User login
Single agent can treat resistant MM

© ASCO/Todd Buchanan
CHICAGO—The anti-CD38 monoclonal antibody daratumumab can be effective as a stand-alone therapy for some heavily pretreated patients with multiple myeloma (MM), results of an ongoing phase 2 trial suggest.
The study, known as SIRIUS or MMY2002, included more than 100 patients who had received 3 or more prior lines of therapy.
Roughly 30% of these subjects responded to daratumumab, with a median response duration of about 7 months.
The median progression-free survival was close to 4 months, and the estimated 1-year overall survival rate was 65%.
Serious adverse events (AEs) occurred in 30% of patients.
“These findings speak to the potential of daratumumab as an effective and tolerable option for people with multiple myeloma who have exhausted other available treatment options,” said study investigator Sagar Lonial, MD, of Emory University School of Medicine in Atlanta, Georgia.
Dr Lonial presented these findings at the 2015 ASCO Annual Meeting (abstract LBA8512). The research was funded by Janssen Research & Development, the company developing daratumumab.
In part 1 of this study, 34 patients were randomized to receive either 8 mg/kg of daratumumab once every 4 weeks or 16 mg/kg once a week for 8 weeks, then once every 2 weeks for 16 weeks and once every 4 weeks after that, until disease progression or unacceptable toxicity.
In part 2, an additional 90 patients were enrolled to receive 16 mg/kg of daratumumab on the same dosing schedule as in part 1.
Dr Lonial reported results for all patients in parts 1 and 2 who received 16 mg/kg of daratumumab. These 106 patients had received a median of 5 prior lines of therapy, including a proteasome inhibitor and an immunomodulatory drug.
According to an independent review committee, 29.2% of patients responded to daratumumab. Eighteen patients had a partial response, 10 had a very good partial response, and 3 had a stringent complete response. The median duration of response was 7.4 months.
“It is particularly noteworthy to see this level of response with a single-agent in this heavily pretreated population,” Dr Lonial said. “Ninety-seven percent of patients in this study were refractory to their last line of therapy, and 95% were double-refractory to both a [proteasome inhibitor] and an [immunomodulatory drug].”
The median overall survival has not been reached, and the estimated 1-year overall survival rate is 65%. The median progression-free survival was 3.7 months.
After a median follow up of 9.4 months, 45.2% of responders remain on therapy.
The most common AEs were fatigue (39.6%), anemia (33%), nausea (29.2%), thrombocytopenia (25.5%), neutropenia (22.6%), back pain (22.6%), and cough (20.8%).
Thirty percent of patients experienced serious AEs. And 4.7% of patients discontinued treatment due to AEs, none of which were considered drug-related.
Infusion-related reactions (IRR) were reported in 42.5% of patients and were predominantly grade 1 or 2 (4.7% grade 3; no grade 4). These occurred mainly during the first infusion.
The most common IRRs included nasal congestion (12%), throat irritation (7%), cough (6%), dyspnea (6%), chills (6%), and vomiting (6%)—all of which were treated with standard of care and slower infusion rates. ![]()
Cancer survivors mirror spouses’ moods

chemotherapy
Photo by Rhoda Baer
Cancer survivors’ moods are impacted—both positively and negatively—by their spouses’ moods, according to research published in Cancer Epidemiology, Biomarkers & Prevention.
In the study, cancer survivors whose spouses reported depressed moods were more likely to be depressed after about a year of follow-up, and survivors whose spouses reported better mental and physical health-related quality of life (HRQOL) were less likely to be depressed.
However, survivors’ moods did not have the same impact on their spouses.
“We were surprised that the effects of the spouses on the survivors were so much larger in this study than the effect of the survivors on their spouses,” said study author Kristin Litzelman, PhD, of the National Cancer Institute in Bethesda, Maryland. “We expected to see a more reciprocal relationship.”
Dr Litzelman and her colleagues conducted this research in an attempt to understand how cancer survivors and their families influence one another. The team hoped to identify ways to improve the healthcare both parties receive and thereby improve their health and well-being.
The researchers analyzed data from 910 cancer patients and their spouses, comparing them to 910 couples without any kind of cancer-related health problem.
The team used statistical models to assess how each spouse’s quality of life or depression at one time point was associated with his or her partner’s risk of depression around 11 months later. The researchers took into account a person’s previously reported mood, demographic characteristics, and other factors.
The results showed that, when spouses reported feeling depressed, cancer survivors were about 4 times more likely to report being depressed 11 months later (odds ratio [OR]=4.27). This association was stronger among female cancer survivors (OR=9.49) than male survivors (OR=3.98).
Cancer survivors whose spouses reported better HRQOL had a 30% decrease in depressed mood per 10-point improvement in HRQOL score. The ORs were 0.72 for mental health and 0.68 for physical health. The associations between spousal HRQOL and survivor depressed mood were similar for male and female survivors.
The researchers noted that cancer survivors’ moods did not have a significant impact on their spouses’ risk of depressed mood 11 months later.
And the team did not see mood associations in couples without any cancer-related health problems.
“This finding certainly needs to be backed up by other studies, but it highlights the importance of family well-being in cancer survivor outcomes,” Dr Litzelman said. “Our research highlights that spouses need to take care of themselves, not just for their own sake, but also for the sake of the cancer survivor.”
“Our findings also suggest that, when caring for cancer survivors, clinicians may want to assess the well-being of spousal caregivers. Future research could test whether including caregivers in the survivorship care plan might help to improve outcomes for both caregivers and for cancer survivors.” ![]()
CDS systems often can’t tell if imaging is appropriate

Photo courtesy of NIH
Tools that help physicians decide whether to use diagnostic imaging can help reduce the use of unnecessary tests.
But new research suggests these tools may not be able to determine which tests are necessary most of the time.
The tools in question are computerized clinical decision support (CDS) systems, which match a patient’s characteristics against appropriateness
criteria to produce algorithmic treatment recommendations.
In a study published in JAMA, CDS systems did increase orders of imaging tests rated as “appropriate.”
However, the systems were not able to assign appropriateness ratings for a majority of tests because no appropriateness criteria were available for a particular test, or because the systems themselves were not able to find matching criteria.
“The increase in orders rated as appropriate is promising, but the number of tests that were not rated indicates there is room for further improvement of these tools,” said study author Peter S. Hussey, PhD, of the RAND Corporation in Boston, Massachusetts.
Study details
Dr Hussey and his colleagues used data from the Medicare Imaging Demonstration to evaluate the relationship of CDS system use with the proportion of imaging orders matched to appropriateness criteria, the appropriateness of ordered images, and the proportion of orders that changed after feedback.
The team compared 2 time periods during which clinicians used computerized radiology order entry systems and CDS systems for MRI, CT, and nuclear medicine procedures.
During a 6-month baseline period, the CDS systems tracked whether orders were linked with appropriateness criteria but did not provide clinicians with feedback on the appropriateness of orders.
During the 18-month intervention period, the CDS systems provided feedback indicating whether the order was linked to appropriateness criteria and, if so, the appropriateness rating, any recommendations for alternative orders, and a link to documentation supporting each rating.
National medical specialty societies developed the appropriateness criteria using expert panels that reviewed evidence and completed a structured rating process. The same appropriateness criteria were loaded into the CDS systems tools for all participating clinicians.
In all, 3340 clinicians placed 117,348 orders for advanced diagnostic imaging procedures.
Results
The CDS systems could not match most orders to appropriateness criteria. The systems did not identify relevant criteria for 63.3% of orders made during the baseline period and 66.5% of orders made during the intervention period.
Of the orders CDS systems could rate, 73.7% ordered during the baseline period and 81% ordered during the intervention period were rated as appropriate, and 11.1% and 6.4%, respectively, were rated inappropriate.
Of the orders that were initially rated as inappropriate, 4.8% were changed, and 1.9% were canceled.
When the CDS systems suggested an alternative for inappropriate orders, 9.9% of the orders were changed, and 0.4% were canceled. When the systems did not provide an alternative, 1.4% of inappropriate orders were changed, and 2.8% were canceled.
“In response to these findings, we recommend that clinical decision support efforts should focus on tools that help clinicians perform their work more efficiently and effectively,” said study author Katherine Kahn, MD, of the University of California, Los Angeles.
“We need a more comprehensive set of evidence-based guidelines that cover a greater proportion of advanced imaging orders for Medicare patients, and provide better methods for communicating feedback to clinicians.” ![]()
Scientists uncover structure of TOR complex 2

Photo courtesy of
University of Geneva
A group of researchers has developed a new tool to study the structure and function of target of rapamycin complex 2 (TORC2), which helps explain why rapamycin cannot access the TOR protein in this complex.
TOR is essential for the growth of normal cells but is hyperactive in tumor cells. Rapamycin is an immunosuppressant and anticancer agent that inactivates TOR in TORC1 but not in TORC2.
“In order to more easily study TORC2, we wanted to learn how to make this complex sensitive to rapamycin,” said Robbie Loewith, PhD, of the University of Geneva in Switzerland.
So Dr Loewith and a team of scientists from Switzerland, France, and the UK set out to elucidate how TORC2 works. The team reported their findings in Molecular Cell.
Using crosslinking-mass spectrometry and electron microscopy, they discovered that TORC2 has 3 features in common with TORC1: a rhomboid shape, 2-fold symmetry, and a central cavity delimited by the interface of its protein chains.
The 2 complexes differ markedly, however, in overall size, surface area of the interface, and the volume and shape of the central cavity.
By determining the structure of TORC2, the team could observe which subunit within TORC2 was obstructing the rapamycin binding site on TOR.
“By deleting part of this subunit, we generated a variant of TORC2 sensitive to rapamycin,” said Manoel Prouteau, PhD, also of the University of Geneva.
This allowed the researchers to study how TORC2 acts to stimulate cell growth.
Now, they hope to identify a specific inhibitor of endogenous TORC2 that could also be an effective anticancer agent.
“Our discovery that TORC2 inhibition alone is sufficient to block the cell cycle suggests that mTORC2-specific inhibitors may provide new and potentially better therapeutic alternatives,” the team concluded. ![]()
Reduction in Iatrogenic Pneumothorax
Iatrogenic pneumothorax (IAP) is a complication of invasive procedures that is associated with substantial morbidity and some mortality.[1] IAP is often avoidable, and in many cases can be prevented through adherence to evidence‐based guidelines and procedural techniques known to reduce the incidence of IAP.[2] IAP may occur with a subclavian (SC) or internal jugular (IJ) central venous catheter (CVC) insertion, but is more frequently associated with the SC approach.[3] Ultrasound guidance during IJ CVC insertion is associated with a lower risk as compared to guidance by anatomical landmarks.[4, 5] Other bedside procedures that are known to cause IAP include thoracentesis. This risk can also be reduced with the use of ultrasound guidance.[6]
Including simulation in training for CVC insertion has been demonstrated in meta‐analyses to improve both learner outcomes, including simulator performance and perceived confidence, and patient outcomes, including fewer failed CVC attempts and reduced incidence of IAP.[7] Even brief simulation workshops lasting less than two hours can improve patient safety during CVC insertion.[8]
The implementation of ultrasound‐based simulation and improved adherence to the actual use of ultrasound at the bedside can be motivated by tying competency‐based educational objectives (eg, CVC insertion) to clinical outcomes (ie, rates of IAP) and tracking both as part of a continuous quality‐improvement cycle.[9] Adherence to best practices for CVC insertion can also be improved through standardizing hospital‐wide policies and hands‐on training.[10] Involving many stakeholders, including nurses, physicians, nurse practioners and physician assistants, in a multidisciplinary team has been shown to help alter entrenched behaviors and reduce the incidence of central‐line associated bloodstream infections through long‐term adherence to evidence‐based interventions.[11]
LOCAL PROBLEM
The Agency for Healthcare Research and Quality (AHRQ) has designed Patient Safety Indicators (PSIs) (
Our hospital is a member of the University HealthSystem Consortium (UHC) (
Despite this, the PSI can highlight areas where quality‐improvement efforts might be best directed. In 2005 and 2006, our hospital was ranked within the lowest UHC performance quartile for all‐cause IAP PSI.
During FY 2006 (September 2005August 2006), root‐cause analysis on cases of IAP at our hospital found that CVC insertion (40%) was the most common procedure associated with IAP, with SC insertion causing 69% of CVC‐associated IAP. Other common procedures associated with IAP were operative/pacemaker (30%), thoracentesis (25%), and ventilator associated (5%). Ultrasound was not used in 2/5 cases of IJ CVC placement and 3/5 thoracentesis cases. Only 44% of CVC insertions had a procedure note.
Intended Improvement/Study Question
Our team set out to plan and implement a set of multifaceted interventions within 90 days. The short‐term goal was a 50% reduction in the CVC IAP and all‐cause IAP rate within 18 months, and the long‐term goal was sustained reduction of CVC IAP and all‐cause IAP rate.
METHODS
The format of this article is based on the standards for quality‐improvement reporting excellence guidelines for the reporting of studies on the effectiveness of quality‐improvement interventions.[14]
Setting
Stanford University Medical Center is an academic medical center with 465 beds and over 25,000 inpatient admissions per year, providing both general acute care services and tertiary medical care. Residents perform CVC bedside procedures when central venous access is needed, in the intensive care unit (ICU), operating room (OR), and inpatient units. Prior to this project, ultrasound equipment was only available in the emergency department (ED) and ICUs. There was no formal CVC procedure supervision policy, CVC training curriculum, and procedure note templates for documentation of CVC insertion.
Planning the Interventions
A multidisciplinary quality‐improvement team met weekly during the 90‐day design period from January 2007 to March 2007. Our team included representatives from the departments of medicine, anesthesia and critical care, surgery, nursing, and emergency medicine. We also partnered with our institution's clinical and administrative leaders, experts in simulation, and the hospital quality department.
We hypothesized that a standardized set of education and training interventions promoting ultrasound‐guided IJ CVC insertion as the method of choice at our hospital would significantly reduce our rate of CVC‐associated IAP. Our multifaceted intervention included: (1) clinical and documentation standards based on evidence, (2) cognitive aids, (3) simulation training, (4) purchase and deployment of ultrasound equipment, and (5) feedback to clinical services.
Our team followed the define, measure, analyze, improve, control (DMAIC) framework.[15] We set interval goals with target completion dates throughout the 90‐day period, identified owners of each goal, and tracked progress with a shared spreadsheet.
In the 90‐day intervention, we accomplished the following: (1) conducted root‐cause analysis of IAP cases for fiscal year 2006, (2) created clinical and documentation standards around CVC placement, (3) created cognitive aids and procedure note templates, (4) developed simulation training courses, and (5) requested purchase of additional ultrasound equipment.
Data Collection
To evaluate our progress in reducing the rates of IAP, we tracked the incidence of IAP using UHC and AHRQ PSI methodology. In collaboration with our hospital's quality department, we manually reviewed every PSI‐identified case of IAP. This review has focused on identifying whether or not pneumothorax actually occurred, and whether it was associated with CVC insertion. For those associated with CVC, data were collected for patient location and service, the procedure site, whether ultrasound was used, whether a chest tube was required, and the final disposition of the patient.
Demographic data (age, gender, case mix index [CMI]) shown in Table 1 were obtained through MIDAS+ Solutions (Tucson, Arizona), a proprietary database that contains healthcare management coded data. Total hospital CVC insertion rates were calculated using International Classification of Diseases, Ninth Revision (ICD‐9) coding for 38.93 and 38.97. ICU central lineassociated blood stream infections (CLABSI) data were obtained from internal collection by our infection control team. Number and location of CVCs placed in the ICU data were obtained from nursing flow sheets in our electronic medical record (EMR). Cost information was provided by our finance department using internal accounting.
| Patients With CVC Insertion | Year | ||||||||
|---|---|---|---|---|---|---|---|---|---|
| 2006 | 2007 | 2008 | 2009 | 2010 | 2011 | 2012 | 2013 | 2014 | |
| |||||||||
| Age, y (mean) | 55.0 | 55.5 | 55.0 | 57.0 | 56.5 | 58.5 | 57.5 | 59.0 | 58.5 |
| % female | 47.0 | 49.5 | 47.0 | 48.8 | 46.2 | 46.1 | 45.7 | 46.2 | 45.7 |
| Case‐mix index | 3.08 | 3.35 | 3.21 | 3.40 | 3.71 | 3.91 | 3.92 | 3.92 | 4.08 |
| Total no. of CVCs/year* | 1,593 | 1,141 | 1,589 | 2,250 | 2,441 | 2,774 | 2,754 | 2,722 | 2,845 |
| No. of CVCs/year in ICU | NA | NA | NA | 1,502 | 1,357 | 1,345 | 1,316 | 1,421 | 1,590 |
| No. of subclavians/year in ICU | NA | NA | NA | 167 | 75 | 70 | 83 | 75 | 97 |
| No. of IJs/year in ICU | NA | NA | NA | 898 | 773 | 681 | 677 | 713 | 876 |
| No. of femorals/year in ICU | NA | NA | NA | 212 | 152 | 203 | 171 | 198 | 206 |
| No. of PICCs/year in ICU | NA | NA | NA | 225 | 357 | 391 | 385 | 435 | 411 |
| Preintervention (2006) | Postintervention (20082014) | P Value | |||||||
| Age, y (mean) | 55.2 | 58.7 | <0.0001 | ||||||
| % female | 47.0% | 46.4% | 0.642 | ||||||
| Case‐mix index | 3.08 | 3.73 | <0.0001 | ||||||
| CVC insertion rate | 8.1% | 11.4% | <0.0001 | ||||||
| All Inpatients | Year | ||||||||
| 2006 | 2007 | 2008 | 2009 | 2010 | 2011 | 2012 | 2013 | 2014 | |
| Age, y (mean) | 57.1 | 57.2 | 56.8 | 57.2 | 57.5 | 58.0 | 58.0 | 57.9 | 58.3 |
| % female | 51.6 | 51.2 | 52.4 | 51.7 | 51.1 | 51.5 | 50.3 | 49.9 | 50.1 |
| Case‐mix index | 1.86 | 1.98 | 1.96 | 1.99 | 1.96 | 2.02 | 2.03 | 2.07 | 2.23 |
| Preintervention (2006) | Postintervention (20082014) | P Value | |||||||
| Age, y (mean) | 57.1 | 57.6 | <0.01 | ||||||
| % female | 51.6% | 50.9% | 0.07 | ||||||
| Case‐mix index | 1.86 | 2.03 | 0.13 | ||||||
| Central Line‐Associated Bloodstream Infections per 1,000 Central Line Days | |||||||||
| Preintervention | Postintervention | P Value | |||||||
| Short term (2006 vs 2008) | 1.8 | 0.60 | 0.004 | ||||||
| Long term (2006 vs 20082014) | 1.8 | 0.68 | <0.0001 | ||||||
The project granted a Notice of Determination of Approval from the Stanford Administrative Panels for the Protection of Human Subjects (institutional review board).
Methods of Evaluation/Analysis
For the purpose of this analysis, the preintervention period was defined as January 1, 2006 through December 31, 2006, our first year of IAP case review. We defined the intervention period as January 1, 2007 through December 31, 2007, during which we planned and implemented hospital‐wide standardization of CVC insertion practices and incorporated CVC insertion training simulation into resident orientation in July 2007. The postintervention period was defined as January 1, 2008 through December 31, 2014.
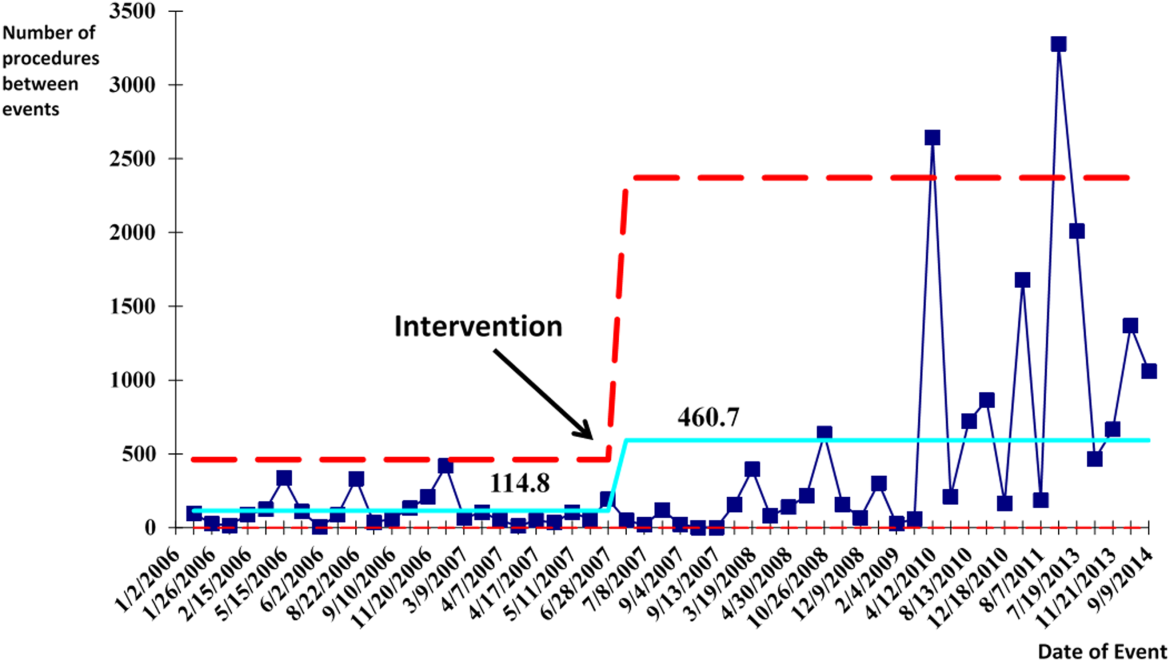
All statistical analyses were performed using Stata version 12.1 (StataCorp, College Station, TX). [2] tests were used to determine statistical differences in pre‐ versus postintervention patient demographic data (age, gender, CMI), CVC insertion rates, and CLABSI rates. Because IAP is a rare event, a statistical process control g‐chart was created using QI Macros (KnowWare International, Inc., Denver, CO) to show the number of CVC procedures between IAP. [2] and Fisher exact tests were used to determine statistical differences in CVC anatomic location and use of ultrasound pre‐ and postintervention. A 2‐sided Z test to show a difference in proportions was used to determine statistical differences in CVC‐related IAP rate and all‐cause IAP rate pre‐ and postintervention.
Measuring Adherence to Intervention
Location of CVC Placement and Ultrasound Guidance Pre‐ Versus Postintervention
We utilized the Stanford Clinical Informatics Center (SCCI) services for obtaining counts of patients. Custom queries were performed on SCCI's Stanford Translational Research Integrated Database Environment (STRIDE) platform[16] to search Stanford Hospital electronic heath records for patients. This search primarily involved getting counts for the number of patients with clinical notes that contained the keywords of interest. To identify documentation for placement of CVC from 2006 to 2014, procedure or operative notes containing the words central line or CVC were counted. Further subcounts were obtained by searching for additional keywords such as PICC [peripherally inserted central catheters], femoral, jugular, subclavian, and ultrasound.
Adherence to Intervention in the ICU in 2014
A total of 100 charts were reviewed from patients in our medical and surgical ICU with a CVC in 2014 to evaluate the current trend of central line placement and sustainability of our intervention. Fifty charts were initially randomly selected from the ICU cohort. For those who had multiple lines placed, only the first line was reviewed. Because the initial audit did not provide enough SC lines and we wanted to review more IJ lines, we randomly selected an additional 25 patients who had SC and 25 patients who had IJ to review. The following was collected during chart review: primary team, location of line placement, usage of ultrasound, usage of standard procedure template, supervision, level of training for supervisor, and level of training for staff who performed procedure.
Outcomes
The rate of CVC‐associated IAP was calculated as the total number of IAPs attributed to CVCs divided by the total number of CVCs inserted determined by ICD‐9 coding for 38.93 and 38.97. The total IAP rate was calculated as the total number of IAP/1000 discharges.
RESULTS
Interventions
Our team began the intervention in early 2007 with promotion of ultrasound‐guided IJ catheterization. Clinical exceptions included: (1) trauma or code situations where access to the neck is limited, (2) suspected or confirmed neck injuries, (3) presence of a tracheostomy, and (4) bilateral internal jugular sites unsuitable for catheterization.
Our hospital adopted new formal CVC insertion policies consistent with the above training and education efforts. All physicians were required to document CVC insertions using the template available in the EMR. To be certified to perform CVC insertion independently, trainee physicians were required to complete the simulation training and successfully place a minimum of 5 CVCs directly supervised by an already‐certified physician. This was consistent with the Accreditation Council for Graduate Medical Education suggested minimum requirement in 2007. In our critical care units, all CVC insertions must be supervised by an ICU fellow or attending.
To reinforce the on‐the‐ground work by our physician leaders, we created 2 education tools to embed best practices into our CVC insertion workflow. A checklist with best practices for CVC insertion that was distributed throughout the hospital via central line kits and educational flyers, and a CVC insertion procedure note template consistent with California Department of Public Health documentation requirements was made available in our EMR.
In June 2007, we integrated CVC insertion simulation training into procedure workshops required for all medicine, surgery, anesthesia, and emergency medicine trainees during their intern year. These workshops promoted ultrasound‐guided IJ catheterization and supporting evidence for the new IJ site preference. Training sessions were 2 to 3 hours, and included a demonstration of best‐practice CVC insertion, as well as training with simulation models supervised by an instructor using a standardized CVC checklist. These trainings used both the Blue Phantom human torso model (
Hospital administration provided funds to purchase ultrasound machines for patient units such as medicine, cardiology, ED, and ICU). A total of 4 Site‐Rite (Bard Access Systems, Inc., Salt Lake City, UT) ultrasounds were purchased in 2007. The hospital has continued to purchase ultrasound units yearly, and had 53 ultrasound units in 2014
Cases of IAP were continuously reviewed throughout the intervention period. Based on their higher CVC‐associated IAP rates, the ORs and catheterization lab were identified as having opportunities for improvement. In 2008, Hospital quality‐improvement leadership met with physician leaders in these areas to review their CVC‐related IAP data and to discuss strategies to reduce their IAP rates. These strategies included lessons learned from other services that had successfully decreased their IAP rates.
To sustain our gains, we continue to review all IAP through our coding quality, clinical documentation, quality reporting departments, and peer review. We have implemented other strategies to decrease IAP, such as the use of ultrasound guidance for bedside thoracentesis procedures, which became possible after the availability of more ultrasound devices. Training for ultrasound‐guided thoracentesis was done by our procedure‐team attending during supervision of residents.
Outcomes
Preintervention (January 1, 2006 to December 31, 2006)
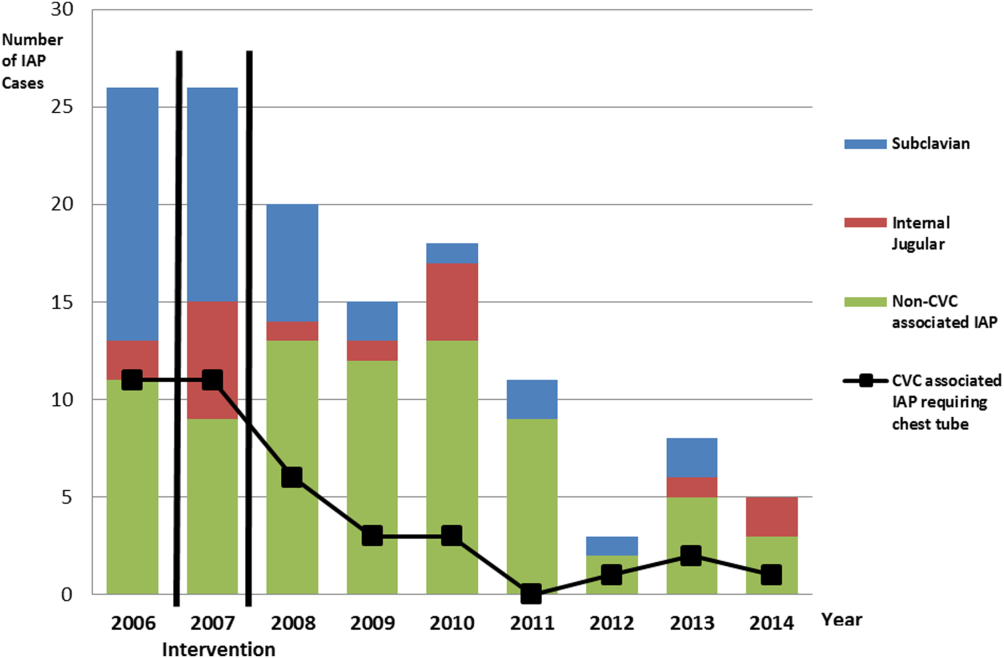
There were a total of 26 cases of IAP in 2006. Of these, 15 (58%) were associated with CVC insertion (Figure 1). The single procedure associated with the largest proportion of IAP was SC CVC insertion (11 cases, 42% of all IAP cases). Eleven CVC‐associated IAPs were significant enough to require chest tube placement. Our hospital recorded a total of 1593 CVC insertions (ICD‐9 codes 38.93 and 38.97) in 2006.
Postintervention (January 1, 2008 to December 31, 2014)
There were a total of 80 cases of IAP over 7 years, of which 24 (30%) were associated with CVC insertion. Of these, 16 required chest tube placement. In the last 4 years of the postintervention period (20112014), there were only 5 cases of CVC‐associated IAP requiring chest tube placement (Figure 1). There were a total of 12,000 CVC insertions recorded over the same period.
We successfully met both our short‐ and long‐term goals. Our preintervention CVC‐associated IAP rate was 0.94%, and our post‐intervention rate during 2008 was 0.44%, a short‐term reduction of 53% (P=0.088). Our average postintervention CVC‐associated IAP rate for the years 2008 through 2014 was 0.13%, a significant long‐term reduction of 86% (P<0.0001) (Table 2). The decrease in CVC‐associated IAP rates occurred despite an older patient population (P<0.001) and a higher CMI (P<0.001) in postintervention patients who received a CVC (Table 1). Special cause variation corresponding to a change in our process is demonstrated in Figure 2. The preintervention average number of procedures between IAP was 114.8 and increased to 460.7 in the postintervention period.
| Total CVC (n=95) | Subclavian (n=29) | Internal Jugular (n=58) | Femoral (n=8) | ||||||||||
|---|---|---|---|---|---|---|---|---|---|---|---|---|---|
| |||||||||||||
| Compliance to intervention | |||||||||||||
| US guided | 68.1% | 20.7% | 86.2% | 100.0% | |||||||||
| Procedure note completion | 90.4% | 93.1% | 86.2% | 100.0% | |||||||||
| Supervision | 70.2% | 77.8% | 73.1% | 87.5% | |||||||||
| Level of training | |||||||||||||
| Resident | 61.1% | 58.6% | 60.3% | 75.0% | |||||||||
| Fellow | 25.3% | 27.6% | 24.1% | 25.0% | |||||||||
| Attending | 4.2% | 6.9% | 3.4% | 0.0% | |||||||||
| Advance practitioner | 3.2% | 3.4% | 3.4% | 0.0% | |||||||||
| Unknown | 6.3% | 3.4% | 8.6% | 0.0% | |||||||||
| Supervisor type | |||||||||||||
| Resident | 3.0% | 4.8% | 2.6% | 0.0% | |||||||||
| Fellow | 54.5% | 33.3% | 57.9% | 100.0% | |||||||||
| Attending | 42.4% | 61.9% | 39.5% | 0.0% | |||||||||
| Location of CVC Placement | Internal Jugular (n=25) | Subclavian (n=25) | |||||||||||
| MICU | 32.0% | 32.0% | |||||||||||
| SICU* | 40.0% | 52.0% | |||||||||||
| Operating room | 28.0% | 16.0% | |||||||||||
| Average no. of attempts/procedure | 1.4 | 1.5 | |||||||||||
| Indications for subclavian insertion (n=25) | |||||||||||||
| Trauma/surgical site | 60.0% | ||||||||||||
| Need for additional access | 16.0% | ||||||||||||
| Unsuccessful IJ placement | 4.0% | ||||||||||||
| Unclear | 20.0% | ||||||||||||
| Iatrogenic Pneumothorax Rate (20062014) | Year | ||||||||||||
| 2006 | 2007 | 2008 | 2009 | 2010 | 2011 | 2012 | 2013 | 2014 | |||||
| % of CVC insertions associated with IAP | 0.94 | 1.49 | 0.44 | 0.13 | 0.20 | 0.07 | 0.04 | 0.11 | 0.07 | ||||
| All‐cause IAP per 1,000 discharges | 1.32 | 1.29 | 0.98 | 0.71 | 0.83 | 0.49 | 0.13 | 0.35 | 0.23 | ||||
| Preintervention | Postintervention | P Value | |||||||||||
| CVC‐ associated IAP short term (2006 vs 2008) | 0.94% | 0.44% | 0.088 | ||||||||||
| CVC‐associated IAP long term (2006 vs 20082014) | 0.94% | 0.13% | <0.0001 | ||||||||||
| All‐cause IAP per 1,000 discharges short term (2006 vs 2008) | 1.32 | 0.98 | <0.0001 | ||||||||||
| All‐cause IAP per 1,000 discharges long term (2006 vs 2008‐14) | 1.32 | 0.52 | <0.0001 | ||||||||||
With the decrease in CVC‐associated IAP, we also saw a decrease in our all‐cause IAP rate per 1000 discharges from 1.32 in 2006 to 0.98 in 2008. This represents a 26% short‐term reduction (P<0.0001). We also saw a decrease in our all‐cause IAP rate per 1000 discharges to 0.52 from 2008 to 2014, representing a 61% long‐term reduction (P<0.0001). This decrease in all‐cause IAP postintervention occurred despite an older patient population (P<0.01) for all discharges. Our hospital is now in the highest performance UHC quartile for all‐cause IAP in 2012 to 2014.
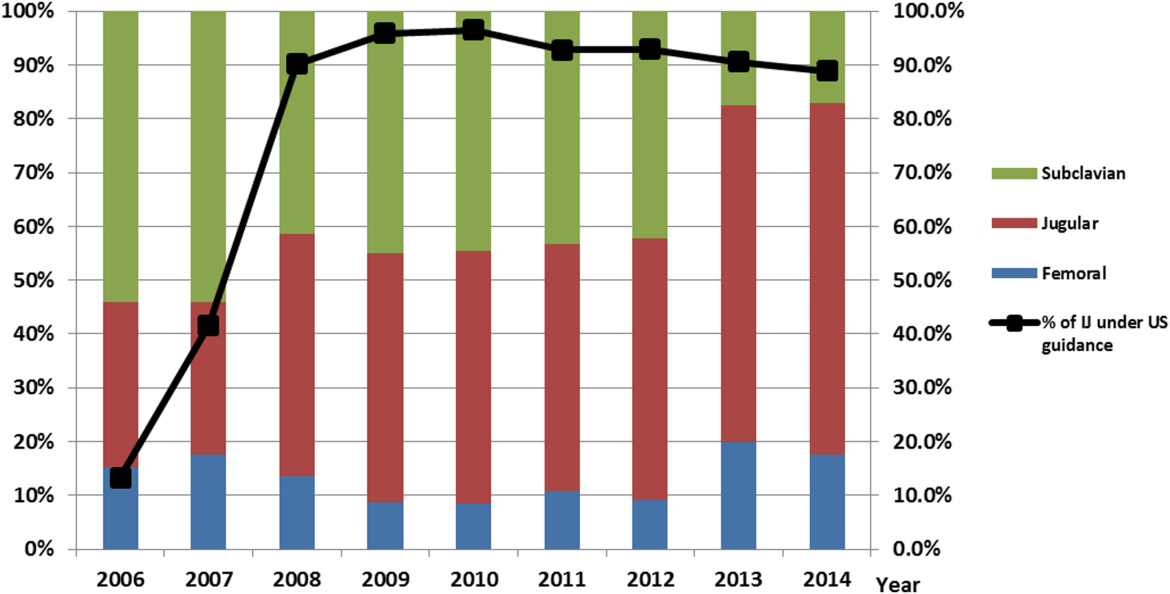
After our multifaceted intervention in 2007, there was substantially more and consistent documentation of CVC procedure notes from less than 500 in 2006 to greater than 2000 in 2009. The distribution of CVC procedure notes in the pre‐ (2006) versus postintervention (20082014) period showed a decrease in the proportion of femoral lines from 15% to 11%, increase in IJ lines from 31% to 49%, and a decrease in SC from 54% to 40% (P=0.001). The distribution of IJ CVC procedure notes in the pre‐ (2006) versus postintervention (20082014) period showed an increase in the proportion of procedures with ultrasound documentation from 13% to 93% (P<0.001) (Figure 3).
In our ICU 2014 audit, the majority of CVC lines were placed by residents under supervision (>70%), and most used the standard CVC note template to document the procedure (90%). Of the total CVC approach, 66% were IJ and 4% were SC. Eighty‐six percent used ultrasound during IJ placement. The majority of SC insertions were placed in the surgical ICU and had clear indications (80%) for placement. Of those, 75% were due to trauma (limited access to neck) or surgery (interfering with surgical site) (Table 2).
DISCUSSION
Summary
This quality‐improvement intervention demonstrates that a multidisciplinary team can successfully implement a multifaceted intervention that sustainably reduces the rate of IAP complications from CVC placement and improves patient safety over 7 years. We found high compliance with our intervention, which included an increase in CVC notes and documentation of ultrasound guidance. There was also an increase in the IJ approach in our postintervention period. We showed statistically significant long‐term reductions in both CVC‐associated and all‐cause IAP rates. From 2011 to 2014, there were only 5 cases of CVC‐associated IAP requiring chest tube placement. Post hoc analysis showed a statistically significant decrease in CLABSI rates (P<0.0001) from a preintervention rate of 1.6 infections per 1000 central line days to postintervention average rate of 0.68 infections per 1000 central line days. This decrease may be related to the incorporation of wide sterile barrier techniques in our CVC training workshops, checklists, and template procedure notes.
A strength of this study is the sustained significant long‐term reduction in IAP. There are few data that exist to describe sustained interventions in this area. Sustainability was achieved by integrating our interventions into ongoing programs that already existed in the hospital; we incorporated our simulation training into the existing new resident orientation, increased the availability of existing ultrasound equipment, and continued our IAP chart review through coding quality with feedback to involved services. The procedure note template continues to be easily available in our EMR, and the SC approach to CVC placement is limited to select cases.
Based on a post hoc cost‐benefit analysis, the financial benefits of decreasing the rate of IAP outweigh the costs associated with implementation of this initiative. The purchase cost for a Site‐Rite (Bard Access Systems) ultrasound machine was $18,000. The cost of materials for 1 workshop is $5000 annually. Cases from the Nationwide Inpatient Sample that were flagged by this PSI had 7.0% excess mortality, 4.4 days of excess hospitalization, and approximately $18,000 in excess hospital charges.[17, 18] Based on these data, if we had continued at our preintervention rate of CVC‐associated IAP requiring chest tube placement, we would estimate 9 additional CVC‐associated IAPs requiring chest tube insertion per year. This would result in over $180,000 of additional costs annually. Based on an initial cost of $100,000 for 4 workshops and the necessary equipment, we would have realized our cost savings in less than 1 year postintervention. These are all approximate costs, and further detailed analysis is needed.
One challenge with this intervention is the culture change away from using the SC approach, and the concern from trainees of how they would learn to perform SC CVC if needed. We would suggest dedicated SC CVC ultrasound training for those services who may need to use this approach (eg, neuroanesthesia and trauma).
Interpretation/Relation to Other Evidence
The field of implementation science can help explain why some projects are successful and others fail. We can further dissect the success of this project using an implementation science model similar to that described by French et al.[19] French et al. describe 4 behavior‐change techniques. These steps include (1) who needs to do what differently, (2) which barriers and enablers need to be addressed, (3) which intervention component could overcome the barriers and enhance enablers, and (4) how can behavior change be measured and understood. Barriers included suboptimal skills of residents, low awareness of evidence‐based guidelines, and entrenched practices inconsistent with best evidence. There was also a belief that IJ lines were more likely to become infected. Targeted behaviors needing to be done differently were the choice of CVC placement site and insertion technique. Barriers to change were assessed by asking members of the project team to explore with members of their service what led them to do CVC lines without ultrasound guidance. Enhancements focused on information provision, simulation practice, and persuasive communication. Behavior change was measured by tracking the number of IAPs, site of CVC, and documentation of technique. Continuation of these interventions based on this theoretical framework drove maintenance of gains.
We completed our main intervention planning in 90 days, and met our short‐term goal on schedule. The Institute for Healthcare Improvement (IHI) advocates that such short timelines are efficient mechanisms for developing and acting on projects. Other institutions have reported on similar rapid‐cycle planning and short‐term goal setting[20]
Limitations
Our study captures the experience of a quality‐improvement team at a single academic center, and our results may not be generalizable to other institutions. Our chart review process only occurred once a case had been identified through AHRQ PSI methodology. It is possible that the PSI does not capture all cases of IAP, although we believe our coding department has a very rigorous process to look for all IAP evidence in the patient's record. We used administrative data to determine the number of hospital‐wide CVC procedures.
Our compliance data with interventions from STRIDE are based on looking for key words in procedure note documentation (so undocumented notes are not captured). To validate this, we performed a manual audit of our adherence to our intervention in 2014, and those data are consistent with the results from our STRIDE data.
Our study's observational design also cannot control for exogenous effects on physician practice relating to CVC insertion or the overall risk of IAP. Some of our decrease in complications may be from the increase in PICC line use. Nevertheless, our CVC‐associated IAP rate has decreased despite >6000 non‐PICC CVCs in our ICU over the past 5 years, and a rising CMI (18% increase in postintervention period) and older population of patients with CVC insertion (P<0.0001)
CONCLUSIONS
We are the first, to our knowledge, to report a measurable improvement in reducing IAP patient outcomes that has been sustained for over 7 years. Our hospital is in the highest performance UHC quartile for all‐cause IAP in 2012 to 2014. A multidisciplinary quality‐improvement team, focused on evidence, patient safety, and standardization, can use a multifaceted intervention to sustainably improve patient outcomes. Promoting ultrasound‐guided IJ catheterization as the CVC insertion method of choice significantly reduced our hospital's rate of CVC‐associated IAP.
Acknowledgements
The authors acknowledge many who have contributed to this quality‐improvement project:
Irina Tokareva, Jay Lee, Kourt Bowes, and Gomathi Krishnan for data analysis; Laura Meinke for significant website curriculum; Fred Mihm, Sarah Williams, and John Kugler for leadership in ultrasound training; Kevin Tabb and Norm Rizk for hospital financial support of simulation workshops and ultrasound machines; Pooja Loftus and Helene Grossman for statistical analysis; Eric Hadhazy for data support; Joan Hendershott for cost information; Nancy Szaflarski for project management and manuscript review; and Isabella Chu for manuscript review.
Disclosures: STRIDE (Stanford Translational Research Integrated Database Environment) is a research and development project at Stanford University to create a standards‐based informatics platform supporting clinical and translational research. This STRIDE project was supported by the National Center for Research Resources and the National Center for Advancing Translational Sciences, National Institutes of Health, through grant UL1 RR025744. The content is solely the responsibility of the authors and does not necessarily represent the official views of the NIH. The authors report no conflicts of interest.
- , , . Significance of iatrogenic pneumothoraces. Chest. 1994;105(4):1147–1150.
- , , , , , . How to avoid and manage a pneumothorax. J Vasc Access. 2006;7(1):7–14.
- , , , . Iatrogenic pneumothorax: etiology, incidence and risk factors. Thorac Cardiovasc Surg. 2009;57(5):286–290.
- , , , et al. Real‐time ultrasound‐guided catheterisation of the internal jugular vein: a prospective comparison with the landmark technique in critical care patients. Crit Care. 2006;10(6):R162.
- , , . Safe placement of central venous catheters: a measured approach. J Intens Care Med. 2011;26(6):392–396.
- , , , . Reducing iatrogenic risk in thoracentesis: establishing best practice via experiential training in a zero‐risk environment. Chest. 2009;135(5):1315–1320.
- , , , , , . Use of simulation‐based education to improve outcomes of central venous catheterization: a systematic review and meta‐analysis. Acad Med. 2011;86(9):1137–1147.
- , , , , , . A prerotational, simulation‐based workshop improves the safety of central venous catheter insertion: results of a successful internal medicine house staff training program. Chest. 2011;140(3):652–658.
- , , , , . Linking residency training effectiveness to clinical outcomes: a quality improvement approach. Jt Comm J Qual Patient Saf. 2010;36(5):203–208.
- , , , et al. Education of physicians‐in‐training can decrease the risk for vascular catheter infection. Ann Intern Med. 2000;132(8):641–648.
- , , , et al. A multidisciplinary approach to reduce central line‐associated bloodstream infections. Jt Comm J Qual Patient Saf. 2013;39(2):61–69.
- , , , et al. Validity of selected Patient Safety Indicators: opportunities and concerns. J Am Coll Surg. 2011;212(6):924–934.
- , , , et al. Cases of iatrogenic pneumothorax can be identified from ICD‐9‐CM coded data. Am J Med Qual. 2010;25(3):218–224.
- , , , , ; SQUIRE development group. Publication guidelines for quality improvement studies in health care: evolution of the SQUIRE project. BMJ. 2009;338:a3152.
- . The Quality Toolbox. 2nd ed. Milwaukee, WI: ASQ Quality Press; 2005.
- , , , . STRIDE—an integrated standards‐based translational research informatics platform. AMIA Annu Symp Proc. 2009;2009:391–395.
- , , . Accidental iatrogenic pneumothorax in hospitalized patients. Med Care. 2006;44(2):182–186.
- , . Excess length of stay, charges, and mortality attributable to medical injuries during hospitalization. JAMA. 2003;290(14):1868–1874.
- , , , et al. Developing theory‐informed behaviour change interventions to implement evidence into practice: a systematic approach using the Theoretical Domains Framework. Implement Sci. 2012;7:38.
- , . Using rapid‐cycle quality improvement methodology to reduce feeding tubes in patients with advanced dementia: before and after study. BMJ. 2004;329(7464):491–494.
Iatrogenic pneumothorax (IAP) is a complication of invasive procedures that is associated with substantial morbidity and some mortality.[1] IAP is often avoidable, and in many cases can be prevented through adherence to evidence‐based guidelines and procedural techniques known to reduce the incidence of IAP.[2] IAP may occur with a subclavian (SC) or internal jugular (IJ) central venous catheter (CVC) insertion, but is more frequently associated with the SC approach.[3] Ultrasound guidance during IJ CVC insertion is associated with a lower risk as compared to guidance by anatomical landmarks.[4, 5] Other bedside procedures that are known to cause IAP include thoracentesis. This risk can also be reduced with the use of ultrasound guidance.[6]
Including simulation in training for CVC insertion has been demonstrated in meta‐analyses to improve both learner outcomes, including simulator performance and perceived confidence, and patient outcomes, including fewer failed CVC attempts and reduced incidence of IAP.[7] Even brief simulation workshops lasting less than two hours can improve patient safety during CVC insertion.[8]
The implementation of ultrasound‐based simulation and improved adherence to the actual use of ultrasound at the bedside can be motivated by tying competency‐based educational objectives (eg, CVC insertion) to clinical outcomes (ie, rates of IAP) and tracking both as part of a continuous quality‐improvement cycle.[9] Adherence to best practices for CVC insertion can also be improved through standardizing hospital‐wide policies and hands‐on training.[10] Involving many stakeholders, including nurses, physicians, nurse practioners and physician assistants, in a multidisciplinary team has been shown to help alter entrenched behaviors and reduce the incidence of central‐line associated bloodstream infections through long‐term adherence to evidence‐based interventions.[11]
LOCAL PROBLEM
The Agency for Healthcare Research and Quality (AHRQ) has designed Patient Safety Indicators (PSIs) (
Our hospital is a member of the University HealthSystem Consortium (UHC) (
Despite this, the PSI can highlight areas where quality‐improvement efforts might be best directed. In 2005 and 2006, our hospital was ranked within the lowest UHC performance quartile for all‐cause IAP PSI.
During FY 2006 (September 2005August 2006), root‐cause analysis on cases of IAP at our hospital found that CVC insertion (40%) was the most common procedure associated with IAP, with SC insertion causing 69% of CVC‐associated IAP. Other common procedures associated with IAP were operative/pacemaker (30%), thoracentesis (25%), and ventilator associated (5%). Ultrasound was not used in 2/5 cases of IJ CVC placement and 3/5 thoracentesis cases. Only 44% of CVC insertions had a procedure note.
Intended Improvement/Study Question
Our team set out to plan and implement a set of multifaceted interventions within 90 days. The short‐term goal was a 50% reduction in the CVC IAP and all‐cause IAP rate within 18 months, and the long‐term goal was sustained reduction of CVC IAP and all‐cause IAP rate.
METHODS
The format of this article is based on the standards for quality‐improvement reporting excellence guidelines for the reporting of studies on the effectiveness of quality‐improvement interventions.[14]
Setting
Stanford University Medical Center is an academic medical center with 465 beds and over 25,000 inpatient admissions per year, providing both general acute care services and tertiary medical care. Residents perform CVC bedside procedures when central venous access is needed, in the intensive care unit (ICU), operating room (OR), and inpatient units. Prior to this project, ultrasound equipment was only available in the emergency department (ED) and ICUs. There was no formal CVC procedure supervision policy, CVC training curriculum, and procedure note templates for documentation of CVC insertion.
Planning the Interventions
A multidisciplinary quality‐improvement team met weekly during the 90‐day design period from January 2007 to March 2007. Our team included representatives from the departments of medicine, anesthesia and critical care, surgery, nursing, and emergency medicine. We also partnered with our institution's clinical and administrative leaders, experts in simulation, and the hospital quality department.
We hypothesized that a standardized set of education and training interventions promoting ultrasound‐guided IJ CVC insertion as the method of choice at our hospital would significantly reduce our rate of CVC‐associated IAP. Our multifaceted intervention included: (1) clinical and documentation standards based on evidence, (2) cognitive aids, (3) simulation training, (4) purchase and deployment of ultrasound equipment, and (5) feedback to clinical services.
Our team followed the define, measure, analyze, improve, control (DMAIC) framework.[15] We set interval goals with target completion dates throughout the 90‐day period, identified owners of each goal, and tracked progress with a shared spreadsheet.
In the 90‐day intervention, we accomplished the following: (1) conducted root‐cause analysis of IAP cases for fiscal year 2006, (2) created clinical and documentation standards around CVC placement, (3) created cognitive aids and procedure note templates, (4) developed simulation training courses, and (5) requested purchase of additional ultrasound equipment.
Data Collection
To evaluate our progress in reducing the rates of IAP, we tracked the incidence of IAP using UHC and AHRQ PSI methodology. In collaboration with our hospital's quality department, we manually reviewed every PSI‐identified case of IAP. This review has focused on identifying whether or not pneumothorax actually occurred, and whether it was associated with CVC insertion. For those associated with CVC, data were collected for patient location and service, the procedure site, whether ultrasound was used, whether a chest tube was required, and the final disposition of the patient.
Demographic data (age, gender, case mix index [CMI]) shown in Table 1 were obtained through MIDAS+ Solutions (Tucson, Arizona), a proprietary database that contains healthcare management coded data. Total hospital CVC insertion rates were calculated using International Classification of Diseases, Ninth Revision (ICD‐9) coding for 38.93 and 38.97. ICU central lineassociated blood stream infections (CLABSI) data were obtained from internal collection by our infection control team. Number and location of CVCs placed in the ICU data were obtained from nursing flow sheets in our electronic medical record (EMR). Cost information was provided by our finance department using internal accounting.
| Patients With CVC Insertion | Year | ||||||||
|---|---|---|---|---|---|---|---|---|---|
| 2006 | 2007 | 2008 | 2009 | 2010 | 2011 | 2012 | 2013 | 2014 | |
| |||||||||
| Age, y (mean) | 55.0 | 55.5 | 55.0 | 57.0 | 56.5 | 58.5 | 57.5 | 59.0 | 58.5 |
| % female | 47.0 | 49.5 | 47.0 | 48.8 | 46.2 | 46.1 | 45.7 | 46.2 | 45.7 |
| Case‐mix index | 3.08 | 3.35 | 3.21 | 3.40 | 3.71 | 3.91 | 3.92 | 3.92 | 4.08 |
| Total no. of CVCs/year* | 1,593 | 1,141 | 1,589 | 2,250 | 2,441 | 2,774 | 2,754 | 2,722 | 2,845 |
| No. of CVCs/year in ICU | NA | NA | NA | 1,502 | 1,357 | 1,345 | 1,316 | 1,421 | 1,590 |
| No. of subclavians/year in ICU | NA | NA | NA | 167 | 75 | 70 | 83 | 75 | 97 |
| No. of IJs/year in ICU | NA | NA | NA | 898 | 773 | 681 | 677 | 713 | 876 |
| No. of femorals/year in ICU | NA | NA | NA | 212 | 152 | 203 | 171 | 198 | 206 |
| No. of PICCs/year in ICU | NA | NA | NA | 225 | 357 | 391 | 385 | 435 | 411 |
| Preintervention (2006) | Postintervention (20082014) | P Value | |||||||
| Age, y (mean) | 55.2 | 58.7 | <0.0001 | ||||||
| % female | 47.0% | 46.4% | 0.642 | ||||||
| Case‐mix index | 3.08 | 3.73 | <0.0001 | ||||||
| CVC insertion rate | 8.1% | 11.4% | <0.0001 | ||||||
| All Inpatients | Year | ||||||||
| 2006 | 2007 | 2008 | 2009 | 2010 | 2011 | 2012 | 2013 | 2014 | |
| Age, y (mean) | 57.1 | 57.2 | 56.8 | 57.2 | 57.5 | 58.0 | 58.0 | 57.9 | 58.3 |
| % female | 51.6 | 51.2 | 52.4 | 51.7 | 51.1 | 51.5 | 50.3 | 49.9 | 50.1 |
| Case‐mix index | 1.86 | 1.98 | 1.96 | 1.99 | 1.96 | 2.02 | 2.03 | 2.07 | 2.23 |
| Preintervention (2006) | Postintervention (20082014) | P Value | |||||||
| Age, y (mean) | 57.1 | 57.6 | <0.01 | ||||||
| % female | 51.6% | 50.9% | 0.07 | ||||||
| Case‐mix index | 1.86 | 2.03 | 0.13 | ||||||
| Central Line‐Associated Bloodstream Infections per 1,000 Central Line Days | |||||||||
| Preintervention | Postintervention | P Value | |||||||
| Short term (2006 vs 2008) | 1.8 | 0.60 | 0.004 | ||||||
| Long term (2006 vs 20082014) | 1.8 | 0.68 | <0.0001 | ||||||
The project granted a Notice of Determination of Approval from the Stanford Administrative Panels for the Protection of Human Subjects (institutional review board).
Methods of Evaluation/Analysis
For the purpose of this analysis, the preintervention period was defined as January 1, 2006 through December 31, 2006, our first year of IAP case review. We defined the intervention period as January 1, 2007 through December 31, 2007, during which we planned and implemented hospital‐wide standardization of CVC insertion practices and incorporated CVC insertion training simulation into resident orientation in July 2007. The postintervention period was defined as January 1, 2008 through December 31, 2014.
All statistical analyses were performed using Stata version 12.1 (StataCorp, College Station, TX). [2] tests were used to determine statistical differences in pre‐ versus postintervention patient demographic data (age, gender, CMI), CVC insertion rates, and CLABSI rates. Because IAP is a rare event, a statistical process control g‐chart was created using QI Macros (KnowWare International, Inc., Denver, CO) to show the number of CVC procedures between IAP. [2] and Fisher exact tests were used to determine statistical differences in CVC anatomic location and use of ultrasound pre‐ and postintervention. A 2‐sided Z test to show a difference in proportions was used to determine statistical differences in CVC‐related IAP rate and all‐cause IAP rate pre‐ and postintervention.
Measuring Adherence to Intervention
Location of CVC Placement and Ultrasound Guidance Pre‐ Versus Postintervention
We utilized the Stanford Clinical Informatics Center (SCCI) services for obtaining counts of patients. Custom queries were performed on SCCI's Stanford Translational Research Integrated Database Environment (STRIDE) platform[16] to search Stanford Hospital electronic heath records for patients. This search primarily involved getting counts for the number of patients with clinical notes that contained the keywords of interest. To identify documentation for placement of CVC from 2006 to 2014, procedure or operative notes containing the words central line or CVC were counted. Further subcounts were obtained by searching for additional keywords such as PICC [peripherally inserted central catheters], femoral, jugular, subclavian, and ultrasound.
Adherence to Intervention in the ICU in 2014
A total of 100 charts were reviewed from patients in our medical and surgical ICU with a CVC in 2014 to evaluate the current trend of central line placement and sustainability of our intervention. Fifty charts were initially randomly selected from the ICU cohort. For those who had multiple lines placed, only the first line was reviewed. Because the initial audit did not provide enough SC lines and we wanted to review more IJ lines, we randomly selected an additional 25 patients who had SC and 25 patients who had IJ to review. The following was collected during chart review: primary team, location of line placement, usage of ultrasound, usage of standard procedure template, supervision, level of training for supervisor, and level of training for staff who performed procedure.
Outcomes
The rate of CVC‐associated IAP was calculated as the total number of IAPs attributed to CVCs divided by the total number of CVCs inserted determined by ICD‐9 coding for 38.93 and 38.97. The total IAP rate was calculated as the total number of IAP/1000 discharges.
RESULTS
Interventions
Our team began the intervention in early 2007 with promotion of ultrasound‐guided IJ catheterization. Clinical exceptions included: (1) trauma or code situations where access to the neck is limited, (2) suspected or confirmed neck injuries, (3) presence of a tracheostomy, and (4) bilateral internal jugular sites unsuitable for catheterization.
Our hospital adopted new formal CVC insertion policies consistent with the above training and education efforts. All physicians were required to document CVC insertions using the template available in the EMR. To be certified to perform CVC insertion independently, trainee physicians were required to complete the simulation training and successfully place a minimum of 5 CVCs directly supervised by an already‐certified physician. This was consistent with the Accreditation Council for Graduate Medical Education suggested minimum requirement in 2007. In our critical care units, all CVC insertions must be supervised by an ICU fellow or attending.
To reinforce the on‐the‐ground work by our physician leaders, we created 2 education tools to embed best practices into our CVC insertion workflow. A checklist with best practices for CVC insertion that was distributed throughout the hospital via central line kits and educational flyers, and a CVC insertion procedure note template consistent with California Department of Public Health documentation requirements was made available in our EMR.
In June 2007, we integrated CVC insertion simulation training into procedure workshops required for all medicine, surgery, anesthesia, and emergency medicine trainees during their intern year. These workshops promoted ultrasound‐guided IJ catheterization and supporting evidence for the new IJ site preference. Training sessions were 2 to 3 hours, and included a demonstration of best‐practice CVC insertion, as well as training with simulation models supervised by an instructor using a standardized CVC checklist. These trainings used both the Blue Phantom human torso model (
Hospital administration provided funds to purchase ultrasound machines for patient units such as medicine, cardiology, ED, and ICU). A total of 4 Site‐Rite (Bard Access Systems, Inc., Salt Lake City, UT) ultrasounds were purchased in 2007. The hospital has continued to purchase ultrasound units yearly, and had 53 ultrasound units in 2014
Cases of IAP were continuously reviewed throughout the intervention period. Based on their higher CVC‐associated IAP rates, the ORs and catheterization lab were identified as having opportunities for improvement. In 2008, Hospital quality‐improvement leadership met with physician leaders in these areas to review their CVC‐related IAP data and to discuss strategies to reduce their IAP rates. These strategies included lessons learned from other services that had successfully decreased their IAP rates.
To sustain our gains, we continue to review all IAP through our coding quality, clinical documentation, quality reporting departments, and peer review. We have implemented other strategies to decrease IAP, such as the use of ultrasound guidance for bedside thoracentesis procedures, which became possible after the availability of more ultrasound devices. Training for ultrasound‐guided thoracentesis was done by our procedure‐team attending during supervision of residents.
Outcomes
Preintervention (January 1, 2006 to December 31, 2006)
There were a total of 26 cases of IAP in 2006. Of these, 15 (58%) were associated with CVC insertion (Figure 1). The single procedure associated with the largest proportion of IAP was SC CVC insertion (11 cases, 42% of all IAP cases). Eleven CVC‐associated IAPs were significant enough to require chest tube placement. Our hospital recorded a total of 1593 CVC insertions (ICD‐9 codes 38.93 and 38.97) in 2006.
Postintervention (January 1, 2008 to December 31, 2014)
There were a total of 80 cases of IAP over 7 years, of which 24 (30%) were associated with CVC insertion. Of these, 16 required chest tube placement. In the last 4 years of the postintervention period (20112014), there were only 5 cases of CVC‐associated IAP requiring chest tube placement (Figure 1). There were a total of 12,000 CVC insertions recorded over the same period.
We successfully met both our short‐ and long‐term goals. Our preintervention CVC‐associated IAP rate was 0.94%, and our post‐intervention rate during 2008 was 0.44%, a short‐term reduction of 53% (P=0.088). Our average postintervention CVC‐associated IAP rate for the years 2008 through 2014 was 0.13%, a significant long‐term reduction of 86% (P<0.0001) (Table 2). The decrease in CVC‐associated IAP rates occurred despite an older patient population (P<0.001) and a higher CMI (P<0.001) in postintervention patients who received a CVC (Table 1). Special cause variation corresponding to a change in our process is demonstrated in Figure 2. The preintervention average number of procedures between IAP was 114.8 and increased to 460.7 in the postintervention period.
| Total CVC (n=95) | Subclavian (n=29) | Internal Jugular (n=58) | Femoral (n=8) | ||||||||||
|---|---|---|---|---|---|---|---|---|---|---|---|---|---|
| |||||||||||||
| Compliance to intervention | |||||||||||||
| US guided | 68.1% | 20.7% | 86.2% | 100.0% | |||||||||
| Procedure note completion | 90.4% | 93.1% | 86.2% | 100.0% | |||||||||
| Supervision | 70.2% | 77.8% | 73.1% | 87.5% | |||||||||
| Level of training | |||||||||||||
| Resident | 61.1% | 58.6% | 60.3% | 75.0% | |||||||||
| Fellow | 25.3% | 27.6% | 24.1% | 25.0% | |||||||||
| Attending | 4.2% | 6.9% | 3.4% | 0.0% | |||||||||
| Advance practitioner | 3.2% | 3.4% | 3.4% | 0.0% | |||||||||
| Unknown | 6.3% | 3.4% | 8.6% | 0.0% | |||||||||
| Supervisor type | |||||||||||||
| Resident | 3.0% | 4.8% | 2.6% | 0.0% | |||||||||
| Fellow | 54.5% | 33.3% | 57.9% | 100.0% | |||||||||
| Attending | 42.4% | 61.9% | 39.5% | 0.0% | |||||||||
| Location of CVC Placement | Internal Jugular (n=25) | Subclavian (n=25) | |||||||||||
| MICU | 32.0% | 32.0% | |||||||||||
| SICU* | 40.0% | 52.0% | |||||||||||
| Operating room | 28.0% | 16.0% | |||||||||||
| Average no. of attempts/procedure | 1.4 | 1.5 | |||||||||||
| Indications for subclavian insertion (n=25) | |||||||||||||
| Trauma/surgical site | 60.0% | ||||||||||||
| Need for additional access | 16.0% | ||||||||||||
| Unsuccessful IJ placement | 4.0% | ||||||||||||
| Unclear | 20.0% | ||||||||||||
| Iatrogenic Pneumothorax Rate (20062014) | Year | ||||||||||||
| 2006 | 2007 | 2008 | 2009 | 2010 | 2011 | 2012 | 2013 | 2014 | |||||
| % of CVC insertions associated with IAP | 0.94 | 1.49 | 0.44 | 0.13 | 0.20 | 0.07 | 0.04 | 0.11 | 0.07 | ||||
| All‐cause IAP per 1,000 discharges | 1.32 | 1.29 | 0.98 | 0.71 | 0.83 | 0.49 | 0.13 | 0.35 | 0.23 | ||||
| Preintervention | Postintervention | P Value | |||||||||||
| CVC‐ associated IAP short term (2006 vs 2008) | 0.94% | 0.44% | 0.088 | ||||||||||
| CVC‐associated IAP long term (2006 vs 20082014) | 0.94% | 0.13% | <0.0001 | ||||||||||
| All‐cause IAP per 1,000 discharges short term (2006 vs 2008) | 1.32 | 0.98 | <0.0001 | ||||||||||
| All‐cause IAP per 1,000 discharges long term (2006 vs 2008‐14) | 1.32 | 0.52 | <0.0001 | ||||||||||
With the decrease in CVC‐associated IAP, we also saw a decrease in our all‐cause IAP rate per 1000 discharges from 1.32 in 2006 to 0.98 in 2008. This represents a 26% short‐term reduction (P<0.0001). We also saw a decrease in our all‐cause IAP rate per 1000 discharges to 0.52 from 2008 to 2014, representing a 61% long‐term reduction (P<0.0001). This decrease in all‐cause IAP postintervention occurred despite an older patient population (P<0.01) for all discharges. Our hospital is now in the highest performance UHC quartile for all‐cause IAP in 2012 to 2014.
After our multifaceted intervention in 2007, there was substantially more and consistent documentation of CVC procedure notes from less than 500 in 2006 to greater than 2000 in 2009. The distribution of CVC procedure notes in the pre‐ (2006) versus postintervention (20082014) period showed a decrease in the proportion of femoral lines from 15% to 11%, increase in IJ lines from 31% to 49%, and a decrease in SC from 54% to 40% (P=0.001). The distribution of IJ CVC procedure notes in the pre‐ (2006) versus postintervention (20082014) period showed an increase in the proportion of procedures with ultrasound documentation from 13% to 93% (P<0.001) (Figure 3).
In our ICU 2014 audit, the majority of CVC lines were placed by residents under supervision (>70%), and most used the standard CVC note template to document the procedure (90%). Of the total CVC approach, 66% were IJ and 4% were SC. Eighty‐six percent used ultrasound during IJ placement. The majority of SC insertions were placed in the surgical ICU and had clear indications (80%) for placement. Of those, 75% were due to trauma (limited access to neck) or surgery (interfering with surgical site) (Table 2).
DISCUSSION
Summary
This quality‐improvement intervention demonstrates that a multidisciplinary team can successfully implement a multifaceted intervention that sustainably reduces the rate of IAP complications from CVC placement and improves patient safety over 7 years. We found high compliance with our intervention, which included an increase in CVC notes and documentation of ultrasound guidance. There was also an increase in the IJ approach in our postintervention period. We showed statistically significant long‐term reductions in both CVC‐associated and all‐cause IAP rates. From 2011 to 2014, there were only 5 cases of CVC‐associated IAP requiring chest tube placement. Post hoc analysis showed a statistically significant decrease in CLABSI rates (P<0.0001) from a preintervention rate of 1.6 infections per 1000 central line days to postintervention average rate of 0.68 infections per 1000 central line days. This decrease may be related to the incorporation of wide sterile barrier techniques in our CVC training workshops, checklists, and template procedure notes.
A strength of this study is the sustained significant long‐term reduction in IAP. There are few data that exist to describe sustained interventions in this area. Sustainability was achieved by integrating our interventions into ongoing programs that already existed in the hospital; we incorporated our simulation training into the existing new resident orientation, increased the availability of existing ultrasound equipment, and continued our IAP chart review through coding quality with feedback to involved services. The procedure note template continues to be easily available in our EMR, and the SC approach to CVC placement is limited to select cases.
Based on a post hoc cost‐benefit analysis, the financial benefits of decreasing the rate of IAP outweigh the costs associated with implementation of this initiative. The purchase cost for a Site‐Rite (Bard Access Systems) ultrasound machine was $18,000. The cost of materials for 1 workshop is $5000 annually. Cases from the Nationwide Inpatient Sample that were flagged by this PSI had 7.0% excess mortality, 4.4 days of excess hospitalization, and approximately $18,000 in excess hospital charges.[17, 18] Based on these data, if we had continued at our preintervention rate of CVC‐associated IAP requiring chest tube placement, we would estimate 9 additional CVC‐associated IAPs requiring chest tube insertion per year. This would result in over $180,000 of additional costs annually. Based on an initial cost of $100,000 for 4 workshops and the necessary equipment, we would have realized our cost savings in less than 1 year postintervention. These are all approximate costs, and further detailed analysis is needed.
One challenge with this intervention is the culture change away from using the SC approach, and the concern from trainees of how they would learn to perform SC CVC if needed. We would suggest dedicated SC CVC ultrasound training for those services who may need to use this approach (eg, neuroanesthesia and trauma).
Interpretation/Relation to Other Evidence
The field of implementation science can help explain why some projects are successful and others fail. We can further dissect the success of this project using an implementation science model similar to that described by French et al.[19] French et al. describe 4 behavior‐change techniques. These steps include (1) who needs to do what differently, (2) which barriers and enablers need to be addressed, (3) which intervention component could overcome the barriers and enhance enablers, and (4) how can behavior change be measured and understood. Barriers included suboptimal skills of residents, low awareness of evidence‐based guidelines, and entrenched practices inconsistent with best evidence. There was also a belief that IJ lines were more likely to become infected. Targeted behaviors needing to be done differently were the choice of CVC placement site and insertion technique. Barriers to change were assessed by asking members of the project team to explore with members of their service what led them to do CVC lines without ultrasound guidance. Enhancements focused on information provision, simulation practice, and persuasive communication. Behavior change was measured by tracking the number of IAPs, site of CVC, and documentation of technique. Continuation of these interventions based on this theoretical framework drove maintenance of gains.
We completed our main intervention planning in 90 days, and met our short‐term goal on schedule. The Institute for Healthcare Improvement (IHI) advocates that such short timelines are efficient mechanisms for developing and acting on projects. Other institutions have reported on similar rapid‐cycle planning and short‐term goal setting[20]
Limitations
Our study captures the experience of a quality‐improvement team at a single academic center, and our results may not be generalizable to other institutions. Our chart review process only occurred once a case had been identified through AHRQ PSI methodology. It is possible that the PSI does not capture all cases of IAP, although we believe our coding department has a very rigorous process to look for all IAP evidence in the patient's record. We used administrative data to determine the number of hospital‐wide CVC procedures.
Our compliance data with interventions from STRIDE are based on looking for key words in procedure note documentation (so undocumented notes are not captured). To validate this, we performed a manual audit of our adherence to our intervention in 2014, and those data are consistent with the results from our STRIDE data.
Our study's observational design also cannot control for exogenous effects on physician practice relating to CVC insertion or the overall risk of IAP. Some of our decrease in complications may be from the increase in PICC line use. Nevertheless, our CVC‐associated IAP rate has decreased despite >6000 non‐PICC CVCs in our ICU over the past 5 years, and a rising CMI (18% increase in postintervention period) and older population of patients with CVC insertion (P<0.0001)
CONCLUSIONS
We are the first, to our knowledge, to report a measurable improvement in reducing IAP patient outcomes that has been sustained for over 7 years. Our hospital is in the highest performance UHC quartile for all‐cause IAP in 2012 to 2014. A multidisciplinary quality‐improvement team, focused on evidence, patient safety, and standardization, can use a multifaceted intervention to sustainably improve patient outcomes. Promoting ultrasound‐guided IJ catheterization as the CVC insertion method of choice significantly reduced our hospital's rate of CVC‐associated IAP.
Acknowledgements
The authors acknowledge many who have contributed to this quality‐improvement project:
Irina Tokareva, Jay Lee, Kourt Bowes, and Gomathi Krishnan for data analysis; Laura Meinke for significant website curriculum; Fred Mihm, Sarah Williams, and John Kugler for leadership in ultrasound training; Kevin Tabb and Norm Rizk for hospital financial support of simulation workshops and ultrasound machines; Pooja Loftus and Helene Grossman for statistical analysis; Eric Hadhazy for data support; Joan Hendershott for cost information; Nancy Szaflarski for project management and manuscript review; and Isabella Chu for manuscript review.
Disclosures: STRIDE (Stanford Translational Research Integrated Database Environment) is a research and development project at Stanford University to create a standards‐based informatics platform supporting clinical and translational research. This STRIDE project was supported by the National Center for Research Resources and the National Center for Advancing Translational Sciences, National Institutes of Health, through grant UL1 RR025744. The content is solely the responsibility of the authors and does not necessarily represent the official views of the NIH. The authors report no conflicts of interest.
- , , . Significance of iatrogenic pneumothoraces. Chest. 1994;105(4):1147–1150.
- , , , , , . How to avoid and manage a pneumothorax. J Vasc Access. 2006;7(1):7–14.
- , , , . Iatrogenic pneumothorax: etiology, incidence and risk factors. Thorac Cardiovasc Surg. 2009;57(5):286–290.
- , , , et al. Real‐time ultrasound‐guided catheterisation of the internal jugular vein: a prospective comparison with the landmark technique in critical care patients. Crit Care. 2006;10(6):R162.
- , , . Safe placement of central venous catheters: a measured approach. J Intens Care Med. 2011;26(6):392–396.
- , , , . Reducing iatrogenic risk in thoracentesis: establishing best practice via experiential training in a zero‐risk environment. Chest. 2009;135(5):1315–1320.
- , , , , , . Use of simulation‐based education to improve outcomes of central venous catheterization: a systematic review and meta‐analysis. Acad Med. 2011;86(9):1137–1147.
- , , , , , . A prerotational, simulation‐based workshop improves the safety of central venous catheter insertion: results of a successful internal medicine house staff training program. Chest. 2011;140(3):652–658.
- , , , , . Linking residency training effectiveness to clinical outcomes: a quality improvement approach. Jt Comm J Qual Patient Saf. 2010;36(5):203–208.
- , , , et al. Education of physicians‐in‐training can decrease the risk for vascular catheter infection. Ann Intern Med. 2000;132(8):641–648.
- , , , et al. A multidisciplinary approach to reduce central line‐associated bloodstream infections. Jt Comm J Qual Patient Saf. 2013;39(2):61–69.
- , , , et al. Validity of selected Patient Safety Indicators: opportunities and concerns. J Am Coll Surg. 2011;212(6):924–934.
- , , , et al. Cases of iatrogenic pneumothorax can be identified from ICD‐9‐CM coded data. Am J Med Qual. 2010;25(3):218–224.
- , , , , ; SQUIRE development group. Publication guidelines for quality improvement studies in health care: evolution of the SQUIRE project. BMJ. 2009;338:a3152.
- . The Quality Toolbox. 2nd ed. Milwaukee, WI: ASQ Quality Press; 2005.
- , , , . STRIDE—an integrated standards‐based translational research informatics platform. AMIA Annu Symp Proc. 2009;2009:391–395.
- , , . Accidental iatrogenic pneumothorax in hospitalized patients. Med Care. 2006;44(2):182–186.
- , . Excess length of stay, charges, and mortality attributable to medical injuries during hospitalization. JAMA. 2003;290(14):1868–1874.
- , , , et al. Developing theory‐informed behaviour change interventions to implement evidence into practice: a systematic approach using the Theoretical Domains Framework. Implement Sci. 2012;7:38.
- , . Using rapid‐cycle quality improvement methodology to reduce feeding tubes in patients with advanced dementia: before and after study. BMJ. 2004;329(7464):491–494.
© 2015 Society of Hospital Medicine

Prevalence of the Use of PIVCs
Peripheral intravenous catheters (PIVCs) are ubiquitous devices that can have serious complications including bloodstream infections.[1] The annual use of PIVCs in North America has been reported to be in excess of 330 million. The estimated number of PIVCs used across greater Europe or other regions of the world is largely unknown, although estimates from global device sales have been reported to be approximately 1.2 billion.[1, 2]
Robust data on the prevalence of PIVCs and their associated management and infection prevention practices remain poor in Western countries; even more concerning is that PIVC data in developing nations remain relatively unknown.[3] Healthcare‐associated infection rates are significantly higher in developing nations, where the lack of resources and staff training can contribute to poor PIVC insertion and management.[4, 5]
There are currently scant data on PIVC management practices across different regions of the world. Localized complication rates such as phlebitis and infiltration are an under‐reported problem, yet are known to be a contributing factor for PIVC failure that leads to premature cessation of intravenous (IV) therapy, device removal, and the requirement for resiting of a new PIVC. Such failure can lead to delays in IV therapy, increased length of hospital stay, and cost.[6] Importantly, it can also lead to patient‐reported anxiety and pain. This lack of information has made it difficult to identify contributing factors for PIVC failure that may include inserter characteristics, patient‐related factors, and anatomical placement as well as healthcare facility adherence to international best practice and infection prevention guidelines.[6, 7]
The aim of this study was to undertake a multicenter, international study to assess the prevalence of PIVCs across different countries, to review population and PIVC characteristics from different regions of the world, and ascertain whether a larger study would provide beneficial data. The data of interest for this study included: (1) prevalence of PIVC use, (2) patient and PIVC characteristics, (3) prevalence of localized symptoms such as phlebitis, and (4) PIVC securement and dressing practices.
MATERIALS AND METHODS
Study Design and Participants
Participating hospitals were sourced through the authors international networks and specialist organizations in vascular access (such as the Association for Vascular Access in the United States and the World Congress in Vascular Access in Europe). A convenience sampling method was used for this point prevalence study. Participating sites were instructed to choose inpatient wards with medical or surgical patients and were asked to collect data on as many patients as possible with a PIVC in place on a given day. This method of patient recruitment was used due to the nature of the collaboration with participating sites; workload constraints dictated final sample numbers, as no funding was available. Sampling of general medical or surgical patients was expected to yield the greatest number of PIVCs compared to higher acuity areas.
The study was approved by the Human Research Ethics Committee of Griffith University (Queensland, Australia), with each participating organization required to comply with local ethical and regulatory requirements prior to participation. For the purpose of the study, only adult patients were screened, and all were required to give verbal or written informed consent prior to assessment of the PIVC.
A site questionnaire identified organizational characteristics regarding resource allocation and clinician training for insertion and management of PIVCs. The patient case report form (CRF) elicited information on patient demographics, characteristics of the PIVC, site assessment, and dressing and securement assessment. The CRF provided standardized assessment criteria. The Strengthening the Reporting of Observational Studies in Epidemiology guidelines for cross‐sectional studies were followed, and results are presented following these recommendations.
Statistical Analysis
Statistical software (SAS version 9.1; SAS Institute, Inc., Cary, NC) was used with results stratified into individual countries and regions. Proportions were used (with total number of PIVCs as the denominator) to present the data on PIVC characteristics. Data describing the prevalence of PIVC by country used individual country totals for derivation of a denominator.
RESULTS
Prevalence of PIVC Use
Fourteen sites in 13 countries contributed to this study (including 2 sites in the United States). The regions of Oceania, North and South America, Europe, and Asia were all represented. A total of 479 patients across all sites were screened for the presence of a PIVC. On the day of the study, the PIVC prevalence was 59% (n=281), with a range of 24% to 100%; only 1 patient across the entire cohort had more than 1 PIVC in place on the day of the study. The prevalence of patients with a vascular access device (VAD) other than a PIVC (eg, centrally or peripherally inserted central venous catheters) was 16% (n=76), and a quarter (n=122, 25%) of the patients screened had no VAD in place (Table 1).
| Region/Country | PIVC, n (%) | Other VAD, n (%) | No IV, n (%) | Total Patients, n |
|---|---|---|---|---|
| ||||
| North America | ||||
| Canada | 10 (48) | 11 (52) | 0 | 21 |
| United States of America | 16 (64) | 9 (36) | 0 | 25 |
| Latin America | ||||
| Argentina | 50 (79) | 3 (5) | 10 (16) | 63 |
| Western Europe | ||||
| England | 23 (100) | 0 | 0 | 23 |
| Greece | 5 (71) | 2 (29) | 0 | 7 |
| Italy | 12 (34) | 9 (26) | 14 (40) | 35 |
| Malta | 18 (78) | 0 | 5 (22) | 23 |
| Scotland | 12 (100) | 0 | 0 | 12 |
| Spain | 59 (83) | 3 (4) | 9 (13) | 71 |
| Asia | ||||
| China | 23 (24) | 24 (26) | 46 (50) | 93 |
| India | 16 (73) | 2 (9) | 4 (18) | 22 |
| Oceania | ||||
| Australia | 18 (37) | 13 (26) | 18 (37) | 49 |
| New Zealand | 19 (54) | 0 | 16 (46) | 35 |
The study sites in Spain and Argentina were among the countries that screened the largest number of patients and had a similar prevalence of PIVC use (83% and 79%, respectively, Table 1). The study site in China, which screened the highest number of patients overall (n=93), had the lowest PIVC prevalence at only 24%; this site also had the highest proportion of patients with no device at all (50%).
PIVC Characteristics
Overall, PIVC gauge preference was between 18 gauge and 22 gauge; this comprised 95% of all PIVCs in place across the regions. The forearm was the preferential choice for the regions of North America and Asia, with approximately half of PIVCs placed in this area. Notably, most PIVCs were inserted by nurses or specialty vascular access teams (Table 2), with medical practitioner insertions reported in only 2 regions (Western Europe and Oceania). Overall, most PIVCs were inserted in the general wards (91%). No PIVCs were found to have been inserted in the emergency room on the day of the study, although they could be represented in the unknown category.
| Population Group* | Region | |||||
|---|---|---|---|---|---|---|
| North America | Latin America | Western Europe | Asia | Oceania | Total | |
| ||||||
| Total PIVCs, n (%) | 26 (9) | 50 (18) | 129 (46) | 39 (14) | 37 (13) | 281 (100) |
| Age, mean (SD), y | 58 (16) | 51 (17) | 66 (19) | 51 (19) | 68 (17) | 59 (18) |
| Total men, n (%) | 11 (42) | 26 (52) | 72 (56) | 19 (49) | 25 (68) | 154 (55) |
| Hospital category, n (%) | ||||||
| Medical | 23 (89) | 19 (38) | 96 (74) | 28 (72) | 13 (35) | 179 (63) |
| Surgical | 0 | 23 (46) | 30 (23) | 3 (8) | 16 (43) | 72 (26) |
| Oncology | 0 | 0 | 3 (2) | 8 (20) | 8 (22) | 19 (7) |
| Intensive/coronary care | 3 (11) | 8 (16) | 0 | 0 | 0 | 11 (4) |
| PIVC inserted by, n (%) | ||||||
| Specialist team | 14 (54) | 8 (16) | 19 (15) | 0 | 27 (72) | 68 (24) |
| Nurse | 12 (47) | 42 (84) | 88 (68) | 39 (100.0) | 2 (5.0) | 183 (65) |
| Doctor | 0 | 0 | 22 (17) | 0 | 7 (19) | 29 (10) |
| Technician | 0 | 0 | 0 | 0 | 1 (3) | 1 (1) |
| Where PIVC was inserted, n (%) | ||||||
| Ward | 22 (85) | 42 (84) | 124 (96) | 39 (100.0) | 28 (76) | 255 (91) |
| Intensive/coronary care | 3 (12) | 8 (16) | 0 | 0 | 0 | 11 (4) |
| Unknown | 1 (4) | 0 | 5 (4) | 0 | 9 (24) | 15 (5) |
| Current IV fluid orders, n (%) | ||||||
| Yes | 10 (38) | 27 (54) | 62 (48) | 33 (85) | 14 (38) | 146 (52) |
| Current IV meds orders, n (%) | ||||||
| Yes | 22 (85) | 40 (80) | 93 (72) | 37 (95) | 16 (43) | 208 (74) |
| No IV or meds order, n (%) | ||||||
| Yes | 3 (12) | 6 (12) | 20 (16) | 1 (3) | 16 (43) | 46 (16) |
| Dressing quality, n (%) | ||||||
| Clean and intact | 25 (96) | 43 (86) | 98 (76) | 35 (90) | 25 (68) | 226 (80) |
| Moist or soiled | 0 | 2 (4) | 17 (13) | 1 (2) | 3 (8) | 23 (8) |
| Loose or lifting | 1 (4) | 5 (10) | 14 (11) | 3 (8) | 9 (24) | 32 (12) |
| Symptoms of phlebitis, n (%) | ||||||
| None | 25 (96) | 44 (88) | 114 (88) | 32 (82) | 36 (97) | 251 (89) |
| Pain or tenderness | 0 | 3 (6) | 5 (4) | 0 | 0 | 8 (3) |
| Redness | 0 | 0 | 7 (5) | 2 (5) | 0 | 9 (3) |
| Swelling | 1 (4) | 3 (6) | 2 (2) | 1 (3) | 0 | 7 (3) |
| Other | 0 | 0 | 1 (1) | 4 (10) | 1 (3) | 6 (2) |
There were disparate results across the regions for whether patients had a documented IV fluid order or IV medication order. The Asian region had the highest proportion of documented IV fluid and medication orders (85% and 95%, respectively) for patients with a PIVC. The lowest proportions of documented IV fluid and medication orders were from Oceania (38% and 43%, respectively). This region also had the highest number of PIVCs with neither IV nor medication order (43%). The overall study incidence of redundant PIVCs with no IV orders was 16%.
Most PIVC sites assessed had no symptoms of phlebitis; although every region had some patients with at least 1 sign (range: 3%12%). PIVC dressings were primarily clean and intact (n=226, 80%); however, the Oceania region had the highest proportion of dressings that were loose or lifting (24%). Dressing selection was homogenous in North America, Latin America, and Asia, where study sites exclusively used borderless transparent polyurethane dressings. A small proportion (9%) of patients in Western Europe had gauze and tape dressings.
Five of the 14 sites (36%) had a dedicated IV team, and most hospitals had dedicated PIVC insertion training for nursing staff (n=10, 71%). In contrast, only 43% (n=6) of sites provided PIVC insertion training for medical staff. Some facilities also used specially trained technicians to undertake cannulation (n=6, 43%). Most sites had policies for care and maintenance of PIVCs (n=12, 86%) and predominantly prescribed routine replacement of PIVCs every 72 to 96 hours (n=11, 83%). No sites exclusively prescribed leaving PIVCs in place until clinically indicated for removal, although some provided this as an option for certain patients.
DISCUSSION
This study has shown variation in the prevalence, characteristics, and management practices of PIVCs across sites from different regions of the world. Estimates for global PIVC prevalence in hospitalized patients vary widely from 30% to 80%.[8, 9, 10] The overall prevalence of PIVCs in this pilot study at 59% lay in the midrange of those reported in recent literature,[11] yet we found disproportionate PIVC prevalence between sites and regions. This heterogeneity could be explained by a number of factors including cohort acuity, clinician preference, and hospital guidelines. The generalizability of results from participating hospitals to their country is limited, because in most countries only a single institution participated.
Insertion of PIVCs was mainly by nurses, except in the Oceania region, where specialist teams and medical staff were the primary inserters. Of concern was the disparity in training provided by sites, with medical staff being less likely to receive instruction in how to prevent infection during this important procedure. A larger study would be needed to understand the effect on patient and infection outcomes of different inserter models and training provided.
A small proportion of patients from a site in Western Europe were observed to have gauze and tape as the PIVC dressing. The preference for gauze and tape is not common in developed nations, although recommended in clinical practice guidelines as an acceptable option.[12] There is currently no strong evidence to suggest that any 1 dressing or securement device to secure PIVCs is more effective than any other.[13] Nearly a quarter of PIVCs were loose or lifting from the Oceania region, this is of concern as interrupted dressings have been shown to increase the risk of catheter failure and catheter‐related bloodstream infection.[14]
We found that 17% of PIVCs overall had no IV order for fluids or medication. This proportion of redundant catheters increases the burden of preventable intravascular infection.[15] The prevalence of unnecessary PIVCs was lowest in Asia and greatest in the Oceania region, where 43% had no documented IV orders.
We reported PIVC prevalence from only a small number of nonrepresentative international sites for the purpose of considering a larger prevalence study. Observed differences in PIVC care and management cannot be generalized to entire regions. We asked sites to focus on medicalsurgical wards, and as such some PIVCs in higher acuity areas were likely not included. A larger study will help to assess PIVC outcomes and contributing factors for any differences, and improve external validity.
Operational challenges also may have affected sample selection and size. This was an unfunded study undertaken by hospital investigators, with competing workload demands. Poor or slow internet connection at the bedside was reported by every participating site, and may have contributed to the small numbers of patients screened at some sites.
CONCLUSION
More than half of hospitalized patients screened internationally had a PIVC, and 1 in 4 patients had no VAD, with wide variability from country to country both in prevalence and practice. The data gained have provided valuable initial insights into the global variation in PIVC use and care, and confirm that a larger international study with multiple sites is warranted. In particular, it remains important to understand variations in PIVC use and whether country or regional trends increase the risk of infection.
Acknowledgements
The authors thank the following collaborators for assisting in the collection of the data for this pilot study: Argentina: Laura Alberto, Fabio Castel, Estela Farias, and Carlos Daz; Australia: Nicholas Mifflin and Timothy Spencer; Canada: Jocelyn Hill; China: Lili Jin; Greece: Evangelos Konstantinou and Theodoros Katsoulas; India: Gracy Joseph and Sojan Ipe; Italy: Giancarlo Scoppettuolo and Laura Dolcetti; Malta: Michael Borg and Elmira Tartari; New Zealand: Ruth Barratt; Scotland: Linda Kelly and Audrey Green; Spain: Sonia Casanova, Jos Luis Mic, and Vicenta Solaz; England: Sheila Inwood; United States: Julie Jefferson and Janette Whitley.
Disclosures
All authors have made substantial contributions to the study conception and design, acquisition of the data, and analysis and interpretation of the data. Each author has contributed to drafting and editing the manuscript and approved the final version for publishing as per the International Committee of Medical Journal Editors convention. The authors wish to declare they have received unrestricted investigator‐initiated research grants from Becton Dickinson (BD) and 3M. The investigators also received professional translation services for most languages that were funded by B. Braun. All funds have been made payable to Griffith University and not to researchers themselves. These funders played no role in the conception, design, execution, analysis or reporting of the study. BD, 3M, CareFusion, Smiths Medical, B Braun, Vygon, and Teleflex assisted in disseminating study information and assisting with translation of data forms where necessary. No commercial entity had any involvement in the design, execution and analysis, or reporting of the study. Evan Alexandrou has provided education services for CareFusion, Teleflex, Cook Medical, and 3M. Peter Carr is undertaking a PhD, which is partly funded by BD. He has received payment for educational lectures from CareFusion. Claire Rickard's department (Griffith University) has received investigator‐initiated, unrestricted research/educational grants from suppliers of vascular access device products including: 3M, BD, CareFusion, and Centurion. Claire Rickard has undertaken contract research or educational lectures for Bard, BBraun, BD, CareFusion, and Teleflex. Sheila Inwood is an employee of CareFusion. Leonard Mermel has received research funding from Theravance, Astellas Pharma, Marvao Medical, and CareFusion, and he has been a consultant for 3M, CareFusion, Catheter Connections, Fresenius Medical, Marvao Medical, Bard Access, and ICU Medical.
- , . Peripheral venous catheters: an under‐evaluated problem. Int J Antimicrob Agents. 2009;34:S38–S42.
- PR Newswire. Global peripheral I.V. catheter market 2014–2018. Available at: http://www.prnewswire.com/news-releases/global-peripheral-iv-catheter-market-2014-2018-257019061.html. Accessed April 28, 2015.
- , , , et al. Burden of endemic health‐care‐associated infection in developing countries: systematic review and meta‐analysis. Lancet. 2011;377(9761):228–241.
- , , , . The attributable cost, length of hospital stay, and mortality of central line‐associated bloodstream infection in intensive care departments in Argentina: a prospective, matched analysis. Am J Infect Control. 2003;31(8):475–480.
- , , , , . Health‐care‐associated infection in Africa: a systematic review. Bull World Health Organ. 2011;89(10):757–765.
- , , , , , . Risk factors for PIV catheter failure: a multivariate analysis from a randomized control trial. InfectControl Hosp Epidemiol. 2014;35(1):63–68.
- , . Intravenous catheter complications in the hand and forearm. J Trauma. 2004;56(1):123–127.
- , , . The Auckland City Hospital Device Point Prevalence Survey 2005: utilisation and infectious complications of intravascular and urinary devices. NZ Med J. 2007;120(1260):U2683.
- , , , et al. Prospective surveillance of phlebitis associated with peripheral intravenous catheters. Am J Infect Control. 2006;34(5):308–312.
- , , , et al. Clinical epidemiology and outcomes of peripheral venous catheter‐related bloodstream infections at a university‐affiliated hospital. J Hosp Infect. 2007;67(1):22–29.
- , , , , . Gauze and tape and transparent polyurethane dressings for central venous catheters. Cochrane Database Syst Rev. 2011;(11):CD003827.
- , , , , , . Gauze and tape and transparent polyurethane dressings for central venous catheters. Cochrane Database Syst Rev. 2003;(4):CD003827.
- , , , , , . Central venous catheter dressings: a systematic review. J Adv Nurs. 2003;44(6):623–632.
- , , , et al. Dressing disruption is a major risk factor for catheter‐related infections. Crit Care Med. 2012;40(6):1707–1714.
- , , , . The idle intravenous catheter. Ann Intern Med. 1992;116(9):737–738.
Peripheral intravenous catheters (PIVCs) are ubiquitous devices that can have serious complications including bloodstream infections.[1] The annual use of PIVCs in North America has been reported to be in excess of 330 million. The estimated number of PIVCs used across greater Europe or other regions of the world is largely unknown, although estimates from global device sales have been reported to be approximately 1.2 billion.[1, 2]
Robust data on the prevalence of PIVCs and their associated management and infection prevention practices remain poor in Western countries; even more concerning is that PIVC data in developing nations remain relatively unknown.[3] Healthcare‐associated infection rates are significantly higher in developing nations, where the lack of resources and staff training can contribute to poor PIVC insertion and management.[4, 5]
There are currently scant data on PIVC management practices across different regions of the world. Localized complication rates such as phlebitis and infiltration are an under‐reported problem, yet are known to be a contributing factor for PIVC failure that leads to premature cessation of intravenous (IV) therapy, device removal, and the requirement for resiting of a new PIVC. Such failure can lead to delays in IV therapy, increased length of hospital stay, and cost.[6] Importantly, it can also lead to patient‐reported anxiety and pain. This lack of information has made it difficult to identify contributing factors for PIVC failure that may include inserter characteristics, patient‐related factors, and anatomical placement as well as healthcare facility adherence to international best practice and infection prevention guidelines.[6, 7]
The aim of this study was to undertake a multicenter, international study to assess the prevalence of PIVCs across different countries, to review population and PIVC characteristics from different regions of the world, and ascertain whether a larger study would provide beneficial data. The data of interest for this study included: (1) prevalence of PIVC use, (2) patient and PIVC characteristics, (3) prevalence of localized symptoms such as phlebitis, and (4) PIVC securement and dressing practices.
MATERIALS AND METHODS
Study Design and Participants
Participating hospitals were sourced through the authors international networks and specialist organizations in vascular access (such as the Association for Vascular Access in the United States and the World Congress in Vascular Access in Europe). A convenience sampling method was used for this point prevalence study. Participating sites were instructed to choose inpatient wards with medical or surgical patients and were asked to collect data on as many patients as possible with a PIVC in place on a given day. This method of patient recruitment was used due to the nature of the collaboration with participating sites; workload constraints dictated final sample numbers, as no funding was available. Sampling of general medical or surgical patients was expected to yield the greatest number of PIVCs compared to higher acuity areas.
The study was approved by the Human Research Ethics Committee of Griffith University (Queensland, Australia), with each participating organization required to comply with local ethical and regulatory requirements prior to participation. For the purpose of the study, only adult patients were screened, and all were required to give verbal or written informed consent prior to assessment of the PIVC.
A site questionnaire identified organizational characteristics regarding resource allocation and clinician training for insertion and management of PIVCs. The patient case report form (CRF) elicited information on patient demographics, characteristics of the PIVC, site assessment, and dressing and securement assessment. The CRF provided standardized assessment criteria. The Strengthening the Reporting of Observational Studies in Epidemiology guidelines for cross‐sectional studies were followed, and results are presented following these recommendations.
Statistical Analysis
Statistical software (SAS version 9.1; SAS Institute, Inc., Cary, NC) was used with results stratified into individual countries and regions. Proportions were used (with total number of PIVCs as the denominator) to present the data on PIVC characteristics. Data describing the prevalence of PIVC by country used individual country totals for derivation of a denominator.
RESULTS
Prevalence of PIVC Use
Fourteen sites in 13 countries contributed to this study (including 2 sites in the United States). The regions of Oceania, North and South America, Europe, and Asia were all represented. A total of 479 patients across all sites were screened for the presence of a PIVC. On the day of the study, the PIVC prevalence was 59% (n=281), with a range of 24% to 100%; only 1 patient across the entire cohort had more than 1 PIVC in place on the day of the study. The prevalence of patients with a vascular access device (VAD) other than a PIVC (eg, centrally or peripherally inserted central venous catheters) was 16% (n=76), and a quarter (n=122, 25%) of the patients screened had no VAD in place (Table 1).
| Region/Country | PIVC, n (%) | Other VAD, n (%) | No IV, n (%) | Total Patients, n |
|---|---|---|---|---|
| ||||
| North America | ||||
| Canada | 10 (48) | 11 (52) | 0 | 21 |
| United States of America | 16 (64) | 9 (36) | 0 | 25 |
| Latin America | ||||
| Argentina | 50 (79) | 3 (5) | 10 (16) | 63 |
| Western Europe | ||||
| England | 23 (100) | 0 | 0 | 23 |
| Greece | 5 (71) | 2 (29) | 0 | 7 |
| Italy | 12 (34) | 9 (26) | 14 (40) | 35 |
| Malta | 18 (78) | 0 | 5 (22) | 23 |
| Scotland | 12 (100) | 0 | 0 | 12 |
| Spain | 59 (83) | 3 (4) | 9 (13) | 71 |
| Asia | ||||
| China | 23 (24) | 24 (26) | 46 (50) | 93 |
| India | 16 (73) | 2 (9) | 4 (18) | 22 |
| Oceania | ||||
| Australia | 18 (37) | 13 (26) | 18 (37) | 49 |
| New Zealand | 19 (54) | 0 | 16 (46) | 35 |
The study sites in Spain and Argentina were among the countries that screened the largest number of patients and had a similar prevalence of PIVC use (83% and 79%, respectively, Table 1). The study site in China, which screened the highest number of patients overall (n=93), had the lowest PIVC prevalence at only 24%; this site also had the highest proportion of patients with no device at all (50%).
PIVC Characteristics
Overall, PIVC gauge preference was between 18 gauge and 22 gauge; this comprised 95% of all PIVCs in place across the regions. The forearm was the preferential choice for the regions of North America and Asia, with approximately half of PIVCs placed in this area. Notably, most PIVCs were inserted by nurses or specialty vascular access teams (Table 2), with medical practitioner insertions reported in only 2 regions (Western Europe and Oceania). Overall, most PIVCs were inserted in the general wards (91%). No PIVCs were found to have been inserted in the emergency room on the day of the study, although they could be represented in the unknown category.
| Population Group* | Region | |||||
|---|---|---|---|---|---|---|
| North America | Latin America | Western Europe | Asia | Oceania | Total | |
| ||||||
| Total PIVCs, n (%) | 26 (9) | 50 (18) | 129 (46) | 39 (14) | 37 (13) | 281 (100) |
| Age, mean (SD), y | 58 (16) | 51 (17) | 66 (19) | 51 (19) | 68 (17) | 59 (18) |
| Total men, n (%) | 11 (42) | 26 (52) | 72 (56) | 19 (49) | 25 (68) | 154 (55) |
| Hospital category, n (%) | ||||||
| Medical | 23 (89) | 19 (38) | 96 (74) | 28 (72) | 13 (35) | 179 (63) |
| Surgical | 0 | 23 (46) | 30 (23) | 3 (8) | 16 (43) | 72 (26) |
| Oncology | 0 | 0 | 3 (2) | 8 (20) | 8 (22) | 19 (7) |
| Intensive/coronary care | 3 (11) | 8 (16) | 0 | 0 | 0 | 11 (4) |
| PIVC inserted by, n (%) | ||||||
| Specialist team | 14 (54) | 8 (16) | 19 (15) | 0 | 27 (72) | 68 (24) |
| Nurse | 12 (47) | 42 (84) | 88 (68) | 39 (100.0) | 2 (5.0) | 183 (65) |
| Doctor | 0 | 0 | 22 (17) | 0 | 7 (19) | 29 (10) |
| Technician | 0 | 0 | 0 | 0 | 1 (3) | 1 (1) |
| Where PIVC was inserted, n (%) | ||||||
| Ward | 22 (85) | 42 (84) | 124 (96) | 39 (100.0) | 28 (76) | 255 (91) |
| Intensive/coronary care | 3 (12) | 8 (16) | 0 | 0 | 0 | 11 (4) |
| Unknown | 1 (4) | 0 | 5 (4) | 0 | 9 (24) | 15 (5) |
| Current IV fluid orders, n (%) | ||||||
| Yes | 10 (38) | 27 (54) | 62 (48) | 33 (85) | 14 (38) | 146 (52) |
| Current IV meds orders, n (%) | ||||||
| Yes | 22 (85) | 40 (80) | 93 (72) | 37 (95) | 16 (43) | 208 (74) |
| No IV or meds order, n (%) | ||||||
| Yes | 3 (12) | 6 (12) | 20 (16) | 1 (3) | 16 (43) | 46 (16) |
| Dressing quality, n (%) | ||||||
| Clean and intact | 25 (96) | 43 (86) | 98 (76) | 35 (90) | 25 (68) | 226 (80) |
| Moist or soiled | 0 | 2 (4) | 17 (13) | 1 (2) | 3 (8) | 23 (8) |
| Loose or lifting | 1 (4) | 5 (10) | 14 (11) | 3 (8) | 9 (24) | 32 (12) |
| Symptoms of phlebitis, n (%) | ||||||
| None | 25 (96) | 44 (88) | 114 (88) | 32 (82) | 36 (97) | 251 (89) |
| Pain or tenderness | 0 | 3 (6) | 5 (4) | 0 | 0 | 8 (3) |
| Redness | 0 | 0 | 7 (5) | 2 (5) | 0 | 9 (3) |
| Swelling | 1 (4) | 3 (6) | 2 (2) | 1 (3) | 0 | 7 (3) |
| Other | 0 | 0 | 1 (1) | 4 (10) | 1 (3) | 6 (2) |
There were disparate results across the regions for whether patients had a documented IV fluid order or IV medication order. The Asian region had the highest proportion of documented IV fluid and medication orders (85% and 95%, respectively) for patients with a PIVC. The lowest proportions of documented IV fluid and medication orders were from Oceania (38% and 43%, respectively). This region also had the highest number of PIVCs with neither IV nor medication order (43%). The overall study incidence of redundant PIVCs with no IV orders was 16%.
Most PIVC sites assessed had no symptoms of phlebitis; although every region had some patients with at least 1 sign (range: 3%12%). PIVC dressings were primarily clean and intact (n=226, 80%); however, the Oceania region had the highest proportion of dressings that were loose or lifting (24%). Dressing selection was homogenous in North America, Latin America, and Asia, where study sites exclusively used borderless transparent polyurethane dressings. A small proportion (9%) of patients in Western Europe had gauze and tape dressings.
Five of the 14 sites (36%) had a dedicated IV team, and most hospitals had dedicated PIVC insertion training for nursing staff (n=10, 71%). In contrast, only 43% (n=6) of sites provided PIVC insertion training for medical staff. Some facilities also used specially trained technicians to undertake cannulation (n=6, 43%). Most sites had policies for care and maintenance of PIVCs (n=12, 86%) and predominantly prescribed routine replacement of PIVCs every 72 to 96 hours (n=11, 83%). No sites exclusively prescribed leaving PIVCs in place until clinically indicated for removal, although some provided this as an option for certain patients.
DISCUSSION
This study has shown variation in the prevalence, characteristics, and management practices of PIVCs across sites from different regions of the world. Estimates for global PIVC prevalence in hospitalized patients vary widely from 30% to 80%.[8, 9, 10] The overall prevalence of PIVCs in this pilot study at 59% lay in the midrange of those reported in recent literature,[11] yet we found disproportionate PIVC prevalence between sites and regions. This heterogeneity could be explained by a number of factors including cohort acuity, clinician preference, and hospital guidelines. The generalizability of results from participating hospitals to their country is limited, because in most countries only a single institution participated.
Insertion of PIVCs was mainly by nurses, except in the Oceania region, where specialist teams and medical staff were the primary inserters. Of concern was the disparity in training provided by sites, with medical staff being less likely to receive instruction in how to prevent infection during this important procedure. A larger study would be needed to understand the effect on patient and infection outcomes of different inserter models and training provided.
A small proportion of patients from a site in Western Europe were observed to have gauze and tape as the PIVC dressing. The preference for gauze and tape is not common in developed nations, although recommended in clinical practice guidelines as an acceptable option.[12] There is currently no strong evidence to suggest that any 1 dressing or securement device to secure PIVCs is more effective than any other.[13] Nearly a quarter of PIVCs were loose or lifting from the Oceania region, this is of concern as interrupted dressings have been shown to increase the risk of catheter failure and catheter‐related bloodstream infection.[14]
We found that 17% of PIVCs overall had no IV order for fluids or medication. This proportion of redundant catheters increases the burden of preventable intravascular infection.[15] The prevalence of unnecessary PIVCs was lowest in Asia and greatest in the Oceania region, where 43% had no documented IV orders.
We reported PIVC prevalence from only a small number of nonrepresentative international sites for the purpose of considering a larger prevalence study. Observed differences in PIVC care and management cannot be generalized to entire regions. We asked sites to focus on medicalsurgical wards, and as such some PIVCs in higher acuity areas were likely not included. A larger study will help to assess PIVC outcomes and contributing factors for any differences, and improve external validity.
Operational challenges also may have affected sample selection and size. This was an unfunded study undertaken by hospital investigators, with competing workload demands. Poor or slow internet connection at the bedside was reported by every participating site, and may have contributed to the small numbers of patients screened at some sites.
CONCLUSION
More than half of hospitalized patients screened internationally had a PIVC, and 1 in 4 patients had no VAD, with wide variability from country to country both in prevalence and practice. The data gained have provided valuable initial insights into the global variation in PIVC use and care, and confirm that a larger international study with multiple sites is warranted. In particular, it remains important to understand variations in PIVC use and whether country or regional trends increase the risk of infection.
Acknowledgements
The authors thank the following collaborators for assisting in the collection of the data for this pilot study: Argentina: Laura Alberto, Fabio Castel, Estela Farias, and Carlos Daz; Australia: Nicholas Mifflin and Timothy Spencer; Canada: Jocelyn Hill; China: Lili Jin; Greece: Evangelos Konstantinou and Theodoros Katsoulas; India: Gracy Joseph and Sojan Ipe; Italy: Giancarlo Scoppettuolo and Laura Dolcetti; Malta: Michael Borg and Elmira Tartari; New Zealand: Ruth Barratt; Scotland: Linda Kelly and Audrey Green; Spain: Sonia Casanova, Jos Luis Mic, and Vicenta Solaz; England: Sheila Inwood; United States: Julie Jefferson and Janette Whitley.
Disclosures
All authors have made substantial contributions to the study conception and design, acquisition of the data, and analysis and interpretation of the data. Each author has contributed to drafting and editing the manuscript and approved the final version for publishing as per the International Committee of Medical Journal Editors convention. The authors wish to declare they have received unrestricted investigator‐initiated research grants from Becton Dickinson (BD) and 3M. The investigators also received professional translation services for most languages that were funded by B. Braun. All funds have been made payable to Griffith University and not to researchers themselves. These funders played no role in the conception, design, execution, analysis or reporting of the study. BD, 3M, CareFusion, Smiths Medical, B Braun, Vygon, and Teleflex assisted in disseminating study information and assisting with translation of data forms where necessary. No commercial entity had any involvement in the design, execution and analysis, or reporting of the study. Evan Alexandrou has provided education services for CareFusion, Teleflex, Cook Medical, and 3M. Peter Carr is undertaking a PhD, which is partly funded by BD. He has received payment for educational lectures from CareFusion. Claire Rickard's department (Griffith University) has received investigator‐initiated, unrestricted research/educational grants from suppliers of vascular access device products including: 3M, BD, CareFusion, and Centurion. Claire Rickard has undertaken contract research or educational lectures for Bard, BBraun, BD, CareFusion, and Teleflex. Sheila Inwood is an employee of CareFusion. Leonard Mermel has received research funding from Theravance, Astellas Pharma, Marvao Medical, and CareFusion, and he has been a consultant for 3M, CareFusion, Catheter Connections, Fresenius Medical, Marvao Medical, Bard Access, and ICU Medical.
- , . Peripheral venous catheters: an under‐evaluated problem. Int J Antimicrob Agents. 2009;34:S38–S42.
- PR Newswire. Global peripheral I.V. catheter market 2014–2018. Available at: http://www.prnewswire.com/news-releases/global-peripheral-iv-catheter-market-2014-2018-257019061.html. Accessed April 28, 2015.
- , , , et al. Burden of endemic health‐care‐associated infection in developing countries: systematic review and meta‐analysis. Lancet. 2011;377(9761):228–241.
- , , , . The attributable cost, length of hospital stay, and mortality of central line‐associated bloodstream infection in intensive care departments in Argentina: a prospective, matched analysis. Am J Infect Control. 2003;31(8):475–480.
- , , , , . Health‐care‐associated infection in Africa: a systematic review. Bull World Health Organ. 2011;89(10):757–765.
- , , , , , . Risk factors for PIV catheter failure: a multivariate analysis from a randomized control trial. InfectControl Hosp Epidemiol. 2014;35(1):63–68.
- , . Intravenous catheter complications in the hand and forearm. J Trauma. 2004;56(1):123–127.
- , , . The Auckland City Hospital Device Point Prevalence Survey 2005: utilisation and infectious complications of intravascular and urinary devices. NZ Med J. 2007;120(1260):U2683.
- , , , et al. Prospective surveillance of phlebitis associated with peripheral intravenous catheters. Am J Infect Control. 2006;34(5):308–312.
- , , , et al. Clinical epidemiology and outcomes of peripheral venous catheter‐related bloodstream infections at a university‐affiliated hospital. J Hosp Infect. 2007;67(1):22–29.
- , , , , . Gauze and tape and transparent polyurethane dressings for central venous catheters. Cochrane Database Syst Rev. 2011;(11):CD003827.
- , , , , , . Gauze and tape and transparent polyurethane dressings for central venous catheters. Cochrane Database Syst Rev. 2003;(4):CD003827.
- , , , , , . Central venous catheter dressings: a systematic review. J Adv Nurs. 2003;44(6):623–632.
- , , , et al. Dressing disruption is a major risk factor for catheter‐related infections. Crit Care Med. 2012;40(6):1707–1714.
- , , , . The idle intravenous catheter. Ann Intern Med. 1992;116(9):737–738.
AACE: How to safely skip radioactive iodine for low-grade thyroid cancer
NASHVILLE, TENN. – Patients with stage I or II differentiated thyroid cancers do not need radioactive iodine treatment if their nonsuppressed thyroglobulin level is less than 2 ng/mL 2 weeks after surgery, according to Dr. Kathleen Hands.
When that’s the case, “I know the patient had an excellent surgery and will have an excellent prognosis with an extremely low likelihood of recurrence over the next 10 years without radioactive iodine. These patients can be managed safely and effectively without radioactive iodine in a community setting,” said Dr. Hands, a thyroidologist who practices in San Antonio.

It’s common for patients in the United States to receive iodine-131 (I-131) after surgery for low-risk thyroid cancers “despite the abundance of evidence” showing that it does them no good and may cause harm and despite guidelines calling for conservative use of I-131, she said (World. J. Surg. 2002;26:879-85).
“It’s a habit,” a holdover from decades ago “when we didn’t actually have good surgical technique. We need to [heed recent data] and step away from what we did in the 60s, 70s, and 80s and get into the 21st century. We should stop using radioactive iodine in these low-risk patients,” Dr. Hands said at the American Association of Clinical Endocrinologists annual meeting.
Among radioactive iodine’s drawbacks are its expense and sometimes salivary and lacrimal problems associated with its use. Earlier in her career, “I personally had two of my cases” – 19 and 22 years old – “develop acute myelogenous leukemia [shortly] after I-131, one of whom succumbed. I took that very seriously. I’ve become very conservative in the use of this drug. Ablation should be restricted to patients with incomplete surgical excision or poor prognostic factors for recurrence or death,” she said.
This advice is backed up by findings from her review of 378 patients who underwent surgery for differentiated thyroid cancer, with MACIS (metastasis, age, completeness of resection, invasion, and size) scores below 7, meaning low-intermediate-risk disease. Patients ranged from 18 to 79 years old. The majority were women, and about a third had multifocal disease. Tumor sizes ranged from 0.8 mm to 4.0 cm. Twenty-one patients under 45 years old had lymph node metastases of less than 5 mm.
The patients had nonsuppressed thyroglobulin levels below 2 ng/mL 2 weeks after surgery. They opted against I-131, and were started on levothyroxine. There’s been no recurrence of disease in the group after 8 years’ follow-up; thyroglobulin was undetectable in 72% by 2 years. Those in whom thyroglobulin remained detectable had thyroglobulin velocities below 10% over a period of 5 years.
“Nonsuppressed thyroglobulin” means that the patients were not put on thyroxine right after surgery, so that Dr. Hands could get an idea if any tumor was left 2 weeks later. They also weren’t put on low-iodine diets in the interim, she said, because she had no intention of giving them I-131.
To get the most out of the approach, patients need excellent and complete surgeries. That means that endocrinologists should learn to perform preoperative neck ultrasounds – or refer to someone who can – to give surgeons a heads-up about tumor location, size, shape, and invasiveness, as well as lymph node involvement, calcifications, and other issues. “This is the kind of information your surgeon needs” to do a good job, Dr. Hands said.
She said she doesn’t worry about hypothyroidism when patients don’t get thyroxine right after surgery. Manipulation of the thyroid during surgery releases hormone into the system, and “I think that tides them over; It’s a long-acting hormone. Patients tolerate not having replacement immediately [after surgery],” Dr. Hands said.
There was no funding for the project, and Dr. Hands said she had no relevant financial disclosures.
NASHVILLE, TENN. – Patients with stage I or II differentiated thyroid cancers do not need radioactive iodine treatment if their nonsuppressed thyroglobulin level is less than 2 ng/mL 2 weeks after surgery, according to Dr. Kathleen Hands.
When that’s the case, “I know the patient had an excellent surgery and will have an excellent prognosis with an extremely low likelihood of recurrence over the next 10 years without radioactive iodine. These patients can be managed safely and effectively without radioactive iodine in a community setting,” said Dr. Hands, a thyroidologist who practices in San Antonio.
It’s common for patients in the United States to receive iodine-131 (I-131) after surgery for low-risk thyroid cancers “despite the abundance of evidence” showing that it does them no good and may cause harm and despite guidelines calling for conservative use of I-131, she said (World. J. Surg. 2002;26:879-85).
“It’s a habit,” a holdover from decades ago “when we didn’t actually have good surgical technique. We need to [heed recent data] and step away from what we did in the 60s, 70s, and 80s and get into the 21st century. We should stop using radioactive iodine in these low-risk patients,” Dr. Hands said at the American Association of Clinical Endocrinologists annual meeting.
Among radioactive iodine’s drawbacks are its expense and sometimes salivary and lacrimal problems associated with its use. Earlier in her career, “I personally had two of my cases” – 19 and 22 years old – “develop acute myelogenous leukemia [shortly] after I-131, one of whom succumbed. I took that very seriously. I’ve become very conservative in the use of this drug. Ablation should be restricted to patients with incomplete surgical excision or poor prognostic factors for recurrence or death,” she said.
This advice is backed up by findings from her review of 378 patients who underwent surgery for differentiated thyroid cancer, with MACIS (metastasis, age, completeness of resection, invasion, and size) scores below 7, meaning low-intermediate-risk disease. Patients ranged from 18 to 79 years old. The majority were women, and about a third had multifocal disease. Tumor sizes ranged from 0.8 mm to 4.0 cm. Twenty-one patients under 45 years old had lymph node metastases of less than 5 mm.
The patients had nonsuppressed thyroglobulin levels below 2 ng/mL 2 weeks after surgery. They opted against I-131, and were started on levothyroxine. There’s been no recurrence of disease in the group after 8 years’ follow-up; thyroglobulin was undetectable in 72% by 2 years. Those in whom thyroglobulin remained detectable had thyroglobulin velocities below 10% over a period of 5 years.
“Nonsuppressed thyroglobulin” means that the patients were not put on thyroxine right after surgery, so that Dr. Hands could get an idea if any tumor was left 2 weeks later. They also weren’t put on low-iodine diets in the interim, she said, because she had no intention of giving them I-131.
To get the most out of the approach, patients need excellent and complete surgeries. That means that endocrinologists should learn to perform preoperative neck ultrasounds – or refer to someone who can – to give surgeons a heads-up about tumor location, size, shape, and invasiveness, as well as lymph node involvement, calcifications, and other issues. “This is the kind of information your surgeon needs” to do a good job, Dr. Hands said.
She said she doesn’t worry about hypothyroidism when patients don’t get thyroxine right after surgery. Manipulation of the thyroid during surgery releases hormone into the system, and “I think that tides them over; It’s a long-acting hormone. Patients tolerate not having replacement immediately [after surgery],” Dr. Hands said.
There was no funding for the project, and Dr. Hands said she had no relevant financial disclosures.
AT AACE 2015
Key clinical point: Thyroid cancer patients do not need radioactive iodine treatment if their nonsuppressed thyroglobulin is less than 2 ng/mL 2 weeks after surgery.
Major finding: Among 378 patients whose nonsuppressed thyroglobulin levels were below 2 ng/mL 2 weeks after removal of low-risk differentiated thyroid cancers, there were zero recurrences over 8 years of follow-up.
Data source: A single-center, retrospective study.
Disclosures: The investigator said she had no relevant financial disclosures and no outside funding.

ASCO: Precision medicine initiatives take wing
CHICAGO – It’s getting very personal in oncology, and that’s a very good thing.
At the annual meeting of the American Society of Clinical Oncology, major cancer organizations announced new precision medicine initiatives that will attempt to match patients who have advanced cancers with the best available therapies based not on the location or histologic subtypes of their tumors, but on specific molecular abnormalities.

The National Cancer Institute’s Molecular Analysis for Therapy Choice (NCI-MATCH) trial will begin enrolling patients in July 2015. The study’s objective is “to understand the relative efficacy of the same therapy applied to oncogene-defined subsets across the entire cancer population as defined by site of origin or tumor histology,” said co–principal investigator Dr. Keith T. Flaherty of Harvard Medical School, Boston.
“This is the beginning, not the end, in terms of how we think about applying these therapies,” he said at a briefing that was held to announce the start of trial enrollment and a second initiative – the Targeted Agent and Profiling Utilization Registry (TAPUR) Study – by ASCO in cooperation with major pharmaceutical companies.
NCI-MATCH
NCI-MATCH is a phase II trial that will be operated through the National Clinical Trials Network. Oncologists at participating centers throughout the United States can enroll patients aged 18 years and older who have solid tumors or lymphomas that have relapsed or are refractory to conventional therapy, or who have a type of cancer for which no effective, consensus-based therapy is available.
Investigators plan to screen 3,000 patients initially, with the goal of enrolling 1,000 patients distributed among several substudies that will be evaluating specific drugs against specific molecular targets.

Patients will undergo biopsy at study entry, and their tumors will be subjected to genomic analysis to detect specific, targetable molecular abnormalities.
If a patient has a specific abnormality that is being explored in a current substudy, that patient will be further evaluated to determine whether he or she meets the eligibility criteria for that trial arm. Once enrolled, patients can remain on therapy until disease progression. The therapies will include both currently marketed agents and investigational therapies contributed by drug companies. Most of the trial arms will explore monotherapy with a targeted agent, but a few may investigate combinations which have accumulated enough safety and efficacy data to suggest that they might work against a specific molecular target.
The primary endpoint will be overall response rate, with a secondary endpoint of 6-month progression-free survival (PFS).
“This holds promise to bring faster cures to millions of Americans who so desperately need them,” ASCO past president Dr. Clifford A. Hudis said at the briefing.
TAPUR Trial
In cooperation with major pharmaceutical manufacturers (currently five, with more expected to sign on), ASCO has initiated a study designed to help answer the question, “I’ve got the tumor genome – now what do I do with it?”

The goal of the TAPUR trial, says ASCO Chief Medical Officer Dr. Richard Schilsky, is “to learn from the real world practice of prescribing targeted therapies to patients with advanced cancer whose tumor harbors a genomic variant known to be a drug target.”
The primary objectives are to describe the antitumor activity and toxicity profiles of targeted therapies, and to help patients get access to Food and Drug Administration–approved agents from which they may be able to benefit.
The trial will enroll patients with advanced solid tumors, B-cell non-Hodgkin’s lymphomas, and multiple myelomas for which there are no standard therapies. The patients must have adequate organ function and good performance status (0-2).
Patients will be matched by their personal physicians to specific therapies, if such a match exists; otherwise, they will be treated at the physician’s discretion.
The primary endpoint of the study will be overall response rates by Response Evaluation Criteria in Solid Tumors (RECIST). Secondary endpoints will be PFS, OS, time on treatment, grade 3 or greater adverse events, and serious adverse event. The investigators plan to begin patient enrollment in the fourth quarter of 2015.
Current industry partners include AstraZeneca, Bristol Myers Squibb, Eli Lilly, Genentech, and Pfizer.
The NCI-MATCH study is funded by the National Institutes of Health. Dr. Flaherty has received NIH research grants. Dr. Hudis disclosed ties to AstraZeneca, Sanofi-Aventis, Amgen, Bristol-Myers Squibb, Genentech, Eli Lilly, Novartis, Ortho Biotech, Pfizer, and Roche. Dr. Schilsky disclosed no relevant conflicts of interest.
CHICAGO – It’s getting very personal in oncology, and that’s a very good thing.
At the annual meeting of the American Society of Clinical Oncology, major cancer organizations announced new precision medicine initiatives that will attempt to match patients who have advanced cancers with the best available therapies based not on the location or histologic subtypes of their tumors, but on specific molecular abnormalities.
The National Cancer Institute’s Molecular Analysis for Therapy Choice (NCI-MATCH) trial will begin enrolling patients in July 2015. The study’s objective is “to understand the relative efficacy of the same therapy applied to oncogene-defined subsets across the entire cancer population as defined by site of origin or tumor histology,” said co–principal investigator Dr. Keith T. Flaherty of Harvard Medical School, Boston.
“This is the beginning, not the end, in terms of how we think about applying these therapies,” he said at a briefing that was held to announce the start of trial enrollment and a second initiative – the Targeted Agent and Profiling Utilization Registry (TAPUR) Study – by ASCO in cooperation with major pharmaceutical companies.
NCI-MATCH
NCI-MATCH is a phase II trial that will be operated through the National Clinical Trials Network. Oncologists at participating centers throughout the United States can enroll patients aged 18 years and older who have solid tumors or lymphomas that have relapsed or are refractory to conventional therapy, or who have a type of cancer for which no effective, consensus-based therapy is available.
Investigators plan to screen 3,000 patients initially, with the goal of enrolling 1,000 patients distributed among several substudies that will be evaluating specific drugs against specific molecular targets.
Patients will undergo biopsy at study entry, and their tumors will be subjected to genomic analysis to detect specific, targetable molecular abnormalities.
If a patient has a specific abnormality that is being explored in a current substudy, that patient will be further evaluated to determine whether he or she meets the eligibility criteria for that trial arm. Once enrolled, patients can remain on therapy until disease progression. The therapies will include both currently marketed agents and investigational therapies contributed by drug companies. Most of the trial arms will explore monotherapy with a targeted agent, but a few may investigate combinations which have accumulated enough safety and efficacy data to suggest that they might work against a specific molecular target.
The primary endpoint will be overall response rate, with a secondary endpoint of 6-month progression-free survival (PFS).
“This holds promise to bring faster cures to millions of Americans who so desperately need them,” ASCO past president Dr. Clifford A. Hudis said at the briefing.
TAPUR Trial
In cooperation with major pharmaceutical manufacturers (currently five, with more expected to sign on), ASCO has initiated a study designed to help answer the question, “I’ve got the tumor genome – now what do I do with it?”
The goal of the TAPUR trial, says ASCO Chief Medical Officer Dr. Richard Schilsky, is “to learn from the real world practice of prescribing targeted therapies to patients with advanced cancer whose tumor harbors a genomic variant known to be a drug target.”
The primary objectives are to describe the antitumor activity and toxicity profiles of targeted therapies, and to help patients get access to Food and Drug Administration–approved agents from which they may be able to benefit.
The trial will enroll patients with advanced solid tumors, B-cell non-Hodgkin’s lymphomas, and multiple myelomas for which there are no standard therapies. The patients must have adequate organ function and good performance status (0-2).
Patients will be matched by their personal physicians to specific therapies, if such a match exists; otherwise, they will be treated at the physician’s discretion.
The primary endpoint of the study will be overall response rates by Response Evaluation Criteria in Solid Tumors (RECIST). Secondary endpoints will be PFS, OS, time on treatment, grade 3 or greater adverse events, and serious adverse event. The investigators plan to begin patient enrollment in the fourth quarter of 2015.
Current industry partners include AstraZeneca, Bristol Myers Squibb, Eli Lilly, Genentech, and Pfizer.
The NCI-MATCH study is funded by the National Institutes of Health. Dr. Flaherty has received NIH research grants. Dr. Hudis disclosed ties to AstraZeneca, Sanofi-Aventis, Amgen, Bristol-Myers Squibb, Genentech, Eli Lilly, Novartis, Ortho Biotech, Pfizer, and Roche. Dr. Schilsky disclosed no relevant conflicts of interest.
AT THE 2015 ASCO ANNUAL MEETING

Expert: Don’t discourage pregnancy in MS patients; manage it
INDIANAPOLIS – If you feel overwhelmed by the notion of managing multiple sclerosis patients who seek your guidance in navigating their pregnancy, you’re not alone.
Comprehensive management programs for pregnant MS patients currently do not exist, even within most dedicated MS centers and clinics, Dr. Maria K. Houtchens said at the annual meeting of the Consortium of Multiple Sclerosis Centers.
“Individual providers have an interest in this area, but there are no guidelines for most physicians or nurse practitioners to follow yet,” she said. “The level of care these patients receive varies dramatically, from one part of the country to another and from one provider to the next.”

An estimated 50% of all pregnancies in the United States and about 40% of all pregnancies worldwide are unplanned.
“I believe that women with MS should receive support and counseling from their MS specialist on issues about possible pregnancy,” said Dr. Houtchens, a neurologist who directs the Women’s Health Program at the Partners MS Center at Brigham and Women’s Hospital, Boston. “I believe that we should all feel comfortable discussing with our patients the effects of pregnancy on their MS course and the reciprocal effect on pregnancy outcomes of their disease, the genetic risk of disease in their offspring, and optimal conception timing. We need to be able to talk to them freely about disease control before, during, and after pregnancy.”
Dr. Houtchens, one of the authors of a recent multinational systematic review on the topic noted that increasing numbers of MS patients with stable disease are choosing not to become pregnant (Obstet. Gynecol. 2014;124:1157-68). Others “want to get pregnant and feel cheated out of their life goal,” she said.
A large survey of female patients with MS from Canada found that more than three-quarters had not become pregnant since being diagnosed with the disease. The most common contributing factor across both MS-related and non–MS-related categories was completion of families prior to an MS diagnosis (53%). The top MS-related reasons that contributed to not having children were symptoms interfering with parenting, burdening the partner, and finances (Mult. Scler. 2013;19:351-8).
“It’s only in the last 2-3 decades that this issue has come to the forefront in caring for MS patients,” she said. “Previous to that, a lot of colleagues would discourage patients from becoming pregnant. Some of those attitudes persist to this day. There’s a perception of disapproval from health care providers on the part of the patient, and from their family and peers, and historic misconceptions. Our goal as physicians is to help women live lives to their fullest potential with a disease that can’t be cured. We should not discourage our patients from becoming pregnant.”
To optimize chances of conception, she recommended that oral contraceptives be stopped 2-3 months prior to conception attempts, and patients should be advised to transition to mechanical birth control. The optimal “fertility window” is a 6-day period, ending with the ovulation day. This window can be estimated based on duration of menstrual cycle, cervical mucus, and basal body temperature, as well as commercially available ovulation kits. Intercourse is most likely going to result in a pregnancy if attempted within a 3-day period, ending with the ovulation day. Moderate alcohol consumption, smoking, drug use, and vaginal lubricant use decrease the chance of contraception, she said.
Assisted reproductive technologies, if associated with failed pregnancy attempts, can lead to an increased relapse rate.
“If somebody really wants to have a child and are not able to conceive on their own, they may certainly consider ART; it’s all about education,” Dr. Houtchens said. “You just need to tell them what to expect and that they might have a higher risk of relapses if their attempt is unsuccessful.”
According to the medical literature, an MS patient’s prepregnancy annualized relapse rate predicts her risk for relapse during the postpartum period. “From that perspective, if you have the luxury of time, you ideally try to make sure that her disease is stabilized for the year before she becomes pregnant,” she said. “That means if she has an active MRI or has had a couple of attacks on whatever drug she’s taking, you talk to her about that, and you change the medication and repeat the MRI after the medication is changed to try to make sure that her disease is stable before she becomes pregnant. Hopefully that will help prevent postpartum attacks.”
Dr. Houtchens recommends standard preconception care including prenatal vitamins with 0.4 mg-1 mg of daily folate, smoking and alcohol cessation, improved sleep hygiene, and vitamin D3 supplementation. Low levels of vitamin D3 are associated with adverse pregnancy outcomes, and a poorer clinical and radiologic MS course. Low levels may also be associated with increased MS risk in offspring.
“A pregnancy test should be administered prior to every treatment with a chemotherapeutic or cytotoxic agent in a woman of child-bearing age, even if she thinks her periods have ceased as a result of chemotherapy treatment,” she said. “They may have ceased due to pregnancy, and we don’t want to treat our pregnant patients with chemotherapy.”
The approximate risk of MS is 1 in 500 in the general population, 1 in 100 in people with an affected second-degree relative, 1 in 50 with an affected first-degree relative, and 1 in 4 in monozygotic twins born to an affected mother, according to Dr. Houtchens.
Babies born to MS moms face a risk of being slightly smaller for gestational age by weight (odds ratio, 1.45) but their Apgar scores are the same as their healthy mom counterpart babies. MS moms face a slight risk for operative deliveries but no increased risk for birth defects or other adverse fetal outcomes specifically related to MS. The method of labor and delivery does not impact the postpartum course of the disease, she said.
“Epidural anesthesia is perfectly safe and does not impact the postpartum course of MS,” Dr. Houtchens said. “There’s still an ongoing misconception [about this], especially among obstetric providers and anesthesiologists. Multiple studies have been published stating that there is no increased risk of relapse in these patients after they get an epidural. If they don’t want an epidural, that’s okay, but they shouldn’t be denied it because they have MS.”
Secondary MS symptoms may be affected by pregnancy, including fatigue, bladder symptoms, and mobility difficulty due to increased weight. IV corticosteroids are used widely to treat MS relapses during pregnancy, as well as in obstetrics to speed fetal lung maturity.
Steroids “cross the placental barrier and may increase the risk of cleft palate when used in the first trimester or may cause lower birth weight in the baby and earlier than expected delivery. They could also in theory delay healing for the mother after giving birth,” she said.
However, prednisone, prednisolone, and methylprednisolone can be administered with low levels of fetal exposure. “These agents are metabolized to inactive forms by 11 beta-hydroxysteroid dehydrogenase in the placenta, allowing less than 10% of the maternal dose to reach the fetus,” she said. Betamethasone and dexamethasone cross the placenta with minimal metabolism, leading to direct full-dose effects on the fetus.
Dr. Houtchens cautioned that none of the available MS drugs should be used in pregnant patients.
“It appears that pregnancy itself is protective enough that we don’t need to use a drug to keep them healthier,” she said.
For a nonlactating patient, it’s safe to resume MS therapy within 1 week after birth. For a lactating patient with previously active disease, it may be safe to administer monthly steroids or monthly IVIG, instructing them to discontinue breastfeeding for 24 hours after treatment. In breast milk, beta-interferon agents are found at 0.006% of the maternal dose. Oral small molecules such as fingolimod and dimethyl fumarate “are freely passed in breast milk at a lower level than in sera but are more likely to directly affect the infant’s immune/neurological systems,” Dr. Houtchens said. “Hepatic clearance is slower in infants. We don’t have anyone at our MS center taking any MS medications and breastfeeding. Is this the right thing to do? I don’t know. But if you have someone who really wants to breastfeed, you could theoretically put them on an injectable medication.”
MRI should be repeated within 6 months postpartum to assess radiographic disease activity, she recommended.
Dr. Houtchers pointed out that postpartum depression is common in mothers with MS, “and it’s probably under-studied in general.” In fact, the lifetime prevalence of major depressive disorder in people with MS is estimated to be approximately 50%, while the rate of suicides among people with MS is 7.5 times greater than that of the general population.
Helping MS patients navigate conception, pregnancy, and the postpartum period is just the beginning.
“You’re still going to be her doctor,” Dr. Houtchens said. “She’s still going to have that child for the rest of her life. How is she going to deal with raising the child with all of the symptoms of her disease over time? How is she going to relate to her child? You’re going to walk this road with your patients, as one of their most important health care providers.”
Dr. Houtchens disclosed that she has received research grants from Genzyme Sanofi, Biogen Idec, and Novartis. She has also served as a consultant for Teva Pharmaceuticals, Genzyme Sanofi, Questcor, Biogen Idec, and Novartis.
On Twitter @dougbrunk
INDIANAPOLIS – If you feel overwhelmed by the notion of managing multiple sclerosis patients who seek your guidance in navigating their pregnancy, you’re not alone.
Comprehensive management programs for pregnant MS patients currently do not exist, even within most dedicated MS centers and clinics, Dr. Maria K. Houtchens said at the annual meeting of the Consortium of Multiple Sclerosis Centers.
“Individual providers have an interest in this area, but there are no guidelines for most physicians or nurse practitioners to follow yet,” she said. “The level of care these patients receive varies dramatically, from one part of the country to another and from one provider to the next.”
An estimated 50% of all pregnancies in the United States and about 40% of all pregnancies worldwide are unplanned.
“I believe that women with MS should receive support and counseling from their MS specialist on issues about possible pregnancy,” said Dr. Houtchens, a neurologist who directs the Women’s Health Program at the Partners MS Center at Brigham and Women’s Hospital, Boston. “I believe that we should all feel comfortable discussing with our patients the effects of pregnancy on their MS course and the reciprocal effect on pregnancy outcomes of their disease, the genetic risk of disease in their offspring, and optimal conception timing. We need to be able to talk to them freely about disease control before, during, and after pregnancy.”
Dr. Houtchens, one of the authors of a recent multinational systematic review on the topic noted that increasing numbers of MS patients with stable disease are choosing not to become pregnant (Obstet. Gynecol. 2014;124:1157-68). Others “want to get pregnant and feel cheated out of their life goal,” she said.
A large survey of female patients with MS from Canada found that more than three-quarters had not become pregnant since being diagnosed with the disease. The most common contributing factor across both MS-related and non–MS-related categories was completion of families prior to an MS diagnosis (53%). The top MS-related reasons that contributed to not having children were symptoms interfering with parenting, burdening the partner, and finances (Mult. Scler. 2013;19:351-8).
“It’s only in the last 2-3 decades that this issue has come to the forefront in caring for MS patients,” she said. “Previous to that, a lot of colleagues would discourage patients from becoming pregnant. Some of those attitudes persist to this day. There’s a perception of disapproval from health care providers on the part of the patient, and from their family and peers, and historic misconceptions. Our goal as physicians is to help women live lives to their fullest potential with a disease that can’t be cured. We should not discourage our patients from becoming pregnant.”
To optimize chances of conception, she recommended that oral contraceptives be stopped 2-3 months prior to conception attempts, and patients should be advised to transition to mechanical birth control. The optimal “fertility window” is a 6-day period, ending with the ovulation day. This window can be estimated based on duration of menstrual cycle, cervical mucus, and basal body temperature, as well as commercially available ovulation kits. Intercourse is most likely going to result in a pregnancy if attempted within a 3-day period, ending with the ovulation day. Moderate alcohol consumption, smoking, drug use, and vaginal lubricant use decrease the chance of contraception, she said.
Assisted reproductive technologies, if associated with failed pregnancy attempts, can lead to an increased relapse rate.
“If somebody really wants to have a child and are not able to conceive on their own, they may certainly consider ART; it’s all about education,” Dr. Houtchens said. “You just need to tell them what to expect and that they might have a higher risk of relapses if their attempt is unsuccessful.”
According to the medical literature, an MS patient’s prepregnancy annualized relapse rate predicts her risk for relapse during the postpartum period. “From that perspective, if you have the luxury of time, you ideally try to make sure that her disease is stabilized for the year before she becomes pregnant,” she said. “That means if she has an active MRI or has had a couple of attacks on whatever drug she’s taking, you talk to her about that, and you change the medication and repeat the MRI after the medication is changed to try to make sure that her disease is stable before she becomes pregnant. Hopefully that will help prevent postpartum attacks.”
Dr. Houtchens recommends standard preconception care including prenatal vitamins with 0.4 mg-1 mg of daily folate, smoking and alcohol cessation, improved sleep hygiene, and vitamin D3 supplementation. Low levels of vitamin D3 are associated with adverse pregnancy outcomes, and a poorer clinical and radiologic MS course. Low levels may also be associated with increased MS risk in offspring.
“A pregnancy test should be administered prior to every treatment with a chemotherapeutic or cytotoxic agent in a woman of child-bearing age, even if she thinks her periods have ceased as a result of chemotherapy treatment,” she said. “They may have ceased due to pregnancy, and we don’t want to treat our pregnant patients with chemotherapy.”
The approximate risk of MS is 1 in 500 in the general population, 1 in 100 in people with an affected second-degree relative, 1 in 50 with an affected first-degree relative, and 1 in 4 in monozygotic twins born to an affected mother, according to Dr. Houtchens.
Babies born to MS moms face a risk of being slightly smaller for gestational age by weight (odds ratio, 1.45) but their Apgar scores are the same as their healthy mom counterpart babies. MS moms face a slight risk for operative deliveries but no increased risk for birth defects or other adverse fetal outcomes specifically related to MS. The method of labor and delivery does not impact the postpartum course of the disease, she said.
“Epidural anesthesia is perfectly safe and does not impact the postpartum course of MS,” Dr. Houtchens said. “There’s still an ongoing misconception [about this], especially among obstetric providers and anesthesiologists. Multiple studies have been published stating that there is no increased risk of relapse in these patients after they get an epidural. If they don’t want an epidural, that’s okay, but they shouldn’t be denied it because they have MS.”
Secondary MS symptoms may be affected by pregnancy, including fatigue, bladder symptoms, and mobility difficulty due to increased weight. IV corticosteroids are used widely to treat MS relapses during pregnancy, as well as in obstetrics to speed fetal lung maturity.
Steroids “cross the placental barrier and may increase the risk of cleft palate when used in the first trimester or may cause lower birth weight in the baby and earlier than expected delivery. They could also in theory delay healing for the mother after giving birth,” she said.
However, prednisone, prednisolone, and methylprednisolone can be administered with low levels of fetal exposure. “These agents are metabolized to inactive forms by 11 beta-hydroxysteroid dehydrogenase in the placenta, allowing less than 10% of the maternal dose to reach the fetus,” she said. Betamethasone and dexamethasone cross the placenta with minimal metabolism, leading to direct full-dose effects on the fetus.
Dr. Houtchens cautioned that none of the available MS drugs should be used in pregnant patients.
“It appears that pregnancy itself is protective enough that we don’t need to use a drug to keep them healthier,” she said.
For a nonlactating patient, it’s safe to resume MS therapy within 1 week after birth. For a lactating patient with previously active disease, it may be safe to administer monthly steroids or monthly IVIG, instructing them to discontinue breastfeeding for 24 hours after treatment. In breast milk, beta-interferon agents are found at 0.006% of the maternal dose. Oral small molecules such as fingolimod and dimethyl fumarate “are freely passed in breast milk at a lower level than in sera but are more likely to directly affect the infant’s immune/neurological systems,” Dr. Houtchens said. “Hepatic clearance is slower in infants. We don’t have anyone at our MS center taking any MS medications and breastfeeding. Is this the right thing to do? I don’t know. But if you have someone who really wants to breastfeed, you could theoretically put them on an injectable medication.”
MRI should be repeated within 6 months postpartum to assess radiographic disease activity, she recommended.
Dr. Houtchers pointed out that postpartum depression is common in mothers with MS, “and it’s probably under-studied in general.” In fact, the lifetime prevalence of major depressive disorder in people with MS is estimated to be approximately 50%, while the rate of suicides among people with MS is 7.5 times greater than that of the general population.
Helping MS patients navigate conception, pregnancy, and the postpartum period is just the beginning.
“You’re still going to be her doctor,” Dr. Houtchens said. “She’s still going to have that child for the rest of her life. How is she going to deal with raising the child with all of the symptoms of her disease over time? How is she going to relate to her child? You’re going to walk this road with your patients, as one of their most important health care providers.”
Dr. Houtchens disclosed that she has received research grants from Genzyme Sanofi, Biogen Idec, and Novartis. She has also served as a consultant for Teva Pharmaceuticals, Genzyme Sanofi, Questcor, Biogen Idec, and Novartis.
On Twitter @dougbrunk
EXPERT ANALYSIS AT THE CMSC ANNUAL MEETING

Diagnosis and Management of Complex Pelvic Floor Disorders in Women
From Beaumont Health System, Royal Oak, MI.
Abstract
- Objective: To review the evaluation and management of complex pelvic floor disorders in elderly women.
- Methods: Literature review and presentation of a clinical case.
- Results: Pelvic floor disorders are a common problem in elderly women. Pelvic organ prolapse and voiding complaints often coexist and several treatment options are available. A step-wise approach should be used in which management of the most bothersome symptoms occurs first. Conservative, medication, and surgical options should be discussed with each patient depending on treatment goals and health status. Some effects do overlap; however, treatment of one condition may not preclude treatment of other symptoms.
- Conclusion: In women with complex pelvic floor disorders, addressing the most bothersome symptom first will increase patient satisfaction. Patients should be counseled about the potential need for multiple treatments for optimal results.
The female pelvic floor consists of a complex relationship of muscles, connective tissue and fascia, ligaments, and neurovascular support. These structures are responsible for support of the pelvic organs (uterus, bladder, rectum, and vagina), maintain continence, and assist in normal bowel function. Pelvic floor disorders occur when there is a compromise in these structures, resulting in prolapse, urinary incontinence, bowel complaints, or pain. Often several symptoms coexist with overlapping pathophysiology. Examinations and studies should aim to correctly diagnose the disorders and guide treatments toward the most bothersome symptoms.
Pelvic organ prolapse occurs when there is a weakening of the pelvic floor connective tissue, muscles, and nerves, allowing a bulge or protrusion of the vaginal walls and their associated pelvic organs. Between 3% to 50% of women in the United States have some degree of pelvic organ prolapse depending on whether the definition is based on symptoms or anatomic evaluation [1–3]. Risk factors include vaginal delivery, obesity, Caucasian race, and prior prolapse surgery. Despite the non–life-threatening nature of pelvic organ prolapse, the associated social and physical restrictions can significantly impact quality of life [4]. The cost of prolapse surgery has been estimated to be over $1.4 billion per year [3].
The sensation of a vaginal bulge is the only symptom consistently related to pelvic organ prolapse, with patients typically reporting symptoms once the prolapse extends beyond the hymenal ring [5]. The diagnosis of pelvic organ prolapse is made based on symptoms and confirmed by physical exam.
Patients with pelvic organ prolapse may experience obstructive voiding symptoms, such as hesitancy, straining, or incomplete bladder emptying. In some cases, patients may have to manually reduce the bulge to be able to void, a practice known as “splinting.” Overactive bladder (OAB), a syndrome of urinary urgency, frequency, and nocturia with or without urgency incontinence, can also occur. In patients with lower urinary tract complaints, repair of a vaginal bulge, especially a cystocele, can be associated with improved voiding symptoms [6]. Additionally, prolapse treatment can unmask de novo stress urinary incontinence (SUI), leaking with cough, sneeze or other activity that increases abdominal pressure. Urinary tract infections, pelvic pain, dyspareunia and defecatory problems can also be present.
When evaluating a woman with pelvic organ prolapse and voiding complaints, the clinician should strive to illicit which symptoms bother the patient most. A patient with primarily OAB symptoms and minimal prolapse may be treated with physical therapy or medications addressing the OAB rather than reconstructive surgery. In contrast, the patient with OAB symptoms and bothersome prolapse must be counseled on possible need for additional treatment of voiding complaints following surgical repair. This may include management of persistent OAB symptoms or SUI occurring following prolapse repair. Defecatory problems may be independent of a small rectocele present on exam, especially if long-term constipation is present. Choice of treatment depends on the severity of symptoms, the degree of prolapse, and the patient’s health status and activity level.
Case Study
Initial Presentation
A 68-year-old woman with a 15-month history of urinary urgency, frequency, incontinence and vaginal pressure presents to a urologist.
History and Physical Examination
The patient’s symptoms began shortly after the death of her husband. She initially saw her internist who prescribed antibiotics for a suspected urinary tract infection (UTI) based on office urinalysis. The symptoms did not resolve so another course of antibiotics was tried, again without relief. At her 3rd visit, a urine culture was done which was negative and she was referred to a urologist.
The patient reports 3 UTIs in the last 6 months. Following antibiotic treatment, the burning improves but she still complains of urgency and frequency. She also wears 2 to 3 pads per day for leakage that occurs with coughing and also when she feels an urge but cannot make it to the bathroom. She wakes 1 to 3 times at night to void. She feels that she empties her bladder well but often has to strain to void and sometimes feels a “bulge” in her vagina. All of these symptoms increase after being on her feet all day while she works as a grocery store cashier.
Physical exam demonstrates mild suprapubic tenderness and mild atrophic vaginitis. The anterior vaginal wall protrudes to the hymen with straining and her vaginal apex is supported 5 cm above the hymenal ring. With reduction of the cystocele there was urine leakage with cough. The cervix is surgically absent and her posterior vaginal wall is without bulge on valsalva. Her catheterized post-void residual (PVR) was 105 mL. Urine dipstick analysis was negative for infection or blood.
What is the initial evaluation of a woman with pelvic organ prolapse and voiding complaints?
The initial evaluation of a woman with pelvic organ prolapse and voiding complaints consists of a detailed history and physical examination. The nature, duration, and severity of symptoms should be assessed. Complaints of vaginal pressure or bulge are important, as well as exacerbating instances (standing, straining, defecation). Local irritation or vaginal spotting is common if prolapse is beyond the hymen. Splinting or reduction of a bulge to void or defecate are important elements of the history. Sexual history should never be overlooked, including both sexual status (active or not) as well as goals for future sexual activity. Voiding symptoms such as dysuria, frequency, urgency, nocturia and incontinence should be discussed. A 3-day voiding diary that captures number of voids per day, voided volumes, and fluid intake can be obtained. If incontinence is present, the clinician should determine what causes the incontinence. Incontinence that is associated with urgency or no warning (urge incontinence) should be treated differently than incontinence associated with activity (SUI). Mixed urinary incontinence is the presence of both stress and urgency incontinence.
Past medical history should include common medical comorbidities such as diabetes, hypertension and cardiovascular disease. Obstetric history is important due to the increased risk for pelvic floor disorders in women with multiple pregnancies and vaginal deliveries [2]. Prior hysterectomy, colon resection, or other pelvic surgeries may also contribute to symptoms. Smokers have a greater risk of genitourinary malignancy and high caffeine consumption is implicated in urgency-frequency syndromes. Exercise, sleep, and work may also be affected.
Pelvic examination should evaluate for vaginal atrophy or other vaginal mucosal abnormalities such as tears, ulcerations, lichen sclerosis, or erythema. To evaluate for prolapse, using one-half of a Graves or Pederson speculum, examine the 3 compartments of the vagina: anterior, posterior and apical. To view the anterior wall, the speculum is placed posteriorly to retract the posterior wall downward. Next it is rotated anteriorly to retract the anterior wall up and examine the posterior compartment. The uterus or the apex is evaluated with 2 halves of the speculum, one pushing anteriorly and the other posteriorly. At each point in the evaluation, the patient is told to strain or valsalva. The pelvic organ prolapse quantification system (POP-Q) is a systematic description of site-specific measurements of a woman’s pelvic support [7]. Using this classification system, a standardized and reproducible method of documenting the severity of the prolapse is done based on 6 points of the vaginal wall in relation to the hymen (2 on the anterior wall, 2 in the superior vagina, and 2 on the posterior vaginal wall). A corresponding prolapse stage can then be assigned to the patient based on POP-Q measurements. If unable to reproduce the patient’s symptoms, or exam findings do not correlate with the history, a standing exam can be helpful. Close evaluation of the urethra is also important. In severe prolapse the urethra may become kinked and mask a potential underlying problem (occult SUI). Patients should be asked to valsalva or cough with prolapse reduction and a full bladder to evaluate for this. Lastly, the pelvic floor muscles should be palpated to assess for pain or pelvic floor atrophy, hypertonicity, tenderness, or spasms.
If the patient complains of urgency, frequency, and/or dysuria, urine cultures should be performed to exclude infection even if the urinalysis is negative. Antibiotics should be given based on culture results. A postvoid ultrasound or catheterization is used to evaluate for incomplete bladder emptying. Patients with microscopic or gross hematuria should undergo further testing with radiologic and cystoscopic evaluation as indicated, especially with a history of smoking. Women should be questioned regarding their menstrual history and if postmenopausal, about any vaginal bleeding. A pelvic ultrasound should be considered if the patient has a history of endometriosis, gynecological cancers, uterine fibroids, or ovarian cysts or if considering uterine preserving surgery or colpocleisis. Urodynamics are often indicated in complex patients with prolapse and lower urinary tract complaints or prior pelvic surgery.
Diagnosis
The patient was diagnosed with mixed urinary incontinence and a grade 2 cystocele. Treatment options were discussed and she was most interested in conservative management options.
What is first-line treatment for the complaints of urgency, frequency, and incontinence?
In an older patient with complaints of urgency, frequency, and incontinence, dietary and behavioral modifications as well as pelvic floor physical therapy are considered first-line minimally invasive treatments.
Dietary irritants such as coffee, tea, soda, and other caffeinated beverages can contribute to worsening of symptoms [8]. A randomized study measuring the effects of caffeine noted a significant reduction in urgency and frequency of voids and in symptom scores with reduction of caffeine use [9]. Some elderly patients are reluctant to change their lifestyle, but even small changes can significantly improve their urgency symptoms.
Timed voiding is an effective method for bladder retraining, which can be critical for managing symptoms both alone and as an adjunct to other interventions. Studies of behavioral therapy show significant improvement in urgency, frequency, and incontinence episodes. In a study by Wyman and Fanti, patients participating in bladder training and Kegel exercises noted a 57% decrease in incontinence episodes and 54% decrease in urine loss without medications [10]. Burgio et al compared behavioral therapy to anticholinergic medication administration. After 4 sessions over 8 weeks they reported 81% reduction in incontinence episodes compared to 69% in the drug group and 39% in the placebo group [11].
Elderly patients may take several medications, some of which can affect urine volume and timing of urine production. Diuretics given later in the day can increase nighttime urine production and worsen nocturia. Similarly, lower extremity edema can increase nocturnal urine volumes when the patient reclines. Compressive stockings and leg elevation 2-3 hours prior to bedtime will help evenly distribute fluids and decrease reabsorption when supine at night.
Pelvic Floor Physical Therapy
Pelvic floor physical therapy (PFPT) can be an effective treatment for OAB, SUI, and pelvic organ prolapse. PFPT is used as an urge suppression strategy for OAB by teaching patients how to contract their pelvic muscles to occlude the urethra and prevent leakage during a detrusor contraction. Strategies to help suppress urge and manage stress situations can reduce incontinence episodes up to 60% to 80% [12]. Behavioral programs can include bladder diaries, scheduled voiding, delayed voiding, double voiding, fluid management, and caffeine reduction. When combined with PFPT they can be very effective in the management of OAB symptoms and incontinence. The BE-DRI study showed that combined behavioral training and drug therapy yielded better outcomes over time in OAB symptoms, patient distress and treatment satisfaction than drug therapy alone [13]. PFPT is considered a first-line treatment for OAB and is a noninvasive and effective treatment for these symptoms [14].
Pelvic floor programs for SUI aim to teach pelvic floor muscle contraction to help prevent stress leakage and use a variety of methods including biofeedback and personalized training programs. A recent Cochrane review included 18 studies of PFPT for incontinence. They concluded that there was high quality evidence that PFPT was associated with cure and moderate evidence for improvement in SUI [15]. In a study comparing surgery versus PFPT at 1 year, subjective improvement in the surgery group was 91% compared to 64% in the PFPT group. While PFPT was not as effective as surgery, over 50% had improvement. PFPT remains an effective noninvasive option that should be considered, particularly in an older patient [16].
PFPT has also been studied as a treatment option for pelvic organ prolapse. In a randomized controlled trial (RCT) that compared PFPT to controls over time, more women in the PFPT group improved 1 POP-Q stage compared to the control group. They also had significantly improved pelvic floor symptom bother [17]. In the POPPY study examining PFPT versus a control condition, researchers were not able to show statistically significant improvement in prolapse stages but did show improvement in secondary outcomes, including symptom bother and the feeling of “bulge.” Fewer women sought further treatment for prolapse after undergoing PFPT [18]. PFPT can be effective in managing prolapse symptoms and may help improve prolapse stage.
Pessary
Pessaries are commonly used for management of pelvic organ prolapse in patients who choose nonoperative management. In a large study of pessary use in the Medicare population, it was noted that of 34,782 women diagnosed with prolapse between 1999 and 2000, 11.6% were treated with a pessary. Complications noted during the 9 years of follow-up included 3% with vesicovaginal or rectovaginal fistulas and 5% with a device-associated complication [19]. Use increased with age, with 24% of women over 85 being managed with a pessary. In a review examining quality of life, improvement in bulge, irritative symptoms, and sexual satisfaction occurred with pessary use. In the medium-term, prolapse-related bother symptoms, quality of life, and overall perception of body image improved with the use of a pessary [20]. For SUI, rings with a knob or an incontinence dish can provide support to the urethra and help to pinch it closed with coughing, sneezing, and laughing, preventing leakage. In an RCT comparing women who received behavioral therapy, an incontinence pessary, or both, at 3 months 33% of those assigned to pessary reported improved incontinence symptoms compared to 49% with behavioral therapy, and 63% were satisfied with pessary treatment compared to 75% with behavioral therapy [21,22]. Differences did not persist to 12 months with over one third of all women improved and even more satisfied. A pessary can be safely used in the elderly population but does require office management and regular follow-up to prevent complications.
Initital Treatment
The patient was treated with 3 months of PFPT with biofeedback and pelvic floor muscle strengthening. In addition, she was able to decrease her caffeine use from 4 cups of coffee per day to 1 cup in the morning. At her 3-month follow-up visit, she noticed significant improvement in her voiding symptoms, and her voiding diary showed improved voided volumes and decreased frequency and nocturia. However, she was becoming more active in her community, going to aerobics and dance classes. She was more bothered by the “bulge” feeling in her vagina. She was not interested in a pessary but wanted to hear about surgical options for prolapse treatment.
What is operative management of pelvic organ prolapse?
The goals for surgical pelvic organ prolapse repair are to resolve symptoms, restore normal or near-normal anatomy, preserve sexual, urinary and bowel function, and minimize patient morbidity. The extent of prolapse, patient risk factors for recurrence, patient preference, and overall medical condition all influence the method for surgical repair. Surgeon familiarity and experience is also important when selecting the appropriate repair. Recent concerns regarding the use of synthetic mesh material has become a factor in counseling patients since the 2011 US Food and Drug Administration safety communication on transvaginal mesh [23].
Vaginal Approaches
Numerous techniques for pelvic organ prolapse repair have been described, though most repairs can broadly be divided into vaginal and abdominal procedures. Vaginal surgery is consistently associated with shorter operative times, less postoperative pain, and a shorter length of stay than abdominal approaches. All prolapsing compartments can be addressed vaginally using a patient’s own tissue, often called a “native tissue repair.” The vaginal apex is suspended from either the uterosacral ligament (USL) condensations or to the sacrospinous ligaments (SSL). Sutures are placed through these structures and tied to hold the vaginal vault in place, often at the time of concomitant enterocele, cystocele, or rectocele repairs. A recent randomized trial comparing USL and SSL repair showed composite functional and symptomatic success was 60% at 2 years and did not differ by technique [24]. While overall success may appear low, symptomatic vaginal bulge was present in only 17% to 19% of women at 2 years and only 5% underwent re-treatment with surgery or pessary during follow-up. Similar outcomes have been demonstrated for isolated cystocele repairs plicating the pubo-cervical fascia (anterior colporrhaphy). Cited failure rates have been as high as 70% [25], though this depends on the definition of success. When symptoms of bulge and/or prolapse beyond the hymen are used, success rates are closer to 89% at 2 years [26]. In one study comparing mesh-augmented cystocele repair with native tissue anterior colporrhaphy, 49% of women had a successful composite outcome at 2 years of grade 0 or 1 prolapse and no symptoms of bulge without the use of mesh graft [27]. Despite lower anatomic success rates, anterior colporrhaphy consistently relieves symptoms of bulge with low retreatment rates.
The high failure rates of native tissue vaginal repairs, especially in women with high-grade or recurrent prolapse, led to an interest in graft-augmented repairs. Furthermore, anatomic studies showed that up to 88% of cystoceles were associated with a lateral defect, or tearing of the pubocervical fascia from the pelvic sidewall (arcus tendineous fascia pelvis) [28]. Plicating the already weak fascia centrally would not repair an underlying lateral defect resulting in treatment failure. Replacing this weak fascia with a graft and anchoring it laterally and proximally should result in better anatomic and functional outcomes. These patches can be made from autologous tissue (rectus fascia), donor allograft material (fascia lata), xenografts (porcine dermis, bovine pericardium), or synthetic mesh. Initial studies using cadaveric dermis grafts for recurrent stage II or stage III/IV pelvic organ prolapse resulted in 50% failure at 4 years, but symptomatic failure was only 11% [29]. Further publications utilizing cadaveric tissue patches showed lower rates of cystocele recurrences of 0 to 17% between 20 and 56 months of follow-up [30].
As interest in patch repairs became popular, the use of synthetic mesh was applied to tension-free mid-urethral tapes for SUI. Studies were also showing rapid cadaveric and xenograft graft metabolism, graft extrusion, and early failure in some women [31]. This led to the use of larger pieces of synthetic mesh for prolapse repair, as it had been for abdominal wall and inguinal hernia repairs. Ultimately large-pore, light-weight polypropylene mesh was seen as the most favorable material and large randomized studies were performed to compare outcomes. Theoretically, a synthetic material would provide a replacement for the weakened and torn pubocervical fascia and not be subjected to enzymatic degradation. Altman et al published a widely cited randomized trial comparing native tissue vs. synthetic mesh showing that improvement in the composite primary outcome (no prolapse on the basis of both objective and subjective assessments) was more common in the mesh group (61% vs. 35%) at 1 year. Mesh placement was associated with longer operative times, higher blood loss, and 3.2% of women underwent secondary procedures for vaginal mesh exposure [27]. While there is still debate on the routine use of transvaginal mesh placement, current recommendations generally limit its use for recurrent or high grade pelvic organ prolapse (> Stage III), and possibly those at higher risks for recurrence. The American Urological Association has supported the FDA recommendation that patients undergo a thorough consent process and that surgeons are properly trained in pelvic reconstruction and mesh placement techniques. Furthermore, surgeons placing transvaginal mesh should be equipped to diagnose and treat any complications that may arise subsequent to its use.
Abdominal Approaches
Pelvic organ prolapse can also be approached through an abdominal technique. The classic description for vaginal vault prolapse repair is the abdominal sacrocolpopexy. This involves fixating the vaginal apex to the anterior longitudinal ligament at the sacral promontory. Hysterectomy is performed at the same setting if still in situ. A strip of lightweight polypropylene mesh is sutured to the anterior and posterior vaginal walls after dissecting the bladder and rectum off, then suspended in a tension-free manner to the sacrum. Large trials with long-term follow-up show durability of this repair. Seven-year follow-up of a large NIH-sponsored trial comparing sacrocolpopexy with and without urethropexy found 31/181 (17%) with anatomic prolapse beyond the hymen [32]. Of these women one-third had involvement of the vaginal apex, though 50% of women were asymptomatic. Overall, 95% of women had no retreatment for pelvic organ prolapse. A surprising finding was a 10.5% mesh exposure rate with a mean follow-up of 6.1 years. Previously, abdominally placed mesh was thought to be much safer than transvaginal mesh, but exposure rates are roughly similar in newer studies at high-volume, fellowship-trained centers [33]. The largest advance in abdominal prolapse surgery has come with the adoption of laparoscopic and robotic-assisted technology. Minimally invasive approaches to abdominal surgery have resulted in less blood loss and shorter length of stay, though longer operative times [34]. Short- and medium-term outcomes have been compared to the open techniques in smaller single-center series. At least 1 randomized trial comparing laparoscopic to robotic sacrocolpopexy showed similar complications and perioperative outcomes, though the robotic technique was more costly [35].
Stress Urinary Incontinence Procedures
When SUI is identified preoperatively, treatment should be considered at the time of prolapse repair [32,36]. The gold standard for treatment of SUI with urethral hypermobility has been placement of a synthetic mid-urethral sling. There are several types of slings available, mainly categorized as retropubic, transobturator, or single-incision “mini-slings.” In a multicenter study by the Urinary Incontinence Treatment Network (UITN), patient satisfaction after retropubic and transobturator sling placement was studied 12 months after surgery. Both groups had a high satisfaction rate (from 85% to 90%) for urine leakage, urgency, and frequency [37]. There was no significant difference in outcomes between the 2 approaches. Several other studies and systematic reviews have also shown excellent long-term results with sling treatment. In the recently published 5-year follow-up of the Trial of Mid-Urethral Slings (TOMUS), researchers demonstrated an 80% to 85% patient satisfaction rate with a 10% adverse event rate. Of these adverse events, only 6 were classified as serious requiring surgical, radiologic, or endoscopic intervention [38].
If the patient has SUI but no urethral hypermobility, consider intrinsic sphincter deficiency as the etiology of her incontinence. In that case, injectable therapy with urethral bulking agents is an effective treatment. Some commonly used injectables include carbon beads (Durasphere), calcium hydroxylapatite (Coaptite), bovine collagen (Contigen), and silicon particles (Macroplastique). In a Cochrane review of injectable therapy, they compared urethral injection to conservative treatment with physical therapy and noted an improvement with injection at 3 months. Surgical treatment was overall more effective; however, 50% of the women that received a collagen injection were satisfied at 12 months after the procedure. They also note lower morbidity for this procedure compared to surgery [39].
Treatment in This Patient
The patient underwent successful robotic sacrocolpopexy with mesh and a transobturator sling. There were no complications during the procedure and she reports no bulge or SUI symptoms. She has not been straining to void and has been emptying her bladder well since the Foley catheter was removed the day after surgery. However, she continues to complain of bothersome urgency, frequency, and urge incontinence. She is wearing 1 to 3 pads daily for leakage. At her 6-week postoperative visit, the exam showed excellent vaginal support, no SUI, low PVR, and her urine culture was negative.
What are the clinical implications of these findings?
At this point it is reasonable to continue treatment of OAB. The patient may continue to see improvement as she gets further out from surgery but especially in a patient that had preoperative OAB symptoms, treatment is indicated and may consist of reminding her of behavioral modifications, returning to pelvic floor physical therapy, or starting her on a medication.
What medications are used to treat OAB?
Anticholinergic Drugs
Anticholinergics are second-line therapy for OAB; these medications prevent the binding of acetylcholine to the M3 muscarinic receptor in the detrusor muscle and inhibit uncontrolled bladder contraction. There are numerous medications and delivery methods (pills, patches, gels) but efficacy is similar among the different drugs and all are limited by side effects such as dry mouth, constipation, and central nervous system side effects. Mirabegron, approved by the FDA in June 2012 and released in October 2012, is an agonist of the β3-adrenoceptor receptor in the detrusor muscle promoting bladder storage. A phase III trial found that mirabegron significantly decreased incontinence episodes and micturition frequency compared to placebo [40]. Dry mouth, common with anticholinergics, was 3 times less likely compared to tolterodine [41]. The most common side effects (headache, urinary tract infection, hypertension, and nasopharyngitis) were similar between treatment and placebo groups.
Long-term compliance, side effects, and decreased efficacy limit the benefits of medication therapy [42]. In one survey, 25% of patients taking OAB medications discontinued them within 12 months with 89% reporting unmet treatment expectations and/or tolerability [43].
6 Months Later
The patient continues to complain of persistent OAB symptoms despite anticholinergic and beta-3 agonist therapy. She reported significant constipation and dry mouth with an anticholinergic and symptoms did not improve with mirebegron. Despite having OAB symptoms prior to her prolapse repair, it is important to evaluate for any other cause of her persistent symptoms. Her surgical repair remains intact and urodynamics and cystoscopy were performed showing no evidence of bladder outlet obstruction and no mesh or suture material in the bladder. There was no leakage with valsalva, though she had some early sensation of fullness (sensory urge). With a negative evaluation, refractory OAB is diagnosed and the patient is a candidate for third-line OAB treatment.
What are third-line OAB treatments?
OnabotulinumtoxinA
OnabotulinumtoxinA (Botox) was approved in 2013 for patients intolerant or unresponsive to behavioral therapy and oral medications. OnabotulinumtoxinA is a chemical neuromodulator that cleaves the SNARE protein SNAP-25, inhibits the fusion of the cytoplasmic vesical to the nerve terminal, and prevents the release of acetylcholine. This causes detrusor muscle relaxation and may also inhibit sensory afferent pathways [44].
Nitti et al compared Botox 100 U to placebo in 557 patients that were refractory to anticholinergics [45]. Botox decreased the frequency of daily urinary incontinence episodes vs placebo (–2.65 vs –0.87, P < 0.001) and 22.9% vs 6.5% of patients became completely continent. A 5.4% rate of urinary retention occurred and UTI was the most common side effect (16%) in those receiving active drug. A dose of 100 U is recommended to limit side effects while maintaining efficacy [46].
Comparision of a daily anticholinergic (solifenacin) versus Botox 100 U for 6 months was done in a randomized double-blind, double-placebo-controlled trial [47]. Patients underwent saline injection or took an oral placebo in the anticholinergic and Botox groups, respectively. Complete resolution of urinary symptoms occurred in 13% of the medication group and 27% of the Botox group (P = 0.003). Dry mouth was more common in the medication group (46% vs. 31%) and the Botox group had a higher rate of catheter use and urinary tract infections (5% vs. 0%; 33% vs. 13%). Quality of life measures have also been shown to improve significantly following Botox injection [45,48].
When considering whether Botox is appropriate for a particular patient, physicians must determine whether the patient is willing and able to perform clean intermittent catheterization. Contraindications include active UTI, urinary retention, unwilling or unable to do clean intermittent catheterization, and known hypersenstivitiy to botulinum toxin type A. Although the definition of urinary retention and the PVR at which clean intermittent catheterization should be initiated varies, one study found a 94% rate of urinary retention with a preoperative PVR > 100 mL [49].
Botox can be administered in the clinic with or without local anesthetic but general anesthetic may be used in patients who might be poorly tolerant of the procedure. Using flexible or rigid cystoscopy, the bladder is filled to 100 to 200 mL. An injection needle is used to inject 0.5 cc aliquots of reconstituted onabotulinumtoxinA in 20 areas spaced 1 cm apart. Periprocedure antibiotics are recommended by the manufacturer but actual usage varies [50]. Patients should understand that the effects of Botox may take up to 4 weeks and an appointment should be scheduled within 2 weeks to evaluate PVR and any other adverse reactions. Repeat injections are needed between 3 to 9 months as symptoms return; however, efficacy is maintained with subsequent treatments [51].
Neuromodulation
Additional third-line treatment options include sacral or posterior tibial nerve neuromodulation. Sacral neuromodulation has been FDA approved for treatment of urgency, frequency and urgency incontinence since 1997. Also known as InterStim (Medtronic, Minneapolis, MN), this involves placement of a tined electrode adjacent to the S3 nerve root and is thought to result in modulation of the afferent nerve signals from the bladder to the spinal cord and the pontine micturition center.
Since the FDA approved sacral neuromodulation, long-term results for this therapy have been positive. A multicenter study with a 5-year follow-up showed a statistically significant reduction in daily leakage episodes, number of daily voids, and increase in voided volume, with a 5-year success rate of 68% for urgency incontinence and 56% for urgency/frequency [52]. Al-Zahrani et al followed 96 patients (35% with urgency incontinence) for a mean of 50.7 months and approximately 85% of the incontinent patients remained improved [53]. Conversely, Groen et al observed a gradual decrease in success rate from 1 month to 5 years in 60 women with urge incontinence, with only 15% completely continent at 5 years [54].
Sacral neuromodulation is typically performed in 2 stages. The first stage is electrode placement and trial period. A percutaneous nerve evaluation is a temporary electrode placement in the office or a permanent lead placement can be performed in the operating room. Correct placement stimulating the S3 nerve root is confirmed by motor and/or sensory testing. If there is an appropriate response, the electrode lead is connected to a temporary external pulse generator and is worn by the patient for a 2–14 day test period. If more than a 50% improvement in symptoms occur, a permanent lead and battery is placed in the operating room. If there is inadequate symptom response, the lead is removed. There are several recognized limitations of the office percutaneous nerve evaluation compared to operating room lead placement, including false-negative responses, possibly due to lead migration [55], incorrect lead placement, or an inadequate test period [56]. However, it is relatively noninvasive and potentially avoids 2 operating room procedures. Regardless of the choice of the initial test period, sacral neuromodulation offers a minimally invasive, long-term treatment option for refractory OAB.
Percutaneous tibial nerve stimulation (PTNS) is an office procedure that stimulates the posterior tibial nerve. This nerve contains L4–S3 fibers that originate from the same spinal segments that innervate the bladder and pelvic floor. In comparision to sacral neuromodulation, percutaneous tibial nerve stimulation is less invasive, less expensive and there is no permanent implant required [57].
Percutaneous tibial nerve stimulation is performed by a physician, nurse, or other advanced practice provider. Patients sit with knees abducted and the leg externally rotated. A 34-gauge needle is inserted 3 cm into the skin 3 fingerbreadths above the medial malleolus. The Urgent PC Neuromodulation System (Uroplasty, Minnetonka, MN) is attached and the amplitude of the stimulation is increased until the large toe curls or the toes fan. Each session lasts 30 minutes and 12 weekly treatments provides the best improvement in patient symptoms [58, 59]. There is a strong carry-over effect and patients generally need re-treatments every 4-6 weeks for 30 minutes.
Percutaneous tibial nerve stimulation has been compared favorably to both anticholinergic and sham treatments. The Overactive Bladder Innovative Therapy Trial (OrBIT) randomized 100 patients to PTNS or tolterodine for 12 weeks. The global response assessment demonstrated a statistically significant subjective improvement or cure over baseline in OAB symptoms in 79.5% of the PTNS group vs. 54.8% of the tolterodine group (P = 0.01)[60]. The SUmiT trial compared the efficacy of PTNS to sham for 12 weeks of therapy [59]. In this multicenter study, subjects were assessed at 13 weeks using the global response assessment for overall bladder symptoms. 55% of PTNS subjects achieved moderately or marked improvement in bladder symptoms compared to 20.9% of sham subjects (P < 0.001). Voiding diary parameters also improved compared to sham. In an earlier sham controlled trial, 12 patients (71%) in the treatment arm compared to none of the 15 placebo patients, demonstrated more than 50% improvement in diary and quality of life scores [61].
To evaluate long-term efficacy and safety, 36-month results of 29 positive responders of the initial SUmiT trial was reported [59]. In addition, a maintenance regimen was developed so patients received PTNS at tapering intervals over a 3-month period followed by a personalized treatment plan to sustain subjective improvement in their symptoms. With an average of 1 treatment a month, symptom severity scores and health related quality of life scores were statistically significant for improvement at each tested time-point. Yoong et al followed patients for 2 years following initial treatment with PTNS and confirmed a durable improvement in nocturia, frequency, urgency incontinence and symptom scores with a longer median length between treatments of 64 days [62].
PTNS is office-based, has few side effects, and avoids an implantable device. In addition, continuous stimulation is not necessary and a decreased treatment frequency is needed over time. Limitations include the time commitment that is required for both the initial treatment phase and the maintenance phase. Logistical concerns of weekly and monthly office visits or arranging for transportation can limit treatment.
Additional Treatment
The patient received injection of 100 U of Botox in the office. At her 2-week follow up appointment, her PVR was 90 mL and she was already seeing improvement in her incontinence episodes. At 6 weeks she was wearing 1 pad per day but using it mainly for protection. She still notices urgency, particularly if she drinks more than 1 cup of coffee in the morning, but overall she reports significant improvement in her symptoms. She has no complaints of a vaginal bulge and on exam has a grade 1 distal rectocele and no SUI with a full bladder. The physician discussed need for continued yearly examinations and repeat injections due to the duration of action of Botox.
Conclusion
This case demonstrates the complex step-wise management strategy of a patient with pelvic organ prolapse and voiding dysfunction. Interventions directed at patient bother and recognition of the various modalities and timing of treatment are essential to provide the greatest chance of positive treatment outcomes and patient satisfaction.
Corresponding author: Jaimie M Bartley, DO, 3601 W. 13 Mile Rd., Royal Oak, MI 48073.
Financial disclosures: None.
1. Nygaard I, Barber MD, Burgio KL, et al; Pelvic Floor Disorders Network. Prevalence of symptomatic pelvic floor disorders in US women. JAMA 2008;300:1311–6.
2. Hendrix SL, Clark A, Nygaard I, et al. Pelvic organ prolapse in the Women's Health Initiative: gravity and gravidity. Am J Obstet Gynecol 2002;186:1160–6.
3. Barber MD, Maher C. Epidemiology and outcome assessment of pelvic organ prolapse. Int Urogynecol J 2013;24:1783–90.
4. Zhang C, Hai T, Yu L, et al. Association between occupational stress and risk of overactive bladder and other lower urinary tract symptoms: a cross-sectional study of female nurses in China. Neurourol Urodyn 2013;32:254–60.
5. Swift SE, Tate SB, Nicholas J. Correlation of symptoms with degree of pelvic organ support in a general population of women: what is pelvic organ prolapse? Am J Obstet Gynecol 2003;189:372–7.
6. Baessler K, Maher C. Pelvic organ prolapse surgery and bladder function. Int Urogynecol J 2013;24:1843–52.
7. Bump RC, Mattiasson A, Bø K, et al. The standardization of terminology of female pelvic organ prolapse and pelvic floor dysfunction. Am J Obstet Gynecol 1996;175:10–7.
8. Lohsiriwat S, Hirunsai M, Chaiyaprasithi B. Effect of caffeine on bladder function in patients with overactive bladder symptoms. Urol Ann 2011;3:14–8.
9. Wells MJ, Jamieson K, Markham TC, et al. The effect of caffeinated versus decaffeinated drinks on overactive bladder: a double-blind, randomized, crossover study. J Wound Ostomy Continence Nurs 2014;41:371–8.
10. Fantl JA, Wyman JF, McClish DK, et al. Efficacy of bladder training in older women with urinary incontinence. JAMA 1991;265:609–13.
11. Burgio KL, Locher JL, Goode PS, et al. Behavioral vs drug treatment for urge urinary incontinence in older women: a randomized controlled trial. JAMA 1998;280:1995–2000.
12. Burgio KL. Update on behavioral and physical therapies for incontinence and overactive bladder: the role of pelvic floor muscle training. Curr Urol Rep 2013;14:457–64.
13. Burgio KL, Kraus SR, Menefee S, et al; Urinary Incontinence Treatment Network. Behavioral therapy to enable women with urge incontinence to discontinue drug treatment: a randomized trial. Ann Intern Med 2008;149:161–9.
14. Gormley EA, Lightner DJ, Faraday M, Vasavada SP. Diagnosis and Treatment of Overactive Bladder (Non-Neurogenic) in Adults: AUA/SUFU Guideline Amendment. J Urol 2015;193:1572–80.
15. Dumoulin C, Hay-Smith J, Habée-Séguin GM, Mercier J. Pelvic floor muscle training versus no treatment, or inactive control treatments, for urinary incontinence in women: A short version Cochrane systematic review with meta-analysis. Neurourol Urodyn 2015;34:300–8.
16. Labrie J, Berghmans BL, Fischer K, et al. Surgery versus physiotherapy for stress urinary incontinence. N Engl J Med 2013;369:1124–33.
17. Braekken IH, Majida M, Engh ME, Bø K. Can pelvic floor muscle training reverse pelvic organ prolapse and reduce prolapse symptoms? An assessor-blinded, randomized, controlled trial. Am J Obstet Gynecol 2010;203:170.e1–7.
18. Hagen S, Stark D, Glazener C, et al; POPPY Trial Collaborators. Individualised pelvic floor muscle training in women with pelvic organ prolapse (POPPY): a multicentre randomised controlled trial. Lancet 2014;383:796–806.
19. Alperin M, Khan A, Dubina E, et al. Patterns of pessary care and outcomes for medicare beneficiaries with pelvic organ prolapse. Female Pelvic Med Reconstr Surg 2013;19:142-7.
20. Lamers BH, Broekman BM, Milani AL. Pessary treatment for pelvic organ prolapse and health-related quality of life: a review. Int Urogynecol J 2011;22:637–44.
21. Richter HE, Burgio KL, Brubaker L, et al; Pelvic Floor Disorders Network. Continence pessary compared with behavioral therapy or combined therapy for stress incontinence: a randomized controlled trial. Obstet Gynecol 2010;115:609–17.
22. Wood LN, Anger JT. Urinary incontinence in women. BMJ 2014;349:g4531.
23. FDA Safety Communication. Update on serious complications associated with transvaginal placement of surgical mesh for pelvic organ prolapse. Available at http://www.fda.gov/MedicalDevices/Safety/AlertsandNotices/ucm262435.htm.
24. Barber MD, Brubaker L, Burgio KL, Meikle SF; Eunice Kennedy Shriver National Institute of Child Health and Human Development Pelvic Floor Disorders Network. Comparison of 2 transvaginal surgical approaches and perioperative behavioral therapy for apical vaginal prolapse: the OPTIMAL randomized trial. JAMA 2014;311:1023–34.
25. Weber AM, Walters MD, Piedmonte MR, Ballard LA. Anterior colporrhaphy: a randomized trial of three surgical techniques. Am J Obstet Gynecol 2001;185:1299–304.
26. Chmielewski L, Walters MD, Weber AM, Barber MD. Reanalysis of a randomized trial of 3 techniques of anterior colporrhaphy using clinically relevan tdefinitions of success. Am J Obstet Gynecol 2011;205:69.e1–8.
27. Altman D, Väyrynen T, Engh ME, et al; Nordic Transvaginal Mesh Group. Anterior colporrhaphy versus transvaginal mesh for pelvic-organ prolapse. N Engl J Med 2011;364:1826–36. Erratum in: N Engl J Med 2013;368:394.
28. Delancey JO. Fascial and muscular abnormalities in women with urethral hypermobility and anterior vaginal wall prolapse. Am J Obstet Gynecol 2002;187:93–8.
29. Clemons JL, Myers DL, Aguilar VC, Arya LA. Vaginal paravaginal repair with an AlloDerm graft. Am J Obstet Gynecol 2003;189:1612–8.
30. Gomelsky A, Rudy DC, Dmochowski RR. Porcine dermis interposition graft for repair of high grade anterior compartment defects with or without concomitant pelvic organ prolapse procedures. J Urol 2004;171:1581–4.
31. Handel LN, Frenkl TL, Kim YH. Results of cystocele repair: a comparison of traditional anterior colporrhaphy, polypropylene mesh and porcine dermis. J Urol 2007;178:153–6.
32. Nygaard I, Brubaker L, Zyczynski HM, et al. Long-term outcomes following abdominal sacrocolpopexy for pelvic organ prolapse. JAMA 2013;309:2016–24.
33. Sirls LT, McLennan GP, Killinger KA, et al. Exploring predictors of mesh exposure after vaginal prolapse repair. Female Pelvic Med Reconstr Surg 2013;19:206–9.
34. Hsiao KC, Latchamsetty K, Govier FE, et al. Comparison of laparoscopic and abdominal sacrocolpopexy for the treatment of vaginal vault prolapse. J Endourol 2007;21:926–30.
35. Anger JT, Mueller ER, Tarnay C, et al. Robotic compared with laparoscopic sacrocolpopexy: a randomized controlled trial. Obstet Gynecol 2014;123:5–12.
36. Wei JT, Nygaard I, Richter HE, et al; Pelvic Floor Disorders Network. A midurethral sling to reduce incontinence after vaginal prolapse repair. N Engl J Med 2012;366:2358–67.
37. Wai CY, Curto TM, Zyczynski HM, et al; Urinary Incontinence Treatment Network. Patient satisfaction after midurethral sling surgery for stress urinary incontinence. Obstet Gynecol 2013;121:1009–16.
38. Kenton K, Stoddard AM, Zyczynski H, et al. 5-year longitudinal followup after retropubic and transobturator mid urethral slings. J Urol 2015;193:203–10.
39. Kirchin V, Page T, Keegan PE, Atiemo K, Cody JD, McClinton S. Urethral injection therapy for urinary incontinence in women. Cochrane Database Syst Rev 2012;2:CD003881.
40. Chapple CR, Kaplan SA, Mitcheson D, et al. Randomized double-blind, active-controlled phase 3 study to assess 12-month safety and efficacy of mirabegron, a β(3)-adrenoceptor agonist, in overactive bladder. Eur Urol 2013;63:296–305.
41. Nitti VW, Auerbach S, Martin N, et al. Results of a randomized phase III trial of mirabegron in patients with overactive bladder. J Urol 2013;189:1388–95.
42. Dmochowski RR, Newman DK. Impact of overactive bladder on women in the United States: results of a national survey. Curr Med Res Opin 2007;23:65–76.
43. Benner JS, Nichol MB, Rovner ES, et al. Patient-reported reasons for discontinuing overactive bladder medication. BJU Int 2010;105:1276–82.
44. Apostolidis A, Dasgupta P, Fowler CJ. Proposed mechanism for the efficacy of injected botulinum toxin in the treatment of human detrusor overactivity. Eur Urol 2006;49:644–50.
45. Nitti VW, Dmochowski R, Herschorn S, et al; EMBARK Study Group. OnabotulinumtoxinA for the treatment of patients with overactive bladder and urinary incontinence: results of a phase 3, randomized, placebo controlled trial. J Urol 2013;189:2186–93.
46. Dmochowski R, Chapple C, Nitti VW, et al. Efficacy and safety of onabotulinumtoxinA for idiopathic overactive bladder: a double-blind, placebo controlled, randomized, dose ranging trial. J Urol 2010;184:2416–22.
47. Visco AG, Brubaker L, Richter HE, et al; Pelvic Floor Disorders Network. Anticholinergic versus botulinum toxin A comparison trial for the treatment of bothersome urge urinary incontinence: ABC trial. Contemp Clin Trials 2012;33:184–96.
48. Chapple C, Sievert KD, MacDiarmid S, et al. OnabotulinumtoxinA 100 U significantly improves all idiopathic overactive bladder symptoms and quality of life in patients with overactive bladder and urinary incontinence: a randomised, double-blind, placebo-controlled trial. Eur Urol 2013;64:249–56.
49. Osborn DJ, Kaufman MR, Mock S, et al. Urinary retention rates after intravesical onabotulinumtoxinA injection for idiopathic overactive bladder in clinical practice and predictors of this outcome. Neurourol Urodyn 2014 Jun 29.
50. Rovner E. Chapter 6: Practical aspects of administration of onabotulinumtoxinA. Neurourol Urodyn 2014;33 Suppl 3:S32–7.
51. Duthie JB, Vincent M, Herbison GP, et al. Botulinum toxin injections for adults with overactive bladder syndrome. Cochrane Database Syst Rev 2011;(12):CD005493.
52. van Kerrebroeck PE, van Voskuilen AC, Heesakkers JP, et al. Results of sacral neuromodulation therapy for urinary voiding dysfunction: outcomes of a prospective, worldwide clinical study. J Urol 2007;178:2029–34.
53. Al-zahrani AA, Elzayat EA, Gajewski JB. Long-term outcome and surgical interventions after sacral neuromodulation implant for lower urinary tract symptoms: 14-year experience at 1 center. J Urol 2011;185:981–6.
54. Groen J, Blok BF, Bosch JL. Sacral neuromodulation as treatment for refractory idiopathic urge urinary incontinence: 5-year results of a longitudinal study in 60 women. J Urol 2011;186:954–9.
55. Carey M, Fynes M, Murray C, Maher C. Sacral nerve root stimulation for lower urinary tract dysfunction: overcoming the problem of lead migration. BJU Int 2001;87:15–8.
56. Everaert K, Kerckhaert W, Caluwaerts H, et al. A prospective randomized trial comparing the 1-stage with the 2-stage implantation of a pulse generator in patients with pelvic floor dysfunction selected for sacral nerve stimulation. Eur Urol 2004;45:649–54.
57. Staskin DR, Peters KM, MacDiarmid S, et al. Percutaneous tibial nerve stimulation: a clinically and cost effective addition to the overactive bladder algorithm of care. Curr Urol Rep 2012;13:327–34.
58. Peters KM, Carrico DJ, Wooldridge LS, et al. Percutaneous tibial nerve stimulation for the long-term treatment of overactive bladder: 3-year results of the STEP study. J Urol 2013;189:2194–201.
59. Peters KM, Carrico DJ, Perez-Marrero RA, et al. Randomized trial of percutaneous tibial nerve stimulation versus Sham efficacy in the treatment of overactive bladder syndrome: results from the SUmiT trial. J Urol 2010;183:1438–43.
60. Peters KM, Macdiarmid SA, Wooldridge LS, et al. Randomized trial of percutaneous tibial nerve stimulation versus extended-release tolterodine: results from the overactive bladder innovative therapy trial. J Urol 2009;182:1055–61.
61. Finazzi-Agrò E, Petta F, Sciobica F, et al. Percutaneous tibial nerve stimulation effects on detrusor overactivity incontinence are not due to a placebo effect: a randomized, double-blind, placebo controlled trial. J Urol 2010;184:2001–6.
62. Yoong W, Shah P, Dadswell R, Green L. Sustained effectiveness of percutaneous tibial nerve stimulation for overactive bladder syndrome: 2-year follow-up of positive responders. Int Urogynecol J 2013;24:795–9.
From Beaumont Health System, Royal Oak, MI.
Abstract
- Objective: To review the evaluation and management of complex pelvic floor disorders in elderly women.
- Methods: Literature review and presentation of a clinical case.
- Results: Pelvic floor disorders are a common problem in elderly women. Pelvic organ prolapse and voiding complaints often coexist and several treatment options are available. A step-wise approach should be used in which management of the most bothersome symptoms occurs first. Conservative, medication, and surgical options should be discussed with each patient depending on treatment goals and health status. Some effects do overlap; however, treatment of one condition may not preclude treatment of other symptoms.
- Conclusion: In women with complex pelvic floor disorders, addressing the most bothersome symptom first will increase patient satisfaction. Patients should be counseled about the potential need for multiple treatments for optimal results.
The female pelvic floor consists of a complex relationship of muscles, connective tissue and fascia, ligaments, and neurovascular support. These structures are responsible for support of the pelvic organs (uterus, bladder, rectum, and vagina), maintain continence, and assist in normal bowel function. Pelvic floor disorders occur when there is a compromise in these structures, resulting in prolapse, urinary incontinence, bowel complaints, or pain. Often several symptoms coexist with overlapping pathophysiology. Examinations and studies should aim to correctly diagnose the disorders and guide treatments toward the most bothersome symptoms.
Pelvic organ prolapse occurs when there is a weakening of the pelvic floor connective tissue, muscles, and nerves, allowing a bulge or protrusion of the vaginal walls and their associated pelvic organs. Between 3% to 50% of women in the United States have some degree of pelvic organ prolapse depending on whether the definition is based on symptoms or anatomic evaluation [1–3]. Risk factors include vaginal delivery, obesity, Caucasian race, and prior prolapse surgery. Despite the non–life-threatening nature of pelvic organ prolapse, the associated social and physical restrictions can significantly impact quality of life [4]. The cost of prolapse surgery has been estimated to be over $1.4 billion per year [3].
The sensation of a vaginal bulge is the only symptom consistently related to pelvic organ prolapse, with patients typically reporting symptoms once the prolapse extends beyond the hymenal ring [5]. The diagnosis of pelvic organ prolapse is made based on symptoms and confirmed by physical exam.
Patients with pelvic organ prolapse may experience obstructive voiding symptoms, such as hesitancy, straining, or incomplete bladder emptying. In some cases, patients may have to manually reduce the bulge to be able to void, a practice known as “splinting.” Overactive bladder (OAB), a syndrome of urinary urgency, frequency, and nocturia with or without urgency incontinence, can also occur. In patients with lower urinary tract complaints, repair of a vaginal bulge, especially a cystocele, can be associated with improved voiding symptoms [6]. Additionally, prolapse treatment can unmask de novo stress urinary incontinence (SUI), leaking with cough, sneeze or other activity that increases abdominal pressure. Urinary tract infections, pelvic pain, dyspareunia and defecatory problems can also be present.
When evaluating a woman with pelvic organ prolapse and voiding complaints, the clinician should strive to illicit which symptoms bother the patient most. A patient with primarily OAB symptoms and minimal prolapse may be treated with physical therapy or medications addressing the OAB rather than reconstructive surgery. In contrast, the patient with OAB symptoms and bothersome prolapse must be counseled on possible need for additional treatment of voiding complaints following surgical repair. This may include management of persistent OAB symptoms or SUI occurring following prolapse repair. Defecatory problems may be independent of a small rectocele present on exam, especially if long-term constipation is present. Choice of treatment depends on the severity of symptoms, the degree of prolapse, and the patient’s health status and activity level.
Case Study
Initial Presentation
A 68-year-old woman with a 15-month history of urinary urgency, frequency, incontinence and vaginal pressure presents to a urologist.
History and Physical Examination
The patient’s symptoms began shortly after the death of her husband. She initially saw her internist who prescribed antibiotics for a suspected urinary tract infection (UTI) based on office urinalysis. The symptoms did not resolve so another course of antibiotics was tried, again without relief. At her 3rd visit, a urine culture was done which was negative and she was referred to a urologist.
The patient reports 3 UTIs in the last 6 months. Following antibiotic treatment, the burning improves but she still complains of urgency and frequency. She also wears 2 to 3 pads per day for leakage that occurs with coughing and also when she feels an urge but cannot make it to the bathroom. She wakes 1 to 3 times at night to void. She feels that she empties her bladder well but often has to strain to void and sometimes feels a “bulge” in her vagina. All of these symptoms increase after being on her feet all day while she works as a grocery store cashier.
Physical exam demonstrates mild suprapubic tenderness and mild atrophic vaginitis. The anterior vaginal wall protrudes to the hymen with straining and her vaginal apex is supported 5 cm above the hymenal ring. With reduction of the cystocele there was urine leakage with cough. The cervix is surgically absent and her posterior vaginal wall is without bulge on valsalva. Her catheterized post-void residual (PVR) was 105 mL. Urine dipstick analysis was negative for infection or blood.
What is the initial evaluation of a woman with pelvic organ prolapse and voiding complaints?
The initial evaluation of a woman with pelvic organ prolapse and voiding complaints consists of a detailed history and physical examination. The nature, duration, and severity of symptoms should be assessed. Complaints of vaginal pressure or bulge are important, as well as exacerbating instances (standing, straining, defecation). Local irritation or vaginal spotting is common if prolapse is beyond the hymen. Splinting or reduction of a bulge to void or defecate are important elements of the history. Sexual history should never be overlooked, including both sexual status (active or not) as well as goals for future sexual activity. Voiding symptoms such as dysuria, frequency, urgency, nocturia and incontinence should be discussed. A 3-day voiding diary that captures number of voids per day, voided volumes, and fluid intake can be obtained. If incontinence is present, the clinician should determine what causes the incontinence. Incontinence that is associated with urgency or no warning (urge incontinence) should be treated differently than incontinence associated with activity (SUI). Mixed urinary incontinence is the presence of both stress and urgency incontinence.
Past medical history should include common medical comorbidities such as diabetes, hypertension and cardiovascular disease. Obstetric history is important due to the increased risk for pelvic floor disorders in women with multiple pregnancies and vaginal deliveries [2]. Prior hysterectomy, colon resection, or other pelvic surgeries may also contribute to symptoms. Smokers have a greater risk of genitourinary malignancy and high caffeine consumption is implicated in urgency-frequency syndromes. Exercise, sleep, and work may also be affected.
Pelvic examination should evaluate for vaginal atrophy or other vaginal mucosal abnormalities such as tears, ulcerations, lichen sclerosis, or erythema. To evaluate for prolapse, using one-half of a Graves or Pederson speculum, examine the 3 compartments of the vagina: anterior, posterior and apical. To view the anterior wall, the speculum is placed posteriorly to retract the posterior wall downward. Next it is rotated anteriorly to retract the anterior wall up and examine the posterior compartment. The uterus or the apex is evaluated with 2 halves of the speculum, one pushing anteriorly and the other posteriorly. At each point in the evaluation, the patient is told to strain or valsalva. The pelvic organ prolapse quantification system (POP-Q) is a systematic description of site-specific measurements of a woman’s pelvic support [7]. Using this classification system, a standardized and reproducible method of documenting the severity of the prolapse is done based on 6 points of the vaginal wall in relation to the hymen (2 on the anterior wall, 2 in the superior vagina, and 2 on the posterior vaginal wall). A corresponding prolapse stage can then be assigned to the patient based on POP-Q measurements. If unable to reproduce the patient’s symptoms, or exam findings do not correlate with the history, a standing exam can be helpful. Close evaluation of the urethra is also important. In severe prolapse the urethra may become kinked and mask a potential underlying problem (occult SUI). Patients should be asked to valsalva or cough with prolapse reduction and a full bladder to evaluate for this. Lastly, the pelvic floor muscles should be palpated to assess for pain or pelvic floor atrophy, hypertonicity, tenderness, or spasms.
If the patient complains of urgency, frequency, and/or dysuria, urine cultures should be performed to exclude infection even if the urinalysis is negative. Antibiotics should be given based on culture results. A postvoid ultrasound or catheterization is used to evaluate for incomplete bladder emptying. Patients with microscopic or gross hematuria should undergo further testing with radiologic and cystoscopic evaluation as indicated, especially with a history of smoking. Women should be questioned regarding their menstrual history and if postmenopausal, about any vaginal bleeding. A pelvic ultrasound should be considered if the patient has a history of endometriosis, gynecological cancers, uterine fibroids, or ovarian cysts or if considering uterine preserving surgery or colpocleisis. Urodynamics are often indicated in complex patients with prolapse and lower urinary tract complaints or prior pelvic surgery.
Diagnosis
The patient was diagnosed with mixed urinary incontinence and a grade 2 cystocele. Treatment options were discussed and she was most interested in conservative management options.
What is first-line treatment for the complaints of urgency, frequency, and incontinence?
In an older patient with complaints of urgency, frequency, and incontinence, dietary and behavioral modifications as well as pelvic floor physical therapy are considered first-line minimally invasive treatments.
Dietary irritants such as coffee, tea, soda, and other caffeinated beverages can contribute to worsening of symptoms [8]. A randomized study measuring the effects of caffeine noted a significant reduction in urgency and frequency of voids and in symptom scores with reduction of caffeine use [9]. Some elderly patients are reluctant to change their lifestyle, but even small changes can significantly improve their urgency symptoms.
Timed voiding is an effective method for bladder retraining, which can be critical for managing symptoms both alone and as an adjunct to other interventions. Studies of behavioral therapy show significant improvement in urgency, frequency, and incontinence episodes. In a study by Wyman and Fanti, patients participating in bladder training and Kegel exercises noted a 57% decrease in incontinence episodes and 54% decrease in urine loss without medications [10]. Burgio et al compared behavioral therapy to anticholinergic medication administration. After 4 sessions over 8 weeks they reported 81% reduction in incontinence episodes compared to 69% in the drug group and 39% in the placebo group [11].
Elderly patients may take several medications, some of which can affect urine volume and timing of urine production. Diuretics given later in the day can increase nighttime urine production and worsen nocturia. Similarly, lower extremity edema can increase nocturnal urine volumes when the patient reclines. Compressive stockings and leg elevation 2-3 hours prior to bedtime will help evenly distribute fluids and decrease reabsorption when supine at night.
Pelvic Floor Physical Therapy
Pelvic floor physical therapy (PFPT) can be an effective treatment for OAB, SUI, and pelvic organ prolapse. PFPT is used as an urge suppression strategy for OAB by teaching patients how to contract their pelvic muscles to occlude the urethra and prevent leakage during a detrusor contraction. Strategies to help suppress urge and manage stress situations can reduce incontinence episodes up to 60% to 80% [12]. Behavioral programs can include bladder diaries, scheduled voiding, delayed voiding, double voiding, fluid management, and caffeine reduction. When combined with PFPT they can be very effective in the management of OAB symptoms and incontinence. The BE-DRI study showed that combined behavioral training and drug therapy yielded better outcomes over time in OAB symptoms, patient distress and treatment satisfaction than drug therapy alone [13]. PFPT is considered a first-line treatment for OAB and is a noninvasive and effective treatment for these symptoms [14].
Pelvic floor programs for SUI aim to teach pelvic floor muscle contraction to help prevent stress leakage and use a variety of methods including biofeedback and personalized training programs. A recent Cochrane review included 18 studies of PFPT for incontinence. They concluded that there was high quality evidence that PFPT was associated with cure and moderate evidence for improvement in SUI [15]. In a study comparing surgery versus PFPT at 1 year, subjective improvement in the surgery group was 91% compared to 64% in the PFPT group. While PFPT was not as effective as surgery, over 50% had improvement. PFPT remains an effective noninvasive option that should be considered, particularly in an older patient [16].
PFPT has also been studied as a treatment option for pelvic organ prolapse. In a randomized controlled trial (RCT) that compared PFPT to controls over time, more women in the PFPT group improved 1 POP-Q stage compared to the control group. They also had significantly improved pelvic floor symptom bother [17]. In the POPPY study examining PFPT versus a control condition, researchers were not able to show statistically significant improvement in prolapse stages but did show improvement in secondary outcomes, including symptom bother and the feeling of “bulge.” Fewer women sought further treatment for prolapse after undergoing PFPT [18]. PFPT can be effective in managing prolapse symptoms and may help improve prolapse stage.
Pessary
Pessaries are commonly used for management of pelvic organ prolapse in patients who choose nonoperative management. In a large study of pessary use in the Medicare population, it was noted that of 34,782 women diagnosed with prolapse between 1999 and 2000, 11.6% were treated with a pessary. Complications noted during the 9 years of follow-up included 3% with vesicovaginal or rectovaginal fistulas and 5% with a device-associated complication [19]. Use increased with age, with 24% of women over 85 being managed with a pessary. In a review examining quality of life, improvement in bulge, irritative symptoms, and sexual satisfaction occurred with pessary use. In the medium-term, prolapse-related bother symptoms, quality of life, and overall perception of body image improved with the use of a pessary [20]. For SUI, rings with a knob or an incontinence dish can provide support to the urethra and help to pinch it closed with coughing, sneezing, and laughing, preventing leakage. In an RCT comparing women who received behavioral therapy, an incontinence pessary, or both, at 3 months 33% of those assigned to pessary reported improved incontinence symptoms compared to 49% with behavioral therapy, and 63% were satisfied with pessary treatment compared to 75% with behavioral therapy [21,22]. Differences did not persist to 12 months with over one third of all women improved and even more satisfied. A pessary can be safely used in the elderly population but does require office management and regular follow-up to prevent complications.
Initital Treatment
The patient was treated with 3 months of PFPT with biofeedback and pelvic floor muscle strengthening. In addition, she was able to decrease her caffeine use from 4 cups of coffee per day to 1 cup in the morning. At her 3-month follow-up visit, she noticed significant improvement in her voiding symptoms, and her voiding diary showed improved voided volumes and decreased frequency and nocturia. However, she was becoming more active in her community, going to aerobics and dance classes. She was more bothered by the “bulge” feeling in her vagina. She was not interested in a pessary but wanted to hear about surgical options for prolapse treatment.
What is operative management of pelvic organ prolapse?
The goals for surgical pelvic organ prolapse repair are to resolve symptoms, restore normal or near-normal anatomy, preserve sexual, urinary and bowel function, and minimize patient morbidity. The extent of prolapse, patient risk factors for recurrence, patient preference, and overall medical condition all influence the method for surgical repair. Surgeon familiarity and experience is also important when selecting the appropriate repair. Recent concerns regarding the use of synthetic mesh material has become a factor in counseling patients since the 2011 US Food and Drug Administration safety communication on transvaginal mesh [23].
Vaginal Approaches
Numerous techniques for pelvic organ prolapse repair have been described, though most repairs can broadly be divided into vaginal and abdominal procedures. Vaginal surgery is consistently associated with shorter operative times, less postoperative pain, and a shorter length of stay than abdominal approaches. All prolapsing compartments can be addressed vaginally using a patient’s own tissue, often called a “native tissue repair.” The vaginal apex is suspended from either the uterosacral ligament (USL) condensations or to the sacrospinous ligaments (SSL). Sutures are placed through these structures and tied to hold the vaginal vault in place, often at the time of concomitant enterocele, cystocele, or rectocele repairs. A recent randomized trial comparing USL and SSL repair showed composite functional and symptomatic success was 60% at 2 years and did not differ by technique [24]. While overall success may appear low, symptomatic vaginal bulge was present in only 17% to 19% of women at 2 years and only 5% underwent re-treatment with surgery or pessary during follow-up. Similar outcomes have been demonstrated for isolated cystocele repairs plicating the pubo-cervical fascia (anterior colporrhaphy). Cited failure rates have been as high as 70% [25], though this depends on the definition of success. When symptoms of bulge and/or prolapse beyond the hymen are used, success rates are closer to 89% at 2 years [26]. In one study comparing mesh-augmented cystocele repair with native tissue anterior colporrhaphy, 49% of women had a successful composite outcome at 2 years of grade 0 or 1 prolapse and no symptoms of bulge without the use of mesh graft [27]. Despite lower anatomic success rates, anterior colporrhaphy consistently relieves symptoms of bulge with low retreatment rates.
The high failure rates of native tissue vaginal repairs, especially in women with high-grade or recurrent prolapse, led to an interest in graft-augmented repairs. Furthermore, anatomic studies showed that up to 88% of cystoceles were associated with a lateral defect, or tearing of the pubocervical fascia from the pelvic sidewall (arcus tendineous fascia pelvis) [28]. Plicating the already weak fascia centrally would not repair an underlying lateral defect resulting in treatment failure. Replacing this weak fascia with a graft and anchoring it laterally and proximally should result in better anatomic and functional outcomes. These patches can be made from autologous tissue (rectus fascia), donor allograft material (fascia lata), xenografts (porcine dermis, bovine pericardium), or synthetic mesh. Initial studies using cadaveric dermis grafts for recurrent stage II or stage III/IV pelvic organ prolapse resulted in 50% failure at 4 years, but symptomatic failure was only 11% [29]. Further publications utilizing cadaveric tissue patches showed lower rates of cystocele recurrences of 0 to 17% between 20 and 56 months of follow-up [30].
As interest in patch repairs became popular, the use of synthetic mesh was applied to tension-free mid-urethral tapes for SUI. Studies were also showing rapid cadaveric and xenograft graft metabolism, graft extrusion, and early failure in some women [31]. This led to the use of larger pieces of synthetic mesh for prolapse repair, as it had been for abdominal wall and inguinal hernia repairs. Ultimately large-pore, light-weight polypropylene mesh was seen as the most favorable material and large randomized studies were performed to compare outcomes. Theoretically, a synthetic material would provide a replacement for the weakened and torn pubocervical fascia and not be subjected to enzymatic degradation. Altman et al published a widely cited randomized trial comparing native tissue vs. synthetic mesh showing that improvement in the composite primary outcome (no prolapse on the basis of both objective and subjective assessments) was more common in the mesh group (61% vs. 35%) at 1 year. Mesh placement was associated with longer operative times, higher blood loss, and 3.2% of women underwent secondary procedures for vaginal mesh exposure [27]. While there is still debate on the routine use of transvaginal mesh placement, current recommendations generally limit its use for recurrent or high grade pelvic organ prolapse (> Stage III), and possibly those at higher risks for recurrence. The American Urological Association has supported the FDA recommendation that patients undergo a thorough consent process and that surgeons are properly trained in pelvic reconstruction and mesh placement techniques. Furthermore, surgeons placing transvaginal mesh should be equipped to diagnose and treat any complications that may arise subsequent to its use.
Abdominal Approaches
Pelvic organ prolapse can also be approached through an abdominal technique. The classic description for vaginal vault prolapse repair is the abdominal sacrocolpopexy. This involves fixating the vaginal apex to the anterior longitudinal ligament at the sacral promontory. Hysterectomy is performed at the same setting if still in situ. A strip of lightweight polypropylene mesh is sutured to the anterior and posterior vaginal walls after dissecting the bladder and rectum off, then suspended in a tension-free manner to the sacrum. Large trials with long-term follow-up show durability of this repair. Seven-year follow-up of a large NIH-sponsored trial comparing sacrocolpopexy with and without urethropexy found 31/181 (17%) with anatomic prolapse beyond the hymen [32]. Of these women one-third had involvement of the vaginal apex, though 50% of women were asymptomatic. Overall, 95% of women had no retreatment for pelvic organ prolapse. A surprising finding was a 10.5% mesh exposure rate with a mean follow-up of 6.1 years. Previously, abdominally placed mesh was thought to be much safer than transvaginal mesh, but exposure rates are roughly similar in newer studies at high-volume, fellowship-trained centers [33]. The largest advance in abdominal prolapse surgery has come with the adoption of laparoscopic and robotic-assisted technology. Minimally invasive approaches to abdominal surgery have resulted in less blood loss and shorter length of stay, though longer operative times [34]. Short- and medium-term outcomes have been compared to the open techniques in smaller single-center series. At least 1 randomized trial comparing laparoscopic to robotic sacrocolpopexy showed similar complications and perioperative outcomes, though the robotic technique was more costly [35].
Stress Urinary Incontinence Procedures
When SUI is identified preoperatively, treatment should be considered at the time of prolapse repair [32,36]. The gold standard for treatment of SUI with urethral hypermobility has been placement of a synthetic mid-urethral sling. There are several types of slings available, mainly categorized as retropubic, transobturator, or single-incision “mini-slings.” In a multicenter study by the Urinary Incontinence Treatment Network (UITN), patient satisfaction after retropubic and transobturator sling placement was studied 12 months after surgery. Both groups had a high satisfaction rate (from 85% to 90%) for urine leakage, urgency, and frequency [37]. There was no significant difference in outcomes between the 2 approaches. Several other studies and systematic reviews have also shown excellent long-term results with sling treatment. In the recently published 5-year follow-up of the Trial of Mid-Urethral Slings (TOMUS), researchers demonstrated an 80% to 85% patient satisfaction rate with a 10% adverse event rate. Of these adverse events, only 6 were classified as serious requiring surgical, radiologic, or endoscopic intervention [38].
If the patient has SUI but no urethral hypermobility, consider intrinsic sphincter deficiency as the etiology of her incontinence. In that case, injectable therapy with urethral bulking agents is an effective treatment. Some commonly used injectables include carbon beads (Durasphere), calcium hydroxylapatite (Coaptite), bovine collagen (Contigen), and silicon particles (Macroplastique). In a Cochrane review of injectable therapy, they compared urethral injection to conservative treatment with physical therapy and noted an improvement with injection at 3 months. Surgical treatment was overall more effective; however, 50% of the women that received a collagen injection were satisfied at 12 months after the procedure. They also note lower morbidity for this procedure compared to surgery [39].
Treatment in This Patient
The patient underwent successful robotic sacrocolpopexy with mesh and a transobturator sling. There were no complications during the procedure and she reports no bulge or SUI symptoms. She has not been straining to void and has been emptying her bladder well since the Foley catheter was removed the day after surgery. However, she continues to complain of bothersome urgency, frequency, and urge incontinence. She is wearing 1 to 3 pads daily for leakage. At her 6-week postoperative visit, the exam showed excellent vaginal support, no SUI, low PVR, and her urine culture was negative.
What are the clinical implications of these findings?
At this point it is reasonable to continue treatment of OAB. The patient may continue to see improvement as she gets further out from surgery but especially in a patient that had preoperative OAB symptoms, treatment is indicated and may consist of reminding her of behavioral modifications, returning to pelvic floor physical therapy, or starting her on a medication.
What medications are used to treat OAB?
Anticholinergic Drugs
Anticholinergics are second-line therapy for OAB; these medications prevent the binding of acetylcholine to the M3 muscarinic receptor in the detrusor muscle and inhibit uncontrolled bladder contraction. There are numerous medications and delivery methods (pills, patches, gels) but efficacy is similar among the different drugs and all are limited by side effects such as dry mouth, constipation, and central nervous system side effects. Mirabegron, approved by the FDA in June 2012 and released in October 2012, is an agonist of the β3-adrenoceptor receptor in the detrusor muscle promoting bladder storage. A phase III trial found that mirabegron significantly decreased incontinence episodes and micturition frequency compared to placebo [40]. Dry mouth, common with anticholinergics, was 3 times less likely compared to tolterodine [41]. The most common side effects (headache, urinary tract infection, hypertension, and nasopharyngitis) were similar between treatment and placebo groups.
Long-term compliance, side effects, and decreased efficacy limit the benefits of medication therapy [42]. In one survey, 25% of patients taking OAB medications discontinued them within 12 months with 89% reporting unmet treatment expectations and/or tolerability [43].
6 Months Later
The patient continues to complain of persistent OAB symptoms despite anticholinergic and beta-3 agonist therapy. She reported significant constipation and dry mouth with an anticholinergic and symptoms did not improve with mirebegron. Despite having OAB symptoms prior to her prolapse repair, it is important to evaluate for any other cause of her persistent symptoms. Her surgical repair remains intact and urodynamics and cystoscopy were performed showing no evidence of bladder outlet obstruction and no mesh or suture material in the bladder. There was no leakage with valsalva, though she had some early sensation of fullness (sensory urge). With a negative evaluation, refractory OAB is diagnosed and the patient is a candidate for third-line OAB treatment.
What are third-line OAB treatments?
OnabotulinumtoxinA
OnabotulinumtoxinA (Botox) was approved in 2013 for patients intolerant or unresponsive to behavioral therapy and oral medications. OnabotulinumtoxinA is a chemical neuromodulator that cleaves the SNARE protein SNAP-25, inhibits the fusion of the cytoplasmic vesical to the nerve terminal, and prevents the release of acetylcholine. This causes detrusor muscle relaxation and may also inhibit sensory afferent pathways [44].
Nitti et al compared Botox 100 U to placebo in 557 patients that were refractory to anticholinergics [45]. Botox decreased the frequency of daily urinary incontinence episodes vs placebo (–2.65 vs –0.87, P < 0.001) and 22.9% vs 6.5% of patients became completely continent. A 5.4% rate of urinary retention occurred and UTI was the most common side effect (16%) in those receiving active drug. A dose of 100 U is recommended to limit side effects while maintaining efficacy [46].
Comparision of a daily anticholinergic (solifenacin) versus Botox 100 U for 6 months was done in a randomized double-blind, double-placebo-controlled trial [47]. Patients underwent saline injection or took an oral placebo in the anticholinergic and Botox groups, respectively. Complete resolution of urinary symptoms occurred in 13% of the medication group and 27% of the Botox group (P = 0.003). Dry mouth was more common in the medication group (46% vs. 31%) and the Botox group had a higher rate of catheter use and urinary tract infections (5% vs. 0%; 33% vs. 13%). Quality of life measures have also been shown to improve significantly following Botox injection [45,48].
When considering whether Botox is appropriate for a particular patient, physicians must determine whether the patient is willing and able to perform clean intermittent catheterization. Contraindications include active UTI, urinary retention, unwilling or unable to do clean intermittent catheterization, and known hypersenstivitiy to botulinum toxin type A. Although the definition of urinary retention and the PVR at which clean intermittent catheterization should be initiated varies, one study found a 94% rate of urinary retention with a preoperative PVR > 100 mL [49].
Botox can be administered in the clinic with or without local anesthetic but general anesthetic may be used in patients who might be poorly tolerant of the procedure. Using flexible or rigid cystoscopy, the bladder is filled to 100 to 200 mL. An injection needle is used to inject 0.5 cc aliquots of reconstituted onabotulinumtoxinA in 20 areas spaced 1 cm apart. Periprocedure antibiotics are recommended by the manufacturer but actual usage varies [50]. Patients should understand that the effects of Botox may take up to 4 weeks and an appointment should be scheduled within 2 weeks to evaluate PVR and any other adverse reactions. Repeat injections are needed between 3 to 9 months as symptoms return; however, efficacy is maintained with subsequent treatments [51].
Neuromodulation
Additional third-line treatment options include sacral or posterior tibial nerve neuromodulation. Sacral neuromodulation has been FDA approved for treatment of urgency, frequency and urgency incontinence since 1997. Also known as InterStim (Medtronic, Minneapolis, MN), this involves placement of a tined electrode adjacent to the S3 nerve root and is thought to result in modulation of the afferent nerve signals from the bladder to the spinal cord and the pontine micturition center.
Since the FDA approved sacral neuromodulation, long-term results for this therapy have been positive. A multicenter study with a 5-year follow-up showed a statistically significant reduction in daily leakage episodes, number of daily voids, and increase in voided volume, with a 5-year success rate of 68% for urgency incontinence and 56% for urgency/frequency [52]. Al-Zahrani et al followed 96 patients (35% with urgency incontinence) for a mean of 50.7 months and approximately 85% of the incontinent patients remained improved [53]. Conversely, Groen et al observed a gradual decrease in success rate from 1 month to 5 years in 60 women with urge incontinence, with only 15% completely continent at 5 years [54].
Sacral neuromodulation is typically performed in 2 stages. The first stage is electrode placement and trial period. A percutaneous nerve evaluation is a temporary electrode placement in the office or a permanent lead placement can be performed in the operating room. Correct placement stimulating the S3 nerve root is confirmed by motor and/or sensory testing. If there is an appropriate response, the electrode lead is connected to a temporary external pulse generator and is worn by the patient for a 2–14 day test period. If more than a 50% improvement in symptoms occur, a permanent lead and battery is placed in the operating room. If there is inadequate symptom response, the lead is removed. There are several recognized limitations of the office percutaneous nerve evaluation compared to operating room lead placement, including false-negative responses, possibly due to lead migration [55], incorrect lead placement, or an inadequate test period [56]. However, it is relatively noninvasive and potentially avoids 2 operating room procedures. Regardless of the choice of the initial test period, sacral neuromodulation offers a minimally invasive, long-term treatment option for refractory OAB.
Percutaneous tibial nerve stimulation (PTNS) is an office procedure that stimulates the posterior tibial nerve. This nerve contains L4–S3 fibers that originate from the same spinal segments that innervate the bladder and pelvic floor. In comparision to sacral neuromodulation, percutaneous tibial nerve stimulation is less invasive, less expensive and there is no permanent implant required [57].
Percutaneous tibial nerve stimulation is performed by a physician, nurse, or other advanced practice provider. Patients sit with knees abducted and the leg externally rotated. A 34-gauge needle is inserted 3 cm into the skin 3 fingerbreadths above the medial malleolus. The Urgent PC Neuromodulation System (Uroplasty, Minnetonka, MN) is attached and the amplitude of the stimulation is increased until the large toe curls or the toes fan. Each session lasts 30 minutes and 12 weekly treatments provides the best improvement in patient symptoms [58, 59]. There is a strong carry-over effect and patients generally need re-treatments every 4-6 weeks for 30 minutes.
Percutaneous tibial nerve stimulation has been compared favorably to both anticholinergic and sham treatments. The Overactive Bladder Innovative Therapy Trial (OrBIT) randomized 100 patients to PTNS or tolterodine for 12 weeks. The global response assessment demonstrated a statistically significant subjective improvement or cure over baseline in OAB symptoms in 79.5% of the PTNS group vs. 54.8% of the tolterodine group (P = 0.01)[60]. The SUmiT trial compared the efficacy of PTNS to sham for 12 weeks of therapy [59]. In this multicenter study, subjects were assessed at 13 weeks using the global response assessment for overall bladder symptoms. 55% of PTNS subjects achieved moderately or marked improvement in bladder symptoms compared to 20.9% of sham subjects (P < 0.001). Voiding diary parameters also improved compared to sham. In an earlier sham controlled trial, 12 patients (71%) in the treatment arm compared to none of the 15 placebo patients, demonstrated more than 50% improvement in diary and quality of life scores [61].
To evaluate long-term efficacy and safety, 36-month results of 29 positive responders of the initial SUmiT trial was reported [59]. In addition, a maintenance regimen was developed so patients received PTNS at tapering intervals over a 3-month period followed by a personalized treatment plan to sustain subjective improvement in their symptoms. With an average of 1 treatment a month, symptom severity scores and health related quality of life scores were statistically significant for improvement at each tested time-point. Yoong et al followed patients for 2 years following initial treatment with PTNS and confirmed a durable improvement in nocturia, frequency, urgency incontinence and symptom scores with a longer median length between treatments of 64 days [62].
PTNS is office-based, has few side effects, and avoids an implantable device. In addition, continuous stimulation is not necessary and a decreased treatment frequency is needed over time. Limitations include the time commitment that is required for both the initial treatment phase and the maintenance phase. Logistical concerns of weekly and monthly office visits or arranging for transportation can limit treatment.
Additional Treatment
The patient received injection of 100 U of Botox in the office. At her 2-week follow up appointment, her PVR was 90 mL and she was already seeing improvement in her incontinence episodes. At 6 weeks she was wearing 1 pad per day but using it mainly for protection. She still notices urgency, particularly if she drinks more than 1 cup of coffee in the morning, but overall she reports significant improvement in her symptoms. She has no complaints of a vaginal bulge and on exam has a grade 1 distal rectocele and no SUI with a full bladder. The physician discussed need for continued yearly examinations and repeat injections due to the duration of action of Botox.
Conclusion
This case demonstrates the complex step-wise management strategy of a patient with pelvic organ prolapse and voiding dysfunction. Interventions directed at patient bother and recognition of the various modalities and timing of treatment are essential to provide the greatest chance of positive treatment outcomes and patient satisfaction.
Corresponding author: Jaimie M Bartley, DO, 3601 W. 13 Mile Rd., Royal Oak, MI 48073.
Financial disclosures: None.
1. Nygaard I, Barber MD, Burgio KL, et al; Pelvic Floor Disorders Network. Prevalence of symptomatic pelvic floor disorders in US women. JAMA 2008;300:1311–6.
2. Hendrix SL, Clark A, Nygaard I, et al. Pelvic organ prolapse in the Women's Health Initiative: gravity and gravidity. Am J Obstet Gynecol 2002;186:1160–6.
3. Barber MD, Maher C. Epidemiology and outcome assessment of pelvic organ prolapse. Int Urogynecol J 2013;24:1783–90.
4. Zhang C, Hai T, Yu L, et al. Association between occupational stress and risk of overactive bladder and other lower urinary tract symptoms: a cross-sectional study of female nurses in China. Neurourol Urodyn 2013;32:254–60.
5. Swift SE, Tate SB, Nicholas J. Correlation of symptoms with degree of pelvic organ support in a general population of women: what is pelvic organ prolapse? Am J Obstet Gynecol 2003;189:372–7.
6. Baessler K, Maher C. Pelvic organ prolapse surgery and bladder function. Int Urogynecol J 2013;24:1843–52.
7. Bump RC, Mattiasson A, Bø K, et al. The standardization of terminology of female pelvic organ prolapse and pelvic floor dysfunction. Am J Obstet Gynecol 1996;175:10–7.
8. Lohsiriwat S, Hirunsai M, Chaiyaprasithi B. Effect of caffeine on bladder function in patients with overactive bladder symptoms. Urol Ann 2011;3:14–8.
9. Wells MJ, Jamieson K, Markham TC, et al. The effect of caffeinated versus decaffeinated drinks on overactive bladder: a double-blind, randomized, crossover study. J Wound Ostomy Continence Nurs 2014;41:371–8.
10. Fantl JA, Wyman JF, McClish DK, et al. Efficacy of bladder training in older women with urinary incontinence. JAMA 1991;265:609–13.
11. Burgio KL, Locher JL, Goode PS, et al. Behavioral vs drug treatment for urge urinary incontinence in older women: a randomized controlled trial. JAMA 1998;280:1995–2000.
12. Burgio KL. Update on behavioral and physical therapies for incontinence and overactive bladder: the role of pelvic floor muscle training. Curr Urol Rep 2013;14:457–64.
13. Burgio KL, Kraus SR, Menefee S, et al; Urinary Incontinence Treatment Network. Behavioral therapy to enable women with urge incontinence to discontinue drug treatment: a randomized trial. Ann Intern Med 2008;149:161–9.
14. Gormley EA, Lightner DJ, Faraday M, Vasavada SP. Diagnosis and Treatment of Overactive Bladder (Non-Neurogenic) in Adults: AUA/SUFU Guideline Amendment. J Urol 2015;193:1572–80.
15. Dumoulin C, Hay-Smith J, Habée-Séguin GM, Mercier J. Pelvic floor muscle training versus no treatment, or inactive control treatments, for urinary incontinence in women: A short version Cochrane systematic review with meta-analysis. Neurourol Urodyn 2015;34:300–8.
16. Labrie J, Berghmans BL, Fischer K, et al. Surgery versus physiotherapy for stress urinary incontinence. N Engl J Med 2013;369:1124–33.
17. Braekken IH, Majida M, Engh ME, Bø K. Can pelvic floor muscle training reverse pelvic organ prolapse and reduce prolapse symptoms? An assessor-blinded, randomized, controlled trial. Am J Obstet Gynecol 2010;203:170.e1–7.
18. Hagen S, Stark D, Glazener C, et al; POPPY Trial Collaborators. Individualised pelvic floor muscle training in women with pelvic organ prolapse (POPPY): a multicentre randomised controlled trial. Lancet 2014;383:796–806.
19. Alperin M, Khan A, Dubina E, et al. Patterns of pessary care and outcomes for medicare beneficiaries with pelvic organ prolapse. Female Pelvic Med Reconstr Surg 2013;19:142-7.
20. Lamers BH, Broekman BM, Milani AL. Pessary treatment for pelvic organ prolapse and health-related quality of life: a review. Int Urogynecol J 2011;22:637–44.
21. Richter HE, Burgio KL, Brubaker L, et al; Pelvic Floor Disorders Network. Continence pessary compared with behavioral therapy or combined therapy for stress incontinence: a randomized controlled trial. Obstet Gynecol 2010;115:609–17.
22. Wood LN, Anger JT. Urinary incontinence in women. BMJ 2014;349:g4531.
23. FDA Safety Communication. Update on serious complications associated with transvaginal placement of surgical mesh for pelvic organ prolapse. Available at http://www.fda.gov/MedicalDevices/Safety/AlertsandNotices/ucm262435.htm.
24. Barber MD, Brubaker L, Burgio KL, Meikle SF; Eunice Kennedy Shriver National Institute of Child Health and Human Development Pelvic Floor Disorders Network. Comparison of 2 transvaginal surgical approaches and perioperative behavioral therapy for apical vaginal prolapse: the OPTIMAL randomized trial. JAMA 2014;311:1023–34.
25. Weber AM, Walters MD, Piedmonte MR, Ballard LA. Anterior colporrhaphy: a randomized trial of three surgical techniques. Am J Obstet Gynecol 2001;185:1299–304.
26. Chmielewski L, Walters MD, Weber AM, Barber MD. Reanalysis of a randomized trial of 3 techniques of anterior colporrhaphy using clinically relevan tdefinitions of success. Am J Obstet Gynecol 2011;205:69.e1–8.
27. Altman D, Väyrynen T, Engh ME, et al; Nordic Transvaginal Mesh Group. Anterior colporrhaphy versus transvaginal mesh for pelvic-organ prolapse. N Engl J Med 2011;364:1826–36. Erratum in: N Engl J Med 2013;368:394.
28. Delancey JO. Fascial and muscular abnormalities in women with urethral hypermobility and anterior vaginal wall prolapse. Am J Obstet Gynecol 2002;187:93–8.
29. Clemons JL, Myers DL, Aguilar VC, Arya LA. Vaginal paravaginal repair with an AlloDerm graft. Am J Obstet Gynecol 2003;189:1612–8.
30. Gomelsky A, Rudy DC, Dmochowski RR. Porcine dermis interposition graft for repair of high grade anterior compartment defects with or without concomitant pelvic organ prolapse procedures. J Urol 2004;171:1581–4.
31. Handel LN, Frenkl TL, Kim YH. Results of cystocele repair: a comparison of traditional anterior colporrhaphy, polypropylene mesh and porcine dermis. J Urol 2007;178:153–6.
32. Nygaard I, Brubaker L, Zyczynski HM, et al. Long-term outcomes following abdominal sacrocolpopexy for pelvic organ prolapse. JAMA 2013;309:2016–24.
33. Sirls LT, McLennan GP, Killinger KA, et al. Exploring predictors of mesh exposure after vaginal prolapse repair. Female Pelvic Med Reconstr Surg 2013;19:206–9.
34. Hsiao KC, Latchamsetty K, Govier FE, et al. Comparison of laparoscopic and abdominal sacrocolpopexy for the treatment of vaginal vault prolapse. J Endourol 2007;21:926–30.
35. Anger JT, Mueller ER, Tarnay C, et al. Robotic compared with laparoscopic sacrocolpopexy: a randomized controlled trial. Obstet Gynecol 2014;123:5–12.
36. Wei JT, Nygaard I, Richter HE, et al; Pelvic Floor Disorders Network. A midurethral sling to reduce incontinence after vaginal prolapse repair. N Engl J Med 2012;366:2358–67.
37. Wai CY, Curto TM, Zyczynski HM, et al; Urinary Incontinence Treatment Network. Patient satisfaction after midurethral sling surgery for stress urinary incontinence. Obstet Gynecol 2013;121:1009–16.
38. Kenton K, Stoddard AM, Zyczynski H, et al. 5-year longitudinal followup after retropubic and transobturator mid urethral slings. J Urol 2015;193:203–10.
39. Kirchin V, Page T, Keegan PE, Atiemo K, Cody JD, McClinton S. Urethral injection therapy for urinary incontinence in women. Cochrane Database Syst Rev 2012;2:CD003881.
40. Chapple CR, Kaplan SA, Mitcheson D, et al. Randomized double-blind, active-controlled phase 3 study to assess 12-month safety and efficacy of mirabegron, a β(3)-adrenoceptor agonist, in overactive bladder. Eur Urol 2013;63:296–305.
41. Nitti VW, Auerbach S, Martin N, et al. Results of a randomized phase III trial of mirabegron in patients with overactive bladder. J Urol 2013;189:1388–95.
42. Dmochowski RR, Newman DK. Impact of overactive bladder on women in the United States: results of a national survey. Curr Med Res Opin 2007;23:65–76.
43. Benner JS, Nichol MB, Rovner ES, et al. Patient-reported reasons for discontinuing overactive bladder medication. BJU Int 2010;105:1276–82.
44. Apostolidis A, Dasgupta P, Fowler CJ. Proposed mechanism for the efficacy of injected botulinum toxin in the treatment of human detrusor overactivity. Eur Urol 2006;49:644–50.
45. Nitti VW, Dmochowski R, Herschorn S, et al; EMBARK Study Group. OnabotulinumtoxinA for the treatment of patients with overactive bladder and urinary incontinence: results of a phase 3, randomized, placebo controlled trial. J Urol 2013;189:2186–93.
46. Dmochowski R, Chapple C, Nitti VW, et al. Efficacy and safety of onabotulinumtoxinA for idiopathic overactive bladder: a double-blind, placebo controlled, randomized, dose ranging trial. J Urol 2010;184:2416–22.
47. Visco AG, Brubaker L, Richter HE, et al; Pelvic Floor Disorders Network. Anticholinergic versus botulinum toxin A comparison trial for the treatment of bothersome urge urinary incontinence: ABC trial. Contemp Clin Trials 2012;33:184–96.
48. Chapple C, Sievert KD, MacDiarmid S, et al. OnabotulinumtoxinA 100 U significantly improves all idiopathic overactive bladder symptoms and quality of life in patients with overactive bladder and urinary incontinence: a randomised, double-blind, placebo-controlled trial. Eur Urol 2013;64:249–56.
49. Osborn DJ, Kaufman MR, Mock S, et al. Urinary retention rates after intravesical onabotulinumtoxinA injection for idiopathic overactive bladder in clinical practice and predictors of this outcome. Neurourol Urodyn 2014 Jun 29.
50. Rovner E. Chapter 6: Practical aspects of administration of onabotulinumtoxinA. Neurourol Urodyn 2014;33 Suppl 3:S32–7.
51. Duthie JB, Vincent M, Herbison GP, et al. Botulinum toxin injections for adults with overactive bladder syndrome. Cochrane Database Syst Rev 2011;(12):CD005493.
52. van Kerrebroeck PE, van Voskuilen AC, Heesakkers JP, et al. Results of sacral neuromodulation therapy for urinary voiding dysfunction: outcomes of a prospective, worldwide clinical study. J Urol 2007;178:2029–34.
53. Al-zahrani AA, Elzayat EA, Gajewski JB. Long-term outcome and surgical interventions after sacral neuromodulation implant for lower urinary tract symptoms: 14-year experience at 1 center. J Urol 2011;185:981–6.
54. Groen J, Blok BF, Bosch JL. Sacral neuromodulation as treatment for refractory idiopathic urge urinary incontinence: 5-year results of a longitudinal study in 60 women. J Urol 2011;186:954–9.
55. Carey M, Fynes M, Murray C, Maher C. Sacral nerve root stimulation for lower urinary tract dysfunction: overcoming the problem of lead migration. BJU Int 2001;87:15–8.
56. Everaert K, Kerckhaert W, Caluwaerts H, et al. A prospective randomized trial comparing the 1-stage with the 2-stage implantation of a pulse generator in patients with pelvic floor dysfunction selected for sacral nerve stimulation. Eur Urol 2004;45:649–54.
57. Staskin DR, Peters KM, MacDiarmid S, et al. Percutaneous tibial nerve stimulation: a clinically and cost effective addition to the overactive bladder algorithm of care. Curr Urol Rep 2012;13:327–34.
58. Peters KM, Carrico DJ, Wooldridge LS, et al. Percutaneous tibial nerve stimulation for the long-term treatment of overactive bladder: 3-year results of the STEP study. J Urol 2013;189:2194–201.
59. Peters KM, Carrico DJ, Perez-Marrero RA, et al. Randomized trial of percutaneous tibial nerve stimulation versus Sham efficacy in the treatment of overactive bladder syndrome: results from the SUmiT trial. J Urol 2010;183:1438–43.
60. Peters KM, Macdiarmid SA, Wooldridge LS, et al. Randomized trial of percutaneous tibial nerve stimulation versus extended-release tolterodine: results from the overactive bladder innovative therapy trial. J Urol 2009;182:1055–61.
61. Finazzi-Agrò E, Petta F, Sciobica F, et al. Percutaneous tibial nerve stimulation effects on detrusor overactivity incontinence are not due to a placebo effect: a randomized, double-blind, placebo controlled trial. J Urol 2010;184:2001–6.
62. Yoong W, Shah P, Dadswell R, Green L. Sustained effectiveness of percutaneous tibial nerve stimulation for overactive bladder syndrome: 2-year follow-up of positive responders. Int Urogynecol J 2013;24:795–9.