User login
Managing dyspepsia
› Review the medications taken by patients who suffer from dyspepsia, as many drugs—bisphosphonates, antibiotics, steroids, and nonsteroidal anti-inflammatory drugs, among others—are associated with this condition. B
› Order an esophagogastroduodenoscopy for patients ages 55 years or older with new-onset dyspepsia and those who have red flags for more serious conditions, eg, a history of upper gastrointestinal (GI) cancer, unintended weight loss, GI bleeding, dysphagia, or a palpable mass. C
› Prescribe acid suppression therapy as first-line treatment for patients who have dyspepsia but are at low risk or have tested negative for Helicobacter pylori infection. A
Strength of recommendation (SOR)
A Good-quality patient-oriented evidence
B Inconsistent or limited-quality patient-oriented evidence
C Consensus, usual practice, opinion, disease-oriented evidence, case series
Each year, an estimated 25% to 30% of the US population suffers from dyspepsia.1 Most self-treat with home remedies and over-the-counter products, but others seek medical care. Dyspepsia accounts for an estimated 2% to 5% of primary care visits annually,2 mostly by patients who are found to have no organic, or structural, cause for their symptoms.1,3
Such patients are said to have functional dyspepsia (FD), a category that applies to about two-thirds of those with dyspepsia.1 A small number of cases are categorized as organic dyspepsia, indicating the presence of a clear structural or anatomic cause, such as an ulcer or mass. The remainder are said to have undifferentiated dyspepsia, which simply means that their signs and symptoms do not rise to the level for which further investigation is warranted and thus it is not known whether it is functional or organic.
There are many possible causes of FD, ranging from medications3,4 to abnormal gastroduodenal motility5,6 to Helicobacter pylori infection,7 and a comprehensive differential diagnosis. The first step in an investigation is to rule out red flags suggestive of gastrointestinal (GI) cancer or other serious disorders.
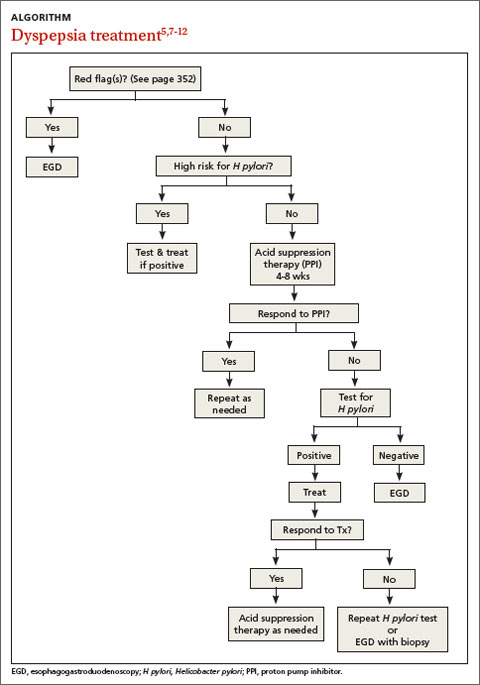
Patients with FD, like the vast majority of those you’ll treat in a primary care setting, suffer significant morbidity. Most have chronic symptoms, with intermittent flare-ups interspersed with periods of remission.8 In the text and dyspepsia treatment ALGORITHM5,7-12 that follow, you’ll find an evidence-based patient management approach.
Symptoms and causes: What to look for
The primary symptoms of dyspepsia include bothersome postprandial fullness, early satiety, and epigastric pain and burning. To meet the Rome criteria for dyspepsia, these symptoms must have been present for the last 3 months and have had an onset ≥6 months prior to diagnosis.2 Recurrent belching and nausea are also common, but are not included in the Rome diagnostic criteria.
Symptom severity is a poor predictor of the seriousness of the condition, however, and more intense symptoms are no more likely than milder cases to have an organic cause.13,14 Indeed, anxiety is a common comorbidity in patients with FD and a risk factor for the diagnosis. Compared with the general public, patients with FD have been found to have higher levels of anxiety, chronic tension, hostility, and hypochondriasis, and a tendency to be more pessimistic.15
Possible causes of FD
While the etiology of organic dyspepsia is clear, the cause of FD is often far more difficult to determine.
Medication use should always be considered, as many types of drugs—including bisphosphonates, antibiotics, narcotics, steroids, iron, metformin, and nonsteroidal anti-inflammatory drugs (NSAIDs)—are associated with dyspepsia.3,4
Gastroduodenal motility and accommodation, which has been found in numerous studies of patients with FD, is a proposed etiology.5,6
Visceral hypersensitivity also appears to play a role. In one study of patients with severe dyspepsia, 87% of those with FD had a reduced or altered GI pain threshold, compared with 20% of those with organic dyspepsia.16
H pylori, commonly linked to peptic ulcer disease (PUD), is also associated with both organic dyspepsia and FD.17,18 The gram-negative rod-shaped bacterium is present in approximately half of the population worldwide, but is more common in developing nations.7H pylori immunoglobulin G (IgG) is more prevalent in patients with dyspepsia, particularly in those younger than 30 years of age. The exact mechanism by which H pylori causes non-ulcerative dyspepsia is not clear, but inflammation, dysmotility, visceral hypersensitivity, and alteration of acid secretion have all been proposed.17
Dysfunctional intestinal epithelium is increasingly being considered in the pathophysiology of dyspepsia, among other conditions. Researchers theorize that certain foods, toxins, infections, and/or other stressors lead to changes in the structure and function of tight junctions, resulting in increased intestinal permeability.19 This in turn is thought to allow the outflow of antigens through the leaky epithelium and to stimulate an immune response—a process that may play a role in the increased GI inflammation or hypersensitivity associated with dyspepsia. The “leaky gut” theory may eventually lead to new ways to treat dyspepsia, but thus far, highquality evidence of the efficacy of treatments aimed at this mechanism is lacking.
A range of disorders included in the differential
The primary differential diagnosis for dyspepsia includes gastroesophageal reflux disease (GERD), esophagitis, chronic PUD (including both gastric and duodenal ulcers), and malignancy. The differential may also include biliary disorder, pancreatitis, hepatitis, or other liver disease; chronic abdominal wall pain, irritable bowel syndrome, motility disorders, or infiltrative diseases of the stomach (eosinophilic gastritis, Crohn’s disease, sarcoidosis); celiac disease and food sensitivities/allergies, including gluten, lactose, and other intolerances; cardiac disease, including acute coronary syndrome, myocardial infarction, and arrhythmias; intestinal angina; small intestine bacterial overgrowth; heavy metal toxicity; and hypercalcemia.8
Ulcers are found in approximately 10% of patients undergoing evaluation for dyspepsia.8 Previously, PUD was almost exclusively due to H pylori infection. In developed countries, however, chronic use of NSAIDs, including aspirin, has increased, and is now responsible for most ulcer diseases.20,21 The combination of H pylori infection and NSAID usage appears to be synergistic, with the risk of uncomplicated PUD estimated to be 17.5 times higher among those who test positive for H pylori and take NSAIDs vs a 3- to 4-fold increase in ulcer incidence among those with either of these risk factors alone.22
The work-up starts with a search for red flags
Symptom severity is a poor predictor of the seriousness of dyspepsia; more intense symptoms are no more likely than milder cases to have an organic cause.
Evaluation of a patient with dyspepsia begins with a thorough history. Start by determining whether the patient has any red flags, or alarm features, that may be associated with a more serious condition—particularly an underlying malignancy. One or more of the following is an indication for an esophagogastroduodenoscopy (EGD):5,8,12
• family and/or personal history of upper GI cancer
• unintended weight loss
• GI bleeding
• progressive dysphagia
• unexplained iron-deficiency anemia
• persistent vomiting
• palpable mass or lymphadenopathy
• jaundice.
While it is important to rule out these red flags, they are poor predictors of malignancy.23,24 With the exception of a single study, their positive predictive value was a mere 1%.8 Their usefulness lies in their ability to exclude malignancy, however; when none of these features is present, the negative predictive value for malignancy is >97%.8
Age is also a risk factor. In addition to red flags, EGD is recommended by the American Gastroenterological Association (AGA) for patients with new-onset dyspepsia who are 55 years or older—an age at which upper GI malignancy becomes more common. A repeat EGD is rarely indicated, unless Barrett’s esophagus or severe erosive esophagitis is found on the initial EGD.25
Physical exam, H pylori evaluation follow
A physical examination of all patients presenting with symptoms suggestive of dyspepsia is crucial. While the exam is usually normal, it may reveal epigastric tenderness on abdominal palpation. Rebound tenderness, guarding, or evidence of other abnormalities should raise the prospect of alternative diagnoses. GERD, for example, has many symptoms in common with dyspepsia, but is a more likely diagnosis in a patient who has retrosternal burning discomfort and regurgitation and reports that symptoms worsen at night and when lying down.
Lab work has limited value. Although laboratory work is not specifically addressed in the AGA guidelines (except for H pylori testing), a complete blood count is a reasonable part of an initial evaluation of dyspepsia to check for anemia. Other routine blood work is not needed, but further lab testing may be warranted based on the history, exam, and differential diagnosis.
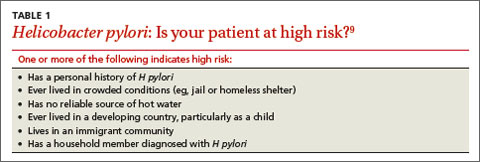
H pylori risk. Because of the association between dyspepsia and H pylori, evaluating the patient’s risk for infection with this bacterium, based primarily on his or her current and previous living conditions (TABLE 1),9 is the next step. Although a test for H pylori could be included in the initial work-up of all patients with dyspepsia, a better—and more cost-effective—strategy is to initially test only those at high risk. (More on testing and treating H pylori in a bit.)
Initiate acid suppression therapy for low-risk patients
First-line treatment for patients with dyspepsia who have no red flags for malignancy or other serious conditions and either are not at high risk for H pylori or are at high risk but have been tested for it and had negative results is a 4- to 8-week course of acid suppression therapy. Patients at low risk for H pylori should be tested for the bacterium only if therapy fails to alleviate their symptoms.9
H2RAs or PPIs? A look at the evidence
In a Cochrane review, both H2 receptor antagonists (H2RAs) and proton pump inhibitors (PPIs) were significantly more effective than placebo for treating FD.26 However, H2RAs can lead to tachyphylaxis—an acute decrease in response to a drug—within 2 to 6 weeks, thus limiting their long-term efficacy.27
PPIs appear to be more effective than H2RAs, and are the AGA’s acid suppression drug of choice.11 The CADET study, a randomized controlled trial comparing PPIs (omeprazole 20 mg/d) with an H2RA (ranitidine 150 mg BID) and a prokinetic agent (cisapride 20 mg BID) as well as placebo for dyspepsia, found the PPI to be superior to the H2RA at 6 months.28 In a systematic review, the number needed to treat with PPI therapy for improvement of dyspepsia symptoms was 9.29
There is no specified time limit for the use of PPIs. AGA guidelines recommend that patients who respond to initial therapy stop treatment after 4 to 8 weeks.11 If symptoms recur, another course of the same treatment is justified; if necessary, therapy can continue long term. However, patients should be made aware of the risk for vitamin deficiency, osteoporosis, and fracture, as well as arrhythmias, Clostridium difficile infection, and rebound upon abrupt discontinuation of PPIs.
When to test for H pylori ...
Empiric treatment for H pylori is not recommended. Thus, testing is indicated for patients who have risk factors for the bacterium or who fail to respond to acid suppression therapy. There are various ways to test for the presence of H pylori. Which test you choose depends, in part, on patient-specific factors.
Serology. IgG serology testing is extremely useful in patients who have never been diagnosed with H pylori. It is best suited for those who are currently taking proton pump inhibitors (PPIs) or who recently completed a course of antibiotics, since neither medication affects the results of the serology test.
Serology testing should not be used, however, for any patient who was previously diagnosed with or treated for H pylori, because this type of test cannot distinguish between an active or past infection. The IgG serology test has a sensitivity of 87% and a specificity of 67%.30
Stool antigen. Stool tests using monoclonal antibodies to detect the presence of H pylori have a sensitivity of 87% to 92% and a specificity of 70%. Stool antigen is also an excellent post-treatment test to confirm that H pylori has been eradicated.31
Stool testing has some drawbacks, however. PPIs can decrease the sensitivity and should be discontinued at least 2 weeks prior to stool testing.32 In addition, a stool test for H pylori is not accurate if the patient has an acute GI bleed.
Urea breath testing. This is the most sensitive and specific test for active H pylori infection (90%-96% sensitivity and 88%-96% specificity).33 PPIs can lower the sensitivity of the test, however, and are typically discontinued at least 2 weeks prior to testing. Urea breath testing, like stool testing, is an excellent way to confirm that H pylori has been eradicated after treatment. However, it is more expensive than other tests for H pylori and often inconvenient to obtain.13
An EGD is indicated for a patient who has failed to respond to acid suppression therapy and has a negative serology, stool antigen, or urea breath test for H pylori.
Biopsy-based testing for H pylori is performed with EGD and is therefore reserved for patients who have red flags or other indications of a need for invasive testing. There are 3 types of biopsy-based tests: urease (sensitivity, 70%-90%; specificity, 95%); histology (87%-92% and 70%, respectively); and culture (85%-88% and 69%, respectively). Overall, the specificity is slightly better than that of noninvasive testing, but the sensitivity can be lowered by recent use of PPIs, bismuth, or antibiotics.12,34
... and how to treat it
H pylori infection is associated with an increased risk of noncardiac gastric adenocarcinoma, but a decreased risk of cardiac gastric adenocarcinoma and esophageal adenocarcinoma.35,36 Thus, the potential to reduce the risk of gastric cancer is not considered an indication for H pylori treatment. The possibility of improving dyspepsia symptoms is a reason to treat H pylori infection, although eradicating it does not always do so.
In a 2006 Cochrane Review, treating H pylori had a small but statistically significant benefit for patients with FD (NNT=14).37 A 2011 study on the effects of H pylori eradication on symptoms and quality of life in primary care patients with FD revealed a 12.5% improvement in quality of life and a 10.6% improvement in symptoms.38
The triple therapy regimen (a PPI + amoxicillin + clarithromycin) is the most common first-line H pylori treatment in the United States, and a good initial choice in regions in which clarithromycin resistance is low (TABLE 2).39-44 The standard duration is 7 days. A 2013 Cochrane Review showed that a longer duration (14 days) increased the rate of eradication (82% vs 73%), but this remains controversial.39 The addition of bismuth subsalicylate to the triple therapy regimen has been shown to increase the eradication rate of H pylori by approximately 10%.45 Adding probiotics (saccharomyces or lactobacillus) appears to increase eradication rates, as well.40
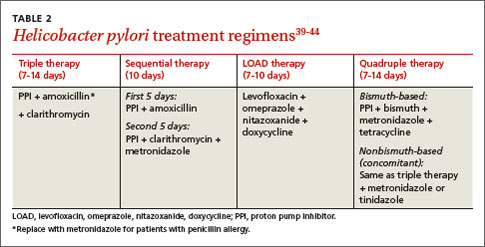
Sequential therapy consists of a 5-day course of treatment in which a PPI and amoxicillin are taken twice a day, followed by another 5-day course of a PPI, clarithromycin, and metronidazole. A recent meta-analysis of sequential therapy showed that it is superior to 7-day triple therapy but equivalent to 14-day triple therapy.40
LOAD (levofloxacin, omeprazole, nitazoxanide, and doxycycline) therapy for 7 to 10 days can be used in place of triple therapy in areas of high resistance or for persistent H pylori. In one study, the H pylori eradication rate for a 7-day course of LOAD therapy—levofloxacin and doxycycline taken once a day, omeprazole before breakfast, and nitazoxanide twice daily—was 90% vs 73.3% for a 7-day course of triple therapy.41
Quadruple therapy has 2 variations: bismuth-based and non-bismuth (concomitant) therapy. The latter uses the base triple therapy and adds either metronidazole or tinidazole for 7 to 14 days. In a multicenter randomized trial, this concomitant therapy was found to have similar efficacy to sequential therapy.42
Bismuth-based quad therapy includes a PPI, bismuth, metronidazole, and tetracycline. A meta-analysis found it to have a higher rate of eradication than triple therapy for patients with antibiotic resistance.43,44
For persistent H pylori, a PPI, levofloxacin, and amoxicillin for 10 days has been shown to be more effective and better tolerated than quadruple therapy.12
Confirmation is indicated when symptoms persist
If dyspepsia symptoms persist after H pylori treatment, it is reasonable to retest to confirm that the infection has in fact been eradicated. Confirmation is also indicated if the patient has an H pylori-associated ulcer or a prior history of gastric cancer.
Retesting should be performed at least 4 to 6 weeks after treatment is completed. If H pylori has not been eradicated, you can try another regimen. If retesting confirms eradication and symptoms persist, EGD with biopsy is indicated. Although EGD typically has a very low yield, even for patients with red flags, this invasive test often provides reassurance and increased satisfaction for patients with persistent symptoms.46

More options for challenging cases
Managing FD is challenging when both initial acid suppression therapy and H pylori eradication fail. Unproven but low-risk treatments include modification of eating habits (eg, eating slower, not gulping food), reducing stress, discontinuing medications that may be related to symptoms, avoiding foods that seem to exacerbate symptoms, and cutting down or eliminating tobacco, caffeine, alcohol, and carbonated beverages.8 Bismuth salts have been shown to be superior to placebo for the treatment of dyspepsia.25 Small studies have also demonstrated a favorable risk–benefit ratio for peppermint oil and caraway oil for the treatment of FD.47 Prokinetics have shown efficacy compared with placebo, although a Cochrane review questioned their efficacy based on publication bias.26
There is no good evidence of efficacy for over-the-counter antacids, such as TUMS, or for GI “cocktails” (antacid, antispasmotic, and lidocaine), sucralfate, psychological interventions (eg, cognitive behavioral therapy, relaxation therapy, or hypnosis), or antidepressants.48,49 Several recent randomized controlled trials have shown the efficacy of acupuncture for the treatment of dyspepsia.49,50 Ginger may also be helpful; it has been found to help with nausea in other GI conditions, but it’s uncertain whether it can help patients with dyspepsia.51
CORRESPONDENCE
Michael Malone, MD, 845 Fishburn Road, Hershey, PA 17053; [email protected]
1. Shaib Y, El-Serag HB. The prevalence and risk factors of functional dyspepsia in a multiethnic population in the United States. Am J Gastroenterol. 2004;99:2210-2216.
2. Talley NJ. Dyspepsia: management guidelines for the millennium. Gut. 2002;50(suppl 4):iv72–iv78.
3. Harmon RC, Peura DA. Evaluation and management of dyspepsia. Therap Adv Gastroenterol. 2010;3:87–98.
4. Bazaldua OV, Schneider FD. Evaluation and management of dyspepsia. Am Fam Physician. 1999;60:1773-1784.
5. Tack J, Talley NJ, Camilleri M, et al. Functional gastroduodenal disorders. Gastroenterology. 2006;130:1466-1479.
6. Haag S, Talley NJ, Holtmann G. Symptom patterns in functional dyspepsia and irritable bowel syndrome: relationship to disturbances in gastric emptying and response to a nutrient challenge in consulters and non-consulters. Gut. 2004;53:1445-1451.
7. Malfertheiner P, Megraud F, O’Morain CA, et al; European Helicobacter Study Group. Management of Helicobacter pylori infection—the Maastricht IV/Florence Consensus Report. Gut. 2012;61:646-664.
8. Talley NJ, Vakil NB, Moayyedi P. American Gastroenterological Association technical review on the evaluation of dyspepsia. Gastroenterology. 2005;129:1756-1780.
9. Moayyedi P, Axon AT. The usefulness of the likelihood ratio in the diagnosis of dyspepsia and gastroesophageal reflux disease. Am J Gastroenterol. 1999;94:3122-3125.
10. McColl KE. Clinical practice. Helicobacter pylori infection. N Engl J Med. 2010;362:1597-1604.
11. Kahrilas PJ, Shaheen NJ, Vaezi MF, et al; American Gastroenterological Association. American Gastroenterological Association Medical Position Statement on the management of gastroesophageal reflux disease. Gastroenterology. 2008;135:1383-1391.
12. Chey WD, Wong BC; Practice Parameters Committee of the American College of Gastroenterology. American College of Gastroenterology guideline on the management of Helicobacter pylori Infection. Am J Gastroenterol. 2007;102:1808-1825.
13. Moayyedi P, Talley NJ, Fennerty MB, et al. Can the clinical history distinguish between organic and functional dyspepsia? JAMA. 2006;295:1566-1576.
14. Eslick GD, Howell SC, Hammer J, et al. Empirically derived symptom sub-groups correspond poorly with diagnostic criteria for functional dyspepsia and irritable bowel syndrome. A factor and cluster analysis of a patient sample. Aliment Pharmacol Ther. 2004;19:133-140.
15. Aro P, Talley NJ, Ronkainen J, et al. Anxiety is associated with uninvestigated and functional dyspepsia (Rome III criteria) in a Swedish population-based study. Gastroenterology. 2009;137:94-100.
16. Mertz H, Fullerton S, Naliboff B, et al. Symptoms and visceral perception in severe functional and organic dyspepsia. Gut. 1998;42:814-822.
17. O’Morain C. Role of Helicobacter pylori in functional dyspepsia. World J Gastroenterol. 2006;12:2677-2680.
18. Shmuely H, Obure S, Passaro DJ, et al. Dyspepsia symptoms and Helicobacter pylori infection, Nakuru, Kenya. Emerg Infect Dis. 2003;9:1103-1107.
19. Barbara G, Zecchi L, Barbaro R, et al. Mucosal permeability and immune activation as potential therapeutic targets of probiotics in irritable bowel syndrome. J Clin Gastroenterol. 2012;46(suppl):S52-S55.
20. Liu NJ, Lee CS, Tang JH, et al. Outcomes of bleeding peptic ulcers: a prospective study. J Gastroenterol Hepatol. 2008;23:e340-e347.
21. Ramsoekh D, van Leerdam ME, Rauws EA, et al. Outcome of peptic ulcer bleeding, nonsteroidal anti-inflammatory drug use, and Helicobacter pylori infection. Clin Gastroenterol Hepatol. 2005;3:859-864.
22. Papatheodoridis GV, Sougioultzis S, Archimandritis AJ. Effects of Helicobacter pylori and nonsteroidal anti-inflammatory drugs on peptic ulcer disease: a systematic review. Clin Gastroenterol Hepatol. 2006;4:130-142.
23. Bai Y, Li ZS, Zou DW, et al. Alarm features and age for predicting upper gastrointestinal malignancy in Chinese patients with dyspepsia with high background prevalence of Helicobacter pylori infection and upper gastrointestinal malignancy: an endoscopic database review of 102,665 patients from 1996 to 2006. Gut. 2010;59:722-728.
24. Vakil N. Dyspepsia, peptic ulcer, and H. pylori: a remembrance of things past. Am J Gastroenterol. 2010;105:572-574.
25. Shaheen NJ, Weinberg DS, Denberg TD, et al; Clinical Guidelines Committee of the American College of Physicians. Upper endoscopy for gastroesophageal reflux disease: best practice advice from the clinical guidelines committee of the American College of Physicians. Ann Intern Med. 2012;157:808-816.
26. Moayyedi P, Soo S, Deeks J, et al. Pharmacological interventions for non-ulcer dyspepsia. Cochrane Database Syst Rev. 2006;(4):CD001960.
27. Chiu CT, Hsu CM, Wang CC, et al. Randomised clinical trial: sodium alginate oral suspension is non-inferior to omeprazole in the treatment of patients with non-erosive gastroesophageal disease. Aliment Pharmacol Ther. 2013;38:1054-1064.
28. Veldhuyzen van Zanten SJ, Chiba N, Armstrong D, et al. A randomized trial comparing omeprazole, ranitidine, cisapride, or placebo in helicobacter pylori negative, primary care patients with dyspepsia: the CADET-HN Study. Am J Gastroenterol. 2005;100:1477-1488.
29. Moayyedi P, Delaney BC, Vakil N, et al. The efficacy of proton pump inhibitors in nonulcer dyspepsia: a systematic review and economic analysis. Gastroenterology. 2004;127:1329-1337.
30. Garza-González E, Bosques-Padilla FJ, Tijerina-Menchaca R, et al. Comparison of endoscopy-based and serum-based methods for the diagnosis of Helicobacter pylori. Can J Gastroenterol. 2003;17:101-106.
31. Kodama M, Murakami K, Okimoto T, et al. Influence of proton pump inhibitor treatment on Helicobacter pylori stool antigen test. World J Gastroenterol. 2012;18:44-48.
32. Shimoyama T. Stool antigen tests for the management of Helicobacter pylori infection. World J Gastroenterol. 2013;19:8188-8191.
33. Howden CW, Hunt RH. Guidelines for the management of Helicobacter pylori infection. Ad Hoc Committee on Practice Parameters of the American College of Gastroenterology. Am J Gastroenterol. 1998;93:2330-2338.
34. Gisbert J, Abraira V. Accuracy of Helicobacter pylori diagnostic tests in patients with bleeding peptic ulcer: a systematic review and meta-analysis. Am J Gastroenterol. 2006;101:848-863.
35. Kamangar F, Dawsey SM, Blaser MJ, et al. Opposing risks of gastric cardiac and noncardia gastric adenocarcinomas associated with Helicobacter pylori seropositivity. J Natl Cancer Inst. 2006;98:1445-1452.
36. Islami F, Kamangar F. Helicobacter pylori and esophageal cancer risk: a meta-analysis. Cancer Prevent Res (Phila). 2008;1:329-338.
37. Moayyedi P, Soo S, Deeks J, et al. Eradication of Helicobacter pylori for non-ulcer dyspepsia. Cochrane Database Syst Rev. 2006;(2):CD002096.
38. Mazzoleni LE, Sander GB, Francesconi CF, et al. Helicobacter pylori eradication in functional dyspepsia: HEROES trial. Arch Intern Med. 2011;171:1929-1936.
39. Yuan Y, Ford AC, Khan KJ, et al. Optimum duration of regimens for Helicobacter pylori eradication. Cochrane Database Syst Rev. 2013;(12):CD008337.
40. Zou J, Dong J, Yu X. Meta-analysis: Lactobacillus containing quadruple therapy versus standard triple first-line therapy for Helicobacter pylori eradication. Helicobacter. 2009;14:97-107.
41. Basu PP, Rayapudi K, Pacana T, et al. A randomized study comparing levofloxacin, omeprazole, nitazoxanide, and doxycycline versus triple therapy for the eradication of Helicobacter pylori. Am J Gastroenterol. 2011;106:1970-1975.
42. Wu DC, Hsu PI, Wu JY, et al. Sequential and concomitant therapy with 4 drugs are equally effective for eradication of H. pylori infection. Clin Gastroenterol Hepatol. 2010;8:36–41.
43. Osato R, Reddy R, Reddy SG, et al. Pattern of primary resistance of Helicobacter pylori to metronidazole or clarithromycin in the United States. Arch Intern Med. 2001;161:1217-1220.
44. Fischbach L, Evans EL. Meta-analysis: the effect of antibiotic resistance status on the efficacy of triple and quadruple firstline therapies for Helicobacter pylori. Aliment Pharmacol Ther. 2007;26:343-357.
45. Hinostroza Morales D, Díaz Ferrer J. Addition of bismuth subsalicylate to triple eradication therapy for Helicobacter pylori infection: efficiency and adverse events. Rev Gastroenterol Peru. 2014;34:315-320.
46. Rabeneck L, Wristers K, Souchek J, et al. Impact of upper endoscopy on satisfaction in patients with previously uninvestigated dyspepsia. Gastrointest Endosc. 2003;57:295-299.
47. Hojo M, Miwa H, Yokoyama T, et al. Treatment of functional dyspepsia with antianxiety or antidepressive agents: systematic review. J Gastroenterol. 2005;40:1036-1042.
48. Soo S, Moayyedi P, Deeks J, et al. Psychological interventions for non-ulcer dyspepsia. Cochrane Database Syst Rev. 2005;(2):CD002301.
49. Lima FA, Ferreira LE, Pace FH. Acupuncture effectiveness as a complementary therapy in functional dyspepsia patients. Arq Gastroenterol. 2013;50:202-207.
50. Ma TT, Yu SY, Li Y, et al. Randomised clinical trial: an assessment of acupuncture on specific meridian or specific acupoint vs. sham acupuncture for treating functional dyspepsia. Aliment Pharmacol Ther. 2012;35:552-561.
51. Koretz RL, Rotblatt M. Complementary and alternative medicine in gastroenterology: the good, the bad, and the ugly. Clin Gastroenterol Hepatol. 2004;2:957-967.
› Review the medications taken by patients who suffer from dyspepsia, as many drugs—bisphosphonates, antibiotics, steroids, and nonsteroidal anti-inflammatory drugs, among others—are associated with this condition. B
› Order an esophagogastroduodenoscopy for patients ages 55 years or older with new-onset dyspepsia and those who have red flags for more serious conditions, eg, a history of upper gastrointestinal (GI) cancer, unintended weight loss, GI bleeding, dysphagia, or a palpable mass. C
› Prescribe acid suppression therapy as first-line treatment for patients who have dyspepsia but are at low risk or have tested negative for Helicobacter pylori infection. A
Strength of recommendation (SOR)
A Good-quality patient-oriented evidence
B Inconsistent or limited-quality patient-oriented evidence
C Consensus, usual practice, opinion, disease-oriented evidence, case series
Each year, an estimated 25% to 30% of the US population suffers from dyspepsia.1 Most self-treat with home remedies and over-the-counter products, but others seek medical care. Dyspepsia accounts for an estimated 2% to 5% of primary care visits annually,2 mostly by patients who are found to have no organic, or structural, cause for their symptoms.1,3
Such patients are said to have functional dyspepsia (FD), a category that applies to about two-thirds of those with dyspepsia.1 A small number of cases are categorized as organic dyspepsia, indicating the presence of a clear structural or anatomic cause, such as an ulcer or mass. The remainder are said to have undifferentiated dyspepsia, which simply means that their signs and symptoms do not rise to the level for which further investigation is warranted and thus it is not known whether it is functional or organic.
There are many possible causes of FD, ranging from medications3,4 to abnormal gastroduodenal motility5,6 to Helicobacter pylori infection,7 and a comprehensive differential diagnosis. The first step in an investigation is to rule out red flags suggestive of gastrointestinal (GI) cancer or other serious disorders.
Patients with FD, like the vast majority of those you’ll treat in a primary care setting, suffer significant morbidity. Most have chronic symptoms, with intermittent flare-ups interspersed with periods of remission.8 In the text and dyspepsia treatment ALGORITHM5,7-12 that follow, you’ll find an evidence-based patient management approach.
Symptoms and causes: What to look for
The primary symptoms of dyspepsia include bothersome postprandial fullness, early satiety, and epigastric pain and burning. To meet the Rome criteria for dyspepsia, these symptoms must have been present for the last 3 months and have had an onset ≥6 months prior to diagnosis.2 Recurrent belching and nausea are also common, but are not included in the Rome diagnostic criteria.
Symptom severity is a poor predictor of the seriousness of the condition, however, and more intense symptoms are no more likely than milder cases to have an organic cause.13,14 Indeed, anxiety is a common comorbidity in patients with FD and a risk factor for the diagnosis. Compared with the general public, patients with FD have been found to have higher levels of anxiety, chronic tension, hostility, and hypochondriasis, and a tendency to be more pessimistic.15
Possible causes of FD
While the etiology of organic dyspepsia is clear, the cause of FD is often far more difficult to determine.
Medication use should always be considered, as many types of drugs—including bisphosphonates, antibiotics, narcotics, steroids, iron, metformin, and nonsteroidal anti-inflammatory drugs (NSAIDs)—are associated with dyspepsia.3,4
Gastroduodenal motility and accommodation, which has been found in numerous studies of patients with FD, is a proposed etiology.5,6
Visceral hypersensitivity also appears to play a role. In one study of patients with severe dyspepsia, 87% of those with FD had a reduced or altered GI pain threshold, compared with 20% of those with organic dyspepsia.16
H pylori, commonly linked to peptic ulcer disease (PUD), is also associated with both organic dyspepsia and FD.17,18 The gram-negative rod-shaped bacterium is present in approximately half of the population worldwide, but is more common in developing nations.7H pylori immunoglobulin G (IgG) is more prevalent in patients with dyspepsia, particularly in those younger than 30 years of age. The exact mechanism by which H pylori causes non-ulcerative dyspepsia is not clear, but inflammation, dysmotility, visceral hypersensitivity, and alteration of acid secretion have all been proposed.17
Dysfunctional intestinal epithelium is increasingly being considered in the pathophysiology of dyspepsia, among other conditions. Researchers theorize that certain foods, toxins, infections, and/or other stressors lead to changes in the structure and function of tight junctions, resulting in increased intestinal permeability.19 This in turn is thought to allow the outflow of antigens through the leaky epithelium and to stimulate an immune response—a process that may play a role in the increased GI inflammation or hypersensitivity associated with dyspepsia. The “leaky gut” theory may eventually lead to new ways to treat dyspepsia, but thus far, highquality evidence of the efficacy of treatments aimed at this mechanism is lacking.
A range of disorders included in the differential
The primary differential diagnosis for dyspepsia includes gastroesophageal reflux disease (GERD), esophagitis, chronic PUD (including both gastric and duodenal ulcers), and malignancy. The differential may also include biliary disorder, pancreatitis, hepatitis, or other liver disease; chronic abdominal wall pain, irritable bowel syndrome, motility disorders, or infiltrative diseases of the stomach (eosinophilic gastritis, Crohn’s disease, sarcoidosis); celiac disease and food sensitivities/allergies, including gluten, lactose, and other intolerances; cardiac disease, including acute coronary syndrome, myocardial infarction, and arrhythmias; intestinal angina; small intestine bacterial overgrowth; heavy metal toxicity; and hypercalcemia.8
Ulcers are found in approximately 10% of patients undergoing evaluation for dyspepsia.8 Previously, PUD was almost exclusively due to H pylori infection. In developed countries, however, chronic use of NSAIDs, including aspirin, has increased, and is now responsible for most ulcer diseases.20,21 The combination of H pylori infection and NSAID usage appears to be synergistic, with the risk of uncomplicated PUD estimated to be 17.5 times higher among those who test positive for H pylori and take NSAIDs vs a 3- to 4-fold increase in ulcer incidence among those with either of these risk factors alone.22
The work-up starts with a search for red flags
Symptom severity is a poor predictor of the seriousness of dyspepsia; more intense symptoms are no more likely than milder cases to have an organic cause.
Evaluation of a patient with dyspepsia begins with a thorough history. Start by determining whether the patient has any red flags, or alarm features, that may be associated with a more serious condition—particularly an underlying malignancy. One or more of the following is an indication for an esophagogastroduodenoscopy (EGD):5,8,12
• family and/or personal history of upper GI cancer
• unintended weight loss
• GI bleeding
• progressive dysphagia
• unexplained iron-deficiency anemia
• persistent vomiting
• palpable mass or lymphadenopathy
• jaundice.
While it is important to rule out these red flags, they are poor predictors of malignancy.23,24 With the exception of a single study, their positive predictive value was a mere 1%.8 Their usefulness lies in their ability to exclude malignancy, however; when none of these features is present, the negative predictive value for malignancy is >97%.8
Age is also a risk factor. In addition to red flags, EGD is recommended by the American Gastroenterological Association (AGA) for patients with new-onset dyspepsia who are 55 years or older—an age at which upper GI malignancy becomes more common. A repeat EGD is rarely indicated, unless Barrett’s esophagus or severe erosive esophagitis is found on the initial EGD.25
Physical exam, H pylori evaluation follow
A physical examination of all patients presenting with symptoms suggestive of dyspepsia is crucial. While the exam is usually normal, it may reveal epigastric tenderness on abdominal palpation. Rebound tenderness, guarding, or evidence of other abnormalities should raise the prospect of alternative diagnoses. GERD, for example, has many symptoms in common with dyspepsia, but is a more likely diagnosis in a patient who has retrosternal burning discomfort and regurgitation and reports that symptoms worsen at night and when lying down.
Lab work has limited value. Although laboratory work is not specifically addressed in the AGA guidelines (except for H pylori testing), a complete blood count is a reasonable part of an initial evaluation of dyspepsia to check for anemia. Other routine blood work is not needed, but further lab testing may be warranted based on the history, exam, and differential diagnosis.
H pylori risk. Because of the association between dyspepsia and H pylori, evaluating the patient’s risk for infection with this bacterium, based primarily on his or her current and previous living conditions (TABLE 1),9 is the next step. Although a test for H pylori could be included in the initial work-up of all patients with dyspepsia, a better—and more cost-effective—strategy is to initially test only those at high risk. (More on testing and treating H pylori in a bit.)
Initiate acid suppression therapy for low-risk patients
First-line treatment for patients with dyspepsia who have no red flags for malignancy or other serious conditions and either are not at high risk for H pylori or are at high risk but have been tested for it and had negative results is a 4- to 8-week course of acid suppression therapy. Patients at low risk for H pylori should be tested for the bacterium only if therapy fails to alleviate their symptoms.9
H2RAs or PPIs? A look at the evidence
In a Cochrane review, both H2 receptor antagonists (H2RAs) and proton pump inhibitors (PPIs) were significantly more effective than placebo for treating FD.26 However, H2RAs can lead to tachyphylaxis—an acute decrease in response to a drug—within 2 to 6 weeks, thus limiting their long-term efficacy.27
PPIs appear to be more effective than H2RAs, and are the AGA’s acid suppression drug of choice.11 The CADET study, a randomized controlled trial comparing PPIs (omeprazole 20 mg/d) with an H2RA (ranitidine 150 mg BID) and a prokinetic agent (cisapride 20 mg BID) as well as placebo for dyspepsia, found the PPI to be superior to the H2RA at 6 months.28 In a systematic review, the number needed to treat with PPI therapy for improvement of dyspepsia symptoms was 9.29
There is no specified time limit for the use of PPIs. AGA guidelines recommend that patients who respond to initial therapy stop treatment after 4 to 8 weeks.11 If symptoms recur, another course of the same treatment is justified; if necessary, therapy can continue long term. However, patients should be made aware of the risk for vitamin deficiency, osteoporosis, and fracture, as well as arrhythmias, Clostridium difficile infection, and rebound upon abrupt discontinuation of PPIs.
When to test for H pylori ...
Empiric treatment for H pylori is not recommended. Thus, testing is indicated for patients who have risk factors for the bacterium or who fail to respond to acid suppression therapy. There are various ways to test for the presence of H pylori. Which test you choose depends, in part, on patient-specific factors.
Serology. IgG serology testing is extremely useful in patients who have never been diagnosed with H pylori. It is best suited for those who are currently taking proton pump inhibitors (PPIs) or who recently completed a course of antibiotics, since neither medication affects the results of the serology test.
Serology testing should not be used, however, for any patient who was previously diagnosed with or treated for H pylori, because this type of test cannot distinguish between an active or past infection. The IgG serology test has a sensitivity of 87% and a specificity of 67%.30
Stool antigen. Stool tests using monoclonal antibodies to detect the presence of H pylori have a sensitivity of 87% to 92% and a specificity of 70%. Stool antigen is also an excellent post-treatment test to confirm that H pylori has been eradicated.31
Stool testing has some drawbacks, however. PPIs can decrease the sensitivity and should be discontinued at least 2 weeks prior to stool testing.32 In addition, a stool test for H pylori is not accurate if the patient has an acute GI bleed.
Urea breath testing. This is the most sensitive and specific test for active H pylori infection (90%-96% sensitivity and 88%-96% specificity).33 PPIs can lower the sensitivity of the test, however, and are typically discontinued at least 2 weeks prior to testing. Urea breath testing, like stool testing, is an excellent way to confirm that H pylori has been eradicated after treatment. However, it is more expensive than other tests for H pylori and often inconvenient to obtain.13
An EGD is indicated for a patient who has failed to respond to acid suppression therapy and has a negative serology, stool antigen, or urea breath test for H pylori.
Biopsy-based testing for H pylori is performed with EGD and is therefore reserved for patients who have red flags or other indications of a need for invasive testing. There are 3 types of biopsy-based tests: urease (sensitivity, 70%-90%; specificity, 95%); histology (87%-92% and 70%, respectively); and culture (85%-88% and 69%, respectively). Overall, the specificity is slightly better than that of noninvasive testing, but the sensitivity can be lowered by recent use of PPIs, bismuth, or antibiotics.12,34
... and how to treat it
H pylori infection is associated with an increased risk of noncardiac gastric adenocarcinoma, but a decreased risk of cardiac gastric adenocarcinoma and esophageal adenocarcinoma.35,36 Thus, the potential to reduce the risk of gastric cancer is not considered an indication for H pylori treatment. The possibility of improving dyspepsia symptoms is a reason to treat H pylori infection, although eradicating it does not always do so.
In a 2006 Cochrane Review, treating H pylori had a small but statistically significant benefit for patients with FD (NNT=14).37 A 2011 study on the effects of H pylori eradication on symptoms and quality of life in primary care patients with FD revealed a 12.5% improvement in quality of life and a 10.6% improvement in symptoms.38
The triple therapy regimen (a PPI + amoxicillin + clarithromycin) is the most common first-line H pylori treatment in the United States, and a good initial choice in regions in which clarithromycin resistance is low (TABLE 2).39-44 The standard duration is 7 days. A 2013 Cochrane Review showed that a longer duration (14 days) increased the rate of eradication (82% vs 73%), but this remains controversial.39 The addition of bismuth subsalicylate to the triple therapy regimen has been shown to increase the eradication rate of H pylori by approximately 10%.45 Adding probiotics (saccharomyces or lactobacillus) appears to increase eradication rates, as well.40
Sequential therapy consists of a 5-day course of treatment in which a PPI and amoxicillin are taken twice a day, followed by another 5-day course of a PPI, clarithromycin, and metronidazole. A recent meta-analysis of sequential therapy showed that it is superior to 7-day triple therapy but equivalent to 14-day triple therapy.40
LOAD (levofloxacin, omeprazole, nitazoxanide, and doxycycline) therapy for 7 to 10 days can be used in place of triple therapy in areas of high resistance or for persistent H pylori. In one study, the H pylori eradication rate for a 7-day course of LOAD therapy—levofloxacin and doxycycline taken once a day, omeprazole before breakfast, and nitazoxanide twice daily—was 90% vs 73.3% for a 7-day course of triple therapy.41
Quadruple therapy has 2 variations: bismuth-based and non-bismuth (concomitant) therapy. The latter uses the base triple therapy and adds either metronidazole or tinidazole for 7 to 14 days. In a multicenter randomized trial, this concomitant therapy was found to have similar efficacy to sequential therapy.42
Bismuth-based quad therapy includes a PPI, bismuth, metronidazole, and tetracycline. A meta-analysis found it to have a higher rate of eradication than triple therapy for patients with antibiotic resistance.43,44
For persistent H pylori, a PPI, levofloxacin, and amoxicillin for 10 days has been shown to be more effective and better tolerated than quadruple therapy.12
Confirmation is indicated when symptoms persist
If dyspepsia symptoms persist after H pylori treatment, it is reasonable to retest to confirm that the infection has in fact been eradicated. Confirmation is also indicated if the patient has an H pylori-associated ulcer or a prior history of gastric cancer.
Retesting should be performed at least 4 to 6 weeks after treatment is completed. If H pylori has not been eradicated, you can try another regimen. If retesting confirms eradication and symptoms persist, EGD with biopsy is indicated. Although EGD typically has a very low yield, even for patients with red flags, this invasive test often provides reassurance and increased satisfaction for patients with persistent symptoms.46
More options for challenging cases
Managing FD is challenging when both initial acid suppression therapy and H pylori eradication fail. Unproven but low-risk treatments include modification of eating habits (eg, eating slower, not gulping food), reducing stress, discontinuing medications that may be related to symptoms, avoiding foods that seem to exacerbate symptoms, and cutting down or eliminating tobacco, caffeine, alcohol, and carbonated beverages.8 Bismuth salts have been shown to be superior to placebo for the treatment of dyspepsia.25 Small studies have also demonstrated a favorable risk–benefit ratio for peppermint oil and caraway oil for the treatment of FD.47 Prokinetics have shown efficacy compared with placebo, although a Cochrane review questioned their efficacy based on publication bias.26
There is no good evidence of efficacy for over-the-counter antacids, such as TUMS, or for GI “cocktails” (antacid, antispasmotic, and lidocaine), sucralfate, psychological interventions (eg, cognitive behavioral therapy, relaxation therapy, or hypnosis), or antidepressants.48,49 Several recent randomized controlled trials have shown the efficacy of acupuncture for the treatment of dyspepsia.49,50 Ginger may also be helpful; it has been found to help with nausea in other GI conditions, but it’s uncertain whether it can help patients with dyspepsia.51
CORRESPONDENCE
Michael Malone, MD, 845 Fishburn Road, Hershey, PA 17053; [email protected]
1. Shaib Y, El-Serag HB. The prevalence and risk factors of functional dyspepsia in a multiethnic population in the United States. Am J Gastroenterol. 2004;99:2210-2216.
2. Talley NJ. Dyspepsia: management guidelines for the millennium. Gut. 2002;50(suppl 4):iv72–iv78.
3. Harmon RC, Peura DA. Evaluation and management of dyspepsia. Therap Adv Gastroenterol. 2010;3:87–98.
4. Bazaldua OV, Schneider FD. Evaluation and management of dyspepsia. Am Fam Physician. 1999;60:1773-1784.
5. Tack J, Talley NJ, Camilleri M, et al. Functional gastroduodenal disorders. Gastroenterology. 2006;130:1466-1479.
6. Haag S, Talley NJ, Holtmann G. Symptom patterns in functional dyspepsia and irritable bowel syndrome: relationship to disturbances in gastric emptying and response to a nutrient challenge in consulters and non-consulters. Gut. 2004;53:1445-1451.
7. Malfertheiner P, Megraud F, O’Morain CA, et al; European Helicobacter Study Group. Management of Helicobacter pylori infection—the Maastricht IV/Florence Consensus Report. Gut. 2012;61:646-664.
8. Talley NJ, Vakil NB, Moayyedi P. American Gastroenterological Association technical review on the evaluation of dyspepsia. Gastroenterology. 2005;129:1756-1780.
9. Moayyedi P, Axon AT. The usefulness of the likelihood ratio in the diagnosis of dyspepsia and gastroesophageal reflux disease. Am J Gastroenterol. 1999;94:3122-3125.
10. McColl KE. Clinical practice. Helicobacter pylori infection. N Engl J Med. 2010;362:1597-1604.
11. Kahrilas PJ, Shaheen NJ, Vaezi MF, et al; American Gastroenterological Association. American Gastroenterological Association Medical Position Statement on the management of gastroesophageal reflux disease. Gastroenterology. 2008;135:1383-1391.
12. Chey WD, Wong BC; Practice Parameters Committee of the American College of Gastroenterology. American College of Gastroenterology guideline on the management of Helicobacter pylori Infection. Am J Gastroenterol. 2007;102:1808-1825.
13. Moayyedi P, Talley NJ, Fennerty MB, et al. Can the clinical history distinguish between organic and functional dyspepsia? JAMA. 2006;295:1566-1576.
14. Eslick GD, Howell SC, Hammer J, et al. Empirically derived symptom sub-groups correspond poorly with diagnostic criteria for functional dyspepsia and irritable bowel syndrome. A factor and cluster analysis of a patient sample. Aliment Pharmacol Ther. 2004;19:133-140.
15. Aro P, Talley NJ, Ronkainen J, et al. Anxiety is associated with uninvestigated and functional dyspepsia (Rome III criteria) in a Swedish population-based study. Gastroenterology. 2009;137:94-100.
16. Mertz H, Fullerton S, Naliboff B, et al. Symptoms and visceral perception in severe functional and organic dyspepsia. Gut. 1998;42:814-822.
17. O’Morain C. Role of Helicobacter pylori in functional dyspepsia. World J Gastroenterol. 2006;12:2677-2680.
18. Shmuely H, Obure S, Passaro DJ, et al. Dyspepsia symptoms and Helicobacter pylori infection, Nakuru, Kenya. Emerg Infect Dis. 2003;9:1103-1107.
19. Barbara G, Zecchi L, Barbaro R, et al. Mucosal permeability and immune activation as potential therapeutic targets of probiotics in irritable bowel syndrome. J Clin Gastroenterol. 2012;46(suppl):S52-S55.
20. Liu NJ, Lee CS, Tang JH, et al. Outcomes of bleeding peptic ulcers: a prospective study. J Gastroenterol Hepatol. 2008;23:e340-e347.
21. Ramsoekh D, van Leerdam ME, Rauws EA, et al. Outcome of peptic ulcer bleeding, nonsteroidal anti-inflammatory drug use, and Helicobacter pylori infection. Clin Gastroenterol Hepatol. 2005;3:859-864.
22. Papatheodoridis GV, Sougioultzis S, Archimandritis AJ. Effects of Helicobacter pylori and nonsteroidal anti-inflammatory drugs on peptic ulcer disease: a systematic review. Clin Gastroenterol Hepatol. 2006;4:130-142.
23. Bai Y, Li ZS, Zou DW, et al. Alarm features and age for predicting upper gastrointestinal malignancy in Chinese patients with dyspepsia with high background prevalence of Helicobacter pylori infection and upper gastrointestinal malignancy: an endoscopic database review of 102,665 patients from 1996 to 2006. Gut. 2010;59:722-728.
24. Vakil N. Dyspepsia, peptic ulcer, and H. pylori: a remembrance of things past. Am J Gastroenterol. 2010;105:572-574.
25. Shaheen NJ, Weinberg DS, Denberg TD, et al; Clinical Guidelines Committee of the American College of Physicians. Upper endoscopy for gastroesophageal reflux disease: best practice advice from the clinical guidelines committee of the American College of Physicians. Ann Intern Med. 2012;157:808-816.
26. Moayyedi P, Soo S, Deeks J, et al. Pharmacological interventions for non-ulcer dyspepsia. Cochrane Database Syst Rev. 2006;(4):CD001960.
27. Chiu CT, Hsu CM, Wang CC, et al. Randomised clinical trial: sodium alginate oral suspension is non-inferior to omeprazole in the treatment of patients with non-erosive gastroesophageal disease. Aliment Pharmacol Ther. 2013;38:1054-1064.
28. Veldhuyzen van Zanten SJ, Chiba N, Armstrong D, et al. A randomized trial comparing omeprazole, ranitidine, cisapride, or placebo in helicobacter pylori negative, primary care patients with dyspepsia: the CADET-HN Study. Am J Gastroenterol. 2005;100:1477-1488.
29. Moayyedi P, Delaney BC, Vakil N, et al. The efficacy of proton pump inhibitors in nonulcer dyspepsia: a systematic review and economic analysis. Gastroenterology. 2004;127:1329-1337.
30. Garza-González E, Bosques-Padilla FJ, Tijerina-Menchaca R, et al. Comparison of endoscopy-based and serum-based methods for the diagnosis of Helicobacter pylori. Can J Gastroenterol. 2003;17:101-106.
31. Kodama M, Murakami K, Okimoto T, et al. Influence of proton pump inhibitor treatment on Helicobacter pylori stool antigen test. World J Gastroenterol. 2012;18:44-48.
32. Shimoyama T. Stool antigen tests for the management of Helicobacter pylori infection. World J Gastroenterol. 2013;19:8188-8191.
33. Howden CW, Hunt RH. Guidelines for the management of Helicobacter pylori infection. Ad Hoc Committee on Practice Parameters of the American College of Gastroenterology. Am J Gastroenterol. 1998;93:2330-2338.
34. Gisbert J, Abraira V. Accuracy of Helicobacter pylori diagnostic tests in patients with bleeding peptic ulcer: a systematic review and meta-analysis. Am J Gastroenterol. 2006;101:848-863.
35. Kamangar F, Dawsey SM, Blaser MJ, et al. Opposing risks of gastric cardiac and noncardia gastric adenocarcinomas associated with Helicobacter pylori seropositivity. J Natl Cancer Inst. 2006;98:1445-1452.
36. Islami F, Kamangar F. Helicobacter pylori and esophageal cancer risk: a meta-analysis. Cancer Prevent Res (Phila). 2008;1:329-338.
37. Moayyedi P, Soo S, Deeks J, et al. Eradication of Helicobacter pylori for non-ulcer dyspepsia. Cochrane Database Syst Rev. 2006;(2):CD002096.
38. Mazzoleni LE, Sander GB, Francesconi CF, et al. Helicobacter pylori eradication in functional dyspepsia: HEROES trial. Arch Intern Med. 2011;171:1929-1936.
39. Yuan Y, Ford AC, Khan KJ, et al. Optimum duration of regimens for Helicobacter pylori eradication. Cochrane Database Syst Rev. 2013;(12):CD008337.
40. Zou J, Dong J, Yu X. Meta-analysis: Lactobacillus containing quadruple therapy versus standard triple first-line therapy for Helicobacter pylori eradication. Helicobacter. 2009;14:97-107.
41. Basu PP, Rayapudi K, Pacana T, et al. A randomized study comparing levofloxacin, omeprazole, nitazoxanide, and doxycycline versus triple therapy for the eradication of Helicobacter pylori. Am J Gastroenterol. 2011;106:1970-1975.
42. Wu DC, Hsu PI, Wu JY, et al. Sequential and concomitant therapy with 4 drugs are equally effective for eradication of H. pylori infection. Clin Gastroenterol Hepatol. 2010;8:36–41.
43. Osato R, Reddy R, Reddy SG, et al. Pattern of primary resistance of Helicobacter pylori to metronidazole or clarithromycin in the United States. Arch Intern Med. 2001;161:1217-1220.
44. Fischbach L, Evans EL. Meta-analysis: the effect of antibiotic resistance status on the efficacy of triple and quadruple firstline therapies for Helicobacter pylori. Aliment Pharmacol Ther. 2007;26:343-357.
45. Hinostroza Morales D, Díaz Ferrer J. Addition of bismuth subsalicylate to triple eradication therapy for Helicobacter pylori infection: efficiency and adverse events. Rev Gastroenterol Peru. 2014;34:315-320.
46. Rabeneck L, Wristers K, Souchek J, et al. Impact of upper endoscopy on satisfaction in patients with previously uninvestigated dyspepsia. Gastrointest Endosc. 2003;57:295-299.
47. Hojo M, Miwa H, Yokoyama T, et al. Treatment of functional dyspepsia with antianxiety or antidepressive agents: systematic review. J Gastroenterol. 2005;40:1036-1042.
48. Soo S, Moayyedi P, Deeks J, et al. Psychological interventions for non-ulcer dyspepsia. Cochrane Database Syst Rev. 2005;(2):CD002301.
49. Lima FA, Ferreira LE, Pace FH. Acupuncture effectiveness as a complementary therapy in functional dyspepsia patients. Arq Gastroenterol. 2013;50:202-207.
50. Ma TT, Yu SY, Li Y, et al. Randomised clinical trial: an assessment of acupuncture on specific meridian or specific acupoint vs. sham acupuncture for treating functional dyspepsia. Aliment Pharmacol Ther. 2012;35:552-561.
51. Koretz RL, Rotblatt M. Complementary and alternative medicine in gastroenterology: the good, the bad, and the ugly. Clin Gastroenterol Hepatol. 2004;2:957-967.

Improving our approach to preventive care
› Avoid scheduling annual visits exclusively for preventive care. A
› Institute simple practice changes to improve the preventive services you provide, such as implementing standing orders for influenza vaccines. A
› Adopt components of the chronic care model for preventive services wherever possible—using ancillary providers to remind patients to undergo colorectal cancer screening and recommending apps that support self-management, for example. A
Strength of recommendation (SOR)
A Good-quality patient-oriented evidence
B Inconsistent or limited-quality patient-oriented evidence
C Consensus, usual practice, opinion, disease-oriented evidence, case series
For well over a century, the periodic health exam has been associated with the delivery of preventive services1—a model widely accepted by physicians and patients alike. Approximately 8% of ambulatory care visits are for check-ups, and more than 20% of US residents schedule a health exam annually.2
Periodic health exams, however, do not result in optimal preventive care. Evidence suggests that important preventive services, such as dietary counseling, occur at only 8% of such visits; that just 10 seconds, on average, is devoted to smoking cessation; and that 80% of the preventive services patients receive are delivered outside of scheduled health exams.2 Because physicians and patients alike understandably prioritize acute problems, any discussion of health maintenance issues during a periodic check-up is likely to occur despite the visit’s agenda, not as part of it.3-7
Primary care physicians and practices are increasingly being held accountable for their performance on preventive measures. With that in mind, being familiar with evidence-based guidelines relating to the delivery of preventive services in ambulatory care settings, such as those developed by the US Preventive Services Task Force (USPSTF),8 is crucial. Identifying elements of the chronic care model that can be effectively applied to preventive care—and recognizing that the reactive acute care model is ineffective for both chronic illness and preventive services—is essential, as well.
Preventive care that's evidence-based
Good practice guidelines should have the following features, according to the Institute of Medicine:9
• Validity. Application would lead to the desired health and cost outcomes.
• Reliability/reproducibility. Others using the same data/interpretation would reach the same conclusion.
• Clinical applicability. Patient populations are appropriately defined.
• Clinical flexibility. Known or generally expected exceptions are identified.
• Clarity. Guideline uses unambiguous language with precise definitions.
• Multidisciplinary process. Developed with the participation of all key stakeholders.
• Scheduled review. Periodically reviewed and revised to incorporate new evidence/changing consensus.
• Documentation. Procedures used in development are well documented.
The USPSTF guidelines are consistent with these attributes.8
Some brief interventions fail
Guidelines are useful as practice standards for establishing preventive care goals, but their existence alone does not ensure the delivery of high-quality preventive services in an office setting. One key factor is time. It is estimated that a primary care physician with an average-sized patient panel would require an additional 7.4 hours per day to achieve 100% compliance with all of the USPSTF recommendations.10
Counseling, in particular, is an intervention that may be more effective in theory than in practice. Evidence suggests that even when primary care providers are trained in preventive counseling (and many are not), many brief interventions are not effective at creating sustained behavior change or health improvement.11
Others are effective
That’s not to say that there’s little that can be done. Use of standing orders for influenza vaccination is one example of an effective and easily implemented preventive measure that requires little or no additional physician time. Yet some doctors are resistant, fearing loss of control or lawsuits. In fact, the National Vaccine Injury Compensation Program specifically provides protection against vaccinerelated malpractice claims.12 A standing order for office staff to arrange a screening mammogram is another effective intervention; it has been shown to improve screening rates by as much as 30%.13
Lessons from chronic illness management
Chronic illness care and preventive care have much in common.14 Both acknowledge the need for proactive screening and counseling to bring about behavior change. In addition, both require ongoing care and follow-up, as well as depend on links to community resources. And finally, both are resource-intensive—too resource-intensive, some say, to be delivered in a cost-effective manner.

The Chronic Care Model has been proposed as a framework for improving preventive services (TABLE).15,16 Evidence suggests adopting some key components of chronic care can lead to significant gains in the delivery of preventive care, with the largest improvement seen when multiple components are used simultaneously.17-20
Self-management support. A growing body of evidence shows that self-management activities are associated with improved outcomes.21 Instituting a peer support group for pregnant women at a federally qualified health center, for example, led to a 7% absolute risk reduction in preterm births.22
Not all efforts to encourage self-management are effective, however, and evaluation is crucial to determine what works. In one large-scale trial, the use of patient reminder cards to facilitate a reduction in health risk behaviors such as tobacco use, risky drinking, unhealthy dietary patterns, and physical inactivity led to fewer health risk assessments being performed, fewer individual counseling encounters, and no change in these behaviors.23
Decision support. Clinical decision support systems, which generate patient-specific evidence-based assessments and/or recommendations that are actionable as part of the workflow at the point of care, have been found to improve care.24,25 An example of this is a prompt that reminds the physician to discuss chemoprevention with a patient at high risk for breast cancer.
Delivery system design. The patient-centered medical home (PCMH) is a well-known example of a redesign of health care delivery.26 Conversion to this model is associated with a small positive effect on preventive interventions.27 However, the persistence of a fee-for-service payment system—which does not include physician reimbursement for some of the added services incorporated into the PCMH—limits the implementation of the PCMH model.28
Many practices are improving health care delivery by using nonphysicians for various tasks related to preventive care. Care managers, for example, typically have smaller caseloads and focus on reducing unnecessary treatment for patients with high-risk conditions, such as congestive heart failure, while patient navigators generally have less clinical expertise but more knowledge of community services.
In one study, practice-initiated phone conversations with nonphysicians increased colorectal cancer screening by up to 40%.29 And in one pilot program, the use of ancillary providers led to an increase in colorectal cancer screening by as much as 123%.30 The human touch seems to be key to the success of these interventions. Passive reminders, such as videos being shown on waiting room televisions, have not proven to be effective.31
Clinical information systems. Early on, the power of electronic health records (EHRs) to improve practices’ delivery of preventive services was recognized. As early as 1995, the use of a reminder system to highlight such services during acute care visits was linked to improvements in counseling about smoking cessation and higher rates of cervical cancer screening, among other preventive measures.32,33 Overall, the use of EHRs alone has been shown to improve rates of preventive services by as much as 66%, with most practices reporting improvements of at least 20%.34
Today, EHRs that are Meaningful Use Stage 2-compliant have the tools needed to improve care. Requirements include the ability to generate patient registries of all those with a given disease and to identify patients on the registry who have not received needed care.35 To improve preventive care, registries should focus on the mitigation of risk factors, such as identifying—and contacting—patients with diabetes who are in need of, or overdue for, an annual eye exam.
Trials using the registry function, in combination with automated messaging to deliver targeted information to various patient groups (identified by the demographic information available from the EHR), are ongoing.
Community resources. Many clinicians have informal referral relationships with community organizations, such as the YMCA. Physician practices that establish links to community resources have the potential to have a large effect on unhealthy behaviors. (See “Putting theory into practice: 2 cases”.) However, a systematic review found that, while evidence to support such connections is mainly positive, research is limited and further evaluation is needed.36
The Practical Playbook (practicalplaybook.org)37 developed by the deBeaumont Foundation, Duke Department of Community and Family Medicine, and the Centers for Disease Control and Prevention, offers concrete examples of how physician practices are linking with community resources to improve the health of the population. For example, Duke University’s “Just for Us” program provides in-home chronic illness care to 350 high-risk elderly individuals. The LATCH program connects thousands of Latino immigrants to health care services and culturally and linguistically appropriate health education classes.37
CASE 1
Dominic B, a 53-year-old patient, has scheduled a visit for a cough that has persisted for 4 weeks. The patient is a nonsmoker, is married, and has no first-degree relatives with cancer. But when you review his chart before the visit, you note that he missed his 6-month check-up for hypertension and hyperlipidemia. In addition, your electronic health record (EHR ) flags the fact that he has not undergone colorectal screening and that his immunizations are not current. Because you have standing orders in place, your medical assistant gives him a flu shot and a pamphlet providing information on colorectal cancer screening before you enter the room.
During the visit, Mr. B mentions that his father, age 82, recently had a heart attack. This event—reinforced by the postcards and phone messages he received from your office after he missed his 6-month follow-up—prompted him to reluctantly admit it was “time for a check-up.” You take the patient’s blood pressure (BP) and review his lipid panel (blood work was ordered prior to his visit) with him. He is relieved to know that he will not need to be on a statin and agrees to be screened for colorectal cancer using a sensitive stool study.
Before he leaves, the patient requests medication for erectile dysfunction—a problem he never reported before. You ask him to keep a diary and return in 2 months, and promise to discuss his erectile dysfunction at that time.
CASE 2
A review of your practice’s patient registry reveals that Gladys P, age 55, is behind on breast and cervical cancer screening. She has had only a few sporadic office visits, the last of which was for bronchitis 18 months ago. At that time, the patient’s systolic BP was 162 mm Hg. You told her you would recheck it in 6 weeks, but she failed to return for follow-up.
Ms. P smokes, but has no other chronic diseases and takes no medications. There is no record of a mammogram or Pap smear, and you don’t know whether she sees a gynecologist routinely. Your office contacts her and discovers that you are the only doctor she sees. The patient tells the medical assistant who placed the call that her car broke down but she has not had money to repair or replace it, so she has had no way to get to your office.
Your staff arranges for her to get a ride from a community volunteer group, first to the nearby hospital for a mammogram and then to your office, where you perform a Pap smear and address her elevated BP and smoking. You are rewarded for the counseling and preventive care with a letter and a bonus check from Ms. P’s insurance carrier, congratulating you on your quality improvement efforts.
Growing emphasis on quality
Systemic changes in the US health care system are occurring rapidly, with an emphasis on quality and improved outcomes. Many physicians are now required to submit data to external agencies for payment, and much of the data is grounded in preventive standards. Medicare’s Physicians Quality Reporting System requires that all Medicare providers provide data on preventive and chronic illness care. Rates of vaccination, obesity screening, and tobacco use screening are examples of preventive services that will be reported publicly on the Centers for Medicare & Medicaid Services’ Physician Compare Web site.38
Physicians who work in accountable care organizations are required to meet quality standards on the delivery of certain preventive services, including breast cancer screening, colorectal cancer screening, influenza and pneumonia immunization, body mass index screening and follow-up, tobacco use screening and cessation intervention, screening for high blood pressure and followup, and screening for clinical depression and follow-up.39 As patients discover that the Affordable Care Act mandates that preventive services be covered with no cost sharing, they are likely to become more receptive to physician attempts to provide them.40,41
CORRESPONDENCE
Gerald Liu, MD, 1504 Springhill Avenue, Suite 3414, Mobile, AL 36604-3207; [email protected]
1. Han P. Historical changes in the objectives of the periodic health exam. Ann Intern Med. 1997;127:910-917.
2. Mehrota A, Zaslavsky A, Anyanian J. Preventive health examinations and preventive gynecologic examinations in the United States. Arch Intern Med. 2007;167:1876-1883.
3. Jean CR, Stange KC, Nutting PA. Competing demands of primary care: a model for the delivery of clinical preventive services. J Fam Pract. 1994;38:166-171.
4. McGinnis JM, Foege WH. The immediate versus the important. JAMA. 2004;291:1263-1264.
5. Crabtree BF, Miller WL, Tallia AF, et al. Delivery of clinical preventive services in family medicine offices. Ann Fam Med. 2005;3:430-435.
6. US Department of Health and Human Services. August 28, 2013. Healthy People 2020. Available at: www.healthypeople.gov. Accessed September 13, 2013.
7. Pollak KI, Krause KM, Yarnall KS, et al. Estimated time spent on preventive services by primary care physicians. BMC Health Serv Res. 2008;8:245.
8. US Preventive Services Task Force. Guide to Clinical Preventive Services. 2nd ed. Washington, DC: Office of Disease Prevention and Health Promotion; 1996.
9. Field MJ, Lohr KN, Committee to Advise the Public Health Service on Clinical Practice Guidelines, Institute of Medicine. Clinical Practice Guidelines: Directions for a New Program. Washington, DC: National Academies Press; 1990.
10. Yarnell K, Pollak K, Ostbye T, et al. Primary care: is there enough time for prevention? Am J Public Health. 2003;93:635-641.
11. Butler CC, Simpson SA, Hood K, et al. Training practitioners to deliver opportunistic multiple behaviour change counselling in primary care: a cluster randomized trial. BMJ. 2013;346:f1191.
12. Yonas M, Nowalk M, Zimmerman R, et al. Examining structural and clinical factors associated with implementation of standing orders for adult immunization. J Healthcare Qual. 2012;34:34-42.
13. Donahue K, Plescia M, Stafford K. Do standing orders help with chronic disease care and health maintenance in ambulatory practice? J Fam Pract. 2010;59:226-227.
14. Glasgow R, Orleans T, Wagner E. Does the chronic care model serve also as a template for improving prevention? Milbank Q. 2002;79.
15. Wagner EH. Chronic disease management: What will it take to improve care for chronic illness? Effective Clin Pract. 1998;1:2-4.
16. Barr V, Robinson S, Marin-Link B, et al. Chronic care model: an integration of concepts and strategies from population health promotion and the chronic care model. Hosp Q. 2003;7:73-83.
17. Bodenheimer T, Wagner EH, Grumbach K. Improving primary care for patients with chronic illness. JAMA. 2002;288:1775-1779.
18. Moore LG. Escaping the tyranny of the urgent by delivering planned care. Fam Pract Manage. 2006;13:37-40.
19. Tsai AC, Morton SC, Mangione CM, et al. A meta-analysis of interventions to improve care for chronic illnesses. Am J Managed Care. 2005;11:478-488.
20. Coleman K, Austin BT, Brach C, et al. Evidence on the chronic care model in the new millenium. Health Affairs. 2009;28:75-85.
21. Pearson ML, Mattke S, Shaw R, et al. Patient Self-Management Support Programs: An Evaluation. Final Contract Report. Publication No. 08-0011. Rockville, MD: Agency for Healthcare Research and Quality. November 2007.
22. Feder J. Restructuring care in a federally qualified health center to better meet patients’ needs. Health Affairs. 2011. Available at: http://content.healthaffairs.org/content/30/3/419.full.html. Accessed February 13, 2014.
23. Hung D, Rundall T, Tallia A, et al. Rethinking prevention in primary care: applying the chronic care model to address health risk behaviors. Milbank Q. 2007;85:69-91.
24. Lobach D, Sanders GD, Bright TJ, et al. Enabling Health Care Decisionmaking Through Clinical Decision Support and Knowledge Management. Evidence Report No. 203. Publication No. 12-E001-EF. Rockville, MD: Agency for Healthcare Research and Quality. April 2012.
25. Kawamoto K, Houlihan C, Balas E, et al. Improving clinical practice using clinical decision support systems: a systemic review of trials to identify features critical to success. BMJ. 2005;330:765.
26. American Academy of Family Physicians, American Academy of Pediatrics, American College of Physicians, American Osteopathic Association. Joint Principles of the Patient-Centered Medical Home. March 2007. American Academy of Family Physicians Web site. Available at: http://www.aafp.org/dam/AAFP/documents/practice_management/pcmh/initiatives/PCMHJoint.pdf. Accessed May 7, 2015.
27. Agency for Healthcare Research and Quality. The Patient-Centered Medical Home. Closing the Quality Gap: Revisiting the State of the Science: Evidence Report/Technology Assessment Executive Summary No. 208. Agency for Healthcare Research and Quality Web site. Available at: http://www.effectivehealthcare.ahrq.gov/ehc/products/391/1178/EvidReport208_CQGPatientCenteredMedicalHome_FinalReport_20120703.pdf. Accessed May 7, 2015.
28. Peikes D, Zutshi A, Genevro J, et al. Early Evidence on the Patient-Centered Medical Home. Final Report. Publication No. 12-0020-EF. Rockville, MD: Agency for Healthcare Research and Quality. February 2012.
29. Liu G, Perkins A. Using a lay cancer screening navigator to increase colorectal cancer screening rates. J Am Board Fam Med. 2015;28:280-282.
30. Baker N, Parsons M, Donnelly S, et al. Improving colon cancer screening rates in primary care: a pilot study emphasising the role of the medical assistant. Qual Saf Health Care. 2009;18:355-359.
31. Holden D, Jonas D, Portersfield D. Systematic review: enhancing the use and quality of colorectal cancer screening. Ann Intern Med. 2010;152:668-676.
32. Dexheimer JW, Talbot TR, Sanders DL, et al. Prompting clinicians about preventive care measures: a systematic review of randomized controlled trials. J Am Med Inf Assoc. 2008;15:311-320.
33. Shea S, DuMouchel W, Bahamonde L. A meta-analysis of 16 randomized controlled trials to evaluate computer-based clinical reminder systems for preventive care in the ambulatory setting. J Am Med Inf Assoc. 1996;3:399-409.
34. Chaudhry B, Wang J, Wu S, et al. Systematic review: impact of health information technology on quality, efficiency, and costs of medical care. Ann Intern Med. 2006;144:742-752.
35. Future of Family Medicine Leadership Committee. The future of family medicine: a collaborative project of the family medicine community. Ann Fam Med. 2004;2(Suppl 1):S3-S32.
36. Porterfield D, Hinnant L, Kane H, et al. Linkages Between Clinical Practices and Community Organizations for Prevention: Final Report. Rockville, MD: Agency for Healthcare Research and Quality. October 2010.
37. deBeaumont Foundation, Duke Community and Family Medicine, Centers for Disease Control and Prevention. A Practical Playbook. Available at: https://practicalplaybook.org. Accessed March 29, 2015.
38. Physician Quality Reporting System. Centers for Medicare and Medicaid Services. Available at: http://www.cms.gov/Medicare/Quality-Initiatives-Patient-Assessment-Instruments/PQRS. Accessed March 29, 2015.
39. RTI International. Accountable Care Organization 2014 Program Analysis Quality Performance Standards Narrative Measure Specifications. 2014. Centers for Medicare and Medicaid Services Web site. Available at: http://www.cms.gov/Medicare/Medicare-Feefor-Service-Payment/sharedsavingsprogram/Downloads/ACONarrativeMeasures-Specs.pdf. Accessed May 7, 2015.
40. Koh K, Sebelius K. Promoting prevention through the Affordable Care Act. N Engl J Med. 2010;363:1296-1299.
41. Rosenbaum S. The patient protection and affordable care act: Implications for public health policy and practice. Public Health Rep. 2011;126:130-135.
› Avoid scheduling annual visits exclusively for preventive care. A
› Institute simple practice changes to improve the preventive services you provide, such as implementing standing orders for influenza vaccines. A
› Adopt components of the chronic care model for preventive services wherever possible—using ancillary providers to remind patients to undergo colorectal cancer screening and recommending apps that support self-management, for example. A
Strength of recommendation (SOR)
A Good-quality patient-oriented evidence
B Inconsistent or limited-quality patient-oriented evidence
C Consensus, usual practice, opinion, disease-oriented evidence, case series
For well over a century, the periodic health exam has been associated with the delivery of preventive services1—a model widely accepted by physicians and patients alike. Approximately 8% of ambulatory care visits are for check-ups, and more than 20% of US residents schedule a health exam annually.2
Periodic health exams, however, do not result in optimal preventive care. Evidence suggests that important preventive services, such as dietary counseling, occur at only 8% of such visits; that just 10 seconds, on average, is devoted to smoking cessation; and that 80% of the preventive services patients receive are delivered outside of scheduled health exams.2 Because physicians and patients alike understandably prioritize acute problems, any discussion of health maintenance issues during a periodic check-up is likely to occur despite the visit’s agenda, not as part of it.3-7
Primary care physicians and practices are increasingly being held accountable for their performance on preventive measures. With that in mind, being familiar with evidence-based guidelines relating to the delivery of preventive services in ambulatory care settings, such as those developed by the US Preventive Services Task Force (USPSTF),8 is crucial. Identifying elements of the chronic care model that can be effectively applied to preventive care—and recognizing that the reactive acute care model is ineffective for both chronic illness and preventive services—is essential, as well.
Preventive care that's evidence-based
Good practice guidelines should have the following features, according to the Institute of Medicine:9
• Validity. Application would lead to the desired health and cost outcomes.
• Reliability/reproducibility. Others using the same data/interpretation would reach the same conclusion.
• Clinical applicability. Patient populations are appropriately defined.
• Clinical flexibility. Known or generally expected exceptions are identified.
• Clarity. Guideline uses unambiguous language with precise definitions.
• Multidisciplinary process. Developed with the participation of all key stakeholders.
• Scheduled review. Periodically reviewed and revised to incorporate new evidence/changing consensus.
• Documentation. Procedures used in development are well documented.
The USPSTF guidelines are consistent with these attributes.8
Some brief interventions fail
Guidelines are useful as practice standards for establishing preventive care goals, but their existence alone does not ensure the delivery of high-quality preventive services in an office setting. One key factor is time. It is estimated that a primary care physician with an average-sized patient panel would require an additional 7.4 hours per day to achieve 100% compliance with all of the USPSTF recommendations.10
Counseling, in particular, is an intervention that may be more effective in theory than in practice. Evidence suggests that even when primary care providers are trained in preventive counseling (and many are not), many brief interventions are not effective at creating sustained behavior change or health improvement.11
Others are effective
That’s not to say that there’s little that can be done. Use of standing orders for influenza vaccination is one example of an effective and easily implemented preventive measure that requires little or no additional physician time. Yet some doctors are resistant, fearing loss of control or lawsuits. In fact, the National Vaccine Injury Compensation Program specifically provides protection against vaccinerelated malpractice claims.12 A standing order for office staff to arrange a screening mammogram is another effective intervention; it has been shown to improve screening rates by as much as 30%.13
Lessons from chronic illness management
Chronic illness care and preventive care have much in common.14 Both acknowledge the need for proactive screening and counseling to bring about behavior change. In addition, both require ongoing care and follow-up, as well as depend on links to community resources. And finally, both are resource-intensive—too resource-intensive, some say, to be delivered in a cost-effective manner.
The Chronic Care Model has been proposed as a framework for improving preventive services (TABLE).15,16 Evidence suggests adopting some key components of chronic care can lead to significant gains in the delivery of preventive care, with the largest improvement seen when multiple components are used simultaneously.17-20
Self-management support. A growing body of evidence shows that self-management activities are associated with improved outcomes.21 Instituting a peer support group for pregnant women at a federally qualified health center, for example, led to a 7% absolute risk reduction in preterm births.22
Not all efforts to encourage self-management are effective, however, and evaluation is crucial to determine what works. In one large-scale trial, the use of patient reminder cards to facilitate a reduction in health risk behaviors such as tobacco use, risky drinking, unhealthy dietary patterns, and physical inactivity led to fewer health risk assessments being performed, fewer individual counseling encounters, and no change in these behaviors.23
Decision support. Clinical decision support systems, which generate patient-specific evidence-based assessments and/or recommendations that are actionable as part of the workflow at the point of care, have been found to improve care.24,25 An example of this is a prompt that reminds the physician to discuss chemoprevention with a patient at high risk for breast cancer.
Delivery system design. The patient-centered medical home (PCMH) is a well-known example of a redesign of health care delivery.26 Conversion to this model is associated with a small positive effect on preventive interventions.27 However, the persistence of a fee-for-service payment system—which does not include physician reimbursement for some of the added services incorporated into the PCMH—limits the implementation of the PCMH model.28
Many practices are improving health care delivery by using nonphysicians for various tasks related to preventive care. Care managers, for example, typically have smaller caseloads and focus on reducing unnecessary treatment for patients with high-risk conditions, such as congestive heart failure, while patient navigators generally have less clinical expertise but more knowledge of community services.
In one study, practice-initiated phone conversations with nonphysicians increased colorectal cancer screening by up to 40%.29 And in one pilot program, the use of ancillary providers led to an increase in colorectal cancer screening by as much as 123%.30 The human touch seems to be key to the success of these interventions. Passive reminders, such as videos being shown on waiting room televisions, have not proven to be effective.31
Clinical information systems. Early on, the power of electronic health records (EHRs) to improve practices’ delivery of preventive services was recognized. As early as 1995, the use of a reminder system to highlight such services during acute care visits was linked to improvements in counseling about smoking cessation and higher rates of cervical cancer screening, among other preventive measures.32,33 Overall, the use of EHRs alone has been shown to improve rates of preventive services by as much as 66%, with most practices reporting improvements of at least 20%.34
Today, EHRs that are Meaningful Use Stage 2-compliant have the tools needed to improve care. Requirements include the ability to generate patient registries of all those with a given disease and to identify patients on the registry who have not received needed care.35 To improve preventive care, registries should focus on the mitigation of risk factors, such as identifying—and contacting—patients with diabetes who are in need of, or overdue for, an annual eye exam.
Trials using the registry function, in combination with automated messaging to deliver targeted information to various patient groups (identified by the demographic information available from the EHR), are ongoing.
Community resources. Many clinicians have informal referral relationships with community organizations, such as the YMCA. Physician practices that establish links to community resources have the potential to have a large effect on unhealthy behaviors. (See “Putting theory into practice: 2 cases”.) However, a systematic review found that, while evidence to support such connections is mainly positive, research is limited and further evaluation is needed.36
The Practical Playbook (practicalplaybook.org)37 developed by the deBeaumont Foundation, Duke Department of Community and Family Medicine, and the Centers for Disease Control and Prevention, offers concrete examples of how physician practices are linking with community resources to improve the health of the population. For example, Duke University’s “Just for Us” program provides in-home chronic illness care to 350 high-risk elderly individuals. The LATCH program connects thousands of Latino immigrants to health care services and culturally and linguistically appropriate health education classes.37
CASE 1
Dominic B, a 53-year-old patient, has scheduled a visit for a cough that has persisted for 4 weeks. The patient is a nonsmoker, is married, and has no first-degree relatives with cancer. But when you review his chart before the visit, you note that he missed his 6-month check-up for hypertension and hyperlipidemia. In addition, your electronic health record (EHR ) flags the fact that he has not undergone colorectal screening and that his immunizations are not current. Because you have standing orders in place, your medical assistant gives him a flu shot and a pamphlet providing information on colorectal cancer screening before you enter the room.
During the visit, Mr. B mentions that his father, age 82, recently had a heart attack. This event—reinforced by the postcards and phone messages he received from your office after he missed his 6-month follow-up—prompted him to reluctantly admit it was “time for a check-up.” You take the patient’s blood pressure (BP) and review his lipid panel (blood work was ordered prior to his visit) with him. He is relieved to know that he will not need to be on a statin and agrees to be screened for colorectal cancer using a sensitive stool study.
Before he leaves, the patient requests medication for erectile dysfunction—a problem he never reported before. You ask him to keep a diary and return in 2 months, and promise to discuss his erectile dysfunction at that time.
CASE 2
A review of your practice’s patient registry reveals that Gladys P, age 55, is behind on breast and cervical cancer screening. She has had only a few sporadic office visits, the last of which was for bronchitis 18 months ago. At that time, the patient’s systolic BP was 162 mm Hg. You told her you would recheck it in 6 weeks, but she failed to return for follow-up.
Ms. P smokes, but has no other chronic diseases and takes no medications. There is no record of a mammogram or Pap smear, and you don’t know whether she sees a gynecologist routinely. Your office contacts her and discovers that you are the only doctor she sees. The patient tells the medical assistant who placed the call that her car broke down but she has not had money to repair or replace it, so she has had no way to get to your office.
Your staff arranges for her to get a ride from a community volunteer group, first to the nearby hospital for a mammogram and then to your office, where you perform a Pap smear and address her elevated BP and smoking. You are rewarded for the counseling and preventive care with a letter and a bonus check from Ms. P’s insurance carrier, congratulating you on your quality improvement efforts.
Growing emphasis on quality
Systemic changes in the US health care system are occurring rapidly, with an emphasis on quality and improved outcomes. Many physicians are now required to submit data to external agencies for payment, and much of the data is grounded in preventive standards. Medicare’s Physicians Quality Reporting System requires that all Medicare providers provide data on preventive and chronic illness care. Rates of vaccination, obesity screening, and tobacco use screening are examples of preventive services that will be reported publicly on the Centers for Medicare & Medicaid Services’ Physician Compare Web site.38
Physicians who work in accountable care organizations are required to meet quality standards on the delivery of certain preventive services, including breast cancer screening, colorectal cancer screening, influenza and pneumonia immunization, body mass index screening and follow-up, tobacco use screening and cessation intervention, screening for high blood pressure and followup, and screening for clinical depression and follow-up.39 As patients discover that the Affordable Care Act mandates that preventive services be covered with no cost sharing, they are likely to become more receptive to physician attempts to provide them.40,41
CORRESPONDENCE
Gerald Liu, MD, 1504 Springhill Avenue, Suite 3414, Mobile, AL 36604-3207; [email protected]
1. Han P. Historical changes in the objectives of the periodic health exam. Ann Intern Med. 1997;127:910-917.
2. Mehrota A, Zaslavsky A, Anyanian J. Preventive health examinations and preventive gynecologic examinations in the United States. Arch Intern Med. 2007;167:1876-1883.
3. Jean CR, Stange KC, Nutting PA. Competing demands of primary care: a model for the delivery of clinical preventive services. J Fam Pract. 1994;38:166-171.
4. McGinnis JM, Foege WH. The immediate versus the important. JAMA. 2004;291:1263-1264.
5. Crabtree BF, Miller WL, Tallia AF, et al. Delivery of clinical preventive services in family medicine offices. Ann Fam Med. 2005;3:430-435.
6. US Department of Health and Human Services. August 28, 2013. Healthy People 2020. Available at: www.healthypeople.gov. Accessed September 13, 2013.
7. Pollak KI, Krause KM, Yarnall KS, et al. Estimated time spent on preventive services by primary care physicians. BMC Health Serv Res. 2008;8:245.
8. US Preventive Services Task Force. Guide to Clinical Preventive Services. 2nd ed. Washington, DC: Office of Disease Prevention and Health Promotion; 1996.
9. Field MJ, Lohr KN, Committee to Advise the Public Health Service on Clinical Practice Guidelines, Institute of Medicine. Clinical Practice Guidelines: Directions for a New Program. Washington, DC: National Academies Press; 1990.
10. Yarnell K, Pollak K, Ostbye T, et al. Primary care: is there enough time for prevention? Am J Public Health. 2003;93:635-641.
11. Butler CC, Simpson SA, Hood K, et al. Training practitioners to deliver opportunistic multiple behaviour change counselling in primary care: a cluster randomized trial. BMJ. 2013;346:f1191.
12. Yonas M, Nowalk M, Zimmerman R, et al. Examining structural and clinical factors associated with implementation of standing orders for adult immunization. J Healthcare Qual. 2012;34:34-42.
13. Donahue K, Plescia M, Stafford K. Do standing orders help with chronic disease care and health maintenance in ambulatory practice? J Fam Pract. 2010;59:226-227.
14. Glasgow R, Orleans T, Wagner E. Does the chronic care model serve also as a template for improving prevention? Milbank Q. 2002;79.
15. Wagner EH. Chronic disease management: What will it take to improve care for chronic illness? Effective Clin Pract. 1998;1:2-4.
16. Barr V, Robinson S, Marin-Link B, et al. Chronic care model: an integration of concepts and strategies from population health promotion and the chronic care model. Hosp Q. 2003;7:73-83.
17. Bodenheimer T, Wagner EH, Grumbach K. Improving primary care for patients with chronic illness. JAMA. 2002;288:1775-1779.
18. Moore LG. Escaping the tyranny of the urgent by delivering planned care. Fam Pract Manage. 2006;13:37-40.
19. Tsai AC, Morton SC, Mangione CM, et al. A meta-analysis of interventions to improve care for chronic illnesses. Am J Managed Care. 2005;11:478-488.
20. Coleman K, Austin BT, Brach C, et al. Evidence on the chronic care model in the new millenium. Health Affairs. 2009;28:75-85.
21. Pearson ML, Mattke S, Shaw R, et al. Patient Self-Management Support Programs: An Evaluation. Final Contract Report. Publication No. 08-0011. Rockville, MD: Agency for Healthcare Research and Quality. November 2007.
22. Feder J. Restructuring care in a federally qualified health center to better meet patients’ needs. Health Affairs. 2011. Available at: http://content.healthaffairs.org/content/30/3/419.full.html. Accessed February 13, 2014.
23. Hung D, Rundall T, Tallia A, et al. Rethinking prevention in primary care: applying the chronic care model to address health risk behaviors. Milbank Q. 2007;85:69-91.
24. Lobach D, Sanders GD, Bright TJ, et al. Enabling Health Care Decisionmaking Through Clinical Decision Support and Knowledge Management. Evidence Report No. 203. Publication No. 12-E001-EF. Rockville, MD: Agency for Healthcare Research and Quality. April 2012.
25. Kawamoto K, Houlihan C, Balas E, et al. Improving clinical practice using clinical decision support systems: a systemic review of trials to identify features critical to success. BMJ. 2005;330:765.
26. American Academy of Family Physicians, American Academy of Pediatrics, American College of Physicians, American Osteopathic Association. Joint Principles of the Patient-Centered Medical Home. March 2007. American Academy of Family Physicians Web site. Available at: http://www.aafp.org/dam/AAFP/documents/practice_management/pcmh/initiatives/PCMHJoint.pdf. Accessed May 7, 2015.
27. Agency for Healthcare Research and Quality. The Patient-Centered Medical Home. Closing the Quality Gap: Revisiting the State of the Science: Evidence Report/Technology Assessment Executive Summary No. 208. Agency for Healthcare Research and Quality Web site. Available at: http://www.effectivehealthcare.ahrq.gov/ehc/products/391/1178/EvidReport208_CQGPatientCenteredMedicalHome_FinalReport_20120703.pdf. Accessed May 7, 2015.
28. Peikes D, Zutshi A, Genevro J, et al. Early Evidence on the Patient-Centered Medical Home. Final Report. Publication No. 12-0020-EF. Rockville, MD: Agency for Healthcare Research and Quality. February 2012.
29. Liu G, Perkins A. Using a lay cancer screening navigator to increase colorectal cancer screening rates. J Am Board Fam Med. 2015;28:280-282.
30. Baker N, Parsons M, Donnelly S, et al. Improving colon cancer screening rates in primary care: a pilot study emphasising the role of the medical assistant. Qual Saf Health Care. 2009;18:355-359.
31. Holden D, Jonas D, Portersfield D. Systematic review: enhancing the use and quality of colorectal cancer screening. Ann Intern Med. 2010;152:668-676.
32. Dexheimer JW, Talbot TR, Sanders DL, et al. Prompting clinicians about preventive care measures: a systematic review of randomized controlled trials. J Am Med Inf Assoc. 2008;15:311-320.
33. Shea S, DuMouchel W, Bahamonde L. A meta-analysis of 16 randomized controlled trials to evaluate computer-based clinical reminder systems for preventive care in the ambulatory setting. J Am Med Inf Assoc. 1996;3:399-409.
34. Chaudhry B, Wang J, Wu S, et al. Systematic review: impact of health information technology on quality, efficiency, and costs of medical care. Ann Intern Med. 2006;144:742-752.
35. Future of Family Medicine Leadership Committee. The future of family medicine: a collaborative project of the family medicine community. Ann Fam Med. 2004;2(Suppl 1):S3-S32.
36. Porterfield D, Hinnant L, Kane H, et al. Linkages Between Clinical Practices and Community Organizations for Prevention: Final Report. Rockville, MD: Agency for Healthcare Research and Quality. October 2010.
37. deBeaumont Foundation, Duke Community and Family Medicine, Centers for Disease Control and Prevention. A Practical Playbook. Available at: https://practicalplaybook.org. Accessed March 29, 2015.
38. Physician Quality Reporting System. Centers for Medicare and Medicaid Services. Available at: http://www.cms.gov/Medicare/Quality-Initiatives-Patient-Assessment-Instruments/PQRS. Accessed March 29, 2015.
39. RTI International. Accountable Care Organization 2014 Program Analysis Quality Performance Standards Narrative Measure Specifications. 2014. Centers for Medicare and Medicaid Services Web site. Available at: http://www.cms.gov/Medicare/Medicare-Feefor-Service-Payment/sharedsavingsprogram/Downloads/ACONarrativeMeasures-Specs.pdf. Accessed May 7, 2015.
40. Koh K, Sebelius K. Promoting prevention through the Affordable Care Act. N Engl J Med. 2010;363:1296-1299.
41. Rosenbaum S. The patient protection and affordable care act: Implications for public health policy and practice. Public Health Rep. 2011;126:130-135.

Tips for assessing, managing temper tantrums
Concerns about tantrums come up a lot in pediatric care. We all know about telling parents to ignore tantrums in toddlers and not to give in. But what about when this advice does not work?
I like to think of tantrums as emotions that go beyond the child’s control. This reframing helps families consider that not all tantrums are an attempt by the child to manipulate them. That is an important first step in avoiding a solely punitive response and instead encouraging parents to look for the source of the imbalance.
Temper tantrums are most common when a child is making developmental spurts in abilities or thinking that are typically unevenly matched with self-control. There is a lot of unevenness in children’s ability to do, say, or tolerate feelings between the early tantrums of the 9-month-old until the greater coping of the 6-year-old. For example, 87% of 18- to 24-month-olds have tantrums just as they acquire autonomy and some language, yet can’t really speak their feelings, while 91% of 30- to 36-month-olds have tantrums because they can imagine big things, but are only capable of or allowed small ones. Even at 42-48 months, more than half have tantrums, which often are associated with the stress and fatigue from dropping their nap.
Life is frustrating for kids. Young children want to try to use their new skills such as climbing, opening things, or scribbling, but parents – at first delighted – suddenly want them to stop! At first, every new word is celebrated, but then toddler talk gets routine, and toddlers may be ignored or even shushed. When the child has a strong desire, the words may not be there, or emotions may make it hard to talk at all, leading to frustration.
With the development of a sense of self, the song is “I want,” “mine,” and “no!” Sharing is not in the child’s repertoire until age 3 years or older. Temperamentally more intense children give up less easily or are not readily distracted.
The threshold for frustration depends on the child’s overall state. Is the child hungry? Tired? Stressed? In pain? Here is where the differential diagnosis of excessive tantrums needs to also include pain from a medical condition such as celiac disease, arthritis, migraine, or sickle cell disease. Children under age 7 years commonly have a low tolerance for sensations as simple as loud noises and elastic waistbands, but those with sensory integration disorder are at the extreme in what sounds, feelings, or motions they cannot bear at any age and may need specific intervention by occupational or physical therapists. Mental health conditions such as attention-deficit/hyperactivity disorder, depression, anxiety, and bipolar disorder also predispose to irritable responses to even normal stresses, often in combination with lagging skills and poor sleep. Consider these when tantrums are extreme.

An age period of tantrums may be expected and accepted by parents, thus the name “terrible twos,” but if tantrums persist, they can wear out even a patient parent. Signs that a child’s tantrums are beyond the usual range include a frequency of more than once a day, a duration of more than the typical 5 minutes, or persistence after age 6 years. When you are asked if a child’s tantrums are “normal,” these are useful parameters. It also helps to explain to parents the natural course of anger arousal that starts with a trigger, peaks within 3 minutes, then subsides rapidly (usually a total of 90 seconds), and although starting with anger, ends up with sadness. Asking parents to collect this information helps them avoid interfering with or reinforcing tantrums.
Understanding the child’s temperament and needs, and avoiding triggers, can prevent many tantrums. What was she doing just before the tantrum started? What were the triggers such as fatigue, hunger, inability to express herself, or a buildup of jealousy from repeated sibling intrusions? Are there skill deficits setting him off, especially fine motor or language delays? Management then needs to focus on avoiding these triggers, if possible, and diagnosing and treating developmental delays.
Next, parents can try to distract by jollying, making a joke, or singing. These are useful moments of modeling. Some parents are worried that distracting the child with something more fun to do will interfere with his learning to cope. If distraction works, they should use it!
Often nothing works, and the child has to explode and recover on her own. Talking, cajoling, or scolding during the fit is useless – like trying to squash dynamite after the flame has hit the powder.
While standing by silently ignoring tantrums is usually the fastest way to reduce them, some children calm down faster if held. This does not reinforce the fits as long as the child’s demand is not fulfilled. Instead, it lends adult “ego support” to reassure the child that all is well and life goes on. Children quickly go from angry to sad; older children are even embarrassed by their loss of control. Comfort is appropriate and kind, as long as at least one parent can do this authentically.
Point out that frustrations in small doses are crucial for learning frustration tolerance. Parents who overprotect their child from any little stress to avoid fits is doing him a disservice. Instead, attention, praise, or marks for little bits of self-control effort or for “using your words” builds self-control over time. Times of transitions such as coming for dinner or going to brush teeth are often times of tantrums; these deserve a 2-minute warning and praise or marks for success in “moving on.”(Stopping electronics without a fit is another . Hint: If the child has a fit, he gets no electronics the next day.)
Adult management may be reinforcing tantrums. When parents give the child what she was screaming for, or remove a demand – such as to take a bath – that had sparked a fit, they can count on having an even worse reaction the next time.
I coach parents to think together about the six main things that set off their child’s tantrums and decide in advance on which ones they will hold their ground. Then, when the child just begins to beg for that snack, the parent should decide instantly if this is a “yes” or a “no” (aiming for more yeses). Parental “giving in” before a tantrum starts models positive flexibility for the child and avoids reinforcement. When an event on the “no” list comes up, both parents are then better able to have an unequivocal response and then walk away.
“But when should we teach him a lesson?” parents often ask. If parents interpret a tantrum as manipulative, a moral failing, or an evil tendency, they tend to react with anger and even loss of control themselves. Be alert for risks of excessive punishment in these cases. Not only is their response a poor model and scary for the child, it can even become an exciting, reinforcing display. If parents are depressed or tend to ignore the child as a norm, it may be worth it to the child to throw a fit to bring them to life. You can emphasize that positive attention to good behavior and silent ignoring of fits is more effective and avoids these side effects.
Parents may experience tantrums as a battle of wills that they are not willing to lose, imagining a future rebellious teen. They need education on the normal imbalances of childhood and on both prevention and intervention strategies. What they can lose in the present is their child’s confidence in adult kindness, the opportunity to model flexibility and self-control, and a relationship with their child that conveys acceptance.
Dr. Howard is assistant professor of pediatrics at the Johns Hopkins University School of Medicine, Baltimore, and creator of CHADIS (www.CHADIS.com). She has no other relevant disclosures. Dr. Howard’s contribution to this publication was as a paid expert to Frontline Medical Communications.
Concerns about tantrums come up a lot in pediatric care. We all know about telling parents to ignore tantrums in toddlers and not to give in. But what about when this advice does not work?
I like to think of tantrums as emotions that go beyond the child’s control. This reframing helps families consider that not all tantrums are an attempt by the child to manipulate them. That is an important first step in avoiding a solely punitive response and instead encouraging parents to look for the source of the imbalance.
Temper tantrums are most common when a child is making developmental spurts in abilities or thinking that are typically unevenly matched with self-control. There is a lot of unevenness in children’s ability to do, say, or tolerate feelings between the early tantrums of the 9-month-old until the greater coping of the 6-year-old. For example, 87% of 18- to 24-month-olds have tantrums just as they acquire autonomy and some language, yet can’t really speak their feelings, while 91% of 30- to 36-month-olds have tantrums because they can imagine big things, but are only capable of or allowed small ones. Even at 42-48 months, more than half have tantrums, which often are associated with the stress and fatigue from dropping their nap.
Life is frustrating for kids. Young children want to try to use their new skills such as climbing, opening things, or scribbling, but parents – at first delighted – suddenly want them to stop! At first, every new word is celebrated, but then toddler talk gets routine, and toddlers may be ignored or even shushed. When the child has a strong desire, the words may not be there, or emotions may make it hard to talk at all, leading to frustration.
With the development of a sense of self, the song is “I want,” “mine,” and “no!” Sharing is not in the child’s repertoire until age 3 years or older. Temperamentally more intense children give up less easily or are not readily distracted.
The threshold for frustration depends on the child’s overall state. Is the child hungry? Tired? Stressed? In pain? Here is where the differential diagnosis of excessive tantrums needs to also include pain from a medical condition such as celiac disease, arthritis, migraine, or sickle cell disease. Children under age 7 years commonly have a low tolerance for sensations as simple as loud noises and elastic waistbands, but those with sensory integration disorder are at the extreme in what sounds, feelings, or motions they cannot bear at any age and may need specific intervention by occupational or physical therapists. Mental health conditions such as attention-deficit/hyperactivity disorder, depression, anxiety, and bipolar disorder also predispose to irritable responses to even normal stresses, often in combination with lagging skills and poor sleep. Consider these when tantrums are extreme.
An age period of tantrums may be expected and accepted by parents, thus the name “terrible twos,” but if tantrums persist, they can wear out even a patient parent. Signs that a child’s tantrums are beyond the usual range include a frequency of more than once a day, a duration of more than the typical 5 minutes, or persistence after age 6 years. When you are asked if a child’s tantrums are “normal,” these are useful parameters. It also helps to explain to parents the natural course of anger arousal that starts with a trigger, peaks within 3 minutes, then subsides rapidly (usually a total of 90 seconds), and although starting with anger, ends up with sadness. Asking parents to collect this information helps them avoid interfering with or reinforcing tantrums.
Understanding the child’s temperament and needs, and avoiding triggers, can prevent many tantrums. What was she doing just before the tantrum started? What were the triggers such as fatigue, hunger, inability to express herself, or a buildup of jealousy from repeated sibling intrusions? Are there skill deficits setting him off, especially fine motor or language delays? Management then needs to focus on avoiding these triggers, if possible, and diagnosing and treating developmental delays.
Next, parents can try to distract by jollying, making a joke, or singing. These are useful moments of modeling. Some parents are worried that distracting the child with something more fun to do will interfere with his learning to cope. If distraction works, they should use it!
Often nothing works, and the child has to explode and recover on her own. Talking, cajoling, or scolding during the fit is useless – like trying to squash dynamite after the flame has hit the powder.
While standing by silently ignoring tantrums is usually the fastest way to reduce them, some children calm down faster if held. This does not reinforce the fits as long as the child’s demand is not fulfilled. Instead, it lends adult “ego support” to reassure the child that all is well and life goes on. Children quickly go from angry to sad; older children are even embarrassed by their loss of control. Comfort is appropriate and kind, as long as at least one parent can do this authentically.
Point out that frustrations in small doses are crucial for learning frustration tolerance. Parents who overprotect their child from any little stress to avoid fits is doing him a disservice. Instead, attention, praise, or marks for little bits of self-control effort or for “using your words” builds self-control over time. Times of transitions such as coming for dinner or going to brush teeth are often times of tantrums; these deserve a 2-minute warning and praise or marks for success in “moving on.”(Stopping electronics without a fit is another . Hint: If the child has a fit, he gets no electronics the next day.)
Adult management may be reinforcing tantrums. When parents give the child what she was screaming for, or remove a demand – such as to take a bath – that had sparked a fit, they can count on having an even worse reaction the next time.
I coach parents to think together about the six main things that set off their child’s tantrums and decide in advance on which ones they will hold their ground. Then, when the child just begins to beg for that snack, the parent should decide instantly if this is a “yes” or a “no” (aiming for more yeses). Parental “giving in” before a tantrum starts models positive flexibility for the child and avoids reinforcement. When an event on the “no” list comes up, both parents are then better able to have an unequivocal response and then walk away.
“But when should we teach him a lesson?” parents often ask. If parents interpret a tantrum as manipulative, a moral failing, or an evil tendency, they tend to react with anger and even loss of control themselves. Be alert for risks of excessive punishment in these cases. Not only is their response a poor model and scary for the child, it can even become an exciting, reinforcing display. If parents are depressed or tend to ignore the child as a norm, it may be worth it to the child to throw a fit to bring them to life. You can emphasize that positive attention to good behavior and silent ignoring of fits is more effective and avoids these side effects.
Parents may experience tantrums as a battle of wills that they are not willing to lose, imagining a future rebellious teen. They need education on the normal imbalances of childhood and on both prevention and intervention strategies. What they can lose in the present is their child’s confidence in adult kindness, the opportunity to model flexibility and self-control, and a relationship with their child that conveys acceptance.
Dr. Howard is assistant professor of pediatrics at the Johns Hopkins University School of Medicine, Baltimore, and creator of CHADIS (www.CHADIS.com). She has no other relevant disclosures. Dr. Howard’s contribution to this publication was as a paid expert to Frontline Medical Communications.
Cirrhosis complications: Keeping them under control
› Prescribe low-dose diuretics and recommend sodium restriction for patients with cirrhosis who have grade 2 (moderate) ascites. C
› Initiate treatment with beta-blockers to prevent variceal bleeding in all patients with medium or large varices, as well as in those with small varices who also have red wale signs and/or Child-Pugh Class B or C cirrhosis. A
› Consider evaluation for liver transplantation for a patient with cirrhosis who has experienced a major complication (eg, ascites, hepatic encephalopathy, or variceal hemorrhage) or one who has a model for end-stage liver disease (MELD) score ≥15. B
Strength of recommendation (SOR)
A Good-quality patient-oriented evidence
B Inconsistent or limited-quality patient-oriented evidence
C Consensus, usual practice, opinion, disease-oriented evidence, case series
CASE › Joe M, age 59, seeks care at the local emergency department (ED) for shortness of breath. He also complains that his abdomen has been getting “bigger and bigger.” The ED physician recognizes that he is suffering from cirrhosis with secondary ascites and admits him. A paracentesis is performed and 7 L of fluid are removed. The patient is started on furosemide 40 mg/d and the health care team educates him about the relationship between his alcohol consumption and his enlarging abdomen. At discharge, he is told to follow up with his primary care physician.
Two weeks later, the patient arrives at your clinic for followup. What is the next step in managing this patient?
Cirrhosis—the end stage of chronic liver disease characterized by inflammation and fibrosis—is a relatively common and often fatal diagnosis. In the United States, an estimated 633,000 adults have cirrhosis,1 and each year approximately 32,000 people die from the condition.2 The most common causes of cirrhosis are heavy alcohol use, chronic hepatitis B or C infection, nonalcoholic fatty liver disease, and nonalcoholic steatohepatitis.3 Cirrhosis typically involves degeneration and necrosis of hepatocytes, which are replaced by fibrotic tissues and regenerative nodules, leading to loss of liver function.4
Patients with cirrhosis can be treated as outpatients—that is, until they decompensate. Obviously, treatment specific to the underlying causes of cirrhosis, such as interferon for a patient with hepatitis and abstinence for a patient with alcohol-related liver disease, should be the first concern. However, this article focuses on the family physician’s role in identifying and treating several of the most common complications of cirrhosis, including ascites, variceal bleeding, hepatic encephalopathy, and hepatorenal syndrome. We will also cover which patients should be referred for evaluation for liver transplantation. (For a guide to providing patient education for individuals with cirrhosis, see “Dx cirrhosis: What to teach your patient”.3,5-10)
Sodium restriction, diuretics are first steps for ascites
The goals of ascites treatment are to prevent or relieve dyspnea and abdominal pain and to prevent life-threatening complications, such as spontaneous bacterial peritonitis (SBP) and hepatorenal syndrome.11 Patient education is key regarding weight gain; that’s why it’s important to instruct patients to contact you if they gain more than 2 lbs/d for 3 consecutive days or more than 10 lbs.12
Approximately 10% of patients with ascites respond well to sodium restriction alone (1500-2000 mg/d).11 In addition to sodium restriction, patients with grade 2 ascites (moderate ascites with proportionate abdominal distension) should receive a low-dose diuretic, such as spironolactone (initial dose, 50-100 mg/d; increase up to 200-300 mg/d)13 or amiloride (5-10 mg/d).5
Painful gynecomastia and hyperkalemia are the most common adverse effects of spironolactone.13 Amiloride has fewer adverse effects than spironolactone, but is less effective.11 Low-dose furosemide (20-40 mg/d) may be added, although weight loss should be monitored to watch for excessive diuresis, which can lead to renal failure, hyponatremia, or encephalopathy.5,13 Also monitor electrolytes to watch for hypokalemia or hyponatremia.13
Recommended weight loss to prevent renal failure is 300 to 500 g/d (.66-1.1 lbs/d) for patients without peripheral edema, and 800 to 1000 g/d (1.7-2.2 lbs/d) for patients with peripheral edema.5,13
Patients with grade 3 (tense) or refractory ascites should have large-volume paracentesis (LVP) plus an albumin infusion.5 LVP (removal of >5 L of fluid) is more effective, faster, and has less risk of adverse effects than increasing the dosage of the patient’s diuretic.5,13 LVP can be done in an outpatient setting and is considered safe—even for patients with a prolonged prothrombin time.13,14 Rare complications of LVP include significant bleeding at the puncture site, infection, and intestinal perforation.5
Diuretics should be prescribed after LVP to prevent ascites recurrence.5 Plasma expanders can prevent hepatorenal syndrome, ascites recurrence, and dilutional hyponatremia.5,11 Albumin is the most efficacious of these agents;5,14 it is administered intravenously at a dose of 8 to 10 g/L of fluid removed.13,15
Take steps to prevent variceal bleeding
Soon after a patient is diagnosed with cirrhosis, he or she should undergo esophagogastroduodenoscopy to screen for the presence and size of varices.16 Although they can’t prevent esophagogastric varices, nonselective beta-blockers (NSBBs) are the gold standard for preventing first variceal hemorrhage in patients with small varices with red wale signs on the varices and/or Child-Pugh Class B or C cirrhosis (TABLE17), and in all patients with medium or large varices.18 Propranolol is usually started at 20 mg BID, or nadolol is started at 20 to 40 mg/d.16 The NSBB dose is adjusted to the maximum tolerated dose, which occurs when the patient's heart rate is reduced to 55 to 60 beats/min.
NSBBs are associated with poor survival in patients with refractory ascites and thus are contraindicated in these patients.19 NSBBs also should not be taken by patients with SBP because use of these medications is associated with worse outcomes compared to those not receiving NSBBs.20
Endoscopic variceal ligation is an alternative to NSBBs for the primary prophylaxis of variceal hemorrhage in patients with medium to large varices.18 In particular, ligation should be considered for patients with high-risk varices in whom beta-blockers are contraindicated or must be discontinued because of adverse effects.21
Avoid nitrates in patients with varices because these agents do not prevent first variceal hemorrhage and have been associated with higher mortality rates in patients older than 50.16 There is no significant additional benefit or mortality reduction associated with adding a nitrate to an NSBB.22 Transjugular intrahepatic portosystemic shunt (TIPS) or surgically created shunts are reserved for patients for whom medical therapy fails.18
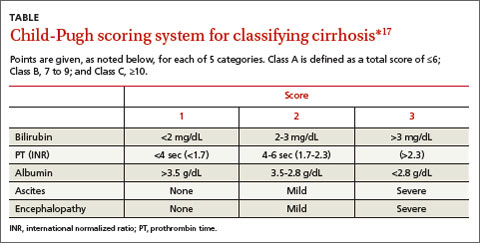
Mental status changes suggest hepatic encephalopathy
Hepatic encephalopathy is a reversible impairment of neuropsychiatric function that is associated with impaired hepatic function. Because a patient with encephalopathy presents with an altered mental status, he or she may need to be admitted to the hospital for evaluation, diagnosis, and treatment.
The goals of hepatic encephalopathy treatment are to identify and correct precipitating causes and lower serum ammonia concentrations to improve mental status.15 Nutritional support should be provided without protein restriction unless the patient is severely proteinintolerant.23 The recommended initial therapy is lactulose 30 to 45 mL 2 to 4 times per day, to decrease absorption of ammonia in the gut. The dose should be titrated until patients have 2 to 3 soft stools daily.24
For patients who can’t tolerate lactulose or whose mental status doesn’t improve within 48 hours, rifaximin 400 mg orally 3 times daily or 550 mg 2 times daily is recommended.25 Neomycin 500 mg orally 3 times a day or 1 g twice daily is a second-line agent reserved for patients who are unable to take rifaximin; however, its efficacy is not well established, and neomycin has been associated with ototoxicity and nephrotoxicity.24
Watch for signs of kidney failure
Hepatorenal syndrome is renal failure induced by severe hepatic injury and characterized by azotemia and decreased renal blood flow and glomerular filtration rate.15 It is a diagnosis of exclusion. Hepatorenal syndrome is typically caused by arterial vasodilation in the splanchnic circulation in patients with portal hypertension.15,26,27 Type 1 hepatorenal syndrome is characterized by at least a 2-fold increase in serum creatinine to a level of >2.5 mg/dL over more than 2 weeks. Patients typically have urine output <400 to 500 mL/d. Type 2 hepatorenal syndrome is characterized by less severe renal impairment; it is associated with ascites that does not improve with diuretics.28
Patients with hepatorenal syndrome should not use any nephrotoxic agents, such as nonsteroidal anti-inflammatory drugs. Inpatient treatment is usually required and may include norepinephrine with albumin, terlipressin with midodrine, or octreotide and albumin. Patients who fail to respond to medical therapy may benefit from TIPS as a bridge until they can undergo liver transplantation.29
When to consider liver transplantation
The appropriateness and timing of liver transplantation should be determined on a case-by-case basis. For some patients with cirrhosis, transplantation may be the definitive treatment. For example, in some patients with hepatocellular carcinoma (HCC), liver transplantation is an option because transplantation can cure the tumor and underlying cirrhosis. However, while transplantation is a suitable option for early HCC in patients with cirrhosis, it has been shown to have limited efficacy in patients with advanced disease who are not selected using specific criteria.30
Referral for evaluation for transplantation should be considered once a patient with cirrhosis experiences a major complication (eg, ascites, variceal hemorrhage, or hepatic encephalopathy).31 Another criterion for timing and allocation of liver transplantation is based on the statistical model for end-stage liver disease (MELD), which is used to predict 3-month survival in patients with cirrhosis based on the relationships between serum bilirubin, serum creatinine, and international normalized ratio values.15 Liver transplantation should be considered for patients with a MELD score ≥15.15,31 Such patients should be promptly referred to a liver transplantation specialist to allow sufficient time for the appropriate psychosocial assessments and medical evaluations, and for patients and their families to receive appropriate education on things like the risks and benefits of transplantation.15
Patients with cirrhosis should be educated about complications of their condition, including ascites, esophageal varices, hepatic encephalopathy, hepatorenal syndrome, spontaneous bacterial peritonitis, and hepatocellular carcinoma (HCC).5 It’s important to explain that they will need to be evaluated every 6 months with serology and ultrasound to assess disease changes.6 Annual screening for HCC should be done with ultrasound or computed tomography scanning with or without alpha-fetoprotein.6
Ensure that your patient knows that he needs to receive the recommended immunizations. The Centers for Disease Control and Prevention recommends that patients with cirrhosis should receive annual influenza, pneumococcal 23, and hepatitis A and B series vaccinations.7
Advise patients with cirrhosis to be cautious when taking any medications. Patients with cirrhosis should avoid nonsteroidal anti-inflammatory drugs because these medications encourage sodium retention, which can exacerbate ascites.6 Acetaminophen use is discouraged, but should not be harmful unless the patient takes >2 g/d.8
Emphasize the importance of eating a healthy diet. Malnutrition is common in patients with cirrhosis3 and correlates with more severe disease and poorer outcomes, including mortality.9 Nutritional recommendations for patients with alcohol-related liver disease include thiamine 50 mg orally or intramuscularly, and riboflavin and pyridoxine in the recommended daily doses.10 Advise patients to take other vitamins, as needed, to treat any deficiencies.9
CASE › After evaluating Mr. M, you prescribe spironolactone 100 mg/d and furosemide 40 mg twice a day to address ascites, and propranolol—which you titrate to 80 mg twice a day—to prevent variceal hemorrhage. Mr. M is maintained on these medications and returns with his daughter, as he has been doing every 2 to 3 months. He is excited that he breathes easily as long as he avoids salt and takes his medications. He continues to see his hepatologist regularly, and his last paracentesis was 4 months ago. He has not used any alcohol since he was taught about the relationship between alcohol and his breathing.
CORRESPONDENCE
Suzanne Minor, MD, FAAF P, Assistant Professor of Family Medicine, Department of Humanities, Health, & Society, Florida International University, Herbert Wertheim College of Medicine, 11200 SW 8th Street, AHC II, 554A, Miami, FL 33199; [email protected]
1. Scaglion S, Kliethermes S, Cao G, et al. The epidemiology of cirrhosis in the United States: A population-based study. J Clin Gastroenterol. 2014. October 8. [Epub ahead of print.]
2. Murphy SL, Xu JQ, Kochanek KD. Deaths: Final data for 2010. National Vital Statistics Reports. National Center for Health Statistics Web site. Available at: http://www.cdc.gov/nchs/data/nvsr/nvsr61/nvsr61_04.pdf. Accessed April 30, 2015.
3. National Institute of Diabetes and Digestive and Kidney Diseases. Cirrhosis. National Institute of Diabetes and Digestive and Kidney Diseases Web site. Available at: http://www.niddk.nih.gov/health-information/health-topics/liver-disease/cirrhosis/Pages/facts.aspx. Accessed April 30, 2015.
4. Zhou WC, Zhang QB, Qiao L. Pathogenesis of liver cirrhosis. World J Gastroenterol. 2014;20:7312-7324.
5. Ginès P, Cárdenas A, Arroyo V, et al. Management of cirrhosis and ascites. N Eng J Med. 2004;350:1646-1654.
6. Grattagliano I, Ubaldi E, Bonfrate L, et al. Management of liver cirrhosis between primary care and specialists. World J Gastroenterol. 2011;17:2273-2282.
7. Centers for Disease Control and Prevention. 2015 recommended immunizations for adults: By age. Centers for Disease Control and Prevention Web site. Available from: http://www.cdc.gov/vaccines/schedules/downloads/adult/adult-schedule-easy-read.pdf. Accessed April 28, 2015.
8. Bacon BR. Cirrhosis and its complications. In: Fauci AS, Braunwald E, Kasper DL, et al, eds. Harrison’s Principles of Internal Medicine. 18th ed. New York, NY: McGraw-Hill; 2012. Available from: http://accessmedicine.mhmedical.com/content.aspx?bookid=1130§ionid=79748841. Accessed April 28, 2015.
9. O’Shea RS, Dasarathy S, McCullough AJ. Alcoholic liver disease. Am J Gastroenterol. 2010;105:14-32.
10. National Institute on Alcohol Abuse and Alcoholism. Alcohol Alert. Alcoholic liver disease. U.S. Department of Health & Human Services. 2005. National Institute on Alcohol Abuse and Alcoholism Web site. Available at: http://pubs.niaaa.nih.gov/publications/aa64/aa64.htm. Accessed April 18, 2015.
11. Kashani A, Landaverde C, Medici V, et al. Fluid retention in cirrhosis: pathophysiology and management. QJM. 2008;101:71-85.
12. Chalasani NP, Vuppalanchi RK. Ascites: A common problem in people with cirrhosis. July 2013. American College of Gastroenterology Web site. Available at: http://patients.gi.org/topics/ascites/. Accessed April 28, 2015.
13. Kuiper JJ, van Buuren HR, de Man RA. Ascites in cirrhosis: a review of management and complications. Neth J Med. 2007;65:283-288.
14. Biecker E. Diagnosis and therapy of ascites in liver cirrhosis. World J Gastroentol. 2011;17:1237-1248.
15. Heidelbaugh JJ, Sherbondy M. Cirrhosis and chronic liver failure: Part II. Complications and treatment. Am Fam Physician. 2006;74:767-776.
16. Garcia-Tsao G, Lim JK; Members of Veterans Affairs Hepatitis C Resource Center Program. Management and treatment of patients with cirrhosis and portal hypertension: recommendations from the Department of Veterans Affairs Hepatitis C Resource Center Program and the National Hepatitis C Program. Am J Gastroenterol. 2009;104:1802-1829.
17. Infante-Rivard C, Esnaola S, Villeneuve JP. Clinical and statistical validity of conventional prognostic factors in predicting shortterm survival among cirrhotics. Hepatology. 1987;7:660-664.
18. Garcia-Tsao G, Sanyal AJ, Grace ND, et al; Practice Guidelines Committee of the American Association for the Study of Liver Diseases; Practice Parameters Committee of the American College of Gastroenterology. Prevention and management of gastroesophageal varices and variceal hemorrhage in cirrhosis. Hepatology. 2007;46:922-938.
19. Serste T, Melot C, Francoz C, et al. Deleterious effects of betablockers on survival in patients with cirrhosis and refractory ascites. Hepatology. 2010;52:1017-1022.
20. Mandorfer M, Bota S, Schwabl P, et al. Nonselective b blockers increase risk for hepatorenal syndrome and death in patients with cirrhosis and spontaneous bacterial peritonitis. Gastroenterology. 2014;146:1680–1690.e1.
21. Sarin SK, Lamba GS, Kumar M, et al. Comparison of endoscopic ligation and propranolol for the primary prevention of variceal bleeding. N Engl J Med. 1999;340:988-993.
22. Garcia-Pagan JC, Feu F, Bosch J, et al. Propranolol compared with propranolol plus isosorbide-5-mononitrate for portal hypertension in cirrhosis. A randomized controlled study. Ann Intern Med. 1991;114:869-873.
23. Amodio P, Bemeur C, Butterworth R, et al. The nutritional management of hepatic encephalopathy in patients with cirrhosis: International Society for Hepatic Encephalopathy and Nitrogen Metabolism Consensus. Hepatology. 2013;58:325-336.
24. Sharma P, Sharma BC. Disaccharides in the treatment of hepatic encephalopathy. Metab Brain Dis. 2013;28:313-320.
25. Jiang Q, Jiang XH, Zheng MH, et al. Rifaximin versus nonabsorbable disaccharides in the management of hepatic encephalopathy: a meta-analysis. Eur J Gastroenterol Hepatol. 2008;20:1064-1070.
26. Ginès P, Schrier RW. Renal failure in cirrhosis. N Engl J Med. 2009;361:1279-1290.
27. Iwakiri Y. The molecules: mechanisms of arterial vasodilatation observed in the splanchnic and systemic circulation in portal hypertension. J Clin Gastroenterol. 2007;41(Suppl 3):S288-S294.
28. Epstein M, Berk DP, Hollenberg NK, et al. Renal failure in the patient with cirrhosis. The role of active vasoconstriction. Am J Med. 1970;49:175-185.
29. Singh V, Ghosh S, Singh B, et al. Noradrenaline vs. terlipressin in the treatment of hepatorenal syndrome: a randomized study. J Hepatol. 2012;56:1293-1298.
30. Chua TC, Saxena A, Chu F, et al. Hepatic resection for transplantable hepatocellular carcinoma for patients within Milan and UCSF criteria. Am J Clin Oncol. 2012;35:141-145.
31. Martin P, DiMartini A, Feng S, et al. Evaluation for liver transplantation in adults: 2013 practice guideline by the American Association for the Study of Liver Diseases and the American Society of Transplantation. Hepatology. 2014;59:1144-1165.
› Prescribe low-dose diuretics and recommend sodium restriction for patients with cirrhosis who have grade 2 (moderate) ascites. C
› Initiate treatment with beta-blockers to prevent variceal bleeding in all patients with medium or large varices, as well as in those with small varices who also have red wale signs and/or Child-Pugh Class B or C cirrhosis. A
› Consider evaluation for liver transplantation for a patient with cirrhosis who has experienced a major complication (eg, ascites, hepatic encephalopathy, or variceal hemorrhage) or one who has a model for end-stage liver disease (MELD) score ≥15. B
Strength of recommendation (SOR)
A Good-quality patient-oriented evidence
B Inconsistent or limited-quality patient-oriented evidence
C Consensus, usual practice, opinion, disease-oriented evidence, case series
CASE › Joe M, age 59, seeks care at the local emergency department (ED) for shortness of breath. He also complains that his abdomen has been getting “bigger and bigger.” The ED physician recognizes that he is suffering from cirrhosis with secondary ascites and admits him. A paracentesis is performed and 7 L of fluid are removed. The patient is started on furosemide 40 mg/d and the health care team educates him about the relationship between his alcohol consumption and his enlarging abdomen. At discharge, he is told to follow up with his primary care physician.
Two weeks later, the patient arrives at your clinic for followup. What is the next step in managing this patient?
Cirrhosis—the end stage of chronic liver disease characterized by inflammation and fibrosis—is a relatively common and often fatal diagnosis. In the United States, an estimated 633,000 adults have cirrhosis,1 and each year approximately 32,000 people die from the condition.2 The most common causes of cirrhosis are heavy alcohol use, chronic hepatitis B or C infection, nonalcoholic fatty liver disease, and nonalcoholic steatohepatitis.3 Cirrhosis typically involves degeneration and necrosis of hepatocytes, which are replaced by fibrotic tissues and regenerative nodules, leading to loss of liver function.4
Patients with cirrhosis can be treated as outpatients—that is, until they decompensate. Obviously, treatment specific to the underlying causes of cirrhosis, such as interferon for a patient with hepatitis and abstinence for a patient with alcohol-related liver disease, should be the first concern. However, this article focuses on the family physician’s role in identifying and treating several of the most common complications of cirrhosis, including ascites, variceal bleeding, hepatic encephalopathy, and hepatorenal syndrome. We will also cover which patients should be referred for evaluation for liver transplantation. (For a guide to providing patient education for individuals with cirrhosis, see “Dx cirrhosis: What to teach your patient”.3,5-10)
Sodium restriction, diuretics are first steps for ascites
The goals of ascites treatment are to prevent or relieve dyspnea and abdominal pain and to prevent life-threatening complications, such as spontaneous bacterial peritonitis (SBP) and hepatorenal syndrome.11 Patient education is key regarding weight gain; that’s why it’s important to instruct patients to contact you if they gain more than 2 lbs/d for 3 consecutive days or more than 10 lbs.12
Approximately 10% of patients with ascites respond well to sodium restriction alone (1500-2000 mg/d).11 In addition to sodium restriction, patients with grade 2 ascites (moderate ascites with proportionate abdominal distension) should receive a low-dose diuretic, such as spironolactone (initial dose, 50-100 mg/d; increase up to 200-300 mg/d)13 or amiloride (5-10 mg/d).5
Painful gynecomastia and hyperkalemia are the most common adverse effects of spironolactone.13 Amiloride has fewer adverse effects than spironolactone, but is less effective.11 Low-dose furosemide (20-40 mg/d) may be added, although weight loss should be monitored to watch for excessive diuresis, which can lead to renal failure, hyponatremia, or encephalopathy.5,13 Also monitor electrolytes to watch for hypokalemia or hyponatremia.13
Recommended weight loss to prevent renal failure is 300 to 500 g/d (.66-1.1 lbs/d) for patients without peripheral edema, and 800 to 1000 g/d (1.7-2.2 lbs/d) for patients with peripheral edema.5,13
Patients with grade 3 (tense) or refractory ascites should have large-volume paracentesis (LVP) plus an albumin infusion.5 LVP (removal of >5 L of fluid) is more effective, faster, and has less risk of adverse effects than increasing the dosage of the patient’s diuretic.5,13 LVP can be done in an outpatient setting and is considered safe—even for patients with a prolonged prothrombin time.13,14 Rare complications of LVP include significant bleeding at the puncture site, infection, and intestinal perforation.5
Diuretics should be prescribed after LVP to prevent ascites recurrence.5 Plasma expanders can prevent hepatorenal syndrome, ascites recurrence, and dilutional hyponatremia.5,11 Albumin is the most efficacious of these agents;5,14 it is administered intravenously at a dose of 8 to 10 g/L of fluid removed.13,15
Take steps to prevent variceal bleeding
Soon after a patient is diagnosed with cirrhosis, he or she should undergo esophagogastroduodenoscopy to screen for the presence and size of varices.16 Although they can’t prevent esophagogastric varices, nonselective beta-blockers (NSBBs) are the gold standard for preventing first variceal hemorrhage in patients with small varices with red wale signs on the varices and/or Child-Pugh Class B or C cirrhosis (TABLE17), and in all patients with medium or large varices.18 Propranolol is usually started at 20 mg BID, or nadolol is started at 20 to 40 mg/d.16 The NSBB dose is adjusted to the maximum tolerated dose, which occurs when the patient's heart rate is reduced to 55 to 60 beats/min.
NSBBs are associated with poor survival in patients with refractory ascites and thus are contraindicated in these patients.19 NSBBs also should not be taken by patients with SBP because use of these medications is associated with worse outcomes compared to those not receiving NSBBs.20
Endoscopic variceal ligation is an alternative to NSBBs for the primary prophylaxis of variceal hemorrhage in patients with medium to large varices.18 In particular, ligation should be considered for patients with high-risk varices in whom beta-blockers are contraindicated or must be discontinued because of adverse effects.21
Avoid nitrates in patients with varices because these agents do not prevent first variceal hemorrhage and have been associated with higher mortality rates in patients older than 50.16 There is no significant additional benefit or mortality reduction associated with adding a nitrate to an NSBB.22 Transjugular intrahepatic portosystemic shunt (TIPS) or surgically created shunts are reserved for patients for whom medical therapy fails.18
Mental status changes suggest hepatic encephalopathy
Hepatic encephalopathy is a reversible impairment of neuropsychiatric function that is associated with impaired hepatic function. Because a patient with encephalopathy presents with an altered mental status, he or she may need to be admitted to the hospital for evaluation, diagnosis, and treatment.
The goals of hepatic encephalopathy treatment are to identify and correct precipitating causes and lower serum ammonia concentrations to improve mental status.15 Nutritional support should be provided without protein restriction unless the patient is severely proteinintolerant.23 The recommended initial therapy is lactulose 30 to 45 mL 2 to 4 times per day, to decrease absorption of ammonia in the gut. The dose should be titrated until patients have 2 to 3 soft stools daily.24
For patients who can’t tolerate lactulose or whose mental status doesn’t improve within 48 hours, rifaximin 400 mg orally 3 times daily or 550 mg 2 times daily is recommended.25 Neomycin 500 mg orally 3 times a day or 1 g twice daily is a second-line agent reserved for patients who are unable to take rifaximin; however, its efficacy is not well established, and neomycin has been associated with ototoxicity and nephrotoxicity.24
Watch for signs of kidney failure
Hepatorenal syndrome is renal failure induced by severe hepatic injury and characterized by azotemia and decreased renal blood flow and glomerular filtration rate.15 It is a diagnosis of exclusion. Hepatorenal syndrome is typically caused by arterial vasodilation in the splanchnic circulation in patients with portal hypertension.15,26,27 Type 1 hepatorenal syndrome is characterized by at least a 2-fold increase in serum creatinine to a level of >2.5 mg/dL over more than 2 weeks. Patients typically have urine output <400 to 500 mL/d. Type 2 hepatorenal syndrome is characterized by less severe renal impairment; it is associated with ascites that does not improve with diuretics.28
Patients with hepatorenal syndrome should not use any nephrotoxic agents, such as nonsteroidal anti-inflammatory drugs. Inpatient treatment is usually required and may include norepinephrine with albumin, terlipressin with midodrine, or octreotide and albumin. Patients who fail to respond to medical therapy may benefit from TIPS as a bridge until they can undergo liver transplantation.29
When to consider liver transplantation
The appropriateness and timing of liver transplantation should be determined on a case-by-case basis. For some patients with cirrhosis, transplantation may be the definitive treatment. For example, in some patients with hepatocellular carcinoma (HCC), liver transplantation is an option because transplantation can cure the tumor and underlying cirrhosis. However, while transplantation is a suitable option for early HCC in patients with cirrhosis, it has been shown to have limited efficacy in patients with advanced disease who are not selected using specific criteria.30
Referral for evaluation for transplantation should be considered once a patient with cirrhosis experiences a major complication (eg, ascites, variceal hemorrhage, or hepatic encephalopathy).31 Another criterion for timing and allocation of liver transplantation is based on the statistical model for end-stage liver disease (MELD), which is used to predict 3-month survival in patients with cirrhosis based on the relationships between serum bilirubin, serum creatinine, and international normalized ratio values.15 Liver transplantation should be considered for patients with a MELD score ≥15.15,31 Such patients should be promptly referred to a liver transplantation specialist to allow sufficient time for the appropriate psychosocial assessments and medical evaluations, and for patients and their families to receive appropriate education on things like the risks and benefits of transplantation.15
Patients with cirrhosis should be educated about complications of their condition, including ascites, esophageal varices, hepatic encephalopathy, hepatorenal syndrome, spontaneous bacterial peritonitis, and hepatocellular carcinoma (HCC).5 It’s important to explain that they will need to be evaluated every 6 months with serology and ultrasound to assess disease changes.6 Annual screening for HCC should be done with ultrasound or computed tomography scanning with or without alpha-fetoprotein.6
Ensure that your patient knows that he needs to receive the recommended immunizations. The Centers for Disease Control and Prevention recommends that patients with cirrhosis should receive annual influenza, pneumococcal 23, and hepatitis A and B series vaccinations.7
Advise patients with cirrhosis to be cautious when taking any medications. Patients with cirrhosis should avoid nonsteroidal anti-inflammatory drugs because these medications encourage sodium retention, which can exacerbate ascites.6 Acetaminophen use is discouraged, but should not be harmful unless the patient takes >2 g/d.8
Emphasize the importance of eating a healthy diet. Malnutrition is common in patients with cirrhosis3 and correlates with more severe disease and poorer outcomes, including mortality.9 Nutritional recommendations for patients with alcohol-related liver disease include thiamine 50 mg orally or intramuscularly, and riboflavin and pyridoxine in the recommended daily doses.10 Advise patients to take other vitamins, as needed, to treat any deficiencies.9
CASE › After evaluating Mr. M, you prescribe spironolactone 100 mg/d and furosemide 40 mg twice a day to address ascites, and propranolol—which you titrate to 80 mg twice a day—to prevent variceal hemorrhage. Mr. M is maintained on these medications and returns with his daughter, as he has been doing every 2 to 3 months. He is excited that he breathes easily as long as he avoids salt and takes his medications. He continues to see his hepatologist regularly, and his last paracentesis was 4 months ago. He has not used any alcohol since he was taught about the relationship between alcohol and his breathing.
CORRESPONDENCE
Suzanne Minor, MD, FAAF P, Assistant Professor of Family Medicine, Department of Humanities, Health, & Society, Florida International University, Herbert Wertheim College of Medicine, 11200 SW 8th Street, AHC II, 554A, Miami, FL 33199; [email protected]
1. Scaglion S, Kliethermes S, Cao G, et al. The epidemiology of cirrhosis in the United States: A population-based study. J Clin Gastroenterol. 2014. October 8. [Epub ahead of print.]
2. Murphy SL, Xu JQ, Kochanek KD. Deaths: Final data for 2010. National Vital Statistics Reports. National Center for Health Statistics Web site. Available at: http://www.cdc.gov/nchs/data/nvsr/nvsr61/nvsr61_04.pdf. Accessed April 30, 2015.
3. National Institute of Diabetes and Digestive and Kidney Diseases. Cirrhosis. National Institute of Diabetes and Digestive and Kidney Diseases Web site. Available at: http://www.niddk.nih.gov/health-information/health-topics/liver-disease/cirrhosis/Pages/facts.aspx. Accessed April 30, 2015.
4. Zhou WC, Zhang QB, Qiao L. Pathogenesis of liver cirrhosis. World J Gastroenterol. 2014;20:7312-7324.
5. Ginès P, Cárdenas A, Arroyo V, et al. Management of cirrhosis and ascites. N Eng J Med. 2004;350:1646-1654.
6. Grattagliano I, Ubaldi E, Bonfrate L, et al. Management of liver cirrhosis between primary care and specialists. World J Gastroenterol. 2011;17:2273-2282.
7. Centers for Disease Control and Prevention. 2015 recommended immunizations for adults: By age. Centers for Disease Control and Prevention Web site. Available from: http://www.cdc.gov/vaccines/schedules/downloads/adult/adult-schedule-easy-read.pdf. Accessed April 28, 2015.
8. Bacon BR. Cirrhosis and its complications. In: Fauci AS, Braunwald E, Kasper DL, et al, eds. Harrison’s Principles of Internal Medicine. 18th ed. New York, NY: McGraw-Hill; 2012. Available from: http://accessmedicine.mhmedical.com/content.aspx?bookid=1130§ionid=79748841. Accessed April 28, 2015.
9. O’Shea RS, Dasarathy S, McCullough AJ. Alcoholic liver disease. Am J Gastroenterol. 2010;105:14-32.
10. National Institute on Alcohol Abuse and Alcoholism. Alcohol Alert. Alcoholic liver disease. U.S. Department of Health & Human Services. 2005. National Institute on Alcohol Abuse and Alcoholism Web site. Available at: http://pubs.niaaa.nih.gov/publications/aa64/aa64.htm. Accessed April 18, 2015.
11. Kashani A, Landaverde C, Medici V, et al. Fluid retention in cirrhosis: pathophysiology and management. QJM. 2008;101:71-85.
12. Chalasani NP, Vuppalanchi RK. Ascites: A common problem in people with cirrhosis. July 2013. American College of Gastroenterology Web site. Available at: http://patients.gi.org/topics/ascites/. Accessed April 28, 2015.
13. Kuiper JJ, van Buuren HR, de Man RA. Ascites in cirrhosis: a review of management and complications. Neth J Med. 2007;65:283-288.
14. Biecker E. Diagnosis and therapy of ascites in liver cirrhosis. World J Gastroentol. 2011;17:1237-1248.
15. Heidelbaugh JJ, Sherbondy M. Cirrhosis and chronic liver failure: Part II. Complications and treatment. Am Fam Physician. 2006;74:767-776.
16. Garcia-Tsao G, Lim JK; Members of Veterans Affairs Hepatitis C Resource Center Program. Management and treatment of patients with cirrhosis and portal hypertension: recommendations from the Department of Veterans Affairs Hepatitis C Resource Center Program and the National Hepatitis C Program. Am J Gastroenterol. 2009;104:1802-1829.
17. Infante-Rivard C, Esnaola S, Villeneuve JP. Clinical and statistical validity of conventional prognostic factors in predicting shortterm survival among cirrhotics. Hepatology. 1987;7:660-664.
18. Garcia-Tsao G, Sanyal AJ, Grace ND, et al; Practice Guidelines Committee of the American Association for the Study of Liver Diseases; Practice Parameters Committee of the American College of Gastroenterology. Prevention and management of gastroesophageal varices and variceal hemorrhage in cirrhosis. Hepatology. 2007;46:922-938.
19. Serste T, Melot C, Francoz C, et al. Deleterious effects of betablockers on survival in patients with cirrhosis and refractory ascites. Hepatology. 2010;52:1017-1022.
20. Mandorfer M, Bota S, Schwabl P, et al. Nonselective b blockers increase risk for hepatorenal syndrome and death in patients with cirrhosis and spontaneous bacterial peritonitis. Gastroenterology. 2014;146:1680–1690.e1.
21. Sarin SK, Lamba GS, Kumar M, et al. Comparison of endoscopic ligation and propranolol for the primary prevention of variceal bleeding. N Engl J Med. 1999;340:988-993.
22. Garcia-Pagan JC, Feu F, Bosch J, et al. Propranolol compared with propranolol plus isosorbide-5-mononitrate for portal hypertension in cirrhosis. A randomized controlled study. Ann Intern Med. 1991;114:869-873.
23. Amodio P, Bemeur C, Butterworth R, et al. The nutritional management of hepatic encephalopathy in patients with cirrhosis: International Society for Hepatic Encephalopathy and Nitrogen Metabolism Consensus. Hepatology. 2013;58:325-336.
24. Sharma P, Sharma BC. Disaccharides in the treatment of hepatic encephalopathy. Metab Brain Dis. 2013;28:313-320.
25. Jiang Q, Jiang XH, Zheng MH, et al. Rifaximin versus nonabsorbable disaccharides in the management of hepatic encephalopathy: a meta-analysis. Eur J Gastroenterol Hepatol. 2008;20:1064-1070.
26. Ginès P, Schrier RW. Renal failure in cirrhosis. N Engl J Med. 2009;361:1279-1290.
27. Iwakiri Y. The molecules: mechanisms of arterial vasodilatation observed in the splanchnic and systemic circulation in portal hypertension. J Clin Gastroenterol. 2007;41(Suppl 3):S288-S294.
28. Epstein M, Berk DP, Hollenberg NK, et al. Renal failure in the patient with cirrhosis. The role of active vasoconstriction. Am J Med. 1970;49:175-185.
29. Singh V, Ghosh S, Singh B, et al. Noradrenaline vs. terlipressin in the treatment of hepatorenal syndrome: a randomized study. J Hepatol. 2012;56:1293-1298.
30. Chua TC, Saxena A, Chu F, et al. Hepatic resection for transplantable hepatocellular carcinoma for patients within Milan and UCSF criteria. Am J Clin Oncol. 2012;35:141-145.
31. Martin P, DiMartini A, Feng S, et al. Evaluation for liver transplantation in adults: 2013 practice guideline by the American Association for the Study of Liver Diseases and the American Society of Transplantation. Hepatology. 2014;59:1144-1165.
Let’s talk about the evidence

One of my favorite professional activities is teaching an evidence-based continuing medical education course each year at state Academy of Family Physicians meetings. In 12 intensive hours, 4 evidence-based medicine (EBM) experts guide family physicians, nurse practitioners, and physician assistants through nearly 400 abstracts that summarize recent studies that impact primary care practice.
In some cases, the new studies support current practice and standards of care, but for many topics, the new evidence suggests we ought to change our practice, either by stopping something we are currently doing or by starting to do something new. Who would have thought, for instance, that we should abandon the routine bimanual pelvic exam because the potential for harm is greater than the potential for benefit?
Frequently, however, we conclude a talk by describing the uncertainty surrounding particular issues and the need for more high-quality research. For example, there is scant evidence that vitamin D supplementation in healthy Americans leads to any positive outcomes compared to a decent diet and 15 minutes in the sun each day. Luckily, there are several large randomized trials currently underway that will evaluate vitamin D supplementation.
The strength of the scientific evidence to support screening tests and treatments is important to consider. A study examining changes in 11 American College of Cardiology/American Heart Association guidelines found that, out of 619 recommendations, 90% were unchanged in the updated version if supported by multiple randomized trials, and 74% were unchanged if supported by expert opinion.1
In The Journal of Family Practice, we use the Strength of Recommendation Taxonomy (SORT) that was developed by family physician EBM experts2 because it is an approach to grading evidence that takes into account “patient-oriented evidence that matters.” An A-level recommendation is based on consistent and good-quality patient-oriented evidence; a B-level recommendation is based on inconsistent or limited-quality patient-oriented evidence; and a C-level recommendation is based on consensus, usual practice, opinion, disease-oriented evidence, or case series.
We ask our authors to carefully select the level of evidence supporting their clinical recommendations. But your input—and the lively discussion that can often follow—is important, too. Just last month, we published a letter from 2 readers who challenged the evidence-based answer to a Clinical Inquiries question on breastfeeding.
Such ongoing dialogue is useful and enlightening. And we encourage you to write us if you disagree with any of the SORT ratings published in the journal. Let’s keep talking about what the evidence says.
1. Neuman MD, Goldstein JN, Cirullo MA, et al. Durability of class I American College of Cardiology/American Heart Association clinical practice guideline recommendations. JAMA. 2014;311:2092-2100.
2. Ebell MH, Siwek J, Weiss BD, et al. Simplifying the language of evidence to improve patient care: Strength of recommendation taxonomy (SORT): a patient-centered approach to grading evidence in medical literature. J Fam Pract. 2004;53:111-120.
One of my favorite professional activities is teaching an evidence-based continuing medical education course each year at state Academy of Family Physicians meetings. In 12 intensive hours, 4 evidence-based medicine (EBM) experts guide family physicians, nurse practitioners, and physician assistants through nearly 400 abstracts that summarize recent studies that impact primary care practice.
In some cases, the new studies support current practice and standards of care, but for many topics, the new evidence suggests we ought to change our practice, either by stopping something we are currently doing or by starting to do something new. Who would have thought, for instance, that we should abandon the routine bimanual pelvic exam because the potential for harm is greater than the potential for benefit?
Frequently, however, we conclude a talk by describing the uncertainty surrounding particular issues and the need for more high-quality research. For example, there is scant evidence that vitamin D supplementation in healthy Americans leads to any positive outcomes compared to a decent diet and 15 minutes in the sun each day. Luckily, there are several large randomized trials currently underway that will evaluate vitamin D supplementation.
The strength of the scientific evidence to support screening tests and treatments is important to consider. A study examining changes in 11 American College of Cardiology/American Heart Association guidelines found that, out of 619 recommendations, 90% were unchanged in the updated version if supported by multiple randomized trials, and 74% were unchanged if supported by expert opinion.1
In The Journal of Family Practice, we use the Strength of Recommendation Taxonomy (SORT) that was developed by family physician EBM experts2 because it is an approach to grading evidence that takes into account “patient-oriented evidence that matters.” An A-level recommendation is based on consistent and good-quality patient-oriented evidence; a B-level recommendation is based on inconsistent or limited-quality patient-oriented evidence; and a C-level recommendation is based on consensus, usual practice, opinion, disease-oriented evidence, or case series.
We ask our authors to carefully select the level of evidence supporting their clinical recommendations. But your input—and the lively discussion that can often follow—is important, too. Just last month, we published a letter from 2 readers who challenged the evidence-based answer to a Clinical Inquiries question on breastfeeding.
Such ongoing dialogue is useful and enlightening. And we encourage you to write us if you disagree with any of the SORT ratings published in the journal. Let’s keep talking about what the evidence says.
1. Neuman MD, Goldstein JN, Cirullo MA, et al. Durability of class I American College of Cardiology/American Heart Association clinical practice guideline recommendations. JAMA. 2014;311:2092-2100.
2. Ebell MH, Siwek J, Weiss BD, et al. Simplifying the language of evidence to improve patient care: Strength of recommendation taxonomy (SORT): a patient-centered approach to grading evidence in medical literature. J Fam Pract. 2004;53:111-120.
Burning pain from chest to back • allodynia and hyperesthesia • extreme sensitivity at the left T5 dermatome • Dx?
THE CASE
A 27-year-old woman in the 21st week of her first pregnancy came to our clinic complaining of a constant burning pain that spread around her left chest wall to her back. She graded the pain as a 10 on a 0 to 10 visual analog scale. The pain, which began 3 months earlier, became worse when she took a deep breath, ate, or walked, but was alleviated by applying warm compresses. Our patient hadn’t slept well since the pain began. Her medical history was noteworthy for chickenpox at age 5.
During the physical examination, palpating her left upper abdominal quadrant and left lower chest wall elicited tenderness. We noted allodynia and hyperesthesia in these regions, and the left T5 dermatome revealed extreme sensitivity.
THE DIAGNOSIS
We decided to test for antibodies to the varicella-zoster virus (VZV) based on the location of the pain along a dermatome. A serum anti-VZV immunoglobulin G (IgG) level was high at 1.9. Since our patient hadn’t been vaccinated against VZV, her high IgG level may have been the result of reactivation of the virus. Based on this test result and our patient’s history and physical exam findings (ie, neuropathic pain along a dermatome without a typical herpes zoster rash), we diagnosed zoster sine herpete (ZSH).
DISCUSSION
One million new cases of herpes zoster (shingles) are diagnosed in the United States each year, with a rate of 3 to 4 cases per 1000 people.1 One in 3 patients develops postherpetic neuralgia, depending on age and immunocompetence.1
In ZSH, the neuropathic pain of herpes zoster occurs without the typical zoster rash.2 Since the rash is absent, the diagnosis is often missed. The incidence of ZSH is unknown.
Although many pregnant women suffer from thoracic and/or abdominal neuropathic pain, there are no reports in the literature that describe ZSH in pregnant women.3
The appropriate diagnostic tests for ZSH are polymerase chain reaction for VZV DNA and anti-VZV IgG.2,4-7 A definitive diagnosis can be reached by identifying herpes zoster DNA in cerebrospinal fluid (CSF) and organism-specific immunoglobulins. However, a high titer of serum IgG antibodies or a positive IgM antibodies test typically provides a high degree of certainty for the diagnosis.8 For our patient, we decided not to test her CSF because we felt that her clinical course and positive IgG test were sufficient to establish the diagnosis.
The differential diagnosis of radicular pain during pregnancy includes cutaneous nerve entrapment. The expanding uterus could increase pressure on cutaneous nerves in the abdominal wall and cause pain. Although nerve entrapment would be expected to cause impingement and sometimes hypoesthesia, ZSH usually causes allodynia and hyperesthesia, as was the case in our patient.3
Pregnancy affects choice of treatment
Treatments for ZSH include acyclovir and local anesthesia.8 A single injection of lidocaine (8 cc) may completely eliminate the ZSH pain by affecting the nerve action potential.9 Corticosteroids are used to suppress inflammation and decrease erythema, swelling, warmth at the site, and local tenderness.
Our patient. We decided to treat our patient with only a nerve block because the potential adverse effects of acyclovir in the second trimester of pregnancy are unclear.10 She received 1 cc of betamethasone acetate (3 mg) and betamethasone sodium phosphate (3 mg) and 8 cc of 2% lidocaine. The patient reported immediate pain relief, which lasted until delivery.
THE TAKEAWAY
ZSH is characterized by neuropathic pain along a dermatome that’s associated with herpes zoster and is not accompanied by the characteristic rash. Many pregnant women suffer from thoracic and abdominal wall neuropathic pain. Neuropathic radicular pain in the absence of a rash should raise suspicion of ZSH. Considering this syndrome at an early stage can avert unnecessary testing and reduce the patient’s pain.
1. Cohen JI. Clinical practice: Herpes zoster. N Engl J Med. 2013;369:255-263.
2. Nagel MA, Gilden DH. The protean neurologic manifestations of varicella-zoster virus infection. Cleve Clin J Med. 2007;74:489-504.
3. Peleg R, Gohar J, Koretz M, et al. Abdominal wall pain in pregnant women caused by thoracic lateral cutaneous nerve entrapment. Eur J Obstet Gynecol Reprod Biol. 1997;74:169-171.
4. Gilden DH, Wright RR, Schneck SA, et al. Zoster sine herpete, a clinical variant. Ann Neurol. 1994;35:530-533.
5. Amlie-Lefond C, Mackin GA, Ferguson M, et al. Another case of virologically confirmed zoster sine herpete, with electrophysiologic correlation. J Neurovirol. 1996;2:136-138.
6. Blumenthal DT, Shacham-Shmueli E, Bokstein F, et al. Zoster sine herpete: virologic verification by detection of anti-VZV IgG antibody in CSF. Neurology. 2011;76:484-485.
7. Lewis GW. Zoster sine herpete. Br Med J. 1958;2:418-421.
8. Kennedy PG. Zoster sine herpete: it would be rash to ignore it. Neurology. 2011;76:416-417.
9. Baranowski AP, De Courcey J, Bonello E. A trial of intravenous lidocaine on the pain and allodynia of postherpetic neuralgia. J Pain Symptom Manage. 1999;17:429-433.
10. Stone KM, Reiff-Eldridge R, White AD, et al. Pregnancy outcomes following systemic prenatal acyclovir exposure: Conclusions from the international acyclovir pregnancy registry, 1984-1999. Birth Defects Res A Clin Mol Teratol. 2004;70:201-207.
THE CASE
A 27-year-old woman in the 21st week of her first pregnancy came to our clinic complaining of a constant burning pain that spread around her left chest wall to her back. She graded the pain as a 10 on a 0 to 10 visual analog scale. The pain, which began 3 months earlier, became worse when she took a deep breath, ate, or walked, but was alleviated by applying warm compresses. Our patient hadn’t slept well since the pain began. Her medical history was noteworthy for chickenpox at age 5.
During the physical examination, palpating her left upper abdominal quadrant and left lower chest wall elicited tenderness. We noted allodynia and hyperesthesia in these regions, and the left T5 dermatome revealed extreme sensitivity.
THE DIAGNOSIS
We decided to test for antibodies to the varicella-zoster virus (VZV) based on the location of the pain along a dermatome. A serum anti-VZV immunoglobulin G (IgG) level was high at 1.9. Since our patient hadn’t been vaccinated against VZV, her high IgG level may have been the result of reactivation of the virus. Based on this test result and our patient’s history and physical exam findings (ie, neuropathic pain along a dermatome without a typical herpes zoster rash), we diagnosed zoster sine herpete (ZSH).
DISCUSSION
One million new cases of herpes zoster (shingles) are diagnosed in the United States each year, with a rate of 3 to 4 cases per 1000 people.1 One in 3 patients develops postherpetic neuralgia, depending on age and immunocompetence.1
In ZSH, the neuropathic pain of herpes zoster occurs without the typical zoster rash.2 Since the rash is absent, the diagnosis is often missed. The incidence of ZSH is unknown.
Although many pregnant women suffer from thoracic and/or abdominal neuropathic pain, there are no reports in the literature that describe ZSH in pregnant women.3
The appropriate diagnostic tests for ZSH are polymerase chain reaction for VZV DNA and anti-VZV IgG.2,4-7 A definitive diagnosis can be reached by identifying herpes zoster DNA in cerebrospinal fluid (CSF) and organism-specific immunoglobulins. However, a high titer of serum IgG antibodies or a positive IgM antibodies test typically provides a high degree of certainty for the diagnosis.8 For our patient, we decided not to test her CSF because we felt that her clinical course and positive IgG test were sufficient to establish the diagnosis.
The differential diagnosis of radicular pain during pregnancy includes cutaneous nerve entrapment. The expanding uterus could increase pressure on cutaneous nerves in the abdominal wall and cause pain. Although nerve entrapment would be expected to cause impingement and sometimes hypoesthesia, ZSH usually causes allodynia and hyperesthesia, as was the case in our patient.3
Pregnancy affects choice of treatment
Treatments for ZSH include acyclovir and local anesthesia.8 A single injection of lidocaine (8 cc) may completely eliminate the ZSH pain by affecting the nerve action potential.9 Corticosteroids are used to suppress inflammation and decrease erythema, swelling, warmth at the site, and local tenderness.
Our patient. We decided to treat our patient with only a nerve block because the potential adverse effects of acyclovir in the second trimester of pregnancy are unclear.10 She received 1 cc of betamethasone acetate (3 mg) and betamethasone sodium phosphate (3 mg) and 8 cc of 2% lidocaine. The patient reported immediate pain relief, which lasted until delivery.
THE TAKEAWAY
ZSH is characterized by neuropathic pain along a dermatome that’s associated with herpes zoster and is not accompanied by the characteristic rash. Many pregnant women suffer from thoracic and abdominal wall neuropathic pain. Neuropathic radicular pain in the absence of a rash should raise suspicion of ZSH. Considering this syndrome at an early stage can avert unnecessary testing and reduce the patient’s pain.
1. Cohen JI. Clinical practice: Herpes zoster. N Engl J Med. 2013;369:255-263.
2. Nagel MA, Gilden DH. The protean neurologic manifestations of varicella-zoster virus infection. Cleve Clin J Med. 2007;74:489-504.
3. Peleg R, Gohar J, Koretz M, et al. Abdominal wall pain in pregnant women caused by thoracic lateral cutaneous nerve entrapment. Eur J Obstet Gynecol Reprod Biol. 1997;74:169-171.
4. Gilden DH, Wright RR, Schneck SA, et al. Zoster sine herpete, a clinical variant. Ann Neurol. 1994;35:530-533.
5. Amlie-Lefond C, Mackin GA, Ferguson M, et al. Another case of virologically confirmed zoster sine herpete, with electrophysiologic correlation. J Neurovirol. 1996;2:136-138.
6. Blumenthal DT, Shacham-Shmueli E, Bokstein F, et al. Zoster sine herpete: virologic verification by detection of anti-VZV IgG antibody in CSF. Neurology. 2011;76:484-485.
7. Lewis GW. Zoster sine herpete. Br Med J. 1958;2:418-421.
8. Kennedy PG. Zoster sine herpete: it would be rash to ignore it. Neurology. 2011;76:416-417.
9. Baranowski AP, De Courcey J, Bonello E. A trial of intravenous lidocaine on the pain and allodynia of postherpetic neuralgia. J Pain Symptom Manage. 1999;17:429-433.
10. Stone KM, Reiff-Eldridge R, White AD, et al. Pregnancy outcomes following systemic prenatal acyclovir exposure: Conclusions from the international acyclovir pregnancy registry, 1984-1999. Birth Defects Res A Clin Mol Teratol. 2004;70:201-207.
Bifrontal headache • blurred vision • vomiting • Dx?
THE CASE
A 55-year-old woman presented to the emergency department (ED) with a bifrontal headache that she’d had for one day. She also had blurred vision and was vomiting shortly before coming to the hospital. The patient had no history of hypertension, migraine headaches, seizure disorder, autoimmune disorders, or cerebrovascular disease.
Her vital signs, including a blood pressure of 114/63 mm Hg, were normal, but a physical examination revealed subjective vision loss. She was only able to see objects moving on a horizontal plane. Her finger-to-nose exam, pupillary reflexes, and extra-ocular movements were normal, but peripheral vision was limited on her left side. No other neurologic deficits were noted.
The patient was admitted to the hospital and most of her laboratory work-up was normal, including a basic metabolic panel, complete blood count, coagulation studies, brain natriuretic peptide test, and cardiac enzymes. Her white blood cell count was 19,700/mcL, but no source of infection was found. A computed tomography (CT) scan of her head without contrast showed low-density, patchy areas in the subcortical regions of the parietal and occipital lobes bilaterally (FIGURE 1, arrows), with relative sparing of the cortex.
THE DIAGNOSIS
Based on our patient’s presentation and radiologic findings, we made a diagnosis of posterior reversible encephalopathy syndrome (PRES). However, because we could not rule out an ischemic cerebrovascular event at the time of presentation, we started the patient on aspirin and clopidogrel 75 mg to prevent possible future ischemic events. The next day, we ordered magnetic resonance imaging (MRI) of the head and neck, which documented the edema and confirmed the diagnosis of PRES (FIGURE 2).
DISCUSSION
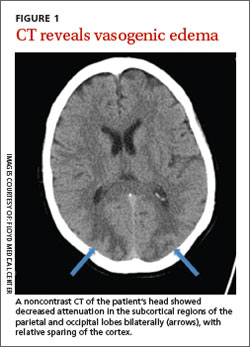
PRES is a neurotoxic state associated with a unique pattern of brain vasogenic edema seen on CT or MRI. The edema is often widespread but is predominantly found in the parietal and occipital regions.1 PRES is seen in patients with a variety of conditions, including hypertension and bone marrow or organ transplantation, as well as in those receiving immunosuppressive or cytotoxic medications.1 Patients with PRES typically present with headaches and seizures.2 Visual abnormalities (most commonly cortical blindness), occur in 15% to 20% of patients with PRES.2-4
Hinchey et al3 first described reversible posterior leukoencephalopathy syndrome (which later became known as PRES) in 1996. Most of the 15 patients included in this original report had a history of hypertension or immunosuppression. These cases were associated with cerebral edema in portions of the posterior cerebral white matter. It is thought that hypertension alters the blood-brain barrier and causes the acute changes that occur in PRES.3
Besides hypertension and immunosuppression, the risk factors most commonly associated with PRES include preeclampsia/eclampsia; sepsis, particularly due to grampositive organisms; Wegener’s granulomatosis, scleroderma, and polyarteritis nodosa; cancer chemotherapy; bone marrow or stem cell transplantation; and renal disease.1,4-6
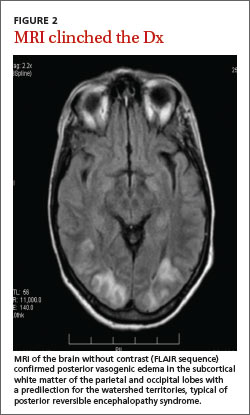
Although a clear cause of PRES has not yet been established, researchers have proposed 2 theories. The first postulates that a sudden increase in systemic blood pressure causes vasoconstriction, which leads to ischemia and edema.1-4,7,8 However, several studies have also described cases of PRES in patients with mild elevations in blood pressure,1,5-7 and mild edema has been observed even in normotensive patients1,5 (as was the case with our patient).
The second theory links PRES to the loss of brain autoregulation, a function that maintains steady blood flow when blood pressure fluctuates.6 A loss of this regulatory mechanism causes endothelial dysfunction, capillary leakage, and disruption in the blood-brain barrier.1,2,4,6-8 These changes then lead to cerebral vasodilatation and edema.2 Immunotherapy has also been associated with increased endothelial dysfunction.2
The evidence on the link between the severity of PRES and clinical outcomes is conflicting.
One study that followed 113 PRES patients over 6 years did not find an association between the severity of clinical presentation and the extent of vasogenic edema found on imaging studies.5 Of these 113 patients, 69 had PRES primarily due to hypertension, and 21 were receiving cytotoxic medications.5 In contrast, a larger retrospective study that followed patients with PRES for 12 years found that severe cases, which included patients with severe cerebral edema and altered mental status, had poor outcomes.4 Small studies have reported that 14% of patients with PRES develop cerebral hemorrhage.8
When to suspect this condition. PRES should be part of the differential diagnosis for any patient who presents with headache and vision loss. It is important to distinguish PRES from an acute cerebrovascular accident (CVA) because the 2 conditions are managed differently.2 In addition, PRES lesions can be misdiagnosed as tumors, especially in a patient with a history of malignant disease in whom the condition appears after chemotherapy.9
Treatment targets the underlying causes
Treatment options for PRES are limited. Hypertension in a patient with PRES requires prompt intervention to avoid progression of the disease.2 The use of intravenous (IV) calcium-channel blockers or IV beta-blockers for these patients is common.2,8
Patients with seizures should be treated with anticonvulsant medication, but longterm antiepileptic treatment usually is not required.2 Patients who take immunosuppressant or cytotoxic drugs should stop them indefinitely upon presenting with PRES.2
For a pregnant woman with preeclampsia/eclampsia, delivery of the placenta, which is considered to be the cause of PRES in these cases, is curative.1 However, women can develop PRES several weeks after delivery.1
In most cases, the symptoms associated with PRES will resolve once treatment is initiated, and neurologic recovery can be expected within 2 weeks.2
Our patient regained her sight the following morning and was discharged home 2 days after admission. Her blood pressure remained normal. She returned to the hospital unresponsive the day after she had been discharged. Family members stated that she had taken 15 packets of an aspirin/caffeine combination to control a new headache.
Her blood pressure was elevated at 159/79 mm Hg. A CT of the brain showed a hemorrhagic stroke within the left occipital lobe and posterior parietal lobe with a midline shift of 8 mm. We don’t know if the aspirin use contributed to the hemorrhagic event or if it was a sequela of PRES.
The patient died 4 days later.
THE TAKEAWAY
PRES is a neurotoxic condition that causes headache, seizures, and vision loss. Most patients will present with elevated blood pressure and imaging studies will reveal a specific pattern of vasogenic edema that is predominately found in the parietal and occipital regions.
Treating the hypertension may result in a more favorable recovery. Normotensive patients are harder to treat because there is no specific therapy for PRES. Follow-up imaging may help to assess the resolution of the syndrome.
1. Bartynski WS. Posterior reversible encephalopathy syndrome, part 1: fundamental imaging and clinical features. AJNR Am J Neuroradiol. 2008;29:1036-1042.
2. Stott VL, Hurrell MA, Anderson TJ. Reversible posterior leukoencephalopathy syndrome: a misnomer reviewed. Intern Med J. 2005;35:83-90.
3. Hinchey J, Chaves C, Appignani B, et al. A reversible posterior leukoencephalopathy syndrome. N Engl J Med. 1996;334:494-500.
4. Liman TG, Bohner G, Endres M, et al. Discharge status and in-hospital mortality in posterior reversible encephalopathy syndrome. Acta Neurol Scand. 2014;130:34-39.
5. Fugate JE, Claassen DO, Cloft HJ, et al. Posterior reversible encephalopathy syndrome: associated clinical and radiologic findings. Mayo Clin Proc. 2010;85:427-432.
6. Bartynski WS. Posterior reversible encephalopathy syndrome, part 2: controversies surrounding pathophysiology of vasogenic edema. AJNR Am J Neuroradiol. 2008;29:1043-1049.
7. Ay H, Buonanno FS, Schaefer PW, et al. Posterior leukoencephalopathy without severe hypertension: utility of diffusion-weighted MRI. Neurology. 1998;51:1369-1376.
8. Legriel S, Schraub O, Azoulay E, et al; Critically III Posterior Reversible Encephalopathy Syndrome Study Group (CYPRESS). Determinants of recovery from severe posterior reversible encephalopathy syndrome. PLoS ONE. 2012;7:e44534.
9. Morina D, Ntoulias G, Maslehaty H, et al. Posterior reversible encephalopathy syndrome mimicking cerebral metastasis: contraindication for biopsy. Clin Pract. 2014;4:632.
THE CASE
A 55-year-old woman presented to the emergency department (ED) with a bifrontal headache that she’d had for one day. She also had blurred vision and was vomiting shortly before coming to the hospital. The patient had no history of hypertension, migraine headaches, seizure disorder, autoimmune disorders, or cerebrovascular disease.
Her vital signs, including a blood pressure of 114/63 mm Hg, were normal, but a physical examination revealed subjective vision loss. She was only able to see objects moving on a horizontal plane. Her finger-to-nose exam, pupillary reflexes, and extra-ocular movements were normal, but peripheral vision was limited on her left side. No other neurologic deficits were noted.
The patient was admitted to the hospital and most of her laboratory work-up was normal, including a basic metabolic panel, complete blood count, coagulation studies, brain natriuretic peptide test, and cardiac enzymes. Her white blood cell count was 19,700/mcL, but no source of infection was found. A computed tomography (CT) scan of her head without contrast showed low-density, patchy areas in the subcortical regions of the parietal and occipital lobes bilaterally (FIGURE 1, arrows), with relative sparing of the cortex.
THE DIAGNOSIS
Based on our patient’s presentation and radiologic findings, we made a diagnosis of posterior reversible encephalopathy syndrome (PRES). However, because we could not rule out an ischemic cerebrovascular event at the time of presentation, we started the patient on aspirin and clopidogrel 75 mg to prevent possible future ischemic events. The next day, we ordered magnetic resonance imaging (MRI) of the head and neck, which documented the edema and confirmed the diagnosis of PRES (FIGURE 2).
DISCUSSION
PRES is a neurotoxic state associated with a unique pattern of brain vasogenic edema seen on CT or MRI. The edema is often widespread but is predominantly found in the parietal and occipital regions.1 PRES is seen in patients with a variety of conditions, including hypertension and bone marrow or organ transplantation, as well as in those receiving immunosuppressive or cytotoxic medications.1 Patients with PRES typically present with headaches and seizures.2 Visual abnormalities (most commonly cortical blindness), occur in 15% to 20% of patients with PRES.2-4
Hinchey et al3 first described reversible posterior leukoencephalopathy syndrome (which later became known as PRES) in 1996. Most of the 15 patients included in this original report had a history of hypertension or immunosuppression. These cases were associated with cerebral edema in portions of the posterior cerebral white matter. It is thought that hypertension alters the blood-brain barrier and causes the acute changes that occur in PRES.3
Besides hypertension and immunosuppression, the risk factors most commonly associated with PRES include preeclampsia/eclampsia; sepsis, particularly due to grampositive organisms; Wegener’s granulomatosis, scleroderma, and polyarteritis nodosa; cancer chemotherapy; bone marrow or stem cell transplantation; and renal disease.1,4-6
Although a clear cause of PRES has not yet been established, researchers have proposed 2 theories. The first postulates that a sudden increase in systemic blood pressure causes vasoconstriction, which leads to ischemia and edema.1-4,7,8 However, several studies have also described cases of PRES in patients with mild elevations in blood pressure,1,5-7 and mild edema has been observed even in normotensive patients1,5 (as was the case with our patient).
The second theory links PRES to the loss of brain autoregulation, a function that maintains steady blood flow when blood pressure fluctuates.6 A loss of this regulatory mechanism causes endothelial dysfunction, capillary leakage, and disruption in the blood-brain barrier.1,2,4,6-8 These changes then lead to cerebral vasodilatation and edema.2 Immunotherapy has also been associated with increased endothelial dysfunction.2
The evidence on the link between the severity of PRES and clinical outcomes is conflicting.
One study that followed 113 PRES patients over 6 years did not find an association between the severity of clinical presentation and the extent of vasogenic edema found on imaging studies.5 Of these 113 patients, 69 had PRES primarily due to hypertension, and 21 were receiving cytotoxic medications.5 In contrast, a larger retrospective study that followed patients with PRES for 12 years found that severe cases, which included patients with severe cerebral edema and altered mental status, had poor outcomes.4 Small studies have reported that 14% of patients with PRES develop cerebral hemorrhage.8
When to suspect this condition. PRES should be part of the differential diagnosis for any patient who presents with headache and vision loss. It is important to distinguish PRES from an acute cerebrovascular accident (CVA) because the 2 conditions are managed differently.2 In addition, PRES lesions can be misdiagnosed as tumors, especially in a patient with a history of malignant disease in whom the condition appears after chemotherapy.9
Treatment targets the underlying causes
Treatment options for PRES are limited. Hypertension in a patient with PRES requires prompt intervention to avoid progression of the disease.2 The use of intravenous (IV) calcium-channel blockers or IV beta-blockers for these patients is common.2,8
Patients with seizures should be treated with anticonvulsant medication, but longterm antiepileptic treatment usually is not required.2 Patients who take immunosuppressant or cytotoxic drugs should stop them indefinitely upon presenting with PRES.2
For a pregnant woman with preeclampsia/eclampsia, delivery of the placenta, which is considered to be the cause of PRES in these cases, is curative.1 However, women can develop PRES several weeks after delivery.1
In most cases, the symptoms associated with PRES will resolve once treatment is initiated, and neurologic recovery can be expected within 2 weeks.2
Our patient regained her sight the following morning and was discharged home 2 days after admission. Her blood pressure remained normal. She returned to the hospital unresponsive the day after she had been discharged. Family members stated that she had taken 15 packets of an aspirin/caffeine combination to control a new headache.
Her blood pressure was elevated at 159/79 mm Hg. A CT of the brain showed a hemorrhagic stroke within the left occipital lobe and posterior parietal lobe with a midline shift of 8 mm. We don’t know if the aspirin use contributed to the hemorrhagic event or if it was a sequela of PRES.
The patient died 4 days later.
THE TAKEAWAY
PRES is a neurotoxic condition that causes headache, seizures, and vision loss. Most patients will present with elevated blood pressure and imaging studies will reveal a specific pattern of vasogenic edema that is predominately found in the parietal and occipital regions.
Treating the hypertension may result in a more favorable recovery. Normotensive patients are harder to treat because there is no specific therapy for PRES. Follow-up imaging may help to assess the resolution of the syndrome.
1. Bartynski WS. Posterior reversible encephalopathy syndrome, part 1: fundamental imaging and clinical features. AJNR Am J Neuroradiol. 2008;29:1036-1042.
2. Stott VL, Hurrell MA, Anderson TJ. Reversible posterior leukoencephalopathy syndrome: a misnomer reviewed. Intern Med J. 2005;35:83-90.
3. Hinchey J, Chaves C, Appignani B, et al. A reversible posterior leukoencephalopathy syndrome. N Engl J Med. 1996;334:494-500.
4. Liman TG, Bohner G, Endres M, et al. Discharge status and in-hospital mortality in posterior reversible encephalopathy syndrome. Acta Neurol Scand. 2014;130:34-39.
5. Fugate JE, Claassen DO, Cloft HJ, et al. Posterior reversible encephalopathy syndrome: associated clinical and radiologic findings. Mayo Clin Proc. 2010;85:427-432.
6. Bartynski WS. Posterior reversible encephalopathy syndrome, part 2: controversies surrounding pathophysiology of vasogenic edema. AJNR Am J Neuroradiol. 2008;29:1043-1049.
7. Ay H, Buonanno FS, Schaefer PW, et al. Posterior leukoencephalopathy without severe hypertension: utility of diffusion-weighted MRI. Neurology. 1998;51:1369-1376.
8. Legriel S, Schraub O, Azoulay E, et al; Critically III Posterior Reversible Encephalopathy Syndrome Study Group (CYPRESS). Determinants of recovery from severe posterior reversible encephalopathy syndrome. PLoS ONE. 2012;7:e44534.
9. Morina D, Ntoulias G, Maslehaty H, et al. Posterior reversible encephalopathy syndrome mimicking cerebral metastasis: contraindication for biopsy. Clin Pract. 2014;4:632.

Oral device reduced obstructive sleep apnea, not sleepiness
An oral appliance that advances a patient’s lower jaw reduced episodes of obstructive sleep apnea, snoring, and restless legs symptoms, according to a report published online June 1 in JAMA Internal Medicine.
The device, however, failed to improve daytime sleepiness or quality of life in a Swedish study of adults who had daytime sleepiness and either snoring or mild to moderate sleep apnea, said Marie Marklund, Ph.D., D.D.S., of the department of odontology at Umeå (Sweden) University and her associates (JAMA Intern. Med. 2015 June 1 [doi:10.1001/jamainternmed.2015.2051]).
Previous studies of oral appliances have focused on patients with more severe sleep apnea and have yielded conflicting results, particularly regarding daytime sleepiness.
A total of 91 patients who were randomly assigned to receive either a placebo device (46 patients) or an oral appliance individually made by a dental technician using separate plaster casts of the upper and lower teeth (45 participants) completed the study. The device’s elastomer pieces fitted over the teeth and were connected with a screw that allowed continuous gradual advancement of the lower jaw by 6-7 mm. Holding the lower mandible forward improves breathing during sleep.
After 4 months of follow-up, at-home overnight polysomnography showed “a clear, significant treatment effect”: the mean apnea-hypopnea index (AHI) was 6.7 in the active-treatment group, compared with 16.7 in the placebo group. A total of 49% of the patients receiving active treatment had an AHI lower than 5, compared with only 11% of those using the placebo device, for an odds ratio of 7.8 and a number needed to treat of 3.
Snoring and symptoms of restless legs also were significantly less frequent with the active treatment, Dr. Marklund and her associates said.
In addition, 73% of patients who used oral appliances said that their expectations of treatment were either “totally” or “sufficiently” fulfilled, compared with only 11% of those who used placebo devices. And 89% of patients who used oral appliances said they would continue the treatment after completing the study, compared with only 52% of those who used the sham device.
However, daytime sleepiness, measured subjectively using the Epworth Sleepiness Scale and the Karolinska Sleepiness Scale and measured objectively using the Oxford Sleep Resistance test, did not differ significantly between the two study groups. The number of days with headaches, the intensity of headaches, the presence of nasal congestion, difficulty falling asleep, nighttime awakenings, nightmares, and reaction times also were not significantly different, nor were scores on a quality of life measure.
The study was supported by grants from the Swedish Research Council, the Swedish Heart and Lung Foundation, and the County Council of Vasterbotten. Dr. Marklund and her associates reported no conflicts of interest.
It appears that patients generally prefer these devices to continuous positive airway pressure (CPAP) therapy. Better adherence to an oral appliance may outweigh the fact that it is not as effective as CPAP. Long-term studies comparing the two approaches are warranted.
The benefits of the mandibular advancement devices used in this study cannot be translated automatically to other devices, because there is a huge variety of these appliances on the market.
The extent of the protrusion of the lower jaw, the stability of the material, and the structural design of the devices vary widely. Several experts currently recommend avoiding the less sophisticated appliances that are not tailored to the individual’s jaw and oral cavity and instead using only customized adjustable appliances made by a trained specialist.
Dr. Winfried J. Randerath is with the pneumonology clinic and the Allergology Center for Sleep Medicine and Respiratory Care at Bethanien Hospital in Solingen, Germany. He reported having no relevant financial disclosures. He has, however, received speaking fees and research funds from companies that produce positive airway pressure devices: Heinen und Lowenstein, Resmed, Respironics, and Weinmann. Dr. Randerath made these remarks in an invited commentary (JAMA Intern. Med. 2015 June 1 [doi:10.1001/jamainternmed.2015.2059]).
An oral appliance that advances a patient’s lower jaw reduced episodes of obstructive sleep apnea, snoring, and restless legs symptoms, according to a report published online June 1 in JAMA Internal Medicine.
The device, however, failed to improve daytime sleepiness or quality of life in a Swedish study of adults who had daytime sleepiness and either snoring or mild to moderate sleep apnea, said Marie Marklund, Ph.D., D.D.S., of the department of odontology at Umeå (Sweden) University and her associates (JAMA Intern. Med. 2015 June 1 [doi:10.1001/jamainternmed.2015.2051]).
Previous studies of oral appliances have focused on patients with more severe sleep apnea and have yielded conflicting results, particularly regarding daytime sleepiness.
A total of 91 patients who were randomly assigned to receive either a placebo device (46 patients) or an oral appliance individually made by a dental technician using separate plaster casts of the upper and lower teeth (45 participants) completed the study. The device’s elastomer pieces fitted over the teeth and were connected with a screw that allowed continuous gradual advancement of the lower jaw by 6-7 mm. Holding the lower mandible forward improves breathing during sleep.
After 4 months of follow-up, at-home overnight polysomnography showed “a clear, significant treatment effect”: the mean apnea-hypopnea index (AHI) was 6.7 in the active-treatment group, compared with 16.7 in the placebo group. A total of 49% of the patients receiving active treatment had an AHI lower than 5, compared with only 11% of those using the placebo device, for an odds ratio of 7.8 and a number needed to treat of 3.
Snoring and symptoms of restless legs also were significantly less frequent with the active treatment, Dr. Marklund and her associates said.
In addition, 73% of patients who used oral appliances said that their expectations of treatment were either “totally” or “sufficiently” fulfilled, compared with only 11% of those who used placebo devices. And 89% of patients who used oral appliances said they would continue the treatment after completing the study, compared with only 52% of those who used the sham device.
However, daytime sleepiness, measured subjectively using the Epworth Sleepiness Scale and the Karolinska Sleepiness Scale and measured objectively using the Oxford Sleep Resistance test, did not differ significantly between the two study groups. The number of days with headaches, the intensity of headaches, the presence of nasal congestion, difficulty falling asleep, nighttime awakenings, nightmares, and reaction times also were not significantly different, nor were scores on a quality of life measure.
The study was supported by grants from the Swedish Research Council, the Swedish Heart and Lung Foundation, and the County Council of Vasterbotten. Dr. Marklund and her associates reported no conflicts of interest.
FROM JAMA INTERNAL MEDICINE
Key clinical point: An oral appliance to advance the lower jaw reduced apneic episodes, snoring, and restless legs symptoms.
Major finding: Half of the patients receiving active treatment had an apnea-hypopnea index lower than 5, compared with only 11% of those using the placebo device, for an odds ratio of 7.8 and a number-needed-to-treat of 3.
Data source: A randomized, single-blind trial comparing a customized oral appliance against a placebo device in 96 adults with daytime sleepiness and either snoring or mild to moderate obstructive sleep apnea.
Disclosures: This study was supported by grants from the Swedish Research Council, the Swedish Heart and Lung Foundation, and the County Council of Vasterbotten. Dr. Marklund and her associates reported no conflicts of interest.
Another Good Reason to Recommend Low-dose Aspirin
PRACTICE CHANGER
Prescribe low-dose aspirin (eg, 81 mg/d) to pregnant women who are at high risk for preeclampsia because it reduces the risk for this complication, as well as preterm birth and intrauterine growth restriction.1
STRENGTH OF RECOMMENDATION
A: Based on a systematic review and meta-analysis of 23 studies, including 21 randomized controlled trials.1
ILLUSTRATIVE CASE
A 22-year-old G2P1 pregnant woman at 18 weeks’ gestation who has a history of preeclampsia comes to your office for a routine prenatal visit. On exam, her blood pressure continues to be in the 110s/60s, as it has been for several visits. Her history puts her at risk for preeclampsia again, and you wonder if anything can be done to prevent this from happening.
The incidence of preeclampsia, which occurs in 2% to 8% of pregnancies worldwide and 3.4% of pregnancies in the United States, appears to be steadily increasing.2,3 Preeclampsia is defined as new-onset hypertension at > 20 weeks’ gestation, plus proteinuria, thrombocytopenia, renal insufficiency, impaired liver function, pulmonary edema, and/or cerebral or visual symptoms.4
The condition is associated with several adverse maternal and fetal outcomes, including eclampsia, abruption, intrauterine growth restriction (IUGR), preterm birth, stillbirth, and maternal death.2,4 Risk factors include previous preeclampsia, maternal age 40 or older, chronic medical conditions, and multifetal pregnancy.5
The only effective treatment for preeclampsia is delivery.4 Given the lack of other treatments, strategies for prevention would be highly valuable.
In 1996, the US Preventive Services Task Force (USPSTF) addressed this issue and concluded that there was insufficient evidence to recommend for or against using aspirin to prevent preeclampsia.6 More recently, Henderson et al1 conducted a systematic review and meta-analysis to support the USPSTF in a revision of its earlier recommendation.
STUDY SUMMARY
Aspirin lowers risk for preeclampsia and preterm birth
Henderson et al1 evaluated the impact of low-dose aspirin on maternal and fetal outcomes among pregnant women at risk for preeclampsia. The review of 23 studies included 21 randomized, placebo-controlled trials that evaluated 24,666 patients. Slightly more than half of the studies that evaluated maternal and fetal health benefits were graded as good quality, and 67% of those that evaluated maternal, perinatal, and developmental harms were rated good quality.
Most study participants were white and ages 20 to 33. Aspirin doses ranged from 60 to 150 mg/d; most studies used doses of 60 or 100 mg/d. Aspirin was initiated between 12 to 36 weeks’ gestation, with nine trials initiating aspirin before 16 weeks. In most trials, aspirin was continued until delivery.
Among women at high preeclampsia risk (10 studies), the pooled relative risk (RR) for perinatal death was 0.81 for low-dose aspirin, compared to placebo. However, this finding was not statistically significant (P = .78).
Among women who received low-dose aspirin, researchers noted a 14% risk reduction for preterm birth (RR, 0.86), a 20% risk reduction for IUGR (RR, 0.80), and a 24% risk reduction for preeclampsia (RR, 0.76). The absolute risk reduction for preeclampsia was estimated to be 2% to 5%.
While the results for preterm birth, IUGR, and preeclampsia were statistically significant, the authors noted that these results could have been biased by “small study effects” (the tendency of smaller studies to report positive findings, which in turn can skew the results of a meta-analysis based primarily on such studies). The timing and dosage of aspirin had no significant effect on outcomes.
There was no evidence of increased maternal postpartum hemorrhage with aspirin use (RR, 1.02). Aspirin use did not seem to increase perinatal mortality among all risk levels (RR, 0.92; P = .65). No differences were noted in the toddlers’ development at 18 months.
WHAT’S NEW
Low-dose aspirin use is now recommended
The 1996 USPSTF recommendation concluded that there was insufficient evidence to recommend aspirin use for preventing preeclampsia. This systematic review and meta-analysis, along with findings from a 2007 Cochrane review7 and a meta-analysis from the PARIS Collaborative Group,8 provide good-quality evidence that aspirin reduces negative maternal and fetal outcomes associated with preeclampsia. In 2014, the USPSTF cited this evidence when it decided to recommend using low-dose aspirin (81 mg/d) to prevent preeclampsia in women who are at high risk for the complication (Grade B).9
CAVEATS
Much of the data came from small studies
A substantial portion of the data in this systematic review and meta-analysis came from small studies with positive findings. Because small studies with null findings tend not to be published, there is concern that the results reported by Henderson et al1 may be somewhat biased, and that future studies may push the overall observed effect toward a null finding.
Also, the criteria used to define “high risk” for preeclampsia varied by study, so it’s unclear which groups of women would benefit most from aspirin use during pregnancy. Finally, there is a lack of high-quality data on the effects of aspirin use during pregnancy on long-term outcomes in children. Despite these caveats, the cumulative evidence strongly points to greater benefit than harm.
CHALLENGES TO IMPLEMENTATION
You need to determine which patients are at highest risk
The principle challenge lies in the identification of patients who are at high risk for preeclampsia and thus will likely benefit from this intervention. This systematic review and meta-analysis used a large variety of risk factors to determine whether a woman was at high risk. A 2013 American College of Obstetricians and Gynecologists Task Force on Hypertension in Pregnancy report defined as high risk women with a history of preeclampsia in more than one previous pregnancy or women with a previous preterm delivery due to preeclampsia.4
The updated USPSTF recommendation suggests that women be considered high risk if they have any of the following: previous preeclampsia, multifetal gestation, chronic hypertension, diabetes, renal disease, or autoimmune disease.9 We consider both sets of criteria reasonable for identifying women who may benefit from low-dose aspirin during pregnancy.
REFERENCES
1. Henderson J, Whitlock E, O’Connor E, et al. Low-dose aspirin for prevention of morbidity and mortality from preeclampsia: a systematic evidence review for the US Preventive Services Task Force. Ann Intern Med. 2014;160:695-703.
2. Ghulmiyyah L, Sibai B. Maternal mortality from preeclampsia/eclampsia. Semin Perinatol. 2012;36:56-59.
3. Ananth CV, Keyes KM, Wapner RJ. Pre-eclampsia rates in the United States, 1980-2010: age-period-cohort analysis. BMJ. 2013;347:f6564.
4. American College of Obstetricians and Gynecologists; Task Force on Hypertension in Pregnancy. Hypertension in pregnancy. Obstet Gynecol. 2013;122:1122-1131.
5. Duckitt K, Harrington D. Risk factors for pre-eclampsia at antenatal booking: systematic review of controlled studies. BMJ. 2005; 330:565.
6. US Preventive Services Task Force. Aspirin prophylaxis in pregnancy. In: Guide to Clinical Preventive Services: Report of the US Preventive Services Task Force. 2nd ed. Washington, DC: US Department of Health and Human Services; 1996.
7. Duley L, Henderson-Smart DJ, Meher S, et al. Antiplatelet agents for preventing pre-eclampsia and its complications. Cochrane Database Syst Rev. 2007(2):CD004659. 8. Askie LM, Duley L, Henderson-Smart DJ, et al; PARIS Collaborative Group. Antiplatelet agents for prevention of pre-eclampsia: a meta-analysis of individual patient data. Lancet. 2007;369: 1791-1798. 9. LeFevre ML; US Preventive Services Task Force. Low-dose aspirin use for the prevention of morbidity and mortality from preeclampsia [recommendation statement]. Ann Intern Med. 2014;161:819-826.
ACKNOWLEDGEMENT
The PURLs Surveillance System was supported in part by Grant Number UL1RR024999 from the National Center For Research Resources, a Clinical Translational Science Award to the University of Chicago. The content is solely the responsibility of the authors and does not necessarily represent the official views of the National Center For Research Resources or the National Institutes of Health.
Copyright © 2015. The Family Physicians Inquiries Network. All rights reserved.
Reprinted with permission from The Family Physicians Inquiries Network and The Journal of Family Practice. 2015;64(5):301-303.
Hospitalists Should Make Commitment to Improve Healthcare Safety

Peter Pronovost, MD, PhD, FCCM, knows how to deliver a great talk. It is no wonder he is highly sought after and was asked to speak at the plenary for SHM’s annual meeting. Dr. Pronovost, also known as the “Checklist Doctor,” knows how to combine just the right amount of sadness, inspiration, and humor to make his audience feel motivated and compelled to DO something. And, in fact, he implores you—DO something.
Most of us feel excited and inspired during the annual meeting. But those feelings serve little purpose unless we translate them into actions that will make the medical industry a better place for clinicians to work and for patients to receive care. As Dr. Pronovost said, “We are the only hope that the healthcare system has of improving quality and safety.”
He was inspired years ago by the watershed event that will forever be imprinted upon Johns Hopkins Hospital in Baltimore, the preventable death of 18-month-old Josie King on Feb. 22, 2001. Years after the event, her mother, Sorrel King, a passionate patient safety advocate, wanted to know if hospitals are any safer than they were the day that Josie died. She wanted to know what patient safety experts at Hopkins had done to ensure there would not be another Josie King story.
Patients and their families consistently voice similar desires after they have suffered preventable harm. They want to know what happened, why it happened, what it means for them, and what will be done to prevent it from happening again.1 The latter question is one I am frequently asked by patients and their families at my hospital. “What are you going to do to make sure this does not happen again?”
I would venture to guess most hospitalists have been responsible for some type of preventable patient harm during their careers. We work in complex, high-volume, unpredictable, and continuously changing environments. Many of the patients and families in our care are new to us and are with us for only short periods of time. Those of us who have been responsible for preventable patient harm know that it is an unforgettable moment in time that can weigh upon your conscious. And, of course, we all want to do something to make sure it does not happen again.
That is exactly what patients and their families expect of all of us—to DO something—and they should.
But this can be an overwhelming responsibility, especially when the root causes of harm are difficult either to identify or to fix—such as a miscommunication, a diagnostic error, or an inadequate handoff.
Which gets me back to Dr. Pronovost giving a great talk. His appeal to our audience of about 3,000 hospitalists was to DO something. To make the healthcare system improve quality and safety for future patients. To not wait until we or our colleagues are involved in a preventable harm event. To do something, anything, now, that contributes to safer care, today and every day going forward.
He ended his talk with “I will….” Dr. Pronovost (and I would venture to guess patients and their families) wants each of us to fill in the blank with a statement of personal accountability for action. Unfortunately, many of us still believe that we are personally unable to make complex systems safer for patients. Many of us still believe that patients and the systems they traverse are too complex, unpredictable, unreliable, or noncompliant.
The truth is, patients and systems are indeed complex, unpredictable, unreliable, and noncompliant. The further truth is, the only way to make care safer is for each of us to start with a collective shared mental model that we can make it better—and for each of us to commit to personal accountability for action.
My “I Will”
So, while I really enjoyed Dr. Pronovost’s talk, what I enjoyed even more was reading the section in last month’s edition of The Hospitalist in which about a half dozen hospitalists interviewed after the plenary accepted the challenge of filling in the blank “I will….” A few excerpts:
- “I will let them know that everything is possible…”
- “I will improve healthcare…”
- “[I will] make sure the patient is heard…”
By a simple proclamation of personal accountability, a mere thousand hospitalists attending an annual meeting can collectively and progressively change the safety of healthcare in thousands of hospitals around the country. It starts with thinking we can do it and publicly committing to the journey. Although we are still a relatively new specialty, we have permeated almost every hospital in the country, and we have outpaced the growth of any specialty in the history of modern medicine. We are perfectly poised to be the safety change agents for every hospital system. As Margaret Meade famously said, “Never doubt that a small group of thoughtful, committed citizens can change the world; indeed, it’s the only thing that ever has….”
So don’t delay. Whether or not you had the good fortune of being inspired at the SHM annual meeting, each of us owes it to our patients to commit to improving the safety of healthcare and paving the future of hospital care. Get out your pen, craft a commitment now, follow through with it, and make hospitals safer tomorrow than they were yesterday.
I will…

Reference
- Gallagher TH, Waterman AD, Ebers AG, Fraser VJ, Levinson W. Patients’ and physicians’ attitudes regarding the disclosure of medical errors. JAMA. 2003;289(8):1001-1007.
Peter Pronovost, MD, PhD, FCCM, knows how to deliver a great talk. It is no wonder he is highly sought after and was asked to speak at the plenary for SHM’s annual meeting. Dr. Pronovost, also known as the “Checklist Doctor,” knows how to combine just the right amount of sadness, inspiration, and humor to make his audience feel motivated and compelled to DO something. And, in fact, he implores you—DO something.
Most of us feel excited and inspired during the annual meeting. But those feelings serve little purpose unless we translate them into actions that will make the medical industry a better place for clinicians to work and for patients to receive care. As Dr. Pronovost said, “We are the only hope that the healthcare system has of improving quality and safety.”
He was inspired years ago by the watershed event that will forever be imprinted upon Johns Hopkins Hospital in Baltimore, the preventable death of 18-month-old Josie King on Feb. 22, 2001. Years after the event, her mother, Sorrel King, a passionate patient safety advocate, wanted to know if hospitals are any safer than they were the day that Josie died. She wanted to know what patient safety experts at Hopkins had done to ensure there would not be another Josie King story.
Patients and their families consistently voice similar desires after they have suffered preventable harm. They want to know what happened, why it happened, what it means for them, and what will be done to prevent it from happening again.1 The latter question is one I am frequently asked by patients and their families at my hospital. “What are you going to do to make sure this does not happen again?”
I would venture to guess most hospitalists have been responsible for some type of preventable patient harm during their careers. We work in complex, high-volume, unpredictable, and continuously changing environments. Many of the patients and families in our care are new to us and are with us for only short periods of time. Those of us who have been responsible for preventable patient harm know that it is an unforgettable moment in time that can weigh upon your conscious. And, of course, we all want to do something to make sure it does not happen again.
That is exactly what patients and their families expect of all of us—to DO something—and they should.
But this can be an overwhelming responsibility, especially when the root causes of harm are difficult either to identify or to fix—such as a miscommunication, a diagnostic error, or an inadequate handoff.
Which gets me back to Dr. Pronovost giving a great talk. His appeal to our audience of about 3,000 hospitalists was to DO something. To make the healthcare system improve quality and safety for future patients. To not wait until we or our colleagues are involved in a preventable harm event. To do something, anything, now, that contributes to safer care, today and every day going forward.
He ended his talk with “I will….” Dr. Pronovost (and I would venture to guess patients and their families) wants each of us to fill in the blank with a statement of personal accountability for action. Unfortunately, many of us still believe that we are personally unable to make complex systems safer for patients. Many of us still believe that patients and the systems they traverse are too complex, unpredictable, unreliable, or noncompliant.
The truth is, patients and systems are indeed complex, unpredictable, unreliable, and noncompliant. The further truth is, the only way to make care safer is for each of us to start with a collective shared mental model that we can make it better—and for each of us to commit to personal accountability for action.
My “I Will”
So, while I really enjoyed Dr. Pronovost’s talk, what I enjoyed even more was reading the section in last month’s edition of The Hospitalist in which about a half dozen hospitalists interviewed after the plenary accepted the challenge of filling in the blank “I will….” A few excerpts:
- “I will let them know that everything is possible…”
- “I will improve healthcare…”
- “[I will] make sure the patient is heard…”
By a simple proclamation of personal accountability, a mere thousand hospitalists attending an annual meeting can collectively and progressively change the safety of healthcare in thousands of hospitals around the country. It starts with thinking we can do it and publicly committing to the journey. Although we are still a relatively new specialty, we have permeated almost every hospital in the country, and we have outpaced the growth of any specialty in the history of modern medicine. We are perfectly poised to be the safety change agents for every hospital system. As Margaret Meade famously said, “Never doubt that a small group of thoughtful, committed citizens can change the world; indeed, it’s the only thing that ever has….”
So don’t delay. Whether or not you had the good fortune of being inspired at the SHM annual meeting, each of us owes it to our patients to commit to improving the safety of healthcare and paving the future of hospital care. Get out your pen, craft a commitment now, follow through with it, and make hospitals safer tomorrow than they were yesterday.
I will…
Reference
- Gallagher TH, Waterman AD, Ebers AG, Fraser VJ, Levinson W. Patients’ and physicians’ attitudes regarding the disclosure of medical errors. JAMA. 2003;289(8):1001-1007.