User login
Ergonomic Strain in Minimally Invasive Surgery: Addressing the Strain Epidemic
From the Division of Reproductive Endocrinology and Infertility, Department of Obstetrics, Gynecology and Reproductive Science, Robert Wood Johnson Medical School, Rutgers University, New Brunswick, NJ (Dr. Fransasiak), and the Division of Gynecologic Oncology, Department of Obstetrics and Gynecology, University of North Carolina, Chapel Hill, NC (Dr. Gehrig).
Abstract
- Background: Minimally invasive surgery (MIS) has benefits to both patients and society and its use has increased markedly over the past 3 decades. With its introduction, new mental and physical challenges were presented to the surgeons, leading to concerns regarding operative ergonomics. Applied ergonomics has been used to study and improve operative techniques and technologies as they apply to MIS.
- Objective: To review the ergonomic challenges presented by both traditional MIS as well as robot-assisted MIS and discuss how ergonomic science has evolved to address these issues.
- Methods: Review of the literature involving MIS and applied ergonomics
- Results: Surgeon strain as it relates to MIS has historically been thought to occur in only approximately 15% of MIS surgeons. More recent data suggests this number is much higher. Rates of strain have been reported to be as high as 88% among traditional MIS surgeons and 45% among robotic-assisted MIS surgeons. Strain results from a number of factors, including instrument design and use, optics placement and resolution, patient and surgeon positioning, and the drive to implement surgical technologies which aim to further minimize the invasiveness of surgical procedures.
- Conclusion: Improvements in applied ergonomics in MIS have resulted in improved optics, more sophisticated and ergonomic instruments, and methods of optimizing positioning. However, despite these advancements, ergonomic strain rates amongst surgeons remain alarmingly high. With the ever-increasing demand for MIS, more research and development as well as MIS surgeon training are needed to improve the safety of surgeons and ensure the career longevity required to meet the patient and societal demand for MIS.
Since its introduction to North America in the 1980s, minimally invasive surgery (MIS) has become widely accepted and practiced across surgical disciplines including general surgery, gynecologic surgery, oncology, and thoracic surgery [1]. Procedures once done through large incisions, such as cholecystectomies, have been supplanted by those utilizing 2 or 3 small punctures as the gold standard.
The demand for MIS has been rising and is driven by both providers and patients. The minimally invasive approaches have been shown to decrease recovery time, result in less postoperative pain, and decrease blood loss and other surgical complications [2,3], allowing for patients and their supports to return to baseline function more quickly [4]. In this way, both individual patients and society as a whole derives benefits from MIS through decreased recovery times and return to productivity.
Despite the clear benefits to patients and society, there has been increasing evidence of an unanticipated side effect of MIS: surgeon ergonomic strain and injury [5].Although the same ultimate procedure is performed when open techniques are employed as when MIS is utilized, surgeons have reported increased physical stress and mental strain when utilizing minimally invasive technologies [6,7]. The phenomenon was first noted during the laparoscopic surgery boom of the early 1990s and has been revisited more recently in the setting of both traditional and robotic-assisted MIS techniques [5,8,9].
The source of the issues arises from the fact the surgeons are, by definition, operating with reduced access to the patient. This requires limiting the degrees of freedom in movements, employing specialized and often awkward or cumbersome instruments, and requiring use of an intracorporeal camera that projects the surgical field onto a screen, which causes increased mental strain due to perceptual challenges as well as visual strain [7,10–13].
The initial large survey studies characterizing surgeon strain during MIS revealed rates of strain and discomfort in the 12% to 18% range, with many reporting that strain was persistent and not simply limited to operative time [11,14]. In part, these early estimates focused on very experienced surgeons and thus may have underreported the rates of strain. Subsequently, other studies have quoted rates of strain in the 40% to 60% range [15,16]. These studies focused on a larger and more hetero-geneous group of MIS surgeons, which may explain the higher rates of strain. Most recently, in the setting of an ever growing demand for MIS, large survey studies have revealed rates of surgeon strain to be as high as 87% and 88% among traditional MIS surgeons and 45% among robotic-assisted MIS surgeons, with 26% reporting persistent strain beyond the robotic console time [5,9,17]. This prolonged strain can impact productivity, with 14% of surgeons limiting the number of surgical cases they do per day, and may impact quality of life, with 29% needing to seek treatment for strain related to MIS [9].
Here we review the 2 major forms of MIS, traditional and robotic-assisted surgery. The unique features of each type of MIS that predispose to surgeon strain are discussed along with the techniques and technologies that have been employed to improve the ergonomics of MIS and reduce surgeon strain.
Traditional MIS
Traditional MIS, developed in the 1980s, involves use of a surgeon-manipulated intracorporeal video camera to view the surgical field. Instruments are placed through fixed ports inserted through the body wall called trocars. Most MIS surgical suites involve 1 or more surgeons standing aside a patient holding the camera and surgical instruments and viewing the surgical field on monitors placed around the patient.
The field and technology have evolved greatly since its inception. However, there are a number of factors that persist in creating ergonomic strain during traditional MIS.
Instruments
MIS instruments are limited by several factors. They must have long, thin shafts that can be placed and removed through fixed trocars. The majority of trocars commonly used are 5 to 10 mm in diameter. Given this fixed point, the instrument motion is inverted in the operative cavity, which requires mental adjustment and scaling. Additionally, the range of motion of MIS instruments is limited to 5 degrees of freedom, which allows for less dexterity than is commonly enjoyed during open surgery through large incisions, which accommodate the surgeons hands and allows for more degrees of freedom and dexterity [18]. These limitations have historically yielded instruments that have not been ergonomically sound. Indeed, MIS instrument are identified as an ergonomic problem by over 80% of minimally invasive surgeons [19].
Additionally, given that the surgeon’s hands are often occupied with the camera and an operative tool, the activation of suction devices and electrocautery devices often requires use of instrument foot pedals. Requiring that the instrument and camera be optimally positioned and relatively stationary and the foot pedal be activated simultaneously can exacerbate poor posture and back strain as the surgeon balances on one foot. The addition of foot pedals around the operative table also further limits space for proper surgeon
positioning [19].
Ergonomic engineering has focused on instrument handles. To accommodate the varied sizes of surgeon hands, many companies have altered the size of the device handles allowing for a more comfortable grip. To address the issue of poor posture induced by the use of foot pedals, many instruments now have trigger finger or thumb-activated buttons on the handle of the device itself, which alleviates the need for positioning to activate a foot pedal. However, many of these may not be suitable to accommodate smaller hands.
Optics
A major limitation of MIS is the limited visual field. The video monitor is positioned outside of the sterile operative field, often requiring that the surgeon looks in one direction and operates in another direction, placing strain in both the axial or rotational and frontal or flexion/extension planes [20]. The surgeon does not have immediate visual access to the entire surgical field but rather must rely on movement of the camera, which can at times result in unnatural and uncomfortable positions in order to position the camera optimally [19]. Additionally, eye strain can result from constant visualization of the operative monitor throughout the surgery. Finally, until only recently, optic systems required operating in 2 dimensions, without the depth perception enjoyed during traditional open surgery.
To address neck and upper body strain as well as optic strain, operative monitor positioning has received significant emphasis. The original MIS video monitors were small, had poor resolution, and were fixed in their position. Over time, monitors have increased in size and resolution, allowing for easier viewing and decreased optic strain. Additionally, in the 1990s the MIS operative suite concept allowed for placement of monitors on swing arms, which allow for movement about the operating room with ease. Subsequently, use of systems that employed multiple monitors placed around the patient at different angles with independent height and inclination adjustment allowed for comfortable positioning for all members of the surgical team, particularly in cases where 2 or more surgeons are operating simultaneously [21]. The implementation of these monitor systems not only decrease ergonomic strain but have also been shown to improve intraoperative speed and surgical accuracy when performing standardized tasks [22,23].
The most recent advance in surgical optics has been the introduction of 3-dimensional (3D) imaging systems [21,24,25]. At present, most of these systems are cost prohibitive and have poorer resolution than the traditional 2-dimensional monitors which may in fact increase optic strain. The modern high-definition 2D monitor systems in current use have done much to decrease optic strain and further refinement of 3D technology may prove to mitigate this strain even further.
Operative Posture
MIS often involves assuming unnatural postures to manipulate instruments and visualize the operative monitors. When non-neutral posture is maintained, muscles require an increase in energy production in order to maintain the same contractile forces and the contractile forces required to stabilize joints is increased [20]. Maintaining these static positions for long periods of time results in rapid fatigue, muscle pain, and cramping, and strain that can persist after the operation is complete [19].
Attention to ideal posture is paramount during MIS. The surgeon should be upright next to the patient with the head slightly bent forward, ideally employing a shift in position of the neck from time to time throughout the surgery to avoid prolonged static positioning [11]. The arms should rest so that the elbow is at the side with a 90- to 120-degree bend to accommodate instrument manipulation. This angle can be tolerated for long period of time as opposed to angles that require the elbow be taken away from the side of the body [19]. The forearm should rest in the neutral rotating position between pronated and supinated whenever possible with the wrist slightly extended and the fingers slightly bent [26]. This neutral position allows for rapid and simple changes in grip.
Adjustment of table height or use of operative foot platforms is crucial to ensuring the arms remain in neutral position. Given that the patient is often positioned in steep Trendelenburg or reverse Trendelenburg for MIS, the standard operating beds may not be at a height that allows the surgeon to operate in a relaxed, neutral posture [27,28]. In these circumstances, rather than operating with arms and shoulders in an elevated position, a position that produces rapid upper extremity fatigue, surgeons should elevate themselves with the assistance of an operative platform or step.
Single Incision Laparoscopic Surgery
Most recently, single port laparoscopic surgery (SPLS), also called single incision laparoscopic surgery (SILS) has been introduced. This technique involves use of a slightly larger, single incision that allows for a single port, which accommodates several instruments and the operative camera. This enhances some of the challenges posed with traditional MIS, namely maintaining exposure of the operative field, sustaining pneumatic pressure in the operative space, avoiding instrument collision both intra- and extracorporeally, and avoiding instrument interference with optics [29].
A number of techniques have been employed to minimize these issues. For example, percutaneous sutures may be placed intraoperatively in order to assist with retraction and improve visualization. The most important technological advances have come in the form of coaxial, flexible, and articulating instruments to avoid collisions [29]. While there is a learning curve with these technologies in terms of instrument triangulation, they can be successfully employed to improve operative efficiency and ergonomics.
Robot-Assisted MIS
Robot-assisted MIS involves the use of intracorporeal instruments attached to robotic arms that have been docked to trocars. The surgeon controls these robotic arms with a computer console and a video monitor is available for the surgical assistants. Many robot-assisted surgeries involve the use of an assistant, who utilizes traditional MIS instruments and trocars. The same issues in ergonomics discussed above apply to the assistant surgeon. Here, we will focus on the ergonomic challenges unique to operating surgeon at a robotic console.
There have been several robotic systems developed for use during surgery. At present, only the da Vinci surgical system (Intuitive Surgical, Sunnyvale, CA) is in use in the United States. Several components of the robotic systems allow for potential advantages over traditional MIS in terms of ergonomics. First, as discussed, the primary surgeon is seated at a robotic console rather than standing next to the patient. The camera and instruments are held intracorporeally by the robotic system and controlled by the surgeon at the console. The mechanical engineering, which is associated with the instruments of the robotic system, allows for many for degrees of freedom in range of motion, which permits the surgeon to employ techniques which more closely mimic open surgical techniques.
The robotic surgical system has experienced rapid acceptance and growth over the past decade [30–33]. One small case comparison study and 1 large prospective analysis of over 200 procedures have suggested that robotic surgery is more ergonomically favorable and potentially less mentally stressful than conventional minimally invasive surgery [34,35]. However, although robotic surgery is often thought of as a tool to alleviate strain related to MIS [36,37], there are still high levels of strain, with some survey data indicating strain rates as high as 45%, involved with robotic surgery [8,9]. It is clear that, as with traditional MIS, effective interventions are needed to prevent and reduce strain to prevent work-related injury in robot-assisted MIS.
A primary cause of ergonomic strain during robot-assisted MIS is the lack of knowledge and training regard-ing proper ergonomic techniques at seated console work stations amongst surgeons, with as few as 16% of surgeons reporting any formal training [5,9,17,38]. Furthermore, when compared with traditional MIS, there is little available literature specific to robotic surgery ergonomics. Much of the data available has been extrapolated from recommendations from the U.S. Department of Labor’s Occupational Safety and Health Administration’s (OSHA’s) guidelines for working positions at workstations and on the available body of literature on the ergonomics of microscopy, which, due to somewhat similar positioning, have been adapted for robotic-assisted MIS [39].
The Robotic Console
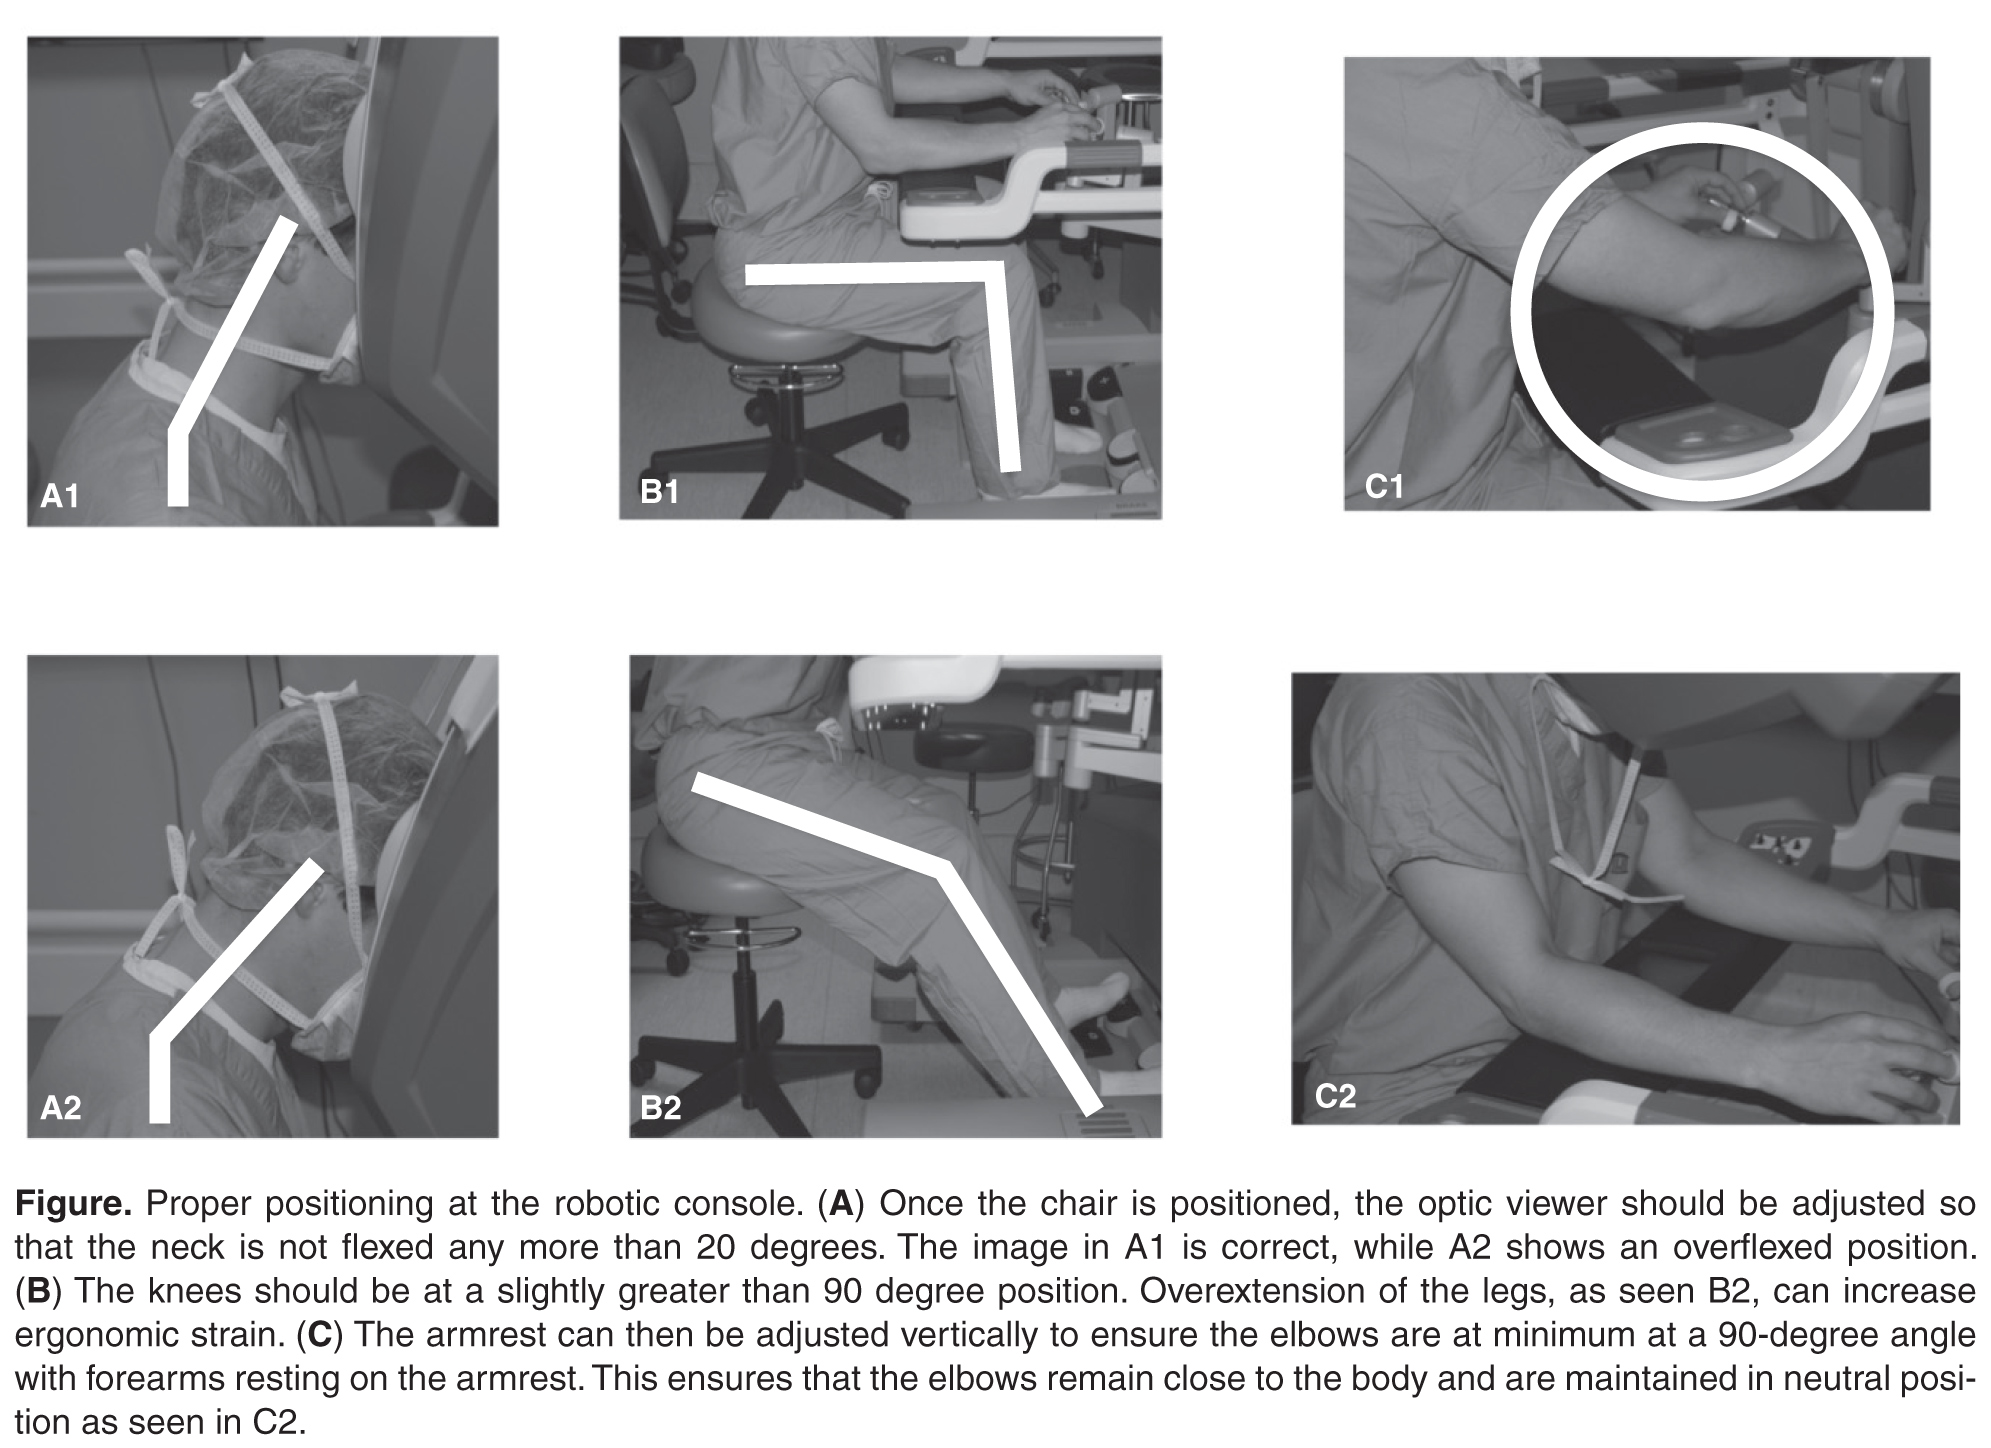
When addressing applied ergonomics in robot-assisted MIS, the primary focuses in on the robotic console set-up and the surgeon positioning. The primary focus is on ensuring a comfortable headrest and adjustable ocular height, which relieves neck, shoulder, and upper back strain, and proper adjustment of armrests and finger controls aimed at minimizing arm and upper back strain due to static load forces [40].
The most common pitfalls during robotic-assisted MIS are when the arms are moved from the arm rest and the elbows flare out from the side of the operator. This departure from neutral position, common when attempting to reach for structures that are on the edge of the surgical field, causes significant tension and strain and is often not corrected for long period of time. Frequent use of the robotic clutch, which freezes the intracorporeal arms and allows for movement of the console arms freely, to bring the body back to neutral position is of paramount importance [17].
Conclusion
The field of applied ergonomics in surgery has never been more important. The fields of both traditional and robot-assisted MIS are growing rapidly and demand for these technologies will only increase as outcomes continue to improve. As the increasing workload of MIS is handled by a pool of surgeons that is not increasing rapidly enough to meet the demand, more volume will be handled by each surgeon.
With ergonomic strain now reported by nearly 90% of surgeons, much of it persistent strain beyond operative time, we will run into situations where surgeons may compensate for this persistent strain by decreasing operative volume and may decide to retire earlier than they otherwise might have. This could result in a health care supply problem as demand for MIS increases and the surgeon pool available to perform it stays constant or decreases.
To date, there has been relatively little research into this issue. The epidemiologic data on surgeon strain comes primarily from survey research done within various MIS subspecialties. There has been some data based on objective measures of strain utilizing validated strain indicators, but more work in this area is needed. Standardized methods of reporting strain will assist in clarifying both the epidemiology and standardize the response to interventions. Studies that aim to address the reported rates of strain are also needed. Much of the early work focused on operating room set-up and resulted in great improvements. More work is needed to assess optimal ergonomic positioning and formal surgeon training.
The solution will involve a combination of engineering advances in operating room set-up and equipment design along with a renewed focus on teaching ergonomic techniques and principles to MIS surgeons. While early data is promising and shows that training sessions in ergonomics are easy, acceptable by surgeons, and effective, more data is needed to develop optimal training session and modules when it comes to traditional and robot-assisted MIS ergonomics [17]. As ergonomic studies specifically designed to address this population accrue, more data driven guidelines can be developed and implemented.
Corresponding author: Jason M. Franasiak, MD, 140 Allen Rd., Basking Ridge, NJ 07920, [email protected].
Financial disclosures: None
1. Cuschieri A. Laparoscopic surgery: current status, issues and future developments. Surg J R Coll Surg Edinb Irel 2005;3:125–30, 132–3, 135–8.
2. Gehrig PA, Cantrell LA, Shafer A, et al. What is the optimal minimally invasive surgical procedure for endometrial cancer staging in the obese and morbidly obese woman? Gynecol Oncol 2008;111:41–5.
3. Walker JL, Piedmonte MR, Spirtos NM, et al. Laparoscopy compared with laparotomy for comprehensive surgical staging of uterine cancer: Gynecologic Oncology Group Study LAP2. J Clin Oncol 2009;27:5331–6.
4. Bell MC, Torgerson J, Seshadri-Kreaden U, et al. Comparison of outcomes and cost for endometrial cancer staging via traditional laparotomy, standard laparoscopy and robotic techniques. Gynecol Oncol 2008;111:407–11.
5. Park A, Lee G, Seagull FJ, et al. Patients benefit while surgeons suffer: an impending epidemic. J Am Coll Surg 2010;210:306–13.
6. Kant IJ, de Jong LC, van Rijssen-Moll M, Borm PJ. A survey of static and dynamic work postures of operating room staff. Int Arch Occup Environ Health 1992;63:423–8.
7. Patkin M, Isabel L. Ergonomics, engineering and surgery of endosurgical dissection. J R Coll Surg Edinb 1995;40:120–32.
8. Craven R, Franasiak J, Mosaly P, Gehrig PA. Ergonomic deficits in robotic gynecologic oncology surgery: a need for intervention. J Minim Invasive Gynecol 2013;20:648–55.
9. Franasiak J, Ko EM, Kidd J, et al. Physical strain and urgent need for ergonomic training among gynecologic oncologists who perform minimally invasive surgery. Gynecol Oncol 2012;126:437–42.
10. Berguer R. Surgical technology and the ergonomics of laparoscopic instruments. Surg Endosc 1998;12:458–62.
11. Berguer R. Surgery and ergonomics. Arch Surg 1999;134:1011–6.
12. Berguer R, Forkey DL, Smith WD. The effect of laparoscopic instrument working angle on surgeons’ upper extremity workload. Surg Endosc 2001;15:1027–9.
13. Lawson EH, Curet MJ, Sanchez BR, et al. Postural ergonomics during robotic and laparoscopic gastric bypass surgery: a pilot project. J Robot Surg 2007;1:61–7.
14. Van Veelen MA, Meijer DW. Ergonomics and design of laparoscopic instruments: results of a survey among laparoscopic surgeons. J Laparoendosc Adv Surg Tech A 1999;9:481–9.
15. Van Veelen MA, Nederlof EA, Goossens RHM, et al. Ergonomic problems encountered by the medical team related to products used for minimally invasive surgery. Surg Endosc 2003;17:1077–81.
16. Lawther RE, Kirk GR, Regan MC. Laparoscopic procedures are associated with a significant risk of digital nerve injury for general surgeons. Ann R Coll Surg Engl 2002;84:443.
17. Franasiak J, Craven R, Mosaly P, Gehrig PA. Feasibility and acceptance of a robotic surgery ergonomic training program. JSLS 2014;18(4).
18. Ballantyne GH. The pitfalls of laparoscopic surgery: challenges for robotics and telerobotic surgery. Surg Laparosc Endosc Percutan Tech 2002;12:1–5.
19. Matern U. Ergonomic deficiencies in the operating room: examples from minimally invasive surgery. Work 2009;33:165–8.
20. Van Det MJ, Meijerink WJHJ, Hoff C, et al. Optimal ergonomics for laparoscopic surgery in minimally invasive surgery suites: a review and guidelines. Surg Endosc 2009;23:1279–85.
21. Veelen MA, Jakimowicz JJ, Goossens RHM, et al. Evaluation of the usability of two types of image display systems, during laparoscopy. Surg Endosc 2002;16:674–8.
22. Haveran LA, Novitsky YW, Czerniach DR, et al. Optimizing laparoscopic task efficiency: the role of camera and monitor positions. Surg Endosc 2007;21:980–4.
23. Hanna GB, Shimi SM, Cuschieri A. Task performance in endoscopic surgery is influenced by location of the image display. Ann Surg 1998;227:481–4.
24. Ballantyne GH. Robotic surgery, telerobotic surgery, telepresence, and telementoring. Review of early clinical results. Surg Endosc 2002;16:1389–402.
25. Boppart SA, Deutsch TF, Rattner DW. Optical imaging technology in minimally invasive surgery. Current status and future directions. Surg Endosc 1999;13:718–22.
26. Matern U, Waller P. Instruments for minimally invasive surgery: principles of ergonomic handles. Surg Endosc 1999;13:174–82.
27. Matern U, Waller P, Giebmeyer C, et al. Ergonomics: requirements for adjusting the height of laparoscopic operating tables. JSLS 2001;5:7–12.
28. Van Veelen MA, Kazemier G, Koopman J, et al. Assessment of the ergonomically optimal operating surface height for laparoscopic surgery. J Laparoendosc Adv Surg Tech A 2002;12:47–52.
29. Tang B, Hou S, Cuschieri SA. Ergonomics of and technologies for single-port lapaxroscopic surgery. Minim Invasive Ther Allied Technol 2012;21:46–54.
30. Wexner SD, Bergamaschi R, Lacy A, et al. The current status of robotic pelvic surgery: results of a multinational interdisciplinary consensus conference. Surg Endosc 2009;23:438–43.
31. Challacombe BJ, Khan MS, Murphy D, Dasgupta P. The history of robotics in urology. World J Urol 2006;24:120–7.
32. Ballantyne GH, Moll F. The da Vinci telerobotic surgical system: the virtual operative field and telepresence surgery. Surg Clin North Am 2003;83:1293–304, vii.
33. Ruurda JP, van Vroonhoven TJ, Broeders IA. Robot-assisted surgical systems: a new era in laparoscopic surgery. Ann R Coll Surg Engl 2002;84:223–6.
34. Mohr CJ, Nadzam GS, Curet MJ. Totally robotic Roux-en-Y gastric bypass. Arch Surg 2005;140:779–86.
35. Talamini MA, Chapman S, Horgan S, Melvin WS; Academic Robotics Group. A prospective analysis of 211 robotic-assisted surgical procedures. Surg Endosc 2003;17:1521–4.
36. Mucksavage P, Kerbl DC, Lee JY. The da Vinci Surgical System overcomes innate hand dominance. J Endourol 2011;25:1385–8.
37. Schreuder HW, Verheijen RH. Robotic surgery. BJOG 2009;116:198–213.
38. Stone R, McCloy R. Ergonomics in medicine and surgery. BMJ 2004;328:1115–8.
39. Lux MM, Marshall M, Erturk E, Joseph JV. Ergonomic evaluation and guidelines for use of the daVinci Robot system. J Endourol 2010;24:371–5.
40. Sillanpaa J, Nyberg M, Laippala P. A new table for work with a microscope, a solution to ergonomic problems. Appl Ergon 2003;34:621–8.
From the Division of Reproductive Endocrinology and Infertility, Department of Obstetrics, Gynecology and Reproductive Science, Robert Wood Johnson Medical School, Rutgers University, New Brunswick, NJ (Dr. Fransasiak), and the Division of Gynecologic Oncology, Department of Obstetrics and Gynecology, University of North Carolina, Chapel Hill, NC (Dr. Gehrig).
Abstract
- Background: Minimally invasive surgery (MIS) has benefits to both patients and society and its use has increased markedly over the past 3 decades. With its introduction, new mental and physical challenges were presented to the surgeons, leading to concerns regarding operative ergonomics. Applied ergonomics has been used to study and improve operative techniques and technologies as they apply to MIS.
- Objective: To review the ergonomic challenges presented by both traditional MIS as well as robot-assisted MIS and discuss how ergonomic science has evolved to address these issues.
- Methods: Review of the literature involving MIS and applied ergonomics
- Results: Surgeon strain as it relates to MIS has historically been thought to occur in only approximately 15% of MIS surgeons. More recent data suggests this number is much higher. Rates of strain have been reported to be as high as 88% among traditional MIS surgeons and 45% among robotic-assisted MIS surgeons. Strain results from a number of factors, including instrument design and use, optics placement and resolution, patient and surgeon positioning, and the drive to implement surgical technologies which aim to further minimize the invasiveness of surgical procedures.
- Conclusion: Improvements in applied ergonomics in MIS have resulted in improved optics, more sophisticated and ergonomic instruments, and methods of optimizing positioning. However, despite these advancements, ergonomic strain rates amongst surgeons remain alarmingly high. With the ever-increasing demand for MIS, more research and development as well as MIS surgeon training are needed to improve the safety of surgeons and ensure the career longevity required to meet the patient and societal demand for MIS.
Since its introduction to North America in the 1980s, minimally invasive surgery (MIS) has become widely accepted and practiced across surgical disciplines including general surgery, gynecologic surgery, oncology, and thoracic surgery [1]. Procedures once done through large incisions, such as cholecystectomies, have been supplanted by those utilizing 2 or 3 small punctures as the gold standard.
The demand for MIS has been rising and is driven by both providers and patients. The minimally invasive approaches have been shown to decrease recovery time, result in less postoperative pain, and decrease blood loss and other surgical complications [2,3], allowing for patients and their supports to return to baseline function more quickly [4]. In this way, both individual patients and society as a whole derives benefits from MIS through decreased recovery times and return to productivity.
Despite the clear benefits to patients and society, there has been increasing evidence of an unanticipated side effect of MIS: surgeon ergonomic strain and injury [5].Although the same ultimate procedure is performed when open techniques are employed as when MIS is utilized, surgeons have reported increased physical stress and mental strain when utilizing minimally invasive technologies [6,7]. The phenomenon was first noted during the laparoscopic surgery boom of the early 1990s and has been revisited more recently in the setting of both traditional and robotic-assisted MIS techniques [5,8,9].
The source of the issues arises from the fact the surgeons are, by definition, operating with reduced access to the patient. This requires limiting the degrees of freedom in movements, employing specialized and often awkward or cumbersome instruments, and requiring use of an intracorporeal camera that projects the surgical field onto a screen, which causes increased mental strain due to perceptual challenges as well as visual strain [7,10–13].
The initial large survey studies characterizing surgeon strain during MIS revealed rates of strain and discomfort in the 12% to 18% range, with many reporting that strain was persistent and not simply limited to operative time [11,14]. In part, these early estimates focused on very experienced surgeons and thus may have underreported the rates of strain. Subsequently, other studies have quoted rates of strain in the 40% to 60% range [15,16]. These studies focused on a larger and more hetero-geneous group of MIS surgeons, which may explain the higher rates of strain. Most recently, in the setting of an ever growing demand for MIS, large survey studies have revealed rates of surgeon strain to be as high as 87% and 88% among traditional MIS surgeons and 45% among robotic-assisted MIS surgeons, with 26% reporting persistent strain beyond the robotic console time [5,9,17]. This prolonged strain can impact productivity, with 14% of surgeons limiting the number of surgical cases they do per day, and may impact quality of life, with 29% needing to seek treatment for strain related to MIS [9].
Here we review the 2 major forms of MIS, traditional and robotic-assisted surgery. The unique features of each type of MIS that predispose to surgeon strain are discussed along with the techniques and technologies that have been employed to improve the ergonomics of MIS and reduce surgeon strain.
Traditional MIS
Traditional MIS, developed in the 1980s, involves use of a surgeon-manipulated intracorporeal video camera to view the surgical field. Instruments are placed through fixed ports inserted through the body wall called trocars. Most MIS surgical suites involve 1 or more surgeons standing aside a patient holding the camera and surgical instruments and viewing the surgical field on monitors placed around the patient.
The field and technology have evolved greatly since its inception. However, there are a number of factors that persist in creating ergonomic strain during traditional MIS.
Instruments
MIS instruments are limited by several factors. They must have long, thin shafts that can be placed and removed through fixed trocars. The majority of trocars commonly used are 5 to 10 mm in diameter. Given this fixed point, the instrument motion is inverted in the operative cavity, which requires mental adjustment and scaling. Additionally, the range of motion of MIS instruments is limited to 5 degrees of freedom, which allows for less dexterity than is commonly enjoyed during open surgery through large incisions, which accommodate the surgeons hands and allows for more degrees of freedom and dexterity [18]. These limitations have historically yielded instruments that have not been ergonomically sound. Indeed, MIS instrument are identified as an ergonomic problem by over 80% of minimally invasive surgeons [19].
Additionally, given that the surgeon’s hands are often occupied with the camera and an operative tool, the activation of suction devices and electrocautery devices often requires use of instrument foot pedals. Requiring that the instrument and camera be optimally positioned and relatively stationary and the foot pedal be activated simultaneously can exacerbate poor posture and back strain as the surgeon balances on one foot. The addition of foot pedals around the operative table also further limits space for proper surgeon
positioning [19].
Ergonomic engineering has focused on instrument handles. To accommodate the varied sizes of surgeon hands, many companies have altered the size of the device handles allowing for a more comfortable grip. To address the issue of poor posture induced by the use of foot pedals, many instruments now have trigger finger or thumb-activated buttons on the handle of the device itself, which alleviates the need for positioning to activate a foot pedal. However, many of these may not be suitable to accommodate smaller hands.
Optics
A major limitation of MIS is the limited visual field. The video monitor is positioned outside of the sterile operative field, often requiring that the surgeon looks in one direction and operates in another direction, placing strain in both the axial or rotational and frontal or flexion/extension planes [20]. The surgeon does not have immediate visual access to the entire surgical field but rather must rely on movement of the camera, which can at times result in unnatural and uncomfortable positions in order to position the camera optimally [19]. Additionally, eye strain can result from constant visualization of the operative monitor throughout the surgery. Finally, until only recently, optic systems required operating in 2 dimensions, without the depth perception enjoyed during traditional open surgery.
To address neck and upper body strain as well as optic strain, operative monitor positioning has received significant emphasis. The original MIS video monitors were small, had poor resolution, and were fixed in their position. Over time, monitors have increased in size and resolution, allowing for easier viewing and decreased optic strain. Additionally, in the 1990s the MIS operative suite concept allowed for placement of monitors on swing arms, which allow for movement about the operating room with ease. Subsequently, use of systems that employed multiple monitors placed around the patient at different angles with independent height and inclination adjustment allowed for comfortable positioning for all members of the surgical team, particularly in cases where 2 or more surgeons are operating simultaneously [21]. The implementation of these monitor systems not only decrease ergonomic strain but have also been shown to improve intraoperative speed and surgical accuracy when performing standardized tasks [22,23].
The most recent advance in surgical optics has been the introduction of 3-dimensional (3D) imaging systems [21,24,25]. At present, most of these systems are cost prohibitive and have poorer resolution than the traditional 2-dimensional monitors which may in fact increase optic strain. The modern high-definition 2D monitor systems in current use have done much to decrease optic strain and further refinement of 3D technology may prove to mitigate this strain even further.
Operative Posture
MIS often involves assuming unnatural postures to manipulate instruments and visualize the operative monitors. When non-neutral posture is maintained, muscles require an increase in energy production in order to maintain the same contractile forces and the contractile forces required to stabilize joints is increased [20]. Maintaining these static positions for long periods of time results in rapid fatigue, muscle pain, and cramping, and strain that can persist after the operation is complete [19].
Attention to ideal posture is paramount during MIS. The surgeon should be upright next to the patient with the head slightly bent forward, ideally employing a shift in position of the neck from time to time throughout the surgery to avoid prolonged static positioning [11]. The arms should rest so that the elbow is at the side with a 90- to 120-degree bend to accommodate instrument manipulation. This angle can be tolerated for long period of time as opposed to angles that require the elbow be taken away from the side of the body [19]. The forearm should rest in the neutral rotating position between pronated and supinated whenever possible with the wrist slightly extended and the fingers slightly bent [26]. This neutral position allows for rapid and simple changes in grip.
Adjustment of table height or use of operative foot platforms is crucial to ensuring the arms remain in neutral position. Given that the patient is often positioned in steep Trendelenburg or reverse Trendelenburg for MIS, the standard operating beds may not be at a height that allows the surgeon to operate in a relaxed, neutral posture [27,28]. In these circumstances, rather than operating with arms and shoulders in an elevated position, a position that produces rapid upper extremity fatigue, surgeons should elevate themselves with the assistance of an operative platform or step.
Single Incision Laparoscopic Surgery
Most recently, single port laparoscopic surgery (SPLS), also called single incision laparoscopic surgery (SILS) has been introduced. This technique involves use of a slightly larger, single incision that allows for a single port, which accommodates several instruments and the operative camera. This enhances some of the challenges posed with traditional MIS, namely maintaining exposure of the operative field, sustaining pneumatic pressure in the operative space, avoiding instrument collision both intra- and extracorporeally, and avoiding instrument interference with optics [29].
A number of techniques have been employed to minimize these issues. For example, percutaneous sutures may be placed intraoperatively in order to assist with retraction and improve visualization. The most important technological advances have come in the form of coaxial, flexible, and articulating instruments to avoid collisions [29]. While there is a learning curve with these technologies in terms of instrument triangulation, they can be successfully employed to improve operative efficiency and ergonomics.
Robot-Assisted MIS
Robot-assisted MIS involves the use of intracorporeal instruments attached to robotic arms that have been docked to trocars. The surgeon controls these robotic arms with a computer console and a video monitor is available for the surgical assistants. Many robot-assisted surgeries involve the use of an assistant, who utilizes traditional MIS instruments and trocars. The same issues in ergonomics discussed above apply to the assistant surgeon. Here, we will focus on the ergonomic challenges unique to operating surgeon at a robotic console.
There have been several robotic systems developed for use during surgery. At present, only the da Vinci surgical system (Intuitive Surgical, Sunnyvale, CA) is in use in the United States. Several components of the robotic systems allow for potential advantages over traditional MIS in terms of ergonomics. First, as discussed, the primary surgeon is seated at a robotic console rather than standing next to the patient. The camera and instruments are held intracorporeally by the robotic system and controlled by the surgeon at the console. The mechanical engineering, which is associated with the instruments of the robotic system, allows for many for degrees of freedom in range of motion, which permits the surgeon to employ techniques which more closely mimic open surgical techniques.
The robotic surgical system has experienced rapid acceptance and growth over the past decade [30–33]. One small case comparison study and 1 large prospective analysis of over 200 procedures have suggested that robotic surgery is more ergonomically favorable and potentially less mentally stressful than conventional minimally invasive surgery [34,35]. However, although robotic surgery is often thought of as a tool to alleviate strain related to MIS [36,37], there are still high levels of strain, with some survey data indicating strain rates as high as 45%, involved with robotic surgery [8,9]. It is clear that, as with traditional MIS, effective interventions are needed to prevent and reduce strain to prevent work-related injury in robot-assisted MIS.
A primary cause of ergonomic strain during robot-assisted MIS is the lack of knowledge and training regard-ing proper ergonomic techniques at seated console work stations amongst surgeons, with as few as 16% of surgeons reporting any formal training [5,9,17,38]. Furthermore, when compared with traditional MIS, there is little available literature specific to robotic surgery ergonomics. Much of the data available has been extrapolated from recommendations from the U.S. Department of Labor’s Occupational Safety and Health Administration’s (OSHA’s) guidelines for working positions at workstations and on the available body of literature on the ergonomics of microscopy, which, due to somewhat similar positioning, have been adapted for robotic-assisted MIS [39].
The Robotic Console
When addressing applied ergonomics in robot-assisted MIS, the primary focuses in on the robotic console set-up and the surgeon positioning. The primary focus is on ensuring a comfortable headrest and adjustable ocular height, which relieves neck, shoulder, and upper back strain, and proper adjustment of armrests and finger controls aimed at minimizing arm and upper back strain due to static load forces [40].
The most common pitfalls during robotic-assisted MIS are when the arms are moved from the arm rest and the elbows flare out from the side of the operator. This departure from neutral position, common when attempting to reach for structures that are on the edge of the surgical field, causes significant tension and strain and is often not corrected for long period of time. Frequent use of the robotic clutch, which freezes the intracorporeal arms and allows for movement of the console arms freely, to bring the body back to neutral position is of paramount importance [17].
Conclusion
The field of applied ergonomics in surgery has never been more important. The fields of both traditional and robot-assisted MIS are growing rapidly and demand for these technologies will only increase as outcomes continue to improve. As the increasing workload of MIS is handled by a pool of surgeons that is not increasing rapidly enough to meet the demand, more volume will be handled by each surgeon.
With ergonomic strain now reported by nearly 90% of surgeons, much of it persistent strain beyond operative time, we will run into situations where surgeons may compensate for this persistent strain by decreasing operative volume and may decide to retire earlier than they otherwise might have. This could result in a health care supply problem as demand for MIS increases and the surgeon pool available to perform it stays constant or decreases.
To date, there has been relatively little research into this issue. The epidemiologic data on surgeon strain comes primarily from survey research done within various MIS subspecialties. There has been some data based on objective measures of strain utilizing validated strain indicators, but more work in this area is needed. Standardized methods of reporting strain will assist in clarifying both the epidemiology and standardize the response to interventions. Studies that aim to address the reported rates of strain are also needed. Much of the early work focused on operating room set-up and resulted in great improvements. More work is needed to assess optimal ergonomic positioning and formal surgeon training.
The solution will involve a combination of engineering advances in operating room set-up and equipment design along with a renewed focus on teaching ergonomic techniques and principles to MIS surgeons. While early data is promising and shows that training sessions in ergonomics are easy, acceptable by surgeons, and effective, more data is needed to develop optimal training session and modules when it comes to traditional and robot-assisted MIS ergonomics [17]. As ergonomic studies specifically designed to address this population accrue, more data driven guidelines can be developed and implemented.
Corresponding author: Jason M. Franasiak, MD, 140 Allen Rd., Basking Ridge, NJ 07920, [email protected].
Financial disclosures: None
1. Cuschieri A. Laparoscopic surgery: current status, issues and future developments. Surg J R Coll Surg Edinb Irel 2005;3:125–30, 132–3, 135–8.
2. Gehrig PA, Cantrell LA, Shafer A, et al. What is the optimal minimally invasive surgical procedure for endometrial cancer staging in the obese and morbidly obese woman? Gynecol Oncol 2008;111:41–5.
3. Walker JL, Piedmonte MR, Spirtos NM, et al. Laparoscopy compared with laparotomy for comprehensive surgical staging of uterine cancer: Gynecologic Oncology Group Study LAP2. J Clin Oncol 2009;27:5331–6.
4. Bell MC, Torgerson J, Seshadri-Kreaden U, et al. Comparison of outcomes and cost for endometrial cancer staging via traditional laparotomy, standard laparoscopy and robotic techniques. Gynecol Oncol 2008;111:407–11.
5. Park A, Lee G, Seagull FJ, et al. Patients benefit while surgeons suffer: an impending epidemic. J Am Coll Surg 2010;210:306–13.
6. Kant IJ, de Jong LC, van Rijssen-Moll M, Borm PJ. A survey of static and dynamic work postures of operating room staff. Int Arch Occup Environ Health 1992;63:423–8.
7. Patkin M, Isabel L. Ergonomics, engineering and surgery of endosurgical dissection. J R Coll Surg Edinb 1995;40:120–32.
8. Craven R, Franasiak J, Mosaly P, Gehrig PA. Ergonomic deficits in robotic gynecologic oncology surgery: a need for intervention. J Minim Invasive Gynecol 2013;20:648–55.
9. Franasiak J, Ko EM, Kidd J, et al. Physical strain and urgent need for ergonomic training among gynecologic oncologists who perform minimally invasive surgery. Gynecol Oncol 2012;126:437–42.
10. Berguer R. Surgical technology and the ergonomics of laparoscopic instruments. Surg Endosc 1998;12:458–62.
11. Berguer R. Surgery and ergonomics. Arch Surg 1999;134:1011–6.
12. Berguer R, Forkey DL, Smith WD. The effect of laparoscopic instrument working angle on surgeons’ upper extremity workload. Surg Endosc 2001;15:1027–9.
13. Lawson EH, Curet MJ, Sanchez BR, et al. Postural ergonomics during robotic and laparoscopic gastric bypass surgery: a pilot project. J Robot Surg 2007;1:61–7.
14. Van Veelen MA, Meijer DW. Ergonomics and design of laparoscopic instruments: results of a survey among laparoscopic surgeons. J Laparoendosc Adv Surg Tech A 1999;9:481–9.
15. Van Veelen MA, Nederlof EA, Goossens RHM, et al. Ergonomic problems encountered by the medical team related to products used for minimally invasive surgery. Surg Endosc 2003;17:1077–81.
16. Lawther RE, Kirk GR, Regan MC. Laparoscopic procedures are associated with a significant risk of digital nerve injury for general surgeons. Ann R Coll Surg Engl 2002;84:443.
17. Franasiak J, Craven R, Mosaly P, Gehrig PA. Feasibility and acceptance of a robotic surgery ergonomic training program. JSLS 2014;18(4).
18. Ballantyne GH. The pitfalls of laparoscopic surgery: challenges for robotics and telerobotic surgery. Surg Laparosc Endosc Percutan Tech 2002;12:1–5.
19. Matern U. Ergonomic deficiencies in the operating room: examples from minimally invasive surgery. Work 2009;33:165–8.
20. Van Det MJ, Meijerink WJHJ, Hoff C, et al. Optimal ergonomics for laparoscopic surgery in minimally invasive surgery suites: a review and guidelines. Surg Endosc 2009;23:1279–85.
21. Veelen MA, Jakimowicz JJ, Goossens RHM, et al. Evaluation of the usability of two types of image display systems, during laparoscopy. Surg Endosc 2002;16:674–8.
22. Haveran LA, Novitsky YW, Czerniach DR, et al. Optimizing laparoscopic task efficiency: the role of camera and monitor positions. Surg Endosc 2007;21:980–4.
23. Hanna GB, Shimi SM, Cuschieri A. Task performance in endoscopic surgery is influenced by location of the image display. Ann Surg 1998;227:481–4.
24. Ballantyne GH. Robotic surgery, telerobotic surgery, telepresence, and telementoring. Review of early clinical results. Surg Endosc 2002;16:1389–402.
25. Boppart SA, Deutsch TF, Rattner DW. Optical imaging technology in minimally invasive surgery. Current status and future directions. Surg Endosc 1999;13:718–22.
26. Matern U, Waller P. Instruments for minimally invasive surgery: principles of ergonomic handles. Surg Endosc 1999;13:174–82.
27. Matern U, Waller P, Giebmeyer C, et al. Ergonomics: requirements for adjusting the height of laparoscopic operating tables. JSLS 2001;5:7–12.
28. Van Veelen MA, Kazemier G, Koopman J, et al. Assessment of the ergonomically optimal operating surface height for laparoscopic surgery. J Laparoendosc Adv Surg Tech A 2002;12:47–52.
29. Tang B, Hou S, Cuschieri SA. Ergonomics of and technologies for single-port lapaxroscopic surgery. Minim Invasive Ther Allied Technol 2012;21:46–54.
30. Wexner SD, Bergamaschi R, Lacy A, et al. The current status of robotic pelvic surgery: results of a multinational interdisciplinary consensus conference. Surg Endosc 2009;23:438–43.
31. Challacombe BJ, Khan MS, Murphy D, Dasgupta P. The history of robotics in urology. World J Urol 2006;24:120–7.
32. Ballantyne GH, Moll F. The da Vinci telerobotic surgical system: the virtual operative field and telepresence surgery. Surg Clin North Am 2003;83:1293–304, vii.
33. Ruurda JP, van Vroonhoven TJ, Broeders IA. Robot-assisted surgical systems: a new era in laparoscopic surgery. Ann R Coll Surg Engl 2002;84:223–6.
34. Mohr CJ, Nadzam GS, Curet MJ. Totally robotic Roux-en-Y gastric bypass. Arch Surg 2005;140:779–86.
35. Talamini MA, Chapman S, Horgan S, Melvin WS; Academic Robotics Group. A prospective analysis of 211 robotic-assisted surgical procedures. Surg Endosc 2003;17:1521–4.
36. Mucksavage P, Kerbl DC, Lee JY. The da Vinci Surgical System overcomes innate hand dominance. J Endourol 2011;25:1385–8.
37. Schreuder HW, Verheijen RH. Robotic surgery. BJOG 2009;116:198–213.
38. Stone R, McCloy R. Ergonomics in medicine and surgery. BMJ 2004;328:1115–8.
39. Lux MM, Marshall M, Erturk E, Joseph JV. Ergonomic evaluation and guidelines for use of the daVinci Robot system. J Endourol 2010;24:371–5.
40. Sillanpaa J, Nyberg M, Laippala P. A new table for work with a microscope, a solution to ergonomic problems. Appl Ergon 2003;34:621–8.
Early Parkinsonism: Distinguishing Idiopathic Parkinson’s Disease from Other Syndromes
From the VA Medical Center (Dr. Lehosit) and the Parkinson’s and Movement Disorders Center, Virginia Commonwealth University (Dr. Cloud), Richmond, VA.
Abstract
- Objective: To provide an overview of the importance and challenges of accurate diagnosis of early idiopathic Parkinson’s disease and practical guidelines for clinicians.
- Methods: Review of the relevant literature.
- Results: Idiopathic Parkinson’s disease is a common neurodegenerative disorder causing a wide spectrum of motor and nonmotor symptoms. The cardinal motor features include resting tremors, bradykinesia, rigidity, and postural instability. The diagnosis is clinical, and ancillary laboratory or radiology tests are unnecessary in typical cases. Despite the use of validated diagnostic criteria, misdiagnosis is common, especially early in the disease process. This is largely due to the phenotypic heterogeneity in the idiopathic Parkinson’s disease population as well phenotypic overlapping with other diseases. The diseases most commonly confused with idiopathic Parkinson’s disease are the Parkinson-plus syndromes (dementia with Lewy bodies, multiple system atrophy, progressive supranuclear palsy, and corticobasal degeneration), vascular parkinsonism, drug-induced parkinsonism, dopa responsive dystonia, normal pressure hydrocephalus, and essential tremor. Since the diagnosis of these other diseases is also clinical, familiarity with their typical presentations and most current diagnostic criteria is helpful. Brain MRI can be helpful in diagnosing some of the diseases, though brain imaging is most commonly unremarkable in idiopathic Parkinson’s disease. DaTscan has an FDA indication to assist in the evaluation of adults with parkinsonian syndromes. It should not be used in typical cases but can be a useful adjunct to other diagnostic evaluations in atypical cases.
- Conclusion: Despite the challenges involved, accurate and early diagnosis of idiopathic Parkinson’s disease is essential for optimal patient education, counseling, and treatment.
Idiopathic Parkinson’s disease (IPD) is a common neurodenerative disease, affecting 1% of the population over the age of 65 [1]. A definitive diagnosis requires the postmortem findings of degeneration of the substantia nigra pars compacta and the presence of Lewy bodies (insoluble cytoplasmic inclusions composed of aggregated alpha-synuclein). In the later stages of the disease, a correct clinical diagnosis is made in more than 90% of patients [2]. Early on, however, clinical diagnosis is less reliable. For clinicians, distinguishing early IPD from other parkinsonian syndromes can be extraordinarily challenging because these conditions, especially in the earliest stages, present with highly variable yet overlapping phenotypes [3]. Furthermore, most of the diseases in the differential diagnosis, including IPD itself, are clinical diagnoses made on the basis of history and examination without the benefit of laboratory or radiology data. A high level of clinical acumen is therefore required for early and accurate diagnosis. Recent clinical trials in which subspecialists performed stringent diagnostic assessments to identify subjects with clinically diagnosed IPD later found that some subjects had normal functional dopamine imaging, suggesting that they probably did not have IPD [4,5]. These trials served to highlight the possibility of misdiagnosis, even in the hands of highly trained subspecialists. Early and accurate diagnosis is of paramount importance for many reasons. First, treatment approaches differ significantly across many of these diseases. Second, as neuroprotective interventions that are currently under investigation become available, long-term outcomes may significantly improve with earlier diagnosis and intervention. Third, some of these diseases are prognostically very different from one another, so accurate diagnosis enables better counseling and setting realistic expectations for progression.
This review will discuss the most common presenting signs and symptoms of early IPD, present the most widely used diagnostic criteria, and introduce the ancillary laboratory and imaging tests that may be helpful in distinguishing it from its mimics. The diseases most commonly confused with early IPD will also be discussed with an emphasis on the ways they most commonly differ from IPD. We will begin our discussion with the presenting signs and symptoms of IPD.
Idiopathic Parkinson’s Disease
IPD typically has a subtle and insidious onset with characteristic features developing over months to years. IPD most often presents in patients after age 60, and age is the most consistent risk factor for developing IPD; however, approximately 5% of IPD cases begin before age 40 years. These young-onset cases are likely to be caused by genetic mutations [6]. The widely recognized cardinal motor features of IPD include asymmetric resting tremor, rigidity, bradykinesia and postural instability [7]. Asymmetry is a key feature, as symptoms typically start on one side and remain more prominent on that side as the disease progresses. In fact, lack of asymmetry suggests an alternative diagnosis. Of the cardinal motor features, tremor is most often reported by patients as the first symptom [8]. However, IPD can alternately present with various other motor or even nonmotor complaints that will be discussed later.
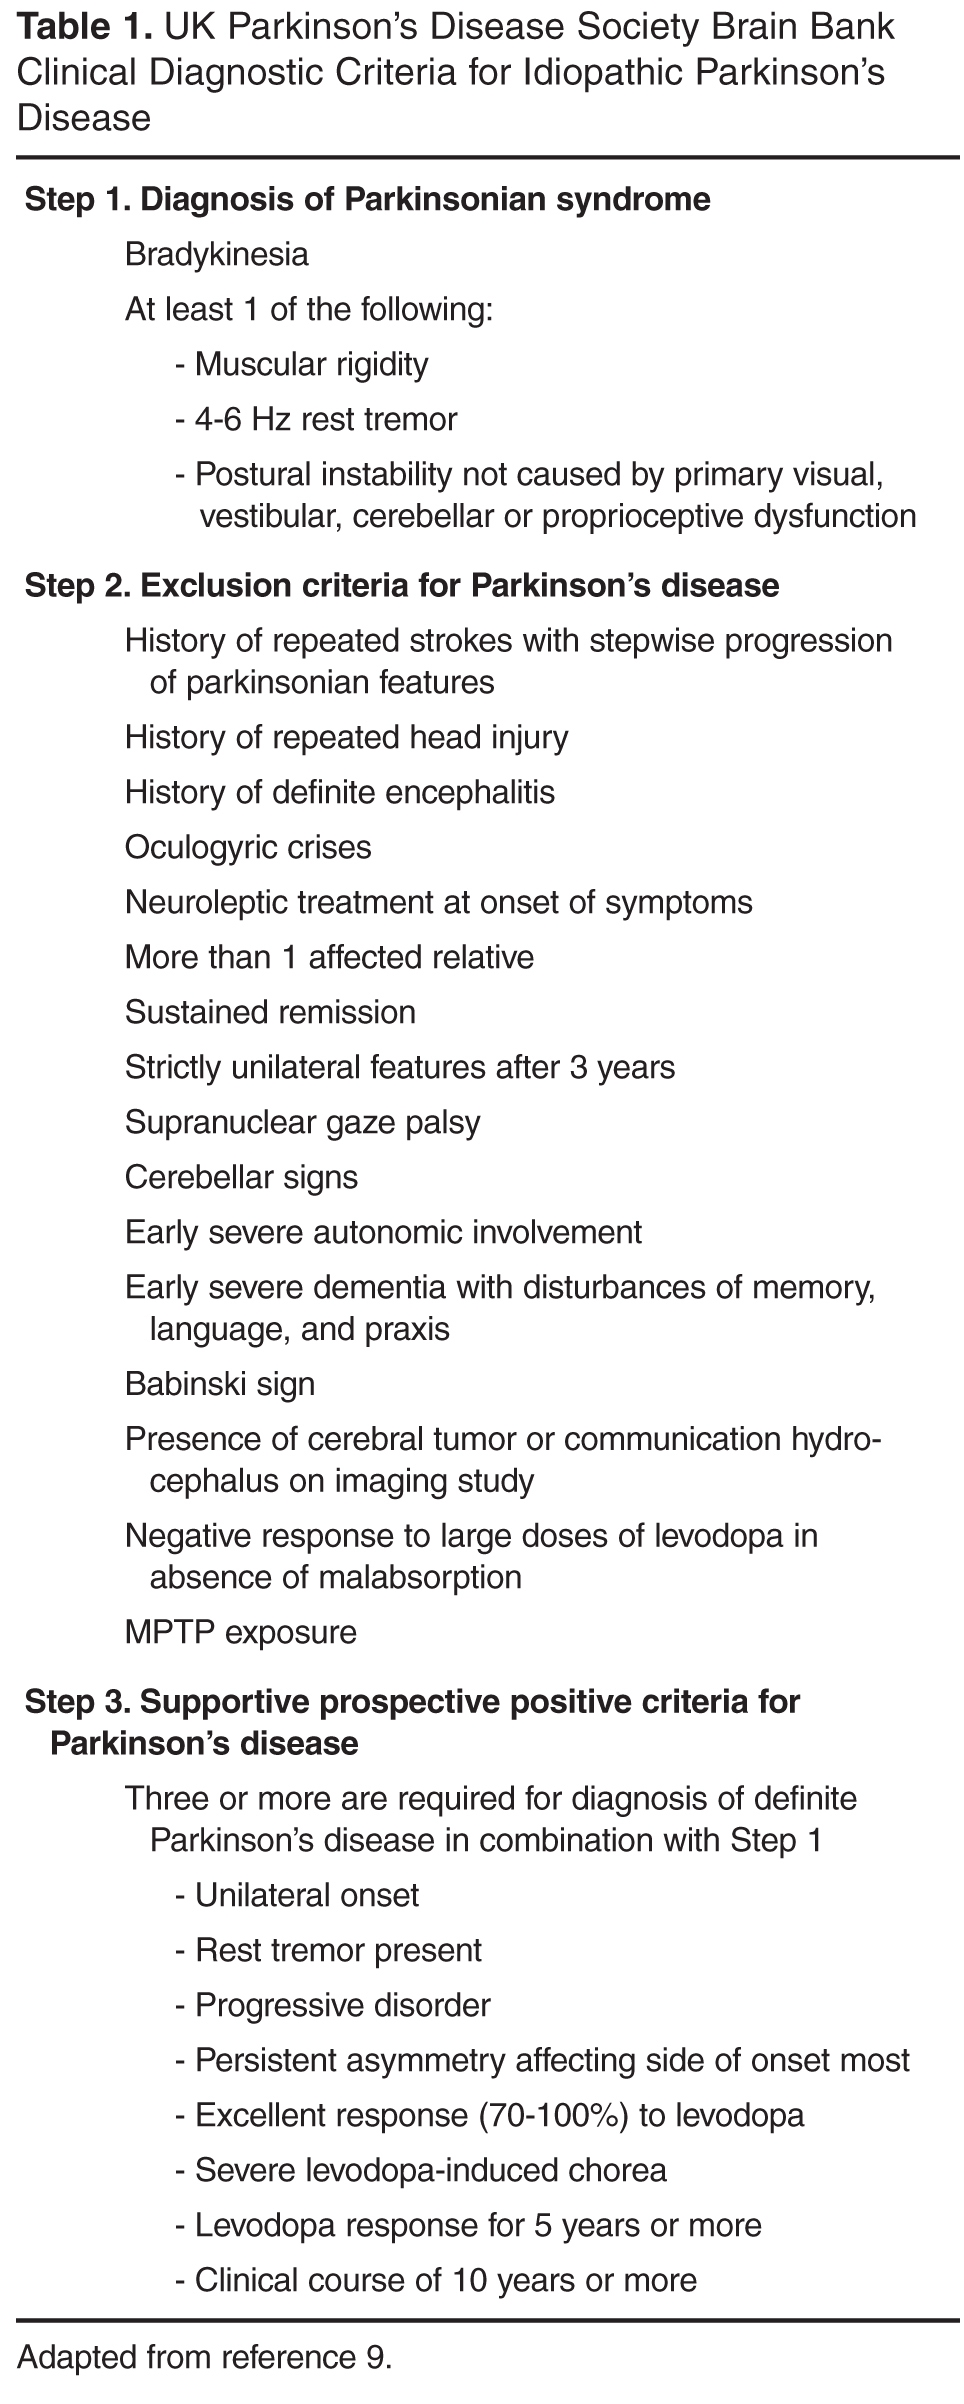
Motor Features
Resting tremor is the most common presenting sign/symptom of early IPD, found in approximately 70% of patients [8]. The tremor typically is asymmetric and intermittent at onset, often starting in one hand. It is sometimes, though not necessarily, described as a “pill-rolling” rhythmic movement of the thumb and first finger while the hand is at rest. Patients will usually report a worsening of tremor with stress, anxiety, and increased fatigue. The tremor does not persist during sleep and diminishes with voluntary activity of the affected limb(s). By having the patient perform mentally challenging tasks (such as counting backwards) or motor movements of other body parts (such as finger tapping with the other hand or walking), the examiner may notice an increase in tremor amplitude [11]. There may also be a resting tremor of the lip or lower jaw, but true head tremor suggests an alternate diagnosis such as essential tremor [12]. Postural tremor can co-exist with resting tremor in IPD, which often leads to diagnostic confusion, especially when the postural tremor is more prominent than the resting tremor. In this scenario, the distinction between IPD and essential tremor (discussed later) can become more difficult.
Rigidity is characterized as the presence of increased resistance to passive stretch throughout the range of motion [13]. “Lead pipe” rigidity remains sustained throughout the motion of the joint, while “cogwheel” rigidity is intermittent through the movement. The examiner must take care to distinguish between true rigidity and other forms of increased tone such as spasticity (a velocity dependent increase in tone) and paratonia (a resistance to passive motion created by the patient). Subtle rigidity can be enhanced in a limb by having the patient perform a voluntary movement of the contralateral limb [14]. Rigidity in early IPD is also asymmetric and most commonly found in the upper extremities, but it can be seen in the neck and lower extremities as well. Patients may initially complain of shoulder pain and stiffness that is diagnosed as rotator cuff disease or arthritis, when this pain is actually due to rigidity from Parkinson’s disease [15]. Severe axial rigidity out of proportion to appendicular rigidity, however, should suggest an alternate diagnosis in the early stages of the disease (such as progressive supranuclear palsy which is further discussed below).
Bradykinesia refers to decreased amplitude and speed of voluntary motor movements. This sign can be found throughout the body in the form of hypometric saccades, decreased blink rate, decreased facial expressions (“masked facies”) and softening of speech (hypophonia) [16]. Patients may initially report a general slowing down of movements as well as difficulty with handwriting due to their writing becoming smaller (micrographia) [17]. Bradykinesia is evaluated by testing the speed, amplitude, and rhythmicity of voluntary movements such as repetitive tapping of the thumb and first finger together, alternation of supination and pronation of the forearm and hand, opening and closing the hand and tapping the foot rhythmically on the floor. The examiner should also evaluate for generalized bradykinesia by viewing the patient rise from a seated to standing position as well as observing the patient’s normal speed of ambulation and speed and symmetry of arm swing.
Gait disturbance and postural instability can sometimes be found in early IPD; however, significant impairment of postural reflexes, gait impairment and early falls may point to a diagnosis other than IPD. Early IPD postural changes include mild flexion of the neck or trunk that may be accompanied by a slight leaning to one side. On examination of natural gait, the patient may exhibit asymmetrically reduced arm swing, slowing of gait and turning, shortened stride length and intermittent shuffling of the feet. With disease progression, all of these become more severe and there may be festination of gait (“hurried” gate with increased cadence and difficulty stopping). This can lead to instability and falls as the patient’s center of balance is displaced forward. Freezing of gait can also develop, but is rarely found in early IPD [18]. Postural stability is evaluated by the “pull test” where the patient is asked to stand in a comfortable stance with eyes open and feet apart and instructed to resist falling backwards when pulled by the examiner. The patient is allowed to take one step backwards with either foot if necessary to prevent falling. This test is usually normal in early IPD, but it often becomes abnormal with disease progression.
Because of dramatic heterogeneity in the expression of these cardinal motor features in IPD, patients are often subcategorized based upon the most prominent features of their motor exam. Well-recognized motor subtypes include tremor-predominant, akinetic-rigid, postural instability gait disorder PD (PIGD), and mixed [19]. Tremor-predominant patients are those with significant tremors that overshadow the other motor features of the disease, while akinetic-rigid patients have prominent bradykinesia and rigidity with little to no tremor. PIGD patients have prominent postural and gait abnormalities, while mixed patients have roughly equal amounts of all of the cardinal motor features. Recent research has suggested that these motor subtypes differ with regard to the frequency of comorbid nonmotor features, disease prognosis, and response to certain treatments [20–22]. For example, tremor-predominant patients generally have a good prognosis with slow disease progression while PIGD patients have a poor prognosis with rapid progression, dementia, and depression [19].
Nonmotor Symptoms
Along with the classic motor features of IPD, patients often suffer from a variety of nonmotor symptoms that can sometimes precede the onset of motor symptoms by several years [23]. When nonmotor symptoms are the presenting symptoms, diagnosis is often delayed at 1.6 years versus 1.0 year for individuals with motor presentations [2]. Recognition of a nonmotor prodrome of PD has instigated a debate about whether new diagnostic criteria for early-stage and prodromal PD should be created [24]; for now, however, a diagnosis of PD still requires the motor syndrome. The spectrum of nonmotor symptoms in IPD can include olfactory dysfunction, urinary dysfunction, constipation, depression, anxiety, apathy, cognitive decline, sleep disorders such as REM (rapid eye movement) sleep behavior disorder and restless legs syndrome, fatigue and orthostatic hypotension. While many of these nonmotor symptoms are common in the general population and are certainly not specific to IPD, their presence in conjunction with early parkinsonism can help further support an IPD diagnosis.
Patients with IPD should exhibit a robust and sustained response to levodopa therapy. Over time, as the degenerative disease progresses, doses need to be increased and complications of therapy are likely to emerge, most commonly levodopa-induced dyskinesia, motor and nonmotor fluctuations [25]. The various forms of parkinsonism (discussed later) may have an initial response to levodopa therapy; however, this response is generally transient and wanes quickly despite increases in dose. Many will have no response at all.
Differential Diagnosis
The differential diagnosis for IPD most commonly includes the Parkinson-plus syndromes (dementia with Lewy bodies, multiple system atrophy, progressive supra-nuclear palsy, and corticobasal degeneration), vascular parkinsonism, drug-induced parkinsonism, dopa responsive dystonia, normal pressure hydrocephalus, and essential tremor. Each of these conditions will be discussed in further detail below.
Parkinson-Plus Syndromes
Dementia with Lewy bodies (DLB) may initially resemble IPD as it can present with parkinsonian motor signs, but the distinguishing feature of this disease is the presence of a progressive dementia with deficits in attention and executive function that occurs before or within 1 year of the development of parkinsonian motor signs [26]. This is in contrast to the dementia that can develop in IPD, which usually occurs many years into the disease course. Patients with DLB often have well-formed, visual hallucinations with this disorder. Motor parkinsonian symptoms do not improve with dopaminergic therapy and caution should be used with these patients as psychiatric symptoms may be exacerbated by even small doses of these medications [27]. Diagnostic criteria for probable DLB require the presence of dementia plus at least 2 of the following 3 core features: fluctuating attention and concentration, recurrent well-formed visual hallucinations, and spontaneous parkinsonian motor signs. Suggestive clinical features include REM behavior disorder, severe neuroleptic sensitivity, and low dopamine transporter uptake in the basal ganglia on SPECT or PET imaging. In the absence of 2 core features, the diagnosis of probable DLB can also be made if dementia plus at least 1 suggestive feature is present with just 1 core feature. Possible DLB can be diagnosed with the presence of dementia plus 1 core or suggestive feature. These criteria are 83% sensitive and 95% specific for the presence of neocortical Lewy bodies at autopsy [27]. Other supportive clinical features include repeated falls, syncope, transient loss of consciousness, severe autonomic dysfunction, depression, and systematized delusions or hallucinations in other sensory and perceptual modalities [27]. Definitive diagnosis requires pathological confirmation.

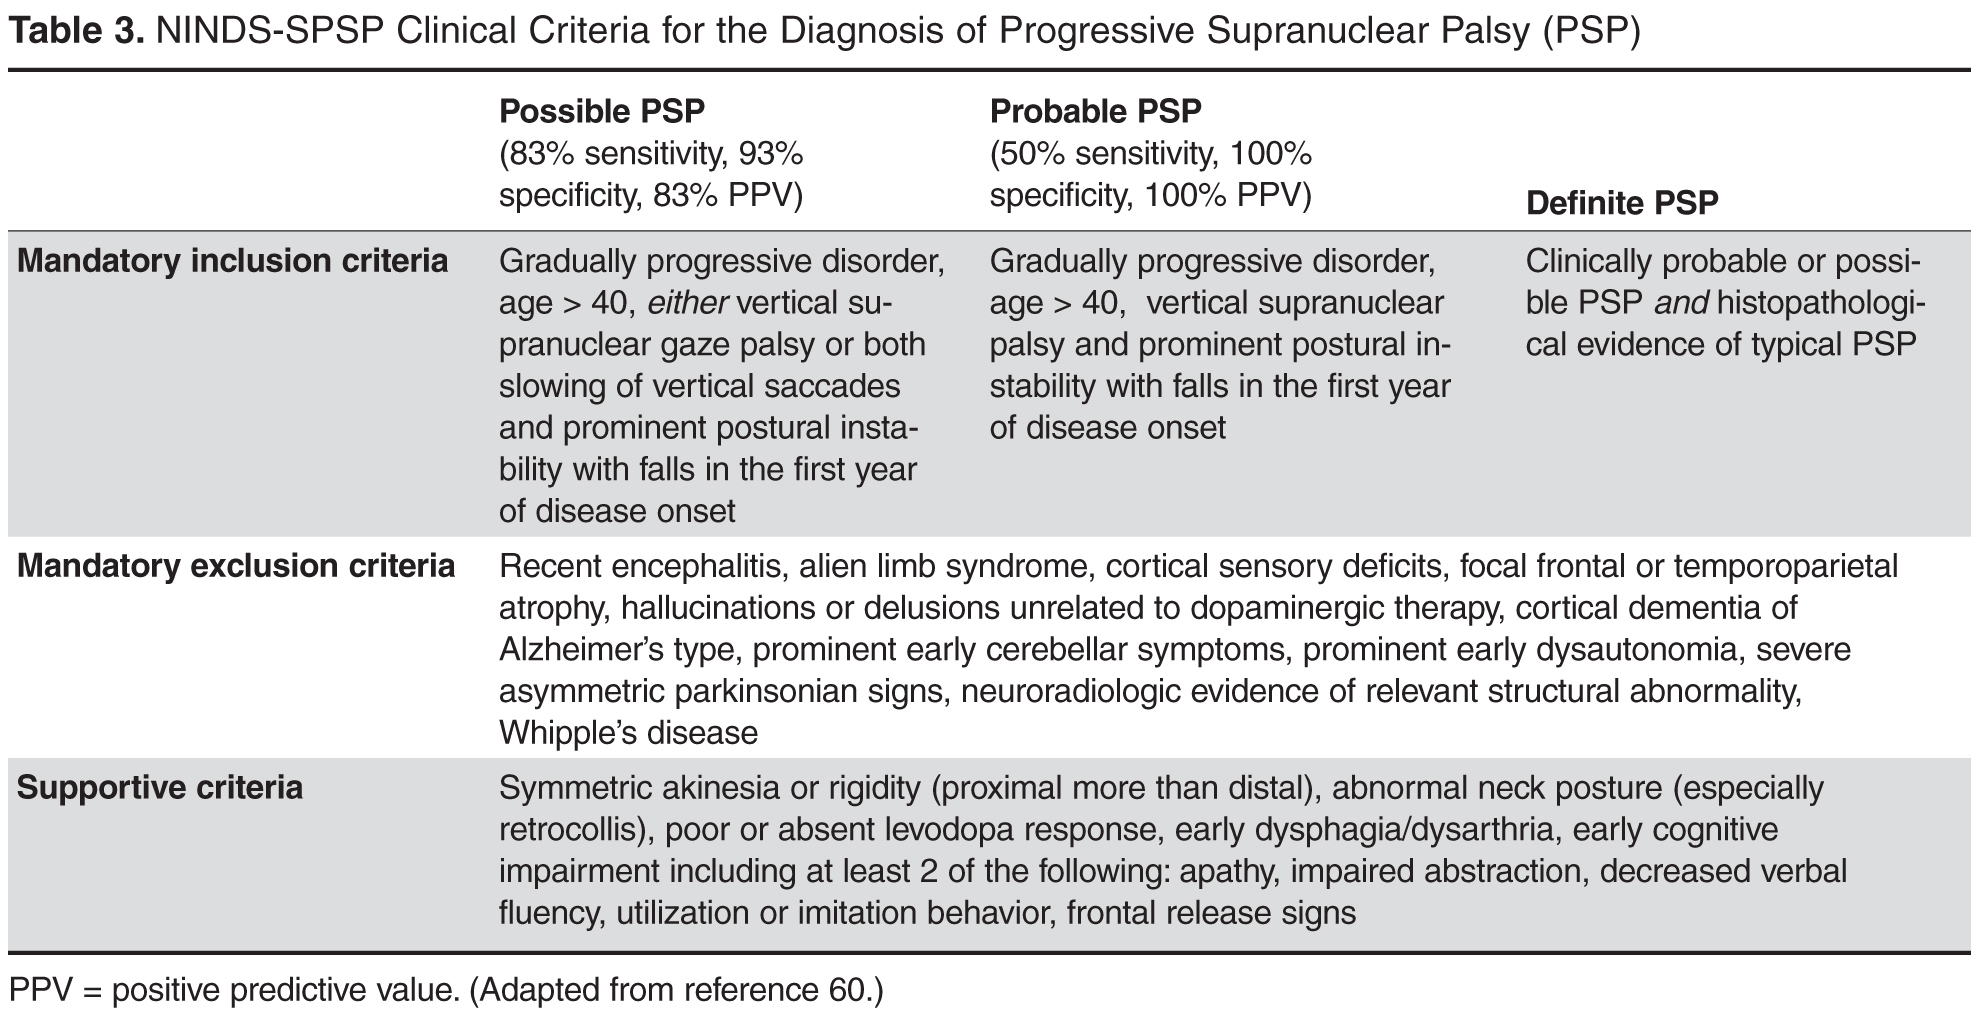
Corticobasal degeneration (CBD) is more rare than the previously described Parkinson-plus syndromes. CBD typically presents with a markedly unilateral/asymmetric motor features and can mimic early IPD, but other defining features include cortical signs of progressive unilateral apraxia, limb dystonia and visual-tactile neglect (“alien limb” sign) that can lead to loss of voluntary control of the extremity. This sign has been reported in approximately half of all patients with CBD [34]. As the disease progresses, cognitive decline, dementia, dysarthria, postural instability and gait dysfunction can all occur [35]. Patients with CBD typically do not show any response to dopaminergic therapy. CBD brain MRI findings include asymmetric cortical atrophy (most commonly in the superior parietal region), bilateral basal ganglia atrophy, corpus callosum atrophy and T2 hyperintensities of the subcortical white matter and posterolateral putamen [36]. In recently published consensus criteria, Armstrong et al broadened the clinical phenotype associated with CBD to acknowledge the spectrum and overlapping phenotypes of tau-related neurodegenerative diseases [37]. The criteria for probable corticobasal syndrome require asymmetric presentation of 2 of: (a) limb rigidity or akinesia, (b) limb dystonia, (c) limb myoclonus plus 2 of: (d) orobuccal or limb apraxia, (e) cortical sensory deficit, (f) alien limb phenomena (more than simple levitation). Possible corticobasal syndrome may be symmetric and requires 1 of: (a) limb rigidity or akinesia, (b) limb dystonia, (c) limb myoclonus plus 1 of: (d) orobuccal or limb apraxia, (e) cortical sensory deficit, (f) alien limb phenomena (more than simple levitation). Unfortunately, these new criteria have not improved the specificity of diagnosis compared to previous criteria as shown by a recent longitudinal clinical and neuropathological study that found that all of their patients with a cortiocobasal syndrome but without corticobasal pathology had all met the new diagnostic criteria for possible or probable CBD [38]. The reader should be aware that Armstrong et al acknowledged that memory dysfunction is common in CBD, although this was not incorporated into the diagnostic criteria.
Other Causes of Parkinsonism
Vascular parkinsonism results from the accumulation of multiple infarcts in the basal ganglia and/or subcortical white matter [39]. It may account for up to 12% of all cases of parkinsonism [40]. There are not any specific clinical diagnostic criteria for vascular parkinsonism; however, the clinical presentation is somewhat distinctive. Vascular parkinsonism initially presents with gait problems, and the upper extremities are less affected than the lower extremities. Vascular parkinsonism has been referred to as “lower body parkinsonism” due to this distribution of symptoms. Patients often present with a characteristic shuffling gait, but may also exhibit significant freezing of gait, even early in the course of the disease (in contrast to IPD). Tremor is reported less consistently and other pyramidal tract signs, urinary symptoms, dementia and pseudobulbar affect resulting from various ischemic lesions often co-exist [41]. Patients tend to have a history of cerebrovascular risk factors. Response to dopaminergic therapy is present in one-third to one-half of patients and is typically short-lived [42]. Brain MRI findings in vascular parkinsonism include diffuse subcortical white or gray matter lesions, particularly involving the globus pallidus, thalamus, substantia nigra and frontal lobes. One study reported a “cutoff” point to help differentiate between vascular parkinsonism and the normal vascular changes associated with aging at 0.6% lesioned volume of brain tissue [43]. It is important to remember that microvascular lesions are commonly seen on MRI scans of older patients and therefore the presence of these lesions on imaging does not necessarily convey a diagnosis of vascular parkinsonism.
Evaluation of any parkinsonian patient should involve careful scrutiny of the medication list (current and past) to exclude the possibility of drug-induced parkinsonism (DIP). DIP is typically, though not always, symmetric in onset. Drugs causing DIP include all of the typical and atypical antipsychotics, dopamine depleters such as reserpine and tetrabenazine, gastrointestinal drugs with dopamine receptor blocking activity such as antiemetics and metoclopramide, calcium channel blockers, valproic acid, selective serotonin reuptake inhibiters and lithium [44]. Traditionally this syndrome was thought to be reversible with discontinuation of the offending drug; however, resolution can require many months and at least 10% of patients with DIP develop persistent and progressive parkinsonism despite discontinuation of the drug [45].
Dopa-responsive dystonia (DRD) most typically presents in childhood with initial onset of lower limb dystonia with parkinsonism developing over time. Symptoms respond robustly to low doses of levodopa, hence the name DRD. Occasionally, however, DRD can present in adulthood. In adult-onset cases of DRD, parkinsonism usually develops before dystonia. Because it presents with parkinsonism and is levodopa responsive, adult-onset DRD can easily be confused with young-onset IPD [46]. Clues to the presence of DRD include diurnal fluctuation, stability of symptoms over time, and a normal DaTscan (discussed later) [46].
Other rare causes of parkinsonism include exposure to toxins (MPTP, manganese, carbon monoxide, methanol), metabolic disorders (hypoparathyroidism, hypothyroidism, acquired hepatocerebral degeneration), early-onset and genetic disorders (Wilson’s disease, juvenile Huntington’s disease, spinocerebellar ataxia types 2 and 3, and neurodegeneration with brain iron accumulation), infectious diseases, trauma, space-occupying brain lesions, autoimmune diseases (Sjogren’s syndrome) and paraneoplastic disorders [47–51]. Further discussion of these more rare causes parkinsonism is beyond the scope of this review; however, clinicians should always carefully consider the past medical, family, and social history, along with the review of systems, as these aspects of the patient history may point to one of these causes of parkinsonism.
Normal pressure hydrocephalus (NPH) refers to chronic communicating hydrocephalus with adult onset. The classic clinical triad of NPH includes cognitive impairment, urinary incontinence, and gait disturbance in the absence of signs of increased intracranial pressure such as papilledema. NPH can present with motor signs similar to those found in vascular parkinsonism, possibly due to the close proximity of basal ganglia structures to the ventricular system [52]. The gait of NPH typically shows a decrease in step height and foot clearance as well as a decrease in walking speed. This is often referred to as a “magnetic gait.” In contrast to Parkinson’s disease patients, the gait disturbance in NPH does not improve with visual cues or dopaminergic therapy [53]. Dementia also occurs early on in the course of NPH and is mostly characterized by apathy, forgetfulness, and impaired recall. Urinary incontinence and urgency is a later finding of the disease in contrast to IPD in which urinary dysfunction is often an early nonmotor symptom. MRI and CT scans of the brain reveal enlarged ventricles (out of proportion to surrounding cerebral atrophy if present) and should be followed by a diagnostic high volume lumbar puncture. Clinical improvement following lumbar puncture is supportive of the diagnosis of NPH and helps to identify patients who may benefit from ventriculoperitoneal shunting [54].
Essential tremor (ET) is characterized by postural and action tremors, rather than resting tremors, though some ET patients can have co-existing resting tremors. Though it is usually bilateral, it is often asymmetric, adding to the potential for diagnostic confusion with IPD. It typically has a higher frequency than the tremor of IPD. The absence of rigidity, bradykinesia, postural and gait disturbances and no response to dopaminergic therapy help distinguish it further from IPD [55]. There is phenotypic overlap between these two conditions and some patients with IPD have more postural tremor than rest tremor (or even postural tremor with no rest tremor), while some with long-standing essential tremor may go on to develop parkinsonism [56].
The Role of DaTscan in Diagnosing Early Parkinsonism

Final Thoughts
Despite the challenges involved, accurate and early diagnosis of IPD is essential for optimal patient education, counseling, and treatment. Careful attention to the initial presentation and examination may be all that is required for diagnosis in typical cases. In atypical cases, brain MRI to evaluate for other diseases or DaTscan may be helpful adjunctive tests. As research advances over the coming years, it is likely that additional imaging or fluid biomarkers will become available to assist us with the diagnosis of IPD (and related disorders) in the early stages. Until then, clinicians must remain highly vigilant in their efforts to make these often challenging clinical diagnoses.
Corresponding author: Leslie J. Cloud, MD, MSc, 6605 West Broad St., Ste. C, Richmond, VA 23230, [email protected].
Financial disclosures: None.
1. Wirdefeldt K, Adami HO, Cole P, et al. Epidemiology and etiology of Parkinson’s disease: a review of the evidence. Eur J Epidemiol 2011;26 Suppl 1:S1–58.
2. O’Sullivan SS, Williams DR, Gallagher DA, et al. Nonmotor symptoms as presenting complaints in Parkinson’s disease: a clinicopathological study. Mov Disord 2008;23:101–6.
3. Ali K, Morris HR. Parkinson’s disease: chameleons and mimics. Pract Neurol 2015;15:14–25.
4. Holloway RG, Shoulson I, Fahn S, et al. Pramipexole vs levodopa as initial treatment for Parkinson disease: a 4-year randomized controlled trial. Arch Neurol 2004;61:1044–53.
5. Whone AL, Watts RL, Stoessl AJ, et al. Slower progression of Parkinson’s disease with ropinirole versus levodopa: The REAL-PET study. Ann Neurol 2003;54:93–101.
6. Wickremaratchi MM, Ben-Shlomo Y, Morris HR. The effect of onset age on the clinical features of Parkinson’s disease. Eur J Neurol 2009;16:450–6.
7. Gelb DJ, Oliver E, Gilman S. Diagnostic criteria for Parkinson disease. Arch Neurol 1999;56:33–9.
8. Rajput AH, Rozdilsky B, Ang L. Occurrence of resting tremor in Parkinson’s disease. Neurology 1991;41:1298–9.
9. Hughes AJ, Daniel SE, Kilford L, Lees AJ. Accuracy of clinical diagnosis of idiopathic Parkinson’s disease: a clinico-pathological study of 100 cases. J Neurol Neurosurg Psychiatry 1992;55:181–4.
10. Dickson DW, Braak H, Duda JE, et al. Neuropathological assessment of Parkinson’s disease: refining the diagnostic criteria. Lancet Neurol 2009;8:1150–7.
11. Raethjen J, Austermann K, Witt K, et al. Provocation of Parkinsonian tremor. Mov Disord 2008;23:1019–23.
12. Roze E, Coêlho-Braga MC, Gayraud D, et al. Head tremor in Parkinson’s disease. Mov Disord 2006;21:1245–8.
13. Hallett M. Parkinson revisited: pathophysiology of motor signs. Adv Neurol 2003;91:19–28.
14. Broussolle E, Krack P, Thobois S, et al. Contribution of Jules Froment to the study of parkinsonian rigidity. Mov Disord 2007;22:909–14.
15. Riley D, Lang AE, Blair RD, et al. Frozen shoulder and other shoulder disturbances in Parkinson’s disease. J Neurol Neurosurg Psychiatry 1989;52:63–6.
16. Rottach KG, Riley DE, DiScenna AO, et al. Dynamic properties of horizontal and vertical eye movements in parkinsonian syndromes. Ann Neurol 1996;39:368–77.
17. Cooper JA, Sagar HJ, Tidswell P, Jordan N. Slowed central processing in simple and go/no-go reaction time tasks in Parkinson’s disease. Brain 1994;117(Pt 3):517–29.
18. Almeida QJ, Lebold CA. Freezing of gait in Parkinson’s disease: a perceptual cause for a motor impairment? J Neurol Neurosurg Psychiatry 2010;81:513–8.
19. Thenganatt MA, Jankovic J. Parkinson disease subtypes. JAMA Neurology 2014;71:499–504.
20. Burn DJ, Rowan EN, Allan LM, et al. Motor subtype and cognitive decline in Parkinson’s disease, Parkinson’s disease with dementia, and dementia with Lewy bodies. J Neurol Neurosurg Psychiatry 2006;77:585–9.
21. Burn DJ, Landau S, Hindle JV, et al; PROMS-PD Study Group. Parkinson’s disease motor subtypes and mood. Mov Disord 2012;27:379–86.
22. Katz M, Luciano MS, Carlson K, et al; CSP 468 study group. Differential effects of deep brain stimulation target on motor subtypes in Parkinson’s disease. Ann Neurol 2015;77:710–9.
23. Savica R, Rocca WA, Ahlskog JE. When does Parkinson disease start? Arch Neurol 2010;67:798–801.
24. Berg D, Postuma RB, Bloem B, et al. Time to redefine PD? Introductory statement of the MDS Task Force on the definition of Parkinson’s disease. Mov Disord 2014;29:454–62.
25. Aquino CC, Fox SH. Clinical spectrum of levodopa-induced complications. Mov Disord 2015;30:80–9.
26. Geser F, Wenning GK, Poewe W, McKeith I. How to diagnose dementia with Lewy bodies: state of the art. Mov Disord 2005;20 Suppl 12:S11–20.
27. Karantzoulis S, Galvin JE. Update on dementia with Lewy bodies. Curr Transl Geriatr Exp Gerontol Rep 2013;2:196–204.
28. Gilman S, Low PA, Quinn N, et al. Consensus statement on the diagnosis of multiple system atrophy. J Neurol Sci 1999;163:94–8.
29. Kim HJ, Jeon BS, Jellinger KA. Diagnosis and differential diagnosis of MSA: boundary issues. J Neurol 2015 Feb 7. [Epub ahead of print]
30. Lee EA, Cho HI, Kim SS, Lee WY. Comparison of magnetic resonance imaging in subtypes of multiple system atrophy. Parkinsonism Relat Disord 2004;10:363–8.
31. Golbe LI, Davis PH, Schoenberg BS, Duvoisin RC. Prevalence and natural history of progressive supranuclear palsy. Neurology 1988;38:1031–4.
32. Maher ER, Lees AJ. The clinical features and natural history of the Steele-Richardson-Olszewski syndrome (progressive supranuclear palsy). Neurology 1986;36:1005–8.
33. Gröschel K, Kastrup A, Litvan I, Schulz JB. Penguins and hummingbirds: midbrain atrophy in progressive supranuclear palsy. Neurology 2006;66:949–50.
34. Rinne JO, Lee MS, Thompson PD, Marsden CD. Corticobasal degeneration. A clinical study of 36 cases. Brain 1994117(Pt 5):1183–96.
35. Grimes DA, Lang AE, Bergeron CB. Dementia as the most common presentation of cortical-basal ganglionic degeneration. Neurology 1999;53:1969–74.
36. Tokumaru AM, O’uchi T, Kuru Y, et al. Corticobasal degeneration: MR with histopathologic comparison. AJNR Am J Neuroradiol 1996;17:1849–52.
37. Armstrong MJ, Litvan I, Lang AE, et al. Criteria for the diagnosis of corticobasal degeneration. Neurology 2013;80:496–503.
38. Alexander SK, Rittman T, Xuereb JH, et al. Validation of the new consensus criteria for the diagnosis of corticobasal degeneration. J Neurol Neurosurg Psychiatry 2014;85:925–9.
39. Sibon I, Fenelon G, Quinn NP, Tison F. Vascular parkinsonism. J Neurol 2004;251:513–24.
40. Thanvi B, Lo N, Robinson T. Vascular parkinsonism--an important cause of parkinsonism in older people. Age Ageing 2005;34:114–9.
41. Kalra S, Grosset DG, Benamer HT. Differentiating vascular parkinsonism from idiopathic Parkinson’s disease: a systematic review. Mov Disord 2010;25:149–56.
42. Mehanna R, Jankovic J. Movement disorders in cerebrovascular disease. Lancet Neurol 2013; 12:597–608.
43. Josephs KA. Frontotemporal lobar degeneration. Neurol Clin 2007;25:683–96, vi.
44. Lopez-Sendon J, Mena MA, de Yebenes JG. Drug-induced parkinsonism. Expert Opin Drug Saf 2013;12:487–96.
45. Mena MA, de Yebenes JG. Drug-induced parkinsonism. Expert Opin Drug Saf 2006;5:759–71.
46. Brajkovic LD, Svetel MV, Kostic VS, et al. Dopamine transporter imaging (123)I-FP-CIT (DaTSCAN) SPET in differential diagnosis of dopa-responsive dystonia and young-onset Parkinson’s disease. Hell J Nucl Med 2012;15:134–8.
47. Krusz JC, Koller WC, Ziegler DK. Historical review: abnormal movements associated with epidemic encephalitis lethargica. Mov Disord 1987;2:137–41.
48. Langston JW, Ballard P, Tetrud JW, Irwin I. Chronic Parkinsonism in humans due to a product of meperidine-analog synthesis. Science 1983;219:979–80.
49. Jankovic J. Searching for a relationship between manganese and welding and Parkinson’s disease. Neurology 2005;64:2021–8.
50. Jankovic J, Kirkpatrick JB, Blomquist KA, et al. Late-onset Hallervorden-Spatz disease presenting as familial parkinsonism. Neurology 1985;35:227–34.
51. Cloud L, Jankovic J. Systemic disease and movement disorders. In: Burn DJ, editor. Oxford textbook of clinical neurology on movement disorders. Oxford University Press; 2013.
52. Bugalho P, Guimaraes J. Gait disturbance in normal pressure hydrocephalus: a clinical study. Parkinsonism Relat Disord 2007;13:434–7.
53. Jankovic J, Newmark M, Peter P. Parkinsonism and acquired hydrocephalus. Mov Disord 1986;1:59–64.
54. Bergsneider M, Black PM, Klinge P, et al. Surgical management of idiopathic normal-pressure hydrocephalus. Neurosurgery 2005;57(3 Suppl): S29-39; discussion ii-v.
55. Bain P, Brin M, Deuschl G, et al. Criteria for the diagnosis of essential tremor. Neurology 2000; 54(11 Suppl 4): S7.
56. Jankovic J. Essential tremor and Parkinson’s disease. Ann Neurol 1989;25:211–2.
57. Catafau AM, Tolosa E; DaTSCAN Clinically Uncertain Parkinsonian Syndromes Study Group. Impact of dopamine transporter SPECT using 123I-Ioflupane on diagnosis and management of patients with clinically uncertain Parkinsonian syndromes. Mov Disord 2004;19:1175–82.
58. Bajaj N, Hauser RA, Grachev ID. Clinical utility of dopamine transporter single photon emission CT (DaT-SPECT) with (123I) ioflupane in diagnosis of parkinsonian syndromes. J Neurol Neurosurg Psychiatry 2013;84:1288–95.
59. Kagi G, Bhatia KP, Tolosa E. The role of DAT-SPECT in movement disorders. J Neurol Neurosurg Psychiatry 2010;81:5–12.
60. Litvan I, Agid Y, Calne D, et al. Clinical research criteria for the diagnosis of progressive supranuclear palsy (Steele-Richardson-Olszewski syndrome): report of the NINDS-SPSP international workshop. Neurology 1996;47:1–9.
From the VA Medical Center (Dr. Lehosit) and the Parkinson’s and Movement Disorders Center, Virginia Commonwealth University (Dr. Cloud), Richmond, VA.
Abstract
- Objective: To provide an overview of the importance and challenges of accurate diagnosis of early idiopathic Parkinson’s disease and practical guidelines for clinicians.
- Methods: Review of the relevant literature.
- Results: Idiopathic Parkinson’s disease is a common neurodegenerative disorder causing a wide spectrum of motor and nonmotor symptoms. The cardinal motor features include resting tremors, bradykinesia, rigidity, and postural instability. The diagnosis is clinical, and ancillary laboratory or radiology tests are unnecessary in typical cases. Despite the use of validated diagnostic criteria, misdiagnosis is common, especially early in the disease process. This is largely due to the phenotypic heterogeneity in the idiopathic Parkinson’s disease population as well phenotypic overlapping with other diseases. The diseases most commonly confused with idiopathic Parkinson’s disease are the Parkinson-plus syndromes (dementia with Lewy bodies, multiple system atrophy, progressive supranuclear palsy, and corticobasal degeneration), vascular parkinsonism, drug-induced parkinsonism, dopa responsive dystonia, normal pressure hydrocephalus, and essential tremor. Since the diagnosis of these other diseases is also clinical, familiarity with their typical presentations and most current diagnostic criteria is helpful. Brain MRI can be helpful in diagnosing some of the diseases, though brain imaging is most commonly unremarkable in idiopathic Parkinson’s disease. DaTscan has an FDA indication to assist in the evaluation of adults with parkinsonian syndromes. It should not be used in typical cases but can be a useful adjunct to other diagnostic evaluations in atypical cases.
- Conclusion: Despite the challenges involved, accurate and early diagnosis of idiopathic Parkinson’s disease is essential for optimal patient education, counseling, and treatment.
Idiopathic Parkinson’s disease (IPD) is a common neurodenerative disease, affecting 1% of the population over the age of 65 [1]. A definitive diagnosis requires the postmortem findings of degeneration of the substantia nigra pars compacta and the presence of Lewy bodies (insoluble cytoplasmic inclusions composed of aggregated alpha-synuclein). In the later stages of the disease, a correct clinical diagnosis is made in more than 90% of patients [2]. Early on, however, clinical diagnosis is less reliable. For clinicians, distinguishing early IPD from other parkinsonian syndromes can be extraordinarily challenging because these conditions, especially in the earliest stages, present with highly variable yet overlapping phenotypes [3]. Furthermore, most of the diseases in the differential diagnosis, including IPD itself, are clinical diagnoses made on the basis of history and examination without the benefit of laboratory or radiology data. A high level of clinical acumen is therefore required for early and accurate diagnosis. Recent clinical trials in which subspecialists performed stringent diagnostic assessments to identify subjects with clinically diagnosed IPD later found that some subjects had normal functional dopamine imaging, suggesting that they probably did not have IPD [4,5]. These trials served to highlight the possibility of misdiagnosis, even in the hands of highly trained subspecialists. Early and accurate diagnosis is of paramount importance for many reasons. First, treatment approaches differ significantly across many of these diseases. Second, as neuroprotective interventions that are currently under investigation become available, long-term outcomes may significantly improve with earlier diagnosis and intervention. Third, some of these diseases are prognostically very different from one another, so accurate diagnosis enables better counseling and setting realistic expectations for progression.
This review will discuss the most common presenting signs and symptoms of early IPD, present the most widely used diagnostic criteria, and introduce the ancillary laboratory and imaging tests that may be helpful in distinguishing it from its mimics. The diseases most commonly confused with early IPD will also be discussed with an emphasis on the ways they most commonly differ from IPD. We will begin our discussion with the presenting signs and symptoms of IPD.
Idiopathic Parkinson’s Disease
IPD typically has a subtle and insidious onset with characteristic features developing over months to years. IPD most often presents in patients after age 60, and age is the most consistent risk factor for developing IPD; however, approximately 5% of IPD cases begin before age 40 years. These young-onset cases are likely to be caused by genetic mutations [6]. The widely recognized cardinal motor features of IPD include asymmetric resting tremor, rigidity, bradykinesia and postural instability [7]. Asymmetry is a key feature, as symptoms typically start on one side and remain more prominent on that side as the disease progresses. In fact, lack of asymmetry suggests an alternative diagnosis. Of the cardinal motor features, tremor is most often reported by patients as the first symptom [8]. However, IPD can alternately present with various other motor or even nonmotor complaints that will be discussed later.
Motor Features
Resting tremor is the most common presenting sign/symptom of early IPD, found in approximately 70% of patients [8]. The tremor typically is asymmetric and intermittent at onset, often starting in one hand. It is sometimes, though not necessarily, described as a “pill-rolling” rhythmic movement of the thumb and first finger while the hand is at rest. Patients will usually report a worsening of tremor with stress, anxiety, and increased fatigue. The tremor does not persist during sleep and diminishes with voluntary activity of the affected limb(s). By having the patient perform mentally challenging tasks (such as counting backwards) or motor movements of other body parts (such as finger tapping with the other hand or walking), the examiner may notice an increase in tremor amplitude [11]. There may also be a resting tremor of the lip or lower jaw, but true head tremor suggests an alternate diagnosis such as essential tremor [12]. Postural tremor can co-exist with resting tremor in IPD, which often leads to diagnostic confusion, especially when the postural tremor is more prominent than the resting tremor. In this scenario, the distinction between IPD and essential tremor (discussed later) can become more difficult.
Rigidity is characterized as the presence of increased resistance to passive stretch throughout the range of motion [13]. “Lead pipe” rigidity remains sustained throughout the motion of the joint, while “cogwheel” rigidity is intermittent through the movement. The examiner must take care to distinguish between true rigidity and other forms of increased tone such as spasticity (a velocity dependent increase in tone) and paratonia (a resistance to passive motion created by the patient). Subtle rigidity can be enhanced in a limb by having the patient perform a voluntary movement of the contralateral limb [14]. Rigidity in early IPD is also asymmetric and most commonly found in the upper extremities, but it can be seen in the neck and lower extremities as well. Patients may initially complain of shoulder pain and stiffness that is diagnosed as rotator cuff disease or arthritis, when this pain is actually due to rigidity from Parkinson’s disease [15]. Severe axial rigidity out of proportion to appendicular rigidity, however, should suggest an alternate diagnosis in the early stages of the disease (such as progressive supranuclear palsy which is further discussed below).
Bradykinesia refers to decreased amplitude and speed of voluntary motor movements. This sign can be found throughout the body in the form of hypometric saccades, decreased blink rate, decreased facial expressions (“masked facies”) and softening of speech (hypophonia) [16]. Patients may initially report a general slowing down of movements as well as difficulty with handwriting due to their writing becoming smaller (micrographia) [17]. Bradykinesia is evaluated by testing the speed, amplitude, and rhythmicity of voluntary movements such as repetitive tapping of the thumb and first finger together, alternation of supination and pronation of the forearm and hand, opening and closing the hand and tapping the foot rhythmically on the floor. The examiner should also evaluate for generalized bradykinesia by viewing the patient rise from a seated to standing position as well as observing the patient’s normal speed of ambulation and speed and symmetry of arm swing.
Gait disturbance and postural instability can sometimes be found in early IPD; however, significant impairment of postural reflexes, gait impairment and early falls may point to a diagnosis other than IPD. Early IPD postural changes include mild flexion of the neck or trunk that may be accompanied by a slight leaning to one side. On examination of natural gait, the patient may exhibit asymmetrically reduced arm swing, slowing of gait and turning, shortened stride length and intermittent shuffling of the feet. With disease progression, all of these become more severe and there may be festination of gait (“hurried” gate with increased cadence and difficulty stopping). This can lead to instability and falls as the patient’s center of balance is displaced forward. Freezing of gait can also develop, but is rarely found in early IPD [18]. Postural stability is evaluated by the “pull test” where the patient is asked to stand in a comfortable stance with eyes open and feet apart and instructed to resist falling backwards when pulled by the examiner. The patient is allowed to take one step backwards with either foot if necessary to prevent falling. This test is usually normal in early IPD, but it often becomes abnormal with disease progression.
Because of dramatic heterogeneity in the expression of these cardinal motor features in IPD, patients are often subcategorized based upon the most prominent features of their motor exam. Well-recognized motor subtypes include tremor-predominant, akinetic-rigid, postural instability gait disorder PD (PIGD), and mixed [19]. Tremor-predominant patients are those with significant tremors that overshadow the other motor features of the disease, while akinetic-rigid patients have prominent bradykinesia and rigidity with little to no tremor. PIGD patients have prominent postural and gait abnormalities, while mixed patients have roughly equal amounts of all of the cardinal motor features. Recent research has suggested that these motor subtypes differ with regard to the frequency of comorbid nonmotor features, disease prognosis, and response to certain treatments [20–22]. For example, tremor-predominant patients generally have a good prognosis with slow disease progression while PIGD patients have a poor prognosis with rapid progression, dementia, and depression [19].
Nonmotor Symptoms
Along with the classic motor features of IPD, patients often suffer from a variety of nonmotor symptoms that can sometimes precede the onset of motor symptoms by several years [23]. When nonmotor symptoms are the presenting symptoms, diagnosis is often delayed at 1.6 years versus 1.0 year for individuals with motor presentations [2]. Recognition of a nonmotor prodrome of PD has instigated a debate about whether new diagnostic criteria for early-stage and prodromal PD should be created [24]; for now, however, a diagnosis of PD still requires the motor syndrome. The spectrum of nonmotor symptoms in IPD can include olfactory dysfunction, urinary dysfunction, constipation, depression, anxiety, apathy, cognitive decline, sleep disorders such as REM (rapid eye movement) sleep behavior disorder and restless legs syndrome, fatigue and orthostatic hypotension. While many of these nonmotor symptoms are common in the general population and are certainly not specific to IPD, their presence in conjunction with early parkinsonism can help further support an IPD diagnosis.
Patients with IPD should exhibit a robust and sustained response to levodopa therapy. Over time, as the degenerative disease progresses, doses need to be increased and complications of therapy are likely to emerge, most commonly levodopa-induced dyskinesia, motor and nonmotor fluctuations [25]. The various forms of parkinsonism (discussed later) may have an initial response to levodopa therapy; however, this response is generally transient and wanes quickly despite increases in dose. Many will have no response at all.
Differential Diagnosis
The differential diagnosis for IPD most commonly includes the Parkinson-plus syndromes (dementia with Lewy bodies, multiple system atrophy, progressive supra-nuclear palsy, and corticobasal degeneration), vascular parkinsonism, drug-induced parkinsonism, dopa responsive dystonia, normal pressure hydrocephalus, and essential tremor. Each of these conditions will be discussed in further detail below.
Parkinson-Plus Syndromes
Dementia with Lewy bodies (DLB) may initially resemble IPD as it can present with parkinsonian motor signs, but the distinguishing feature of this disease is the presence of a progressive dementia with deficits in attention and executive function that occurs before or within 1 year of the development of parkinsonian motor signs [26]. This is in contrast to the dementia that can develop in IPD, which usually occurs many years into the disease course. Patients with DLB often have well-formed, visual hallucinations with this disorder. Motor parkinsonian symptoms do not improve with dopaminergic therapy and caution should be used with these patients as psychiatric symptoms may be exacerbated by even small doses of these medications [27]. Diagnostic criteria for probable DLB require the presence of dementia plus at least 2 of the following 3 core features: fluctuating attention and concentration, recurrent well-formed visual hallucinations, and spontaneous parkinsonian motor signs. Suggestive clinical features include REM behavior disorder, severe neuroleptic sensitivity, and low dopamine transporter uptake in the basal ganglia on SPECT or PET imaging. In the absence of 2 core features, the diagnosis of probable DLB can also be made if dementia plus at least 1 suggestive feature is present with just 1 core feature. Possible DLB can be diagnosed with the presence of dementia plus 1 core or suggestive feature. These criteria are 83% sensitive and 95% specific for the presence of neocortical Lewy bodies at autopsy [27]. Other supportive clinical features include repeated falls, syncope, transient loss of consciousness, severe autonomic dysfunction, depression, and systematized delusions or hallucinations in other sensory and perceptual modalities [27]. Definitive diagnosis requires pathological confirmation.
Corticobasal degeneration (CBD) is more rare than the previously described Parkinson-plus syndromes. CBD typically presents with a markedly unilateral/asymmetric motor features and can mimic early IPD, but other defining features include cortical signs of progressive unilateral apraxia, limb dystonia and visual-tactile neglect (“alien limb” sign) that can lead to loss of voluntary control of the extremity. This sign has been reported in approximately half of all patients with CBD [34]. As the disease progresses, cognitive decline, dementia, dysarthria, postural instability and gait dysfunction can all occur [35]. Patients with CBD typically do not show any response to dopaminergic therapy. CBD brain MRI findings include asymmetric cortical atrophy (most commonly in the superior parietal region), bilateral basal ganglia atrophy, corpus callosum atrophy and T2 hyperintensities of the subcortical white matter and posterolateral putamen [36]. In recently published consensus criteria, Armstrong et al broadened the clinical phenotype associated with CBD to acknowledge the spectrum and overlapping phenotypes of tau-related neurodegenerative diseases [37]. The criteria for probable corticobasal syndrome require asymmetric presentation of 2 of: (a) limb rigidity or akinesia, (b) limb dystonia, (c) limb myoclonus plus 2 of: (d) orobuccal or limb apraxia, (e) cortical sensory deficit, (f) alien limb phenomena (more than simple levitation). Possible corticobasal syndrome may be symmetric and requires 1 of: (a) limb rigidity or akinesia, (b) limb dystonia, (c) limb myoclonus plus 1 of: (d) orobuccal or limb apraxia, (e) cortical sensory deficit, (f) alien limb phenomena (more than simple levitation). Unfortunately, these new criteria have not improved the specificity of diagnosis compared to previous criteria as shown by a recent longitudinal clinical and neuropathological study that found that all of their patients with a cortiocobasal syndrome but without corticobasal pathology had all met the new diagnostic criteria for possible or probable CBD [38]. The reader should be aware that Armstrong et al acknowledged that memory dysfunction is common in CBD, although this was not incorporated into the diagnostic criteria.
Other Causes of Parkinsonism
Vascular parkinsonism results from the accumulation of multiple infarcts in the basal ganglia and/or subcortical white matter [39]. It may account for up to 12% of all cases of parkinsonism [40]. There are not any specific clinical diagnostic criteria for vascular parkinsonism; however, the clinical presentation is somewhat distinctive. Vascular parkinsonism initially presents with gait problems, and the upper extremities are less affected than the lower extremities. Vascular parkinsonism has been referred to as “lower body parkinsonism” due to this distribution of symptoms. Patients often present with a characteristic shuffling gait, but may also exhibit significant freezing of gait, even early in the course of the disease (in contrast to IPD). Tremor is reported less consistently and other pyramidal tract signs, urinary symptoms, dementia and pseudobulbar affect resulting from various ischemic lesions often co-exist [41]. Patients tend to have a history of cerebrovascular risk factors. Response to dopaminergic therapy is present in one-third to one-half of patients and is typically short-lived [42]. Brain MRI findings in vascular parkinsonism include diffuse subcortical white or gray matter lesions, particularly involving the globus pallidus, thalamus, substantia nigra and frontal lobes. One study reported a “cutoff” point to help differentiate between vascular parkinsonism and the normal vascular changes associated with aging at 0.6% lesioned volume of brain tissue [43]. It is important to remember that microvascular lesions are commonly seen on MRI scans of older patients and therefore the presence of these lesions on imaging does not necessarily convey a diagnosis of vascular parkinsonism.
Evaluation of any parkinsonian patient should involve careful scrutiny of the medication list (current and past) to exclude the possibility of drug-induced parkinsonism (DIP). DIP is typically, though not always, symmetric in onset. Drugs causing DIP include all of the typical and atypical antipsychotics, dopamine depleters such as reserpine and tetrabenazine, gastrointestinal drugs with dopamine receptor blocking activity such as antiemetics and metoclopramide, calcium channel blockers, valproic acid, selective serotonin reuptake inhibiters and lithium [44]. Traditionally this syndrome was thought to be reversible with discontinuation of the offending drug; however, resolution can require many months and at least 10% of patients with DIP develop persistent and progressive parkinsonism despite discontinuation of the drug [45].
Dopa-responsive dystonia (DRD) most typically presents in childhood with initial onset of lower limb dystonia with parkinsonism developing over time. Symptoms respond robustly to low doses of levodopa, hence the name DRD. Occasionally, however, DRD can present in adulthood. In adult-onset cases of DRD, parkinsonism usually develops before dystonia. Because it presents with parkinsonism and is levodopa responsive, adult-onset DRD can easily be confused with young-onset IPD [46]. Clues to the presence of DRD include diurnal fluctuation, stability of symptoms over time, and a normal DaTscan (discussed later) [46].
Other rare causes of parkinsonism include exposure to toxins (MPTP, manganese, carbon monoxide, methanol), metabolic disorders (hypoparathyroidism, hypothyroidism, acquired hepatocerebral degeneration), early-onset and genetic disorders (Wilson’s disease, juvenile Huntington’s disease, spinocerebellar ataxia types 2 and 3, and neurodegeneration with brain iron accumulation), infectious diseases, trauma, space-occupying brain lesions, autoimmune diseases (Sjogren’s syndrome) and paraneoplastic disorders [47–51]. Further discussion of these more rare causes parkinsonism is beyond the scope of this review; however, clinicians should always carefully consider the past medical, family, and social history, along with the review of systems, as these aspects of the patient history may point to one of these causes of parkinsonism.
Normal pressure hydrocephalus (NPH) refers to chronic communicating hydrocephalus with adult onset. The classic clinical triad of NPH includes cognitive impairment, urinary incontinence, and gait disturbance in the absence of signs of increased intracranial pressure such as papilledema. NPH can present with motor signs similar to those found in vascular parkinsonism, possibly due to the close proximity of basal ganglia structures to the ventricular system [52]. The gait of NPH typically shows a decrease in step height and foot clearance as well as a decrease in walking speed. This is often referred to as a “magnetic gait.” In contrast to Parkinson’s disease patients, the gait disturbance in NPH does not improve with visual cues or dopaminergic therapy [53]. Dementia also occurs early on in the course of NPH and is mostly characterized by apathy, forgetfulness, and impaired recall. Urinary incontinence and urgency is a later finding of the disease in contrast to IPD in which urinary dysfunction is often an early nonmotor symptom. MRI and CT scans of the brain reveal enlarged ventricles (out of proportion to surrounding cerebral atrophy if present) and should be followed by a diagnostic high volume lumbar puncture. Clinical improvement following lumbar puncture is supportive of the diagnosis of NPH and helps to identify patients who may benefit from ventriculoperitoneal shunting [54].
Essential tremor (ET) is characterized by postural and action tremors, rather than resting tremors, though some ET patients can have co-existing resting tremors. Though it is usually bilateral, it is often asymmetric, adding to the potential for diagnostic confusion with IPD. It typically has a higher frequency than the tremor of IPD. The absence of rigidity, bradykinesia, postural and gait disturbances and no response to dopaminergic therapy help distinguish it further from IPD [55]. There is phenotypic overlap between these two conditions and some patients with IPD have more postural tremor than rest tremor (or even postural tremor with no rest tremor), while some with long-standing essential tremor may go on to develop parkinsonism [56].
The Role of DaTscan in Diagnosing Early Parkinsonism
Final Thoughts
Despite the challenges involved, accurate and early diagnosis of IPD is essential for optimal patient education, counseling, and treatment. Careful attention to the initial presentation and examination may be all that is required for diagnosis in typical cases. In atypical cases, brain MRI to evaluate for other diseases or DaTscan may be helpful adjunctive tests. As research advances over the coming years, it is likely that additional imaging or fluid biomarkers will become available to assist us with the diagnosis of IPD (and related disorders) in the early stages. Until then, clinicians must remain highly vigilant in their efforts to make these often challenging clinical diagnoses.
Corresponding author: Leslie J. Cloud, MD, MSc, 6605 West Broad St., Ste. C, Richmond, VA 23230, [email protected].
Financial disclosures: None.
1. Wirdefeldt K, Adami HO, Cole P, et al. Epidemiology and etiology of Parkinson’s disease: a review of the evidence. Eur J Epidemiol 2011;26 Suppl 1:S1–58.
2. O’Sullivan SS, Williams DR, Gallagher DA, et al. Nonmotor symptoms as presenting complaints in Parkinson’s disease: a clinicopathological study. Mov Disord 2008;23:101–6.
3. Ali K, Morris HR. Parkinson’s disease: chameleons and mimics. Pract Neurol 2015;15:14–25.
4. Holloway RG, Shoulson I, Fahn S, et al. Pramipexole vs levodopa as initial treatment for Parkinson disease: a 4-year randomized controlled trial. Arch Neurol 2004;61:1044–53.
5. Whone AL, Watts RL, Stoessl AJ, et al. Slower progression of Parkinson’s disease with ropinirole versus levodopa: The REAL-PET study. Ann Neurol 2003;54:93–101.
6. Wickremaratchi MM, Ben-Shlomo Y, Morris HR. The effect of onset age on the clinical features of Parkinson’s disease. Eur J Neurol 2009;16:450–6.
7. Gelb DJ, Oliver E, Gilman S. Diagnostic criteria for Parkinson disease. Arch Neurol 1999;56:33–9.
8. Rajput AH, Rozdilsky B, Ang L. Occurrence of resting tremor in Parkinson’s disease. Neurology 1991;41:1298–9.
9. Hughes AJ, Daniel SE, Kilford L, Lees AJ. Accuracy of clinical diagnosis of idiopathic Parkinson’s disease: a clinico-pathological study of 100 cases. J Neurol Neurosurg Psychiatry 1992;55:181–4.
10. Dickson DW, Braak H, Duda JE, et al. Neuropathological assessment of Parkinson’s disease: refining the diagnostic criteria. Lancet Neurol 2009;8:1150–7.
11. Raethjen J, Austermann K, Witt K, et al. Provocation of Parkinsonian tremor. Mov Disord 2008;23:1019–23.
12. Roze E, Coêlho-Braga MC, Gayraud D, et al. Head tremor in Parkinson’s disease. Mov Disord 2006;21:1245–8.
13. Hallett M. Parkinson revisited: pathophysiology of motor signs. Adv Neurol 2003;91:19–28.
14. Broussolle E, Krack P, Thobois S, et al. Contribution of Jules Froment to the study of parkinsonian rigidity. Mov Disord 2007;22:909–14.
15. Riley D, Lang AE, Blair RD, et al. Frozen shoulder and other shoulder disturbances in Parkinson’s disease. J Neurol Neurosurg Psychiatry 1989;52:63–6.
16. Rottach KG, Riley DE, DiScenna AO, et al. Dynamic properties of horizontal and vertical eye movements in parkinsonian syndromes. Ann Neurol 1996;39:368–77.
17. Cooper JA, Sagar HJ, Tidswell P, Jordan N. Slowed central processing in simple and go/no-go reaction time tasks in Parkinson’s disease. Brain 1994;117(Pt 3):517–29.
18. Almeida QJ, Lebold CA. Freezing of gait in Parkinson’s disease: a perceptual cause for a motor impairment? J Neurol Neurosurg Psychiatry 2010;81:513–8.
19. Thenganatt MA, Jankovic J. Parkinson disease subtypes. JAMA Neurology 2014;71:499–504.
20. Burn DJ, Rowan EN, Allan LM, et al. Motor subtype and cognitive decline in Parkinson’s disease, Parkinson’s disease with dementia, and dementia with Lewy bodies. J Neurol Neurosurg Psychiatry 2006;77:585–9.
21. Burn DJ, Landau S, Hindle JV, et al; PROMS-PD Study Group. Parkinson’s disease motor subtypes and mood. Mov Disord 2012;27:379–86.
22. Katz M, Luciano MS, Carlson K, et al; CSP 468 study group. Differential effects of deep brain stimulation target on motor subtypes in Parkinson’s disease. Ann Neurol 2015;77:710–9.
23. Savica R, Rocca WA, Ahlskog JE. When does Parkinson disease start? Arch Neurol 2010;67:798–801.
24. Berg D, Postuma RB, Bloem B, et al. Time to redefine PD? Introductory statement of the MDS Task Force on the definition of Parkinson’s disease. Mov Disord 2014;29:454–62.
25. Aquino CC, Fox SH. Clinical spectrum of levodopa-induced complications. Mov Disord 2015;30:80–9.
26. Geser F, Wenning GK, Poewe W, McKeith I. How to diagnose dementia with Lewy bodies: state of the art. Mov Disord 2005;20 Suppl 12:S11–20.
27. Karantzoulis S, Galvin JE. Update on dementia with Lewy bodies. Curr Transl Geriatr Exp Gerontol Rep 2013;2:196–204.
28. Gilman S, Low PA, Quinn N, et al. Consensus statement on the diagnosis of multiple system atrophy. J Neurol Sci 1999;163:94–8.
29. Kim HJ, Jeon BS, Jellinger KA. Diagnosis and differential diagnosis of MSA: boundary issues. J Neurol 2015 Feb 7. [Epub ahead of print]
30. Lee EA, Cho HI, Kim SS, Lee WY. Comparison of magnetic resonance imaging in subtypes of multiple system atrophy. Parkinsonism Relat Disord 2004;10:363–8.
31. Golbe LI, Davis PH, Schoenberg BS, Duvoisin RC. Prevalence and natural history of progressive supranuclear palsy. Neurology 1988;38:1031–4.
32. Maher ER, Lees AJ. The clinical features and natural history of the Steele-Richardson-Olszewski syndrome (progressive supranuclear palsy). Neurology 1986;36:1005–8.
33. Gröschel K, Kastrup A, Litvan I, Schulz JB. Penguins and hummingbirds: midbrain atrophy in progressive supranuclear palsy. Neurology 2006;66:949–50.
34. Rinne JO, Lee MS, Thompson PD, Marsden CD. Corticobasal degeneration. A clinical study of 36 cases. Brain 1994117(Pt 5):1183–96.
35. Grimes DA, Lang AE, Bergeron CB. Dementia as the most common presentation of cortical-basal ganglionic degeneration. Neurology 1999;53:1969–74.
36. Tokumaru AM, O’uchi T, Kuru Y, et al. Corticobasal degeneration: MR with histopathologic comparison. AJNR Am J Neuroradiol 1996;17:1849–52.
37. Armstrong MJ, Litvan I, Lang AE, et al. Criteria for the diagnosis of corticobasal degeneration. Neurology 2013;80:496–503.
38. Alexander SK, Rittman T, Xuereb JH, et al. Validation of the new consensus criteria for the diagnosis of corticobasal degeneration. J Neurol Neurosurg Psychiatry 2014;85:925–9.
39. Sibon I, Fenelon G, Quinn NP, Tison F. Vascular parkinsonism. J Neurol 2004;251:513–24.
40. Thanvi B, Lo N, Robinson T. Vascular parkinsonism--an important cause of parkinsonism in older people. Age Ageing 2005;34:114–9.
41. Kalra S, Grosset DG, Benamer HT. Differentiating vascular parkinsonism from idiopathic Parkinson’s disease: a systematic review. Mov Disord 2010;25:149–56.
42. Mehanna R, Jankovic J. Movement disorders in cerebrovascular disease. Lancet Neurol 2013; 12:597–608.
43. Josephs KA. Frontotemporal lobar degeneration. Neurol Clin 2007;25:683–96, vi.
44. Lopez-Sendon J, Mena MA, de Yebenes JG. Drug-induced parkinsonism. Expert Opin Drug Saf 2013;12:487–96.
45. Mena MA, de Yebenes JG. Drug-induced parkinsonism. Expert Opin Drug Saf 2006;5:759–71.
46. Brajkovic LD, Svetel MV, Kostic VS, et al. Dopamine transporter imaging (123)I-FP-CIT (DaTSCAN) SPET in differential diagnosis of dopa-responsive dystonia and young-onset Parkinson’s disease. Hell J Nucl Med 2012;15:134–8.
47. Krusz JC, Koller WC, Ziegler DK. Historical review: abnormal movements associated with epidemic encephalitis lethargica. Mov Disord 1987;2:137–41.
48. Langston JW, Ballard P, Tetrud JW, Irwin I. Chronic Parkinsonism in humans due to a product of meperidine-analog synthesis. Science 1983;219:979–80.
49. Jankovic J. Searching for a relationship between manganese and welding and Parkinson’s disease. Neurology 2005;64:2021–8.
50. Jankovic J, Kirkpatrick JB, Blomquist KA, et al. Late-onset Hallervorden-Spatz disease presenting as familial parkinsonism. Neurology 1985;35:227–34.
51. Cloud L, Jankovic J. Systemic disease and movement disorders. In: Burn DJ, editor. Oxford textbook of clinical neurology on movement disorders. Oxford University Press; 2013.
52. Bugalho P, Guimaraes J. Gait disturbance in normal pressure hydrocephalus: a clinical study. Parkinsonism Relat Disord 2007;13:434–7.
53. Jankovic J, Newmark M, Peter P. Parkinsonism and acquired hydrocephalus. Mov Disord 1986;1:59–64.
54. Bergsneider M, Black PM, Klinge P, et al. Surgical management of idiopathic normal-pressure hydrocephalus. Neurosurgery 2005;57(3 Suppl): S29-39; discussion ii-v.
55. Bain P, Brin M, Deuschl G, et al. Criteria for the diagnosis of essential tremor. Neurology 2000; 54(11 Suppl 4): S7.
56. Jankovic J. Essential tremor and Parkinson’s disease. Ann Neurol 1989;25:211–2.
57. Catafau AM, Tolosa E; DaTSCAN Clinically Uncertain Parkinsonian Syndromes Study Group. Impact of dopamine transporter SPECT using 123I-Ioflupane on diagnosis and management of patients with clinically uncertain Parkinsonian syndromes. Mov Disord 2004;19:1175–82.
58. Bajaj N, Hauser RA, Grachev ID. Clinical utility of dopamine transporter single photon emission CT (DaT-SPECT) with (123I) ioflupane in diagnosis of parkinsonian syndromes. J Neurol Neurosurg Psychiatry 2013;84:1288–95.
59. Kagi G, Bhatia KP, Tolosa E. The role of DAT-SPECT in movement disorders. J Neurol Neurosurg Psychiatry 2010;81:5–12.
60. Litvan I, Agid Y, Calne D, et al. Clinical research criteria for the diagnosis of progressive supranuclear palsy (Steele-Richardson-Olszewski syndrome): report of the NINDS-SPSP international workshop. Neurology 1996;47:1–9.
For Worksite Weight Loss: Something Is Better than Nothing, but Is Something More Even Better than That?
Study Overview
Objective. To compare the effectiveness of 2 employee weight management programs—a less-intense program versus a more intense, individually-targeted program with financial incentives—at producing weight loss.
Design. Cluster randomized controlled trial.
Setting and participants. The setting for the “Tailored Worksite Weight Control Programs Project” was 28 small and medium-sized employers in and around Roanoke and Richmond, Virginia. Investigators enrolled the firms after a series of conversations with worksite leaders and conducted stratified cluster randomization based on worksite size (categorizing small firms as those with 100–300 employees and medium firms as those with 301–600 employees). For worksites to be considered for inclusion, the researchers required that the employer have between 100–600 employees total, provide internet access to employees, provide access to a weigh-in kiosk for the weight management program, and be willing to conduct a brief health survey of all employees at baseline to facilitate identification of eligible employees. Once eligible and interested worksites were identified, there were further inclusion criteria for employees themselves. To enroll in the study, an individual employee had to be over 18 years of age, have a BMI ≥ 25 kg/m2, not be pregnant or with a medical condition that would contraindicate participation, and not already participating in a structured weight loss program. Of 73 worksites deemed eligible upon review of local companies, 39 (53.4%) initially agreed to enroll in the study. Of those, 11 dropped out before the intervention due to lack of managerial support and/or employee interest. Within the 28 enrolled worksites that were randomized, 6258 employees were felt to be eligible based on baseline screening. Of those, 1790 (29%) enrolled in the study.
Intervention. At worksites randomized to the INCENT program, study participants received an internet-based, tailored weight loss advice intervention coupled with a financial incentive. The behavioral intervention was based in social cognitive theory. It focused on advising healthier diet and increasing physical activity levels to 150 min/wk. Participants in this group received daily emails from the program that were “tailored” according to their gender and according to their preferred features of physical activity. The modest financial incentive they received was tied to weight loss. They were paid $1 for each percent of body weight lost per month. All INCENT participants also had access to a comprehensive website where they could access information about exercise, including videos, and logs for monitoring activity and dietary intake.
At worksites randomized to the less intense LMW (“Livin’ My Weigh”) program, employees who enrolled received an intervention that also included information about diet and physical activity but did not include daily tailored emails or financial incentives. These participants did receive quarterly newsletters. Both programs were designed to last for 12 months, with a 6-month weight-loss phase followed by a 6-month weight maintenance phase. The results reported in this study focus on weight loss achieved at 6 months.
Main outcome measures. The primary outcome in this study was weight change, measured in 2 ways: mean weight loss at 6 months, and percentage of participants in each arm who had achieved clinically meaningful weight loss (defined as ≥ 5% of body weight) at 6 months. Weight change was measured using calibrated scales at kiosks that were provided within each workplace. Secondary outcomes of interest focused on behavioral measures based on self-report using repeated surveys of participants. These included change in physical activity levels (measured using 6 Behavioral Risk Factor Surveillance System (BRFSS) items, and 8 Rapid Assessment Physical Activity (RAPA) scale items), and change in dietary behaviors (using the Block Fruit-Vegetable Fiber Screener, and the Beverage Intake Questionnaire). Analysis was intention-to-treat (last observation carried forward for those who disenrolled before 6 months) and was conducted at the level of the individual participant, with generalized linear modeling including a time indicator and interaction terms for study group by time, to account for clustering effects.
Results. Of the 1790 participants who enrolled in the study, 1581 (88%) had complete follow-up data for analysis. Study participants were predominantly female (74%), Caucasian (77%), and well educated (only 17% had a high school diploma or less). Participants in the study differed from the overall eligible population for the study in a couple of important ways: they were more likely to be Caucasian and more likely to be women. The groups were well balanced with respect to most baseline characteristics, however, INCENT participants were significantly younger (45.7 vs. 48.2 years) and reported having worked at their current jobs for less time (8.1 vs. 11.6 years on average) than LMW participants. A significantly higher percentage of INCENT participants also reported meeting physical activity recommendations at baseline (10.2% vs. 6.8%, P < 0.05).
At the 6-month mark, participants in both groups lost weight on average (–2.3 lbs in INCENT, and –1.3 lbs in LMW), but there were no significant between-group differences. Likewise, although slightly more participants in INCENT (14.6%) achieved a 5% weight loss compared to those in LMW (9.7%), this difference also was not statistically significant.
For self-reported outcomes, some differences did emerge between the groups. INCENT participants reported a statistically significantly larger increase in daily fruit and vegetable intake (0.2 servings, P < 0.001) and fiber intake (0.58 g, P < 0.001). Within group change measured for self-reported water intake was significant for INCENT participants (increased by 0.47 fl oz per day), whereas it was not for LMW participants. Between group differences were presumably not significant for this measure, as they were not reported.
Conclusion. The authors conclude that both an individually targeted internet-based intervention and a minimal intervention can lead to improvements in activity and diet behaviors, and that both produce a modest amount of weight loss for employees.
Commentary
Given the high prevalence of overweight and obesity in the United States, employers are increasingly interested in programs that can promote more healthful behaviors and achieve weight loss for workers. Because many employers are faced with bearing the health care costs of obese employees [1], and because chronic health conditions linked to obesity may impact worker productivity through increased absenteeism [2], the financial benefits of successful employer-based weight management programs may be significant. Unfortunately, to date, many such programs have gone unevaluated. Those that have been evaluated tend to be lacking in empirical basis (eg, too brief and not based on principles of behavior change). Perhaps because of these programmatic weaknesses, evaluations have not generally shown that employer-based weight management programs are able to move the needle very much on weight [3].It seems that having any program in place is better than having nothing at all, but it is unclear whether programs of greater intensity are able to produce better results.
In this study by Almeida and colleagues, the researchers tested whether a more intense, tailored internet-based behavioral intervention with financial incentives produced greater weight loss than a less-intense program, hypothesizing that it would. Surprisingly, they actually found very little difference between the 2 groups with respect to weight outcomes, and only minimal differences with respect to behavior change. The strengths of this study include a randomized trial design with a strong comparison group, and the use of intention-to-treat analysis. Additionally, both interventions that were tested were “real-world friendly” programs, meaning that they could, in theory, be implemented relatively easily in a wide variety of settings. This is in stark contrast to traditional behavioral weight loss programs that tend to be incredibly intense and costly in nature—probably unappealing to most employers. Despite being of lower intensity, both of the interventions in this study had a clear basis in behavior change theory, which was a strength. Additionally, the retention rates at the end of the 6-month study period were excellent, with almost 90% of participants having complete follow-up data. Although this trend was probably facilitated by having a “captive” employee population, it speaks to the ease of participating in and hosting the programs.
Although the randomized design was a definite strength of this study, the demographic imbalances between the groups at baseline (resulting from individual-level factors that could not be randomized) may have been important. INCENT participants were younger and earlier in their careers, and although the researchers conducted multivariable analyses to try to eliminate confounding, this baseline imbalance raises concerns for whether or not other unmeasured confounding variables might have been unequally distributed between the groups.
It is not surprising that neither intervention produced large amounts of weight loss. Although the interventions were evidence-based in that they were grounded in behavior change theory, the specific behaviors focused on were not those that would be expected to yield significant weight loss. Both interventions, at least as described in this paper, seemed to put a greater emphasis on physical activity than diet (in terms of resources available for participants). While activity is critical for health promotion and weight maintenance [4], it is probably less important than diet for achieving meaningful weight loss. This is particularly the case when one considers the level of activity that was targeted in this study (150 min/wk). Although this is the recommended level for adults in order to maintain health, it is not believed to be sufficient to result in weight loss [5]. In terms of the dietary recommendations described in these programs, a focus on low-fat, high-fiber diets would be only expected to promote weight loss assuming that significant overall calorie reductions were met. Without stating specific caloric limits (which perhaps they did, even if not mentioned in the methods section), it’s hard to know how effective these diets would be at reducing weight, despite their likely positive impacts on overall health. In keeping with these points of emphasis for dietary change, the places where statistically significant differences emerged between the groups were not those that would be expected to produce differential weight loss. Fruit and vegetable intake, while important for health, will not produce weight loss independent of an overall decrease in caloric intake. The other dietary outcome that was significantly different between the groups was fiber intake, likely a correlate of the increased fruit and vegetable intake.
One of the key assumptions driving this study was that INCENT was a more intense program than LMY, and thus would produce greater weight loss. In reality, though, neither of the programs was particularly intensive—there were no face-to-face contacts in either, for example. This issue captures a fundamental trade-off between the need to achieve results and the need for pragmatism in designing interventions. Although less intense interventions are likely to produce less weight loss (as was the case in this study), they are probably also infinitely more likely to be adopted in the real world, making it very important to do studies such as this one.
One area where the INCENT arm could have enhanced its effectiveness without sacrificing pragmatism was in the size of the financial incentive used. The researchers mentioned not wanting to use large incentives in order to avoid “undermining intrinsic motivation,” a concern often raised in these kinds of interventions. Unfortunately, the “$1 per percent weight lost” reward probably went too far in the other direction, being too small to provide any kind of additional motivation. Studies of financial incentives for weight loss reveal that weight loss increases in proportion to the size of the incentive [5], and perhaps this incentive was too tiny to register with most participants, particularly in this population of well-educated, high-earning adults.
Applications for Real-World Implementation
For employers and others considering how to design pragmatic weight management interventions, this study shows that even relatively simple, low-key, internet-based interventions are able to produce some measureable behavior changes and a little bit of weight loss, which is likely meaningful when considered in a large population. On the other hand, reconfiguring the resources in such an intervention to provide greater focus on caloric consumption, higher physical activity levels, and the use of larger financial incentives might well be worth the bang for the buck in trying to improve upon these results.
—Kristine Lewis, MD, MPH
1. Colombi AM, Wood GC. Obesity in the workplace: impact on cardiovascular disease, cost and utilization of care. Am Health Drug Benefits 2011;4:271–8.
2. Dee A, Kearns K, O’Neill C, et al. The direct and indirect costs of both overweight and obesity: a systematic review. BMC Res Notes 2014;7:242.
3. Anderson LM, Quinn TA, Glanz K, et al. The effectiveness of worksite nutrition and physical activity interventions for controlling employee overweight and obesity: a systematic review. Am J Prev Med 2010; 37:340–57.
4. Swift DL, Johannsen NM, Lavie CJ, et al. The role of exercise and physical activity in weight loss and maintenance. Prog Cardiovasc Dis 2014;56:447.
5. Jeffery RW. Financial incentives and weight control. Prev Med 2012;55S:61–7.
Study Overview
Objective. To compare the effectiveness of 2 employee weight management programs—a less-intense program versus a more intense, individually-targeted program with financial incentives—at producing weight loss.
Design. Cluster randomized controlled trial.
Setting and participants. The setting for the “Tailored Worksite Weight Control Programs Project” was 28 small and medium-sized employers in and around Roanoke and Richmond, Virginia. Investigators enrolled the firms after a series of conversations with worksite leaders and conducted stratified cluster randomization based on worksite size (categorizing small firms as those with 100–300 employees and medium firms as those with 301–600 employees). For worksites to be considered for inclusion, the researchers required that the employer have between 100–600 employees total, provide internet access to employees, provide access to a weigh-in kiosk for the weight management program, and be willing to conduct a brief health survey of all employees at baseline to facilitate identification of eligible employees. Once eligible and interested worksites were identified, there were further inclusion criteria for employees themselves. To enroll in the study, an individual employee had to be over 18 years of age, have a BMI ≥ 25 kg/m2, not be pregnant or with a medical condition that would contraindicate participation, and not already participating in a structured weight loss program. Of 73 worksites deemed eligible upon review of local companies, 39 (53.4%) initially agreed to enroll in the study. Of those, 11 dropped out before the intervention due to lack of managerial support and/or employee interest. Within the 28 enrolled worksites that were randomized, 6258 employees were felt to be eligible based on baseline screening. Of those, 1790 (29%) enrolled in the study.
Intervention. At worksites randomized to the INCENT program, study participants received an internet-based, tailored weight loss advice intervention coupled with a financial incentive. The behavioral intervention was based in social cognitive theory. It focused on advising healthier diet and increasing physical activity levels to 150 min/wk. Participants in this group received daily emails from the program that were “tailored” according to their gender and according to their preferred features of physical activity. The modest financial incentive they received was tied to weight loss. They were paid $1 for each percent of body weight lost per month. All INCENT participants also had access to a comprehensive website where they could access information about exercise, including videos, and logs for monitoring activity and dietary intake.
At worksites randomized to the less intense LMW (“Livin’ My Weigh”) program, employees who enrolled received an intervention that also included information about diet and physical activity but did not include daily tailored emails or financial incentives. These participants did receive quarterly newsletters. Both programs were designed to last for 12 months, with a 6-month weight-loss phase followed by a 6-month weight maintenance phase. The results reported in this study focus on weight loss achieved at 6 months.
Main outcome measures. The primary outcome in this study was weight change, measured in 2 ways: mean weight loss at 6 months, and percentage of participants in each arm who had achieved clinically meaningful weight loss (defined as ≥ 5% of body weight) at 6 months. Weight change was measured using calibrated scales at kiosks that were provided within each workplace. Secondary outcomes of interest focused on behavioral measures based on self-report using repeated surveys of participants. These included change in physical activity levels (measured using 6 Behavioral Risk Factor Surveillance System (BRFSS) items, and 8 Rapid Assessment Physical Activity (RAPA) scale items), and change in dietary behaviors (using the Block Fruit-Vegetable Fiber Screener, and the Beverage Intake Questionnaire). Analysis was intention-to-treat (last observation carried forward for those who disenrolled before 6 months) and was conducted at the level of the individual participant, with generalized linear modeling including a time indicator and interaction terms for study group by time, to account for clustering effects.
Results. Of the 1790 participants who enrolled in the study, 1581 (88%) had complete follow-up data for analysis. Study participants were predominantly female (74%), Caucasian (77%), and well educated (only 17% had a high school diploma or less). Participants in the study differed from the overall eligible population for the study in a couple of important ways: they were more likely to be Caucasian and more likely to be women. The groups were well balanced with respect to most baseline characteristics, however, INCENT participants were significantly younger (45.7 vs. 48.2 years) and reported having worked at their current jobs for less time (8.1 vs. 11.6 years on average) than LMW participants. A significantly higher percentage of INCENT participants also reported meeting physical activity recommendations at baseline (10.2% vs. 6.8%, P < 0.05).
At the 6-month mark, participants in both groups lost weight on average (–2.3 lbs in INCENT, and –1.3 lbs in LMW), but there were no significant between-group differences. Likewise, although slightly more participants in INCENT (14.6%) achieved a 5% weight loss compared to those in LMW (9.7%), this difference also was not statistically significant.
For self-reported outcomes, some differences did emerge between the groups. INCENT participants reported a statistically significantly larger increase in daily fruit and vegetable intake (0.2 servings, P < 0.001) and fiber intake (0.58 g, P < 0.001). Within group change measured for self-reported water intake was significant for INCENT participants (increased by 0.47 fl oz per day), whereas it was not for LMW participants. Between group differences were presumably not significant for this measure, as they were not reported.
Conclusion. The authors conclude that both an individually targeted internet-based intervention and a minimal intervention can lead to improvements in activity and diet behaviors, and that both produce a modest amount of weight loss for employees.
Commentary
Given the high prevalence of overweight and obesity in the United States, employers are increasingly interested in programs that can promote more healthful behaviors and achieve weight loss for workers. Because many employers are faced with bearing the health care costs of obese employees [1], and because chronic health conditions linked to obesity may impact worker productivity through increased absenteeism [2], the financial benefits of successful employer-based weight management programs may be significant. Unfortunately, to date, many such programs have gone unevaluated. Those that have been evaluated tend to be lacking in empirical basis (eg, too brief and not based on principles of behavior change). Perhaps because of these programmatic weaknesses, evaluations have not generally shown that employer-based weight management programs are able to move the needle very much on weight [3].It seems that having any program in place is better than having nothing at all, but it is unclear whether programs of greater intensity are able to produce better results.
In this study by Almeida and colleagues, the researchers tested whether a more intense, tailored internet-based behavioral intervention with financial incentives produced greater weight loss than a less-intense program, hypothesizing that it would. Surprisingly, they actually found very little difference between the 2 groups with respect to weight outcomes, and only minimal differences with respect to behavior change. The strengths of this study include a randomized trial design with a strong comparison group, and the use of intention-to-treat analysis. Additionally, both interventions that were tested were “real-world friendly” programs, meaning that they could, in theory, be implemented relatively easily in a wide variety of settings. This is in stark contrast to traditional behavioral weight loss programs that tend to be incredibly intense and costly in nature—probably unappealing to most employers. Despite being of lower intensity, both of the interventions in this study had a clear basis in behavior change theory, which was a strength. Additionally, the retention rates at the end of the 6-month study period were excellent, with almost 90% of participants having complete follow-up data. Although this trend was probably facilitated by having a “captive” employee population, it speaks to the ease of participating in and hosting the programs.
Although the randomized design was a definite strength of this study, the demographic imbalances between the groups at baseline (resulting from individual-level factors that could not be randomized) may have been important. INCENT participants were younger and earlier in their careers, and although the researchers conducted multivariable analyses to try to eliminate confounding, this baseline imbalance raises concerns for whether or not other unmeasured confounding variables might have been unequally distributed between the groups.
It is not surprising that neither intervention produced large amounts of weight loss. Although the interventions were evidence-based in that they were grounded in behavior change theory, the specific behaviors focused on were not those that would be expected to yield significant weight loss. Both interventions, at least as described in this paper, seemed to put a greater emphasis on physical activity than diet (in terms of resources available for participants). While activity is critical for health promotion and weight maintenance [4], it is probably less important than diet for achieving meaningful weight loss. This is particularly the case when one considers the level of activity that was targeted in this study (150 min/wk). Although this is the recommended level for adults in order to maintain health, it is not believed to be sufficient to result in weight loss [5]. In terms of the dietary recommendations described in these programs, a focus on low-fat, high-fiber diets would be only expected to promote weight loss assuming that significant overall calorie reductions were met. Without stating specific caloric limits (which perhaps they did, even if not mentioned in the methods section), it’s hard to know how effective these diets would be at reducing weight, despite their likely positive impacts on overall health. In keeping with these points of emphasis for dietary change, the places where statistically significant differences emerged between the groups were not those that would be expected to produce differential weight loss. Fruit and vegetable intake, while important for health, will not produce weight loss independent of an overall decrease in caloric intake. The other dietary outcome that was significantly different between the groups was fiber intake, likely a correlate of the increased fruit and vegetable intake.
One of the key assumptions driving this study was that INCENT was a more intense program than LMY, and thus would produce greater weight loss. In reality, though, neither of the programs was particularly intensive—there were no face-to-face contacts in either, for example. This issue captures a fundamental trade-off between the need to achieve results and the need for pragmatism in designing interventions. Although less intense interventions are likely to produce less weight loss (as was the case in this study), they are probably also infinitely more likely to be adopted in the real world, making it very important to do studies such as this one.
One area where the INCENT arm could have enhanced its effectiveness without sacrificing pragmatism was in the size of the financial incentive used. The researchers mentioned not wanting to use large incentives in order to avoid “undermining intrinsic motivation,” a concern often raised in these kinds of interventions. Unfortunately, the “$1 per percent weight lost” reward probably went too far in the other direction, being too small to provide any kind of additional motivation. Studies of financial incentives for weight loss reveal that weight loss increases in proportion to the size of the incentive [5], and perhaps this incentive was too tiny to register with most participants, particularly in this population of well-educated, high-earning adults.
Applications for Real-World Implementation
For employers and others considering how to design pragmatic weight management interventions, this study shows that even relatively simple, low-key, internet-based interventions are able to produce some measureable behavior changes and a little bit of weight loss, which is likely meaningful when considered in a large population. On the other hand, reconfiguring the resources in such an intervention to provide greater focus on caloric consumption, higher physical activity levels, and the use of larger financial incentives might well be worth the bang for the buck in trying to improve upon these results.
—Kristine Lewis, MD, MPH
1. Colombi AM, Wood GC. Obesity in the workplace: impact on cardiovascular disease, cost and utilization of care. Am Health Drug Benefits 2011;4:271–8.
2. Dee A, Kearns K, O’Neill C, et al. The direct and indirect costs of both overweight and obesity: a systematic review. BMC Res Notes 2014;7:242.
3. Anderson LM, Quinn TA, Glanz K, et al. The effectiveness of worksite nutrition and physical activity interventions for controlling employee overweight and obesity: a systematic review. Am J Prev Med 2010; 37:340–57.
4. Swift DL, Johannsen NM, Lavie CJ, et al. The role of exercise and physical activity in weight loss and maintenance. Prog Cardiovasc Dis 2014;56:447.
5. Jeffery RW. Financial incentives and weight control. Prev Med 2012;55S:61–7.
Dabigatran Adherence Among Nonvalvular Atrial Fibrillation Patients Is Associated with Pharmacist-Based Activities
Study Overview
Objective. To assess site level adherence to dabigatran among patients with atrial fibrillation and to determine if specific practices at the site level are associated with adherence.
Design. Mixed-methods study involving retrospective quantitative and cross-sectional qualitative data.
Setting and participants. 67 Veterans Health Administration sites with 20 or more patients with dabigatran prescription for nonvalvular atrial fibrillation between 2010 and 2012 were included. Among these sites, 41 sites participated in an inquiry about practices related to dabigatran use. A total of 47 pharmacists among the 41 sites were interviewed. The investigators identified from the interviews 3 specific practices related to dabigatran use: appropriate patient selection (review of indications, contradictions, and prior adherence to other medications), pharmacist-driven patient education, and pharmacist-led adverse event and adherence monitoring. Sites were characterized as having adopted these specific practices or not, based on the interviews.
Main outcome measure. Dabigatran adherence defined by proportion of days covered (ratio of days supplied by prescription to follow-up duration) of 80% or more. Site level variance in dabigatran adherence among the 67 sites were described. Site level adherence was adjusted by patient level factors and site level factors. The association between site level practice and adherence was examined with Poisson models using generalized estimate equation to account for clustering of patients within sites.
Main results. A total of 67 sites with 4863 patients with prescriptions of dabigatran for atrial fibrillation were included in the analysis. There was wide variation among sites on adherence rate, with a range of 42% to 93% (median, 74%). The sites were categorized as high performing if their site level adherence rate was at least 74%. Among the 41 sites that participated in the qualitative study that defined exposure variables, appropriate patient selection was performed at 31 sites, pharmacist-led education was provided at 30 sites, and pharmacist-led monitoring at 28 sites. There was variation in the duration of monitoring among sites, with 18 of 28 monitoring for 3 to 6 months while the rest of the sites monitor indefinitely. Site level practices differed between low and high performing sites, with high performing sites more likely to have adopted appropriate patient selection with review of adherence (83% vs. 65% in low-performing sites), have pharmacist-driven education (83% vs. 59%), and have pharmacist-led adverse event monitoring (92% vs. 35%). After adjustment for patient level and site level characteristics, the association between adherence and appropriate patient selection (adjusted risk ratio [RR], 1.14; 95% confidence interval [CI], 1.05–1.25) and pharmacist-led adverse event monitoring (RR, 1.25; 95% CI, 1.11–1.41) remained.
Conclusion. There is wide variability in dabigatran adherence among patients with atrial fibrillation at different VA sites. Site level pharmacist-based practices are associated with the level of adherence at the sites.
Commentary
Studies have demonstrated that in a clinical trial setting, dabigatran is as effective as warfarin in stroke prevention among patients with atrial fibrillation and is associated with a lower risk of major hemorrhage [1]. However, outside of clinical trials, effectiveness of a treatment regimen is highly related to whether treatment is adhered to. In contrast with warfarin treatment, where treatment adherence is regularly tracked through monitoring of blood levels and clinic visits, dabigatran does not require monitoring and thus, adherence to dabigatran may not be monitored. A recent study finds that poorer adherence likely contributes to increased risk of stroke and death among patients on dabigatran [2]. The current study examines the variation in adherence rates on a site level and identifies factors that are associated with better adherence. The findings suggest that better patient selection through examination of prior adherence to warfarin and other medications and pharmacist-led adverse event and adherence monitoring are practices that are associated with better adherence. These are potentially important findings that may impact care for patients with atrial fibrillation.
These results need to be interpreted cautiously because of the limitations of the observational study design. Several factors need to be considered when interpreting the study findings. First, despite the VA being a comprehensive system of care, veterans often use care outside of the VA, including obtaining medications outside of VA [3]. Because of the prevalent concurrent use of care outside of VA, examining adherence to medication with only VA records may be incomplete and may erroneously categorize patients as low adherence. Second, the number of patients on dabigatran per facility is rather small and quite variable as well, with some sites that have very few number of patients. Although the investigators have excluded sites with fewer than 20 patients on dabigatran, the variability in the use of dabigatran may reflect site-specific factors, some of which may affect patient selection on the site level, that ultimately may affect outcome. Finally, the interview of pharmacist at each site may reflect the view of one to two pharmacists at each site, and thus may not truly reflect practices at the site throughout the period where patients were selected and outcomes defined.
Applications for Clinical Practice
Although it is tempting to conclude that instituting the pharmacist-based activities in patient selection and adverse event monitoring will lead to better adherence to dabigatran and thus improved patient outcomes, considering the limitations in the study a follow-up intervention study where sites are randomized to institute-specific practices for dabigatran use will be very important to demonstrate definitively the impact of these interventions. Also, as the use of dabigatran and other novel anticoagulants become more prevalent [4], a follow-up study to include a larger sample of patients may also be valuable to demonstrate if the conclusions are upheld.
—William Hung, MD, MPH
1. Connolly SJ, Ezekowitz MD, Yusuf S, et al. Dabigatran versus warfarin in patients with atrial fibrillation. N Engl J Med 2009: 361:1139–50.
2. Shore S, Carey EP, Turakhia MP, et al. Adherence to dabigatran therapy and longitudinal patient outcomes: insights from the veterans health administration. Am Heart J 2014;167:810–7.
3. Hynes DM, Koelling K, Stroupe K, et al. Veterans’ access to and use of Medicare and veterans affairs health care. Med Care 2007:45:214–23.
4. Boyle AM. VA, army clinicians rapidly increase prescribing of novel anticoagulants. US Med Feb 2014. Available at www.usmedicine.com.
Study Overview
Objective. To assess site level adherence to dabigatran among patients with atrial fibrillation and to determine if specific practices at the site level are associated with adherence.
Design. Mixed-methods study involving retrospective quantitative and cross-sectional qualitative data.
Setting and participants. 67 Veterans Health Administration sites with 20 or more patients with dabigatran prescription for nonvalvular atrial fibrillation between 2010 and 2012 were included. Among these sites, 41 sites participated in an inquiry about practices related to dabigatran use. A total of 47 pharmacists among the 41 sites were interviewed. The investigators identified from the interviews 3 specific practices related to dabigatran use: appropriate patient selection (review of indications, contradictions, and prior adherence to other medications), pharmacist-driven patient education, and pharmacist-led adverse event and adherence monitoring. Sites were characterized as having adopted these specific practices or not, based on the interviews.
Main outcome measure. Dabigatran adherence defined by proportion of days covered (ratio of days supplied by prescription to follow-up duration) of 80% or more. Site level variance in dabigatran adherence among the 67 sites were described. Site level adherence was adjusted by patient level factors and site level factors. The association between site level practice and adherence was examined with Poisson models using generalized estimate equation to account for clustering of patients within sites.
Main results. A total of 67 sites with 4863 patients with prescriptions of dabigatran for atrial fibrillation were included in the analysis. There was wide variation among sites on adherence rate, with a range of 42% to 93% (median, 74%). The sites were categorized as high performing if their site level adherence rate was at least 74%. Among the 41 sites that participated in the qualitative study that defined exposure variables, appropriate patient selection was performed at 31 sites, pharmacist-led education was provided at 30 sites, and pharmacist-led monitoring at 28 sites. There was variation in the duration of monitoring among sites, with 18 of 28 monitoring for 3 to 6 months while the rest of the sites monitor indefinitely. Site level practices differed between low and high performing sites, with high performing sites more likely to have adopted appropriate patient selection with review of adherence (83% vs. 65% in low-performing sites), have pharmacist-driven education (83% vs. 59%), and have pharmacist-led adverse event monitoring (92% vs. 35%). After adjustment for patient level and site level characteristics, the association between adherence and appropriate patient selection (adjusted risk ratio [RR], 1.14; 95% confidence interval [CI], 1.05–1.25) and pharmacist-led adverse event monitoring (RR, 1.25; 95% CI, 1.11–1.41) remained.
Conclusion. There is wide variability in dabigatran adherence among patients with atrial fibrillation at different VA sites. Site level pharmacist-based practices are associated with the level of adherence at the sites.
Commentary
Studies have demonstrated that in a clinical trial setting, dabigatran is as effective as warfarin in stroke prevention among patients with atrial fibrillation and is associated with a lower risk of major hemorrhage [1]. However, outside of clinical trials, effectiveness of a treatment regimen is highly related to whether treatment is adhered to. In contrast with warfarin treatment, where treatment adherence is regularly tracked through monitoring of blood levels and clinic visits, dabigatran does not require monitoring and thus, adherence to dabigatran may not be monitored. A recent study finds that poorer adherence likely contributes to increased risk of stroke and death among patients on dabigatran [2]. The current study examines the variation in adherence rates on a site level and identifies factors that are associated with better adherence. The findings suggest that better patient selection through examination of prior adherence to warfarin and other medications and pharmacist-led adverse event and adherence monitoring are practices that are associated with better adherence. These are potentially important findings that may impact care for patients with atrial fibrillation.
These results need to be interpreted cautiously because of the limitations of the observational study design. Several factors need to be considered when interpreting the study findings. First, despite the VA being a comprehensive system of care, veterans often use care outside of the VA, including obtaining medications outside of VA [3]. Because of the prevalent concurrent use of care outside of VA, examining adherence to medication with only VA records may be incomplete and may erroneously categorize patients as low adherence. Second, the number of patients on dabigatran per facility is rather small and quite variable as well, with some sites that have very few number of patients. Although the investigators have excluded sites with fewer than 20 patients on dabigatran, the variability in the use of dabigatran may reflect site-specific factors, some of which may affect patient selection on the site level, that ultimately may affect outcome. Finally, the interview of pharmacist at each site may reflect the view of one to two pharmacists at each site, and thus may not truly reflect practices at the site throughout the period where patients were selected and outcomes defined.
Applications for Clinical Practice
Although it is tempting to conclude that instituting the pharmacist-based activities in patient selection and adverse event monitoring will lead to better adherence to dabigatran and thus improved patient outcomes, considering the limitations in the study a follow-up intervention study where sites are randomized to institute-specific practices for dabigatran use will be very important to demonstrate definitively the impact of these interventions. Also, as the use of dabigatran and other novel anticoagulants become more prevalent [4], a follow-up study to include a larger sample of patients may also be valuable to demonstrate if the conclusions are upheld.
—William Hung, MD, MPH
1. Connolly SJ, Ezekowitz MD, Yusuf S, et al. Dabigatran versus warfarin in patients with atrial fibrillation. N Engl J Med 2009: 361:1139–50.
2. Shore S, Carey EP, Turakhia MP, et al. Adherence to dabigatran therapy and longitudinal patient outcomes: insights from the veterans health administration. Am Heart J 2014;167:810–7.
3. Hynes DM, Koelling K, Stroupe K, et al. Veterans’ access to and use of Medicare and veterans affairs health care. Med Care 2007:45:214–23.
4. Boyle AM. VA, army clinicians rapidly increase prescribing of novel anticoagulants. US Med Feb 2014. Available at www.usmedicine.com.
ASCO: Trial highlights cognitive toll of adjuvant whole-brain radiation
CHICAGO – Patients with limited brain metastases treated with radiosurgery have a higher risk of cognitive decline if they then undergo whole-brain radiation therapy, researchers reported at the annual meeting of the American Society of Clinical Oncology.
The phase III North Central Cancer Treatment Group (NCCTG)/Alliance trial also found that although whole-brain radiation therapy (WBRT) roughly halved the likelihood of progression in the brain, it did not prolong survival. And quality of life was worse with its use as well.

“We recommend initial treatment with stereotactic radiation alone and close monitoring in order to better preserve cognitive function, and then reserving whole-brain radiation until the time of symptomatic progression,” senior study author Dr. Jan C. Buckner, professor of oncology at the Mayo Clinic, Rochester, Minnesota, said in a press briefing.
He ticked off a list of alternative approaches for avoiding cognitive problems in general for patients with brain tumors: “If at all possible, use either no radiation, low-dose radiation, hippocampal-sparing radiation, or a combination of radiation and memantine as a way to reduce the risk of cognitive decline because essentially, the brain does not like to be radiated.”
ASCO expert Dr. Brian Michael Alexander said, “This scenario is a pretty complex one, and one that I take a lot of time talking to my patients about.” The disconnect between local control and survival with whole-brain radiation may be due to the availability of very good salvage therapies when brain metastases recur (so that recurrence is irrelevant) or a situation wherein progressive disease outside the brain is driving mortality, he proposed.

“If [the latter] is more of the answer, then … the population of patients who are unlikely to have deaths from progression of disease outside the brain may be the only place where you find a benefit for whole-brain radiation therapy,” according to Dr. Alexander, who is also Disease Center Leader of Radiation Oncology and a physician with the Center for Neuro-Oncology at the Dana-Farber Cancer Institute, and an assistant professor of Radiation Oncology at Harvard Medical School, both in Boston.
Given the totality of data today on the risks and benefits of this therapy, “I think the burden of proof is now switched, to say, can we prove that whole-brain radiation therapy is beneficial in a subset of patients?” he maintained, adding that the calculus may be changing with better systemic therapies, such as targeted agents for lung cancer, that may reduce brain metastases.
In their National Institutes of Health–funded trial, Dr. Buckner and colleagues studied 213 adults who had one to three cerebral metastases measuring up to 3 cm in diameter. They were randomly assigned to receive radiosurgery alone or radiosurgery followed by WBRT. Cognitive progression, the trial’s primary endpoint, was assessed with a battery of tests.
With a median follow-up of 7.2 months, the 3-month rate of cognitive progression, defined as a decline of greater than one standard deviation from baseline in any of the six tests used, was 92% in the WBRT group and 64% in the control group (P = .0007). Specifically, the former were more likely to experience declines in immediate recall (30% vs. 8%), delayed recall (51% vs. 20%), and verbal fluency (19% vs. 2%).
The overall difference in cognitive decline persisted at 6 months and there was additionally a trend at 12 months among the small subset of patients still alive. The WBRT group also had significantly worse scores for patient-reported quality of life.
The 3-month rate of failure in the central nervous system was lower for the patients given WBRT (6% vs. 25%, P less than .0001), but overall survival did not differ significantly between groups, either in the entire population or in subgroups. “In spite of imaging evidence of disease control, there was no overall impact on survival in these patients as they died of other causes,” reported Dr. Buckner.
In the session where the results were presented, invited discussant Dr. Andrew B. Lassman, the John Harris Associate Professor of Neurology and the Chief of Neuro-oncology at Columbia University Medical Center, New York, said, “I think there are other interpretations [of the findings] when placing this study in the context of other trials for brain metastases.”
“First, whole-brain radiotherapy does increase survival in the appropriate context. Second, deferring whole-brain radiotherapy leads to more rapid and more numerous recurrences of brain metastases, which also cause neurocognitive injury,” he elaborated. “Accordingly, whole-brain radiotherapy should be used in selected cases when brain metastases are a life-limiting site of disease. This is a form of precision medicine.”
Adequate assessment of any survival benefit of this therapy requires appropriate patient selection, Dr. Lassman maintained. Therefore, ongoing analysis of the trial’s results according to patients’ graded prognostic assessment (GPA) scores are eagerly awaited.
“Whole-brain radiotherapy remains a useful tool in the appropriate context that should not be discarded, but it is a crude tool with significant toxicities that is now over 60 years old. Refinements and new approaches are needed and in development,” he concluded.
Dr. Buckner disclosed that he has a consulting or advisory role with Merck Serono and is provided with travel, accommodations, and expenses by Genentech/Roche. The trial was funded by the National Institutes of Health.
CHICAGO – Patients with limited brain metastases treated with radiosurgery have a higher risk of cognitive decline if they then undergo whole-brain radiation therapy, researchers reported at the annual meeting of the American Society of Clinical Oncology.
The phase III North Central Cancer Treatment Group (NCCTG)/Alliance trial also found that although whole-brain radiation therapy (WBRT) roughly halved the likelihood of progression in the brain, it did not prolong survival. And quality of life was worse with its use as well.
“We recommend initial treatment with stereotactic radiation alone and close monitoring in order to better preserve cognitive function, and then reserving whole-brain radiation until the time of symptomatic progression,” senior study author Dr. Jan C. Buckner, professor of oncology at the Mayo Clinic, Rochester, Minnesota, said in a press briefing.
He ticked off a list of alternative approaches for avoiding cognitive problems in general for patients with brain tumors: “If at all possible, use either no radiation, low-dose radiation, hippocampal-sparing radiation, or a combination of radiation and memantine as a way to reduce the risk of cognitive decline because essentially, the brain does not like to be radiated.”
ASCO expert Dr. Brian Michael Alexander said, “This scenario is a pretty complex one, and one that I take a lot of time talking to my patients about.” The disconnect between local control and survival with whole-brain radiation may be due to the availability of very good salvage therapies when brain metastases recur (so that recurrence is irrelevant) or a situation wherein progressive disease outside the brain is driving mortality, he proposed.
“If [the latter] is more of the answer, then … the population of patients who are unlikely to have deaths from progression of disease outside the brain may be the only place where you find a benefit for whole-brain radiation therapy,” according to Dr. Alexander, who is also Disease Center Leader of Radiation Oncology and a physician with the Center for Neuro-Oncology at the Dana-Farber Cancer Institute, and an assistant professor of Radiation Oncology at Harvard Medical School, both in Boston.
Given the totality of data today on the risks and benefits of this therapy, “I think the burden of proof is now switched, to say, can we prove that whole-brain radiation therapy is beneficial in a subset of patients?” he maintained, adding that the calculus may be changing with better systemic therapies, such as targeted agents for lung cancer, that may reduce brain metastases.
In their National Institutes of Health–funded trial, Dr. Buckner and colleagues studied 213 adults who had one to three cerebral metastases measuring up to 3 cm in diameter. They were randomly assigned to receive radiosurgery alone or radiosurgery followed by WBRT. Cognitive progression, the trial’s primary endpoint, was assessed with a battery of tests.
With a median follow-up of 7.2 months, the 3-month rate of cognitive progression, defined as a decline of greater than one standard deviation from baseline in any of the six tests used, was 92% in the WBRT group and 64% in the control group (P = .0007). Specifically, the former were more likely to experience declines in immediate recall (30% vs. 8%), delayed recall (51% vs. 20%), and verbal fluency (19% vs. 2%).
The overall difference in cognitive decline persisted at 6 months and there was additionally a trend at 12 months among the small subset of patients still alive. The WBRT group also had significantly worse scores for patient-reported quality of life.
The 3-month rate of failure in the central nervous system was lower for the patients given WBRT (6% vs. 25%, P less than .0001), but overall survival did not differ significantly between groups, either in the entire population or in subgroups. “In spite of imaging evidence of disease control, there was no overall impact on survival in these patients as they died of other causes,” reported Dr. Buckner.
In the session where the results were presented, invited discussant Dr. Andrew B. Lassman, the John Harris Associate Professor of Neurology and the Chief of Neuro-oncology at Columbia University Medical Center, New York, said, “I think there are other interpretations [of the findings] when placing this study in the context of other trials for brain metastases.”
“First, whole-brain radiotherapy does increase survival in the appropriate context. Second, deferring whole-brain radiotherapy leads to more rapid and more numerous recurrences of brain metastases, which also cause neurocognitive injury,” he elaborated. “Accordingly, whole-brain radiotherapy should be used in selected cases when brain metastases are a life-limiting site of disease. This is a form of precision medicine.”
Adequate assessment of any survival benefit of this therapy requires appropriate patient selection, Dr. Lassman maintained. Therefore, ongoing analysis of the trial’s results according to patients’ graded prognostic assessment (GPA) scores are eagerly awaited.
“Whole-brain radiotherapy remains a useful tool in the appropriate context that should not be discarded, but it is a crude tool with significant toxicities that is now over 60 years old. Refinements and new approaches are needed and in development,” he concluded.
Dr. Buckner disclosed that he has a consulting or advisory role with Merck Serono and is provided with travel, accommodations, and expenses by Genentech/Roche. The trial was funded by the National Institutes of Health.
AT THE ASCO ANNUAL MEETING 2015
Key clinical point: Adding whole-brain radiation after radiosurgery increases the risk of cognitive decline in patients with limited brain metastases.
Major finding: Patients were more likely to experience cognitive decline if they received WBRT after radiosurgery vs. radiosurgery alone (92% vs. 64%).
Data source: A randomized phase III trial among 213 patients with one to three small brain metastases.
Disclosures: Dr. Buckner disclosed that he has a consulting or advisory role with Merck Serono and is provided with travel, accommodations, and expenses by Genentech/Roche. The trial was funded by the National Institutes of Health.

Drug prolongs PFS in indolent, refractory NHL

the 2015 ASCO Annual Meeting
CHICAGO—Adding obinutuzumab to treatment with bendamustine improves progression-free survival (PFS) in patients with rituximab-refractory, indolent non-Hodgkin lymphoma (NHL), interim results of the phase 3 GADOLIN trial suggest.
Study investigators said patients who received obinutuzumab and bendamustine followed by obinutuzumab maintenance had roughly double the PFS of patients who received bendamustine alone.
There was no significant difference between the treatment groups with regard to response rates or overall survival (OS), but the investigators said longer follow-up is needed to determine if obinutuzumab confers a benefit in OS.
This trial was stopped before its protocol-specified final analysis because of the PFS benefit observed in the obinutuzumab arm.
Laurie Sehn, MD, of the BC Cancer Agency in Vancouver, Canada, presented these results at the 2015 ASCO Annual Meeting (abstract LBA8502). Genentech Inc. and F. Hoffmann-La Roche Ltd. funded this research.
The trial included 413 patients with rituximab-refractory NHL, including follicular lymphoma (FL), marginal zone lymphoma (MZL), small lymphocytic lymphoma (SLL), and Waldenstrom’s macroglobulinemia (WM).
The patients were randomized to receive bendamustine alone (120 mg/m2/day on days 1 and 2 for up to six 28-day cycles) or a combination of bendamustine (90 mg/m2/day on days 1 and 2 for up to six 28-day cycles) plus obinutuzumab (1000 mg on days 1, 8, and 15 for cycle 1, followed by 1 dose for up to six 28-day cycles), followed by obinutuzumab maintenance (1000 mg every 2 months for 2 years or until progression).
Dr Sehn said there were no significant differences in baseline characteristics between the treatment arms. Patients in both arms had received a median of 2 prior treatments, and the median time from last treatment was about 4 months.
Of the 194 patients randomized to treatment in the obinutuzumab-bendamustine (OB) arm, 79.9% had FL, 13.9% had MZL, and 6.2% had SLL. Of the 202 patients randomized to the bendamustine-alone (control) arm, 82.2% had FL, 9.4% had MZL, 7.9% had SLL, and 0.5% had WM.
Ultimately, 156 patients completed induction in the OB arm, as did 129 patients in the control arm. Thirty-six patients completed maintenance with obinutuzumab, and 46 were still receiving maintenance at the time of analysis.
Safety results
Dr Sehn said there were no unexpected safety signals among patients in the OB arm.
About 99% of patients in the OB arm experienced at least 1 adverse event (AE), as did 98% of patients in the control arm. Severe AEs occurred in 38.1% and 32.8% of patients, respectively, and grade 3/4 AEs occurred in 67% and 62.1%, respectively.
AEs leading to treatment withdrawal occurred in 18% and 15.7% of patients, respectively. And AEs leading to death occurred in 6.2% and 6.1%, respectively.
Grade 3/4 AEs that occurred in at least 2% of patients in the OB and control arms, respectively, were neutropenia (33% vs 26.3%), thrombocytopenia (10.8% vs 16.2%), infusion-related reactions (10.8% vs 5.6%), anemia (7.7% vs 10.1%), febrile neutropenia (4.6% vs 3.5%), nausea (1% vs 3%), fatigue (1.5% vs 2.5%), diarrhea (1% vs 2.5%), and vomiting (2.1% vs 1%).
Response and survival
According to an independent radiology facility, 69.2% of patients in the OB arm had responded to treatment at the end of induction, as had 63% of the control arm. The best overall response by the 12-month mark was 78.7% and 76.6%, respectively.
The median follow-up was 21 months. At that point, the median PFS had not been reached in the OB arm but was 14.9 months in the control arm (P<0.0001), according to the independent radiology facility.
According to investigators, the median PFS was 29.2 months and 14 months, respectively (P<0.0001).
The median OS has not been reached in either arm (P=0.4017). Thirty-four patients (18%) in the OB arm died, as did 41 (20%) in the control arm.
Dr Sehn said longer follow-up is needed to determine the potential OS benefit associated with obinutuzumab, but the PFS benefit of OB is clinically meaningful.
“The fact that this new approach doubled average remission time marks a major step forward for our patients,” she said. “Obinutuzumab may offer patients the chance to stay well for a significantly longer period of time, putting off the need for additional chemotherapy.” ![]()
Breastfeeding may lower risk of ALL

Photo by Petr Kratochvil
Breastfeeding a child may reduce his risk of developing acute lymphoblastic leukemia (ALL) but perhaps not acute myeloid leukemia (AML), according to a review published in JAMA Pediatrics.
Researchers found that breastfeeding a child for 6 months or longer was associated with a 19% lower risk of childhood leukemia, compared with no
breastfeeding or breastfeeding for a shorter period of time.
And children who were breastfed for any amount of time had an 11% lower risk of childhood leukemia than children who were never breastfed.
However, when the researchers analyzed studies of ALL and AML separately, they found that breastfeeding was not associated with a significantly lower risk of AML.
Efrat L. Amitay, PhD, and Lital Keinan-Boker, MD, PhD, of the University of Haifa in Israel, conducted this research.
In a review of 18 studies, the pair found that breastfeeding a child for 6 months or longer was associated with a significantly lower risk of childhood leukemia, compared with no breastfeeding or breastfeeding for a shorter period of time (odds ratio [OR]=0.81).
And a separate analysis of 15 studies showed that children who were breastfed for any amount of time had a lower risk of childhood leukemia than children who were never breastfed (OR=0.89).
The researchers also conducted meta-analyses of AML studies and ALL studies separately—11 ALL and 6 AML studies. And they found a significant inverse association between breastfeeding for 6 months or more and ALL risk (OR=0.82) but no significant association for AML risk (OR=0.74).
The researchers said several biological mechanisms may explain the association between breastfeeding and a reduced risk of childhood leukemia. However, more high-quality studies are needed to clarify those mechanisms. ![]()
Newer anticoagulants may not be best for elderly, study shows

A meta-analysis of 92,816 people taking anticoagulants has shown that the risk of gastrointestinal (GI) bleeding related to the newer oral anticoagulants dabigatran and rivaroxaban is similar to that for warfarin.
But for patients older than 65, the risk of GI bleeding increases. By age 76, the risk may be 3 to 5 times higher when taking the newer anticoagulants compared to warfarin.
These findings were published in BMJ.
“The new anticoagulants have really been popular with patients who have previously only had one choice of oral anticoagulant,” said study author Neena S. Abraham, MD, of the Mayo Clinic in Scottsdale, Arizona.
“However, they may not be the right choice for everyone. Our findings definitely point toward important age-related risk that merit consideration when doctors are making treatment recommendations.”
Dr Abraham and her colleagues compared the risk of GI bleeding with newer anticoagulants and warfarin using national data available on privately insured patients and Medicare Advantage enrollees from the Optum Labs Data Warehouse.
Data on apixaban were not included in the study because there were too few patients prescribed apixaban in the dataset during the period of observation, from November 1, 2010, to September 30, 2013.
The cohort included 8578 (9.2%) patients on dabigatran, 16,253 (17.5%) on rivaroxaban, and 67,985 (73.2%) on warfarin. Patients were 18 years of age or older.
The researchers found that, among atrial fibrillation (AF) patients older than 75, the risk of GI bleeding was higher than with warfarin. The hazard ratios (HRs) were 2.49 (95% confidence interval [CI] 1.61 to 3.83) and 1.62 (95% CI 1.02 to 2.58), respectively.
However, among older patients without AF, the risk of GI bleeding was comparable with dabigatran and warfarin. The HRs were 1.56 (95% CI 0.42 to 5.80) and 2.73 (95% CI 0.83 to 8.94), respectively.
Older AF patients taking rivaroxaban had an increased risk of GI bleeding compared to patients taking warfarin. The HRs were 2.91 (95% CI 1.65 to 4.81) and 2.05 (95% CI 1.17 to 3.59), respectively.
And older patients without AF had an increased risk of GI bleeding with rivaroxaban compared to warfarin. The HRs were 4.58 (95% CI 2.40 to 8.72) and 4.40 (95% CI 2.43 to 7.96), respectively.
The researchers also found that, for those patients under 65, the newer agents seemed to confer a lower risk of GI bleeding than warfarin. ![]()
Hole in Jaw Has Drained Fluid for 20 Years
ANSWER
The correct answer is all of the above (choice “d”). The patient’s actual diagnosis, sinus tract of odontogenic origin (choice “a”), will be discussed further.
Branchial cleft cyst (choice “b”) is always in the differential for neck masses, and squamous cell carcinoma (choice “c”) should always be considered in cases of nonhealing lesions—although 20 years is an unlikely timeframe for that diagnosis! Additional differential possibilities include thyroglossal duct cyst and pyogenic granuloma.
DISCUSSION
Sinus tracts of odontogenic origin, also called dentocutaneous sinus tracts, are primarily caused by periapical abscesses. As the purulent material accumulates in the confined space around the apical area, pressure increases; this sets in motion a tunneling process that terminates in an outlet, often inside the mouth but also (often enough) on the skin.
In the latter instance, known as extraoral sinus, the opening forms along the chin or submental area. In 80% of cases, the source is the mandibular teeth.
Dermocutaneous sinuses of maxillary origin, though not unknown, are decidedly unusual. They can drain anywhere on the maxilla, including around the nose. In edentulous patients, retained tooth fragments or segments of apical abscesses can act as the nidus for this process.
When a draining sinus manifests more acutely or occurs in a patient from a high-risk area (eg, Mexico or Central America), other diagnoses must be considered. These include scrofula, in which regional nymph nodes, infected by Mycobacterium tuberculosis or atypical mycobacterial organism, break down and drain. The indolent nature and chronicity of this patient’s problem effectively ruled out this diagnosis.
Culture of the fluid draining from the abscess would reveal a number of organisms (mostly of the strep family) but would not show the actual causative bacteria, since they are typically anaerobic. Biopsy of the surrounding tissue is occasionally necessary, when squamous cell carcinoma or other neoplastic process is suspected.
TREATMENT
The patient was advised to see a dentist, who will likely obtain a panoramic radiograph of her teeth, with particular attention to the affected area.
If an abscess is identified, as expected, treatment would entail root canal or extraction. The sinus tract would then heal rather quickly.
Antibiotics would be of limited use without elimination of the pocket. However, when patients complain of discomfort or outright pain, antibiotics (eg, penicillin V potassium or amoxicillin/clavulanate) can help to reduce the inflammation and offer some relief.

A 74-year-old woman is referred to dermatology by the primary care provider at her nursing home. She has a small hole on her left jaw that has drained foul-smelling material for more than 20 years. Although the site has never been painful, it occasionally swells and becomes slightly sensitive before slowly returning to its usual small size over a period of weeks. The patient is in generally poor health, with early dementia, chronic congestive heart failure, and diabetes. All her teeth were removed almost 30 years ago. She is afebrile and in no acute distress. On the submental aspect of her left jaw, there is a round, 6-cm area of skin that is retracted and fixed around a centrally placed sinus opening (measuring about 2 to 3 mm). A scant amount of purulent-looking fluid can be expressed from the spot. The area is faintly pink, but there is no evidence of increased warmth or tenderness on palpation.

Weighing the Options for Obesity Meds
In June 2013, the American Medical Association classified obesity as a disease. Since then, several medical societies have published guidelines to help clinicians improve care of affected patients. One avenue is, of course, pharmacologic treatment.

Until recently, there was only one FDA-approved medication for chronic weight loss on the market: orlistat, which was approved in 1999. (Phentermine and diethylpropion are only indicated for short-term use). After a long hiatus, the FDA approved two additional agents (phentermine/topiramate and lorcaserin)in 2012 and another two (liraglutide and bupropion/naltrexone) in 2014.
While clinicians appreciate having options for managing their patients’ conditions, in this case, many are overwhelmed by the choices. Most health care providers have not received formal training in obesity management. This column will attempt to fill the information gap in terms of what agents are available and what factors should be assessed before prescribing any of them.
Proviso: Experts claim obesity is a chronic disease, similar to hypertension, and should be managed as such. Although not discussed here, the most important aspect of weight loss and maintenance is lifestyle intervention (diet, exercise, and behavioral modification). It should be emphasized that no medication works by itself; all should be used as an adjunct tool to reinforce adherence to lifestyle changes.1 Furthermore, patients may be disappointed to learn that without these changes, the weight may return when they cease medication use.
CASE Deb, age 61, presents to your office for routine follow-up. She has a history of type 2 diabetes, dyslipidemia, hypertension, atrial fibrillation, depression, and chronic back pain due to a herniated disc. Her medications include insulin glargine, glyburide, pioglitazone, atorvastatin, metoprolol, paroxetine, and acetaminophen/hydrocodone.
Her vital signs include a blood pressure of 143/91 mm Hg and a pulse of 93 beats/min. She has a BMI of 37 and a waist circumference of 35 in.
Deb, concerned about her weight, would like to discuss weight-loss options. She has tried three different commercial programs; each time, she was able to lose 30 to 50 lb in three to six months but regained the weight once she stopped the program. She reports excessive appetite as the main reason for her rebound weight gain. Her exercise is limited due to her back pain.
She recently tried OTC orlistat but could not tolerate it due to flatulence and fecal urgency. She reports an incident in which she couldn’t reach the bathroom in time.
Continue for Discussion >>
DISCUSSION
The Endocrine Society’s recommended approaches to obesity management include diet, exercise, and behavioral modification for patients with a BMI ≥ 25. The addition of pharmacotherapy can be considered for those with a BMI ≥ 30 or with a BMI ≥ 27 and one or more weight-related comorbidities (eg, diabetes, dyslipidemia, hypertension). This matches the FDA-approved product labeling for chronic weight-loss medications. Bariatric surgery should be considered for patients with a BMI ≥ 40 or with a BMI ≥ 35 and at least one weight-related comorbidity.
Orlistat
Orlistat is available OTC in a 60-mg thrice-daily form. A higher dosage (120 mg tid) is available via prescription. Orlistat decreases fat absorption in the gastrointestinal (GI) tract by inhibiting GI lipase. Average weight loss with orlistat is 3% at first and second year, and, when compared with placebo, 2.4% greater at four years.2
Orlistat should be prescribed with a multivitamin due to decreased absorption of fat-soluble vitamins. It is contraindicated in patients with malabsorption syndrome and gallbladder disease (> 2% incidence3). It can increase cyclosporine exposure, and rare cases of liver failure have been reported. The most common adverse effect is related to steatorrhea. Of the available options, orlistat is the only medication that has no effect on neurohormonal regulation in appetite control and metabolic rate, which may be a limiting factor.
CASE POINT Due to Deb’s intolerance of and embarrassment with GI adverse effects, she requests an alternative medication.
Lorcaserin
Lorcaserin is a selective serotonin 2C receptor agonist that reduces appetite by affecting anorexigenic pro-opiomelanocortin (POMC) neurons in the hypothalamus. Of note, lorcaserin “selects” the 2C receptor instead of 2A and 2B; 2B receptors are found in both aortic and mitral valves, which may explain the association between fenfluramine/phentermine (commonly known as “fen/phen” and withdrawn from the market in 1997) and possible cardiac valvulopathy. (Fenfluramine is an amphetamine derivative that nonselectively stimulates serotonin release and inhibits reuptake.)
Lorcaserin comes in a 10-mg twice-daily dosage. In studies, patients taking lorcaserin had an average weight loss of 3.3% more than those taking placebo at one year; weight loss was maintained through the second year for those who continued on medication. However, those who stopped the medication at one year had regained their weight by the two-year mark.4
It is recommended that the medication be discontinued if patients don’t achieve a loss of more than 5% of body weight by 12 weeks.
In a study that enrolled diabetic patients, lorcaserin also demonstrated a 0.9% reduction in A1C, which is similar to or even better than some oral antidiabetic medications.4 However, since the manufacturer was not planning for an antidiabetic indication, A1C was only a secondary endpoint. The reduction is most likely due to decreased caloric intake and weight loss.
The most common adverse effects of lorcaserin include headache, dizziness, and fatigue. The discontinuation rate due to intolerance was 8.6%, compared to 6.7% with placebo.5
Although this was not observed in clinical studies, co-administration of lorcaserin (a serotonin receptor agonist) with other serotonergic or antidopaminergic agents can theoretically cause serotonin syndrome or neuroleptic malignant syndrome–like reactions. Caution is therefore advisable when prescribing these agents. The package insert carries a warning for cardiac valvulopathy due to fen/phen’s history and a lack of long-term cardiovascular safety data.
CASE POINT Deb is taking paroxetine (an SSRI) for her depression. Since you are concerned about serotonin syndrome, you decide to keep exploring options. Checking the package insert for phentermine/topiramate, you learn that it does not have a potential adverse reaction related to co-administration with SSRIs.
Phentermine/Topiramate
Phentermine, a sympathomimetic medication, was approved for short-term (12-week) use for weight loss in the 1960s. Topiramate, an antiseizure and migraine prophylactic medication, enhances appetite suppression—although the exact mechanism of action is unknown.1
Four once-daily doses are available: 3.75/23 mg, 7.5/46 mg, 11.25/69 mg, and 15/92 mg. Dosing starts with 3.75/23 mg for two weeks, then increases to 7.5/46 mg. If a loss of 5% or more of body weight is achieved, the patient can continue the dosage; if not, it can be increased to 11.25/69 mg for two weeks and then to 15/92 mg. The average weight loss for mid and maximum dose was 6.6% and 8.6% greater than placebo at one year.5
Commonly reported adverse effects include paraesthesia, dysgeusia (distortion of sense of taste), dizziness, insomnia, constipation, and dry mouth. Due to phentermine’s sympathomimetic action, mild increases in heart rate and blood pressure were reported. The Endocrine Society recommends against the use of phentermine in patients with uncontrolled hypertension and a history of heart disease.1
Weight loss is generally not recommended during pregnancy, and all weight loss medications are classified as category X for pregnancy. Strict caution is advised with this particular agent, as topiramate has known teratogenicity and therefore comes with a Risk Evaluation Mitigation Strategy. Patients must be advised to use appropriate contraception while taking topiramate, and a pregnancy test should be performed before medication commencement and monthly thereafter.
Abrupt cessation of topiramate can cause seizure. When taking the 15/92-mg dosage, the patient should reduce to one tablet every other day for at least one week before discontinuation.
CASE POINT Deb’s blood pressure is still not at goal. This, along with her history of atrial fibrillation and high pulse, prompts you to consider another option.
Bupropion/Naltrexone
Bupropion, a widely used antidepressant, inhibits the uptake of norepinephrine and dopamine and thereby blocks the reward pathway that various foods can induce. Naltrexone, an opioid antagonist, blocks the opioid pathway and can be helpful in enhancing weight loss.
This combination comes in an 8/90-mg tablet. The suggested titration regimen is to start with one tablet per day and increase by one tablet every week, up to the maximum dosage of two tablets twice a day. Average weight loss was 3.1% greater than placebo at one year with the maximum dosage. An A1C reduction of 0.6% was seen in diabetic patients.6 It is recommended to stop the medication and seek an alternative treatment option if > 5% loss of body weight is not achieved by 12 weeks.
GI adverse effects (eg, nausea and vomiting) are common; these can be reduced with a slower titration regimen or by prescribing a maximum of one tablet twice daily (instead of two). Every antidepressant carries suicidal risk, and caution is advised with their use. Bupropion can also lower the seizure threshold, and it is contraindicated for patients with seizure disorder. It is also contraindicated in patients who are undergoing abrupt cessation of alcohol, benzodiazepines, or barbiturates. It can increase pulse and blood pressure during early titration; regular blood pressure monitoring is warranted.
CASE POINT Due to Deb’s opioid usage and uncontrolled hypertension, you discuss a final option that was recently approved for weight loss.
Liraglutide
This glucagon-like peptide-1 (GLP1) receptor agonist affects the brain to suppress/control appetite, slows down gastric emptying, and induces early satiety. A 3-mg dosage was approved in December 2014, but 0.6-, 1.2-, and 1.8-mg dosages have been available since 2010 for patients with type 2 diabetes.
Average weight loss was 4.5% greater than placebo at one year.7 If < 4% weight loss is achieved by 16 weeks, consider using an alternative agent.
The most common adverse effect is GI upset, which could be related to the mechanism of action (slower gastric emptying). Although self-reported GI upset was high (39%), the actual discontinuation rate was low (2.9% for nausea, 1.7% for vomiting, and 1.4% for diarrhea).3
This adverse effect could, in certain contexts, be considered “wanted,” since it discourages overeating or eating too quickly. My clinical pearl is to tell patients taking liraglutide that they are “trapped” and have to eat smaller portions and eat more slowly or they will be more prone to GI effects. With this strategy, we can encourage portion control and responsibility for behavior. (Please note that this is my experience with the diabetic dosage of liraglutide; I do not have any clinical experience with the obesity dosage, which was not clinically available at the time of writing.)
Both branded versions of liraglutide carry a black-box warning for thyroid C-cell tumors, which were observed in rodents but unproven in humans. The medication is contraindicated in patients with medullary thyroid cancer or with multiple endocrine neoplasia 2 syndrome. Increased rates of acute pancreatitis, cholecystitis, and cholelithiasis were seen in studies, and caution is advised.
Continue for A Word About Meds That Cause Weight Gain >>
A WORD ABOUT MEDS THAT CAUSE WEIGHT GAIN
The Endocrine Society has published a list of medications that can influence weight gain, along with suggestions for alternative agents that are either weight neutral or promote weight loss.
Note that our case patient, Deb, is taking insulin, a sulfonylurea (glyburide), and thiazolidinedione (pioglitazone) for diabetes—all of which can promote weight gain. Guidelines suggest choosing metformin, DPP4 inhibitors, GLP1 agonists, amylin analog, and SGLT2 inhibitors instead when weight gain is a major concern.1
Guidelines also suggest using ACE inhibitors, angiotensin receptor blockers, and calcium channel blockers instead of β-blockers as firstline antihypertensive therapy for diabetic patients.1 Adequate blood pressure and lipid control are imperative in diabetes management.
CASE POINT Deb would need better hypertension control before she considers weight-loss medication. Since she is also taking paroxetine, which among SSRIs is associated with greatest weight gain, a changed to fluoxetine or sertraline should be considered.2
Next page: Conclusion >>
CONCLUSION
There are now five medications approved by the FDA for chronic weight loss, with more to come. Agents with different mechanisms of action give us options to help obese patients and hopefully reduce and prevent obesity-related complications. It is important for clinicians to be competent in managing obesity, especially since we live in an era in which the disease is considered pandemic.
REFERENCES
1. Apovian CM, Aronne LJ, Bessesen DH, et al; Endocrine Society. Pharmacological management of obesity: an Endocrine Society clinical practice guideline. J Clin Endocrinol Metab. 2015;100(2):342-362.
2. Xenical [package insert]. South San Francisco, CA: Genentech USA, Inc; 2012.
3. Fujioka K. Safety and tolerability of medications approved for chronic weight management. Obesity (Silver Spring). 2015;22 (suppl 1):S7-S11.
4. Belviq [package insert]. Woodcliff Lake, NJ: Eisai Inc; 2015.
5. Qsymia [package insert]. Mountain View, CA: Vivus, Inc; 2013.
6. Contrave [package insert]. Deerfield, IL: Takeda USA, Inc; 2014.
7. Saxenda [package insert]. Plainsboro, NJ: Novo Nordisk; 2014.
Clinician Reviews in partnership with![]()
Ji Hyun Chun practices with Optum Medical Partners: Endocrinology in Orange County, California. The author has no financial relationships to disclose.
Clinician Reviews in partnership with![]()
Ji Hyun Chun practices with Optum Medical Partners: Endocrinology in Orange County, California. The author has no financial relationships to disclose.
Clinician Reviews in partnership with![]()
Ji Hyun Chun practices with Optum Medical Partners: Endocrinology in Orange County, California. The author has no financial relationships to disclose.
In June 2013, the American Medical Association classified obesity as a disease. Since then, several medical societies have published guidelines to help clinicians improve care of affected patients. One avenue is, of course, pharmacologic treatment.
Until recently, there was only one FDA-approved medication for chronic weight loss on the market: orlistat, which was approved in 1999. (Phentermine and diethylpropion are only indicated for short-term use). After a long hiatus, the FDA approved two additional agents (phentermine/topiramate and lorcaserin)in 2012 and another two (liraglutide and bupropion/naltrexone) in 2014.
While clinicians appreciate having options for managing their patients’ conditions, in this case, many are overwhelmed by the choices. Most health care providers have not received formal training in obesity management. This column will attempt to fill the information gap in terms of what agents are available and what factors should be assessed before prescribing any of them.
Proviso: Experts claim obesity is a chronic disease, similar to hypertension, and should be managed as such. Although not discussed here, the most important aspect of weight loss and maintenance is lifestyle intervention (diet, exercise, and behavioral modification). It should be emphasized that no medication works by itself; all should be used as an adjunct tool to reinforce adherence to lifestyle changes.1 Furthermore, patients may be disappointed to learn that without these changes, the weight may return when they cease medication use.
CASE Deb, age 61, presents to your office for routine follow-up. She has a history of type 2 diabetes, dyslipidemia, hypertension, atrial fibrillation, depression, and chronic back pain due to a herniated disc. Her medications include insulin glargine, glyburide, pioglitazone, atorvastatin, metoprolol, paroxetine, and acetaminophen/hydrocodone.
Her vital signs include a blood pressure of 143/91 mm Hg and a pulse of 93 beats/min. She has a BMI of 37 and a waist circumference of 35 in.
Deb, concerned about her weight, would like to discuss weight-loss options. She has tried three different commercial programs; each time, she was able to lose 30 to 50 lb in three to six months but regained the weight once she stopped the program. She reports excessive appetite as the main reason for her rebound weight gain. Her exercise is limited due to her back pain.
She recently tried OTC orlistat but could not tolerate it due to flatulence and fecal urgency. She reports an incident in which she couldn’t reach the bathroom in time.
Continue for Discussion >>
DISCUSSION
The Endocrine Society’s recommended approaches to obesity management include diet, exercise, and behavioral modification for patients with a BMI ≥ 25. The addition of pharmacotherapy can be considered for those with a BMI ≥ 30 or with a BMI ≥ 27 and one or more weight-related comorbidities (eg, diabetes, dyslipidemia, hypertension). This matches the FDA-approved product labeling for chronic weight-loss medications. Bariatric surgery should be considered for patients with a BMI ≥ 40 or with a BMI ≥ 35 and at least one weight-related comorbidity.
Orlistat
Orlistat is available OTC in a 60-mg thrice-daily form. A higher dosage (120 mg tid) is available via prescription. Orlistat decreases fat absorption in the gastrointestinal (GI) tract by inhibiting GI lipase. Average weight loss with orlistat is 3% at first and second year, and, when compared with placebo, 2.4% greater at four years.2
Orlistat should be prescribed with a multivitamin due to decreased absorption of fat-soluble vitamins. It is contraindicated in patients with malabsorption syndrome and gallbladder disease (> 2% incidence3). It can increase cyclosporine exposure, and rare cases of liver failure have been reported. The most common adverse effect is related to steatorrhea. Of the available options, orlistat is the only medication that has no effect on neurohormonal regulation in appetite control and metabolic rate, which may be a limiting factor.
CASE POINT Due to Deb’s intolerance of and embarrassment with GI adverse effects, she requests an alternative medication.
Lorcaserin
Lorcaserin is a selective serotonin 2C receptor agonist that reduces appetite by affecting anorexigenic pro-opiomelanocortin (POMC) neurons in the hypothalamus. Of note, lorcaserin “selects” the 2C receptor instead of 2A and 2B; 2B receptors are found in both aortic and mitral valves, which may explain the association between fenfluramine/phentermine (commonly known as “fen/phen” and withdrawn from the market in 1997) and possible cardiac valvulopathy. (Fenfluramine is an amphetamine derivative that nonselectively stimulates serotonin release and inhibits reuptake.)
Lorcaserin comes in a 10-mg twice-daily dosage. In studies, patients taking lorcaserin had an average weight loss of 3.3% more than those taking placebo at one year; weight loss was maintained through the second year for those who continued on medication. However, those who stopped the medication at one year had regained their weight by the two-year mark.4
It is recommended that the medication be discontinued if patients don’t achieve a loss of more than 5% of body weight by 12 weeks.
In a study that enrolled diabetic patients, lorcaserin also demonstrated a 0.9% reduction in A1C, which is similar to or even better than some oral antidiabetic medications.4 However, since the manufacturer was not planning for an antidiabetic indication, A1C was only a secondary endpoint. The reduction is most likely due to decreased caloric intake and weight loss.
The most common adverse effects of lorcaserin include headache, dizziness, and fatigue. The discontinuation rate due to intolerance was 8.6%, compared to 6.7% with placebo.5
Although this was not observed in clinical studies, co-administration of lorcaserin (a serotonin receptor agonist) with other serotonergic or antidopaminergic agents can theoretically cause serotonin syndrome or neuroleptic malignant syndrome–like reactions. Caution is therefore advisable when prescribing these agents. The package insert carries a warning for cardiac valvulopathy due to fen/phen’s history and a lack of long-term cardiovascular safety data.
CASE POINT Deb is taking paroxetine (an SSRI) for her depression. Since you are concerned about serotonin syndrome, you decide to keep exploring options. Checking the package insert for phentermine/topiramate, you learn that it does not have a potential adverse reaction related to co-administration with SSRIs.
Phentermine/Topiramate
Phentermine, a sympathomimetic medication, was approved for short-term (12-week) use for weight loss in the 1960s. Topiramate, an antiseizure and migraine prophylactic medication, enhances appetite suppression—although the exact mechanism of action is unknown.1
Four once-daily doses are available: 3.75/23 mg, 7.5/46 mg, 11.25/69 mg, and 15/92 mg. Dosing starts with 3.75/23 mg for two weeks, then increases to 7.5/46 mg. If a loss of 5% or more of body weight is achieved, the patient can continue the dosage; if not, it can be increased to 11.25/69 mg for two weeks and then to 15/92 mg. The average weight loss for mid and maximum dose was 6.6% and 8.6% greater than placebo at one year.5
Commonly reported adverse effects include paraesthesia, dysgeusia (distortion of sense of taste), dizziness, insomnia, constipation, and dry mouth. Due to phentermine’s sympathomimetic action, mild increases in heart rate and blood pressure were reported. The Endocrine Society recommends against the use of phentermine in patients with uncontrolled hypertension and a history of heart disease.1
Weight loss is generally not recommended during pregnancy, and all weight loss medications are classified as category X for pregnancy. Strict caution is advised with this particular agent, as topiramate has known teratogenicity and therefore comes with a Risk Evaluation Mitigation Strategy. Patients must be advised to use appropriate contraception while taking topiramate, and a pregnancy test should be performed before medication commencement and monthly thereafter.
Abrupt cessation of topiramate can cause seizure. When taking the 15/92-mg dosage, the patient should reduce to one tablet every other day for at least one week before discontinuation.
CASE POINT Deb’s blood pressure is still not at goal. This, along with her history of atrial fibrillation and high pulse, prompts you to consider another option.
Bupropion/Naltrexone
Bupropion, a widely used antidepressant, inhibits the uptake of norepinephrine and dopamine and thereby blocks the reward pathway that various foods can induce. Naltrexone, an opioid antagonist, blocks the opioid pathway and can be helpful in enhancing weight loss.
This combination comes in an 8/90-mg tablet. The suggested titration regimen is to start with one tablet per day and increase by one tablet every week, up to the maximum dosage of two tablets twice a day. Average weight loss was 3.1% greater than placebo at one year with the maximum dosage. An A1C reduction of 0.6% was seen in diabetic patients.6 It is recommended to stop the medication and seek an alternative treatment option if > 5% loss of body weight is not achieved by 12 weeks.
GI adverse effects (eg, nausea and vomiting) are common; these can be reduced with a slower titration regimen or by prescribing a maximum of one tablet twice daily (instead of two). Every antidepressant carries suicidal risk, and caution is advised with their use. Bupropion can also lower the seizure threshold, and it is contraindicated for patients with seizure disorder. It is also contraindicated in patients who are undergoing abrupt cessation of alcohol, benzodiazepines, or barbiturates. It can increase pulse and blood pressure during early titration; regular blood pressure monitoring is warranted.
CASE POINT Due to Deb’s opioid usage and uncontrolled hypertension, you discuss a final option that was recently approved for weight loss.
Liraglutide
This glucagon-like peptide-1 (GLP1) receptor agonist affects the brain to suppress/control appetite, slows down gastric emptying, and induces early satiety. A 3-mg dosage was approved in December 2014, but 0.6-, 1.2-, and 1.8-mg dosages have been available since 2010 for patients with type 2 diabetes.
Average weight loss was 4.5% greater than placebo at one year.7 If < 4% weight loss is achieved by 16 weeks, consider using an alternative agent.
The most common adverse effect is GI upset, which could be related to the mechanism of action (slower gastric emptying). Although self-reported GI upset was high (39%), the actual discontinuation rate was low (2.9% for nausea, 1.7% for vomiting, and 1.4% for diarrhea).3
This adverse effect could, in certain contexts, be considered “wanted,” since it discourages overeating or eating too quickly. My clinical pearl is to tell patients taking liraglutide that they are “trapped” and have to eat smaller portions and eat more slowly or they will be more prone to GI effects. With this strategy, we can encourage portion control and responsibility for behavior. (Please note that this is my experience with the diabetic dosage of liraglutide; I do not have any clinical experience with the obesity dosage, which was not clinically available at the time of writing.)
Both branded versions of liraglutide carry a black-box warning for thyroid C-cell tumors, which were observed in rodents but unproven in humans. The medication is contraindicated in patients with medullary thyroid cancer or with multiple endocrine neoplasia 2 syndrome. Increased rates of acute pancreatitis, cholecystitis, and cholelithiasis were seen in studies, and caution is advised.
Continue for A Word About Meds That Cause Weight Gain >>
A WORD ABOUT MEDS THAT CAUSE WEIGHT GAIN
The Endocrine Society has published a list of medications that can influence weight gain, along with suggestions for alternative agents that are either weight neutral or promote weight loss.
Note that our case patient, Deb, is taking insulin, a sulfonylurea (glyburide), and thiazolidinedione (pioglitazone) for diabetes—all of which can promote weight gain. Guidelines suggest choosing metformin, DPP4 inhibitors, GLP1 agonists, amylin analog, and SGLT2 inhibitors instead when weight gain is a major concern.1
Guidelines also suggest using ACE inhibitors, angiotensin receptor blockers, and calcium channel blockers instead of β-blockers as firstline antihypertensive therapy for diabetic patients.1 Adequate blood pressure and lipid control are imperative in diabetes management.
CASE POINT Deb would need better hypertension control before she considers weight-loss medication. Since she is also taking paroxetine, which among SSRIs is associated with greatest weight gain, a changed to fluoxetine or sertraline should be considered.2
Next page: Conclusion >>
CONCLUSION
There are now five medications approved by the FDA for chronic weight loss, with more to come. Agents with different mechanisms of action give us options to help obese patients and hopefully reduce and prevent obesity-related complications. It is important for clinicians to be competent in managing obesity, especially since we live in an era in which the disease is considered pandemic.
REFERENCES
1. Apovian CM, Aronne LJ, Bessesen DH, et al; Endocrine Society. Pharmacological management of obesity: an Endocrine Society clinical practice guideline. J Clin Endocrinol Metab. 2015;100(2):342-362.
2. Xenical [package insert]. South San Francisco, CA: Genentech USA, Inc; 2012.
3. Fujioka K. Safety and tolerability of medications approved for chronic weight management. Obesity (Silver Spring). 2015;22 (suppl 1):S7-S11.
4. Belviq [package insert]. Woodcliff Lake, NJ: Eisai Inc; 2015.
5. Qsymia [package insert]. Mountain View, CA: Vivus, Inc; 2013.
6. Contrave [package insert]. Deerfield, IL: Takeda USA, Inc; 2014.
7. Saxenda [package insert]. Plainsboro, NJ: Novo Nordisk; 2014.