User login
CUDC-907 passes early hurdle in heavily pretreated lymphoma, myeloma
VIENNA – The investigational dual HDAC and Pi3K inhibitor CUDC-907 was reasonably tolerated and clinically active in a phase I study of relapsed or refractory lymphomas and multiple myeloma.
Among 44 patients evaluable for response, 7 had objective responses (16%).
Two complete and four partial responses occurred in 10 evaluable patients with diffuse large B-cell lymphoma (DLBCL).
One partial response was reported in 12 evaluable patients with Hodgkin lymphoma.
Stable disease was the best response in 4 of 6 evaluable patients with multiple myeloma and 11 of 16 patients with other lymphomas, Dr. Yasuhiro Oki reported at the annual congress of the European Hematology Association.
The first-in-human trial enrolled 57 patients with lymphoma (DLBCL, Hodgkin, Burkitt, follicular, gray zone, lymphoplasmacytic, mantle cell, marginal zone, and small lymphocytic) or multiple myeloma that was refractory to or relapsed after at least two prior regimens.
The median number of prior regimens was 5 (range 2-10), including prior histone deacetylase (HDAC) inhibitors in 11% and prior phosphatidylinositol 3-kinase (Pi3K) inhibitors in 9%.
The 3+3 design tested three different once-daily dosing schedules for the oral small molecule: 30 mg and 60 mg, 5 days on and 2 days off (5/2) 60 mg, and intermittent twice- or thrice-weekly at 60 mg, 90 mg, 120 mg, and 150 mg. The safety and efficacy data are from the completed dose escalation and ongoing expansion stages of the phase I trial with CUDC-907 administered as monotherapy.
Median treatment duration in the DLBCL group was 3 months, with treatment ongoing in some patients beyond 2 years. Long-term responders have included three patients with transformed follicular lymphoma (t-FL)/DLBCL, one with so-called triple-hit status involving translocations/rearrangements of MYC, BCL-2, and BCL-6 genes, according to Dr. Oki of University of Texas MD Anderson Cancer Center in Houston.
The patient with Hodgkin lymphoma who responded had failed four prior therapies, but experienced a 42% reduction in tumor size on imaging by cycle two and a partial response to 60 mg 5/2 CUDC-907 by cycle six.
At least one adverse event (AE) occurred in 50 of the 57 patients, but AEs have been reversible with standard interventions, dose holds, or dose reductions, he added.
The most common grade 3/4 AEs reported in two or more patients were diarrhea, hyperglycemia, fatigue, thrombocytopenia, and decreased neutrophils.
Four dose-limiting toxicities occurred in three patients: grade 3 diarrhea in the 60-mg once-daily and 150-mg thrice-weekly dose groups and grade 4 hyperglycemia in the 60-mg once-daily and 150-mg twice-weekly dose groups.
“The 5/2 60-mg and thrice-weekly 120-mg dosing was found to be reasonably tolerated while still achieving objective responses,” Dr. Oki noted in the poster.
The ongoing expansion phase is evaluating CUDC-907 at the recommended phase II doses of 60 mg 5/2 and 120 mg thrice-weekly in patients with relapsed refractory DLBCL, Hodgkin lymphoma, and multiple myeloma.
The trial is currently enrolling patients with DLBCL for treatment with CUDC-907 monotherapy and in combination with standard-dose rituximab.
Phase II testing of CUDC-907 in combination with rituximab in relapsed/refractory DLBCL is projected to start at the earliest in fourth-quarter 2015, according to the authors.
CUDC-907 (60 mg 5/2 and 120 mg three times weekly) is also being evaluated in advanced or relapsed solid tumors in an ongoing phase I trial.
On Twitter@pwendl
AT EHA CONGRESS
Key clinical point: The dual HDAC and Pi3K inhibitor CUDC-907 was reasonably tolerated and clinically active in a phase I study of heavily pretreated lymphoma and myeloma.
Major finding: Objective responses occurred in 16% of 44 evaluable patients.
Data source: A phase I study in relapsed or refractory lymphoma or multiple myeloma.
Disclosures: Curis funded the study, with financial support from the Leukemia & Lymphoma Society. Dr. Oki reported having no financial conflicts; four coauthors are employees of Curis.
Progressive Cribriform and Zosteriform Hyperpigmentation
To the Editor:
Progressive cribriform and zosteriform hyperpigmentation (PCZH) was first described by Rower et al1 in 1978. The diagnostic criteria included the following: (1) uniformly tan cribriform macular pigmentation in a zosteriform distribution; (2) a histologic pattern that consisted of a mild increase in melanin pigment in the basal cell layer and complete absence of nevus cells; (3) no history of rash, injury, or inflammation to suggest postinflammatory hyperpigmentation; (4) onset occurring well after birth with gradual extension; and (5) lack of other associated cutaneous or internal abnormalities.1
Many pigmentary disorders occurring along the Blaschko lines are included in differential diagnosis of PCZH such as incontinentia pigmenti (IP), progressive zosteriform macular pigmented lesion (PZMPL), and linear and whorled nevoid hypermelanosis (LWNH). However, PCZH is considered to be the localized variant (the late onset) of LWNH.2 We report a case of PCZH, a segmented and delayed form of LWNH.
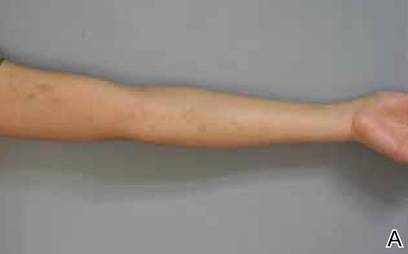
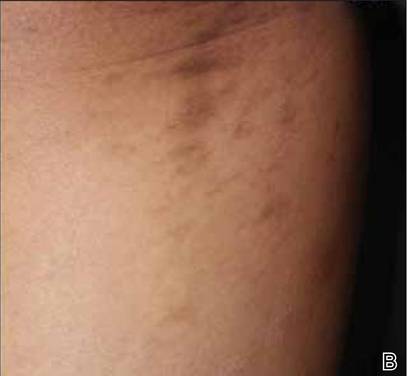
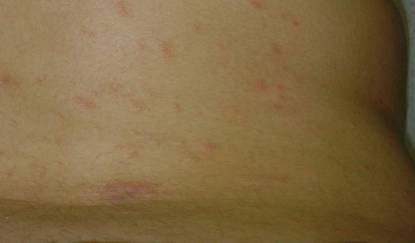
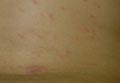
A 25-year-old woman presented with asymptomatic progressive multiple brownish macular eruptions arranged in a zosteriform pattern on the left arm and thigh of 3 months’ duration. There was no history of injury or any prior cutaneous changes. There was no personal or family history of similar eruptions and she was otherwise in good health. She was not taking any medications. Physical examination showed linear, uniformly tanned, cribriform hyperpigmentation along the Blaschko lines on the left arm and thigh (Figure 1). Routine laboratory tests, including complete blood cell count with differential, were normal. Assuming a diagnosis of PCZH or PZMPL, we performed a punch biopsy on the left upper arm. The histopathologic findings showed increased pigmentation of the basal layer. There were a few dermal melanophages and no nevus cells present (Figure 2A). Fontana-Masson stain showed an increase in melanin in the basal layer (Figure 2B). On the basis of these clinical and histological findings, a diagnosis of PCZH was made. She was observed without treatment for 6 months showing no change.
|
|
Progressive cribriform and zosteriform hyperpigmentation is a disorder of pigmentation along the Blaschko lines. The trunk is the most common site of involvement.3 In the differential diagnosis, other pigmentary disorders along the Blaschko lines must be excluded, including the pigmentary stage of IP, PZMPL, and LWNH. In IP, characteristic inflammatory vesicular and verrucous stages usually precede the whorled pigmentation.4 In approximately 80% of cases, IP is associated with various congenital abnormalities, particularly of the central nervous system, eyes, and teeth.5 Progressive zosteriform macular pigmented lesion is a chronic pigmentary dermatosis similar to PCZH but is characteristically accompanied by pruritus as a prodromal symptom. It is usually preceded by multiple pruritic macular pigmentation in part of the dermatome for a period of time. Then the size and number of the pigmented macules abruptly increases and coalesces into patches.6 Linear and whorled nevoid hypermelanosis was first described by Kalter et al7 in 1988. It is characterized by swirls and whorls of hyperpigmented macules without preceding bullae or verrucae along Blaschko lines, usually occurring within the first 2 years of life. The lesions are stable in some patients but can spread in others, stabilizing by 2 to 3 years of age.7-10 It has been referred to as zosteriform lentiginous nevus, zebralike hyperpigmentation, and reticulate hyperpigmentation distributed in a zosteriform fashion.2,9
Linear and whorled nevoid hypermelanosis can be distinguished from PCZH by a diffuse or localized pattern and an association of congenital anomalies.3 However, neurologic and skeletal anomalies also can be observed in PCZH.11 Additionally, not all LWNH cases show a diffuse type.2 Therefore, LWNH has been used to encompass a wide spectrum of clinical entities, ranging from the congenital or perinatal form described by Kalter et al7 to the segmented and delayed form described by Rower et al1 for which there is a tendency to use the term progressive cribriform and zosteriform hyperpigmentation.2,10,11 There are no clinical and histologic differences between PCZH and LWNH, other than a later onset.2 Although some authors reported that PCZH and LWNH have increased hyperpigmentation of the basal layer and prominent melanocytes without incontinence of pigment on histopathology,2,7,8 other reports have demonstrated that both could show pigment incontinence,3,10,12-14 such as in our case.
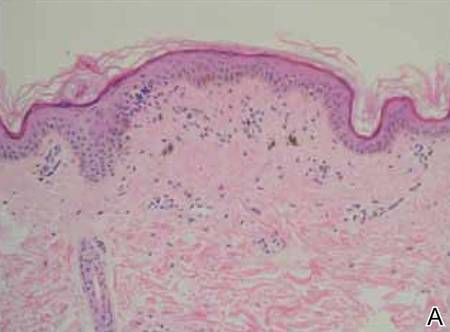
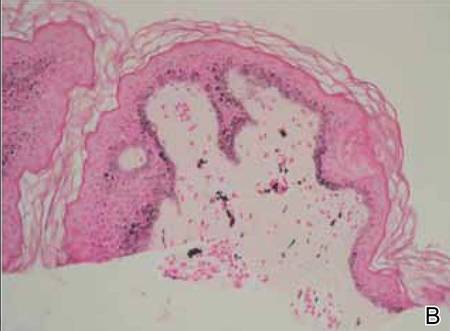
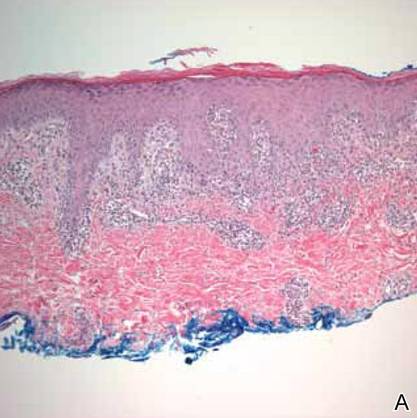
Figure 2. Histopathologic findings showed increased pigmentation of the basal layer with a few dermal melanophages. No nevus cells were present (A)(H&E, original magnification ×100). Fontana-Masson stain showed an increase in melanin in the basal layer (B)(original magnification ×100). |
Progressive cribriform and zosteriform hyperpigmentation is considered to be the localized variant as well as the late onset of LWNH.2 We report a case of PCZH, a segmented and delayed form of LWNH without systemic abnormalities.
1. Rower JM, Carr RD, Lowney ED. Progressive cribriform and zosteriform hyperpigmentation. Arch Dermatol. 1978;114:98-99.
2. Di Lernia V. Linear and whorled hypermelanosis. Pediatr Dermatol. 2007;24:205-210.
3. Cho E, Cho SH, Lee JD. Progressive cribriform and zosteriform hyperpigmentation: a clinicopathologic study. Int J Dermatol. 2012;51:399-405.
4. Hong SP, Ahn SY, Lee WS. Linear and whorled nevoid hypermelanosis: unique clinical presentations and their possible association with chromosomal abnormality inv(9). Arch Dermatol. 2008;144:415-416.
5. Carney RG. Incontinentia pigmenti: a world statistical analysis. Arch Dermatol. 1976;112:535-542.
6. Hong JW, Lee KY, Jeon SY, et al. Progressive zosteriform macular pigmented lesion. Korean J Dermatol. 2011;49:621-624
7. Kalter DC, Griffiths WA, Atherton AJ. Linear and whorled nevoid hypermelanosis. J Am Acad Dermatol. 1988;19:1037-1044.
8. Ertam I, Turk BG, Urkmez A, et al. Linear and whorled nevoid hypermelanosis: dermatoscopic features. J Am Acad Dermatol. 2009;60:328-331.
9. Mehta V, Vasanth V, Balachandran C, et al. Linear and whorled nevoid hypermelanosis. Int J Dermatol. 2011;50:491-492.
10. Choi JC, Yang JH, Lee UH, et al. Progressive cribriform and zosteriform hyperpigmentation—the late onset linear and whorled nevoid hypermelanosis. J Eur Acad Dermatol Venereol. 2005;19:638-639.
11. Schepis C, Alberti A, Siragusa M, et al. Progressive cribriform and zosteriform hyperpigmentation: the late onset feature of linear and whorled nevoid hypermelanosis associated with congenital neurological, skeletal and cutaneous anomalies. Dermatology. 1999;199:72-73.
12. Kovarik CL, Spielvogel RL, Kantor GR. Pigmentary disorders of the skin. In: Elder DE, Elenitsas R, Murphy GF, et al, eds. Lever’s Histopathology of the Skin. 10th ed. Philadelphia, PA: Lippincott Williams & Wilkins; 2009:690.
13. Kim SJ, Kim MB, Oh CK, et al. Three cases of progressive cribriform and zosteriform hyperpigmentation. Korean J Dermatol. 2002;40:181-186.
14. Cho SH, Ha JH, Choi HC, et al. A case of atypical progressive cribriform and zosteriform hyperpigmentation. Korean J Dermatol. 2003;41:792-795.
To the Editor:
Progressive cribriform and zosteriform hyperpigmentation (PCZH) was first described by Rower et al1 in 1978. The diagnostic criteria included the following: (1) uniformly tan cribriform macular pigmentation in a zosteriform distribution; (2) a histologic pattern that consisted of a mild increase in melanin pigment in the basal cell layer and complete absence of nevus cells; (3) no history of rash, injury, or inflammation to suggest postinflammatory hyperpigmentation; (4) onset occurring well after birth with gradual extension; and (5) lack of other associated cutaneous or internal abnormalities.1
Many pigmentary disorders occurring along the Blaschko lines are included in differential diagnosis of PCZH such as incontinentia pigmenti (IP), progressive zosteriform macular pigmented lesion (PZMPL), and linear and whorled nevoid hypermelanosis (LWNH). However, PCZH is considered to be the localized variant (the late onset) of LWNH.2 We report a case of PCZH, a segmented and delayed form of LWNH.
A 25-year-old woman presented with asymptomatic progressive multiple brownish macular eruptions arranged in a zosteriform pattern on the left arm and thigh of 3 months’ duration. There was no history of injury or any prior cutaneous changes. There was no personal or family history of similar eruptions and she was otherwise in good health. She was not taking any medications. Physical examination showed linear, uniformly tanned, cribriform hyperpigmentation along the Blaschko lines on the left arm and thigh (Figure 1). Routine laboratory tests, including complete blood cell count with differential, were normal. Assuming a diagnosis of PCZH or PZMPL, we performed a punch biopsy on the left upper arm. The histopathologic findings showed increased pigmentation of the basal layer. There were a few dermal melanophages and no nevus cells present (Figure 2A). Fontana-Masson stain showed an increase in melanin in the basal layer (Figure 2B). On the basis of these clinical and histological findings, a diagnosis of PCZH was made. She was observed without treatment for 6 months showing no change.
|
|
|
|
Progressive cribriform and zosteriform hyperpigmentation is a disorder of pigmentation along the Blaschko lines. The trunk is the most common site of involvement.3 In the differential diagnosis, other pigmentary disorders along the Blaschko lines must be excluded, including the pigmentary stage of IP, PZMPL, and LWNH. In IP, characteristic inflammatory vesicular and verrucous stages usually precede the whorled pigmentation.4 In approximately 80% of cases, IP is associated with various congenital abnormalities, particularly of the central nervous system, eyes, and teeth.5 Progressive zosteriform macular pigmented lesion is a chronic pigmentary dermatosis similar to PCZH but is characteristically accompanied by pruritus as a prodromal symptom. It is usually preceded by multiple pruritic macular pigmentation in part of the dermatome for a period of time. Then the size and number of the pigmented macules abruptly increases and coalesces into patches.6 Linear and whorled nevoid hypermelanosis was first described by Kalter et al7 in 1988. It is characterized by swirls and whorls of hyperpigmented macules without preceding bullae or verrucae along Blaschko lines, usually occurring within the first 2 years of life. The lesions are stable in some patients but can spread in others, stabilizing by 2 to 3 years of age.7-10 It has been referred to as zosteriform lentiginous nevus, zebralike hyperpigmentation, and reticulate hyperpigmentation distributed in a zosteriform fashion.2,9
Linear and whorled nevoid hypermelanosis can be distinguished from PCZH by a diffuse or localized pattern and an association of congenital anomalies.3 However, neurologic and skeletal anomalies also can be observed in PCZH.11 Additionally, not all LWNH cases show a diffuse type.2 Therefore, LWNH has been used to encompass a wide spectrum of clinical entities, ranging from the congenital or perinatal form described by Kalter et al7 to the segmented and delayed form described by Rower et al1 for which there is a tendency to use the term progressive cribriform and zosteriform hyperpigmentation.2,10,11 There are no clinical and histologic differences between PCZH and LWNH, other than a later onset.2 Although some authors reported that PCZH and LWNH have increased hyperpigmentation of the basal layer and prominent melanocytes without incontinence of pigment on histopathology,2,7,8 other reports have demonstrated that both could show pigment incontinence,3,10,12-14 such as in our case.
Figure 2. Histopathologic findings showed increased pigmentation of the basal layer with a few dermal melanophages. No nevus cells were present (A)(H&E, original magnification ×100). Fontana-Masson stain showed an increase in melanin in the basal layer (B)(original magnification ×100). |
Progressive cribriform and zosteriform hyperpigmentation is considered to be the localized variant as well as the late onset of LWNH.2 We report a case of PCZH, a segmented and delayed form of LWNH without systemic abnormalities.
1. Rower JM, Carr RD, Lowney ED. Progressive cribriform and zosteriform hyperpigmentation. Arch Dermatol. 1978;114:98-99.
2. Di Lernia V. Linear and whorled hypermelanosis. Pediatr Dermatol. 2007;24:205-210.
3. Cho E, Cho SH, Lee JD. Progressive cribriform and zosteriform hyperpigmentation: a clinicopathologic study. Int J Dermatol. 2012;51:399-405.
4. Hong SP, Ahn SY, Lee WS. Linear and whorled nevoid hypermelanosis: unique clinical presentations and their possible association with chromosomal abnormality inv(9). Arch Dermatol. 2008;144:415-416.
5. Carney RG. Incontinentia pigmenti: a world statistical analysis. Arch Dermatol. 1976;112:535-542.
6. Hong JW, Lee KY, Jeon SY, et al. Progressive zosteriform macular pigmented lesion. Korean J Dermatol. 2011;49:621-624
7. Kalter DC, Griffiths WA, Atherton AJ. Linear and whorled nevoid hypermelanosis. J Am Acad Dermatol. 1988;19:1037-1044.
8. Ertam I, Turk BG, Urkmez A, et al. Linear and whorled nevoid hypermelanosis: dermatoscopic features. J Am Acad Dermatol. 2009;60:328-331.
9. Mehta V, Vasanth V, Balachandran C, et al. Linear and whorled nevoid hypermelanosis. Int J Dermatol. 2011;50:491-492.
10. Choi JC, Yang JH, Lee UH, et al. Progressive cribriform and zosteriform hyperpigmentation—the late onset linear and whorled nevoid hypermelanosis. J Eur Acad Dermatol Venereol. 2005;19:638-639.
11. Schepis C, Alberti A, Siragusa M, et al. Progressive cribriform and zosteriform hyperpigmentation: the late onset feature of linear and whorled nevoid hypermelanosis associated with congenital neurological, skeletal and cutaneous anomalies. Dermatology. 1999;199:72-73.
12. Kovarik CL, Spielvogel RL, Kantor GR. Pigmentary disorders of the skin. In: Elder DE, Elenitsas R, Murphy GF, et al, eds. Lever’s Histopathology of the Skin. 10th ed. Philadelphia, PA: Lippincott Williams & Wilkins; 2009:690.
13. Kim SJ, Kim MB, Oh CK, et al. Three cases of progressive cribriform and zosteriform hyperpigmentation. Korean J Dermatol. 2002;40:181-186.
14. Cho SH, Ha JH, Choi HC, et al. A case of atypical progressive cribriform and zosteriform hyperpigmentation. Korean J Dermatol. 2003;41:792-795.

Levonorgestrel-Releasing Intrauterine System Causes a Lichenoid Drug Eruption
To the Editor:
Numerous drugs have been implicated as possible causes of lichenoid drug eruptions (LDEs). We describe a case of an LDE secondary to placement of a levonorgestrel-releasing intrauterine system (IUS).
A 28-year-old woman presented with an extensive pruritic rash of 2 months’ duration. She reported that it began on the wrists; progressed inward to involve the trunk; and then became generalized over the trunk, back, wrists, and legs. A levonorgestrel-releasing IUS had been placed 6 weeks prior to the onset of the rash. She was otherwise healthy and took loratadine and pseudoephedrine on occasion for environmental allergies. On examination there were violaceous, lichenified, flat-topped, polygonal papules scattered over the arms, legs, and trunk (Figure 1). Some papules demonstrated a Köbner phenomenon. No Wickham striae or mucosal involvement was noted. Rapid plasma reagin and hepatitis panel were negative. The patient was treated empirically with fluocinonide ointment 0.05% twice daily.
|

A shave biopsy was taken at the initial visit prior to steroid treatment. Histology revealed a classic lichenoid reaction pattern (Figure 2) and irregular acanthosis lying above the dense bandlike infiltrate of lymphocytes with liquefaction degeneration of the basal layer, rare Civatte bodies in the epidermis, and melanophages in the dermis.
At 5-week follow-up, the patient showed some improvement but not complete control of the lesions with topical steroids. Because the patient was on no other regular medications, we recommended a 3-month trial removal of the IUS. The patient decided to have the IUS removed and noted complete clearance of the skin lesions within 1 month. Challenge with oral or intradermal levonorgestrel was not conducted after clearance of the rash, which is a weakness in this report. Accordingly, the possibility that this patient’s condition was caused by idiopathic lichen planus, which may resolve spontaneously, cannot be ruled out. However, because the patient noted substantial improvement following removal of the device and remained symptom free 2 years after removal, we concluded that the cutaneous lesions were secondary to an LDE in response to the IUS.
It should be noted that as-needed use of pseudoephedrine and loratadine continued during this 2-year follow-up period and again the patient experienced no return of symptoms, which is particularly important because both of these agents have been associated with drug eruption patterns akin to lichenoid tissue reaction/interface dermatitis patterns. Pseudoephedrine is particularly notorious for causing nonpigmenting fixed drug eruptions such as those that heal without hyperpigmentation, while antihistamines such as loratadine have been associated with lichenoid and subacute lupus erythematosus–pattern drug reactions.1,2
Lichenoid drug reactions fall into the category of lymphocyte-rich lichenoid tissue reaction/interface dermatitis skin disorders.3 There are currently 202 different drugs reported to cause lichen planus or lichenoid eruptions as collected in Litt’s Drug Eruption & Reaction Database.4 Some of the more common causes of an LDE include angiotensin-converting enzyme inhibitors, antimalarials, calcium channel blockers, gold salts, and nonsteroidal anti-inflammatory drugs.3,4 Lichenoid eruptions typically are attributed to oral hormonal contraceptives only.5,6 An eruption in response to intrauterine levonorgestrel treatment is rare. One case report of a lichenoid eruption in response to a copper IUS was hypothesized to be due to presence of nickel salts as a manufacturing contaminant; however, the manufacturer denied the presence of the contaminant.7
The manufacturer’s information for health care professionals prescribing levonorgestrel-releasing IUS describes rashes as an adverse reaction present in less than 5% of individuals.8 Levonorgestrel-releasing IUS consists of a polyethylene frame compounded with barium sulfate, 52 mg of levonorgestrel, silicone (polydimethylsiloxane), and a monofilament brown polyethylene removal thread. The device initially releases 20 μg levonorgestrel daily, with a stable levonorgestrel plasma level of 150 to 200 pg/mL reached after the first few weeks following insertion of the device.8 Levonorgestrel is an agonist at the progesterone and androgen receptors.9 In clinical trials, levonorgestrel was implicated as the cause of increased acne, hair loss, and hirsutism as cutaneous side effects from use of levonorgestrel implants.10 However, to our knowledge, none of the other components of the levonorgestrel-releasing IUS have previously been reported to cause lichen planus or LDE.
The levonorgestrel-releasing IUS has been implicated as the cause of biopsy-proven Sweet disease,11 exacerbation of preexisting seborrheic dermatitis,12 rosacea,13 and autoimmune progesterone dermatitis.14 The skin findings in these cases resolved after removal of the IUS and appropriate treatment.
Identification of the causative drug can be difficult in LDE, as timing of the eruption can vary. The latent period has been reported to range from a few months to 1 to 2 years.15 Additionally, the clinical picture is often complicated in patients with a history of different drug dosages or multiple medications. When present, the histologic features of parakeratosis and eosinophils can be clues that a lichen planus–like eruption is drug related rather than idiopathic. However, the absence of these features does not rule out a medication or environmental trigger. In this case, the time-event relationship likely indicates that the eruption was related to the levonorgestrel-releasing IUS and not triggered by other medications or not idiopathic in nature. Lichenoid drug eruptions can resolve within a few weeks or up to 2 years after drug cessation and can occasionally be complicated by partial or complete resolution and recurrence even when the drug has not been discontinued.16,17 Lichenoid drug eruptions or idiopathic lichen planus generally are treated with topical immunomodulators or corticosteroids.3
Based on the time-event relationship, morphology, distribution, and histopathologic findings, we conclude that our patient developed LDE in response to the placement of a levonorgestrel-releasing IUS. Clinicians should be aware of the possibility of LDE occurring as a rare adverse effect of these devices.
1. Shelley WB, Shelley ED. Nonpigmenting fixed drug eruption as a distinctive reaction pattern: examples caused by sensitivity to pseudoephedrine hydrochloride and tetrahydrozoline. J Am Acad Dermatol. 1987;17:403-407.
2. Crowson AN, Magro CM. Lichenoid and subacute cutaneous lupus erythematosus-like dermatitis associated with antihistamine therapy. J Cutan Pathol. 1999;26:95-99.
3. Sontheimer RD. Lichenoid tissue reaction/interface dermatitis: clinical and histological perspectives [published online ahead of print February 26, 2009]. J Invest Dermatol. 2009;129:1088-1099.
4. Litt’s Drug Eruption & Reaction Database. Boca Raton, FL: Taylor & Francis Group; 2015. http://www.drugeruptiondata.com/searchresults/index/reaction_type/id/1/char/L. Accessed June 11, 2015.
5. Coskey RJ. Eruptions due to oral contraceptives. Arch Dermatol. 1977;113:333-334.
6. Thomas P, Dalle E, Revillon B, et al. Cutaneous effects in hormonal contraception [in French]. NPN Med. 1985;5:19-24.
7. Lombardi P, Campolmi P, Sertoli A. Lichenoid dermatitis caused by nickel salts? Contact Dermatitis. 1983;9:520-521.
8. Mirena [package insert]. Whippany, NJ: Bayer HealthCare Pharmaceuticals Inc; 2014.
9. Lemus AE, Vilchis F, Damsky R, et al. Mechanism of action of levonorgestrel: in vitro metabolism and specific interactions with steroid receptors in target organs. J Steroid Biochem Mol Biol. 1992;41:881-890.
10. Brache V, Faundes A, Alvarex F, et al. Nonmenstrual adverse events during use of implantable contraceptives for women: data from clinical trials. Contraception. 2002;65:63-74.
11. Hamill M, Bowling J, Vega-Lopez F. Sweet’s syndrome and a Mirena intrauterine system. J Fam Plann Reprod Health Care. 2004;30:115-116.
12. Karri K, Mowbray D, Adams S, et al. Severe seborrhoeic dermatitis: side-effect of the Mirena intra-uterine system. Eur J Contracept Reprod Health Care. 2006;11:53-54.
13. Choudry K, Humphreys F, Menage J. Rosacea in association with the progesterone-releasing intrauterine contraceptive device. Clin Exp Dermatol. 2001;26:102.
14. Pereira A, Coker A. Hypersensitivity to Mirena—a rare complication. J Obstet Gynaecol. 2003;23:81.
15. Halevy S, Shai A. Lichenoid drug eruptions. J Am Acad Dermatol. 1993;29(2, pt 1):249-255.
16. Seehafer JR, Rogers RS 3rd, Fleming CR, et al. Lichen planus-like lesions caused by penicillamine in primary biliary cirrhosis. Arch Dermatol. 1981;117:140-142.
17. Anderson TE. Lichen planus following quinidine therapy. Br J Dermatol. 1967;79:500.
To the Editor:
Numerous drugs have been implicated as possible causes of lichenoid drug eruptions (LDEs). We describe a case of an LDE secondary to placement of a levonorgestrel-releasing intrauterine system (IUS).
A 28-year-old woman presented with an extensive pruritic rash of 2 months’ duration. She reported that it began on the wrists; progressed inward to involve the trunk; and then became generalized over the trunk, back, wrists, and legs. A levonorgestrel-releasing IUS had been placed 6 weeks prior to the onset of the rash. She was otherwise healthy and took loratadine and pseudoephedrine on occasion for environmental allergies. On examination there were violaceous, lichenified, flat-topped, polygonal papules scattered over the arms, legs, and trunk (Figure 1). Some papules demonstrated a Köbner phenomenon. No Wickham striae or mucosal involvement was noted. Rapid plasma reagin and hepatitis panel were negative. The patient was treated empirically with fluocinonide ointment 0.05% twice daily.
|
|
A shave biopsy was taken at the initial visit prior to steroid treatment. Histology revealed a classic lichenoid reaction pattern (Figure 2) and irregular acanthosis lying above the dense bandlike infiltrate of lymphocytes with liquefaction degeneration of the basal layer, rare Civatte bodies in the epidermis, and melanophages in the dermis.
At 5-week follow-up, the patient showed some improvement but not complete control of the lesions with topical steroids. Because the patient was on no other regular medications, we recommended a 3-month trial removal of the IUS. The patient decided to have the IUS removed and noted complete clearance of the skin lesions within 1 month. Challenge with oral or intradermal levonorgestrel was not conducted after clearance of the rash, which is a weakness in this report. Accordingly, the possibility that this patient’s condition was caused by idiopathic lichen planus, which may resolve spontaneously, cannot be ruled out. However, because the patient noted substantial improvement following removal of the device and remained symptom free 2 years after removal, we concluded that the cutaneous lesions were secondary to an LDE in response to the IUS.
It should be noted that as-needed use of pseudoephedrine and loratadine continued during this 2-year follow-up period and again the patient experienced no return of symptoms, which is particularly important because both of these agents have been associated with drug eruption patterns akin to lichenoid tissue reaction/interface dermatitis patterns. Pseudoephedrine is particularly notorious for causing nonpigmenting fixed drug eruptions such as those that heal without hyperpigmentation, while antihistamines such as loratadine have been associated with lichenoid and subacute lupus erythematosus–pattern drug reactions.1,2
Lichenoid drug reactions fall into the category of lymphocyte-rich lichenoid tissue reaction/interface dermatitis skin disorders.3 There are currently 202 different drugs reported to cause lichen planus or lichenoid eruptions as collected in Litt’s Drug Eruption & Reaction Database.4 Some of the more common causes of an LDE include angiotensin-converting enzyme inhibitors, antimalarials, calcium channel blockers, gold salts, and nonsteroidal anti-inflammatory drugs.3,4 Lichenoid eruptions typically are attributed to oral hormonal contraceptives only.5,6 An eruption in response to intrauterine levonorgestrel treatment is rare. One case report of a lichenoid eruption in response to a copper IUS was hypothesized to be due to presence of nickel salts as a manufacturing contaminant; however, the manufacturer denied the presence of the contaminant.7
The manufacturer’s information for health care professionals prescribing levonorgestrel-releasing IUS describes rashes as an adverse reaction present in less than 5% of individuals.8 Levonorgestrel-releasing IUS consists of a polyethylene frame compounded with barium sulfate, 52 mg of levonorgestrel, silicone (polydimethylsiloxane), and a monofilament brown polyethylene removal thread. The device initially releases 20 μg levonorgestrel daily, with a stable levonorgestrel plasma level of 150 to 200 pg/mL reached after the first few weeks following insertion of the device.8 Levonorgestrel is an agonist at the progesterone and androgen receptors.9 In clinical trials, levonorgestrel was implicated as the cause of increased acne, hair loss, and hirsutism as cutaneous side effects from use of levonorgestrel implants.10 However, to our knowledge, none of the other components of the levonorgestrel-releasing IUS have previously been reported to cause lichen planus or LDE.
The levonorgestrel-releasing IUS has been implicated as the cause of biopsy-proven Sweet disease,11 exacerbation of preexisting seborrheic dermatitis,12 rosacea,13 and autoimmune progesterone dermatitis.14 The skin findings in these cases resolved after removal of the IUS and appropriate treatment.
Identification of the causative drug can be difficult in LDE, as timing of the eruption can vary. The latent period has been reported to range from a few months to 1 to 2 years.15 Additionally, the clinical picture is often complicated in patients with a history of different drug dosages or multiple medications. When present, the histologic features of parakeratosis and eosinophils can be clues that a lichen planus–like eruption is drug related rather than idiopathic. However, the absence of these features does not rule out a medication or environmental trigger. In this case, the time-event relationship likely indicates that the eruption was related to the levonorgestrel-releasing IUS and not triggered by other medications or not idiopathic in nature. Lichenoid drug eruptions can resolve within a few weeks or up to 2 years after drug cessation and can occasionally be complicated by partial or complete resolution and recurrence even when the drug has not been discontinued.16,17 Lichenoid drug eruptions or idiopathic lichen planus generally are treated with topical immunomodulators or corticosteroids.3
Based on the time-event relationship, morphology, distribution, and histopathologic findings, we conclude that our patient developed LDE in response to the placement of a levonorgestrel-releasing IUS. Clinicians should be aware of the possibility of LDE occurring as a rare adverse effect of these devices.
1. Shelley WB, Shelley ED. Nonpigmenting fixed drug eruption as a distinctive reaction pattern: examples caused by sensitivity to pseudoephedrine hydrochloride and tetrahydrozoline. J Am Acad Dermatol. 1987;17:403-407.
2. Crowson AN, Magro CM. Lichenoid and subacute cutaneous lupus erythematosus-like dermatitis associated with antihistamine therapy. J Cutan Pathol. 1999;26:95-99.
3. Sontheimer RD. Lichenoid tissue reaction/interface dermatitis: clinical and histological perspectives [published online ahead of print February 26, 2009]. J Invest Dermatol. 2009;129:1088-1099.
4. Litt’s Drug Eruption & Reaction Database. Boca Raton, FL: Taylor & Francis Group; 2015. http://www.drugeruptiondata.com/searchresults/index/reaction_type/id/1/char/L. Accessed June 11, 2015.
5. Coskey RJ. Eruptions due to oral contraceptives. Arch Dermatol. 1977;113:333-334.
6. Thomas P, Dalle E, Revillon B, et al. Cutaneous effects in hormonal contraception [in French]. NPN Med. 1985;5:19-24.
7. Lombardi P, Campolmi P, Sertoli A. Lichenoid dermatitis caused by nickel salts? Contact Dermatitis. 1983;9:520-521.
8. Mirena [package insert]. Whippany, NJ: Bayer HealthCare Pharmaceuticals Inc; 2014.
9. Lemus AE, Vilchis F, Damsky R, et al. Mechanism of action of levonorgestrel: in vitro metabolism and specific interactions with steroid receptors in target organs. J Steroid Biochem Mol Biol. 1992;41:881-890.
10. Brache V, Faundes A, Alvarex F, et al. Nonmenstrual adverse events during use of implantable contraceptives for women: data from clinical trials. Contraception. 2002;65:63-74.
11. Hamill M, Bowling J, Vega-Lopez F. Sweet’s syndrome and a Mirena intrauterine system. J Fam Plann Reprod Health Care. 2004;30:115-116.
12. Karri K, Mowbray D, Adams S, et al. Severe seborrhoeic dermatitis: side-effect of the Mirena intra-uterine system. Eur J Contracept Reprod Health Care. 2006;11:53-54.
13. Choudry K, Humphreys F, Menage J. Rosacea in association with the progesterone-releasing intrauterine contraceptive device. Clin Exp Dermatol. 2001;26:102.
14. Pereira A, Coker A. Hypersensitivity to Mirena—a rare complication. J Obstet Gynaecol. 2003;23:81.
15. Halevy S, Shai A. Lichenoid drug eruptions. J Am Acad Dermatol. 1993;29(2, pt 1):249-255.
16. Seehafer JR, Rogers RS 3rd, Fleming CR, et al. Lichen planus-like lesions caused by penicillamine in primary biliary cirrhosis. Arch Dermatol. 1981;117:140-142.
17. Anderson TE. Lichen planus following quinidine therapy. Br J Dermatol. 1967;79:500.
Guidelines, appropriateness, and quality of care in PAD
Symptomatic PAD is among the most common reasons for referral to a vascular specialist. The volume of invasive procedures for PAD, and the attendant cost, has risen dramatically over the last decade. The majority of these interventions are for treatment of intermittent claudication (IC). Patients with IC have a broad range of disabilities and comorbid conditions. Medical therapy, smoking cessation, and exercise are of proven value for symptom improvement and long-term vascular health. In appropriately selected patients, revascularization for IC can relieve pain and improve ambulatory function. As a vascular surgeon keenly interested in PAD, I perform both open and endovascular interventions for IC in my practice.
Recent reports have highlighted rising concerns about the overuse of invasive procedures in PAD. A New York Times article1 cited the dramatic growth of stent procedures, raising a red flag among multiple stakeholders and consumers of vascular care. Although a closer look at the NY Times data highlights the explosion of stenting for venous disease, much of the subsequent discussion focused on PAD treatment, with its decade-long trend of rising volumes.

Another recent report2 documented the growing volume and costs of office-based percutaneous interventions for PAD in the United States, coincident with changes in Medicare reimbursement that greatly incentivized providers. This has turned the spotlight on office-based angiography suites, and how they are monitored. Improved, less invasive technology is often cited as a rational basis for offering intervention more readily to PAD patients. Unfortunately, the data on efficacy of interventions in IC is shockingly limited, leaving a wide gap in evidence supplanted by poor quality studies, overemphasis on technical success, market forces, and naked economics.
Just prior to the publication of the New York Times article on stent use, the SVS released a clinical practice guideline on the management of asymptomatic PAD and claudication.3 Systematic evidence reviews were undertaken4,5 and an expert panel of clinicians developed a list of specific recommendations. Medical therapy and exercise, preferably supervised exercise, were strongly recommended as first-line therapy for IC. Revascularization was considered reasonable for those patients with significant disability, acceptable risk, and after pharmacologic or exercise therapy have failed. An important recommendation in the guideline addresses a minimal effectiveness standard for revascularization in IC. Physicians should carefully consider the likelihood of functional benefit of a procedure based on patient risk, degree of impairment, and anatomic/technical factors that are known to impact patency.
The guideline suggests that a recommended intervention for IC should have a minimum expectation of >50% likelihood of sustained benefit for at least 2 years. At a recent local vascular symposium attended by more than 100 vascular providers, I asked the following question: “If you were a PAD patient considering an invasive procedure for claudication, what is the minimum likelihood of durable walking improvement you would expect?” The choices were >50% likelihood for at least 1 year, 2 years, or 3 years. Nearly 80% voted that they would want a 3-year, 50% minimum “guarantee” to consent to treatment. That seems quite rational to me.
Surgical and endovascular interventions for even advanced forms of aorto-iliac disease would generally meet the “>50% patency for at least 2-3 years” bar. But infrainguinal intervention is quite a different story. Although technology continues to advance with drug elution and improved stent designs for femoro-popliteal occlusive disease (FPOD), it has been incremental. I think it is fair to say that 3-year durability of an endovascular intervention for extensive FPOD is much more the exception than the rule. Now let’s consider a bit of “claudication math”. FPOD is commonly bilateral and symmetric.
How does one approach bilateral significant FPOD in a claudicant? If an intervention of long segment FPOD has a 60% chance of patency for 2 years, what’s the likelihood of a successful patient outcome if both legs are treated? Since we can usually assume two good legs are required for walking, it would be 0.6 x 0.6= 0.36! The best treatment we have for FPOD is a vein bypass graft, with a 70%-80% 3-year outcome. Bilateral fem-pop vein bypass grafts would just make the 50%, 3-year minimum expectation threshold, at the expense of two open procedures with their potential complications and costs. All of this means what we have always known: that we need to choose very wisely when intervening for claudication to get successful and satisfying outcomes. The old dictum “stop smoking and start walking” should not be replaced by “lets do a Duplex and take a look at your blockage, then we’ll see.”
Practice guidelines are important because they represent consensus recommendations, but they often leave considerable room for interpretation, particularly where the evidence is less strong. “Appropriateness” criteria, rather than addressing care of a specific clinical condition, focus on indications for specific procedures. Because the notion of “inappropriate” carries liability implications, appropriateness criteria tend to be even more liberal. What we really need are criteria for “rational use” of interventions, and I believe the “50%/2-year” minimum threshold for claudication in the SVS guideline is a good place to start.
Payers, most importantly Medicare, are getting increasingly interested in measuring quality of care in PAD. I believe that there are too many interventions being done in mild to moderate PAD, without adequate patient education, medical therapy, and exercise trials. I believe that informed consent is inconsistent at best, and that patients largely lack the tools for true “shared decision making” in these interactions. I believe that provider implementation of guideline-recommended medical therapy and follow-up care after invasive procedures is highly variable.
So here is what I would do if I were the CEO of a large payer looking at this state of affairs: I would offer qualified coverage for exercise therapy for 3-6 months for IC, and stipulate that outside of vocation-limiting disability, revascularization would not be covered unless a bona fide trial of exercise was made. I would contract with vascular practices that met a high standard of pre- and post-procedural guideline adherence, including prescription of cardioprotective drugs and surveillance. And I would mandate that authorized vascular providers on my panel collect follow-up data for at least 1 year in a high percentage of their PAD interventions, using VQI or a similar tool. Of course real change will require a better alignment of incentives, and by that I don’t mean just penalties, but also rewards for meeting benchmarks. The SVS should continue to broadly promote the development of higher quality standards in PAD care, for the long-term benefit of our patients and our specialty.
References:
1. Medicare payment surge for stents to unblock blood vessels in limbs. New York Times. Jan. 29, 2015 (online).
2. J. Amer. Coll. Card. 2015; 65:920-7.
3. J. Vasc. Surg. 2015;61 (3 suppl):2S-41S.
4. J. Vasc. Surg. 2015;61 (3 suppl):42S-53S.
5. J. Vasc. Surg. 2015; 61 (3 suppl):54S-73S.
Dr. Conte is professor of surgery at the University of California, San Francisco, co-chair of the SVS Lower Extremity Practice Guidelines Committee, and one of three co-editors leading the GVG CLTI Guidelines Steering Committee. He reported that he is on the Cook Medical–Scientific Advisory Board and the Medtronic Inc. Scientific Advisory Board, and is a lecturer for Cook Medical.
Symptomatic PAD is among the most common reasons for referral to a vascular specialist. The volume of invasive procedures for PAD, and the attendant cost, has risen dramatically over the last decade. The majority of these interventions are for treatment of intermittent claudication (IC). Patients with IC have a broad range of disabilities and comorbid conditions. Medical therapy, smoking cessation, and exercise are of proven value for symptom improvement and long-term vascular health. In appropriately selected patients, revascularization for IC can relieve pain and improve ambulatory function. As a vascular surgeon keenly interested in PAD, I perform both open and endovascular interventions for IC in my practice.
Recent reports have highlighted rising concerns about the overuse of invasive procedures in PAD. A New York Times article1 cited the dramatic growth of stent procedures, raising a red flag among multiple stakeholders and consumers of vascular care. Although a closer look at the NY Times data highlights the explosion of stenting for venous disease, much of the subsequent discussion focused on PAD treatment, with its decade-long trend of rising volumes.
Another recent report2 documented the growing volume and costs of office-based percutaneous interventions for PAD in the United States, coincident with changes in Medicare reimbursement that greatly incentivized providers. This has turned the spotlight on office-based angiography suites, and how they are monitored. Improved, less invasive technology is often cited as a rational basis for offering intervention more readily to PAD patients. Unfortunately, the data on efficacy of interventions in IC is shockingly limited, leaving a wide gap in evidence supplanted by poor quality studies, overemphasis on technical success, market forces, and naked economics.
Just prior to the publication of the New York Times article on stent use, the SVS released a clinical practice guideline on the management of asymptomatic PAD and claudication.3 Systematic evidence reviews were undertaken4,5 and an expert panel of clinicians developed a list of specific recommendations. Medical therapy and exercise, preferably supervised exercise, were strongly recommended as first-line therapy for IC. Revascularization was considered reasonable for those patients with significant disability, acceptable risk, and after pharmacologic or exercise therapy have failed. An important recommendation in the guideline addresses a minimal effectiveness standard for revascularization in IC. Physicians should carefully consider the likelihood of functional benefit of a procedure based on patient risk, degree of impairment, and anatomic/technical factors that are known to impact patency.
The guideline suggests that a recommended intervention for IC should have a minimum expectation of >50% likelihood of sustained benefit for at least 2 years. At a recent local vascular symposium attended by more than 100 vascular providers, I asked the following question: “If you were a PAD patient considering an invasive procedure for claudication, what is the minimum likelihood of durable walking improvement you would expect?” The choices were >50% likelihood for at least 1 year, 2 years, or 3 years. Nearly 80% voted that they would want a 3-year, 50% minimum “guarantee” to consent to treatment. That seems quite rational to me.
Surgical and endovascular interventions for even advanced forms of aorto-iliac disease would generally meet the “>50% patency for at least 2-3 years” bar. But infrainguinal intervention is quite a different story. Although technology continues to advance with drug elution and improved stent designs for femoro-popliteal occlusive disease (FPOD), it has been incremental. I think it is fair to say that 3-year durability of an endovascular intervention for extensive FPOD is much more the exception than the rule. Now let’s consider a bit of “claudication math”. FPOD is commonly bilateral and symmetric.
How does one approach bilateral significant FPOD in a claudicant? If an intervention of long segment FPOD has a 60% chance of patency for 2 years, what’s the likelihood of a successful patient outcome if both legs are treated? Since we can usually assume two good legs are required for walking, it would be 0.6 x 0.6= 0.36! The best treatment we have for FPOD is a vein bypass graft, with a 70%-80% 3-year outcome. Bilateral fem-pop vein bypass grafts would just make the 50%, 3-year minimum expectation threshold, at the expense of two open procedures with their potential complications and costs. All of this means what we have always known: that we need to choose very wisely when intervening for claudication to get successful and satisfying outcomes. The old dictum “stop smoking and start walking” should not be replaced by “lets do a Duplex and take a look at your blockage, then we’ll see.”
Practice guidelines are important because they represent consensus recommendations, but they often leave considerable room for interpretation, particularly where the evidence is less strong. “Appropriateness” criteria, rather than addressing care of a specific clinical condition, focus on indications for specific procedures. Because the notion of “inappropriate” carries liability implications, appropriateness criteria tend to be even more liberal. What we really need are criteria for “rational use” of interventions, and I believe the “50%/2-year” minimum threshold for claudication in the SVS guideline is a good place to start.
Payers, most importantly Medicare, are getting increasingly interested in measuring quality of care in PAD. I believe that there are too many interventions being done in mild to moderate PAD, without adequate patient education, medical therapy, and exercise trials. I believe that informed consent is inconsistent at best, and that patients largely lack the tools for true “shared decision making” in these interactions. I believe that provider implementation of guideline-recommended medical therapy and follow-up care after invasive procedures is highly variable.
So here is what I would do if I were the CEO of a large payer looking at this state of affairs: I would offer qualified coverage for exercise therapy for 3-6 months for IC, and stipulate that outside of vocation-limiting disability, revascularization would not be covered unless a bona fide trial of exercise was made. I would contract with vascular practices that met a high standard of pre- and post-procedural guideline adherence, including prescription of cardioprotective drugs and surveillance. And I would mandate that authorized vascular providers on my panel collect follow-up data for at least 1 year in a high percentage of their PAD interventions, using VQI or a similar tool. Of course real change will require a better alignment of incentives, and by that I don’t mean just penalties, but also rewards for meeting benchmarks. The SVS should continue to broadly promote the development of higher quality standards in PAD care, for the long-term benefit of our patients and our specialty.
References:
1. Medicare payment surge for stents to unblock blood vessels in limbs. New York Times. Jan. 29, 2015 (online).
2. J. Amer. Coll. Card. 2015; 65:920-7.
3. J. Vasc. Surg. 2015;61 (3 suppl):2S-41S.
4. J. Vasc. Surg. 2015;61 (3 suppl):42S-53S.
5. J. Vasc. Surg. 2015; 61 (3 suppl):54S-73S.
Dr. Conte is professor of surgery at the University of California, San Francisco, co-chair of the SVS Lower Extremity Practice Guidelines Committee, and one of three co-editors leading the GVG CLTI Guidelines Steering Committee. He reported that he is on the Cook Medical–Scientific Advisory Board and the Medtronic Inc. Scientific Advisory Board, and is a lecturer for Cook Medical.

Society of Hospital Medicine Events, Online Tools, Programs for Hospitalists
Career Advancers: SHM Events, Online Tools, and Programs
Hospitalists can advance their careers and the hospital medicine movement at the same time, with in-person events, online tools, and other programs designed specifically for people providing care to hospitalized patients.
When hospitalists meet face to face, good things happen. Solutions are shared. Challenges are addressed. But most importantly, SHM’s meetings are sources of energy and inspiration for the thousands of hospitalists who attend them every year.
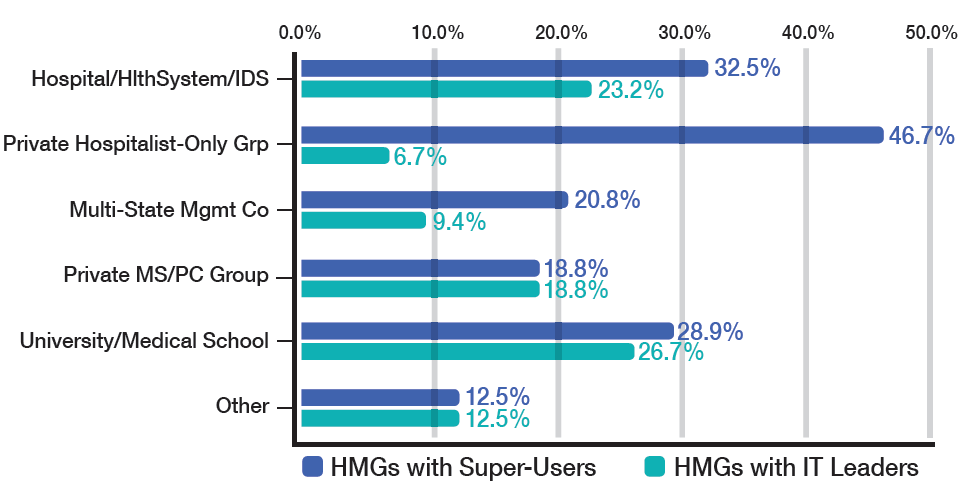
July 23-26, San Antonio
There’s still time to register for the fast-growing national event organized specifically for pediatric hospitalists. This year, the meeting will focus on mentoring, networking, and partnerships to improve children’s health locally and globally.
Meeting attendees should plan on downloading the PHM 2015 app to get session materials, download presentations, and find their way at the conference.
![]()
October 19-22, Austin
Have you taken on more leadership responsibilities at your hospital?
Or are you ready to demonstrate that you’re ready to take them on?
SHM’s Leadership Academy has trained thousands of hospitalists to lead groups more effectively and to understand the financial realities of running a hospital
medicine practice. www.hospitalmedicine.org/leadership
![]()
March 6-9, 2016, San Diego
Every year, thousands of hospitalists gather for educational sessions, professional networking, and time to catch up with friends in the hospital medicine movement. Now is the time to schedule time off and register! www.hospitalmedicine2016.org
Meet-Ups for Medical Students and Residents
Chicago and Los Angeles
Are you in the Chicago or Los Angeles area? Do you know medical students and residents exploring their career options? Make sure they know about SHM’s
Future of Hospital Medicine events later this year. Each event features hospitalist leaders talking about their careers and—of course—there will be food. The first event was held in May at University of Chicago. Upcoming events will be at Rush University in Chicago on September 24 and David Geffen School of Medicine at UCLA on October 22. Visit the website below for details, and share with your colleagues! www.futureofhospitalmedicine.org/events
If you can’t make it to in-person events, SHM brings some of the very best of the hospital medicine movement to your smartphone, tablet, and computer.
New at the Learning Portal: “Perioperative Cardiac Risk Assessment” and “Patient Safety Tools”
Free CME is available to all SHM members at www.shmlearningportal.org, and new modules are added all the time. Recently, SHM has added two new modules:
- Perioperative Cardiac Risk Assessment. Perioperative cardiac complications are the most widely feared medical issues for the anesthesiologist, surgeon, and medical consultant as they approach a patient with the option of surgery. To assess for pre-operative cardiac risk, hospitalists should follow a step-wise algorithm. This new module reviews the risk assessment process and enables the hospitalist to order appropriate pre-operative testing.
- Patient Safety Tools: Root Cause Analysis and Failure Mode and Effects Analysis 2015. This updated online learning module begins with a lesson and contains a 10-question post-test with accompanying answers, rationales, and references. When the participant selects an answer, immediate feedback is given explaining the correct answer.
Quality Improvement Webinars
![]()
SHM is hosting nine webinars between now and September. Hospitalists can attend the webinars in real time or download them from the SHM website at www.hospitalmedicine.org/qiwebinar.
Project BOOST webinar series:
- Project BOOST Teach-Back;
- Project BOOST Presents “Partnering with Skilled Nursing Facilities”; and
- Project BOOST Presents “Approaches to Readmission Risk Stratification.”
Glycemic control webinar series:
- Perioperative Management of Hyperglycemia;
- Hypoglycemia Management and Prevention; and
- Subcutaneous Insulin Order Sets in the Inpatient Setting: Design and Implementation.
General QI webinars:
- Quality Improvement for Hospital Medicine Groups: Self-Assessment and Self-Improvement Using the SHM Key Characteristics;
- Coaching a Quality Improvement Team: Basics for Being Sure Any QI Team and Project Are on the Right Track; and
- Elevating Provider Experience to Improve Patient Experience.
Evaluate Your Performance with the ACS Performance Improvement CME Program
![]()
The ACS PI-CME is a self-directed, web-based activity designed to help you evaluate your practice. Registration is FREE. Upon completion of the activity, participants will receive 20 CME Credits.
For details, visit www.hospitalmedicine.org/acs and click “REGISTER.”
Brand New Podcast: “Before the White Coat”
![]()
To download and subscribe to “Before the White Coat,” visit www.beforethewhitecoat.org.
Career Advancers: SHM Events, Online Tools, and Programs
Hospitalists can advance their careers and the hospital medicine movement at the same time, with in-person events, online tools, and other programs designed specifically for people providing care to hospitalized patients.
When hospitalists meet face to face, good things happen. Solutions are shared. Challenges are addressed. But most importantly, SHM’s meetings are sources of energy and inspiration for the thousands of hospitalists who attend them every year.
July 23-26, San Antonio
There’s still time to register for the fast-growing national event organized specifically for pediatric hospitalists. This year, the meeting will focus on mentoring, networking, and partnerships to improve children’s health locally and globally.
Meeting attendees should plan on downloading the PHM 2015 app to get session materials, download presentations, and find their way at the conference.
![]()
October 19-22, Austin
Have you taken on more leadership responsibilities at your hospital?
Or are you ready to demonstrate that you’re ready to take them on?
SHM’s Leadership Academy has trained thousands of hospitalists to lead groups more effectively and to understand the financial realities of running a hospital
medicine practice. www.hospitalmedicine.org/leadership
![]()
March 6-9, 2016, San Diego
Every year, thousands of hospitalists gather for educational sessions, professional networking, and time to catch up with friends in the hospital medicine movement. Now is the time to schedule time off and register! www.hospitalmedicine2016.org
Meet-Ups for Medical Students and Residents
Chicago and Los Angeles
Are you in the Chicago or Los Angeles area? Do you know medical students and residents exploring their career options? Make sure they know about SHM’s
Future of Hospital Medicine events later this year. Each event features hospitalist leaders talking about their careers and—of course—there will be food. The first event was held in May at University of Chicago. Upcoming events will be at Rush University in Chicago on September 24 and David Geffen School of Medicine at UCLA on October 22. Visit the website below for details, and share with your colleagues! www.futureofhospitalmedicine.org/events
If you can’t make it to in-person events, SHM brings some of the very best of the hospital medicine movement to your smartphone, tablet, and computer.
New at the Learning Portal: “Perioperative Cardiac Risk Assessment” and “Patient Safety Tools”
Free CME is available to all SHM members at www.shmlearningportal.org, and new modules are added all the time. Recently, SHM has added two new modules:
- Perioperative Cardiac Risk Assessment. Perioperative cardiac complications are the most widely feared medical issues for the anesthesiologist, surgeon, and medical consultant as they approach a patient with the option of surgery. To assess for pre-operative cardiac risk, hospitalists should follow a step-wise algorithm. This new module reviews the risk assessment process and enables the hospitalist to order appropriate pre-operative testing.
- Patient Safety Tools: Root Cause Analysis and Failure Mode and Effects Analysis 2015. This updated online learning module begins with a lesson and contains a 10-question post-test with accompanying answers, rationales, and references. When the participant selects an answer, immediate feedback is given explaining the correct answer.
Quality Improvement Webinars
![]()
SHM is hosting nine webinars between now and September. Hospitalists can attend the webinars in real time or download them from the SHM website at www.hospitalmedicine.org/qiwebinar.
Project BOOST webinar series:
- Project BOOST Teach-Back;
- Project BOOST Presents “Partnering with Skilled Nursing Facilities”; and
- Project BOOST Presents “Approaches to Readmission Risk Stratification.”
Glycemic control webinar series:
- Perioperative Management of Hyperglycemia;
- Hypoglycemia Management and Prevention; and
- Subcutaneous Insulin Order Sets in the Inpatient Setting: Design and Implementation.
General QI webinars:
- Quality Improvement for Hospital Medicine Groups: Self-Assessment and Self-Improvement Using the SHM Key Characteristics;
- Coaching a Quality Improvement Team: Basics for Being Sure Any QI Team and Project Are on the Right Track; and
- Elevating Provider Experience to Improve Patient Experience.
Evaluate Your Performance with the ACS Performance Improvement CME Program
![]()
The ACS PI-CME is a self-directed, web-based activity designed to help you evaluate your practice. Registration is FREE. Upon completion of the activity, participants will receive 20 CME Credits.
For details, visit www.hospitalmedicine.org/acs and click “REGISTER.”
Brand New Podcast: “Before the White Coat”
![]()
To download and subscribe to “Before the White Coat,” visit www.beforethewhitecoat.org.
Society of Hospital Medicine Membership Ambassador Program Benefits Hospitalists
![]()
Now, through SHM’s Membership Ambassador Program, SHM members can earn 2016-2017 dues credits and special recognition for recruiting new physician, physician assistant, nurse practitioner, pharmacist, or affiliate members. And for every new member recruited, hospitalists will receive one entry into a grand prize drawing to receive complimentary registration to Hospital Medicine 2016 in San Diego.
Demonstrating leadership by becoming a Fellow or Senior Fellow in Hospital Medicine is another great way to move it forward—and propel your career at the same time. July and August are excellent months to begin the FHM or SFHM application process.
Click for more details and great SHM merchandise.
Proton Pump Inhibitors Commonly Prescribed, Not Always Necessary
Robert Coben, MD, academic coordinator for the Gastrointestinal Fellowship Program at Thomas Jefferson University Hospital in Philadelphia, says that when patients get admitted with chest pain for reasons other than a heart-related problem, he is frequently called on to do an endoscopy right away.
But that’s usually not the best starting point, he says.
“I would say the best test would be to just place the patient on a high-dose proton pump inhibitor once or twice a day first, to see if those symptoms resolve,” he says. “Many times we’re called in to do an upper endoscopy. … And many times that’s not really indicated unless they’re
having other alarm symptoms such as dysphagia, odynophagia, and weight loss.”

Marcelo Vela, MD, gastroenterologist and hepatologist at the Mayo Clinic in Scottsdale, Ariz., and an associate editor with Clinical Gastroenterology and Hepatology, adds that it’s okay to start a patient with non-cardiac chest pain on PPIs when they have concomitant, typical symptoms of gastroesophageal reflux disease (GERD)—heartburn and acid regurgitation. But in patients without such symptoms, further testing is needed to confirm GERD, he says (Katz PO, Gerson LB, Vela MF. Guidelines for the diagnosis and management of gastroesophageal reflux disease. Am J Gastroenterol. 2013;108(3):308–328, Table 1).
This evaluation is usually done in the outpatient setting, he says.
Dr. Vela suggests more care might be needed in the prescribing of PPIs. He says he frequently sees patients who have been hospitalized and put on a PPI without a clear reason.
“They get admitted for various reasons—DVT [deep vein thrombosis], pneumonia, whatever, and then in the hospital, they get started on a proton pump inhibitor for unclear reasons. And then they leave and they stay on it,” Dr. Vela says.
When he asks why, patients just say, “On my last hospitalization, they put me on it,” he says.
“I think you should only leave the hospital on a PPI with a very clear indication—either you found an ulcer or the patient clearly has GERD” or some other reason, he says. “They’re fairly benign medications, but if there’s no indication for it, there’s no benefit.”
Robert Coben, MD, academic coordinator for the Gastrointestinal Fellowship Program at Thomas Jefferson University Hospital in Philadelphia, says that when patients get admitted with chest pain for reasons other than a heart-related problem, he is frequently called on to do an endoscopy right away.
But that’s usually not the best starting point, he says.
“I would say the best test would be to just place the patient on a high-dose proton pump inhibitor once or twice a day first, to see if those symptoms resolve,” he says. “Many times we’re called in to do an upper endoscopy. … And many times that’s not really indicated unless they’re
having other alarm symptoms such as dysphagia, odynophagia, and weight loss.”
Marcelo Vela, MD, gastroenterologist and hepatologist at the Mayo Clinic in Scottsdale, Ariz., and an associate editor with Clinical Gastroenterology and Hepatology, adds that it’s okay to start a patient with non-cardiac chest pain on PPIs when they have concomitant, typical symptoms of gastroesophageal reflux disease (GERD)—heartburn and acid regurgitation. But in patients without such symptoms, further testing is needed to confirm GERD, he says (Katz PO, Gerson LB, Vela MF. Guidelines for the diagnosis and management of gastroesophageal reflux disease. Am J Gastroenterol. 2013;108(3):308–328, Table 1).
This evaluation is usually done in the outpatient setting, he says.
Dr. Vela suggests more care might be needed in the prescribing of PPIs. He says he frequently sees patients who have been hospitalized and put on a PPI without a clear reason.
“They get admitted for various reasons—DVT [deep vein thrombosis], pneumonia, whatever, and then in the hospital, they get started on a proton pump inhibitor for unclear reasons. And then they leave and they stay on it,” Dr. Vela says.
When he asks why, patients just say, “On my last hospitalization, they put me on it,” he says.
“I think you should only leave the hospital on a PPI with a very clear indication—either you found an ulcer or the patient clearly has GERD” or some other reason, he says. “They’re fairly benign medications, but if there’s no indication for it, there’s no benefit.”
ProMISe Trial Adds Skepticism to Early Goal-Directed Therapy for Sepsis
Clinical question: Does EGDT for sepsis reduce mortality at 90 days compared with standard therapy?
Background: EGDT is recommended in international guidelines for the resuscitation of patients presenting with early septic shock; however, adoption has been limited, and uncertainty about its effectiveness remains.
Study design: Pragmatic, multicenter, randomized controlled trial (RCT) with intention to treat analysis.
Setting: Fifty-six National Health Service EDs in the United Kingdom.
Synopsis: ProMISe trial enrolled 1,251 patients with severe sepsis or septic shock and patients were randomized to usual-care group (as determined by the treating clinicians) or algorithm-driven EGDT, which included continuous central venous oxygen saturation (ScvO2) using the original EGDT protocol. The primary outcome of all-cause mortality at 90 days was not significantly different between the two groups: 29.5% in EGDT and 29.2% in the usual-care group (P=0.9). This translated into a relative risk of 1.01% (95% CI 0.85-1.20) in the EGDT group. There were no meaningful differences in secondary outcomes.
Both groups in this study were actually well matched for most interventions. The main difference was in the use of continuous ScvO2 measurement and central venous pressure to guide management. Perhaps we should not completely dismiss the term EGDT. Most of our “usual care” consists of early intervention and goal-directed therapy.
Bottom line: In patients identified early with septic shock, the use of EGDT vs. “usual” care did not result in a statistical difference in 90-day mortality.
Citation: Mouncey PR, Osborn TM, Power GS, et al. Trial of early, goal-directed resuscitation for septic shock. N Engl J Med. 2015;372:1301-1311.
Effectiveness of Multicomponent Nonpharmacological Delirium Interventions
Clinical question: How effective are multicomponent, nonpharmacological interventions at reducing delirium and preventing poor outcomes?
Background: Delirium is an acute disorder with significant morbidity and mortality. Systemic reviews and clinical guidelines recommend targeted, multicomponent, nonpharmacologic strategies for prevention. The Hospital Elder Life Program (HELP) uses an interdisciplinary team to implement nonpharmacologic interventions, such as reorientation, early mobilization, therapeutic activities, hydration, nutrition, sleep strategies, and hearing and vision adaptation. Trials of nonpharmacological strategies to prevent this disorder have been limited to small-scale studies.
Study design: Systemic literature review and meta-analysis.
Synopsis: Fourteen studies involving 12 unique interventions were identified and results were pooled for meta-analysis, with primary outcomes being incidence and falls. Secondary outcomes were length of stay, institutionalization, and change in functional or cognitive status. Eleven studies were found to have demonstrated significant reductions in delirium incidence (odds ratio [OR], 0.47; 95% CI, 0.38-0.58), with four trials reducing delirium incidence by 44% (OR, 0.56; 95%CI, 0.42-0.76). Four studies demonstrated a significant decrease in the rate of falls (OR, 0.38; 95% CI, 0.25-0.60), with two studies reducing falls by 64% (OR, 0.36; 95% CI, 0.22-0.61). Institutionalization and length of stay did not demonstrate statistical significance between the two groups.
Bottom line: Multicomponent, nonpharmacological delirium prevention interventions were found to be effective in decreasing the occurrence of both delirium and falls during hospitalization in older persons.
Citation: Hshieh TT, Yue J, Oh E, et al. Effectiveness of multicomponent nonpharmacological delirium interventions. JAMA. 2015;175(4):512-520.
How to Quantify “Safe” Level of Hyponatremia to Treat at Small Hospitals

I am a hospitalist at a small rural hospital, and I’ve read both the hyponatremia and SIADH articles published in The Hospitalist. Our lab does not do any urine testing beyond a UA [urinalysis] in house, so the urine osmol and urine Na+ tests are send-outs, which take several days to come back. I’m having difficulty with diagnosing the reason for and treating hyponatremia. I find it complicated, and when the urine tests are not readily available, it’s difficult to use the algorithm. Do you know of any basic tips that could help? If our hospital does not have the right urine tests readily available, should I be sending these patients to the larger hospital from the ED if sodium is <125, instead of admitting them?
—Carleigh Wilson, DO
Dr. Hospitalist responds:
I too can recall moonlighting in a small rural hospital in southern Georgia 25 years ago; I remember having to improvise when taking care of patients with hyponatremia. Fortunately, even though we have developed more sophisticated equipment to help in the diagnosis (e.g. electrodes that are not hampered by excess triglycerides or proteins), my basic approach to evaluating these patients hasn’t changed much.
I still begin with an assessment of the patients’ serum osmolarity, which is usually low in most hospitalized patients. If it is elevated, then, of course, hyperglycemia is the most common cause, but we also must consider alcohol or, way less common these days, mannitol. Hypoosmolar hyponatremia most often occurs when the kidneys are overwhelmed by the intake of water and cannot excrete it as free water. Even though it can occur when there is pathologic consumption of large amounts of water (psychogenic polydipsia) or excess consumption of beer, it most often occurs when the kidney fails to fully dilute the urine, which would be evidenced by urine osmolality >100mmol/l.
A good history and physical will help categorize the patients with poorly diluted urine; in the absence of measured urine osmolality, however, urine specific gravity (USG) can be used with some caveats. Studies have shown that USG done by refractometry and reagent strip (both very inexpensive) have a correlation of 0.75-0.80 with urine osmolality. Although there are many variables affecting both (pH, ketones, glucose, urobilinogen, bilirubin, and protein for the reagent strips), I would use the refractometer, which only seems to be affected by bilirubin, ketones, and hemoglobin. So, at a pH of 7, with all the variables considered and a USG of 1.010, predicted osmolality is approximately 300 mosm/kg/H20. Also, while osmolarity and specific gravity change in parallel, the two measurements diverge when there are large particles in solution (e.g. glucose or proteins), so be careful … Dr Kokko would be so proud of me!
The next step is to determine the patients’ volume status. Because I’m old school, I still believe this can be done at the bedside. On most occasions, it is only when I’m trying to decide whether the primary sodium loss in hypovolemic patients is due to a renal or extra-renal cause that the urine sodium is helpful. In truly hypovolemic and asymptomatic patients, I usually start with normal saline (NS) to correct the volume status and follow the serum sodium closely to avoid correcting too rapidly. Urine sodium is not particularly helpful in caring for euvolemic and hypervolemic hyponatremic patients.
Due to multiple variables (e.g. acute vs. chronic, co-morbidities, nursing and lab support, quick and safe transfer to higher level of care), it is difficult to quantify a “safe” level of hyponatremia to treat at a small rural hospital. Considering the clinical variables and presence of symptoms, I probably would not be comfortable with a serum sodium less than 123 meq/L. However, you have to understand and appreciate your limitations and develop your own level of comfort.
Do you have a problem or concern that you’d like Dr. Hospitalist to address? Email your questions to [email protected].