User login
P2X7 receptor implicated in visceral pain caused by chronic pancreatitis
A subtype of purinergic receptor on spinal microglial cells mediated visceral pain hypersensitivity in rats with chronic pancreatitis, and pharmacologic or genetic inhibition of this receptor improved hyperalgesia, according to a report in the November issue of Cellular and Molecular Gastroenterology and Hepatology.
“Our study may be the first to identify that P2X7 receptors in spinal microglia are upregulated in chronic pancreatitis, and that this upregulation is associated with the development of visceral hyperalgesia,” said Dr. Pei-Yi Liu at National Yang-Ming University in Taipei, Taiwan, and her associates. A common laboratory dye known as brilliant blue G, which is an antagonist of P2X7R, “not only attenuated but also prevented CP-related chronic visceral hyperalgesia,” the researchers reported.
Chronic pancreatitis causes intense, recurrent epigastric pain that is “difficult and frustrating” to control and can lead to malnutrition, narcotic analgesic addiction, and social and financial problems, said the researchers. Previously, they had linked visceral pain in murine CP to activation of spinal microglia, the main effector immune cells in the central nervous system. The molecular pathways remained unclear, but some research had implicated extracellular adenosine triphosphate (ATP) as well as purinergic receptors in the CNS. Because a purine receptor subtype known as P2X7 had been linked to neuropathic and inflammatory pain, the researchers wondered if it also facilitated visceral pain (Cell Mol Gastroenterol Hepatol. 2015 Jul 22. doi: 10.1016/j.jcmgh.2015.07.008). To explore that question, they created a CP model by injecting 2% trinitrobenzene sulfonic acid into the pancreatic ducts of male rats. They measured behavioral responses to mechanical and electrical stimulation and quantified spinal cord P2X7R levels with the help of standard laboratory assays. They also watched for changes in pain-related behaviors after blocking spinal cord P2X7R with brilliant blue G or knocking it down with short interfering RNA (siRNA).
Spinal P2X7R expression rose significantly after CP induction, as did levels of the OX-42 microglial marker in the dorsal horn of the spinal cord, said the investigators. Brilliant blue G and genetic knock down suppressed P2X7R expression, inhibited activation of spinal microglia, and “significantly attenuated” nociceptive behaviors, they added.
The researchers also pretreated some rats with brilliant blue G before inducing CP and saw that these rats exhibited significantly lower pain responses to mechanical and electrical stimuli compared with other CP rats. In fact, the nociceptive responses of the pretreated CP rats resembled those of non-CP control rats, the investigators said. Spinal tissue from pretreated rats also lacked signs of P2X7R upregulation, they noted.
Taken together, the data “indicate a critical role of P2X7R expressed in the spinal cord in the development of chronic visceral pain in CP,” concluded the researchers. Brilliant blue G inhibits voltage-gated sodium channels, which are known to contribute to chronic visceral pain, and “may represent an effective drug for the treatment of chronic pain in chronic pancreatitis patients,” they added.
The study was funded by Taipei Veterans General Hospital, National Science Council of Taiwan, and the Taiwan Ministry of Education Aim for Top University Grant. The investigators declared no competing interests.
The traditional approach to treating pain in chronic pancreatitis is as if it were a “plumbing” problem – problems with ductal drainage. More recently, the emphasis has been on sensitization of the sensorineural system (“wiring”), in which the pain responses are greatly exaggerated. An additional consideration is whether this sensitization occurs in peripheral nerves that directly innervate the pancreas, or in the central nervous system, or both. This is clinically important because treatments directed at the periphery, e.g., pancreatectomy, may not be effective in patients in whom central sensitization is dominant.

|
Dr. Pankaj Jay Pasricha |
The findings of Dr. Lui and colleagues show that spinal (hence central) sensitization is important in chronic pancreatitis pain, and that this may be mediated by nonneuronal cells (microglia) in the spinal cord via P2X7R, a nucleotide receptor. This is not surprising, given that this signaling system has shown to be important in other forms of chronic pain. However, some questions remain – is peripheral sensitization driving these changes?
Clearly the “drug” they have used (BBG) is relatively harmless, but it is not practical because it may not be safe in humans (apart from coloring them blue). BBG also affects other channels, notably neuronal voltage-dependent sodium channels. Nevertheless, this study does offer new insight into the pathogenesis of pain in chronic pancreatitis and by itself is an important cautionary message for the growing enthusiasm for total pancreatectomy. It also identifies potential new therapeutic targets for treatment of pain and will, it is hoped, stimulate engagement from the pharmaceutical industry that is developing drugs directed toward glial activation and in particular the P2X7 receptor.
Dr. Pankaj Jay Pasricha, AGAF, is professor of medicine, Johns Hopkins University School of Medicine, director of Johns Hopkins Center for Motility Disorders and Digestive Diseases, and professor of innovation management, The Carey Business School, Johns Hopkins University, Baltimore. He has no conflicts of interest.
The traditional approach to treating pain in chronic pancreatitis is as if it were a “plumbing” problem – problems with ductal drainage. More recently, the emphasis has been on sensitization of the sensorineural system (“wiring”), in which the pain responses are greatly exaggerated. An additional consideration is whether this sensitization occurs in peripheral nerves that directly innervate the pancreas, or in the central nervous system, or both. This is clinically important because treatments directed at the periphery, e.g., pancreatectomy, may not be effective in patients in whom central sensitization is dominant.
|
|
Dr. Pankaj Jay Pasricha |
The findings of Dr. Lui and colleagues show that spinal (hence central) sensitization is important in chronic pancreatitis pain, and that this may be mediated by nonneuronal cells (microglia) in the spinal cord via P2X7R, a nucleotide receptor. This is not surprising, given that this signaling system has shown to be important in other forms of chronic pain. However, some questions remain – is peripheral sensitization driving these changes?
Clearly the “drug” they have used (BBG) is relatively harmless, but it is not practical because it may not be safe in humans (apart from coloring them blue). BBG also affects other channels, notably neuronal voltage-dependent sodium channels. Nevertheless, this study does offer new insight into the pathogenesis of pain in chronic pancreatitis and by itself is an important cautionary message for the growing enthusiasm for total pancreatectomy. It also identifies potential new therapeutic targets for treatment of pain and will, it is hoped, stimulate engagement from the pharmaceutical industry that is developing drugs directed toward glial activation and in particular the P2X7 receptor.
Dr. Pankaj Jay Pasricha, AGAF, is professor of medicine, Johns Hopkins University School of Medicine, director of Johns Hopkins Center for Motility Disorders and Digestive Diseases, and professor of innovation management, The Carey Business School, Johns Hopkins University, Baltimore. He has no conflicts of interest.
A subtype of purinergic receptor on spinal microglial cells mediated visceral pain hypersensitivity in rats with chronic pancreatitis, and pharmacologic or genetic inhibition of this receptor improved hyperalgesia, according to a report in the November issue of Cellular and Molecular Gastroenterology and Hepatology.
“Our study may be the first to identify that P2X7 receptors in spinal microglia are upregulated in chronic pancreatitis, and that this upregulation is associated with the development of visceral hyperalgesia,” said Dr. Pei-Yi Liu at National Yang-Ming University in Taipei, Taiwan, and her associates. A common laboratory dye known as brilliant blue G, which is an antagonist of P2X7R, “not only attenuated but also prevented CP-related chronic visceral hyperalgesia,” the researchers reported.
Chronic pancreatitis causes intense, recurrent epigastric pain that is “difficult and frustrating” to control and can lead to malnutrition, narcotic analgesic addiction, and social and financial problems, said the researchers. Previously, they had linked visceral pain in murine CP to activation of spinal microglia, the main effector immune cells in the central nervous system. The molecular pathways remained unclear, but some research had implicated extracellular adenosine triphosphate (ATP) as well as purinergic receptors in the CNS. Because a purine receptor subtype known as P2X7 had been linked to neuropathic and inflammatory pain, the researchers wondered if it also facilitated visceral pain (Cell Mol Gastroenterol Hepatol. 2015 Jul 22. doi: 10.1016/j.jcmgh.2015.07.008). To explore that question, they created a CP model by injecting 2% trinitrobenzene sulfonic acid into the pancreatic ducts of male rats. They measured behavioral responses to mechanical and electrical stimulation and quantified spinal cord P2X7R levels with the help of standard laboratory assays. They also watched for changes in pain-related behaviors after blocking spinal cord P2X7R with brilliant blue G or knocking it down with short interfering RNA (siRNA).
Spinal P2X7R expression rose significantly after CP induction, as did levels of the OX-42 microglial marker in the dorsal horn of the spinal cord, said the investigators. Brilliant blue G and genetic knock down suppressed P2X7R expression, inhibited activation of spinal microglia, and “significantly attenuated” nociceptive behaviors, they added.
The researchers also pretreated some rats with brilliant blue G before inducing CP and saw that these rats exhibited significantly lower pain responses to mechanical and electrical stimuli compared with other CP rats. In fact, the nociceptive responses of the pretreated CP rats resembled those of non-CP control rats, the investigators said. Spinal tissue from pretreated rats also lacked signs of P2X7R upregulation, they noted.
Taken together, the data “indicate a critical role of P2X7R expressed in the spinal cord in the development of chronic visceral pain in CP,” concluded the researchers. Brilliant blue G inhibits voltage-gated sodium channels, which are known to contribute to chronic visceral pain, and “may represent an effective drug for the treatment of chronic pain in chronic pancreatitis patients,” they added.
The study was funded by Taipei Veterans General Hospital, National Science Council of Taiwan, and the Taiwan Ministry of Education Aim for Top University Grant. The investigators declared no competing interests.
FROM CELLULAR AND MOLECULAR GASTROENTEROLOGY AND HEPATOLOGY
Key clinical point: A subtype of purinergic receptor on spinal microglial cells mediated visceral pain hypersensitivity in rats with chronic pancreatitis.
Major finding: Spinal P2X7R expression rose significantly after CP induction, and pharmacologic inhibition and genetic knock down inhibited activation of spinal microglia and “significantly attenuated” nociceptive behaviors.
Data source: Controlled, prospective, molecular and behavioral study of rats with chemically induced chronic pancreatitis.
Disclosures: The study was funded by Taipei Veterans General Hospital, National Science Council of Taiwan, and the Taiwan Ministry of Education Aim for Top University Grant. The investigators declared no competing interests.

No link found between IBS and serologic markers for celiac disease
Irritable bowel syndrome did not increase the likelihood of having serologic markers of celiac disease, according to a study of more than 3,000 residents of Southeastern Minnesota reported in the November issue of Clinical Gastroenterology and Hepatology.
Although several current guidelines list IBS as a risk factor for celiac disease, “our results suggest that testing for celiac disease [CD] in IBS will not have a significantly increased yield over population-based serologic screening,” said Dr. Rok Seon Choung of the Mayo Clinic, Rochester, Minn., and his associates. “In terms of IBS and other major GI syndromes, undetected CD does not appear to be positively associated with GI symptoms in the United States community.”
Despite widely available screening tests for CD, at least 80% of cases go undiagnosed. Testing based only on the presence of malabsorptive signs and symptoms misses many cases because of the trend toward “nonclassic” CD, said the researchers. “Physicians are especially likely to encounter patients with CD who have no classic symptoms while investigating other GI disorders,” they noted. “We aimed to determine whether positive results of serologic testing for CD by using a highly sensitive and specific assaywere associated with IBS and other functional gastrointestinal disorders in a large representative U.S. white population” (Clin Gastroenterol Hepatol. 2015 May doi: 10.1016/j.cgh.2015.05.014).

The investigators sent validated self-report bowel disease questionnaires to randomly chosen adults living in Olmsted County in Southeastern Minnesota. They also performed CD testing on serum from a convenience sample of 47,000 county residents with no prior diagnosis of CD. In all, 3,202 subjects completed questionnaires and had serum available for testing. About 55% of this group reported at least one GI symptom (95% confidence interval, 53%-57%), while 13.6% met criteria for IBS (95% CI, 12%-15%), the researchers said. A total of 1% of respondents had serologic markers for CD (95% CI, 0.7%-1.4%), in keeping with other epidemiologic studies in the United States, they added.
Notably, IBS affected only 3% of CD patients, compared with 14% of patients without CD, although the difference was not statistically significant (OR, 0.2; 95% CI, 0.03-1.5), the investigators said. Seropositive CD patients most often reported abdominal pain, constipation, weight loss, and dyspepsia, but none of these GI symptoms and no functional GI disorders were significantly more prevalent in CD patients than in non-CD patients. “These results may have important management and screening implications,” said the researchers. “Cost-effectiveness data suggest that testing for CD in patients with diarrhea-predominant IBS has an acceptable cost when the prevalence is above 1%, and becomes the dominant strategy when the prevalence exceeds 8%. However, we cannot confirm whether CD testing is a cost-effective approach in our population.”
The findings should be generalizable to white Americans, but not to the U.S. population as a whole because most participants were white, the researchers noted. “The prevalence of CD may vary by ethnic group, but the disease has been shown to be more common in whites than in other races,” they added. Responder bias was also possible, but past studies of the same bowel disease questionnaire uncovered no significant differences in rates of GI symptoms between responders and nonresponders, they noted.
The National Institutes of Health funded part of the work. Coauthor Dr. Nicholas Talley reported having colicensed the questionnaire used in the study. The remaining authors disclosed no financial conflicts.
In the well-designed and rigorous study by Choung et al., the authors conducted a community-based, cross-sectional survey among residents of Olmsted County, Minn., collecting data on symptoms compatible with functional GI disorders, including irritable bowel syndrome; the authors linked these data to prevalence surveys testing for undiagnosed celiac disease using serologic tests conducted among more than 47,000 individuals within the same regio

|
| Dr. Alexander Ford |
Patients with celiac disease may present with GI symptoms such as abdominal pain, bloating, and diarrhea, leading to confusion with IBS and diagnostic delay. Current guidelines, therefore, recommend screening patients consulting with IBS-type symptoms routinely for celiac disease. Despite this, in the study only 3% of individuals with positive celiac serology met the criteria for IBS, compared with 14% of those testing negative. Also of note is that subjects with positive serology were no more likely to report other GI symptoms felt to be typical presenting features of celiac disease, including abdominal pain, diarrhea, bloating, or abdominal distension. This suggests the yield of opportunistic screening of people reporting GI symptoms in the U.S. community is low.
However, current guidelines do not recommend screening people with IBS for celiac disease in the general population, and based their recommendations on studies conducted among patients consulting with GI symptoms. As a result, although the authors concluded, justifiably, that testing in the community is unlikely to have a significantly increased yield over population-based screening, it should not lead to a change in recommendations for practice in either primary or secondary care in other countries.
Dr. Alexander C. Ford is associate professor and honorary consultant gastroenterologist at Leeds Gastroenterology Institute, St. James’s University Hospital, and Leeds (England) Institute of Biomedical and Clinical Sciences, University of Leeds. He had no relevant financial conflicts of interest.
In the well-designed and rigorous study by Choung et al., the authors conducted a community-based, cross-sectional survey among residents of Olmsted County, Minn., collecting data on symptoms compatible with functional GI disorders, including irritable bowel syndrome; the authors linked these data to prevalence surveys testing for undiagnosed celiac disease using serologic tests conducted among more than 47,000 individuals within the same regio
|
|
| Dr. Alexander Ford |
Patients with celiac disease may present with GI symptoms such as abdominal pain, bloating, and diarrhea, leading to confusion with IBS and diagnostic delay. Current guidelines, therefore, recommend screening patients consulting with IBS-type symptoms routinely for celiac disease. Despite this, in the study only 3% of individuals with positive celiac serology met the criteria for IBS, compared with 14% of those testing negative. Also of note is that subjects with positive serology were no more likely to report other GI symptoms felt to be typical presenting features of celiac disease, including abdominal pain, diarrhea, bloating, or abdominal distension. This suggests the yield of opportunistic screening of people reporting GI symptoms in the U.S. community is low.
However, current guidelines do not recommend screening people with IBS for celiac disease in the general population, and based their recommendations on studies conducted among patients consulting with GI symptoms. As a result, although the authors concluded, justifiably, that testing in the community is unlikely to have a significantly increased yield over population-based screening, it should not lead to a change in recommendations for practice in either primary or secondary care in other countries.
Dr. Alexander C. Ford is associate professor and honorary consultant gastroenterologist at Leeds Gastroenterology Institute, St. James’s University Hospital, and Leeds (England) Institute of Biomedical and Clinical Sciences, University of Leeds. He had no relevant financial conflicts of interest.
Irritable bowel syndrome did not increase the likelihood of having serologic markers of celiac disease, according to a study of more than 3,000 residents of Southeastern Minnesota reported in the November issue of Clinical Gastroenterology and Hepatology.
Although several current guidelines list IBS as a risk factor for celiac disease, “our results suggest that testing for celiac disease [CD] in IBS will not have a significantly increased yield over population-based serologic screening,” said Dr. Rok Seon Choung of the Mayo Clinic, Rochester, Minn., and his associates. “In terms of IBS and other major GI syndromes, undetected CD does not appear to be positively associated with GI symptoms in the United States community.”
Despite widely available screening tests for CD, at least 80% of cases go undiagnosed. Testing based only on the presence of malabsorptive signs and symptoms misses many cases because of the trend toward “nonclassic” CD, said the researchers. “Physicians are especially likely to encounter patients with CD who have no classic symptoms while investigating other GI disorders,” they noted. “We aimed to determine whether positive results of serologic testing for CD by using a highly sensitive and specific assaywere associated with IBS and other functional gastrointestinal disorders in a large representative U.S. white population” (Clin Gastroenterol Hepatol. 2015 May doi: 10.1016/j.cgh.2015.05.014).
The investigators sent validated self-report bowel disease questionnaires to randomly chosen adults living in Olmsted County in Southeastern Minnesota. They also performed CD testing on serum from a convenience sample of 47,000 county residents with no prior diagnosis of CD. In all, 3,202 subjects completed questionnaires and had serum available for testing. About 55% of this group reported at least one GI symptom (95% confidence interval, 53%-57%), while 13.6% met criteria for IBS (95% CI, 12%-15%), the researchers said. A total of 1% of respondents had serologic markers for CD (95% CI, 0.7%-1.4%), in keeping with other epidemiologic studies in the United States, they added.
Notably, IBS affected only 3% of CD patients, compared with 14% of patients without CD, although the difference was not statistically significant (OR, 0.2; 95% CI, 0.03-1.5), the investigators said. Seropositive CD patients most often reported abdominal pain, constipation, weight loss, and dyspepsia, but none of these GI symptoms and no functional GI disorders were significantly more prevalent in CD patients than in non-CD patients. “These results may have important management and screening implications,” said the researchers. “Cost-effectiveness data suggest that testing for CD in patients with diarrhea-predominant IBS has an acceptable cost when the prevalence is above 1%, and becomes the dominant strategy when the prevalence exceeds 8%. However, we cannot confirm whether CD testing is a cost-effective approach in our population.”
The findings should be generalizable to white Americans, but not to the U.S. population as a whole because most participants were white, the researchers noted. “The prevalence of CD may vary by ethnic group, but the disease has been shown to be more common in whites than in other races,” they added. Responder bias was also possible, but past studies of the same bowel disease questionnaire uncovered no significant differences in rates of GI symptoms between responders and nonresponders, they noted.
The National Institutes of Health funded part of the work. Coauthor Dr. Nicholas Talley reported having colicensed the questionnaire used in the study. The remaining authors disclosed no financial conflicts.
FROM CLINICAL GASTROENTEROLOGY AND HEPATOLOGY
Key clinical point: Irritable bowel syndrome did not increase the likelihood of seropositivity for celiac disease.
Major finding: Patients with IBS were no more likely than others to have serologic markers for celiac disease (odds ratio, 0.2; 95% confidence interval, 0.03-1.5).
Data source: An analysis of bowel symptom surveys and serum samples from 3,202 residents of one county.
Disclosures: The National Institutes of Health funded part of the work. Coauthor Dr. Nicholas Talley reported having colicensed the questionnaire used in the study. The remaining authors disclosed no conflicts.

Low-FODMAP and traditional IBS diets found equally effective for symptom reduction
Advising patients with irritable bowel syndrome to cut their intake of fermentable short-chain carbohydrates improved GI symptoms as much as “traditional” recommendations to reduce meal size, gas-producing foods, insoluble fiber, fat, and caffeine, investigators reported in a randomized, multicenter, single-blinded study that appears in the November issue of Gastroenterology.
“Combining elements from these two strategies might further reduce symptoms of IBS,” said Lena Böhn, a registered dietician at the University of Gothenburg (Sweden) and her associates. Clinicians, however, should be aware that patients may cut calories in response to dietary advice even if they do not need to do so, which could eventually lead to malnutrition. “Monitoring calorie and nutrient intake in patients who follow dietary advice seems important,” the investigators wrote.

Fermentable oligosaccharides, disaccharides, monosaccharides, and polyols (FODMAPs) such as apples, beans, white bread, and milk are poorly absorbed in the small intestine, which can trigger bouts of gas from colonic bacterial fermentation and diarrhea because of osmotic water transfer into the lumen of the colon. Several recent studies had linked FODMAPs to GI symptoms in IBS, but no prior randomized controlled trial had compared real-world recommendations to follow either a low-FODMAP or traditional IBS diet, the researchers noted (Gastroenterology 2015. doi: 10.1053/j.gastro.2015.07.056).
For the study, they randomized 75 patients who met Rome III IBS criteria to either the low-FODMAP or traditional IBS diet for 4 weeks. They used the IBS severity scoring system (Aliment Pharmacol Ther. 1997;11[2]:395-402) to assess symptomatic response and studied food diaries completed before and after the interventions to understand how closely patients followed the dietary advice.
A total of 67 patients completed the study, including 56 women and 14 men, Ms. Böhn and her associates reported. Both diets led to similarly significant (P < .0001) decreases in IBS symptoms, with no clear differences between them. Half the patients in the low-FODMAP group experienced at least a 50-point improvement in their IBS severity score, compared with 46% of patients in the traditional IBS diet cohort (P = .72).
Food diaries showed that patients adhered well to their diets, the investigators said, but “an unwanted and somewhat surprising finding” was that patients cut their caloric intake – by an average of 442 kcal/day on the low-FODMAP diet and almost 200 kcal/day on the traditional diet. “We hypothesize that even though patients were not advised to reduce calorie intake, receiving detailed dietary advice [to] limit intake of certain food constituents may result in this unwanted effect,” said the investigators. “In the short term, this should not be harmful, but a lesson from this trial is that calorie and nutrient intake needs to be supervised in order to avoid malnutrition if long-term dietary changes are initiated.”
The study was supported by the Swedish Medical Research Council and by the University of Gothenburg’s Marianne and Marcus Wallenberg Foundation, Centre for Person-Centered Care, and Faculty of Medicine. The investigators declared no competing interests.
Advising patients with irritable bowel syndrome to cut their intake of fermentable short-chain carbohydrates improved GI symptoms as much as “traditional” recommendations to reduce meal size, gas-producing foods, insoluble fiber, fat, and caffeine, investigators reported in a randomized, multicenter, single-blinded study that appears in the November issue of Gastroenterology.
“Combining elements from these two strategies might further reduce symptoms of IBS,” said Lena Böhn, a registered dietician at the University of Gothenburg (Sweden) and her associates. Clinicians, however, should be aware that patients may cut calories in response to dietary advice even if they do not need to do so, which could eventually lead to malnutrition. “Monitoring calorie and nutrient intake in patients who follow dietary advice seems important,” the investigators wrote.
Fermentable oligosaccharides, disaccharides, monosaccharides, and polyols (FODMAPs) such as apples, beans, white bread, and milk are poorly absorbed in the small intestine, which can trigger bouts of gas from colonic bacterial fermentation and diarrhea because of osmotic water transfer into the lumen of the colon. Several recent studies had linked FODMAPs to GI symptoms in IBS, but no prior randomized controlled trial had compared real-world recommendations to follow either a low-FODMAP or traditional IBS diet, the researchers noted (Gastroenterology 2015. doi: 10.1053/j.gastro.2015.07.056).
For the study, they randomized 75 patients who met Rome III IBS criteria to either the low-FODMAP or traditional IBS diet for 4 weeks. They used the IBS severity scoring system (Aliment Pharmacol Ther. 1997;11[2]:395-402) to assess symptomatic response and studied food diaries completed before and after the interventions to understand how closely patients followed the dietary advice.
A total of 67 patients completed the study, including 56 women and 14 men, Ms. Böhn and her associates reported. Both diets led to similarly significant (P < .0001) decreases in IBS symptoms, with no clear differences between them. Half the patients in the low-FODMAP group experienced at least a 50-point improvement in their IBS severity score, compared with 46% of patients in the traditional IBS diet cohort (P = .72).
Food diaries showed that patients adhered well to their diets, the investigators said, but “an unwanted and somewhat surprising finding” was that patients cut their caloric intake – by an average of 442 kcal/day on the low-FODMAP diet and almost 200 kcal/day on the traditional diet. “We hypothesize that even though patients were not advised to reduce calorie intake, receiving detailed dietary advice [to] limit intake of certain food constituents may result in this unwanted effect,” said the investigators. “In the short term, this should not be harmful, but a lesson from this trial is that calorie and nutrient intake needs to be supervised in order to avoid malnutrition if long-term dietary changes are initiated.”
The study was supported by the Swedish Medical Research Council and by the University of Gothenburg’s Marianne and Marcus Wallenberg Foundation, Centre for Person-Centered Care, and Faculty of Medicine. The investigators declared no competing interests.
FROM GASTROENTEROLOGY
Key clinical point: Diets low in fermentable short-chain carbohydrates cut irritable bowel disease symptoms as effectively as did “traditional” IBS diets.
Major finding: After 4 weeks, patients in both groups experienced similar and significant (P < .0001) decreases in IBS symptoms.
Data source: A randomized, multicenter, parallel-group, single-blinded study of 75 patients.
Disclosures: The study was supported by the Swedish Medical Research Council and by the University of Gothenburg’s Marianne and Marcus Wallenberg Foundation, Centre for Person-Centered Care, and Faculty of Medicine. The investigators declared no competing interests.

Low-FODMAP and traditional IBS diets found equally effective for symptom reduction
Advising patients with irritable bowel syndrome to cut their intake of fermentable short-chain carbohydrates improved GI symptoms as much as “traditional” recommendations to reduce meal size, gas-producing foods, insoluble fiber, fat, and caffeine, investigators reported in a randomized, multicenter, single-blinded study that appears in the November issue of Gastroenterology.
“Combining elements from these two strategies might further reduce symptoms of IBS,” said Lena Böhn, a registered dietician at the University of Gothenburg (Sweden) and her associates. Clinicians, however, should be aware that patients may cut calories in response to dietary advice even if they do not need to do so, which could eventually lead to malnutrition. “Monitoring calorie and nutrient intake in patients who follow dietary advice seems important,” the investigators wrote.
Fermentable oligosaccharides, disaccharides, monosaccharides, and polyols (FODMAPs) such as apples, beans, white bread, and milk are poorly absorbed in the small intestine, which can trigger bouts of gas from colonic bacterial fermentation and diarrhea because of osmotic water transfer into the lumen of the colon. Several recent studies had linked FODMAPs to GI symptoms in IBS, but no prior randomized controlled trial had compared real-world recommendations to follow either a low-FODMAP or traditional IBS diet, the researchers noted (Gastroenterology 2015. doi: 10.1053/j.gastro.2015.07.056).
For the study, they randomized 75 patients who met Rome III IBS criteria to either the low-FODMAP or traditional IBS diet for 4 weeks. They used the IBS severity scoring system (Aliment Pharmacol Ther. 1997;11[2]:395-402) to assess symptomatic response and studied food diaries completed before and after the interventions to understand how closely patients followed the dietary advice.
A total of 67 patients completed the study, including 56 women and 14 men, Ms. Böhn and her associates reported. Both diets led to similarly significant (P < .0001) decreases in IBS symptoms, with no clear differences between them. Half the patients in the low-FODMAP group experienced at least a 50-point improvement in their IBS severity score, compared with 46% of patients in the traditional IBS diet cohort (P = .72).
Food diaries showed that patients adhered well to their diets, the investigators said, but “an unwanted and somewhat surprising finding” was that patients cut their caloric intake – by an average of 442 kcal/day on the low-FODMAP diet and almost 200 kcal/day on the traditional diet. “We hypothesize that even though patients were not advised to reduce calorie intake, receiving detailed dietary advice [to] limit intake of certain food constituents may result in this unwanted effect,” said the investigators. “In the short term, this should not be harmful, but a lesson from this trial is that calorie and nutrient intake needs to be supervised in order to avoid malnutrition if long-term dietary changes are initiated.”
The study was supported by the Swedish Medical Research Council and by the University of Gothenburg’s Marianne and Marcus Wallenberg Foundation, Centre for Person-Centered Care, and Faculty of Medicine. The investigators declared no competing interests.
FROM GASTROENTEROLOGY
Key clinical point: Diets low in fermentable short-chain carbohydrates cut irritable bowel disease symptoms as effectively as did “traditional” IBS diets.
Major finding: After 4 weeks, patients in both groups experienced similar and significant (P < .0001) decreases in IBS symptoms.
Data source: A randomized, multicenter, parallel-group, single-blinded study of 75 patients.
Disclosures: The study was supported by the Swedish Medical Research Council and by the University of Gothenburg’s Marianne and Marcus Wallenberg Foundation, Centre for Person-Centered Care, and Faculty of Medicine. The investigators declared no competing interests.

No link found between immunosuppression and anal dysplasia in IBD
Immunosuppression did not affect the probability of abnormal anal cytology among patients with inflammatory bowel disease (IBD), according to a prospective, single-center, cross-sectional study of 270 adults published in the November issue of Clinical Gastroenterology and Hepatology.
“Although our study suggested that immunosuppression may not play a role in the risk of dysplasia, a question remains as to whether it contributes to malignant transformation in patients with dysplasia. More research needs to be performed to identify the utility of wider anal dysplasia screening programs in high-risk populations, and the role of HPV vaccine in prevention,” Dr. Shamita Shah of Stanford (Calif.) University and her associates wrote in Clinical Gastroenterology and Hepatology.
Immunosuppression is a cornerstone of IBD management. Because immunosuppressive medications inhibit cell-mediated immunity, patients are at increased risk of opportunistic infections and neoplasias, the researchers noted. One study reported a greater risk of cervical dysplasia among immunosuppressed women with IBD, but the risk of anal dysplasia and cancer in IBD has not been well studied, they said (Clinical Gasteroenterol Hepatol. 2015. doi: 10.1016/j.cgh.2015.05.031).
To examine associations between anal dysplasia and IBD, human papillomavirus infection, and immunosuppression, the researchers analyzed anal Pap tests from 100 IBD patients who were immunosuppressed, 94 IBD patients who were not immunosuppressed, and 76 healthy controls. They identified 19 cases of atypical squamous cells of undetermined significance (ASCUS). The prevalence of ASCUS was somewhat higher among IBD patients (8.8%) than controls (2.6%; P = 0.1), but did not vary based on immunosuppression status or HPV infection. High-risk HPV occurred in 2% of the entire cohort, including 11% of patients with ASCUS and 1.5% of patients with normal Pap cytology (P = .01). High-resolution anoscopy of six patients with ASCUS revealed two cases of condylomatous disease, but no biopsy-positive dysplasia, the investigators reported.
Patients with Crohn’s disease had a significantly higher prevalence of ASCUS than other study participants (P = .02), but patients with ulcerative colitis or unspecified IBD did not, said the researchers. Having had Crohn’s disease for at least 10 years was associated with a fivefold increase in the odds of ASCUS in the multivariate analysis (95% confidence interval, 1.9-13.6), and female sex was also a risk factor (odds ratio, 3.3; P = .047). Notably, women with long-standing Crohn’s disease were almost five times more likely to have abnormal anal Pap cytology than other subjects (P = .0038), the investigators said. “One proposed mechanism for this was a reduction in human defensins in Crohn’s disease patients,” they added. Defensins – antiviral proteins that are found in immune cells – are known to inhibit cutaneous and mucosal HPV, and can be decreased in patients with Crohn’s disease for several reasons, they said. “Although more research is needed in this area, the hindered ability for an IBD patient to defend against viral illness may be responsible for their susceptibility to HPV-related cervical and anal neoplasias.”
Hologic donated the anal Pap tests used in the study. The researchers disclosed no conflicts of interest.
FROM CLINICAL GASTROENTEROLOGY AND HEPATOLOGY
Key clinical point: Immunosuppression did not affect the probability of abnormal anal cytology among patients with inflammatory bowel disease.
Major finding: Almost 9% of patients had atypical squamous cells on anal Pap testing, with no difference in prevalence based on immunosuppression.
Data source: A prospective, single-center, cross-sectional study of 270 subjects.
Disclosures: Hologic donated the anal Pap tests used in the study. The researchers disclosed no conflicts of interest.
Malpractice Counsel: Aneurysm, Falls
Sued If You Do, Sued If You Don’t
A 52-year-old woman presented to the ED with complaints of abdominal pain, vaginal bleeding, and left leg pain. The patient stated that the symptoms, which she had been experiencing over the past few days, were becoming progressively worse. She denied fevers, chills, nausea, vomiting, diarrhea, or constipation. Her surgical history was
remarkable for an appendectomy 30 years prior. The patient was not currently on any medications. Regarding social history, she denied alcohol or tobacco use. She also denied any allergies to medications.
On physical examination, all of the patient’s vital signs were normal. The head, eyes, ears, nose, and throat, and lung and heart examinations were also normal; however, on abdominal examination, she exhibited tenderness throughout the lower abdomen, but without guarding or rebound. There was no costovertebral angle tenderness of the back. The pelvic examination was remarkable for a small amount of blood from the cervical os and a slightly enlarged uterus. The adnexa were normal and without tenderness.

The patient sued both the EP and the hospital, claiming that the CT scan was unnecessary and had it not been performed, she would not have experienced the stroke. The defense asserted that the CT scan with contrast was appropriate given the patient’s symptoms and physical findings, and that the contrast dye used was not the cause of the stroke. The jury awarded the plaintiff $3.6 million.
Discussion
This case is unique in that the EP was sued for ordering a CT scan. In the overwhelming majority of malpractice cases, EPs are sued for not obtaining a certain test—frequently a CT scan. It does not appear the jury in this case was correct in their judgment as there was no conceivable way the EP could have anticipated this type of unusual reaction, especially in a patient with no history of medication allergies.
This jury ruling places EPs in an untenable situation: If they order a test and anything bad happens, they will be sued. If they do not order a test and something bad happens, they will be sued. In legal theory, there must be proximal cause between what the physician did (ie, order the CT scan) and the bad outcome, or negligence (ie, SAH). For this case, the two events seem true-true and unrelated. The contrast dye clearly did not cause the cerebral aneurysm, which was a preexisting condition.
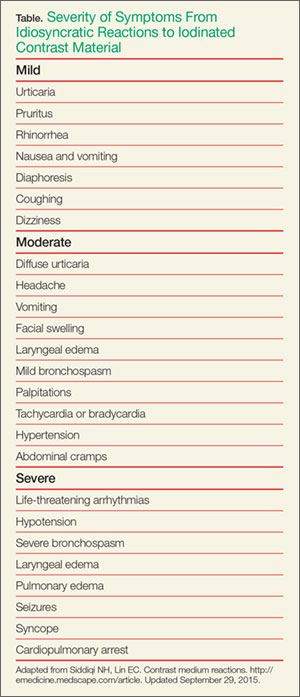
Nonidiosyncratic reactions are due to direct toxic or osmolar effects. Symptoms include bradycardia, hypotension, vasovagal reactions, sensation of warmth, metallic taste in the mouth, and nausea and vomiting.1
Ironically, the majority of adverse reactions to ICM involve hypotension, not hypertension. This includes cardiovascular reactions to ICM, which typically involve bradycardia, peripheral vasodilation, and hypotension.1 The incidence and severity of an adverse reaction to ICM also depends on whether ionic or nonionic ICM was used. (Unfortunately, the type of ICM administered to the patient in this case was not disclosed.)
The incidence and severity of adverse reactions to ICM are less with nonionic compared to ionic ICM. More than 90% of adverse reactions to nonionic ICM are anaphlyactoid.2 In general, adverse reactions occur in 4% to 12% of patients receiving ionic ICM compared to 1% to 3% of those receiving nonionic ICM.2 In a study of more than 300,000 contrast administrations, Katayama et al,3 found the overall risk for severe adverse reaction to be 0.2% for ionic ICM compared to 0.04% for nonionic ICM.
The bottom line in this case is that the patient’s event was a very rare and completely unforeseen result temporally related to the contrast CT scan ordered to evaluate the etiology of this patient’s abdominal pain.
Falls
A 67-year-old woman with a chief complaint of lightheadedness and dizziness was transferred from a dialysis center to the ED by emergency medical services (EMS). She stated that her symptoms came on suddenly right after she had completed her scheduled dialysis.
As the patient was being rolled on a stretcher from the ambulance to the ED entrance, the stretcher collapsed and tipped over, causing the patient to fall and strike her head on the pavement. The patient suffered a severe intraparenchymal brain hemorrhage, requiring intubation, ventilation, and admission to the intensive care unit. On the second day of admission, the patient’s family signed “do not resuscitate” orders and, in accordance with their wishes, life support was withdrawn and the patient died.
The family sued the ambulance company, stating the patient’s death was a direct result of negligent training and supervision of EMS personnel. The plaintiff further claimed the incident was caused by the failure to properly secure a locking mechanism on the stretcher, which caused it to tip. The ambulance company disputed the liability, asserting that what occurred was a tragic accident, not negligence. The jury found in favor of the plaintiff and awarded $1.5 million.
Discussion
While this is not a true ED case since the patient’s fall occurred just outside the ED, it does emphasize the importance of falls and the challenges of fall prevention within the hospital—including the ED. The incidence of falls within hospitals ranges from 1.3 to 9 falls per 1,000 occupied bed days (OBD).1 This incidence, however, is not evenly distributed across hospital departments. Not surprisingly, the highest rates are reported in areas such as geriatric, neurology, and rehabilitation units.1 The highest rates, 17 to 67 per 1,000 OBDs, appear to occur in geropsychiatric units,2,3 and a significant number of such patient falls are serious, with some type of injury resulting from the fall in 30% to 51% of cases.1 The percentage of falls resulting in a fracture ranges from 1% to 3%.1
As previously noted, the ED is not immune to patient falls. A review of one academic medical center ED with 75,000 annual visits found an incidence of 1.3 falls per month, 31% of which resulted in patient injury.4
Some relatively simple steps can be taken to reduce the incidence of falls. For example, identifying patients at high risk of falling (eg, patients who are elderly, confused, dizzy) and ensuring other care-team workers are aware of the risk, can be very helpful.4,5 In addition, brightly colored signs on the stretcher or colored wrist bands indicating the patient is at high-risk for falls helps to engage the entire healthcare team in fall-prevention measures.4 Sitters with high-risk patients can also help minimize fall risk.
Although side rails on hospital beds are intended to increase patient safety, their use is not without controversy. Most hospitals require staff to have side rails up for obvious reasons. Some hospitals, however, are concerned that the use of side rails can cause a fall from a higher position and increase the risk of injury when a patient attempts to get out of bed. Additional important steps include ensuring that all wet surfaces are quickly identified and cleaned, and making sure everyone is aware of the importance of fall-prevention measures.
The employment of the abovementioned fall-prevention measures is especially important in relation to the aging US population. As the number of elderly patients in the United States continues to grow, the risk of patient falls is expected to increase. Therefore, hospitals should be proactive in implementing preventive measures to reduce the risk of patient falls and injury.
- Sued If You Do, Sued If You Don't
- Siddiqi NH, Lin EC. Contrast medium reactions. http://emedicine.medscape.com/article. Updated September 29, 2015. Accessed October 8, 2015.
- Cochran ST. Anaphylactoid reactions to radiocontrast media. Curr Allergy Asthma Rep. 2005;5(1):28-31.
- Katayama H, Yamaguchi K, Kozuka T, Takashima T, Seez P, Matsuura K. Adverse reactions to ionic and nonionic contrast media. A report from the Japanese Committee on the Safety of Contrast Media. Radiology. 1990;175(3):621-128.
- Falls
- Oliver D, Healey F, Haines TP. Preventing falls and fall-related injuries in hospitals. Clin Geriatr Med. 2010;26(4):645-692.
- Nyberg L, Gustafson Y, Janson A, Sandman PO, Eriksson S. Incidence of falls in three different types of geriatric care. A Swedish prospective study. Scand J Soc Med. 1997;25(1):8-13.
- Weintraub D, Spurlock M. Change in the rate of restraint use and falls on a psychogeriatric inpatient unit: impact of the health care financing administration’s new restraint and seclusion standards for hospitals. J Geriatr Psychiatry Neurol. 2002;15(2):91-94.
- Rosenthal A. Preventing falls in the emergency department: a program that works (Abstract). Virginia Henderson Global Nursing e-Repository Web site. http://www.nursinglibrary.org/vhl/handle/10755/162669. Accessed October 7, 2015.
- Alexander D, Kinsley TL, Waszinski C. Journey to a safe environment: fall precaution in an emergency department at a level I trauma center. J Emerg Nurs. 2013;39(4):346-352.
Sued If You Do, Sued If You Don’t
A 52-year-old woman presented to the ED with complaints of abdominal pain, vaginal bleeding, and left leg pain. The patient stated that the symptoms, which she had been experiencing over the past few days, were becoming progressively worse. She denied fevers, chills, nausea, vomiting, diarrhea, or constipation. Her surgical history was
remarkable for an appendectomy 30 years prior. The patient was not currently on any medications. Regarding social history, she denied alcohol or tobacco use. She also denied any allergies to medications.
On physical examination, all of the patient’s vital signs were normal. The head, eyes, ears, nose, and throat, and lung and heart examinations were also normal; however, on abdominal examination, she exhibited tenderness throughout the lower abdomen, but without guarding or rebound. There was no costovertebral angle tenderness of the back. The pelvic examination was remarkable for a small amount of blood from the cervical os and a slightly enlarged uterus. The adnexa were normal and without tenderness.
The patient sued both the EP and the hospital, claiming that the CT scan was unnecessary and had it not been performed, she would not have experienced the stroke. The defense asserted that the CT scan with contrast was appropriate given the patient’s symptoms and physical findings, and that the contrast dye used was not the cause of the stroke. The jury awarded the plaintiff $3.6 million.
Discussion
This case is unique in that the EP was sued for ordering a CT scan. In the overwhelming majority of malpractice cases, EPs are sued for not obtaining a certain test—frequently a CT scan. It does not appear the jury in this case was correct in their judgment as there was no conceivable way the EP could have anticipated this type of unusual reaction, especially in a patient with no history of medication allergies.
This jury ruling places EPs in an untenable situation: If they order a test and anything bad happens, they will be sued. If they do not order a test and something bad happens, they will be sued. In legal theory, there must be proximal cause between what the physician did (ie, order the CT scan) and the bad outcome, or negligence (ie, SAH). For this case, the two events seem true-true and unrelated. The contrast dye clearly did not cause the cerebral aneurysm, which was a preexisting condition.
Nonidiosyncratic reactions are due to direct toxic or osmolar effects. Symptoms include bradycardia, hypotension, vasovagal reactions, sensation of warmth, metallic taste in the mouth, and nausea and vomiting.1
Ironically, the majority of adverse reactions to ICM involve hypotension, not hypertension. This includes cardiovascular reactions to ICM, which typically involve bradycardia, peripheral vasodilation, and hypotension.1 The incidence and severity of an adverse reaction to ICM also depends on whether ionic or nonionic ICM was used. (Unfortunately, the type of ICM administered to the patient in this case was not disclosed.)
The incidence and severity of adverse reactions to ICM are less with nonionic compared to ionic ICM. More than 90% of adverse reactions to nonionic ICM are anaphlyactoid.2 In general, adverse reactions occur in 4% to 12% of patients receiving ionic ICM compared to 1% to 3% of those receiving nonionic ICM.2 In a study of more than 300,000 contrast administrations, Katayama et al,3 found the overall risk for severe adverse reaction to be 0.2% for ionic ICM compared to 0.04% for nonionic ICM.
The bottom line in this case is that the patient’s event was a very rare and completely unforeseen result temporally related to the contrast CT scan ordered to evaluate the etiology of this patient’s abdominal pain.
Falls
A 67-year-old woman with a chief complaint of lightheadedness and dizziness was transferred from a dialysis center to the ED by emergency medical services (EMS). She stated that her symptoms came on suddenly right after she had completed her scheduled dialysis.
As the patient was being rolled on a stretcher from the ambulance to the ED entrance, the stretcher collapsed and tipped over, causing the patient to fall and strike her head on the pavement. The patient suffered a severe intraparenchymal brain hemorrhage, requiring intubation, ventilation, and admission to the intensive care unit. On the second day of admission, the patient’s family signed “do not resuscitate” orders and, in accordance with their wishes, life support was withdrawn and the patient died.
The family sued the ambulance company, stating the patient’s death was a direct result of negligent training and supervision of EMS personnel. The plaintiff further claimed the incident was caused by the failure to properly secure a locking mechanism on the stretcher, which caused it to tip. The ambulance company disputed the liability, asserting that what occurred was a tragic accident, not negligence. The jury found in favor of the plaintiff and awarded $1.5 million.
Discussion
While this is not a true ED case since the patient’s fall occurred just outside the ED, it does emphasize the importance of falls and the challenges of fall prevention within the hospital—including the ED. The incidence of falls within hospitals ranges from 1.3 to 9 falls per 1,000 occupied bed days (OBD).1 This incidence, however, is not evenly distributed across hospital departments. Not surprisingly, the highest rates are reported in areas such as geriatric, neurology, and rehabilitation units.1 The highest rates, 17 to 67 per 1,000 OBDs, appear to occur in geropsychiatric units,2,3 and a significant number of such patient falls are serious, with some type of injury resulting from the fall in 30% to 51% of cases.1 The percentage of falls resulting in a fracture ranges from 1% to 3%.1
As previously noted, the ED is not immune to patient falls. A review of one academic medical center ED with 75,000 annual visits found an incidence of 1.3 falls per month, 31% of which resulted in patient injury.4
Some relatively simple steps can be taken to reduce the incidence of falls. For example, identifying patients at high risk of falling (eg, patients who are elderly, confused, dizzy) and ensuring other care-team workers are aware of the risk, can be very helpful.4,5 In addition, brightly colored signs on the stretcher or colored wrist bands indicating the patient is at high-risk for falls helps to engage the entire healthcare team in fall-prevention measures.4 Sitters with high-risk patients can also help minimize fall risk.
Although side rails on hospital beds are intended to increase patient safety, their use is not without controversy. Most hospitals require staff to have side rails up for obvious reasons. Some hospitals, however, are concerned that the use of side rails can cause a fall from a higher position and increase the risk of injury when a patient attempts to get out of bed. Additional important steps include ensuring that all wet surfaces are quickly identified and cleaned, and making sure everyone is aware of the importance of fall-prevention measures.
The employment of the abovementioned fall-prevention measures is especially important in relation to the aging US population. As the number of elderly patients in the United States continues to grow, the risk of patient falls is expected to increase. Therefore, hospitals should be proactive in implementing preventive measures to reduce the risk of patient falls and injury.
- Sued If You Do, Sued If You Don't
- Siddiqi NH, Lin EC. Contrast medium reactions. http://emedicine.medscape.com/article. Updated September 29, 2015. Accessed October 8, 2015.
- Cochran ST. Anaphylactoid reactions to radiocontrast media. Curr Allergy Asthma Rep. 2005;5(1):28-31.
- Katayama H, Yamaguchi K, Kozuka T, Takashima T, Seez P, Matsuura K. Adverse reactions to ionic and nonionic contrast media. A report from the Japanese Committee on the Safety of Contrast Media. Radiology. 1990;175(3):621-128.
- Falls
- Oliver D, Healey F, Haines TP. Preventing falls and fall-related injuries in hospitals. Clin Geriatr Med. 2010;26(4):645-692.
- Nyberg L, Gustafson Y, Janson A, Sandman PO, Eriksson S. Incidence of falls in three different types of geriatric care. A Swedish prospective study. Scand J Soc Med. 1997;25(1):8-13.
- Weintraub D, Spurlock M. Change in the rate of restraint use and falls on a psychogeriatric inpatient unit: impact of the health care financing administration’s new restraint and seclusion standards for hospitals. J Geriatr Psychiatry Neurol. 2002;15(2):91-94.
- Rosenthal A. Preventing falls in the emergency department: a program that works (Abstract). Virginia Henderson Global Nursing e-Repository Web site. http://www.nursinglibrary.org/vhl/handle/10755/162669. Accessed October 7, 2015.
- Alexander D, Kinsley TL, Waszinski C. Journey to a safe environment: fall precaution in an emergency department at a level I trauma center. J Emerg Nurs. 2013;39(4):346-352.

Pancreas transplant for diabetes mellitus
Pancreas transplant is the only long-term diabetes treatment that consistently results in normal hemoglobin A1c levels without the risk of severe hypoglycemia. Additionally, pancreas transplant may prevent, halt, or even reverse the complications of diabetes.
Here, we explore the indications, options, and outcomes of pancreas transplant as a treatment for diabetes mellitus.
DIABETES IS COMMON, AND OFTEN NOT WELL CONTROLLED
Diabetes mellitus affects more than 25 million people in the United States (8.3% of the population) and is the leading cause of kidney failure, nontraumatic lower-limb amputation, and adult-onset blindness. In 2007, nearly $116 billion was spent on diabetes treatment, not counting another $58 billion in indirect costs such as disability, work loss, and premature death.1
Despite the tremendous expenditure in human, material, and financial resources, only about 50% of patients achieve their diabetes treatment goals. In 2013, a large US population-based study2 reported that 52.2% of patients were achieving the American Diabetes Association treatment goal of hemoglobin A1c lower than 7%. A similar study in South Korea3 found that 45.6% were at this goal.
Most of the patients in these studies had type 2 diabetes, and the data suggested that attaining glycemic goals is more difficult in insulin-treated patients. Studies of patients with type 1 diabetes found hemoglobin A1c levels lower than 7% in only 8.1% of hospitalized patients with type 1 diabetes, and in only 13% in an outpatient diabetes clinic.4,5
YET RATES OF PANCREAS TRANSPLANT ARE DECLINING
Pancreas transplant was first performed more than 40 years ago at the University of Minnesota.6 Since then, dramatic changes in immunosuppression, organ preservation, surgical technique, and donor and recipient selection have brought about significant progress.
Currently, more than 13,000 patients are alive with a functioning pancreas allograft. After reaching a peak in 2004, the annual number of pancreas transplants performed in the United States has declined steadily, whereas the procedure continues to increase in popularity outside North America.7 The primary reason for the decline is recognition of donor factors that lead to success—surgeons are refusing to transplant organs they might have accepted previously, because experience suggests they would yield poor results. In the United States, 1,043 pancreas transplants were performed in 2012, and more than 3,100 patients were on the waiting list.8
Islet cell transplant—a different procedure involving harvesting, encapsulating, and implanting insulin-producing beta cells—has not gained widespread application due to very low long-term success rates.
THREE CATEGORIES OF PANCREAS TRANSPLANT

Pancreas transplant can be categorized according to whether the patient is also receiving or has already received a kidney graft (Table 1).
Simultaneous kidney and pancreas transplant is performed in patients who have type 1 diabetes with advanced chronic kidney disease due to diabetic nephropathy. This remains the most commonly performed type, accounting for 79% of all pancreas transplants in 2012.8
Pancreas-after-kidney transplant is most often done after a living-donor kidney transplant. This procedure accounted for most of the increase in pancreas transplants during the first decade of the 2000s. However, the number of these procedures has steadily decreased since 2004, and in 2012 accounted for only 12% of pancreas transplants.8
Pancreas transplant alone is performed in nonuremic diabetic patients who have labile blood sugar control. Performed in patients with preserved renal function but severe complications of “brittle” diabetes, such as hypoglycemic unawareness, this type accounts for 8% of pancreas transplants.9
Indications for pancreas transplant
A small number of these procedures are done for indications unrelated to diabetes mellitus. In most of these cases, the pancreas is transplanted as part of a multivisceral transplant to facilitate the technical (surgical) aspect of the procedure—the pancreas, liver, stomach, gallbladder, and part of the intestines are transplanted en bloc to maintain the native vasculature. Very infrequently, pancreas transplant is done to replace exocrine pancreatic function.
A small, select group of patients with type 2 diabetes and low body mass index (BMI) may be eligible for pancreas transplant, and they accounted for 8.2% of active candidates in 2012.8 However, most pancreas transplants are performed in patients with type 1 diabetes.
WHAT MAKES A GOOD ALLOGRAFT?
Pancreas allografts are procured as whole organs from brain-dead organ donors. Relatively few pancreas allografts (3.1% in 2012) are from cardiac-death donors, because of concern about warm ischemic injury during the period of circulatory arrest.8

Proper donor selection is critical to the success of pancreas transplant, as donor factors including medical history, age, BMI, and cause of death can significantly affect the outcome. In general, transplant of a pancreas allograft from a young donor (age < 30) with excellent organ function, low BMI, and traumatic cause of death provides the best chance of success.
The Pancreas Donor Risk Index (PDRI)10 was developed after analysis of objective donor criteria, transplant type, and ischemic time in grafts transplanted between 2000 and 2006. One-year graft survival was directly related to the PDRI and ranged between 77% and 87% in recipients of “standard” pancreas allografts (PDRI score of 1.0). Use of grafts from the highest (worst) three quintiles of PDRI (PDRI score > 1.16) was associated with 1-year graft survival rates of 67% to 82%, significantly inferior to that seen with “higher- quality” grafts, again emphasizing the need for rigorous donor selection.10
In addition to these objective measures, visual assessment of pancreas quality at the time of procurement remains an equally important predictor of success. Determination of subjective features, such as fatty infiltration and glandular fibrosis, requires surgical experience developed over several years. In a 2010 analysis, dissatisfaction with the quality of the donor graft on inspection accounted for more than 80% of refusals of potential pancreas donors.11 These studies illustrate an ill-defined aspect of pancreas transplant, ie, even when the pancreas donor is perceived to be suitable, the outcome may be markedly different.
SURGICAL COMPLICATIONS
Surgical complications have long been considered a limiting factor in the growth of pancreas transplant. Technical failure or loss of the graft within 90 days is most commonly due to graft thrombosis, leakage of the enteric anastomosis, or severe peripancreatic infection. The rate of technical failure has declined across all recipient categories and is currently about 9%.8
DO RECIPIENT FACTORS AFFECT OUTCOMES?
As mentioned above, the PDRI identifies donor factors that influence the 1-year graft survival rate. Recipient factors are also thought to play a role, although the influence of these factors has not been consistently demonstrated.
Humar et al15 found that recipient obesity (defined in this study as BMI > 25 kg/m2) and donor age over 40 were risk factors for early laparotomy after pancreas transplant.15 Moreover, patients undergoing early laparotomy had poorer graft survival outcomes.
This finding was reinforced by an analysis of 5,725 primary simultaneous pancreas-kidney recipients between 2000 and 2007. Obesity (BMI 30 ≥ kg/m2) was associated with increased rates of patient death, pancreas graft loss, and kidney graft loss at 3 years.16
More recently, Finger et al17 did not find a statistically significant association between recipient BMI and technical failure, but they did notice a trend toward increased graft loss with a BMI greater than 25 kg/m2. Similarly, others have not found a clear adverse association between recipient BMI and pancreas graft survival.
Intuitively, obesity and other recipient factors such as age, vascular disease, duration of diabetes, and dialysis should influence pancreas graft survival but have not been shown in analyses to carry an adverse effect.18 The inability to consistently find adverse effects of recipient characteristics is most likely due to the relative similarity between the vast majority of pancreas transplant recipients and the relatively small numbers of adverse events. In 98 consecutive pancreas transplants at our center between 2009 and 2014, the technical loss rate was 1.8% (unpublished data).
Acute rejection most commonly occurs during the first year and is usually reversible. More than 1 year after transplant, graft loss is due to chronic rejection, and death is usually from underlying cardiovascular disease.
The immunosuppressive regimens used in pancreas transplant are similar to those in kidney transplant. Since the pancreas is considered to be more immunogenic than other organs, most centers employ a strategy of induction immunosuppression with T-cell–depleting or interleukin 2-receptor antibodies. Maintenance immunosuppression consists of a calcineurin inhibitor (tacrolimus or cyclosporine), an antimetabolite (mycophenolate), and a corticosteroid.8
Immunosuppressive complications occur at a rate similar to that seen in other solid-organ transplants and include an increased risk of opportunistic infection and malignancy. The risk of these complications must be balanced against the patient’s risk of health decline with dialysis and insulin-based therapies.
OVERALL OUTCOMES ARE GOOD
The success rate of pancreas transplant is currently at its highest since the inception of the procedure. The unadjusted patient survival rate for all groups is over 96% at 1 year, and over 80% at 5 years.8 One-year patient survival after pancreas transplant alone, at better than 96%, is the highest of all organ transplant procedures.9
Several recently published single-center reviews of pancreas transplant since 2000 report patient survival rates of 96% to 100% at 1 year and 88% to 100% at 5 years.19–22 This variability is likely closely linked to donor and recipient selection, as centers performing smaller numbers of transplants tend to be more selective and, in turn, report higher patient survival rates.19,21
Long-term patient survival outcomes can be gathered from larger, registry-based reviews, accepting limitations in assessing causes of patient death. Siskind et al23 analyzed the outcomes of 20,854 US pancreas transplants done between 1996 and 2012 and found the 10-year patient survival rate ranged from 43% to 77% and was highly dependent on patient age at the time of the procedure.23 Patient survival after transplant must be balanced against the generally poor long-term survival prospects of diabetic patients on dialysis.
By type of transplant, pancreas graft survival rates at 1 year are 89% for simultaneous pancreas-kidney transplant, 86% for pancreas-after-kidney transplant, and 84% for pancreas-alone transplant. Graft survival rates at 5 years are 71% for simultaneous pancreas-kidney transplant, 65% for pancreas-after-kidney transplant, and 58% for pancreas-alone transplant.8,9
Simultaneous pancreas-kidney transplant has been shown to improve the survival rate compared with cadaveric kidney transplant alone in patients with type 1 diabetes and chronic kidney disease.24,25 The survival benefit of isolated pancreas transplant (after kidney transplant and alone) is not evident at 4-year follow-up compared with patients on the waiting list. However, the benefit for the individual patient must be considered by weighing the incapacities experienced with insulin-based treatments against the risks of surgery and immunosuppression.26,27 For patients who have experienced frequent and significant hypoglycemic episodes, particularly those requiring third-party assistance, pancreas transplant can be a lifesaving procedure.
Effects on secondary diabetic complications
Notwithstanding the effect on the patient’s life span, data from several studies of long-term pancreas transplant recipients suggest that secondary diabetic complications can be halted or even improved. Most of these studies examined the effect of restoring euglycemia in nephropathy and the subsequent influence on renal function.
Effect on renal function. Kleinclauss et al28 examined renal allograft function in type 1 diabetic recipients of living-donor kidney transplants. Comparing kidney allograft survival and function in patients who received a subsequent pancreas-after-kidney transplant vs those who did not, graft survival was superior after 5 years, and the estimated glomerular filtration rate was 10 mL/min higher in pancreas-after-kidney recipients.28 This improvement in renal function was not seen immediately after the pancreas transplant but became evident more than 4 years after establishment of normoglycemia. Somewhat similarly, reversal of diabetic changes in native kidney biopsies has been seen 10 years after pancreas transplant.29
Effect on neuropathy. In other studies, reversal of autonomic neuropathy and hypoglycemic unawareness and improvements in peripheral sensory-motor neuropathy have also been observed.30–32
Effect on retinopathy. Improvements in early-stage nonproliferative diabetic retinopathy and laser-treated proliferative lesions have been seen, even within short periods of follow-up.33 Other groups have shown a significantly higher proportion of improvement or stability of advanced diabetic retinopathy at 3 years after simultaneous pancreas-kidney transplant, compared with kidney transplant alone in patients with type 1 diabetes.34
Effect on heart disease. Salutary effects on cardiovascular risk factors and amelioration of cardiac morphology and functional cardiac indices have been seen within the first posttransplant year.35 Moreover, with longer follow-up (nearly 4 years), simultaneous pancreas-kidney recipients with functioning pancreas grafts were found to have less progression of coronary atherosclerosis than simultaneous pancreas-kidney recipients with early pancreas graft loss.36 These data provide a potential pathophysiologic mechanism for the long-term survival advantage seen in uremic type 1 diabetic patients undergoing simultaneous pancreas-kidney transplant.
In the aggregate, these findings suggest that, in the absence of surgical and immunosuppression-related complications, a functioning pancreas allograft can alter the progress of diabetic complications. As an extension of these results, pancreas transplant done earlier in the course of diabetes may have an even greater impact.
- Centers for Disease Control and Prevention (CDC). National diabetes fact sheet: national estimates and general information on diabetes and prediabetes in the United States, 2011. www.cdc.gov/diabetes/pubs/pdf/ndfs_2011.pdf. Accessed August 12, 2015.
- Ali MK, Bullard KM, Saaddine JB, Cowie CC, Imperatore G, Gregg EW. Achievement of goals in US diabetes care, 1999–2010. N Engl J Med 2013; 368:1613–1624.
- Jeon JY, Kim DJ, Ko SH, et al; Taskforce Team of Diabetes Fact Sheet of the Korean Diabetes Association. Current status of glycemic control of patients with diabetes in Korea: the fifth Korea national health and nutrition examination survey. Diabetes Metab J 2014; 38:197–203.
- Govan L, Wu O, Briggs A, et al; Scottish Diabetes Research Network Epidemiology Group. Achieved levels of HbA1c and likelihood of hospital admission in people with type 1 diabetes in the Scottish population: a study from the Scottish Diabetes Research Network Epidemiology Group. Diabetes Care 2011; 34:1992–1997.
- Bryant W, Greenfield JR, Chisholm DJ, Campbell LV. Diabetes guidelines: easier to preach than to practise? Med J Aust 2006; 185:305–309.
- Kelly WD, Lillehei RC, Merkel FK, Idezuki Y, Goetz FC. Allotransplantation of the pancreas and duodenum along with the kidney in diabetic nephropathy. Surgery 1967; 61:827–837.
- Gruessner AC, Gruessner RW. Pancreas transplant outcomes for United States and non United States cases as reported to the United Network for Organ Sharing and the International Pancreas Transplant Registry as of December 2011. Clin Transpl 2012: 23–40.
- Israni AK, Skeans MA, Gustafson SK, et al. OPTN/SRTR 2012 Annual Data Report: pancreas. Am J Transplant 2014; 14(suppl 1):45–68
- Gruessner RW, Gruessner AC. Pancreas transplant alone: a procedure coming of age. Diabetes Care 2013; 36:2440–2447.
- Axelrod DA, Sung RS, Meyer KH, Wolfe RA, Kaufman DB. Systematic evaluation of pancreas allograft quality, outcomes and geographic variation in utilization. Am J Transplant 2010; 10:837–845.
- Wiseman AC, Wainright JL, Sleeman E, et al. An analysis of the lack of donor pancreas utilization from younger adult organ donors. Transplantation 2010; 90:475–480.
- Gruessner RW, Gruessner AC. The current state of pancreas transplantation. Nat Rev Endocrinol 2013; 9:555–562.
- Gunasekaran G, Wee A, Rabets J, Winans C, Krishnamurthi V. Duodenoduodenostomy in pancreas transplantation. Clin Transplant 2012; 26:550–557.
- Sollinger HW, Odorico JS, Becker YT, D’Alessandro AM, Pirsch JD. One thousand simultaneous pancreas-kidney transplants at a single center with 22-year follow-up. Ann Surg 2009; 250:618–630.
- Humar A, Kandaswamy R, Granger D, Gruessner RW, Gruessner AC, Sutherland DE. Decreased surgical risks of pancreas transplantation in the modern era. Ann Surg 2000; 231:269–275.
- Sampaio MS, Reddy PN, Kuo HT, et al. Obesity was associated with inferior outcomes in simultaneous pancreas kidney transplant. Transplantation 2010; 89:1117–1125.
- Finger EB, Radosevich DM, Dunn TB, et al. A composite risk model for predicting technical failure in pancreas transplantation. Am J Transplant 2013; 13:1840–1849.
- Fridell JA, Mangus RS, Taber TE, et al. Growth of a nation part II: impact of recipient obesity on whole-organ pancreas transplantation. Clin Transplant 2011; 25:E366–E374.
- Tai DS, Hong J, Busuttil RW, Lipshutz GS. Low rates of short- and long-term graft loss after kidney-pancreas transplant from a single center. JAMA Surg 2013; 148:368–373.
- Bazerbachi F, Selzner M, Marquez MA, et al. Pancreas-after-kidney versus synchronous pancreas-kidney transplantation: comparison of intermediate-term results. Transplantation 2013; 95:489–494.
- Laftavi MR, Pankewycz O, Gruessner A, et al. Long-term outcomes of pancreas after kidney transplantation in small centers: is it justified? Transplant Proc 2014; 46:1920–1923.
- Stratta RJ, Farney AC, Orlando G, Farooq U, Al-Shraideh Y, Rogers J. Similar results with solitary pancreas transplantation compared with simultaneous pancreas-kidney transplantation in the new millennium. Transplant Proc 2014; 46:1924–1927.
- Siskind E, Maloney C, Akerman M, et al. An analysis of pancreas transplantation outcomes based on age groupings—an update of the UNOS database. Clin Transplant 2014; 28:990–994.
- Ojo AO, Meier-Kriesche HU, Hanson JA, et al. The impact of simultaneous pancreas-kidney transplantation on long-term patient survival. Transplantation 2001; 71:82–90.
- Reddy KS, Stablein D, Taranto S, et al. Long-term survival following simultaneous kidney-pancreas transplantation versus kidney transplantation alone in patients with type 1 diabetes mellitus and renal failure. Am J Kidney Dis 2003; 41:464–470.
- Venstrom JM, McBride MA, Rother KI, Hirshberg B, Orchard TJ, Harlan DM. Survival after pancreas transplantation in patients with diabetes and preserved kidney function. JAMA 2003; 290:2817–2823.
- Gruessner RW, Sutherland DE, Gruessner AC. Mortality assessment for pancreas transplants. Am J Transplant 2004; 4:2018–2026.
- Kleinclauss F, Fauda M, Sutherland DE, et al. Pancreas after living donor kidney transplants in diabetic patients: impact on long-term kidney graft function. Clin Transplant 2009; 23:437–446.
- Fioretto P, Steffes MW, Sutherland DE, Goetz FC, Mauer M. Reversal of lesions of diabetic nephropathy after pancreas transplantation. N Engl J Med 1998; 339:69–75.
- Landgraf R. Impact of pancreas transplantation on diabetic secondary complications and quality of life. Diabetologia 1996; 39:1415–1424.
- Robertson RP. Update on transplanting beta cells for reversing type 1 diabetes. Endocrinol Metab Clin North Am 2010; 39:655–667.
- Robertson RP, Holohan TV, Genuth S. Therapeutic controversy: pancreas transplantation for type I diabetes. J Clin Endocrinol Metab 1998; 83:1868–1674.
- Giannarelli R, Coppelli A, Sartini MS, et al. Pancreas transplant alone has beneficial effects on retinopathy in type 1 diabetic patients. Diabetologia 2006; 49:2977–2982.
- Koznarová R, Saudek F, Sosna T, et al. Beneficial effect of pancreas and kidney transplantation on advanced diabetic retinopathy. Cell Transplant 2000; 9:903–908.
- Coppelli A, Giannarelli R, Mariotti R, et al. Pancreas transplant alone determines early improvement of cardiovascular risk factors and cardiac function in type 1 diabetic patients. Transplantation 2003; 76:974–976.
- Jukema JW, Smets YF, van der Pijl JW, et al. Impact of simultaneous pancreas and kidney transplantation on progression of coronary atherosclerosis in patients with end-stage renal failure due to type 1 diabetes. Diabetes Care 2002; 25:906–911.
Pancreas transplant is the only long-term diabetes treatment that consistently results in normal hemoglobin A1c levels without the risk of severe hypoglycemia. Additionally, pancreas transplant may prevent, halt, or even reverse the complications of diabetes.
Here, we explore the indications, options, and outcomes of pancreas transplant as a treatment for diabetes mellitus.
DIABETES IS COMMON, AND OFTEN NOT WELL CONTROLLED
Diabetes mellitus affects more than 25 million people in the United States (8.3% of the population) and is the leading cause of kidney failure, nontraumatic lower-limb amputation, and adult-onset blindness. In 2007, nearly $116 billion was spent on diabetes treatment, not counting another $58 billion in indirect costs such as disability, work loss, and premature death.1
Despite the tremendous expenditure in human, material, and financial resources, only about 50% of patients achieve their diabetes treatment goals. In 2013, a large US population-based study2 reported that 52.2% of patients were achieving the American Diabetes Association treatment goal of hemoglobin A1c lower than 7%. A similar study in South Korea3 found that 45.6% were at this goal.
Most of the patients in these studies had type 2 diabetes, and the data suggested that attaining glycemic goals is more difficult in insulin-treated patients. Studies of patients with type 1 diabetes found hemoglobin A1c levels lower than 7% in only 8.1% of hospitalized patients with type 1 diabetes, and in only 13% in an outpatient diabetes clinic.4,5
YET RATES OF PANCREAS TRANSPLANT ARE DECLINING
Pancreas transplant was first performed more than 40 years ago at the University of Minnesota.6 Since then, dramatic changes in immunosuppression, organ preservation, surgical technique, and donor and recipient selection have brought about significant progress.
Currently, more than 13,000 patients are alive with a functioning pancreas allograft. After reaching a peak in 2004, the annual number of pancreas transplants performed in the United States has declined steadily, whereas the procedure continues to increase in popularity outside North America.7 The primary reason for the decline is recognition of donor factors that lead to success—surgeons are refusing to transplant organs they might have accepted previously, because experience suggests they would yield poor results. In the United States, 1,043 pancreas transplants were performed in 2012, and more than 3,100 patients were on the waiting list.8
Islet cell transplant—a different procedure involving harvesting, encapsulating, and implanting insulin-producing beta cells—has not gained widespread application due to very low long-term success rates.
THREE CATEGORIES OF PANCREAS TRANSPLANT
Pancreas transplant can be categorized according to whether the patient is also receiving or has already received a kidney graft (Table 1).
Simultaneous kidney and pancreas transplant is performed in patients who have type 1 diabetes with advanced chronic kidney disease due to diabetic nephropathy. This remains the most commonly performed type, accounting for 79% of all pancreas transplants in 2012.8
Pancreas-after-kidney transplant is most often done after a living-donor kidney transplant. This procedure accounted for most of the increase in pancreas transplants during the first decade of the 2000s. However, the number of these procedures has steadily decreased since 2004, and in 2012 accounted for only 12% of pancreas transplants.8
Pancreas transplant alone is performed in nonuremic diabetic patients who have labile blood sugar control. Performed in patients with preserved renal function but severe complications of “brittle” diabetes, such as hypoglycemic unawareness, this type accounts for 8% of pancreas transplants.9
Indications for pancreas transplant
A small number of these procedures are done for indications unrelated to diabetes mellitus. In most of these cases, the pancreas is transplanted as part of a multivisceral transplant to facilitate the technical (surgical) aspect of the procedure—the pancreas, liver, stomach, gallbladder, and part of the intestines are transplanted en bloc to maintain the native vasculature. Very infrequently, pancreas transplant is done to replace exocrine pancreatic function.
A small, select group of patients with type 2 diabetes and low body mass index (BMI) may be eligible for pancreas transplant, and they accounted for 8.2% of active candidates in 2012.8 However, most pancreas transplants are performed in patients with type 1 diabetes.
WHAT MAKES A GOOD ALLOGRAFT?
Pancreas allografts are procured as whole organs from brain-dead organ donors. Relatively few pancreas allografts (3.1% in 2012) are from cardiac-death donors, because of concern about warm ischemic injury during the period of circulatory arrest.8
Proper donor selection is critical to the success of pancreas transplant, as donor factors including medical history, age, BMI, and cause of death can significantly affect the outcome. In general, transplant of a pancreas allograft from a young donor (age < 30) with excellent organ function, low BMI, and traumatic cause of death provides the best chance of success.
The Pancreas Donor Risk Index (PDRI)10 was developed after analysis of objective donor criteria, transplant type, and ischemic time in grafts transplanted between 2000 and 2006. One-year graft survival was directly related to the PDRI and ranged between 77% and 87% in recipients of “standard” pancreas allografts (PDRI score of 1.0). Use of grafts from the highest (worst) three quintiles of PDRI (PDRI score > 1.16) was associated with 1-year graft survival rates of 67% to 82%, significantly inferior to that seen with “higher- quality” grafts, again emphasizing the need for rigorous donor selection.10
In addition to these objective measures, visual assessment of pancreas quality at the time of procurement remains an equally important predictor of success. Determination of subjective features, such as fatty infiltration and glandular fibrosis, requires surgical experience developed over several years. In a 2010 analysis, dissatisfaction with the quality of the donor graft on inspection accounted for more than 80% of refusals of potential pancreas donors.11 These studies illustrate an ill-defined aspect of pancreas transplant, ie, even when the pancreas donor is perceived to be suitable, the outcome may be markedly different.
SURGICAL COMPLICATIONS
Surgical complications have long been considered a limiting factor in the growth of pancreas transplant. Technical failure or loss of the graft within 90 days is most commonly due to graft thrombosis, leakage of the enteric anastomosis, or severe peripancreatic infection. The rate of technical failure has declined across all recipient categories and is currently about 9%.8
DO RECIPIENT FACTORS AFFECT OUTCOMES?
As mentioned above, the PDRI identifies donor factors that influence the 1-year graft survival rate. Recipient factors are also thought to play a role, although the influence of these factors has not been consistently demonstrated.
Humar et al15 found that recipient obesity (defined in this study as BMI > 25 kg/m2) and donor age over 40 were risk factors for early laparotomy after pancreas transplant.15 Moreover, patients undergoing early laparotomy had poorer graft survival outcomes.
This finding was reinforced by an analysis of 5,725 primary simultaneous pancreas-kidney recipients between 2000 and 2007. Obesity (BMI 30 ≥ kg/m2) was associated with increased rates of patient death, pancreas graft loss, and kidney graft loss at 3 years.16
More recently, Finger et al17 did not find a statistically significant association between recipient BMI and technical failure, but they did notice a trend toward increased graft loss with a BMI greater than 25 kg/m2. Similarly, others have not found a clear adverse association between recipient BMI and pancreas graft survival.
Intuitively, obesity and other recipient factors such as age, vascular disease, duration of diabetes, and dialysis should influence pancreas graft survival but have not been shown in analyses to carry an adverse effect.18 The inability to consistently find adverse effects of recipient characteristics is most likely due to the relative similarity between the vast majority of pancreas transplant recipients and the relatively small numbers of adverse events. In 98 consecutive pancreas transplants at our center between 2009 and 2014, the technical loss rate was 1.8% (unpublished data).
Acute rejection most commonly occurs during the first year and is usually reversible. More than 1 year after transplant, graft loss is due to chronic rejection, and death is usually from underlying cardiovascular disease.
The immunosuppressive regimens used in pancreas transplant are similar to those in kidney transplant. Since the pancreas is considered to be more immunogenic than other organs, most centers employ a strategy of induction immunosuppression with T-cell–depleting or interleukin 2-receptor antibodies. Maintenance immunosuppression consists of a calcineurin inhibitor (tacrolimus or cyclosporine), an antimetabolite (mycophenolate), and a corticosteroid.8
Immunosuppressive complications occur at a rate similar to that seen in other solid-organ transplants and include an increased risk of opportunistic infection and malignancy. The risk of these complications must be balanced against the patient’s risk of health decline with dialysis and insulin-based therapies.
OVERALL OUTCOMES ARE GOOD
The success rate of pancreas transplant is currently at its highest since the inception of the procedure. The unadjusted patient survival rate for all groups is over 96% at 1 year, and over 80% at 5 years.8 One-year patient survival after pancreas transplant alone, at better than 96%, is the highest of all organ transplant procedures.9
Several recently published single-center reviews of pancreas transplant since 2000 report patient survival rates of 96% to 100% at 1 year and 88% to 100% at 5 years.19–22 This variability is likely closely linked to donor and recipient selection, as centers performing smaller numbers of transplants tend to be more selective and, in turn, report higher patient survival rates.19,21
Long-term patient survival outcomes can be gathered from larger, registry-based reviews, accepting limitations in assessing causes of patient death. Siskind et al23 analyzed the outcomes of 20,854 US pancreas transplants done between 1996 and 2012 and found the 10-year patient survival rate ranged from 43% to 77% and was highly dependent on patient age at the time of the procedure.23 Patient survival after transplant must be balanced against the generally poor long-term survival prospects of diabetic patients on dialysis.
By type of transplant, pancreas graft survival rates at 1 year are 89% for simultaneous pancreas-kidney transplant, 86% for pancreas-after-kidney transplant, and 84% for pancreas-alone transplant. Graft survival rates at 5 years are 71% for simultaneous pancreas-kidney transplant, 65% for pancreas-after-kidney transplant, and 58% for pancreas-alone transplant.8,9
Simultaneous pancreas-kidney transplant has been shown to improve the survival rate compared with cadaveric kidney transplant alone in patients with type 1 diabetes and chronic kidney disease.24,25 The survival benefit of isolated pancreas transplant (after kidney transplant and alone) is not evident at 4-year follow-up compared with patients on the waiting list. However, the benefit for the individual patient must be considered by weighing the incapacities experienced with insulin-based treatments against the risks of surgery and immunosuppression.26,27 For patients who have experienced frequent and significant hypoglycemic episodes, particularly those requiring third-party assistance, pancreas transplant can be a lifesaving procedure.
Effects on secondary diabetic complications
Notwithstanding the effect on the patient’s life span, data from several studies of long-term pancreas transplant recipients suggest that secondary diabetic complications can be halted or even improved. Most of these studies examined the effect of restoring euglycemia in nephropathy and the subsequent influence on renal function.
Effect on renal function. Kleinclauss et al28 examined renal allograft function in type 1 diabetic recipients of living-donor kidney transplants. Comparing kidney allograft survival and function in patients who received a subsequent pancreas-after-kidney transplant vs those who did not, graft survival was superior after 5 years, and the estimated glomerular filtration rate was 10 mL/min higher in pancreas-after-kidney recipients.28 This improvement in renal function was not seen immediately after the pancreas transplant but became evident more than 4 years after establishment of normoglycemia. Somewhat similarly, reversal of diabetic changes in native kidney biopsies has been seen 10 years after pancreas transplant.29
Effect on neuropathy. In other studies, reversal of autonomic neuropathy and hypoglycemic unawareness and improvements in peripheral sensory-motor neuropathy have also been observed.30–32
Effect on retinopathy. Improvements in early-stage nonproliferative diabetic retinopathy and laser-treated proliferative lesions have been seen, even within short periods of follow-up.33 Other groups have shown a significantly higher proportion of improvement or stability of advanced diabetic retinopathy at 3 years after simultaneous pancreas-kidney transplant, compared with kidney transplant alone in patients with type 1 diabetes.34
Effect on heart disease. Salutary effects on cardiovascular risk factors and amelioration of cardiac morphology and functional cardiac indices have been seen within the first posttransplant year.35 Moreover, with longer follow-up (nearly 4 years), simultaneous pancreas-kidney recipients with functioning pancreas grafts were found to have less progression of coronary atherosclerosis than simultaneous pancreas-kidney recipients with early pancreas graft loss.36 These data provide a potential pathophysiologic mechanism for the long-term survival advantage seen in uremic type 1 diabetic patients undergoing simultaneous pancreas-kidney transplant.
In the aggregate, these findings suggest that, in the absence of surgical and immunosuppression-related complications, a functioning pancreas allograft can alter the progress of diabetic complications. As an extension of these results, pancreas transplant done earlier in the course of diabetes may have an even greater impact.
- Centers for Disease Control and Prevention (CDC). National diabetes fact sheet: national estimates and general information on diabetes and prediabetes in the United States, 2011. www.cdc.gov/diabetes/pubs/pdf/ndfs_2011.pdf. Accessed August 12, 2015.
- Ali MK, Bullard KM, Saaddine JB, Cowie CC, Imperatore G, Gregg EW. Achievement of goals in US diabetes care, 1999–2010. N Engl J Med 2013; 368:1613–1624.
- Jeon JY, Kim DJ, Ko SH, et al; Taskforce Team of Diabetes Fact Sheet of the Korean Diabetes Association. Current status of glycemic control of patients with diabetes in Korea: the fifth Korea national health and nutrition examination survey. Diabetes Metab J 2014; 38:197–203.
- Govan L, Wu O, Briggs A, et al; Scottish Diabetes Research Network Epidemiology Group. Achieved levels of HbA1c and likelihood of hospital admission in people with type 1 diabetes in the Scottish population: a study from the Scottish Diabetes Research Network Epidemiology Group. Diabetes Care 2011; 34:1992–1997.
- Bryant W, Greenfield JR, Chisholm DJ, Campbell LV. Diabetes guidelines: easier to preach than to practise? Med J Aust 2006; 185:305–309.
- Kelly WD, Lillehei RC, Merkel FK, Idezuki Y, Goetz FC. Allotransplantation of the pancreas and duodenum along with the kidney in diabetic nephropathy. Surgery 1967; 61:827–837.
- Gruessner AC, Gruessner RW. Pancreas transplant outcomes for United States and non United States cases as reported to the United Network for Organ Sharing and the International Pancreas Transplant Registry as of December 2011. Clin Transpl 2012: 23–40.
- Israni AK, Skeans MA, Gustafson SK, et al. OPTN/SRTR 2012 Annual Data Report: pancreas. Am J Transplant 2014; 14(suppl 1):45–68
- Gruessner RW, Gruessner AC. Pancreas transplant alone: a procedure coming of age. Diabetes Care 2013; 36:2440–2447.
- Axelrod DA, Sung RS, Meyer KH, Wolfe RA, Kaufman DB. Systematic evaluation of pancreas allograft quality, outcomes and geographic variation in utilization. Am J Transplant 2010; 10:837–845.
- Wiseman AC, Wainright JL, Sleeman E, et al. An analysis of the lack of donor pancreas utilization from younger adult organ donors. Transplantation 2010; 90:475–480.
- Gruessner RW, Gruessner AC. The current state of pancreas transplantation. Nat Rev Endocrinol 2013; 9:555–562.
- Gunasekaran G, Wee A, Rabets J, Winans C, Krishnamurthi V. Duodenoduodenostomy in pancreas transplantation. Clin Transplant 2012; 26:550–557.
- Sollinger HW, Odorico JS, Becker YT, D’Alessandro AM, Pirsch JD. One thousand simultaneous pancreas-kidney transplants at a single center with 22-year follow-up. Ann Surg 2009; 250:618–630.
- Humar A, Kandaswamy R, Granger D, Gruessner RW, Gruessner AC, Sutherland DE. Decreased surgical risks of pancreas transplantation in the modern era. Ann Surg 2000; 231:269–275.
- Sampaio MS, Reddy PN, Kuo HT, et al. Obesity was associated with inferior outcomes in simultaneous pancreas kidney transplant. Transplantation 2010; 89:1117–1125.
- Finger EB, Radosevich DM, Dunn TB, et al. A composite risk model for predicting technical failure in pancreas transplantation. Am J Transplant 2013; 13:1840–1849.
- Fridell JA, Mangus RS, Taber TE, et al. Growth of a nation part II: impact of recipient obesity on whole-organ pancreas transplantation. Clin Transplant 2011; 25:E366–E374.
- Tai DS, Hong J, Busuttil RW, Lipshutz GS. Low rates of short- and long-term graft loss after kidney-pancreas transplant from a single center. JAMA Surg 2013; 148:368–373.
- Bazerbachi F, Selzner M, Marquez MA, et al. Pancreas-after-kidney versus synchronous pancreas-kidney transplantation: comparison of intermediate-term results. Transplantation 2013; 95:489–494.
- Laftavi MR, Pankewycz O, Gruessner A, et al. Long-term outcomes of pancreas after kidney transplantation in small centers: is it justified? Transplant Proc 2014; 46:1920–1923.
- Stratta RJ, Farney AC, Orlando G, Farooq U, Al-Shraideh Y, Rogers J. Similar results with solitary pancreas transplantation compared with simultaneous pancreas-kidney transplantation in the new millennium. Transplant Proc 2014; 46:1924–1927.
- Siskind E, Maloney C, Akerman M, et al. An analysis of pancreas transplantation outcomes based on age groupings—an update of the UNOS database. Clin Transplant 2014; 28:990–994.
- Ojo AO, Meier-Kriesche HU, Hanson JA, et al. The impact of simultaneous pancreas-kidney transplantation on long-term patient survival. Transplantation 2001; 71:82–90.
- Reddy KS, Stablein D, Taranto S, et al. Long-term survival following simultaneous kidney-pancreas transplantation versus kidney transplantation alone in patients with type 1 diabetes mellitus and renal failure. Am J Kidney Dis 2003; 41:464–470.
- Venstrom JM, McBride MA, Rother KI, Hirshberg B, Orchard TJ, Harlan DM. Survival after pancreas transplantation in patients with diabetes and preserved kidney function. JAMA 2003; 290:2817–2823.
- Gruessner RW, Sutherland DE, Gruessner AC. Mortality assessment for pancreas transplants. Am J Transplant 2004; 4:2018–2026.
- Kleinclauss F, Fauda M, Sutherland DE, et al. Pancreas after living donor kidney transplants in diabetic patients: impact on long-term kidney graft function. Clin Transplant 2009; 23:437–446.
- Fioretto P, Steffes MW, Sutherland DE, Goetz FC, Mauer M. Reversal of lesions of diabetic nephropathy after pancreas transplantation. N Engl J Med 1998; 339:69–75.
- Landgraf R. Impact of pancreas transplantation on diabetic secondary complications and quality of life. Diabetologia 1996; 39:1415–1424.
- Robertson RP. Update on transplanting beta cells for reversing type 1 diabetes. Endocrinol Metab Clin North Am 2010; 39:655–667.
- Robertson RP, Holohan TV, Genuth S. Therapeutic controversy: pancreas transplantation for type I diabetes. J Clin Endocrinol Metab 1998; 83:1868–1674.
- Giannarelli R, Coppelli A, Sartini MS, et al. Pancreas transplant alone has beneficial effects on retinopathy in type 1 diabetic patients. Diabetologia 2006; 49:2977–2982.
- Koznarová R, Saudek F, Sosna T, et al. Beneficial effect of pancreas and kidney transplantation on advanced diabetic retinopathy. Cell Transplant 2000; 9:903–908.
- Coppelli A, Giannarelli R, Mariotti R, et al. Pancreas transplant alone determines early improvement of cardiovascular risk factors and cardiac function in type 1 diabetic patients. Transplantation 2003; 76:974–976.
- Jukema JW, Smets YF, van der Pijl JW, et al. Impact of simultaneous pancreas and kidney transplantation on progression of coronary atherosclerosis in patients with end-stage renal failure due to type 1 diabetes. Diabetes Care 2002; 25:906–911.
KEY POINTS
- Current options are simultaneous pancreas-kidney transplant, pancreas-after-kidney transplant, and pancreas-alone transplant.
- Simultaneous pancreas-kidney transplant provides a significant survival benefit over insulin- and dialysis-based therapies.
- Isolated pancreas transplant for diabetic patients without uremia can prevent hypoglycemic unawareness.
Common infectious complications of liver transplant
The immunosuppressed state of liver transplant recipients makes them vulnerable to infections after surgery.1 These infections are directly correlated with the net state of immunosuppression. Higher levels of immunosuppression mean a higher risk of infection, with rates of infection typically highest in the early posttransplant period.
Common infections during this period include operative and perioperative nosocomial bacterial and fungal infections, reactivation of latent infections, and invasive fungal infections such as candidiasis, aspergillosis, and pneumocystosis. Donor-derived infections also must be considered. As time passes and the level of immunosuppression is reduced, liver recipients are less prone to infection.1
The risk of infection can be minimized by appropriate antimicrobial prophylaxis, strategies for safe living after transplant,2 vaccination,3 careful balancing of immunosuppressive therapy,4 and thoughtful donor selection.5 Drug-drug interactions are common and must be carefully considered to minimize the risk.
This review highlights common infectious complications encountered after liver transplant.
INTRA-ABDOMINAL INFECTIONS
Intra-abdominal infections are common in the early postoperative period.6,7
Risk factors include:
- Pretransplant ascites
- Posttransplant dialysis
- Wound infection
- Reoperation8
- Hepatic artery thrombosis
- Roux-en-Y choledochojejunostomy anastomosis.9
Signs that may indicate intra-abdominal infection include fever, abdominal pain, leukocytosis, and elevated liver enzymes. But because of their immunosuppressed state, transplant recipients may not manifest fever as readily as the general population. They should be evaluated for cholangitis, peritonitis, biloma, and intra-abdominal abscess.
Organisms. Intra-abdominal infections are often polymicrobial. Enterococci, Staphylococcus aureus, gram-negative species including Pseudomonas, Klebsiella, and Acinetobacter, and Candida species are the most common pathogens. Strains are often resistant to multiple drugs, especially in patients who received antibiotics in the weeks before transplant.8,10
Liver transplant recipients are also particularly susceptible to Clostridium difficile-associated colitis as a result of immunosuppression and frequent use of antibiotics perioperatively and postoperatively.11 The spectrum of C difficile infection ranges from mild diarrhea to life-threatening colitis, and the course in liver transplant patients tends to be more complicated than in immunocompetent patients.12
Diagnosis. Intra-abdominal infections should be looked for and treated promptly, as they are associated with a higher mortality rate, a greater risk of graft loss, and a higher incidence of retransplant.6,10 Abdominal ultrasonography or computed tomography (CT) can confirm the presence of fluid collections.
Treatment. Infected collections can be treated with percutaneous or surgical drainage and antimicrobial therapy. In the case of biliary tract complications, retransplant or surgical correction of biliary leakage or stenosis decreases the risk of death.6
Suspicion should be high for C difficile-associated colitis in cases of posttransplant diarrhea. C difficile toxin stool assays help confirm the diagnosis.12 Oral metronidazole is recommended in mild to moderate C difficile infection, with oral vancomycin and intravenous metronidazole reserved for severe cases. Colectomy may be necessary in patients with toxic megacolon.
CYTOMEGALOVIRUS INFECTION
Cytomegalovirus is an important opportunistic pathogen in liver transplant recipients.13 It causes a range of manifestations, from infection (viremia with or without symptoms) to cytomegalovirus syndrome (fever, malaise, and cell-line cytopenias) to tissue-invasive disease with end-organ disease.14 Without preventive measures and treatment, cytomegalovirus disease can increase the risk of morbidity, allograft loss and death.15,16

Risk factors for cytomegalovirus infection (Table 1) include:
- Discordant serostatus of the donor and recipient (the risk is highest in seronegative recipients of organs from seropositive donors)
- Higher levels of immunosuppression, especially when antilymphocyte antibodies are used
- Treatment of graft rejection
- Coinfection with other human herpesviruses, such as Epstein-Barr virus.4,17
Preventing cytomegalovirus infection

The strategy to prevent cytomegalovirus infection depends on the serologic status of the donor and recipient and may include antiviral prophylaxis or preemptive treatment (Table 2).18
Prophylaxis involves giving antiviral drugs during the early high-risk period, with the goal of preventing the development of cytomegalovirus viremia. The alternative preemptive strategy emphasizes serial testing for cytomegalovirus viremia, with the goal of intervening with antiviral medications while viremia is at a low level, thus avoiding potential progression to cytomegalovirus disease. Both strategies have pros and cons that should be considered by each transplant center when setting institutional policy.
A prophylactic approach seems very effective at preventing both infection and disease from cytomegalovirus and has been shown to reduce graft rejection and the risk of death.18 It is preferred in cytomegalovirus-negative recipients when the donor was cytomegalovirus-positive—a high-risk situation.19 However, these patients are also at higher risk of late-onset cytomegalovirus disease. Higher cost and potential drug toxicity, mainly neutropenia from ganciclovir-based regimens, are additional considerations.
Preemptive treatment, in contrast, reserves drug treatment for patients who are actually infected with cytomegalovirus, thus resulting in fewer adverse drug events and lower cost; but it requires regular monitoring. Preemptive methods, by definition, cannot prevent infection, and with this strategy tissue-invasive disease not associated with viremia does occasionally occur.20 As such, patients with a clinical presentation that suggests cytomegalovirus but have negative results on blood testing should be considered for tissue biopsy with culture and immunohistochemical stain.
The most commonly used regimens for antiviral prophylaxis and treatment in liver transplant recipients are intravenous ganciclovir and oral valganciclovir.21 Although valganciclovir is the most commonly used agent in this setting because of ease of administration, it has not been approved by the US Food and Drug Administration in liver transplant patients, as it was associated with higher rates of cytomegalovirus tissue-invasive disease.22–24 Additionally, drug-resistant cytomegalovirus strains have been associated with valganciclovir prophylaxis in cytomegalovirus-negative recipients of solid organs from cytomegalovirus-positive donors.25
Prophylaxis typically consists of therapy for 3 months from the time of transplant. In higher-risk patients (donor-positive, recipient-negative), longer courses of prophylaxis have been extrapolated from data in kidney transplant recipients.26 Extension or reinstitution of prophylaxis should also be considered in liver transplant patients receiving treatment for rejection with antilymphocyte therapy.
Routine screening for cytomegalovirus is not recommended while patients are receiving prophylaxis. High-risk patients who are not receiving prophylaxis should be monitored with nucleic acid or pp65 antigenemia testing as part of the preemptive strategy protocol.
Treatment of cytomegalovirus disease
Although no specific threshold has been established, treatment is generally indicated if a patient has a consistent clinical syndrome, evidence of tissue injury, and persistent or increasing viremia.
Treatment involves giving antiviral drugs and also reducing the level of immunosuppression, if possible, until symptoms and viremia have resolved.
The choice of antiviral therapy depends on the severity of disease. Intravenous ganciclovir (5 mg/kg twice daily adjusted for renal impairment) or oral valganciclovir (900 mg twice daily, also renally dose-adjusted when necessary) can be used for mild to moderate disease if no significant gastrointestinal involvement is reported. Intravenous ganciclovir is preferred for patients with more severe disease or gastrointestinal involvement. The minimum duration of treatment is 2 weeks and may need to be prolonged until both symptoms and viremia completely resolve.18
Drug resistance can occur and should be considered in patients who have a history of prolonged ganciclovir or valganciclovir exposure who do not clinically improve or have persistent or rising viremia. In such cases, genotype assays are helpful, and initiation of alternative therapy should be considered. Mutations conferring resistance to ganciclovir are often associated with cross-resistance to cidofovir. Cidofovir can therefore be considered only when genotype assays demonstrate specific mutations conferring an isolated resistance to ganciclovir.27 The addition of foscarnet to the ganciclovir regimen or substitution of foscarnet for ganciclovir are accepted approaches.
Although cytomegalovirus hyperimmunoglobulin has been used in prophylaxis and invasive disease treatment, its role in the management of ganciclovir-resistant cytomegalovirus infections remains controversial.28
EPSTEIN-BARR VIRUS POSTTRANSPLANT LYMPHOPROLIFERATIVE DISEASE
Epstein-Barr virus-associated posttransplant lymphoproliferative disease is a spectrum of disorders ranging from an infectious mononucleosis syndrome to aggressive malignancy with the potential for death and significant morbidity after liver transplant.29 The timeline of risk varies, but the disease is most common in the first year after transplant.
Risk factors for this disease (Table 1) are:
- Primary Epstein-Barr virus infection
- Cytomegalovirus donor-recipient mismatch
- Cytomegalovirus disease
- Higher levels of immunosuppression, especially with antilymphocyte antibodies.30
The likelihood of Epstein-Barr virus playing a contributing role is lower in later-onset posttransplant lymphoproliferative disease. Patients who are older at the time of transplant, who receive highly immunogenic allografts including a liver as a component of a multivisceral transplant, and who receive increased immunosuppression to treat rejection are at even greater risk of late posttransplant lymphoproliferative disease.31 This is in contrast to early posttransplant lymphoproliferative disease, which is seen more commonly in children as a result of primary Epstein-Barr virus infection.
Recognition and diagnosis. Heightened suspicion is required when considering posttransplant lymphoproliferative disease, and careful evaluation of consistent symptoms and allograft dysfunction are required.
Clinically, posttransplant lymphoproliferative disease should be suspected if a liver transplant recipient develops unexplained fever, weight loss, lymphadenopathy, or cell-line cytopenias.30,32 Other signs and symptoms may be related to the organ involved and may include evidence of hepatitis, pneumonitis, and gastrointestinal disease.31
Adjunctive diagnostic testing includes donor and recipient serology to characterize overall risk before transplantation and quantification of Epstein-Barr viral load, but confirmation relies on tissue histopathology.
Treatment focuses on reducing immunosuppression.30,32 Adding antiviral agents does not seem to improve outcome in all cases.33 Depending on clinical response and histologic classification, additional therapies such as anti-CD20 humanized chimeric monoclonal antibodies, surgery, radiation, and conventional chemotherapy may be required.34
Preventive approaches remain controversial. Chemoprophylaxis with an antiviral such as ganciclovir is occasionally used but has not been shown to consistently decrease rates of posttransplant lymphoproliferative disease. These agents may act in an indirect manner, leading to decreased rates of cytomegalovirus infection, a major cofactor for posttransplant lymphoproliferative disease.24
Passive immunoprophylaxis with immunoglobulin targeting cytomegalovirus has shown to decrease rates of non-Hodgkin lymphoma from posttransplant lymphoproliferative disease in renal transplant recipients in the first year after transplant,35 but data are lacking regarding its use in liver transplant recipients. Monitoring of the viral load and subsequent reduction of immunosuppression remain the most efficient measures to date.36
FUNGAL INFECTIONS
Candida species account for more than half of fungal infections in liver transplant recipients.37 However, a change has been noted in the past 20 years, with a decrease in Candida infections accompanied by an increase in Aspergillus infections.38 Endemic mycoses such as coccidioidomycosis, blastomycosis, and histoplasmosis should be considered with the appropriate epidemiologic history or if disease develops early after transplant and the donor came from a highly endemic region.39Cryptococcus may also be encountered.
Diagnosis. One of the most challenging aspects of fungal infection in liver transplant recipients is timely diagnosis. Heightened suspicion and early biopsy for pathological and microbiological confirmation are necessary. Although available noninvasive diagnostic tools often lack specificity, early detection of fungal markers may be of great use in guiding further diagnostic workup or empiric treatment in the critically ill.
Noninvasive tests include galactomannan, cryptococcal antigen, histoplasma antigen, (1-3)-beta-D-glucan assay and various antibody tests. Galactomannan testing has been widely used to aid in the diagnosis of invasive aspergillosis. Similarly, the (1-3)-beta-D-glucan assay is a non–culture-based tool for diagnosing and monitoring the treatment of invasive fungal infections. However, a definite diagnosis cannot be made on the basis of a positive test alone.40 The complementary diagnostic characteristics of combining noninvasive assays have yet to be fully elucidated.41 Cultures and tissue histopathology are also used when possible.
Treatment is based on targeted specific antifungal drug therapy and reduction of immunosuppressive therapy, when possible. The choice of antifungal agent varies with the pathogen, the site of involvement, and the severity of the disease. A focus on potential drug interactions, their management, and therapeutic drug monitoring when using antifungal medications is essential in the posttransplant period. Combination therapy can be considered in some situations to enhance synergy. The following sections discuss in greater detail Candida species, Aspergillus species, and Pneumocystis jirovecii infections.
Candida infections

Candidiasis after liver transplant is typically nosocomial, especially when diagnosed during the first 3 months (Table 3).37
Risk factors for invasive candidiasis include perioperative colonization, prolonged operative time, retransplant, greater transfusion requirements, and postoperative renal failure.37,42,43 Invasive candidiasis is of concern for its effects on morbidity, mortality, and cost of care.43–46
Organisms. The frequency of implicated species, in particular those with a natural resistance to fluconazole, differs in various reports.37,45,46Candida albicans remains the most commonly isolated pathogen; however, non-albicans species including those resistant to fluconazole have been reported more frequently and include Candida glabrata and Candida krusei.47,48
Signs and diagnosis. Invasive candidiasis in liver transplant recipients generally manifests itself in catheter-related blood stream infections, urinary tract infections, or intra-abdominal infections. Diagnosis can be made by isolating Candida from blood cultures, recovering organisms in culture of a normally sterile site, or finding direct microscopic evidence of the fungus on tissue specimens.49
Disseminated candidiasis refers to the involvement of distant anatomic sites. Clinical manifestations may cause vision changes, abdominal pain or skin nodules with findings of candidemia, hepatosplenic abscesses, or retinal exudates on funduscopy.49
Treatment of invasive candidiasis in liver recipients often involves antifungal therapy and reduction of immunosuppression. Broad-spectrum antifungals are initially advocated in an empirical approach to cover fluconazole-resistant strains of the non-albicans subgroups.50 Depending on antifungal susceptibility, treatment can later be adjusted.
Fluconazole remains the agent of choice in most C albicans infections.47 However, attention should be paid to the possibility of resistance in patients who have received fluconazole prophylaxis within the past 30 days. Additional agents used in treatment may include echinocandins, amphotericin, and additional azoles.
Antifungal prophylaxis is recommended in high-risk liver transplant patients, although its optimal duration remains undetermined.44 Antifungal prophylaxis has been associated with decreased incidence of both superficial and invasive candidiasis.51
Aspergillus infection
Aspergillus, the second most common fungal pathogen, has become a more common concern in liver transplant recipients. Aspergillus fumigatus is the most frequently encountered species.38,52
Risk factors. These infections typically occur in the first year, during intense immunosuppression. Retransplant, renal failure, and fulminant hepatic failure are major risk factors.52 In the presence of risk factors and a suggestive clinical setting, invasive aspergillosis should be considered and the diagnosis pursued.
Diagnosis is suggested by positive findings on CT accompanied by lower respiratory tract symptoms, focal lesions on neuroimaging, or demonstration of the fungus on cultures.49 However, Aspergillus is rarely grown in blood culture. The galactomannan antigen is a noninvasive test that can provide supporting evidence for the diagnosis.41,52 False-positive results do occur in the setting of certain antibiotics and cross-reacting fungi.53
Treatment consists of antifungal therapy and immunosuppression reduction.52
Voriconazole is the first-line agent for invasive aspergillosis. Monitoring for potential drug-drug interactions and side effects is required.54,55 Amphotericin B is considered a second-line choice due to toxicity and lack of an oral formulation. In refractory cases, combined antifungal therapy could be considered.52 The duration of treatment is generally a minimum of 12 weeks.
Prophylaxis. Specific prophylaxis against invasive aspergillosis is not currently recommended; however, some authors suggest a prophylactic approach using echinocandins or liposomal amphotericin B in high-risk patients.51,52 Aspergillosis is associated with a considerable increase in mortality in liver transplant recipients, which highlights the importance of timely management.52,56
Pneumocystis jirovecii
P jirovecii remains a common opportunistic pathogen in people with impaired immunity, including transplant and human immunodeficiency virus patients.
Prophylaxis. Widespread adoption of antimicrobial prophylaxis by transplant centers has decreased the rates of P jirovecii infection in liver transplant recipients.57,58 Commonly used prophylactic regimens after liver transplantation include a single-strength trimethoprim-sulfamethoxazole tablet daily or a double-strength tablet three times per week for a minimum of 6 to 12 months after transplant. Atovaquone and dapsone can be used as alternatives in cases of intolerance to trimethoprim-sulfamethoxazole (Table 2).
Inhaled pentamidine is clearly inferior and should be used only when the other medications are contraindicated.59
Signs and diagnosis. P jirovecii pneumonia is characterized by fever, cough, dyspnea, and chest pain. Insidious hypoxemia, abnormal chest examination, and bilateral interstitial pneumonia on chest radiography are common.
CT may be more sensitive than chest radiography.57 Findings suggestive of P jirovecii pneumonia on chest CT are extensive bilateral and symmetrical ground-glass attenuations. Other less-characteristic findings include upper lobar parenchymal opacities and spontaneous pneumothorax.57,60
The serum (1,3)-beta-D-glucan assay derived from major cell-wall components of P jirovecii might be helpful. Studies report a sensitivity for P jirovecii pneumonia as high as 96% and a negative predictive value of 99.8%.61,62
Definitive diagnosis requires identification of the pathogen. Routine expectorated sputum sampling is generally associated with a poor diagnostic yield. Bronchoscopy and bronchoalveolar lavage with silver or fluorescent antibody staining of samples, polymerase chain reaction testing, or both significantly improves diagnosis. Transbronchial or open lung biopsy are often unnecessary.57
Treatment. Trimethoprim-sulfamethoxazole is the first-line agent for treating P jirovecii pneumonia.57 The minimum duration of treatment is 14 days, with extended courses for severe infection.
Intravenous pentamidine or clindamycin plus primaquine are alternatives for patients who cannot tolerate trimethoprim-sulfamethoxazole. The major concern with intravenous pentamidine is renal dysfunction. Hypoglycemia or hyperglycemia, neutropenia, thrombocytopenia, nausea, dysgeusia, and pancreatitis may also occur.63
Atovaquone might also be beneficial in mild to moderate P jirovecii pneumonia. The main side effects include skin rashes, gastrointestinal intolerance, and elevation of transaminases.64
A corticosteroid (40–60 mg of prednisone or its equivalent) may be beneficial in conjunction with antimicrobial therapy in patients with significant hypoxia (partial pressure of arterial oxygen < 70 mm Hg on room air) in decreasing the risk of respiratory failure and need for intubation.
With appropriate and timely antimicrobial prophylaxis, cases of P jirovecii pneumonia should continue to decrease.
TUBERCULOSIS
Development of tuberculosis after transplantation is a catastrophic complication, with mortality rates of up to 30%.65 Most cases of posttransplant tuberculosis represent reactivation of latent disease.66 Screening with tuberculin skin tests or interferon-gamma-release assays is recommended in all liver transplant candidates. Chest radiography before transplant is necessary when assessing a positive screening test.67
The optimal management of latent tuberculosis in these cases remains controversial. Patients at high risk or those with positive screening results on chest radiography warrant treatment for latent tuberculosis infection with isoniazid unless contraindicated.67,68
The ideal time to initiate prophylactic isoniazid therapy is unclear. Some authors suggest delaying it, as it might be associated with poor tolerance and hepatotoxicity.69 Others have found that early isoniazid use was not associated with negative outcomes.70
Risk factors for symptomatic tuberculosis after liver transplant include previous infection with tuberculosis, intensified immunosuppression (especially anti-T-lymphocyte therapies), diabetes mellitus, and other co-infections (Table 1).71
The increased incidence of atypical presentations in recent years makes the diagnosis of active tuberculosis among liver transplant recipients challenging. Sputum smears can be negative due to low mycobacterial burdens, and tuberculin skin testing and interferon-gamma-release assays may be falsely negative due to immunosuppression.67
Treatment of active tuberculosis consists initially of a four-drug regimen using isoniazid, rifampin, pyrazinamide, and ethambutol for 2 months. Adjustments are made in accordance with culture and sensitivity results. Treatment can then be tapered to two drugs (isoniazid and rifampin) for a minimum of 4 additional months. Prolonged treatment may be required in instances of extrapulmonary or disseminated disease.65,72
Tuberculosis treatment can be complicated by hepatotoxicity in liver transplant recipients because of direct drug effects and drug-drug interactions with immunosuppressive agents. Close monitoring for rejection and hepatotoxicity is therefore imperative while liver transplant recipients are receiving antituberculosis therapy. Drug-drug interactions may also be responsible for marked reductions in immunosuppression levels, especially with regimens containing rifampin.71 Substitution of rifabutin for rifampin reduces the effect of drug interactions.66
VIRAL HEPATITIS
Hepatitis B virus
Hepatitis B virus-related end-stage liver disease and hepatocellular carcinoma are common indications for liver transplant in Asia. It is less common in the United States and Europe, accounting for less than 10% of all liver transplant cases. Prognosis is favorable in recipients undergoing liver transplant for hepatitis B virus, with excellent survival rates. Prevention of reinfection is crucial in these patients.
Treatment with combination antiviral agents and hepatitis B immunoglobulin (HBIG) is effective.73 Lamivudine was the first nucleoside analogue found to be effective against hepatitis B virus. Its low cost and relative safety are strong arguments in favor of its continued use in liver transplant recipients.74 In patients without evidence of hepatitis B viral replication at the time of transplant, monotherapy with lamivudine has led to low recurrence rates, and adefovir can be added to control resistant viral strains.75
The frequent emergence of resistance with lamivudine favors newer agents such as entecavir or tenofovir. These nucleoside and nucleotide analogues have a higher barrier to resistance, and thus resistance to them is rare. They are also more efficient, potentially allowing use of an HBIG-sparing protocol.76 However, they are associated with a higher risk of nephrotoxicity and require dose adjustments in renal insufficiency. Data directly comparing entecavir and tenofovir are scarce.
Prophylaxis. Most studies support an individualized approach for prevention of hepatitis B virus reinfection. High-risk patients, ie, those positive for HBe antigen or with high viral loads (> 100,000 copies/mL) are generally treated with both HBIG and antiviral agents.77 Low-risk patients are those with a negative HBe antigen, low hepatitis B virus DNA levels, hepatitis B virus-related acute liver failure, and cirrhosis resulting from coinfection with both hepatitis B and hepatitis D virus.75 In low-risk patients, discontinuation of HBIG after 1 to 2 years of treatment is appropriate, and long-term prophylaxis with antiviral agents alone is an option. However, levels of hepatitis B DNA should be monitored closely.78,79
Hepatitis C virus
Recurrence of hepatitis C virus infection is the rule among patients who are viremic at the time of liver transplant.80,81 Most of these patients will show histologic evidence of recurrent hepatitis within the first year after liver transplant. It is often difficult to distinguish between the histopathological appearance of a recurrent hepatitis C virus infection and acute cellular rejection.
Progression to fibrosis and subsequently cirrhosis and decompensation is highly variable in hepatitis C virus-infected liver transplant recipients. Diabetes, insulin resistance, and possibly hepatitis steatosis have been associated with a rapid progression to advanced fibrosis. The contribution of immunosuppression to the progression of hepatitis C virus remains an area of active study. Some studies point to antilymphocyte immunosuppressive agents as a potential cause.82 Liver biopsy is a useful tool in this situation. It allows monitoring of disease severity and progression and may distinguish recurrent hepatitis C virus disease from other causes of liver enzyme elevation.
The major concern with the recurrence of hepatitis C virus infection after liver transplant is allograft loss. Rates of patient and graft survival are reduced in infected patients compared with hepatitis C virus-negative patients.83,84 Prophylactic antiviral therapy has no current role in the management of hepatitis C virus disease. Those manifesting moderate to severe necroinflammation or mild to moderate fibrosis indicative of progressive disease should be treated.81,85
Sustained viral clearance with antiviral agents confers a graft survival benefit.
The combination of peg-interferon and weight-based ribavirin has been the standard of treatment but may be associated with increased rates of rejection.86,87 The sustained virologic response rates for hepatitis C virus range from 60% in genotypes 4, 5, and 6 after 48 weeks of treatment to 60% to 80% in genotypes 2 and 3 after 24 weeks, but only about 30% in genotype 1.88
Treatment with the newer agents, especially protease inhibitors, in genotype 1 (peg-interferon, ribavirin, and either telaprevir or boceprevir) has been evaluated. Success rates reaching 70% have been achieved.89 Adverse effects can be a major setback. Serious complications include severe anemia, renal dysfunction, increased risk of infection, and death.
Triple therapy should be carefully considered in liver transplant patients with genotype 1 hepatitis C virus.90 Significant drug-drug interactions are reported between hepatitis C virus protease inhibitors and immunosuppression regimens. Additional new oral direct- acting antivirals have been investigated. They bring promising advances in hepatitis C virus treatment and pave the way for interferon-free regimens with pangenotypic activity.
IMMUNIZATION
Immunization can decrease the risk of infectious complications in liver transplant recipients, as well as in close contacts and healthcare professionals.3
Influenza. Pretransplant influenza vaccine and posttransplant annual influenza vaccines are necessary.
Pneumococcal immunization should additionally be provided prior to transplant and repeated every 3 to 5 years thereafter.3,91
A number of other vaccinations should also be completed before transplant, including the hepatitis A and B vaccines and the tetanus/diphtheria/acellular pertussis vaccines. However, these vaccinations have not been shown to be detrimental to patients after transplant.91
Varicella and zoster vaccines should be given before liver transplant—zoster in patients over age 60, and varicella in patients with no immunity. Live vaccines, including varicella and zoster vaccines, are contraindicated after liver transplant.3
Human papillomavirus. The bivalent human papillomavirus vaccine can be given before transplant in females ages 9 to 26; the quadrivalent vaccine is beneficial in those ages 9 to 26 and in women under age 45.3,91
IMMUNOSUPPRESSION CARRIES RISK OF INFECTION
Most liver transplant patients require prolonged immunosuppressive therapy. This comes with an increased risk of new or recurrent infections, potentially causing death and significant morbidity.
Evaluation of existing risk factors, appropriate prophylaxis and immunization, timely diagnosis, and treatment of such infections are therefore essential steps for the successful management of liver transplant recipients.
- Fishman JA. Infection in solid-organ transplant recipients. N Engl J Med 2007; 357:2601–2614.
- Avery RK, Michaels MG; AST Infectious Diseases Community of Practice. Strategies for safe living after solid organ transplantation. Am J Transplant 2013; 13(suppl 4):304–310.
- Danziger-Isakov L, Kumar D; AST Infectious Diseases Community of Practice. Vaccination in solid organ transplantation. Am J Transplant 2013; 13(suppl 4):311–317.
- San Juan R, Aguado JM, Lumbreras C, et al; RESITRA Network, Spain. Incidence, clinical characteristics and risk factors of late infection in solid organ transplant recipients: data from the RESITRA study group. Am J Transplant 2007; 7:964–971.
- Ison MG, Grossi P; AST Infectious Diseases Community of Practice. Donor-derived infections in solid organ transplantation. Am J Transplant 2013; 13(suppl 4):22–30.
- Kim YJ, Kim SI, Wie SH, et al. Infectious complications in living-donor liver transplant recipients: a 9-year single-center experience. Transpl Infect Dis 2008; 10:316–324.
- Arnow PM. Infections following orthotopic liver transplantation. HPB Surg 1991; 3:221–233.
- Reid GE, Grim SA, Sankary H, Benedetti E, Oberholzer J, Clark NM. Early intra-abdominal infections associated with orthotopic liver transplantation. Transplantation 2009; 87:1706–1711.
- Said A, Safdar N, Lucey MR, et al. Infected bilomas in liver transplant recipients, incidence, risk factors and implications for prevention. Am J Transplant 2004; 4:574–582.
- Safdar N, Said A, Lucey MR, et al. Infected bilomas in liver transplant recipients: clinical features, optimal management, and risk factors for mortality. Clin Infect Dis 2004; 39:517–525.
- Niemczyk M, Leszczyniski P, Wyzgał J, Paczek L, Krawczyk M, Luczak M. Infections caused by Clostridium difficile in kidney or liver graft recipients. Ann Transplant 2005; 10:70–74.
- Albright JB, Bonatti H, Mendez J, et al. Early and late onset Clostridium difficile-associated colitis following liver transplantation. Transpl Int 2007; 20:856–866.
- Lee SO, Razonable RR. Current concepts on cytomegalovirus infection after liver transplantation. World J Hepatol 2010; 2:325–336.
- Ljungman P, Griffiths P, Paya C. Definitions of cytomegalovirus infection and disease in transplant recipients. Clin Infect Dis 2002; 34:1094–1097.
- Beam E, Razonable RR. Cytomegalovirus in solid organ transplantation: epidemiology, prevention, and treatment. Curr Infect Dis Rep 2012; 14:633–641.
- Bodro M, Sabé N, Lladó L, et al. Prophylaxis versus preemptive therapy for cytomegalovirus disease in high-risk liver transplant recipients. Liver Transpl 2012; 18:1093–1099.
- Weigand K, Schnitzler P, Schmidt J, et al. Cytomegalovirus infection after liver transplantation incidence, risks, and benefits of prophylaxis. Transplant Proc 2010; 42:2634–2641.
- Razonable RR, Humar A; AST Infectious Diseases Community of Practice. Cytomegalovirus in solid organ transplantation. Am J Transplant 2013; 13(suppl 4):93–106.
- Meije Y, Fortún J, Len Ó, et al; Spanish Network for Research on Infection in Transplantation (RESITRA) and the Spanish Network for Research on Infectious Diseases (REIPI). Prevention strategies for cytomegalovirus disease and long-term outcomes in the high-risk transplant patient (D+/R-): experience from the RESITRA-REIPI cohort. Transpl Infect Dis 2014; 16:387–396.
- Durand CM, Marr KA, Arnold CA, et al. Detection of cytomegalovirus DNA in plasma as an adjunct diagnostic for gastrointestinal tract disease in kidney and liver transplant recipients. Clin Infect Dis 2013; 57:1550–1559.
- Levitsky J, Singh N, Wagener MM, Stosor V, Abecassis M, Ison MG. A survey of CMV prevention strategies after liver transplantation. Am J Transplant 2008; 8:158–161.
- Marcelin JR, Beam E, Razonable RR. Cytomegalovirus infection in liver transplant recipients: updates on clinical management. World J Gastroenterol 2014; 20:10658–10667.
- Kalil AC, Freifeld AG, Lyden ER, Stoner JA. Valganciclovir for cytomegalovirus prevention in solid organ transplant patients: an evidence-based reassessment of safety and efficacy. PLoS One 2009; 4:e5512.
- Kalil AC, Mindru C, Botha JF, et al. Risk of cytomegalovirus disease in high-risk liver transplant recipients on valganciclovir prophylaxis: a systematic review and meta-analysis. Liver Transpl 2012; 18:1440–1447.
- Eid AJ, Arthurs SK, Deziel PJ, Wilhelm MP, Razonable RR. Emergence of drug-resistant cytomegalovirus in the era of valganciclovir prophylaxis: therapeutic implications and outcomes. Clin Transplant 2008; 22:162–170.
- Kumar D, Humar A. Cytomegalovirus prophylaxis: how long is enough? Nat Rev Nephrol 2010; 6:13–14.
- Lurain NS, Chou S. Antiviral drug resistance of human cytomegalovirus. Clin Microbiol Rev 2010; 23:689–712.
- Torres-Madriz G, Boucher HW. Immunocompromised hosts: perspectives in the treatment and prophylaxis of cytomegalovirus disease in solid-organ transplant recipients. Clin Infect Dis 2008; 47:702–711.
- Burra P, Buda A, Livi U, et al. Occurrence of post-transplant lymphoproliferative disorders among over thousand adult recipients: any role for hepatitis C infection? Eur J Gastroenterol Hepatol 2006; 18:1065–1070.
- Jain A, Nalesnik M, Reyes J, et al. Posttransplant lymphoproliferative disorders in liver transplantation: a 20-year experience. Ann Surg 2002; 236:429–437.
- Allen UD, Preiksaitis JK; AST Infectious Diseases Community of Practice. Epstein-Barr virus and posttransplant lymphoproliferative disorder in solid organ transplantation. Am J Transplant 2013; 13(suppl 4):107–120.
- Allen U, Preiksaitis J; AST Infectious Diseases Community of Practice. Epstein-Barr virus and posttransplant lymphoproliferative disorder in solid organ transplant recipients. Am J Transplant 2009; 9(suppl 4):S87–S96.
- Perrine SP, Hermine O, Small T, et al. A phase 1/2 trial of arginine butyrate and ganciclovir in patients with Epstein-Barr virus-associated lymphoid malignancies. Blood 2007; 109:2571–2578.
- Jagadeesh D, Woda BA, Draper J, Evens AM. Post transplant lymphoproliferative disorders: risk, classification, and therapeutic recommendations. Curr Treat Options Oncol 2012; 13:122–136.
- Opelz G, Daniel V, Naujokat C, Fickenscher H, Döhler B. Effect of cytomegalovirus prophylaxis with immunoglobulin or with antiviral drugs on post-transplant non-Hodgkin lymphoma: a multicentre retrospective analysis. Lancet Oncol 2007; 8:212–218.
- Nowalk AJ, Green M. Epstein-Barr virus–associated posttransplant lymphoproliferative disorder: strategies for prevention and cure. Liver Transpl 2010; 16(suppl S2):S54–S59.
- Pappas PG, Silveira FP; AST Infectious Diseases Community of Practice. Candida in solid organ transplant recipients. Am J Transplant 2009; 9(suppl 4):S173–S179.
- Singh N, Wagener MM, Marino IR, Gayowski T. Trends in invasive fungal infections in liver transplant recipients: correlation with evolution in transplantation practices. Transplantation 2002; 73:63–67.
- Miller R, Assi M; AST Infectious Diseases Community of Practice. Endemic fungal infections in solid organ transplantation. Am J Transplant 2013; 13(suppl 4):250–261.
- Fontana C, Gaziano R, Favaro M, Casalinuovo IA, Pistoia E, Di Francesco P. (1-3)-beta-D-glucan vs galactomannan antigen in diagnosing invasive fungal infections (IFIs). Open Microbiol J 2012; 6:70–73.
- Aydogan S, Kustimur S, Kalkancı A. Comparison of glucan and galactomannan tests with real-time PCR for diagnosis of invasive aspergillosis in a neutropenic rat model [Turkish]. Mikrobiyol Bul 2010; 44:441–452.
- Hadley S, Huckabee C, Pappas PG, et al. Outcomes of antifungal prophylaxis in high-risk liver transplant recipients. Transpl Infect Dis 2009; 11:40–48.
- Pappas PG, Kauffman CA, Andes D, et al; Infectious Diseases Society of America. Clinical practice guidelines for the management of candidiasis: 2009 update by the Infectious Diseases Society of America. Clin Infect Dis 2009; 48:503–535.
- Person AK, Kontoyiannis DP, Alexander BD. Fungal infections in transplant and oncology patients. Infect Dis Clin North Am 2010; 24:439–459.
- Van Hal SJ, Marriott DJE, Chen SCA, et al; Australian Candidaemia Study. Candidemia following solid organ transplantation in the era of antifungal prophylaxis: the Australian experience. Transpl Infect Dis 2009; 11:122–127.
- Singh N. Fungal infections in the recipients of solid organ transplantation. Infect Dis Clin North Am 2003; 17:113–134,
- Liu X, Ling Z, Li L, Ruan B. Invasive fungal infections in liver transplantation. Int J Infect Dis 2011; 15:e298–e304.
- Raghuram A, Restrepo A, Safadjou S, et al. Invasive fungal infections following liver transplantation: incidence, risk factors, survival, and impact of fluconazole-resistant Candida parapsilosis (2003-2007). Liver Transpl 2012; 18:1100–1109.
- De Pauw B, Walsh TJ, Donnelly JP, et al; European Organization for Research and Treatment of Cancer/Invasive Fungal Infections Cooperative Group; National Institute of Allergy and Infectious Diseases Mycoses Study Group (EORTC/MSG) Consensus Group. Revised definitions of invasive fungal disease from the European Organization for Research and Treatment of Cancer/Invasive Fungal Infections Cooperative Group and the National Institute of Allergy and Infectious Diseases Mycoses Study Group (EORTC/MSG) Consensus Group. Clin Infect Dis 2008; 46:1813–1821.
- Moreno A, Cervera C, Gavaldá J, et al. Bloodstream infections among transplant recipients: results of a nationwide surveillance in Spain. Am J Transplant 2007; 7:2579–2586.
- Cruciani M, Mengoli C, Malena M, Bosco O, Serpelloni G, Grossi P. Antifungal prophylaxis in liver transplant patients: a systematic review and meta-analysis. Liver Transpl 2006; 12:850–858.
- Singh N, Husain S; AST Infectious Diseases Community of Practice. Invasive aspergillosis in solid organ transplant recipients. Am J Transplant 2009; 9(suppl 4):S180–S191.
- Fortún J, Martín-Dávila P, Alvarez ME, et al. False-positive results of Aspergillus galactomannan antigenemia in liver transplant recipients. Transplantation 2009; 87:256–260.
- Cherian T, Giakoustidis A, Yokoyama S, et al. Treatment of refractory cerebral aspergillosis in a liver transplant recipient with voriconazole: case report and review of the literature. Exp Clin Transplant 2012; 10:482–486.
- Luong ML, Hosseini-Moghaddam SM, Singer LG, et al. Risk factors for voriconazole hepatotoxicity at 12 weeks in lung transplant recipients. Am J Transplant 2012; 12:1929–1935.
- Neofytos D, Fishman JA, Horn D, et al. Epidemiology and outcome of invasive fungal infections in solid organ transplant recipients. Transpl Infect Dis 2010; 12:220–229.
- Martin SI, Fishman JA; AST Infectious Diseases Community of Practice. Pneumocystis pneumonia in solid organ transplant recipients. Am J Transplant 2009; 9(suppl 4):S227–S233.
- Levine SJ, Masur H, Gill VJ, et al. Effect of aerosolized pentamidine prophylaxis on the diagnosis of Pneumocystis carinii pneumonia by induced sputum examination in patients infected with the human immunodeficiency virus. Am Rev Respir Dis 1991; 144:760–764.
- Rodriguez M, Sifri CD, Fishman JA. Failure of low-dose atovaquone prophylaxis against Pneumocystis jiroveci infection in transplant recipients. Clin Infect Dis 2004; 38:e76–e78.
- Crans CA Jr, Boiselle PM. Imaging features of Pneumocystis carinii pneumonia. Crit Rev Diagn Imaging 1999; 40:251–284.
- Onishi A, Sugiyama D, Kogata Y, et al. Diagnostic accuracy of serum 1,3-beta-D-glucan for Pneumocystis jiroveci pneumonia, invasive candidiasis, and invasive aspergillosis: systematic review and meta-analysis. J Clin Microbiol 2012; 50:7–15.
- Held J, Koch MS, Reischl U, Danner T, Serr A. Serum (1→3)-ß-D-glucan measurement as an early indicator of Pneumocystis jirovecii pneumonia and evaluation of its prognostic value. Clin Microbiol Infect 2011; 17:595–602.
- Fishman JA. Prevention of infection caused by Pneumocystis carinii in transplant recipients. Clin Infect Dis 2001; 33:1397–1405.
- Colby C, McAfee S, Sackstein R, Finkelstein D, Fishman J, Spitzer T. A prospective randomized trial comparing the toxicity and safety of atovaquone with trimethoprim/sulfamethoxazole as Pneumocystis carinii pneumonia prophylaxis following autologous peripheral blood stem cell transplantation. Bone Marrow Transplant 1999; 24:897–902.
- Subramanian A, Dorman S; AST Infectious Diseases Community of Practice. Mycobacterium tuberculosis in solid organ transplant recipients. Am J Transplant 2009; 9(suppl 4):S57–S62.
- Subramanian AK, Morris MI; AST Infectious Diseases Community of Practice. Mycobacterium tuberculosis infections in solid organ transplantation. Am J Transplant 2013; 13(suppl 4):68–76.
- Horne DJ, Narita M, Spitters CL, Parimi S, Dodson S, Limaye AP. Challenging issues in tuberculosis in solid organ transplantation. Clin Infect Dis 2013; 57:1473–1482.
- Holty JE, Gould MK, Meinke L, Keeffe EB, Ruoss SJ. Tuberculosis in liver transplant recipients: a systematic review and meta-analysis of individual patient data. Liver Transpl 2009; 15:894–906.
- Jafri SM, Singal AG, Kaul D, Fontana RJ. Detection and management of latent tuberculosis in liver transplant patients. Liver Transpl 2011; 17:306–314.
- Fábrega E, Sampedro B, Cabezas J, et al. Chemoprophylaxis with isoniazid in liver transplant recipients. Liver Transpl 2012; 18:1110–1117.
- Aguado JM, Torre-Cisneros J, Fortún J, et al. Tuberculosis in solid-organ transplant recipients: consensus statement of the group for the study of infection in transplant recipients (GESITRA) of the Spanish Society of Infectious Diseases and Clinical Microbiology. Clin Infect Dis 2009; 48:1276–1284.
- Yehia BR, Blumberg EA. Mycobacterium tuberculosis infection in liver transplantation. Liver Transpl 2010; 16:1129–1135.
- Katz LH, Paul M, Guy DG, Tur-Kaspa R. Prevention of recurrent hepatitis B virus infection after liver transplantation: hepatitis B immunoglobulin, antiviral drugs, or both? Systematic review and meta-analysis. Transpl Infect Dis 2010; 12:292–308.
- Jiang L, Jiang LS, Cheng NS, Yan LN. Current prophylactic strategies against hepatitis B virus recurrence after liver transplantation. World J Gastroenterol 2009; 15:2489–2499.
- Riediger C, Berberat PO, Sauer P, et al. Prophylaxis and treatment of recurrent viral hepatitis after liver transplantation. Nephrol Dial Transplant 2007; 22(suppl 8):viii37–viii46.
- Cholongitas E, Vasiliadis T, Antoniadis N, Goulis I, Papanikolaou V, Akriviadis E. Hepatitis B prophylaxis post liver transplantation with newer nucleos(t)ide analogues after hepatitis B immunoglobulin discontinuation. Transpl Infect Dis 2012; 14:479–487.
- Fox AN, Terrault NA. Individualizing hepatitis B infection prophylaxis in liver transplant recipients. J Hepatol 2011; 55:507–509.
- Fox AN, Terrault NA. The option of HBIG-free prophylaxis against recurrent HBV. J Hepatol 2012; 56:1189–1197.
- Wesdorp DJ, Knoester M, Braat AE, et al. Nucleoside plus nucleotide analogs and cessation of hepatitis B immunoglobulin after liver transplantation in chronic hepatitis B is safe and effective. J Clin Virol 2013; 58:67–73.
- Terrault NA, Berenguer M. Treating hepatitis C infection in liver transplant recipients. Liver Transpl 2006; 12:1192–1204.
- Ciria R, Pleguezuelo M, Khorsandi SE, et al. Strategies to reduce hepatitis C virus recurrence after liver transplantation. World J Hepatol 2013; 5:237–250.
- Issa NC, Fishman JA. Infectious complications of antilymphocyte therapies in solid organ transplantation. Clin Infect Dis 2009; 48:772–786.
- Kalambokis G, Manousou P, Samonakis D, et al. Clinical outcome of HCV-related graft cirrhosis and prognostic value of hepatic venous pressure gradient. Transpl Int 2009; 22:172–181.
- Neumann UP, Berg T, Bahra M, et al. Long-term outcome of liver transplants for chronic hepatitis C: a 10-year follow-up. Transplantation 2004; 77:226–231.
- Wiesner RH, Sorrell M, Villamil F; International Liver Transplantation Society Expert Panel. Report of the first International Liver Transplantation Society expert panel consensus conference on liver transplantation and hepatitis C. Liver Transpl 2003; 9:S1–S9.
- Dinges S, Morard I, Heim M, et al; Swiss Association for the Study of the Liver (SASL 17). Pegylated interferon-alpha2a/ribavirin treatment of recurrent hepatitis C after liver transplantation. Transpl Infect Dis 2009; 11:33–39.
- Veldt BJ, Poterucha JJ, Watt KD, et al. Impact of pegylated interferon and ribavirin treatment on graft survival in liver transplant patients with recurrent hepatitis C infection. Am J Transplant 2008; 8:2426–2433.
- Faisal N, Yoshida EM, Bilodeau M, et al. Protease inhibitor-based triple therapy is highly effective for hepatitis C recurrence after liver transplant: a multicenter experience. Ann Hepatol 2014; 13:525–532.
- Mariño Z, van Bömmel F, Forns X, Berg T. New concepts of sofosbuvir-based treatment regimens in patients with hepatitis C. Gut 2014; 63:207–215.
- Coilly A, Roche B, Dumortier J, et al. Safety and efficacy of protease inhibitors to treat hepatitis C after liver transplantation: a multicenter experience. J Hepatol 2014; 60:78–86.
- Lucey MR, Terrault N, Ojo L, et al. Long-term management of the successful adult liver transplant: 2012 practice guideline by the American Association for the Study of Liver Diseases and the American Society of Transplantation. Liver Transpl 2013; 19:3–26.
The immunosuppressed state of liver transplant recipients makes them vulnerable to infections after surgery.1 These infections are directly correlated with the net state of immunosuppression. Higher levels of immunosuppression mean a higher risk of infection, with rates of infection typically highest in the early posttransplant period.
Common infections during this period include operative and perioperative nosocomial bacterial and fungal infections, reactivation of latent infections, and invasive fungal infections such as candidiasis, aspergillosis, and pneumocystosis. Donor-derived infections also must be considered. As time passes and the level of immunosuppression is reduced, liver recipients are less prone to infection.1
The risk of infection can be minimized by appropriate antimicrobial prophylaxis, strategies for safe living after transplant,2 vaccination,3 careful balancing of immunosuppressive therapy,4 and thoughtful donor selection.5 Drug-drug interactions are common and must be carefully considered to minimize the risk.
This review highlights common infectious complications encountered after liver transplant.
INTRA-ABDOMINAL INFECTIONS
Intra-abdominal infections are common in the early postoperative period.6,7
Risk factors include:
- Pretransplant ascites
- Posttransplant dialysis
- Wound infection
- Reoperation8
- Hepatic artery thrombosis
- Roux-en-Y choledochojejunostomy anastomosis.9
Signs that may indicate intra-abdominal infection include fever, abdominal pain, leukocytosis, and elevated liver enzymes. But because of their immunosuppressed state, transplant recipients may not manifest fever as readily as the general population. They should be evaluated for cholangitis, peritonitis, biloma, and intra-abdominal abscess.
Organisms. Intra-abdominal infections are often polymicrobial. Enterococci, Staphylococcus aureus, gram-negative species including Pseudomonas, Klebsiella, and Acinetobacter, and Candida species are the most common pathogens. Strains are often resistant to multiple drugs, especially in patients who received antibiotics in the weeks before transplant.8,10
Liver transplant recipients are also particularly susceptible to Clostridium difficile-associated colitis as a result of immunosuppression and frequent use of antibiotics perioperatively and postoperatively.11 The spectrum of C difficile infection ranges from mild diarrhea to life-threatening colitis, and the course in liver transplant patients tends to be more complicated than in immunocompetent patients.12
Diagnosis. Intra-abdominal infections should be looked for and treated promptly, as they are associated with a higher mortality rate, a greater risk of graft loss, and a higher incidence of retransplant.6,10 Abdominal ultrasonography or computed tomography (CT) can confirm the presence of fluid collections.
Treatment. Infected collections can be treated with percutaneous or surgical drainage and antimicrobial therapy. In the case of biliary tract complications, retransplant or surgical correction of biliary leakage or stenosis decreases the risk of death.6
Suspicion should be high for C difficile-associated colitis in cases of posttransplant diarrhea. C difficile toxin stool assays help confirm the diagnosis.12 Oral metronidazole is recommended in mild to moderate C difficile infection, with oral vancomycin and intravenous metronidazole reserved for severe cases. Colectomy may be necessary in patients with toxic megacolon.
CYTOMEGALOVIRUS INFECTION
Cytomegalovirus is an important opportunistic pathogen in liver transplant recipients.13 It causes a range of manifestations, from infection (viremia with or without symptoms) to cytomegalovirus syndrome (fever, malaise, and cell-line cytopenias) to tissue-invasive disease with end-organ disease.14 Without preventive measures and treatment, cytomegalovirus disease can increase the risk of morbidity, allograft loss and death.15,16
Risk factors for cytomegalovirus infection (Table 1) include:
- Discordant serostatus of the donor and recipient (the risk is highest in seronegative recipients of organs from seropositive donors)
- Higher levels of immunosuppression, especially when antilymphocyte antibodies are used
- Treatment of graft rejection
- Coinfection with other human herpesviruses, such as Epstein-Barr virus.4,17
Preventing cytomegalovirus infection
The strategy to prevent cytomegalovirus infection depends on the serologic status of the donor and recipient and may include antiviral prophylaxis or preemptive treatment (Table 2).18
Prophylaxis involves giving antiviral drugs during the early high-risk period, with the goal of preventing the development of cytomegalovirus viremia. The alternative preemptive strategy emphasizes serial testing for cytomegalovirus viremia, with the goal of intervening with antiviral medications while viremia is at a low level, thus avoiding potential progression to cytomegalovirus disease. Both strategies have pros and cons that should be considered by each transplant center when setting institutional policy.
A prophylactic approach seems very effective at preventing both infection and disease from cytomegalovirus and has been shown to reduce graft rejection and the risk of death.18 It is preferred in cytomegalovirus-negative recipients when the donor was cytomegalovirus-positive—a high-risk situation.19 However, these patients are also at higher risk of late-onset cytomegalovirus disease. Higher cost and potential drug toxicity, mainly neutropenia from ganciclovir-based regimens, are additional considerations.
Preemptive treatment, in contrast, reserves drug treatment for patients who are actually infected with cytomegalovirus, thus resulting in fewer adverse drug events and lower cost; but it requires regular monitoring. Preemptive methods, by definition, cannot prevent infection, and with this strategy tissue-invasive disease not associated with viremia does occasionally occur.20 As such, patients with a clinical presentation that suggests cytomegalovirus but have negative results on blood testing should be considered for tissue biopsy with culture and immunohistochemical stain.
The most commonly used regimens for antiviral prophylaxis and treatment in liver transplant recipients are intravenous ganciclovir and oral valganciclovir.21 Although valganciclovir is the most commonly used agent in this setting because of ease of administration, it has not been approved by the US Food and Drug Administration in liver transplant patients, as it was associated with higher rates of cytomegalovirus tissue-invasive disease.22–24 Additionally, drug-resistant cytomegalovirus strains have been associated with valganciclovir prophylaxis in cytomegalovirus-negative recipients of solid organs from cytomegalovirus-positive donors.25
Prophylaxis typically consists of therapy for 3 months from the time of transplant. In higher-risk patients (donor-positive, recipient-negative), longer courses of prophylaxis have been extrapolated from data in kidney transplant recipients.26 Extension or reinstitution of prophylaxis should also be considered in liver transplant patients receiving treatment for rejection with antilymphocyte therapy.
Routine screening for cytomegalovirus is not recommended while patients are receiving prophylaxis. High-risk patients who are not receiving prophylaxis should be monitored with nucleic acid or pp65 antigenemia testing as part of the preemptive strategy protocol.
Treatment of cytomegalovirus disease
Although no specific threshold has been established, treatment is generally indicated if a patient has a consistent clinical syndrome, evidence of tissue injury, and persistent or increasing viremia.
Treatment involves giving antiviral drugs and also reducing the level of immunosuppression, if possible, until symptoms and viremia have resolved.
The choice of antiviral therapy depends on the severity of disease. Intravenous ganciclovir (5 mg/kg twice daily adjusted for renal impairment) or oral valganciclovir (900 mg twice daily, also renally dose-adjusted when necessary) can be used for mild to moderate disease if no significant gastrointestinal involvement is reported. Intravenous ganciclovir is preferred for patients with more severe disease or gastrointestinal involvement. The minimum duration of treatment is 2 weeks and may need to be prolonged until both symptoms and viremia completely resolve.18
Drug resistance can occur and should be considered in patients who have a history of prolonged ganciclovir or valganciclovir exposure who do not clinically improve or have persistent or rising viremia. In such cases, genotype assays are helpful, and initiation of alternative therapy should be considered. Mutations conferring resistance to ganciclovir are often associated with cross-resistance to cidofovir. Cidofovir can therefore be considered only when genotype assays demonstrate specific mutations conferring an isolated resistance to ganciclovir.27 The addition of foscarnet to the ganciclovir regimen or substitution of foscarnet for ganciclovir are accepted approaches.
Although cytomegalovirus hyperimmunoglobulin has been used in prophylaxis and invasive disease treatment, its role in the management of ganciclovir-resistant cytomegalovirus infections remains controversial.28
EPSTEIN-BARR VIRUS POSTTRANSPLANT LYMPHOPROLIFERATIVE DISEASE
Epstein-Barr virus-associated posttransplant lymphoproliferative disease is a spectrum of disorders ranging from an infectious mononucleosis syndrome to aggressive malignancy with the potential for death and significant morbidity after liver transplant.29 The timeline of risk varies, but the disease is most common in the first year after transplant.
Risk factors for this disease (Table 1) are:
- Primary Epstein-Barr virus infection
- Cytomegalovirus donor-recipient mismatch
- Cytomegalovirus disease
- Higher levels of immunosuppression, especially with antilymphocyte antibodies.30
The likelihood of Epstein-Barr virus playing a contributing role is lower in later-onset posttransplant lymphoproliferative disease. Patients who are older at the time of transplant, who receive highly immunogenic allografts including a liver as a component of a multivisceral transplant, and who receive increased immunosuppression to treat rejection are at even greater risk of late posttransplant lymphoproliferative disease.31 This is in contrast to early posttransplant lymphoproliferative disease, which is seen more commonly in children as a result of primary Epstein-Barr virus infection.
Recognition and diagnosis. Heightened suspicion is required when considering posttransplant lymphoproliferative disease, and careful evaluation of consistent symptoms and allograft dysfunction are required.
Clinically, posttransplant lymphoproliferative disease should be suspected if a liver transplant recipient develops unexplained fever, weight loss, lymphadenopathy, or cell-line cytopenias.30,32 Other signs and symptoms may be related to the organ involved and may include evidence of hepatitis, pneumonitis, and gastrointestinal disease.31
Adjunctive diagnostic testing includes donor and recipient serology to characterize overall risk before transplantation and quantification of Epstein-Barr viral load, but confirmation relies on tissue histopathology.
Treatment focuses on reducing immunosuppression.30,32 Adding antiviral agents does not seem to improve outcome in all cases.33 Depending on clinical response and histologic classification, additional therapies such as anti-CD20 humanized chimeric monoclonal antibodies, surgery, radiation, and conventional chemotherapy may be required.34
Preventive approaches remain controversial. Chemoprophylaxis with an antiviral such as ganciclovir is occasionally used but has not been shown to consistently decrease rates of posttransplant lymphoproliferative disease. These agents may act in an indirect manner, leading to decreased rates of cytomegalovirus infection, a major cofactor for posttransplant lymphoproliferative disease.24
Passive immunoprophylaxis with immunoglobulin targeting cytomegalovirus has shown to decrease rates of non-Hodgkin lymphoma from posttransplant lymphoproliferative disease in renal transplant recipients in the first year after transplant,35 but data are lacking regarding its use in liver transplant recipients. Monitoring of the viral load and subsequent reduction of immunosuppression remain the most efficient measures to date.36
FUNGAL INFECTIONS
Candida species account for more than half of fungal infections in liver transplant recipients.37 However, a change has been noted in the past 20 years, with a decrease in Candida infections accompanied by an increase in Aspergillus infections.38 Endemic mycoses such as coccidioidomycosis, blastomycosis, and histoplasmosis should be considered with the appropriate epidemiologic history or if disease develops early after transplant and the donor came from a highly endemic region.39Cryptococcus may also be encountered.
Diagnosis. One of the most challenging aspects of fungal infection in liver transplant recipients is timely diagnosis. Heightened suspicion and early biopsy for pathological and microbiological confirmation are necessary. Although available noninvasive diagnostic tools often lack specificity, early detection of fungal markers may be of great use in guiding further diagnostic workup or empiric treatment in the critically ill.
Noninvasive tests include galactomannan, cryptococcal antigen, histoplasma antigen, (1-3)-beta-D-glucan assay and various antibody tests. Galactomannan testing has been widely used to aid in the diagnosis of invasive aspergillosis. Similarly, the (1-3)-beta-D-glucan assay is a non–culture-based tool for diagnosing and monitoring the treatment of invasive fungal infections. However, a definite diagnosis cannot be made on the basis of a positive test alone.40 The complementary diagnostic characteristics of combining noninvasive assays have yet to be fully elucidated.41 Cultures and tissue histopathology are also used when possible.
Treatment is based on targeted specific antifungal drug therapy and reduction of immunosuppressive therapy, when possible. The choice of antifungal agent varies with the pathogen, the site of involvement, and the severity of the disease. A focus on potential drug interactions, their management, and therapeutic drug monitoring when using antifungal medications is essential in the posttransplant period. Combination therapy can be considered in some situations to enhance synergy. The following sections discuss in greater detail Candida species, Aspergillus species, and Pneumocystis jirovecii infections.
Candida infections
Candidiasis after liver transplant is typically nosocomial, especially when diagnosed during the first 3 months (Table 3).37
Risk factors for invasive candidiasis include perioperative colonization, prolonged operative time, retransplant, greater transfusion requirements, and postoperative renal failure.37,42,43 Invasive candidiasis is of concern for its effects on morbidity, mortality, and cost of care.43–46
Organisms. The frequency of implicated species, in particular those with a natural resistance to fluconazole, differs in various reports.37,45,46Candida albicans remains the most commonly isolated pathogen; however, non-albicans species including those resistant to fluconazole have been reported more frequently and include Candida glabrata and Candida krusei.47,48
Signs and diagnosis. Invasive candidiasis in liver transplant recipients generally manifests itself in catheter-related blood stream infections, urinary tract infections, or intra-abdominal infections. Diagnosis can be made by isolating Candida from blood cultures, recovering organisms in culture of a normally sterile site, or finding direct microscopic evidence of the fungus on tissue specimens.49
Disseminated candidiasis refers to the involvement of distant anatomic sites. Clinical manifestations may cause vision changes, abdominal pain or skin nodules with findings of candidemia, hepatosplenic abscesses, or retinal exudates on funduscopy.49
Treatment of invasive candidiasis in liver recipients often involves antifungal therapy and reduction of immunosuppression. Broad-spectrum antifungals are initially advocated in an empirical approach to cover fluconazole-resistant strains of the non-albicans subgroups.50 Depending on antifungal susceptibility, treatment can later be adjusted.
Fluconazole remains the agent of choice in most C albicans infections.47 However, attention should be paid to the possibility of resistance in patients who have received fluconazole prophylaxis within the past 30 days. Additional agents used in treatment may include echinocandins, amphotericin, and additional azoles.
Antifungal prophylaxis is recommended in high-risk liver transplant patients, although its optimal duration remains undetermined.44 Antifungal prophylaxis has been associated with decreased incidence of both superficial and invasive candidiasis.51
Aspergillus infection
Aspergillus, the second most common fungal pathogen, has become a more common concern in liver transplant recipients. Aspergillus fumigatus is the most frequently encountered species.38,52
Risk factors. These infections typically occur in the first year, during intense immunosuppression. Retransplant, renal failure, and fulminant hepatic failure are major risk factors.52 In the presence of risk factors and a suggestive clinical setting, invasive aspergillosis should be considered and the diagnosis pursued.
Diagnosis is suggested by positive findings on CT accompanied by lower respiratory tract symptoms, focal lesions on neuroimaging, or demonstration of the fungus on cultures.49 However, Aspergillus is rarely grown in blood culture. The galactomannan antigen is a noninvasive test that can provide supporting evidence for the diagnosis.41,52 False-positive results do occur in the setting of certain antibiotics and cross-reacting fungi.53
Treatment consists of antifungal therapy and immunosuppression reduction.52
Voriconazole is the first-line agent for invasive aspergillosis. Monitoring for potential drug-drug interactions and side effects is required.54,55 Amphotericin B is considered a second-line choice due to toxicity and lack of an oral formulation. In refractory cases, combined antifungal therapy could be considered.52 The duration of treatment is generally a minimum of 12 weeks.
Prophylaxis. Specific prophylaxis against invasive aspergillosis is not currently recommended; however, some authors suggest a prophylactic approach using echinocandins or liposomal amphotericin B in high-risk patients.51,52 Aspergillosis is associated with a considerable increase in mortality in liver transplant recipients, which highlights the importance of timely management.52,56
Pneumocystis jirovecii
P jirovecii remains a common opportunistic pathogen in people with impaired immunity, including transplant and human immunodeficiency virus patients.
Prophylaxis. Widespread adoption of antimicrobial prophylaxis by transplant centers has decreased the rates of P jirovecii infection in liver transplant recipients.57,58 Commonly used prophylactic regimens after liver transplantation include a single-strength trimethoprim-sulfamethoxazole tablet daily or a double-strength tablet three times per week for a minimum of 6 to 12 months after transplant. Atovaquone and dapsone can be used as alternatives in cases of intolerance to trimethoprim-sulfamethoxazole (Table 2).
Inhaled pentamidine is clearly inferior and should be used only when the other medications are contraindicated.59
Signs and diagnosis. P jirovecii pneumonia is characterized by fever, cough, dyspnea, and chest pain. Insidious hypoxemia, abnormal chest examination, and bilateral interstitial pneumonia on chest radiography are common.
CT may be more sensitive than chest radiography.57 Findings suggestive of P jirovecii pneumonia on chest CT are extensive bilateral and symmetrical ground-glass attenuations. Other less-characteristic findings include upper lobar parenchymal opacities and spontaneous pneumothorax.57,60
The serum (1,3)-beta-D-glucan assay derived from major cell-wall components of P jirovecii might be helpful. Studies report a sensitivity for P jirovecii pneumonia as high as 96% and a negative predictive value of 99.8%.61,62
Definitive diagnosis requires identification of the pathogen. Routine expectorated sputum sampling is generally associated with a poor diagnostic yield. Bronchoscopy and bronchoalveolar lavage with silver or fluorescent antibody staining of samples, polymerase chain reaction testing, or both significantly improves diagnosis. Transbronchial or open lung biopsy are often unnecessary.57
Treatment. Trimethoprim-sulfamethoxazole is the first-line agent for treating P jirovecii pneumonia.57 The minimum duration of treatment is 14 days, with extended courses for severe infection.
Intravenous pentamidine or clindamycin plus primaquine are alternatives for patients who cannot tolerate trimethoprim-sulfamethoxazole. The major concern with intravenous pentamidine is renal dysfunction. Hypoglycemia or hyperglycemia, neutropenia, thrombocytopenia, nausea, dysgeusia, and pancreatitis may also occur.63
Atovaquone might also be beneficial in mild to moderate P jirovecii pneumonia. The main side effects include skin rashes, gastrointestinal intolerance, and elevation of transaminases.64
A corticosteroid (40–60 mg of prednisone or its equivalent) may be beneficial in conjunction with antimicrobial therapy in patients with significant hypoxia (partial pressure of arterial oxygen < 70 mm Hg on room air) in decreasing the risk of respiratory failure and need for intubation.
With appropriate and timely antimicrobial prophylaxis, cases of P jirovecii pneumonia should continue to decrease.
TUBERCULOSIS
Development of tuberculosis after transplantation is a catastrophic complication, with mortality rates of up to 30%.65 Most cases of posttransplant tuberculosis represent reactivation of latent disease.66 Screening with tuberculin skin tests or interferon-gamma-release assays is recommended in all liver transplant candidates. Chest radiography before transplant is necessary when assessing a positive screening test.67
The optimal management of latent tuberculosis in these cases remains controversial. Patients at high risk or those with positive screening results on chest radiography warrant treatment for latent tuberculosis infection with isoniazid unless contraindicated.67,68
The ideal time to initiate prophylactic isoniazid therapy is unclear. Some authors suggest delaying it, as it might be associated with poor tolerance and hepatotoxicity.69 Others have found that early isoniazid use was not associated with negative outcomes.70
Risk factors for symptomatic tuberculosis after liver transplant include previous infection with tuberculosis, intensified immunosuppression (especially anti-T-lymphocyte therapies), diabetes mellitus, and other co-infections (Table 1).71
The increased incidence of atypical presentations in recent years makes the diagnosis of active tuberculosis among liver transplant recipients challenging. Sputum smears can be negative due to low mycobacterial burdens, and tuberculin skin testing and interferon-gamma-release assays may be falsely negative due to immunosuppression.67
Treatment of active tuberculosis consists initially of a four-drug regimen using isoniazid, rifampin, pyrazinamide, and ethambutol for 2 months. Adjustments are made in accordance with culture and sensitivity results. Treatment can then be tapered to two drugs (isoniazid and rifampin) for a minimum of 4 additional months. Prolonged treatment may be required in instances of extrapulmonary or disseminated disease.65,72
Tuberculosis treatment can be complicated by hepatotoxicity in liver transplant recipients because of direct drug effects and drug-drug interactions with immunosuppressive agents. Close monitoring for rejection and hepatotoxicity is therefore imperative while liver transplant recipients are receiving antituberculosis therapy. Drug-drug interactions may also be responsible for marked reductions in immunosuppression levels, especially with regimens containing rifampin.71 Substitution of rifabutin for rifampin reduces the effect of drug interactions.66
VIRAL HEPATITIS
Hepatitis B virus
Hepatitis B virus-related end-stage liver disease and hepatocellular carcinoma are common indications for liver transplant in Asia. It is less common in the United States and Europe, accounting for less than 10% of all liver transplant cases. Prognosis is favorable in recipients undergoing liver transplant for hepatitis B virus, with excellent survival rates. Prevention of reinfection is crucial in these patients.
Treatment with combination antiviral agents and hepatitis B immunoglobulin (HBIG) is effective.73 Lamivudine was the first nucleoside analogue found to be effective against hepatitis B virus. Its low cost and relative safety are strong arguments in favor of its continued use in liver transplant recipients.74 In patients without evidence of hepatitis B viral replication at the time of transplant, monotherapy with lamivudine has led to low recurrence rates, and adefovir can be added to control resistant viral strains.75
The frequent emergence of resistance with lamivudine favors newer agents such as entecavir or tenofovir. These nucleoside and nucleotide analogues have a higher barrier to resistance, and thus resistance to them is rare. They are also more efficient, potentially allowing use of an HBIG-sparing protocol.76 However, they are associated with a higher risk of nephrotoxicity and require dose adjustments in renal insufficiency. Data directly comparing entecavir and tenofovir are scarce.
Prophylaxis. Most studies support an individualized approach for prevention of hepatitis B virus reinfection. High-risk patients, ie, those positive for HBe antigen or with high viral loads (> 100,000 copies/mL) are generally treated with both HBIG and antiviral agents.77 Low-risk patients are those with a negative HBe antigen, low hepatitis B virus DNA levels, hepatitis B virus-related acute liver failure, and cirrhosis resulting from coinfection with both hepatitis B and hepatitis D virus.75 In low-risk patients, discontinuation of HBIG after 1 to 2 years of treatment is appropriate, and long-term prophylaxis with antiviral agents alone is an option. However, levels of hepatitis B DNA should be monitored closely.78,79
Hepatitis C virus
Recurrence of hepatitis C virus infection is the rule among patients who are viremic at the time of liver transplant.80,81 Most of these patients will show histologic evidence of recurrent hepatitis within the first year after liver transplant. It is often difficult to distinguish between the histopathological appearance of a recurrent hepatitis C virus infection and acute cellular rejection.
Progression to fibrosis and subsequently cirrhosis and decompensation is highly variable in hepatitis C virus-infected liver transplant recipients. Diabetes, insulin resistance, and possibly hepatitis steatosis have been associated with a rapid progression to advanced fibrosis. The contribution of immunosuppression to the progression of hepatitis C virus remains an area of active study. Some studies point to antilymphocyte immunosuppressive agents as a potential cause.82 Liver biopsy is a useful tool in this situation. It allows monitoring of disease severity and progression and may distinguish recurrent hepatitis C virus disease from other causes of liver enzyme elevation.
The major concern with the recurrence of hepatitis C virus infection after liver transplant is allograft loss. Rates of patient and graft survival are reduced in infected patients compared with hepatitis C virus-negative patients.83,84 Prophylactic antiviral therapy has no current role in the management of hepatitis C virus disease. Those manifesting moderate to severe necroinflammation or mild to moderate fibrosis indicative of progressive disease should be treated.81,85
Sustained viral clearance with antiviral agents confers a graft survival benefit.
The combination of peg-interferon and weight-based ribavirin has been the standard of treatment but may be associated with increased rates of rejection.86,87 The sustained virologic response rates for hepatitis C virus range from 60% in genotypes 4, 5, and 6 after 48 weeks of treatment to 60% to 80% in genotypes 2 and 3 after 24 weeks, but only about 30% in genotype 1.88
Treatment with the newer agents, especially protease inhibitors, in genotype 1 (peg-interferon, ribavirin, and either telaprevir or boceprevir) has been evaluated. Success rates reaching 70% have been achieved.89 Adverse effects can be a major setback. Serious complications include severe anemia, renal dysfunction, increased risk of infection, and death.
Triple therapy should be carefully considered in liver transplant patients with genotype 1 hepatitis C virus.90 Significant drug-drug interactions are reported between hepatitis C virus protease inhibitors and immunosuppression regimens. Additional new oral direct- acting antivirals have been investigated. They bring promising advances in hepatitis C virus treatment and pave the way for interferon-free regimens with pangenotypic activity.
IMMUNIZATION
Immunization can decrease the risk of infectious complications in liver transplant recipients, as well as in close contacts and healthcare professionals.3
Influenza. Pretransplant influenza vaccine and posttransplant annual influenza vaccines are necessary.
Pneumococcal immunization should additionally be provided prior to transplant and repeated every 3 to 5 years thereafter.3,91
A number of other vaccinations should also be completed before transplant, including the hepatitis A and B vaccines and the tetanus/diphtheria/acellular pertussis vaccines. However, these vaccinations have not been shown to be detrimental to patients after transplant.91
Varicella and zoster vaccines should be given before liver transplant—zoster in patients over age 60, and varicella in patients with no immunity. Live vaccines, including varicella and zoster vaccines, are contraindicated after liver transplant.3
Human papillomavirus. The bivalent human papillomavirus vaccine can be given before transplant in females ages 9 to 26; the quadrivalent vaccine is beneficial in those ages 9 to 26 and in women under age 45.3,91
IMMUNOSUPPRESSION CARRIES RISK OF INFECTION
Most liver transplant patients require prolonged immunosuppressive therapy. This comes with an increased risk of new or recurrent infections, potentially causing death and significant morbidity.
Evaluation of existing risk factors, appropriate prophylaxis and immunization, timely diagnosis, and treatment of such infections are therefore essential steps for the successful management of liver transplant recipients.
- Fishman JA. Infection in solid-organ transplant recipients. N Engl J Med 2007; 357:2601–2614.
- Avery RK, Michaels MG; AST Infectious Diseases Community of Practice. Strategies for safe living after solid organ transplantation. Am J Transplant 2013; 13(suppl 4):304–310.
- Danziger-Isakov L, Kumar D; AST Infectious Diseases Community of Practice. Vaccination in solid organ transplantation. Am J Transplant 2013; 13(suppl 4):311–317.
- San Juan R, Aguado JM, Lumbreras C, et al; RESITRA Network, Spain. Incidence, clinical characteristics and risk factors of late infection in solid organ transplant recipients: data from the RESITRA study group. Am J Transplant 2007; 7:964–971.
- Ison MG, Grossi P; AST Infectious Diseases Community of Practice. Donor-derived infections in solid organ transplantation. Am J Transplant 2013; 13(suppl 4):22–30.
- Kim YJ, Kim SI, Wie SH, et al. Infectious complications in living-donor liver transplant recipients: a 9-year single-center experience. Transpl Infect Dis 2008; 10:316–324.
- Arnow PM. Infections following orthotopic liver transplantation. HPB Surg 1991; 3:221–233.
- Reid GE, Grim SA, Sankary H, Benedetti E, Oberholzer J, Clark NM. Early intra-abdominal infections associated with orthotopic liver transplantation. Transplantation 2009; 87:1706–1711.
- Said A, Safdar N, Lucey MR, et al. Infected bilomas in liver transplant recipients, incidence, risk factors and implications for prevention. Am J Transplant 2004; 4:574–582.
- Safdar N, Said A, Lucey MR, et al. Infected bilomas in liver transplant recipients: clinical features, optimal management, and risk factors for mortality. Clin Infect Dis 2004; 39:517–525.
- Niemczyk M, Leszczyniski P, Wyzgał J, Paczek L, Krawczyk M, Luczak M. Infections caused by Clostridium difficile in kidney or liver graft recipients. Ann Transplant 2005; 10:70–74.
- Albright JB, Bonatti H, Mendez J, et al. Early and late onset Clostridium difficile-associated colitis following liver transplantation. Transpl Int 2007; 20:856–866.
- Lee SO, Razonable RR. Current concepts on cytomegalovirus infection after liver transplantation. World J Hepatol 2010; 2:325–336.
- Ljungman P, Griffiths P, Paya C. Definitions of cytomegalovirus infection and disease in transplant recipients. Clin Infect Dis 2002; 34:1094–1097.
- Beam E, Razonable RR. Cytomegalovirus in solid organ transplantation: epidemiology, prevention, and treatment. Curr Infect Dis Rep 2012; 14:633–641.
- Bodro M, Sabé N, Lladó L, et al. Prophylaxis versus preemptive therapy for cytomegalovirus disease in high-risk liver transplant recipients. Liver Transpl 2012; 18:1093–1099.
- Weigand K, Schnitzler P, Schmidt J, et al. Cytomegalovirus infection after liver transplantation incidence, risks, and benefits of prophylaxis. Transplant Proc 2010; 42:2634–2641.
- Razonable RR, Humar A; AST Infectious Diseases Community of Practice. Cytomegalovirus in solid organ transplantation. Am J Transplant 2013; 13(suppl 4):93–106.
- Meije Y, Fortún J, Len Ó, et al; Spanish Network for Research on Infection in Transplantation (RESITRA) and the Spanish Network for Research on Infectious Diseases (REIPI). Prevention strategies for cytomegalovirus disease and long-term outcomes in the high-risk transplant patient (D+/R-): experience from the RESITRA-REIPI cohort. Transpl Infect Dis 2014; 16:387–396.
- Durand CM, Marr KA, Arnold CA, et al. Detection of cytomegalovirus DNA in plasma as an adjunct diagnostic for gastrointestinal tract disease in kidney and liver transplant recipients. Clin Infect Dis 2013; 57:1550–1559.
- Levitsky J, Singh N, Wagener MM, Stosor V, Abecassis M, Ison MG. A survey of CMV prevention strategies after liver transplantation. Am J Transplant 2008; 8:158–161.
- Marcelin JR, Beam E, Razonable RR. Cytomegalovirus infection in liver transplant recipients: updates on clinical management. World J Gastroenterol 2014; 20:10658–10667.
- Kalil AC, Freifeld AG, Lyden ER, Stoner JA. Valganciclovir for cytomegalovirus prevention in solid organ transplant patients: an evidence-based reassessment of safety and efficacy. PLoS One 2009; 4:e5512.
- Kalil AC, Mindru C, Botha JF, et al. Risk of cytomegalovirus disease in high-risk liver transplant recipients on valganciclovir prophylaxis: a systematic review and meta-analysis. Liver Transpl 2012; 18:1440–1447.
- Eid AJ, Arthurs SK, Deziel PJ, Wilhelm MP, Razonable RR. Emergence of drug-resistant cytomegalovirus in the era of valganciclovir prophylaxis: therapeutic implications and outcomes. Clin Transplant 2008; 22:162–170.
- Kumar D, Humar A. Cytomegalovirus prophylaxis: how long is enough? Nat Rev Nephrol 2010; 6:13–14.
- Lurain NS, Chou S. Antiviral drug resistance of human cytomegalovirus. Clin Microbiol Rev 2010; 23:689–712.
- Torres-Madriz G, Boucher HW. Immunocompromised hosts: perspectives in the treatment and prophylaxis of cytomegalovirus disease in solid-organ transplant recipients. Clin Infect Dis 2008; 47:702–711.
- Burra P, Buda A, Livi U, et al. Occurrence of post-transplant lymphoproliferative disorders among over thousand adult recipients: any role for hepatitis C infection? Eur J Gastroenterol Hepatol 2006; 18:1065–1070.
- Jain A, Nalesnik M, Reyes J, et al. Posttransplant lymphoproliferative disorders in liver transplantation: a 20-year experience. Ann Surg 2002; 236:429–437.
- Allen UD, Preiksaitis JK; AST Infectious Diseases Community of Practice. Epstein-Barr virus and posttransplant lymphoproliferative disorder in solid organ transplantation. Am J Transplant 2013; 13(suppl 4):107–120.
- Allen U, Preiksaitis J; AST Infectious Diseases Community of Practice. Epstein-Barr virus and posttransplant lymphoproliferative disorder in solid organ transplant recipients. Am J Transplant 2009; 9(suppl 4):S87–S96.
- Perrine SP, Hermine O, Small T, et al. A phase 1/2 trial of arginine butyrate and ganciclovir in patients with Epstein-Barr virus-associated lymphoid malignancies. Blood 2007; 109:2571–2578.
- Jagadeesh D, Woda BA, Draper J, Evens AM. Post transplant lymphoproliferative disorders: risk, classification, and therapeutic recommendations. Curr Treat Options Oncol 2012; 13:122–136.
- Opelz G, Daniel V, Naujokat C, Fickenscher H, Döhler B. Effect of cytomegalovirus prophylaxis with immunoglobulin or with antiviral drugs on post-transplant non-Hodgkin lymphoma: a multicentre retrospective analysis. Lancet Oncol 2007; 8:212–218.
- Nowalk AJ, Green M. Epstein-Barr virus–associated posttransplant lymphoproliferative disorder: strategies for prevention and cure. Liver Transpl 2010; 16(suppl S2):S54–S59.
- Pappas PG, Silveira FP; AST Infectious Diseases Community of Practice. Candida in solid organ transplant recipients. Am J Transplant 2009; 9(suppl 4):S173–S179.
- Singh N, Wagener MM, Marino IR, Gayowski T. Trends in invasive fungal infections in liver transplant recipients: correlation with evolution in transplantation practices. Transplantation 2002; 73:63–67.
- Miller R, Assi M; AST Infectious Diseases Community of Practice. Endemic fungal infections in solid organ transplantation. Am J Transplant 2013; 13(suppl 4):250–261.
- Fontana C, Gaziano R, Favaro M, Casalinuovo IA, Pistoia E, Di Francesco P. (1-3)-beta-D-glucan vs galactomannan antigen in diagnosing invasive fungal infections (IFIs). Open Microbiol J 2012; 6:70–73.
- Aydogan S, Kustimur S, Kalkancı A. Comparison of glucan and galactomannan tests with real-time PCR for diagnosis of invasive aspergillosis in a neutropenic rat model [Turkish]. Mikrobiyol Bul 2010; 44:441–452.
- Hadley S, Huckabee C, Pappas PG, et al. Outcomes of antifungal prophylaxis in high-risk liver transplant recipients. Transpl Infect Dis 2009; 11:40–48.
- Pappas PG, Kauffman CA, Andes D, et al; Infectious Diseases Society of America. Clinical practice guidelines for the management of candidiasis: 2009 update by the Infectious Diseases Society of America. Clin Infect Dis 2009; 48:503–535.
- Person AK, Kontoyiannis DP, Alexander BD. Fungal infections in transplant and oncology patients. Infect Dis Clin North Am 2010; 24:439–459.
- Van Hal SJ, Marriott DJE, Chen SCA, et al; Australian Candidaemia Study. Candidemia following solid organ transplantation in the era of antifungal prophylaxis: the Australian experience. Transpl Infect Dis 2009; 11:122–127.
- Singh N. Fungal infections in the recipients of solid organ transplantation. Infect Dis Clin North Am 2003; 17:113–134,
- Liu X, Ling Z, Li L, Ruan B. Invasive fungal infections in liver transplantation. Int J Infect Dis 2011; 15:e298–e304.
- Raghuram A, Restrepo A, Safadjou S, et al. Invasive fungal infections following liver transplantation: incidence, risk factors, survival, and impact of fluconazole-resistant Candida parapsilosis (2003-2007). Liver Transpl 2012; 18:1100–1109.
- De Pauw B, Walsh TJ, Donnelly JP, et al; European Organization for Research and Treatment of Cancer/Invasive Fungal Infections Cooperative Group; National Institute of Allergy and Infectious Diseases Mycoses Study Group (EORTC/MSG) Consensus Group. Revised definitions of invasive fungal disease from the European Organization for Research and Treatment of Cancer/Invasive Fungal Infections Cooperative Group and the National Institute of Allergy and Infectious Diseases Mycoses Study Group (EORTC/MSG) Consensus Group. Clin Infect Dis 2008; 46:1813–1821.
- Moreno A, Cervera C, Gavaldá J, et al. Bloodstream infections among transplant recipients: results of a nationwide surveillance in Spain. Am J Transplant 2007; 7:2579–2586.
- Cruciani M, Mengoli C, Malena M, Bosco O, Serpelloni G, Grossi P. Antifungal prophylaxis in liver transplant patients: a systematic review and meta-analysis. Liver Transpl 2006; 12:850–858.
- Singh N, Husain S; AST Infectious Diseases Community of Practice. Invasive aspergillosis in solid organ transplant recipients. Am J Transplant 2009; 9(suppl 4):S180–S191.
- Fortún J, Martín-Dávila P, Alvarez ME, et al. False-positive results of Aspergillus galactomannan antigenemia in liver transplant recipients. Transplantation 2009; 87:256–260.
- Cherian T, Giakoustidis A, Yokoyama S, et al. Treatment of refractory cerebral aspergillosis in a liver transplant recipient with voriconazole: case report and review of the literature. Exp Clin Transplant 2012; 10:482–486.
- Luong ML, Hosseini-Moghaddam SM, Singer LG, et al. Risk factors for voriconazole hepatotoxicity at 12 weeks in lung transplant recipients. Am J Transplant 2012; 12:1929–1935.
- Neofytos D, Fishman JA, Horn D, et al. Epidemiology and outcome of invasive fungal infections in solid organ transplant recipients. Transpl Infect Dis 2010; 12:220–229.
- Martin SI, Fishman JA; AST Infectious Diseases Community of Practice. Pneumocystis pneumonia in solid organ transplant recipients. Am J Transplant 2009; 9(suppl 4):S227–S233.
- Levine SJ, Masur H, Gill VJ, et al. Effect of aerosolized pentamidine prophylaxis on the diagnosis of Pneumocystis carinii pneumonia by induced sputum examination in patients infected with the human immunodeficiency virus. Am Rev Respir Dis 1991; 144:760–764.
- Rodriguez M, Sifri CD, Fishman JA. Failure of low-dose atovaquone prophylaxis against Pneumocystis jiroveci infection in transplant recipients. Clin Infect Dis 2004; 38:e76–e78.
- Crans CA Jr, Boiselle PM. Imaging features of Pneumocystis carinii pneumonia. Crit Rev Diagn Imaging 1999; 40:251–284.
- Onishi A, Sugiyama D, Kogata Y, et al. Diagnostic accuracy of serum 1,3-beta-D-glucan for Pneumocystis jiroveci pneumonia, invasive candidiasis, and invasive aspergillosis: systematic review and meta-analysis. J Clin Microbiol 2012; 50:7–15.
- Held J, Koch MS, Reischl U, Danner T, Serr A. Serum (1→3)-ß-D-glucan measurement as an early indicator of Pneumocystis jirovecii pneumonia and evaluation of its prognostic value. Clin Microbiol Infect 2011; 17:595–602.
- Fishman JA. Prevention of infection caused by Pneumocystis carinii in transplant recipients. Clin Infect Dis 2001; 33:1397–1405.
- Colby C, McAfee S, Sackstein R, Finkelstein D, Fishman J, Spitzer T. A prospective randomized trial comparing the toxicity and safety of atovaquone with trimethoprim/sulfamethoxazole as Pneumocystis carinii pneumonia prophylaxis following autologous peripheral blood stem cell transplantation. Bone Marrow Transplant 1999; 24:897–902.
- Subramanian A, Dorman S; AST Infectious Diseases Community of Practice. Mycobacterium tuberculosis in solid organ transplant recipients. Am J Transplant 2009; 9(suppl 4):S57–S62.
- Subramanian AK, Morris MI; AST Infectious Diseases Community of Practice. Mycobacterium tuberculosis infections in solid organ transplantation. Am J Transplant 2013; 13(suppl 4):68–76.
- Horne DJ, Narita M, Spitters CL, Parimi S, Dodson S, Limaye AP. Challenging issues in tuberculosis in solid organ transplantation. Clin Infect Dis 2013; 57:1473–1482.
- Holty JE, Gould MK, Meinke L, Keeffe EB, Ruoss SJ. Tuberculosis in liver transplant recipients: a systematic review and meta-analysis of individual patient data. Liver Transpl 2009; 15:894–906.
- Jafri SM, Singal AG, Kaul D, Fontana RJ. Detection and management of latent tuberculosis in liver transplant patients. Liver Transpl 2011; 17:306–314.
- Fábrega E, Sampedro B, Cabezas J, et al. Chemoprophylaxis with isoniazid in liver transplant recipients. Liver Transpl 2012; 18:1110–1117.
- Aguado JM, Torre-Cisneros J, Fortún J, et al. Tuberculosis in solid-organ transplant recipients: consensus statement of the group for the study of infection in transplant recipients (GESITRA) of the Spanish Society of Infectious Diseases and Clinical Microbiology. Clin Infect Dis 2009; 48:1276–1284.
- Yehia BR, Blumberg EA. Mycobacterium tuberculosis infection in liver transplantation. Liver Transpl 2010; 16:1129–1135.
- Katz LH, Paul M, Guy DG, Tur-Kaspa R. Prevention of recurrent hepatitis B virus infection after liver transplantation: hepatitis B immunoglobulin, antiviral drugs, or both? Systematic review and meta-analysis. Transpl Infect Dis 2010; 12:292–308.
- Jiang L, Jiang LS, Cheng NS, Yan LN. Current prophylactic strategies against hepatitis B virus recurrence after liver transplantation. World J Gastroenterol 2009; 15:2489–2499.
- Riediger C, Berberat PO, Sauer P, et al. Prophylaxis and treatment of recurrent viral hepatitis after liver transplantation. Nephrol Dial Transplant 2007; 22(suppl 8):viii37–viii46.
- Cholongitas E, Vasiliadis T, Antoniadis N, Goulis I, Papanikolaou V, Akriviadis E. Hepatitis B prophylaxis post liver transplantation with newer nucleos(t)ide analogues after hepatitis B immunoglobulin discontinuation. Transpl Infect Dis 2012; 14:479–487.
- Fox AN, Terrault NA. Individualizing hepatitis B infection prophylaxis in liver transplant recipients. J Hepatol 2011; 55:507–509.
- Fox AN, Terrault NA. The option of HBIG-free prophylaxis against recurrent HBV. J Hepatol 2012; 56:1189–1197.
- Wesdorp DJ, Knoester M, Braat AE, et al. Nucleoside plus nucleotide analogs and cessation of hepatitis B immunoglobulin after liver transplantation in chronic hepatitis B is safe and effective. J Clin Virol 2013; 58:67–73.
- Terrault NA, Berenguer M. Treating hepatitis C infection in liver transplant recipients. Liver Transpl 2006; 12:1192–1204.
- Ciria R, Pleguezuelo M, Khorsandi SE, et al. Strategies to reduce hepatitis C virus recurrence after liver transplantation. World J Hepatol 2013; 5:237–250.
- Issa NC, Fishman JA. Infectious complications of antilymphocyte therapies in solid organ transplantation. Clin Infect Dis 2009; 48:772–786.
- Kalambokis G, Manousou P, Samonakis D, et al. Clinical outcome of HCV-related graft cirrhosis and prognostic value of hepatic venous pressure gradient. Transpl Int 2009; 22:172–181.
- Neumann UP, Berg T, Bahra M, et al. Long-term outcome of liver transplants for chronic hepatitis C: a 10-year follow-up. Transplantation 2004; 77:226–231.
- Wiesner RH, Sorrell M, Villamil F; International Liver Transplantation Society Expert Panel. Report of the first International Liver Transplantation Society expert panel consensus conference on liver transplantation and hepatitis C. Liver Transpl 2003; 9:S1–S9.
- Dinges S, Morard I, Heim M, et al; Swiss Association for the Study of the Liver (SASL 17). Pegylated interferon-alpha2a/ribavirin treatment of recurrent hepatitis C after liver transplantation. Transpl Infect Dis 2009; 11:33–39.
- Veldt BJ, Poterucha JJ, Watt KD, et al. Impact of pegylated interferon and ribavirin treatment on graft survival in liver transplant patients with recurrent hepatitis C infection. Am J Transplant 2008; 8:2426–2433.
- Faisal N, Yoshida EM, Bilodeau M, et al. Protease inhibitor-based triple therapy is highly effective for hepatitis C recurrence after liver transplant: a multicenter experience. Ann Hepatol 2014; 13:525–532.
- Mariño Z, van Bömmel F, Forns X, Berg T. New concepts of sofosbuvir-based treatment regimens in patients with hepatitis C. Gut 2014; 63:207–215.
- Coilly A, Roche B, Dumortier J, et al. Safety and efficacy of protease inhibitors to treat hepatitis C after liver transplantation: a multicenter experience. J Hepatol 2014; 60:78–86.
- Lucey MR, Terrault N, Ojo L, et al. Long-term management of the successful adult liver transplant: 2012 practice guideline by the American Association for the Study of Liver Diseases and the American Society of Transplantation. Liver Transpl 2013; 19:3–26.
KEY POINTS
- After liver transplant, the risk of infection and the likely causal organisms vary with the patient’s state of immunosuppression and the time of infection.
- Recurrent or newly acquired infections may jeopardize the survival of the graft and the recipient.
- Because infections with viruses, fungi, and atypical pathogens can alter the prognosis, they need to be prevented and carefully managed.
- An ongoing assessment of each patient’s risk of infection allows the clinician to constantly and efficiently adapt immunosuppressive, prophylactic, and therapeutic strategies.
Noncosmetic uses of botulinum toxin in otolaryngology
Botulinum toxin is commonly used to treat movement disorders of the head and neck. It was first used to treat focal eye dystonia (blepharospasm) and laryngeal dystonia (spasmodic dysphonia) and is now also used for other head and neck dystonias, movement disorders, and muscle spasticity or contraction.
This article reviews the use of botulinum toxin for primary disorders of the laryngopharynx—adductor and abductor spasmodic dysphonias, laryngopharyngeal tremor, and cricopharyngeus muscle dysfunction—and its efficacy and side effects for the different conditions.
ABNORMAL MUSCLE MOVEMENT
Dystonia is abnormal muscle movement characterized by repetitive involuntary contractions. Dystonic contractions are described as either sustained (tonic) or spasmodic (clonic) and are typically induced by conscious action to move the muscle group.1,2 Dystonia can be categorized according to the amount of muscle involvement: generalized (widespread muscle activity), segmental (involving neighboring groups of muscles), or focal (involving only one or a few local small muscles).3 Activity may be associated with gross posturing and disfigurement, depending on the size and location of the muscle contractions, although the muscle action is usually normal during rest.
The cause of dystonia has been the focus of much debate and investigation. Some types of dystonia have strong family inheritance patterns, but most are sporadic, possibly brought on by trauma or infection. In most cases, dystonia is idiopathic, although it may be associated with other muscle group dystonias, tremor, neurologic injury or insults, other neurologic diseases and neurodegenerative disorders, or tardive syndromes.1 Because of the relationship with other neurologic diseases, consultation with a neurologist should be considered.
Treatment of the muscle contractions of the various dystonias includes drug therapy and physical, occupational, and voice therapy. Botulinum toxin is a principal treatment for head and neck dystonias and works by blocking muscular contractions.4 It has the advantages of having few side effects and predictable results for many conditions, although repeat injections are usually required to achieve a sustained effect.
LARYNGEAL DYSTONIAS CAUSE VOICE ABNORMALITIES
The most common laryngeal dystonia is spasmodic dysphonia, a focal dystonia of the larynx. It is subdivided into two types according to whether spasm of the vocal folds occurs during adduction or abduction.
Adductor spasmodic dysphonia accounts for 80% to 90% of cases. It is characterized by irregular speech with pitch breaks and a strained or strangulated voice. It was formerly treated by resection of the nerve to the vocal folds, but results were neither consistent nor persistent. Currently, the primary treatment is injection of botulinum toxin, which has a high success rate,5 with patients reporting about a 90% return of normal function.
Abductor spasmodic dysphonia accounts for 10% to 20% of cases.6 Patients have a breathy quality to the voice with a short duration of vocalization due to excessive loss of air on phonation. This is especially noticeable when the patient speaks words that begin with a voiceless consonant followed by a vowel (eg, pat, puppy). Response to botulinum toxin injection is more variable,6 possibly because of the pathophysiology of the disorder or because of the technical challenges of administering the injection.
Fewer than 1% of patients have both abductor and adductor components, and their treatment can be particularly challenging.
Adductor spasmodic dysphonia: Treatment usually successful
Botulinum toxin can be injected for adductor spasmodic dysphonia via a number of approaches, the most common being through the cricothyroid membrane (Figure 1). Injections can be made into one or both vocal folds and can be performed under guidance with laryngeal electromyography or with a flexible laryngoscope to visualize the larynx.
Patients typically experience breathiness beginning 1 or 2 days after the injection, and this effect may last for up to 2 weeks. During that time, the patient may be more susceptible to aspiration of thin liquids and so is instructed to drink cautiously. Treatment benefits typically last for 3 to 6 months. As the botulinum toxin wears off, the patient notices a gradual increase in vocal straining and effort.
Dosages of botulinum toxin for subsequent treatments are adjusted by balancing the period of benefit with postinjection breathiness. The desire of the patient should be paramount. Some are willing to tolerate more side effects to avoid frequent injections, so they can be given a larger dose. Others cannot tolerate the breathiness but are willing to accept more frequent injections, so they should be given a smaller dose. In rare cases, patients have significant breathiness from even small doses; they may be helped by injecting into only one vocal fold or, alternatively, into a false vocal fold, allowing diffusion of the toxin down to the muscle of the true vocal fold.
Abductor spasmodic dysphonia: Treatment more challenging
The success of botulinum toxin treatment for abductor spasmodic dysphonia is more variable than for the adductor type. The injections are made into the posterior cricoarytenoid muscle (Figure 2); because this muscle cannot be directly visualized, this procedure requires guidance with laryngeal electromyography. Most patients note improvement, and about 20% have a good response.6 Most require a second injection about 1 month later, often on the other side. Bilateral injections at one sitting may compromise the airway, and vocal fold motion should be evaluated at the time of the contralateral injection to assess airway patency. Interest has increased in simultaneous bilateral injections with lower doses of botulinum toxin, and this approach has been shown to be safe.7
ESSENTIAL TREMOR OF THE VOICE
Essential tremor is an action tremor that can occur with voluntary movement. It can occur anywhere in the body, often the head or hand, but the voice can also be affected. About half of cases are hereditary. Essential tremor of the voice causes a rhythmic oscillation of pitch and intensity.
Consultation with a neurologist is recommended to evaluate the cause, although voice tremor is often idiopathic and occurs in about 30% of patients with essential tremor in the arms or legs, as well as in about 30% of patients with spasmodic dysphonia. Extremity tremor can usually be successfully managed medically, but this is not true for voice tremor.
Botulinum toxin injection is the mainstay of treatment for essential tremor of the voice, although its success is marginal. About two-thirds of patients have some degree of improvement from traditional botulinum toxin injections in the true vocal fold.8
The results of treatment are likely to be inconsistent because tremor tends to involve several different muscles used in voice production, commonly in the soft palate, tongue base, pharyngeal walls, strap muscles, false vocal folds, and true vocal folds. A location-oriented tremor scoring system9 can help identify the involved muscles to guide injections. Treatment is less likely to be successful in patients with multiple sites of voice tremor. Injection into the false vocal fold, true vocal fold, and interarytenoid muscle10 can safely be performed; injections into the palate, tongue base, and strap muscles are to be avoided because of the high risk of postinjection aspiration.
Patients who have good results can have repeat treatments as needed. The dosage of botulinum toxin is adjusted according to response, side effects (eg, breathy voice, dysphagia), and patient preference.
CRICOPHARYNGEUS MUSCLE DYSFUNCTION: TROUBLE SWALLOWING
Dysfunction of the cricopharyngeus muscle causes difficulty swallowing, especially swallowing solid foods. It can be attributed to a mechanical stricture or to hyperfunction (spasm).
Mechanical stricture at the esophageal inlet frequently occurs in patients who have had a total laryngectomy for advanced laryngeal cancer. Fibrosis tends to be worse in patients who have also undergone radiation therapy.
Stricture can be treated with botulinum toxin injections and dilation. Conservative treatment is preferred to surgical myotomy for patients with complex postlaryngectomy anatomy and scarring from radiation therapy.
Cricopharyngeus muscle spasm or hyperfunction can be an important cause of dysphagia, especially in the elderly. Patients should be evaluated with barium esophagography or a modified barium swallow. The finding of a cricopharyngeal “bar” provides evidence of contraction of the muscle that impedes the passage of food.
Botulinum toxin injections for cricopharyngeus muscle dysfunction (Figure 2) can be effective in some cases, especially if the toxin is injected bilaterally. However, because the cricopharyngeus muscle plays an important role in preventing esophageal reflux into the laryngopharynx, botulinum toxin injection in patients with substantial hiatal hernia or laryngopharyngeal reflux disease should only be done with caution. In addition, treatment of reflux disease should be considered in any patient undergoing botulinum toxin injection for cricopharyngeus muscle dysfunction.
Most patients require repeat injections when the toxin wears off, although occasionally one or two injections provide long-term or permanent relief. Dosages are adjusted for the patient’s age, the presence of other swallowing problems, and reflux. Patients may experience increased difficulty swallowing for 1 or 2 weeks after the procedure and so should be counseled to eat slowly and carefully.
- Cultrara A, Chitkara A, Blitzer A. Botulinum toxin injections for the treatment of oromandibular dystonia. Oper Tech Otolaryngol Head Neck Surg 2004; 15:97–102.
- Fahn S. The varied clinical expressions of dystonia. Neurol Clin 1984; 2:541–554.
- Fahn S. Concept and classification of dystonia. Adv Neurol 1988; 50:1–8.
- Benninger MS, Knott PD. Techniques of botulinum toxin injections in the head and neck. San Diego, CA: Plural Publishing, Inc; 2012.
- Benninger MS, Gardner G, Grywalski C. Outcomes of botulinum toxin treatment for spasmodic dysphonia. Arch Otolaryngol Head Neck Surg 2001; 127:1083–1085.
- Blitzer A, Brin MF, Stewart CF. Botulinum toxin management of spasmodic dysphonia (laryngeal dystonia): a 12-year experience in more than 900 patients. Laryngoscope 1998; 108:1435–1441.
- Klein AM, Stong BC, Wise J, DelGaudio JM, Hapner ER, Johns MM 3rd. Vocal outcome measures after bilateral posterior cricoarytenoid muscle botulinum toxin injections for abductor spasmodic dysphonia. Otolaryngol Head Neck Surg 2008; 139:421–423.
- Hertegård S, Granqvist S, Lindestad PA. Botulinum toxin injections for essential voice tremor. Ann Otol Rhinol Laryngol 2000; 109:204–209.
- Bové M, Daamen N, Rosen C, Wang CC, Sulica L, Gartner-Schmidt J. Development and validation of the vocal tremor scoring system. Laryngoscope 2006; 116:1662–1667.
- Kendall KA, Leonard RJ. Interarytenoid muscle Botox injection for treatment of adductor spasmodic dysphonia with vocal tremor. J Voice 2001; 25:114–119.
Botulinum toxin is commonly used to treat movement disorders of the head and neck. It was first used to treat focal eye dystonia (blepharospasm) and laryngeal dystonia (spasmodic dysphonia) and is now also used for other head and neck dystonias, movement disorders, and muscle spasticity or contraction.
This article reviews the use of botulinum toxin for primary disorders of the laryngopharynx—adductor and abductor spasmodic dysphonias, laryngopharyngeal tremor, and cricopharyngeus muscle dysfunction—and its efficacy and side effects for the different conditions.
ABNORMAL MUSCLE MOVEMENT
Dystonia is abnormal muscle movement characterized by repetitive involuntary contractions. Dystonic contractions are described as either sustained (tonic) or spasmodic (clonic) and are typically induced by conscious action to move the muscle group.1,2 Dystonia can be categorized according to the amount of muscle involvement: generalized (widespread muscle activity), segmental (involving neighboring groups of muscles), or focal (involving only one or a few local small muscles).3 Activity may be associated with gross posturing and disfigurement, depending on the size and location of the muscle contractions, although the muscle action is usually normal during rest.
The cause of dystonia has been the focus of much debate and investigation. Some types of dystonia have strong family inheritance patterns, but most are sporadic, possibly brought on by trauma or infection. In most cases, dystonia is idiopathic, although it may be associated with other muscle group dystonias, tremor, neurologic injury or insults, other neurologic diseases and neurodegenerative disorders, or tardive syndromes.1 Because of the relationship with other neurologic diseases, consultation with a neurologist should be considered.
Treatment of the muscle contractions of the various dystonias includes drug therapy and physical, occupational, and voice therapy. Botulinum toxin is a principal treatment for head and neck dystonias and works by blocking muscular contractions.4 It has the advantages of having few side effects and predictable results for many conditions, although repeat injections are usually required to achieve a sustained effect.
LARYNGEAL DYSTONIAS CAUSE VOICE ABNORMALITIES
The most common laryngeal dystonia is spasmodic dysphonia, a focal dystonia of the larynx. It is subdivided into two types according to whether spasm of the vocal folds occurs during adduction or abduction.
Adductor spasmodic dysphonia accounts for 80% to 90% of cases. It is characterized by irregular speech with pitch breaks and a strained or strangulated voice. It was formerly treated by resection of the nerve to the vocal folds, but results were neither consistent nor persistent. Currently, the primary treatment is injection of botulinum toxin, which has a high success rate,5 with patients reporting about a 90% return of normal function.
Abductor spasmodic dysphonia accounts for 10% to 20% of cases.6 Patients have a breathy quality to the voice with a short duration of vocalization due to excessive loss of air on phonation. This is especially noticeable when the patient speaks words that begin with a voiceless consonant followed by a vowel (eg, pat, puppy). Response to botulinum toxin injection is more variable,6 possibly because of the pathophysiology of the disorder or because of the technical challenges of administering the injection.
Fewer than 1% of patients have both abductor and adductor components, and their treatment can be particularly challenging.
Adductor spasmodic dysphonia: Treatment usually successful
Botulinum toxin can be injected for adductor spasmodic dysphonia via a number of approaches, the most common being through the cricothyroid membrane (Figure 1). Injections can be made into one or both vocal folds and can be performed under guidance with laryngeal electromyography or with a flexible laryngoscope to visualize the larynx.
Patients typically experience breathiness beginning 1 or 2 days after the injection, and this effect may last for up to 2 weeks. During that time, the patient may be more susceptible to aspiration of thin liquids and so is instructed to drink cautiously. Treatment benefits typically last for 3 to 6 months. As the botulinum toxin wears off, the patient notices a gradual increase in vocal straining and effort.
Dosages of botulinum toxin for subsequent treatments are adjusted by balancing the period of benefit with postinjection breathiness. The desire of the patient should be paramount. Some are willing to tolerate more side effects to avoid frequent injections, so they can be given a larger dose. Others cannot tolerate the breathiness but are willing to accept more frequent injections, so they should be given a smaller dose. In rare cases, patients have significant breathiness from even small doses; they may be helped by injecting into only one vocal fold or, alternatively, into a false vocal fold, allowing diffusion of the toxin down to the muscle of the true vocal fold.
Abductor spasmodic dysphonia: Treatment more challenging
The success of botulinum toxin treatment for abductor spasmodic dysphonia is more variable than for the adductor type. The injections are made into the posterior cricoarytenoid muscle (Figure 2); because this muscle cannot be directly visualized, this procedure requires guidance with laryngeal electromyography. Most patients note improvement, and about 20% have a good response.6 Most require a second injection about 1 month later, often on the other side. Bilateral injections at one sitting may compromise the airway, and vocal fold motion should be evaluated at the time of the contralateral injection to assess airway patency. Interest has increased in simultaneous bilateral injections with lower doses of botulinum toxin, and this approach has been shown to be safe.7
ESSENTIAL TREMOR OF THE VOICE
Essential tremor is an action tremor that can occur with voluntary movement. It can occur anywhere in the body, often the head or hand, but the voice can also be affected. About half of cases are hereditary. Essential tremor of the voice causes a rhythmic oscillation of pitch and intensity.
Consultation with a neurologist is recommended to evaluate the cause, although voice tremor is often idiopathic and occurs in about 30% of patients with essential tremor in the arms or legs, as well as in about 30% of patients with spasmodic dysphonia. Extremity tremor can usually be successfully managed medically, but this is not true for voice tremor.
Botulinum toxin injection is the mainstay of treatment for essential tremor of the voice, although its success is marginal. About two-thirds of patients have some degree of improvement from traditional botulinum toxin injections in the true vocal fold.8
The results of treatment are likely to be inconsistent because tremor tends to involve several different muscles used in voice production, commonly in the soft palate, tongue base, pharyngeal walls, strap muscles, false vocal folds, and true vocal folds. A location-oriented tremor scoring system9 can help identify the involved muscles to guide injections. Treatment is less likely to be successful in patients with multiple sites of voice tremor. Injection into the false vocal fold, true vocal fold, and interarytenoid muscle10 can safely be performed; injections into the palate, tongue base, and strap muscles are to be avoided because of the high risk of postinjection aspiration.
Patients who have good results can have repeat treatments as needed. The dosage of botulinum toxin is adjusted according to response, side effects (eg, breathy voice, dysphagia), and patient preference.
CRICOPHARYNGEUS MUSCLE DYSFUNCTION: TROUBLE SWALLOWING
Dysfunction of the cricopharyngeus muscle causes difficulty swallowing, especially swallowing solid foods. It can be attributed to a mechanical stricture or to hyperfunction (spasm).
Mechanical stricture at the esophageal inlet frequently occurs in patients who have had a total laryngectomy for advanced laryngeal cancer. Fibrosis tends to be worse in patients who have also undergone radiation therapy.
Stricture can be treated with botulinum toxin injections and dilation. Conservative treatment is preferred to surgical myotomy for patients with complex postlaryngectomy anatomy and scarring from radiation therapy.
Cricopharyngeus muscle spasm or hyperfunction can be an important cause of dysphagia, especially in the elderly. Patients should be evaluated with barium esophagography or a modified barium swallow. The finding of a cricopharyngeal “bar” provides evidence of contraction of the muscle that impedes the passage of food.
Botulinum toxin injections for cricopharyngeus muscle dysfunction (Figure 2) can be effective in some cases, especially if the toxin is injected bilaterally. However, because the cricopharyngeus muscle plays an important role in preventing esophageal reflux into the laryngopharynx, botulinum toxin injection in patients with substantial hiatal hernia or laryngopharyngeal reflux disease should only be done with caution. In addition, treatment of reflux disease should be considered in any patient undergoing botulinum toxin injection for cricopharyngeus muscle dysfunction.
Most patients require repeat injections when the toxin wears off, although occasionally one or two injections provide long-term or permanent relief. Dosages are adjusted for the patient’s age, the presence of other swallowing problems, and reflux. Patients may experience increased difficulty swallowing for 1 or 2 weeks after the procedure and so should be counseled to eat slowly and carefully.
- Cultrara A, Chitkara A, Blitzer A. Botulinum toxin injections for the treatment of oromandibular dystonia. Oper Tech Otolaryngol Head Neck Surg 2004; 15:97–102.
- Fahn S. The varied clinical expressions of dystonia. Neurol Clin 1984; 2:541–554.
- Fahn S. Concept and classification of dystonia. Adv Neurol 1988; 50:1–8.
- Benninger MS, Knott PD. Techniques of botulinum toxin injections in the head and neck. San Diego, CA: Plural Publishing, Inc; 2012.
- Benninger MS, Gardner G, Grywalski C. Outcomes of botulinum toxin treatment for spasmodic dysphonia. Arch Otolaryngol Head Neck Surg 2001; 127:1083–1085.
- Blitzer A, Brin MF, Stewart CF. Botulinum toxin management of spasmodic dysphonia (laryngeal dystonia): a 12-year experience in more than 900 patients. Laryngoscope 1998; 108:1435–1441.
- Klein AM, Stong BC, Wise J, DelGaudio JM, Hapner ER, Johns MM 3rd. Vocal outcome measures after bilateral posterior cricoarytenoid muscle botulinum toxin injections for abductor spasmodic dysphonia. Otolaryngol Head Neck Surg 2008; 139:421–423.
- Hertegård S, Granqvist S, Lindestad PA. Botulinum toxin injections for essential voice tremor. Ann Otol Rhinol Laryngol 2000; 109:204–209.
- Bové M, Daamen N, Rosen C, Wang CC, Sulica L, Gartner-Schmidt J. Development and validation of the vocal tremor scoring system. Laryngoscope 2006; 116:1662–1667.
- Kendall KA, Leonard RJ. Interarytenoid muscle Botox injection for treatment of adductor spasmodic dysphonia with vocal tremor. J Voice 2001; 25:114–119.
KEY POINTS
- Botulinum toxin can be injected with a variety of approaches directly into the affected muscle exhibiting abnormal contractions.
- Depending on the muscles involved, side effects may include breathiness or difficulty swallowing for a period soon after injection.
- Injections can be repeated as needed as the toxin wears off.
- Some conditions are more amenable to treatment than others. Benefit can be enhanced by altering the dosage or injection site.
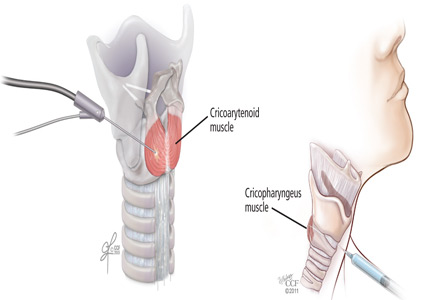
Recreational cannabis use: Pleasures and pitfalls
Clinicians may be encountering more cannabis users than before, and may be encountering users with complications hitherto unseen. Several trends may explain this phenomenon: the legal status of cannabis is changing, cannabis today is more potent than in the past, and enthusiasts are conjuring new ways to enjoy this substance.
This article discusses the history, pharmacology, and potential complications of cannabis use.
A LONG AND TANGLED HISTORY
Cannabis is a broad term that refers to the cannabis plant and its preparations, such as marijuana and hashish, as well as to a family of more than 60 bioactive substances called cannabinoids. It is the most commonly used illegal drug in the world, with an estimated 160 million users. Each year, about 2.4 million people in the United States use it for the first time.1,2
Cannabis has been used throughout the world for recreational and spiritual purposes for nearly 5,000 years, beginning with the fabled Celestial Emperors of China. The tangled history of cannabis in America began in the 17th century, when farmers were required by law to grow it as a fiber crop. It later found its way into the US Pharmacopeia for a wide range of indications. During the long prelude to Prohibition in the latter half of the 19th century, the US government became increasingly suspicious of mind-altering substances and began restricting its prescription in 1934, culminating in its designation by the US Food and Drug Administration as a schedule I controlled substance in 1970.
Investigation into the potential medical uses for the different chemicals within cannabis is ongoing, as is debate over its changing legality and usefulness to society. The apparent cognitive dissonance surrounding the use and advocacy of medical marijuana is beyond the scope of this review,3 which will instead restrict itself to what is known of the cannabinoids and to the recreational use of cannabis.
THC IS THE PRINCIPAL PSYCHOACTIVE MOLECULE
Delta-9 tetrahydrocannabinol (THC), first isolated in 1964, was identified as the principal psychoactive constituent of cannabis in 2002.4
Two G-protein–linked cannabinoid receptors cloned in the 1990s—CB1 and CB2—were found to be a part of a system of endocannabinoid receptors present throughout the body, from the brain to the immune system to the vas deferens.5 Both receptors inhibit cellular excitation by activating inwardly rectifying potassium channels. These receptors are mostly absent in the brainstem, which may explain why cannabis use rarely causes life-threatening autonomic dysfunction. Although the intoxicating effects of marijuana are mediated by CB1 receptors, the specific mechanisms underlying the cannabis “high” are unclear.6
CANNABINOIDS ARE LIPID-SOLUBLE
The rate of absorption of cannabinoids depends on the route of administration and the type of cannabis product used. When cannabis products are smoked, up to 35% of THC is available, and the average time to peak serum concentration is 8 minutes.7 The peak concentration depends on the dose.
On the other hand, when cannabis products (eg, nabilone, dronabinol) are ingested, absorption is unpredictable because THC is unstable in gastric acid and undergoes first-pass metabolism in the liver, which reduces the drug’s bioavailability. Up to 20% of an ingested dose of THC is absorbed, and the time to peak serum concentration averages between 2 and 4 hours. Consequently, many users prefer to smoke cannabis as a means to control the desired effects.
Cannabinoids are lipid-soluble. They accumulate in fatty tissue in a biphasic pattern, initially moving into highly vascularized tissue such as the liver before accumulating in less well-vascularized tissue such as fat. They are then slowly released from fatty tissue as the fat turns over. THC itself has a volume of distribution of about 2.5 to 3.5 L/kg. It crosses the placenta and enters breast milk.8
THC is metabolized by the cytochrome P450 system, primarily by the enzymes CYP2C9 and CYP3A4. Its primary metabolite, 11-hydroxy-delta-9 THC, is also active, but subsequent metabolism produces many other inactive metabolites. THC is eliminated in feces and urine, and its half-life ranges from 2 to nearly 60 hours.8
A LITTLE ABOUT PLANTS AND STREET NAMES
The plant from which THC and nearly a hundred other chemicals, including cannabinoids, are derived has been called many things over the years:
Hemp is a tall fibrous plant grown for rope and fabric that was used as legal tender in early America. In the mid-19th century, there were over 16 million acres of hemp plantations. Hemp contains very low THC concentrations.
Cannabis is an annual flowering herb that is predominantly diecious (ie, there are male and female plants). After a centuries-long debate among taxonomists, the two principal species are considered to be C sativa and C indica, although today many cannabis cultivars are grown by a great number of breeding enthusiasts.
Concentrations of THC vary widely among cannabis cultivars, ranging historically from around 5% to today’s highly selectively bred species containing more than 30%. Concentrations in seized cannabis have been measured as high as 37%, although the average is around 11%.9 This concentration is defined by the percent of THC per dried mass of plant material tested, usually via gas chromatography.
Hashish is a solid or resinous preparation of the trichomes, or glandular hairs, that grow on the cannabis plant, chiefly on its flowers. Various methods to separate the trichomes from the rest of the plant result in a powder called kief that is then compressed into blocks or bricks. THC concentrations as high as 66% have been measured in nondomestic sources of hashish.9
Hash oil is a further purification, produced by using solvents to dissolve the resin and by filtering out remaining plant material. Evaporating the solvent produces hash oil, sometimes called butane hash oil or honey oil. This process has recently led to an increasing number of home explosions, as people attempt to make the product themselves but do not take suitable precautions when using flammable solvents such as butane. THC concentrations as high as 81% have been measured in nondomestic sources of hash oil.9
Other names for hash oil are dab, wax, and budder. Cannabis enthusiasts refer to the use of hash oil as dabbing, which involves heating a small amount (dab) of the product using a variety of paraphernalia and inhaling the vapor.
IT’S ALL ABOUT GETTING HIGH
For recreational users, the experience has always been about being intoxicated—getting high. The psychological effects range broadly from positive to negative and vary both within and between users, depending on the dose and route of administration. Additional factors that influence the psychological effects include the social and physical settings of drug use and even the user’s expectations. One user’s high is another user’s acute toxic effect.
Although subjective reports of the cannabis experience vary greatly, it typically begins with a feeling of dizziness or lightheadedness followed by a relaxed calm and a feeling of being somewhat “disconnected.” There is a quickening of the sense of humor, described by some as a fatuous euphoria; often there is silly giggling. Awareness of the senses and of music may be increased. Appetite increases, and time seems to pass quickly. Eventually, the user becomes drowsy and experiences decreased attention and difficulty maintaining a coherent conversation. Slowed reaction time and decreased psychomotor activity may also occur. The user may drift into daydreams and eventually fall asleep.
Common negative acute effects of getting high can include mild to severe anxiety and feeling tense or agitated. Clumsiness, headache, and confusion are also possible. Lingering effects the following day may include dry mouth, dry eyes, fatigue, slowed thinking, and slowed recall.6
ACUTE PHYSICAL EFFECTS
Acute physical effects of cannabis use include a rapid onset of increased airway conductance, decreased intraocular pressure, and conjunctival injection. A single cannabis cigarette can also induce cardiovascular effects including a dose-dependent increase in heart rate and blood pressure. Chronic users, however, can experience a decreased heart rate, lower blood pressure, and postural hypotension.
In a personal communication, colleagues in Colorado—where recreational use of cannabis was legalized in 2012—described a sharp increase (from virtually none) in the number of adults presenting to the emergency department with cannabis intoxication since 2012. Their patients experienced palpitations, light-headedness, and severe ataxia lasting as long as 12 hours, possibly reflecting the greater potency of current cannabis products. Most of these patients required only supportive care.
Other acute adverse cardiovascular reactions that have been reported include atrial fibrillation, ventricular tachycardia, and a fivefold increased risk of myocardial infarction in the 60 minutes following cannabis use, which subsequently drops sharply to baseline levels.10 Investigations into the cardiovascular effects of cannabis are often complicated by concurrent use of other drugs such as tobacco or cocaine. Possible mechanisms of injury include alterations in coronary microcirculation or slowed coronary flow. In fact, one author found that cannabis users with a history of myocardial infarction had a risk of death 4.2 times higher than users with no history of myocardial infarction.11,12
In children, acute toxicity has been reported from a variety of exposures to cannabis and hashish, including a report of an increase in pediatric cannabis exposures following the changes in Colorado state laws.13 Most of these patients had altered mental status ranging from drowsiness to coma; one report describes a child who experienced a first-time seizure. These patients unfortunately often underwent extensive evaluations such as brain imaging and lumbar puncture, and mechanical ventilation to protect the airway. Earlier consideration of cannabis exposure in these patients might have limited unnecessary testing. Supportive care is usually all that is needed, and most of these patients fully recover.13–17
CHRONIC EFFECTS
Cannabinoids cause a variety of adverse effects, but the ultimate risk these changes pose to human health has been difficult to calculate. Long-term studies are confounded by possible inaccuracies of patient self-reporting of cannabis use, poor control of covariates, and disparate methodologies.
For more than a century, cannabis use has been reported to cause both acute psychotic symptoms and persistent psychotic disorders.18 But the strength of this relationship is modest. Cannabis is more likely a component cause that, in addition to other factors (eg, specific genetic polymorphisms), contributes to the risk of schizophrenia. Individuals with prodromal symptoms and those who have experienced discrete episodes of psychosis related to cannabis use should be discouraged from using cannabis and cannabinoids.19–21
Mounting evidence implicates chronic cannabis use as a cause of long-term medical problems including chronic bronchitis,22 elevated rates of myocardial infarction and dysrhythmias,11 bone loss,23 and cancers at eight different sites including the lung, head, and neck.24 In view of these chronic effects, healthcare providers should caution their patients about cannabis use, as we do about other drugs such as tobacco.
WITHDRAWAL SYNDROME RECOGNIZED
Until recently, neither clinicians nor users recognized a withdrawal syndrome associated with chronic use of cannabis, probably because this syndrome is not as severe as withdrawal from other controlled substances such as opioids or sedative-hypnotics. A number of studies, however, have reported subtle cannabis withdrawal symptoms that are similar to those associated with tobacco withdrawal.
As such, the fifth and latest edition of the Diagnostic and Statistical Manual of Mental Disorders (DSM-5)25 characterized withdrawal from cannabis use in 2013. The DSM-5 criteria require cessation of heavy or prolonged use of cannabis (ie, daily or almost daily over a period of at least a few months) and three or more of the following withdrawal symptoms:
- Irritability and anger
- Nervousness
- Sleep difficulty or insomnia
- Decreased appetite or weight loss
- Restlessness
- Depressed mood
- Physical symptoms causing discomfort.
Medical treatment of cannabis withdrawal has included a range of antidepressants, mood stabilizers, and alpha-2-adrenergic agonists, all of which have limited success.26 Symptoms of cannabis withdrawal tend to be most intense soon after cessation and decline over the next few weeks.27
CANNABINOID HYPEREMESIS SYNDROME
First reported in 2004,28 cannabinoid hyperemesis syndrome is a recurrent disorder, the pathophysiology of which is poorly understood. It has three phases.
The first phase is a prodrome that may last months or years and is characterized by morning nausea, fear of vomiting, and abdominal discomfort. During this phase, the patient maintains normal eating patterns and may well increase his or her cannabis use due to its well-known antiemetic effects.
The second phase is the hyperemetic phase, characterized by intense, incapacitating emesis with episodes of vomiting throughout the day. These symptoms can be relieved only with frequent hot baths, a feature that distinguishes cannabinoid hyperemesis syndrome from other vomiting syndromes. Hot-water bathing is reported to be a compulsive but learned behavior in which the patient learns that only hot water will provide relief. The extent of relief depends on the temperature of the water—the hotter, the better. Symptoms recur as the water cools.28 Patients often present to the emergency department repeatedly with recurrent symptoms and may remain misdiagnosed or subjected to repeated extensive evaluation including laboratory testing and imaging, which are usually not revealing. If the patient has not been accurately diagnosed, there may be reported weight loss of at least 5 kg.
The third phase, recovery, may take several months to complete, possibly because of the prolonged terminal elimination time of cannabinoids. Complete cessation of cannabis use, including synthetic cannabinoids, is usually necessary.29
Diagnostic criteria for cannabinoid hyperemesis syndrome have been suggested, based on a retrospective case series that included 98 patients.30 The most common features of these affected patients were:
- Severe cyclical vomiting, predominantly in the morning
- Resolution of symptoms with cessation of cannabis use
- Symptomatic relief with hot showers or baths
- Abdominal pain
- At least weekly use of cannabis.
Interestingly, long-term cannabis use has been cited as a critical identifying feature of these patients, with the duration of cannabis use ranging from 10 to 16 years.31,32 Other reports show greater variability in duration of cannabis use before the onset of cannabinoid hyperemesis syndrome. In the large study noted above,30 32% of users reported their duration of cannabis use to be less than 1 year, rendering this criterion less useful.
How can cannabis both cause and prevent vomiting?
The body controls nausea and vomiting via complex circuitry in the brain and gut that involves many neurotransmitters (eg, dopamine, serotonin, substance P) that interact with receptors such as CB1, 5-HT1–4, alpha adrenergic receptors, and mu receptors. Interestingly, cannabis use has antiemetic properties mediated by CB1 with a still unclear additional role of CB2 receptors. Data point to the existence of an underlying antiemetic tone mediated by the endocannabinoid system.
Unfortunately, the mechanism by which cannabinoid hyperemesis syndrome occurs is unknown and represents a paradoxical effect against the otherwise antiemetic effects of cannabis. Several theories have been proposed, including delayed gastric emptying, although only a third of patients demonstrated this on scintigraphy in one study.30 Other theories include disturbance of the hypothalamic-pituitary axis, a buildup of highly lipophilic THC in the brain, and a down-regulation of cannabinoid receptors that results from chronic exposure.30 Given that this syndrome has been recognized only relatively recently, one author has suggested the cause may be recent horticultural developments.5
Treating cannabinoid hyperemesis syndrome is difficult
Treatment of cannabinoid hyperemesis syndrome is notoriously difficult, with many authors reporting resistance to the usual first-line antiemetic drugs. Generally, treatment should include hydration and acid-suppression therapy because endoscopic evaluation of several patients has revealed varying degrees of esophagitis and gastritis.29
Antiemetic therapy should target receptors known to mediate nausea and vomiting. In some cases, antiemetic drugs are more effective when used in combination. Agents include the serotonergic receptor antagonists ondansetron and granisetron, the dopamine antagonists prochlorperazine and metoclopramide, and even haloperidol.33,34 Benzodiazepines may be effective by causing sedation, anxiolysis, and depression of the vomiting center.34,35 Two antihistamines—dimenhydrinate and diphenhydramine—have antiemetic effects, perhaps by inhibiting acetylcholine.34
Aprepitant is a neurokinin-1 antagonist that inhibits the action of substance P. When combined with a corticosteroid and a serotonin antagonist, it relieves nausea and vomiting in chemotherapy patients.34,36
Corticosteroids such as dexamethasone are potent antiemetics thought to inhibit prostaglandin synthesis.34
Capsaicin cream applied to the abdomen has also been reported to relieve symptoms, possibly through an interaction between the TRPv1 receptor and the endocannabinoid system.37,38
DIAGNOSTIC TESTING
Cannabinoids are detectable in plasma and urine, with urine testing being more common.
Common laboratory methods include the enzyme-multiplied immunoassay technique (EMIT) and radioimmunoassay. Gas chromatography coupled with mass spectrometry is the most specific assay; it is used for confirmation and is the reference method.
EMIT is a qualitative urine test that detects 9-carboxy-THC as well as other THC metabolites. These urine tests detect all metabolites, and the result is reported as positive if the total concentration is greater than or equal to a prespecified threshold level, such as 20 ng/mL or 50 ng/mL. A positive test does not denote intoxication, nor does the test identify the source of THC (eg, cannabis, dronabinol, butane hash oil). EMIT does not detect nabilone. The National Institute on Drug Abuse guidelines for urine testing specify a test threshold concentration of 50 ng/mL for screening and 15 ng/mL for confirmation.

Many factors affect the detection of THC metabolites and their presence and duration in urine: dose, duration of use, route of exposure, hydration status, urine volume and concentration, and urine pH. THC metabolites have been detected in urine using gas chromatography-mass spectrometry for up to 7 days after smoking one marijuana cigarette.7 Chronic users have also been reported to have positive urine EMIT tests for up to 46 days after cannabis cessation.39 Detection may be further complicated in chronic users: in one study, users produced both negative and positive specimens over 24 days, suggesting that diet and exercise may influence clearance.40 Also, many factors are known to produce false-positive and false-negative results for these immunoassays (Table 1).39,41
In the United States, penalties for driving under the influence of cannabis vary from state to state, and laws specify plasma testing for quantitative analysis. Some states use a threshold of 5 ng/mL in plasma to imply driving under the influence, whereas others use any detectable amount. Currently, there are no generally accepted guidelines for storage and testing of blood samples, despite the known instability of analytes.42
Saliva, hair, and sweat can also be used for cannabinoid testing. Saliva is easy to collect, can be tested for metabolites to rule out passive cannabis exposure, and can be positive for up to 1 day after exposure. Calculating a blood or plasma concentration from a saliva sample is not possible, however.
Hair testing can also rule out passive exposure, but THC binds very little to melanin, resulting in very low concentrations requiring sensitive tests, such as gas chromatography with tandem mass spectrometry.
Only one device is commercially available for sweat testing; further work is needed to elucidate sweat excretion pharmacokinetics and the limitations of the collection devices.43
CLINICAL MANAGEMENT IS GENERALLY SUPPORTIVE
Historically, clinical toxicity from recreational cannabis use is rarely serious or severe and generally responds to supportive care. Reports of cannabis exposure to poison centers are one-tenth of those reported for ethanol exposures annually.44 Gastrointestinal decontamination with activated charcoal is not recommended, even for orally administered cannabis, since the risks outweigh the expected benefits. Agitation or anxiety may be treated with benzodiazepines as needed. There is no antidote for cannabis toxicity. The ever-increasing availability of high-concentration THC preparations may prompt more aggressive supportive measures in the future.
SYNTHETIC MARIJUANA ALTERNATIVES
Available since the early 2000s, herbal marijuana alternatives are legally sold as incense or potpourri and are often labeled “not for human consumption.” They are known by such brand names as K2 and Spice and contain blends of herbs adulterated with synthetic cannabinoid chemicals developed by researchers exploring the receptor-ligand binding of the endocannabinoid system.
Clinical effects, generally psychiatric, include paranoia, anxiety, agitation, delusions, and psychosis. There are also reports of patients who arrive with sympathomimetic toxicity, some of whom develop bradycardia and hypotension, and some who progress to acute renal failure, seizures, and death. Detection of these products is difficult as they do not react on EMIT testing for THC metabolites and require either gas chromatography-mass spectrometry or liquid chromatography with tandem mass spectrometry.45–48
- Substance Abuse and Mental Health Services Administration. Results from the 2012 National Survey on Drug Use and Health: Summary of National Findings, NSDUH Series H-46, HHS Publication No. (SMA) 13-4795. www.samhsa.gov/data/sites/default/files/NSDUHresultsPDFWHTML2013/Web/NSDUHresults2013.pdf. Accessed October 2, 2015.
- United Nations Office on Drugs and Crime. 2008 World Drug Report. www.unodc.org/documents/wdr/WDR_2008/WDR_2008_eng_web.pdf. Accessed October 2, 2015.
- American Society of Addiction Medicine (ASAM). Public policy statement on medical marijuana. www.asam.org/docs/publicy-policy-statements/1medical-marijuana-4-10.pdf?sfvrsn=0. Accessed October 2, 2015.
- Howlett AC, Barth F, Bonner TI, et al. International Union of Pharmacology. XXVII. Classification of cannabinoid receptors. Pharmacol Rev 2002; 54:161–202.
- Sharkey KA, Darmani NA, Parker LA. Regulation of nausea and vomiting by cannabinoids and the endocannabinoid system. Eur J Pharmacol 2014; 722:134–146.
- Iversen L. Cannabis and the brain. Brain 2003; 126:1252–1270.
- Huestis MA, Henningfield JE, Cone EJ. Blood cannabinoids. I. Absorption of THC and formation of 11-OH-THC and THCCOOH during and after smoking marijuana. J Anal Toxicol 1992; 16:276–282.
- Grotenhermen F. Pharmacokinetics and pharmacodynamics of cannabinoids. Clin Pharmacokinet 2003; 42:327–360.
- Mehmedic Z, Chandra S, Slade D, et al. Potency trends of Δ9-THC and other cannabinoids in confiscated cannabis preparations from 1993 to 2008. J Forensic Sci 2010; 55:1209–1217.
- Mittleman MA, Lewis RA, Maclure M, Sherwood JB, Muller JE. Triggering myocardial infarction by marijuana. Circulation 2001; 103:2805–2809.
- Mukamal KJ, Maclure M, Muller JE, Mittleman MA. An exploratory prospective study of marijuana use and mortality following acute myocardial infarction. Am Heart J 2008; 155:465–470.
- Thomas G, Kloner RA, Rezkalla S. Adverse cardiovascular, cerebrovascular, and peripheral vascular effects of marijuana inhalation: what cardiologists need to know. Am J Cardiol 2014; 113:187–190.
- Wang GS, Roosevelt G, Heard K. Pediatric marijuana exposures in a medical marijuana state. JAMA Pediatr 2013; 167:630–633.
- Carstairs SD, Fujinaka MK, Keeney GE, Ly BT. Prolonged coma in a child due to hashish ingestion with quantitation of THC metabolites in urine. J Emerg Med 2011; 41:e69–e71.
- Le Garrec S, Dauger S, Sachs P. Cannabis poisoning in children. Intensive Care Med 2014; 40:1394–1395.
- Ragab AR, Al-Mazroua MK. Passive cannabis smoking resulting in coma in a 16-month old infant. J Clin Case Rep 2012;2:237.
- Robinson K. Beyond resinable doubt? J Clin Forensic Med 2005;12:164–166.
- Burns JK. Pathways from cannabis to psychosis: a review of the evidence. Front Psychiatry 2013;4:128.
- Di Forti M, Sallis H, Allegri F, et al. Daily use, especially of high-potency cannabis, drives the earlier onset of psychosis in cannabis users. Schizophr Bull 2014; 40:1509–1517.
- Moore TH, Zammit S, Lingford-Hughes A, et al. Cannabis use and risk of psychotic or affective mental health outcomes: a systematic review. Lancet 2007; 370:319–328.
- Wilkinson ST, Radhakrishnan R, D'Souza DC. Impact of cannabis use on the development of psychotic disorders. Curr Addict Rep 2014;1:115–128.
- Aldington S, Williams M, Nowitz M, et al. Effects of cannabis on pulmonary structure, function and symptoms. Thorax 2007; 62:1058–1063.
- George KL, Saltman LH, Stein GS, Lian JB, Zurier RB. Ajulemic acid, a nonpsychoactive cannabinoid acid, suppresses osteoclastogenesis in mononuclear precursor cells and induces apoptosis in mature osteoclast-like cells. J Cell Physiol 2008; 214:714–720.
- Reece AS. Chronic toxicology of cannabis. Clin Toxicol (Phila) 2009; 47:517–524.
- American Psychiatric Association. Diagnostic and Statistical Manual of Mental Disorders. 5th ed. Arlington, VA: American Psychiatric Publishing; 2013.
- Allsop DJ, Copeland J, Lintzeris N, et al. Nabiximols as an agonist replacement therapy during cannabis withdrawal: a randomized clinical trial. JAMA Psychiatry 2014; 71:281–291.
- Hesse M, Thylstrup B. Time-course of the DSM-5 cannabis withdrawal symptoms in poly-substance abusers. BMC Psychiatry 2013; 13:258.
- Allen JH, de Moore GM, Heddle R, Twartz JC. Cannabinoid hyperemesis: cyclical hyperemesis in association with chronic cannabis abuse. Gut 2004; 53:1566–1570.
- Galli JA, Sawaya RA, Friedenberg FK. Cannabinoid hyperemesis syndrome. Curr Drug Abuse Rev 2011; 4:241–249.
- Simonetto DA, Oxentenko AS, Herman ML, Szostek JH. Cannabinoid hyperemesis: a case series of 98 patients. Mayo Clin Proc 2012; 87:114–119.
- Soriano-Co M, Batke M, Cappell MS. The cannabis hyperemesis syndrome characterized by persistent nausea and vomiting, abdominal pain, and compulsive bathing associated with chronic marijuana use: a report of eight cases in the United States. Dig Dis Sci 2010; 55:3113–3119.
- Wallace EA, Andrews SE, Garmany CL, Jelley MJ. Cannabinoid hyperemesis syndrome: literature review and proposed diagnosis and treatment algorithm. South Med J 2011; 104:659–664.
- Hickey JL, Witsil JC, Mycyk MB. Haloperidol for treatment of cannabinoid hyperemesis syndrome. Am J Emerg Med 2013; 31:1003.e5–1003.e6.
- Perwitasari DA, Gelderblom H, Atthobari J, et al. Anti-emetic drugs in oncology: pharmacology and individualization by pharmacogenetics. Int J Clin Pharm 2011; 33:33–43.
- Cox B, Chhabra A, Adler M, Simmons J, Randlett D. Cannabinoid hyperemesis syndrome: case report of a paradoxical reaction with heavy marijuana use. Case Rep Med 2012; 2012:757696.
- Sakurai M, Mori T, Kato J, et al. Efficacy of aprepitant in preventing nausea and vomiting due to high-dose melphalan-based conditioning for allogeneic hematopoietic stem cell transplantation. Int J Hematol 2014; 99:457–462.
- Lapoint J. Case series of patients treated for cannabinoid hyperemesis syndrome with capsaicin cream. Clin Tox 2014; 52:707. Abstract #53.
- Biary R, Oh A, Lapoint J, Nelson LS, Hoffman RS, Howland MA. Topical capsaicin cream used as a therapy for cannabinoid hyperemesis syndrome. Clin Tox 2014; 52:787. Abstract #232.
- Moeller KE, Lee KC, Kissack JC. Urine drug screening: practical guide for clinicians. Mayo Clin Proc 2008; 83:66–76.
- Lowe RH, Abraham TT, Darwin WD, Herning R, Cadet JL, Huestis MA. Extended urinary delta9-tetrahydrocannabinol excretion in chronic cannabis users precludes use as a biomarker of new drug exposure. Drug Alcohol Depend 2009; 105:24–32.
- Paul BD, Jacobs A. Effects of oxidizing adulterants on detection of 11-nor-delta9-THC-9-carboxylic acid in urine. J Anal Toxicol 2002; 26:460–463.
- Schwope DM, Karschner EL, Gorelick DA, Huestis MA. Identification of recent cannabis use: whole-blood and plasma free and glucuronidated cannabinoid pharmacokinetics following controlled smoked cannabis administration. Clin Chem 2011; 57:1406-1414.
- Huestis MA, Smith ML. Cannabinoid pharmacokinetics and disposition in alternative matrices. In: Pertwee R, ed. Handbook of Cannabis. Oxford, United Kingdom: Oxford University Press; 2014:296–316.
- Mowry JB, Spyker DA, Cantilena LR Jr, Bailey JE, Ford M. 2012 Annual Report of the American Association of Poison Control Centers’ National Poison Data System (NPDS): 30th Annual Report. Clin Toxicol (Phila) 2013; 51:949–1229.
- Rosenbaum CD, Carreiro SP, Babu KM. Here today, gone tomorrow…and back again? A review of herbal marijuana alternatives (K2, Spice), synthetic cathinones (bath salts), kratom, Salvia divinorum, methoxetamine, and piperazines. J Med Toxicol 2012; 8:15–32.
- Gurney SMR, Scott KS, Kacinko SL, Presley BC, Logan BK. Pharmacology, toxicology, and adverse effects of synthetic cannabinoid drugs. Forensic Sci Rev 2014; 26:53–78.
- McKeever RG, Vearrier D, Jacobs D, LaSala G, Okaneku J, Greenberg MI. K2-not the spice of life; synthetic cannabinoids and ST elevation myocardial infarction: a case report. J Med Toxicol 2015; 11:129–131.
- Schneir AB, Baumbacher T. Convulsions associated with the use of a synthetic cannabinoid product. J Med Toxicol 2012; 8:62–64.
Clinicians may be encountering more cannabis users than before, and may be encountering users with complications hitherto unseen. Several trends may explain this phenomenon: the legal status of cannabis is changing, cannabis today is more potent than in the past, and enthusiasts are conjuring new ways to enjoy this substance.
This article discusses the history, pharmacology, and potential complications of cannabis use.
A LONG AND TANGLED HISTORY
Cannabis is a broad term that refers to the cannabis plant and its preparations, such as marijuana and hashish, as well as to a family of more than 60 bioactive substances called cannabinoids. It is the most commonly used illegal drug in the world, with an estimated 160 million users. Each year, about 2.4 million people in the United States use it for the first time.1,2
Cannabis has been used throughout the world for recreational and spiritual purposes for nearly 5,000 years, beginning with the fabled Celestial Emperors of China. The tangled history of cannabis in America began in the 17th century, when farmers were required by law to grow it as a fiber crop. It later found its way into the US Pharmacopeia for a wide range of indications. During the long prelude to Prohibition in the latter half of the 19th century, the US government became increasingly suspicious of mind-altering substances and began restricting its prescription in 1934, culminating in its designation by the US Food and Drug Administration as a schedule I controlled substance in 1970.
Investigation into the potential medical uses for the different chemicals within cannabis is ongoing, as is debate over its changing legality and usefulness to society. The apparent cognitive dissonance surrounding the use and advocacy of medical marijuana is beyond the scope of this review,3 which will instead restrict itself to what is known of the cannabinoids and to the recreational use of cannabis.
THC IS THE PRINCIPAL PSYCHOACTIVE MOLECULE
Delta-9 tetrahydrocannabinol (THC), first isolated in 1964, was identified as the principal psychoactive constituent of cannabis in 2002.4
Two G-protein–linked cannabinoid receptors cloned in the 1990s—CB1 and CB2—were found to be a part of a system of endocannabinoid receptors present throughout the body, from the brain to the immune system to the vas deferens.5 Both receptors inhibit cellular excitation by activating inwardly rectifying potassium channels. These receptors are mostly absent in the brainstem, which may explain why cannabis use rarely causes life-threatening autonomic dysfunction. Although the intoxicating effects of marijuana are mediated by CB1 receptors, the specific mechanisms underlying the cannabis “high” are unclear.6
CANNABINOIDS ARE LIPID-SOLUBLE
The rate of absorption of cannabinoids depends on the route of administration and the type of cannabis product used. When cannabis products are smoked, up to 35% of THC is available, and the average time to peak serum concentration is 8 minutes.7 The peak concentration depends on the dose.
On the other hand, when cannabis products (eg, nabilone, dronabinol) are ingested, absorption is unpredictable because THC is unstable in gastric acid and undergoes first-pass metabolism in the liver, which reduces the drug’s bioavailability. Up to 20% of an ingested dose of THC is absorbed, and the time to peak serum concentration averages between 2 and 4 hours. Consequently, many users prefer to smoke cannabis as a means to control the desired effects.
Cannabinoids are lipid-soluble. They accumulate in fatty tissue in a biphasic pattern, initially moving into highly vascularized tissue such as the liver before accumulating in less well-vascularized tissue such as fat. They are then slowly released from fatty tissue as the fat turns over. THC itself has a volume of distribution of about 2.5 to 3.5 L/kg. It crosses the placenta and enters breast milk.8
THC is metabolized by the cytochrome P450 system, primarily by the enzymes CYP2C9 and CYP3A4. Its primary metabolite, 11-hydroxy-delta-9 THC, is also active, but subsequent metabolism produces many other inactive metabolites. THC is eliminated in feces and urine, and its half-life ranges from 2 to nearly 60 hours.8
A LITTLE ABOUT PLANTS AND STREET NAMES
The plant from which THC and nearly a hundred other chemicals, including cannabinoids, are derived has been called many things over the years:
Hemp is a tall fibrous plant grown for rope and fabric that was used as legal tender in early America. In the mid-19th century, there were over 16 million acres of hemp plantations. Hemp contains very low THC concentrations.
Cannabis is an annual flowering herb that is predominantly diecious (ie, there are male and female plants). After a centuries-long debate among taxonomists, the two principal species are considered to be C sativa and C indica, although today many cannabis cultivars are grown by a great number of breeding enthusiasts.
Concentrations of THC vary widely among cannabis cultivars, ranging historically from around 5% to today’s highly selectively bred species containing more than 30%. Concentrations in seized cannabis have been measured as high as 37%, although the average is around 11%.9 This concentration is defined by the percent of THC per dried mass of plant material tested, usually via gas chromatography.
Hashish is a solid or resinous preparation of the trichomes, or glandular hairs, that grow on the cannabis plant, chiefly on its flowers. Various methods to separate the trichomes from the rest of the plant result in a powder called kief that is then compressed into blocks or bricks. THC concentrations as high as 66% have been measured in nondomestic sources of hashish.9
Hash oil is a further purification, produced by using solvents to dissolve the resin and by filtering out remaining plant material. Evaporating the solvent produces hash oil, sometimes called butane hash oil or honey oil. This process has recently led to an increasing number of home explosions, as people attempt to make the product themselves but do not take suitable precautions when using flammable solvents such as butane. THC concentrations as high as 81% have been measured in nondomestic sources of hash oil.9
Other names for hash oil are dab, wax, and budder. Cannabis enthusiasts refer to the use of hash oil as dabbing, which involves heating a small amount (dab) of the product using a variety of paraphernalia and inhaling the vapor.
IT’S ALL ABOUT GETTING HIGH
For recreational users, the experience has always been about being intoxicated—getting high. The psychological effects range broadly from positive to negative and vary both within and between users, depending on the dose and route of administration. Additional factors that influence the psychological effects include the social and physical settings of drug use and even the user’s expectations. One user’s high is another user’s acute toxic effect.
Although subjective reports of the cannabis experience vary greatly, it typically begins with a feeling of dizziness or lightheadedness followed by a relaxed calm and a feeling of being somewhat “disconnected.” There is a quickening of the sense of humor, described by some as a fatuous euphoria; often there is silly giggling. Awareness of the senses and of music may be increased. Appetite increases, and time seems to pass quickly. Eventually, the user becomes drowsy and experiences decreased attention and difficulty maintaining a coherent conversation. Slowed reaction time and decreased psychomotor activity may also occur. The user may drift into daydreams and eventually fall asleep.
Common negative acute effects of getting high can include mild to severe anxiety and feeling tense or agitated. Clumsiness, headache, and confusion are also possible. Lingering effects the following day may include dry mouth, dry eyes, fatigue, slowed thinking, and slowed recall.6
ACUTE PHYSICAL EFFECTS
Acute physical effects of cannabis use include a rapid onset of increased airway conductance, decreased intraocular pressure, and conjunctival injection. A single cannabis cigarette can also induce cardiovascular effects including a dose-dependent increase in heart rate and blood pressure. Chronic users, however, can experience a decreased heart rate, lower blood pressure, and postural hypotension.
In a personal communication, colleagues in Colorado—where recreational use of cannabis was legalized in 2012—described a sharp increase (from virtually none) in the number of adults presenting to the emergency department with cannabis intoxication since 2012. Their patients experienced palpitations, light-headedness, and severe ataxia lasting as long as 12 hours, possibly reflecting the greater potency of current cannabis products. Most of these patients required only supportive care.
Other acute adverse cardiovascular reactions that have been reported include atrial fibrillation, ventricular tachycardia, and a fivefold increased risk of myocardial infarction in the 60 minutes following cannabis use, which subsequently drops sharply to baseline levels.10 Investigations into the cardiovascular effects of cannabis are often complicated by concurrent use of other drugs such as tobacco or cocaine. Possible mechanisms of injury include alterations in coronary microcirculation or slowed coronary flow. In fact, one author found that cannabis users with a history of myocardial infarction had a risk of death 4.2 times higher than users with no history of myocardial infarction.11,12
In children, acute toxicity has been reported from a variety of exposures to cannabis and hashish, including a report of an increase in pediatric cannabis exposures following the changes in Colorado state laws.13 Most of these patients had altered mental status ranging from drowsiness to coma; one report describes a child who experienced a first-time seizure. These patients unfortunately often underwent extensive evaluations such as brain imaging and lumbar puncture, and mechanical ventilation to protect the airway. Earlier consideration of cannabis exposure in these patients might have limited unnecessary testing. Supportive care is usually all that is needed, and most of these patients fully recover.13–17
CHRONIC EFFECTS
Cannabinoids cause a variety of adverse effects, but the ultimate risk these changes pose to human health has been difficult to calculate. Long-term studies are confounded by possible inaccuracies of patient self-reporting of cannabis use, poor control of covariates, and disparate methodologies.
For more than a century, cannabis use has been reported to cause both acute psychotic symptoms and persistent psychotic disorders.18 But the strength of this relationship is modest. Cannabis is more likely a component cause that, in addition to other factors (eg, specific genetic polymorphisms), contributes to the risk of schizophrenia. Individuals with prodromal symptoms and those who have experienced discrete episodes of psychosis related to cannabis use should be discouraged from using cannabis and cannabinoids.19–21
Mounting evidence implicates chronic cannabis use as a cause of long-term medical problems including chronic bronchitis,22 elevated rates of myocardial infarction and dysrhythmias,11 bone loss,23 and cancers at eight different sites including the lung, head, and neck.24 In view of these chronic effects, healthcare providers should caution their patients about cannabis use, as we do about other drugs such as tobacco.
WITHDRAWAL SYNDROME RECOGNIZED
Until recently, neither clinicians nor users recognized a withdrawal syndrome associated with chronic use of cannabis, probably because this syndrome is not as severe as withdrawal from other controlled substances such as opioids or sedative-hypnotics. A number of studies, however, have reported subtle cannabis withdrawal symptoms that are similar to those associated with tobacco withdrawal.
As such, the fifth and latest edition of the Diagnostic and Statistical Manual of Mental Disorders (DSM-5)25 characterized withdrawal from cannabis use in 2013. The DSM-5 criteria require cessation of heavy or prolonged use of cannabis (ie, daily or almost daily over a period of at least a few months) and three or more of the following withdrawal symptoms:
- Irritability and anger
- Nervousness
- Sleep difficulty or insomnia
- Decreased appetite or weight loss
- Restlessness
- Depressed mood
- Physical symptoms causing discomfort.
Medical treatment of cannabis withdrawal has included a range of antidepressants, mood stabilizers, and alpha-2-adrenergic agonists, all of which have limited success.26 Symptoms of cannabis withdrawal tend to be most intense soon after cessation and decline over the next few weeks.27
CANNABINOID HYPEREMESIS SYNDROME
First reported in 2004,28 cannabinoid hyperemesis syndrome is a recurrent disorder, the pathophysiology of which is poorly understood. It has three phases.
The first phase is a prodrome that may last months or years and is characterized by morning nausea, fear of vomiting, and abdominal discomfort. During this phase, the patient maintains normal eating patterns and may well increase his or her cannabis use due to its well-known antiemetic effects.
The second phase is the hyperemetic phase, characterized by intense, incapacitating emesis with episodes of vomiting throughout the day. These symptoms can be relieved only with frequent hot baths, a feature that distinguishes cannabinoid hyperemesis syndrome from other vomiting syndromes. Hot-water bathing is reported to be a compulsive but learned behavior in which the patient learns that only hot water will provide relief. The extent of relief depends on the temperature of the water—the hotter, the better. Symptoms recur as the water cools.28 Patients often present to the emergency department repeatedly with recurrent symptoms and may remain misdiagnosed or subjected to repeated extensive evaluation including laboratory testing and imaging, which are usually not revealing. If the patient has not been accurately diagnosed, there may be reported weight loss of at least 5 kg.
The third phase, recovery, may take several months to complete, possibly because of the prolonged terminal elimination time of cannabinoids. Complete cessation of cannabis use, including synthetic cannabinoids, is usually necessary.29
Diagnostic criteria for cannabinoid hyperemesis syndrome have been suggested, based on a retrospective case series that included 98 patients.30 The most common features of these affected patients were:
- Severe cyclical vomiting, predominantly in the morning
- Resolution of symptoms with cessation of cannabis use
- Symptomatic relief with hot showers or baths
- Abdominal pain
- At least weekly use of cannabis.
Interestingly, long-term cannabis use has been cited as a critical identifying feature of these patients, with the duration of cannabis use ranging from 10 to 16 years.31,32 Other reports show greater variability in duration of cannabis use before the onset of cannabinoid hyperemesis syndrome. In the large study noted above,30 32% of users reported their duration of cannabis use to be less than 1 year, rendering this criterion less useful.
How can cannabis both cause and prevent vomiting?
The body controls nausea and vomiting via complex circuitry in the brain and gut that involves many neurotransmitters (eg, dopamine, serotonin, substance P) that interact with receptors such as CB1, 5-HT1–4, alpha adrenergic receptors, and mu receptors. Interestingly, cannabis use has antiemetic properties mediated by CB1 with a still unclear additional role of CB2 receptors. Data point to the existence of an underlying antiemetic tone mediated by the endocannabinoid system.
Unfortunately, the mechanism by which cannabinoid hyperemesis syndrome occurs is unknown and represents a paradoxical effect against the otherwise antiemetic effects of cannabis. Several theories have been proposed, including delayed gastric emptying, although only a third of patients demonstrated this on scintigraphy in one study.30 Other theories include disturbance of the hypothalamic-pituitary axis, a buildup of highly lipophilic THC in the brain, and a down-regulation of cannabinoid receptors that results from chronic exposure.30 Given that this syndrome has been recognized only relatively recently, one author has suggested the cause may be recent horticultural developments.5
Treating cannabinoid hyperemesis syndrome is difficult
Treatment of cannabinoid hyperemesis syndrome is notoriously difficult, with many authors reporting resistance to the usual first-line antiemetic drugs. Generally, treatment should include hydration and acid-suppression therapy because endoscopic evaluation of several patients has revealed varying degrees of esophagitis and gastritis.29
Antiemetic therapy should target receptors known to mediate nausea and vomiting. In some cases, antiemetic drugs are more effective when used in combination. Agents include the serotonergic receptor antagonists ondansetron and granisetron, the dopamine antagonists prochlorperazine and metoclopramide, and even haloperidol.33,34 Benzodiazepines may be effective by causing sedation, anxiolysis, and depression of the vomiting center.34,35 Two antihistamines—dimenhydrinate and diphenhydramine—have antiemetic effects, perhaps by inhibiting acetylcholine.34
Aprepitant is a neurokinin-1 antagonist that inhibits the action of substance P. When combined with a corticosteroid and a serotonin antagonist, it relieves nausea and vomiting in chemotherapy patients.34,36
Corticosteroids such as dexamethasone are potent antiemetics thought to inhibit prostaglandin synthesis.34
Capsaicin cream applied to the abdomen has also been reported to relieve symptoms, possibly through an interaction between the TRPv1 receptor and the endocannabinoid system.37,38
DIAGNOSTIC TESTING
Cannabinoids are detectable in plasma and urine, with urine testing being more common.
Common laboratory methods include the enzyme-multiplied immunoassay technique (EMIT) and radioimmunoassay. Gas chromatography coupled with mass spectrometry is the most specific assay; it is used for confirmation and is the reference method.
EMIT is a qualitative urine test that detects 9-carboxy-THC as well as other THC metabolites. These urine tests detect all metabolites, and the result is reported as positive if the total concentration is greater than or equal to a prespecified threshold level, such as 20 ng/mL or 50 ng/mL. A positive test does not denote intoxication, nor does the test identify the source of THC (eg, cannabis, dronabinol, butane hash oil). EMIT does not detect nabilone. The National Institute on Drug Abuse guidelines for urine testing specify a test threshold concentration of 50 ng/mL for screening and 15 ng/mL for confirmation.
Many factors affect the detection of THC metabolites and their presence and duration in urine: dose, duration of use, route of exposure, hydration status, urine volume and concentration, and urine pH. THC metabolites have been detected in urine using gas chromatography-mass spectrometry for up to 7 days after smoking one marijuana cigarette.7 Chronic users have also been reported to have positive urine EMIT tests for up to 46 days after cannabis cessation.39 Detection may be further complicated in chronic users: in one study, users produced both negative and positive specimens over 24 days, suggesting that diet and exercise may influence clearance.40 Also, many factors are known to produce false-positive and false-negative results for these immunoassays (Table 1).39,41
In the United States, penalties for driving under the influence of cannabis vary from state to state, and laws specify plasma testing for quantitative analysis. Some states use a threshold of 5 ng/mL in plasma to imply driving under the influence, whereas others use any detectable amount. Currently, there are no generally accepted guidelines for storage and testing of blood samples, despite the known instability of analytes.42
Saliva, hair, and sweat can also be used for cannabinoid testing. Saliva is easy to collect, can be tested for metabolites to rule out passive cannabis exposure, and can be positive for up to 1 day after exposure. Calculating a blood or plasma concentration from a saliva sample is not possible, however.
Hair testing can also rule out passive exposure, but THC binds very little to melanin, resulting in very low concentrations requiring sensitive tests, such as gas chromatography with tandem mass spectrometry.
Only one device is commercially available for sweat testing; further work is needed to elucidate sweat excretion pharmacokinetics and the limitations of the collection devices.43
CLINICAL MANAGEMENT IS GENERALLY SUPPORTIVE
Historically, clinical toxicity from recreational cannabis use is rarely serious or severe and generally responds to supportive care. Reports of cannabis exposure to poison centers are one-tenth of those reported for ethanol exposures annually.44 Gastrointestinal decontamination with activated charcoal is not recommended, even for orally administered cannabis, since the risks outweigh the expected benefits. Agitation or anxiety may be treated with benzodiazepines as needed. There is no antidote for cannabis toxicity. The ever-increasing availability of high-concentration THC preparations may prompt more aggressive supportive measures in the future.
SYNTHETIC MARIJUANA ALTERNATIVES
Available since the early 2000s, herbal marijuana alternatives are legally sold as incense or potpourri and are often labeled “not for human consumption.” They are known by such brand names as K2 and Spice and contain blends of herbs adulterated with synthetic cannabinoid chemicals developed by researchers exploring the receptor-ligand binding of the endocannabinoid system.
Clinical effects, generally psychiatric, include paranoia, anxiety, agitation, delusions, and psychosis. There are also reports of patients who arrive with sympathomimetic toxicity, some of whom develop bradycardia and hypotension, and some who progress to acute renal failure, seizures, and death. Detection of these products is difficult as they do not react on EMIT testing for THC metabolites and require either gas chromatography-mass spectrometry or liquid chromatography with tandem mass spectrometry.45–48
- Substance Abuse and Mental Health Services Administration. Results from the 2012 National Survey on Drug Use and Health: Summary of National Findings, NSDUH Series H-46, HHS Publication No. (SMA) 13-4795. www.samhsa.gov/data/sites/default/files/NSDUHresultsPDFWHTML2013/Web/NSDUHresults2013.pdf. Accessed October 2, 2015.
- United Nations Office on Drugs and Crime. 2008 World Drug Report. www.unodc.org/documents/wdr/WDR_2008/WDR_2008_eng_web.pdf. Accessed October 2, 2015.
- American Society of Addiction Medicine (ASAM). Public policy statement on medical marijuana. www.asam.org/docs/publicy-policy-statements/1medical-marijuana-4-10.pdf?sfvrsn=0. Accessed October 2, 2015.
- Howlett AC, Barth F, Bonner TI, et al. International Union of Pharmacology. XXVII. Classification of cannabinoid receptors. Pharmacol Rev 2002; 54:161–202.
- Sharkey KA, Darmani NA, Parker LA. Regulation of nausea and vomiting by cannabinoids and the endocannabinoid system. Eur J Pharmacol 2014; 722:134–146.
- Iversen L. Cannabis and the brain. Brain 2003; 126:1252–1270.
- Huestis MA, Henningfield JE, Cone EJ. Blood cannabinoids. I. Absorption of THC and formation of 11-OH-THC and THCCOOH during and after smoking marijuana. J Anal Toxicol 1992; 16:276–282.
- Grotenhermen F. Pharmacokinetics and pharmacodynamics of cannabinoids. Clin Pharmacokinet 2003; 42:327–360.
- Mehmedic Z, Chandra S, Slade D, et al. Potency trends of Δ9-THC and other cannabinoids in confiscated cannabis preparations from 1993 to 2008. J Forensic Sci 2010; 55:1209–1217.
- Mittleman MA, Lewis RA, Maclure M, Sherwood JB, Muller JE. Triggering myocardial infarction by marijuana. Circulation 2001; 103:2805–2809.
- Mukamal KJ, Maclure M, Muller JE, Mittleman MA. An exploratory prospective study of marijuana use and mortality following acute myocardial infarction. Am Heart J 2008; 155:465–470.
- Thomas G, Kloner RA, Rezkalla S. Adverse cardiovascular, cerebrovascular, and peripheral vascular effects of marijuana inhalation: what cardiologists need to know. Am J Cardiol 2014; 113:187–190.
- Wang GS, Roosevelt G, Heard K. Pediatric marijuana exposures in a medical marijuana state. JAMA Pediatr 2013; 167:630–633.
- Carstairs SD, Fujinaka MK, Keeney GE, Ly BT. Prolonged coma in a child due to hashish ingestion with quantitation of THC metabolites in urine. J Emerg Med 2011; 41:e69–e71.
- Le Garrec S, Dauger S, Sachs P. Cannabis poisoning in children. Intensive Care Med 2014; 40:1394–1395.
- Ragab AR, Al-Mazroua MK. Passive cannabis smoking resulting in coma in a 16-month old infant. J Clin Case Rep 2012;2:237.
- Robinson K. Beyond resinable doubt? J Clin Forensic Med 2005;12:164–166.
- Burns JK. Pathways from cannabis to psychosis: a review of the evidence. Front Psychiatry 2013;4:128.
- Di Forti M, Sallis H, Allegri F, et al. Daily use, especially of high-potency cannabis, drives the earlier onset of psychosis in cannabis users. Schizophr Bull 2014; 40:1509–1517.
- Moore TH, Zammit S, Lingford-Hughes A, et al. Cannabis use and risk of psychotic or affective mental health outcomes: a systematic review. Lancet 2007; 370:319–328.
- Wilkinson ST, Radhakrishnan R, D'Souza DC. Impact of cannabis use on the development of psychotic disorders. Curr Addict Rep 2014;1:115–128.
- Aldington S, Williams M, Nowitz M, et al. Effects of cannabis on pulmonary structure, function and symptoms. Thorax 2007; 62:1058–1063.
- George KL, Saltman LH, Stein GS, Lian JB, Zurier RB. Ajulemic acid, a nonpsychoactive cannabinoid acid, suppresses osteoclastogenesis in mononuclear precursor cells and induces apoptosis in mature osteoclast-like cells. J Cell Physiol 2008; 214:714–720.
- Reece AS. Chronic toxicology of cannabis. Clin Toxicol (Phila) 2009; 47:517–524.
- American Psychiatric Association. Diagnostic and Statistical Manual of Mental Disorders. 5th ed. Arlington, VA: American Psychiatric Publishing; 2013.
- Allsop DJ, Copeland J, Lintzeris N, et al. Nabiximols as an agonist replacement therapy during cannabis withdrawal: a randomized clinical trial. JAMA Psychiatry 2014; 71:281–291.
- Hesse M, Thylstrup B. Time-course of the DSM-5 cannabis withdrawal symptoms in poly-substance abusers. BMC Psychiatry 2013; 13:258.
- Allen JH, de Moore GM, Heddle R, Twartz JC. Cannabinoid hyperemesis: cyclical hyperemesis in association with chronic cannabis abuse. Gut 2004; 53:1566–1570.
- Galli JA, Sawaya RA, Friedenberg FK. Cannabinoid hyperemesis syndrome. Curr Drug Abuse Rev 2011; 4:241–249.
- Simonetto DA, Oxentenko AS, Herman ML, Szostek JH. Cannabinoid hyperemesis: a case series of 98 patients. Mayo Clin Proc 2012; 87:114–119.
- Soriano-Co M, Batke M, Cappell MS. The cannabis hyperemesis syndrome characterized by persistent nausea and vomiting, abdominal pain, and compulsive bathing associated with chronic marijuana use: a report of eight cases in the United States. Dig Dis Sci 2010; 55:3113–3119.
- Wallace EA, Andrews SE, Garmany CL, Jelley MJ. Cannabinoid hyperemesis syndrome: literature review and proposed diagnosis and treatment algorithm. South Med J 2011; 104:659–664.
- Hickey JL, Witsil JC, Mycyk MB. Haloperidol for treatment of cannabinoid hyperemesis syndrome. Am J Emerg Med 2013; 31:1003.e5–1003.e6.
- Perwitasari DA, Gelderblom H, Atthobari J, et al. Anti-emetic drugs in oncology: pharmacology and individualization by pharmacogenetics. Int J Clin Pharm 2011; 33:33–43.
- Cox B, Chhabra A, Adler M, Simmons J, Randlett D. Cannabinoid hyperemesis syndrome: case report of a paradoxical reaction with heavy marijuana use. Case Rep Med 2012; 2012:757696.
- Sakurai M, Mori T, Kato J, et al. Efficacy of aprepitant in preventing nausea and vomiting due to high-dose melphalan-based conditioning for allogeneic hematopoietic stem cell transplantation. Int J Hematol 2014; 99:457–462.
- Lapoint J. Case series of patients treated for cannabinoid hyperemesis syndrome with capsaicin cream. Clin Tox 2014; 52:707. Abstract #53.
- Biary R, Oh A, Lapoint J, Nelson LS, Hoffman RS, Howland MA. Topical capsaicin cream used as a therapy for cannabinoid hyperemesis syndrome. Clin Tox 2014; 52:787. Abstract #232.
- Moeller KE, Lee KC, Kissack JC. Urine drug screening: practical guide for clinicians. Mayo Clin Proc 2008; 83:66–76.
- Lowe RH, Abraham TT, Darwin WD, Herning R, Cadet JL, Huestis MA. Extended urinary delta9-tetrahydrocannabinol excretion in chronic cannabis users precludes use as a biomarker of new drug exposure. Drug Alcohol Depend 2009; 105:24–32.
- Paul BD, Jacobs A. Effects of oxidizing adulterants on detection of 11-nor-delta9-THC-9-carboxylic acid in urine. J Anal Toxicol 2002; 26:460–463.
- Schwope DM, Karschner EL, Gorelick DA, Huestis MA. Identification of recent cannabis use: whole-blood and plasma free and glucuronidated cannabinoid pharmacokinetics following controlled smoked cannabis administration. Clin Chem 2011; 57:1406-1414.
- Huestis MA, Smith ML. Cannabinoid pharmacokinetics and disposition in alternative matrices. In: Pertwee R, ed. Handbook of Cannabis. Oxford, United Kingdom: Oxford University Press; 2014:296–316.
- Mowry JB, Spyker DA, Cantilena LR Jr, Bailey JE, Ford M. 2012 Annual Report of the American Association of Poison Control Centers’ National Poison Data System (NPDS): 30th Annual Report. Clin Toxicol (Phila) 2013; 51:949–1229.
- Rosenbaum CD, Carreiro SP, Babu KM. Here today, gone tomorrow…and back again? A review of herbal marijuana alternatives (K2, Spice), synthetic cathinones (bath salts), kratom, Salvia divinorum, methoxetamine, and piperazines. J Med Toxicol 2012; 8:15–32.
- Gurney SMR, Scott KS, Kacinko SL, Presley BC, Logan BK. Pharmacology, toxicology, and adverse effects of synthetic cannabinoid drugs. Forensic Sci Rev 2014; 26:53–78.
- McKeever RG, Vearrier D, Jacobs D, LaSala G, Okaneku J, Greenberg MI. K2-not the spice of life; synthetic cannabinoids and ST elevation myocardial infarction: a case report. J Med Toxicol 2015; 11:129–131.
- Schneir AB, Baumbacher T. Convulsions associated with the use of a synthetic cannabinoid product. J Med Toxicol 2012; 8:62–64.
KEY POINTS
- Cannabis has been used throughout history and has become increasingly available for recreational purposes, despite its current classification as a schedule I controlled substance.
- Although severe acute toxicity has been reported, it is relatively rare, and most users’ casual experiences are benign.
- Internists are most likely to see complications such as cannabinoid hyperemesis syndrome and cardiovascular problems that cannot be resolved sufficiently in the emergency department.
- Screening urine testing is usually done by enzyme multiplied immunoassay, whereas confirmatory testing is done with gas chromatography-mass spectrometry, which is more specific.