User login
Collagenase Enzymatic Fasciotomy for Dupuytren Contracture in Patients on Chronic Immunosuppression
The incidence of Dupuytren disease increases with advancing age,1 as do the medical comorbidities of patients seeking treatment for disabling hand contractures. For patients with significant comorbidities, open surgical fasciectomy, the current standard of treatment for Dupuytren disease,2,3 may be associated with increased perioperative risks.
Collagenase enzymatic fasciotomy has become an accepted nonsurgical treatment alternative to traditional fasciectomy or surgical fasciotomy for significant digital contractures caused by Dupuytren disease.4-6 Clostridium histolyticum collagenase (CHC) is a foreign protein, made up of 2 collagenases isolated from the bacteria C histolyticum.7 The collagenases are zinc-dependent matrix metalloproteinases that cleave the triple helical structure of collagen molecules.8 Also known as Xiaflex (Auxilium Pharmaceuticals), CHC was approved by the US Food and Drug Administration (FDA) in February 2010 for use in patients with Dupuytren contractures.
Enzymatic rupture is safe and efficacious at midterm follow-up and offers the theoretical advantage of avoiding palmar and digital fasciectomy and the associated risks of surgical-site infection and wound-healing complications.6 The risks of surgical wound complications are magnified in immunosuppressed patients, particularly those on chronic steroid therapy; wound-healing complication rates may be increased 2 to 5 times compared with controls.9 In a pooled literature review, wound-healing complications were reported after 22.9% of open primary fasciectomies, with infection occurring in 2.4%.10 A nonsurgical alternative is therefore particularly appealing for a patient cohort that may be at higher risk for a frequently described complication of surgery for Dupuytren contracture.
The exclusion criteria in the trials for FDA approval were extensive and included breast-feeding, pregnancy, bleeding disorder, recent stroke, use of tetracycline derivative within 14 days before start of study, use of anticoagulant within 7 days before start of study, allergy to collagenase, and chronic muscular, neurologic, or neuromuscular disorder affecting the hands.6 Safety and efficacy of collagenase in patients requiring chronic immunosuppressive therapy for medical comorbidities have not been previously documented. Furthermore, although skin tears were reported in 11% of patients after manual cord rupture in the CORD (Collagenase Option for the Reduction of Dupuytren’s) I trial,6 the likelihood of deep and superficial infection and delayed wound healing has not been quantitated.
In this article, we report on outcomes of 13 collagenase enzymatic fasciotomies performed in 8 patients who were on chronic immunosuppressive therapy.
Methods
Institutional review board approval was obtained at both academic hand surgery institutions. We retrospectively reviewed prospectively collected clinical data within our 2 centers’ databases of patients with Dupuytren disease. Eight patients on chronic immunosuppressive therapies treated with collagenase for metacarpophalangeal (MP) or proximal interphalangeal (PIP) joint contractures between February 2010 and December 2011 were identified. Three of these patients received collagenase injections into 2 or more separate Dupuytren cords at different encounters, resulting in a total of 13 individual collagenase enzymatic fasciotomies.
Collagenase injections were administered following CORD I trial protocol,6 except we injected Dupuytren cords crossing the PIP joint using a lateral approach to minimize risk of flexor tendon rupture. Manipulation of the treated joint was performed between 24 and 48 hours after collagenase injection under local anesthesia with 3 mL of 1% mepivacaine or lidocaine without epinephrine. After manipulation and cord rupture, patients were placed in a hand-based extension splint to wear at night for up to 3 months. Patients were followed at 1 and 12 months.
Results
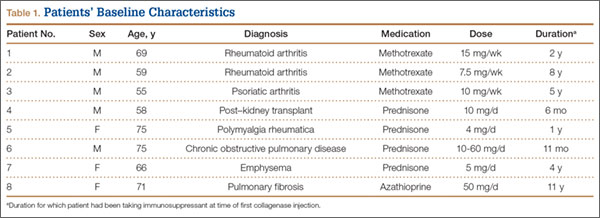
Patients’ baseline characteristics are summarized in Table 1. Four patients were maintained on chronic prednisone therapy, 3 on methotrexate, and 1 on azathioprine. Therapy duration, medication dose, and diagnoses requiring immunosuppressant therapy varied among patients.
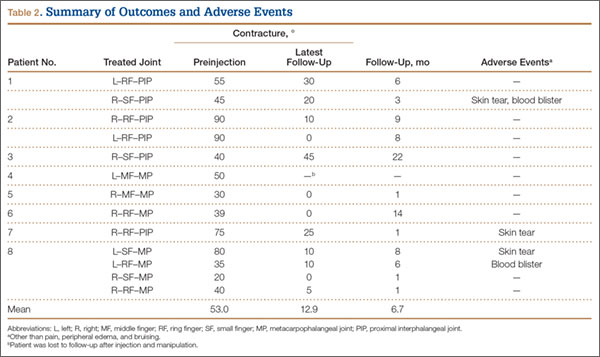
Outcomes and adverse events are summarized in Table 2. Mean number of joint contractures per hand treated was 2.8 (MP, 1.4; PIP, 1.4). However, not all joints met the intervention criteria. Of the 13 joints treated, 7 were MP joints, and 6 were PIP joints. Mean preinjection contracture of the treated joints was 53.0° (range, 20°-90°). Twelve of the 13 joint contractures improved. At mean follow-up of 6.7 months (range, 1-22 months), mean magnitude of contracture improved to 12.9° (range, 0°-45°). Mean MP joint contracture improved from 42.0° to 4.2° (range, 0°-10°), and mean PIP joint contracture improved from 65.8° to 21.7° (range, 0°-45°).
All 13 collagenase injections were well tolerated, and there were no systemic reactions. Injection-site pain was common. Mild injection-site bruising and edema were reported in all cases. Enzymatic fasciotomy was performed in all patients, and immediate improvement in contracture after manipulation 24 to 48 hours after injection was recorded.
Three of the 13 injections were complicated by skin tears during manipulation and cord rupture. All 3 skin tears were treated with local wound care, which included use of povidone-iodine and wet-to-dry dressings. There was no evidence of subsequent superficial or deep, local or regional infection. In 2 cases, the wound healed within 1 week; in the third case, wound healing was present by 2 weeks. Once the wounds showed early re-epithelialization, hand-based extension splinting in a position of comfort was used at night for up to 3 months after injection. Two of the 13 injections were complicated by small blood blisters. These were treated with observation and resolved spontaneously.
Discussion
Collagenase enzymatic fasciotomy appeared to be a safe and efficacious alternative to surgical treatment of Dupuytren contractures in this cohort of patients maintained on chronic immunosuppressive agents. MP contractures responded more substantially than PIP contractures did, as expected.6 No previously undescribed adverse outcomes were noted in these 8 patients on chronic immunosuppressive therapy beyond those reported in the CORD I trial. Three (23%) of the 13 collagenase injections in our series were complicated by skin tears after manipulation. Skins tears were reported in 22 (11%) of 204 patients after manual cord rupture in the CORD I trial.6 Given the limited numbers in this series, it remains unclear if chronic immunosuppression truly increases the risk of skin tears in this subset of patients. Other common treatment-related adverse events seen in the CORD I trial—injection-site hemorrhage (37%), pruritis (11%) and lymphadenopathy (10%)—were not seen after the 13 injections in our case series. We are prospectively following all patients with Dupuytren disease, and this is an area of ongoing research at our centers.
The immunosuppressive actions of prednisone, azathioprine, and methotrexate are well documented. Prednisone is a glucocorticoid, converted in the liver to prednisolone, which suppresses inflammation and immune responses by regulation of gene expression. Its immunosuppressive actions are multifactorial, relating to inhibition of lymphocytes, neutrophils, and monocytes. These effects are dose- and time-dependent11 and may become evident in patients receiving low doses over prolonged periods. Skin atrophy12 and delayed wound healing9 are side effects of long-term prednisone use. Skin atrophy may make the prednisone-treated patient more susceptible to skin tears after collagenase injection and manipulation. Azathioprine inhibits purine synthesis, which is especially important in the proliferation of immune cells.13 It has been shown to inhibit both cellular immunity at low doses and humoral immunity at higher doses.14 Methotrexate inhibits lymphocyte folic acid metabolism. The immunosuppressive properties of low-dose methotrexate have been linked to the induction of apoptosis in activated T cells.15
A more complex process in immunosuppressed patients is the immunogenicity of injected collagenase. As CHC in current use is a mixture of 2 foreign proteins, an immunologic response is expected in the host after injection. It has been shown that, after 3 injections of CHC into Dupuytren cords, 100% of patients developed antibodies to both enzymes in their serum.6 More than 85% demonstrated anti-CHC antibodies after a single injection. However, no patients showed signs of anaphylaxis or allergic reaction, and there was no correlation between serum levels of anti-CHC and adverse events. It has been hypothesized that there is a potential for cross-reactivity of the anti-CHC antibodies with human matrix metalloproteinases, causing enzymatic dysfunction within the host.16 This has yet to be reported clinically, and Xiaflex is currently under postmarketing surveillance. Immunocompromised people, with suppressed humoral and cellular immune responses, may produce less of an antibody response to the foreign CHC proteins. Whether this conclusively leads to a change in the side effect profile of the medication in these individuals is beyond the scope of this article. However, we identified no new side effects in this small but higher risk cohort. The issue should be continually monitored as collagenase is used in wider clinical settings.
Collagenase enzymatic fasciotomy is a new nonsurgical therapeutic option for Dupuytren disease. Indications and guidelines for use continue to evolve. This case series highlights the use of collagenase in 8 patients who were on long-term immunosuppressive therapy. This study has the limitations inherent to retrospective analyses. It is difficult to generalize results across broader immunosuppressed populations. A larger cohort, with long-term follow-up assessing recurrence of contracture, is needed to make definitive conclusions about use of collagenase in this challenging subset of patients. Based on our observations in this limited cohort, it appears appropriate to pursue further studies on use of collagenase enzymatic fasciotomy. A randomized, prospective or case–control series comparing surgical fasciectomy with enzymatic fasciotomy would yield further meaningful data. As more patients seek nonsurgical treatment for Dupuytren disease, its safety and efficacy in select cohorts of patients should continue to be evaluated.
1. Loos B, Puschkin V, Horch RE. 50 years experience with Dupuytren’s contracture in the Erlangen University Hospital—a retrospective analysis of 2919 operated hands from 1956 to 2006. BMC Musculoskelet Disord. 2007;8:60.
2. Coert JH, Nérin JP, Meek MF. Results of partial fasciectomy for Dupuytren disease in 261 consecutive patients. Ann Plast Surg. 2006;57(1):13-17.
3. Sennwald GR. Fasciectomy for treatment of Dupuytren’s disease and early complications. J Hand Surg Am. 1990;15(5):755-761.
4. Badalamente MA, Hurst LC. Enzyme injection as nonsurgical treatment of Dupuytren’s disease. J Hand Surg Am. 2000;25(4):629-636.
5. Badalamente MA, Hurst LC, Hentz VR. Collagen as a clinical target: nonoperative treatment of Dupuytren’s disease. J Hand Surg Am. 2002;27(5):788-798.
6. Hurst LC, Badalamente MA, Hentz VR, et al; CORD I Study Group. Injectable collagenase Clostridium histolyticum for Dupuytren’s contracture. N Engl J Med. 2009;361(10):968-979.
7. Mookhtiar KA, Van Wart HE. Clostridium histolyticum collagenases: a new look at some old enzymes. Matrix Suppl. 1992;1:116-126.
8. Watanabe K. Collagenolytic proteases from bacteria. Appl Microbiol Biotechnol. 2004;63(5):520-526.
9. Wang AS, Armstrong EJ, Armstrong AW. Corticosteroids and wound healing: clinical considerations in the perioperative period. Am J Surg. 2013;206(3):410-417.
10. Denkler K. Surgical complications associated with fasciectomy for Dupuytren’s disease: a 20-year review of the English literature. Eplasty. 2010;10:e15.
11. Stuck AE, Minder CE, Frey FJ. Risk of infectious complications in patients taking glucocorticosteroids. Rev Infect Dis. 1989;11(6):954-963.
12. Oikarinen A, Autio P. New aspects of the mechanism of corticosteroid-induced dermal atrophy. Clin Exp Dermatol. 1991;16(6):416-419.
13. Makinodan T, Santos GW, Quinn RP. Immunosuppressive drugs. Pharmacol Rev. 1970;22(2):189-247.
14. Röllinghoff M, Schrader J, Wagner H. Effect of azathioprine and cytosine arabinoside on humoral and cellular immunity in vitro. Clin Exp Immunol. 1973;15(2):261-269.
15. Genestier L, Paillot R, Fournel S, Ferraro C, Miossec P, Revillard JP. Immunosuppressive properties of methotrexate: apoptosis and clonal deletion of activated peripheral T cells. J Clin Invest. 1998;102(2):322-328.
16. Desai SS, Hentz VR. Collagenase Clostridium histolyticum for Dupuytren’s contracture. Expert Opin Biol Ther. 2010;10(9):1395-1404.
The incidence of Dupuytren disease increases with advancing age,1 as do the medical comorbidities of patients seeking treatment for disabling hand contractures. For patients with significant comorbidities, open surgical fasciectomy, the current standard of treatment for Dupuytren disease,2,3 may be associated with increased perioperative risks.
Collagenase enzymatic fasciotomy has become an accepted nonsurgical treatment alternative to traditional fasciectomy or surgical fasciotomy for significant digital contractures caused by Dupuytren disease.4-6 Clostridium histolyticum collagenase (CHC) is a foreign protein, made up of 2 collagenases isolated from the bacteria C histolyticum.7 The collagenases are zinc-dependent matrix metalloproteinases that cleave the triple helical structure of collagen molecules.8 Also known as Xiaflex (Auxilium Pharmaceuticals), CHC was approved by the US Food and Drug Administration (FDA) in February 2010 for use in patients with Dupuytren contractures.
Enzymatic rupture is safe and efficacious at midterm follow-up and offers the theoretical advantage of avoiding palmar and digital fasciectomy and the associated risks of surgical-site infection and wound-healing complications.6 The risks of surgical wound complications are magnified in immunosuppressed patients, particularly those on chronic steroid therapy; wound-healing complication rates may be increased 2 to 5 times compared with controls.9 In a pooled literature review, wound-healing complications were reported after 22.9% of open primary fasciectomies, with infection occurring in 2.4%.10 A nonsurgical alternative is therefore particularly appealing for a patient cohort that may be at higher risk for a frequently described complication of surgery for Dupuytren contracture.
The exclusion criteria in the trials for FDA approval were extensive and included breast-feeding, pregnancy, bleeding disorder, recent stroke, use of tetracycline derivative within 14 days before start of study, use of anticoagulant within 7 days before start of study, allergy to collagenase, and chronic muscular, neurologic, or neuromuscular disorder affecting the hands.6 Safety and efficacy of collagenase in patients requiring chronic immunosuppressive therapy for medical comorbidities have not been previously documented. Furthermore, although skin tears were reported in 11% of patients after manual cord rupture in the CORD (Collagenase Option for the Reduction of Dupuytren’s) I trial,6 the likelihood of deep and superficial infection and delayed wound healing has not been quantitated.
In this article, we report on outcomes of 13 collagenase enzymatic fasciotomies performed in 8 patients who were on chronic immunosuppressive therapy.
Methods
Institutional review board approval was obtained at both academic hand surgery institutions. We retrospectively reviewed prospectively collected clinical data within our 2 centers’ databases of patients with Dupuytren disease. Eight patients on chronic immunosuppressive therapies treated with collagenase for metacarpophalangeal (MP) or proximal interphalangeal (PIP) joint contractures between February 2010 and December 2011 were identified. Three of these patients received collagenase injections into 2 or more separate Dupuytren cords at different encounters, resulting in a total of 13 individual collagenase enzymatic fasciotomies.
Collagenase injections were administered following CORD I trial protocol,6 except we injected Dupuytren cords crossing the PIP joint using a lateral approach to minimize risk of flexor tendon rupture. Manipulation of the treated joint was performed between 24 and 48 hours after collagenase injection under local anesthesia with 3 mL of 1% mepivacaine or lidocaine without epinephrine. After manipulation and cord rupture, patients were placed in a hand-based extension splint to wear at night for up to 3 months. Patients were followed at 1 and 12 months.
Results
Patients’ baseline characteristics are summarized in Table 1. Four patients were maintained on chronic prednisone therapy, 3 on methotrexate, and 1 on azathioprine. Therapy duration, medication dose, and diagnoses requiring immunosuppressant therapy varied among patients.
Outcomes and adverse events are summarized in Table 2. Mean number of joint contractures per hand treated was 2.8 (MP, 1.4; PIP, 1.4). However, not all joints met the intervention criteria. Of the 13 joints treated, 7 were MP joints, and 6 were PIP joints. Mean preinjection contracture of the treated joints was 53.0° (range, 20°-90°). Twelve of the 13 joint contractures improved. At mean follow-up of 6.7 months (range, 1-22 months), mean magnitude of contracture improved to 12.9° (range, 0°-45°). Mean MP joint contracture improved from 42.0° to 4.2° (range, 0°-10°), and mean PIP joint contracture improved from 65.8° to 21.7° (range, 0°-45°).
All 13 collagenase injections were well tolerated, and there were no systemic reactions. Injection-site pain was common. Mild injection-site bruising and edema were reported in all cases. Enzymatic fasciotomy was performed in all patients, and immediate improvement in contracture after manipulation 24 to 48 hours after injection was recorded.
Three of the 13 injections were complicated by skin tears during manipulation and cord rupture. All 3 skin tears were treated with local wound care, which included use of povidone-iodine and wet-to-dry dressings. There was no evidence of subsequent superficial or deep, local or regional infection. In 2 cases, the wound healed within 1 week; in the third case, wound healing was present by 2 weeks. Once the wounds showed early re-epithelialization, hand-based extension splinting in a position of comfort was used at night for up to 3 months after injection. Two of the 13 injections were complicated by small blood blisters. These were treated with observation and resolved spontaneously.
Discussion
Collagenase enzymatic fasciotomy appeared to be a safe and efficacious alternative to surgical treatment of Dupuytren contractures in this cohort of patients maintained on chronic immunosuppressive agents. MP contractures responded more substantially than PIP contractures did, as expected.6 No previously undescribed adverse outcomes were noted in these 8 patients on chronic immunosuppressive therapy beyond those reported in the CORD I trial. Three (23%) of the 13 collagenase injections in our series were complicated by skin tears after manipulation. Skins tears were reported in 22 (11%) of 204 patients after manual cord rupture in the CORD I trial.6 Given the limited numbers in this series, it remains unclear if chronic immunosuppression truly increases the risk of skin tears in this subset of patients. Other common treatment-related adverse events seen in the CORD I trial—injection-site hemorrhage (37%), pruritis (11%) and lymphadenopathy (10%)—were not seen after the 13 injections in our case series. We are prospectively following all patients with Dupuytren disease, and this is an area of ongoing research at our centers.
The immunosuppressive actions of prednisone, azathioprine, and methotrexate are well documented. Prednisone is a glucocorticoid, converted in the liver to prednisolone, which suppresses inflammation and immune responses by regulation of gene expression. Its immunosuppressive actions are multifactorial, relating to inhibition of lymphocytes, neutrophils, and monocytes. These effects are dose- and time-dependent11 and may become evident in patients receiving low doses over prolonged periods. Skin atrophy12 and delayed wound healing9 are side effects of long-term prednisone use. Skin atrophy may make the prednisone-treated patient more susceptible to skin tears after collagenase injection and manipulation. Azathioprine inhibits purine synthesis, which is especially important in the proliferation of immune cells.13 It has been shown to inhibit both cellular immunity at low doses and humoral immunity at higher doses.14 Methotrexate inhibits lymphocyte folic acid metabolism. The immunosuppressive properties of low-dose methotrexate have been linked to the induction of apoptosis in activated T cells.15
A more complex process in immunosuppressed patients is the immunogenicity of injected collagenase. As CHC in current use is a mixture of 2 foreign proteins, an immunologic response is expected in the host after injection. It has been shown that, after 3 injections of CHC into Dupuytren cords, 100% of patients developed antibodies to both enzymes in their serum.6 More than 85% demonstrated anti-CHC antibodies after a single injection. However, no patients showed signs of anaphylaxis or allergic reaction, and there was no correlation between serum levels of anti-CHC and adverse events. It has been hypothesized that there is a potential for cross-reactivity of the anti-CHC antibodies with human matrix metalloproteinases, causing enzymatic dysfunction within the host.16 This has yet to be reported clinically, and Xiaflex is currently under postmarketing surveillance. Immunocompromised people, with suppressed humoral and cellular immune responses, may produce less of an antibody response to the foreign CHC proteins. Whether this conclusively leads to a change in the side effect profile of the medication in these individuals is beyond the scope of this article. However, we identified no new side effects in this small but higher risk cohort. The issue should be continually monitored as collagenase is used in wider clinical settings.
Collagenase enzymatic fasciotomy is a new nonsurgical therapeutic option for Dupuytren disease. Indications and guidelines for use continue to evolve. This case series highlights the use of collagenase in 8 patients who were on long-term immunosuppressive therapy. This study has the limitations inherent to retrospective analyses. It is difficult to generalize results across broader immunosuppressed populations. A larger cohort, with long-term follow-up assessing recurrence of contracture, is needed to make definitive conclusions about use of collagenase in this challenging subset of patients. Based on our observations in this limited cohort, it appears appropriate to pursue further studies on use of collagenase enzymatic fasciotomy. A randomized, prospective or case–control series comparing surgical fasciectomy with enzymatic fasciotomy would yield further meaningful data. As more patients seek nonsurgical treatment for Dupuytren disease, its safety and efficacy in select cohorts of patients should continue to be evaluated.
1. Loos B, Puschkin V, Horch RE. 50 years experience with Dupuytren’s contracture in the Erlangen University Hospital—a retrospective analysis of 2919 operated hands from 1956 to 2006. BMC Musculoskelet Disord. 2007;8:60.
2. Coert JH, Nérin JP, Meek MF. Results of partial fasciectomy for Dupuytren disease in 261 consecutive patients. Ann Plast Surg. 2006;57(1):13-17.
3. Sennwald GR. Fasciectomy for treatment of Dupuytren’s disease and early complications. J Hand Surg Am. 1990;15(5):755-761.
4. Badalamente MA, Hurst LC. Enzyme injection as nonsurgical treatment of Dupuytren’s disease. J Hand Surg Am. 2000;25(4):629-636.
5. Badalamente MA, Hurst LC, Hentz VR. Collagen as a clinical target: nonoperative treatment of Dupuytren’s disease. J Hand Surg Am. 2002;27(5):788-798.
6. Hurst LC, Badalamente MA, Hentz VR, et al; CORD I Study Group. Injectable collagenase Clostridium histolyticum for Dupuytren’s contracture. N Engl J Med. 2009;361(10):968-979.
7. Mookhtiar KA, Van Wart HE. Clostridium histolyticum collagenases: a new look at some old enzymes. Matrix Suppl. 1992;1:116-126.
8. Watanabe K. Collagenolytic proteases from bacteria. Appl Microbiol Biotechnol. 2004;63(5):520-526.
9. Wang AS, Armstrong EJ, Armstrong AW. Corticosteroids and wound healing: clinical considerations in the perioperative period. Am J Surg. 2013;206(3):410-417.
10. Denkler K. Surgical complications associated with fasciectomy for Dupuytren’s disease: a 20-year review of the English literature. Eplasty. 2010;10:e15.
11. Stuck AE, Minder CE, Frey FJ. Risk of infectious complications in patients taking glucocorticosteroids. Rev Infect Dis. 1989;11(6):954-963.
12. Oikarinen A, Autio P. New aspects of the mechanism of corticosteroid-induced dermal atrophy. Clin Exp Dermatol. 1991;16(6):416-419.
13. Makinodan T, Santos GW, Quinn RP. Immunosuppressive drugs. Pharmacol Rev. 1970;22(2):189-247.
14. Röllinghoff M, Schrader J, Wagner H. Effect of azathioprine and cytosine arabinoside on humoral and cellular immunity in vitro. Clin Exp Immunol. 1973;15(2):261-269.
15. Genestier L, Paillot R, Fournel S, Ferraro C, Miossec P, Revillard JP. Immunosuppressive properties of methotrexate: apoptosis and clonal deletion of activated peripheral T cells. J Clin Invest. 1998;102(2):322-328.
16. Desai SS, Hentz VR. Collagenase Clostridium histolyticum for Dupuytren’s contracture. Expert Opin Biol Ther. 2010;10(9):1395-1404.
Open Carpal Tunnel Release With Use of a Nasal Turbinate Speculum
Carpal tunnel syndrome (CTS) is a disorder characterized by entrapment of the median nerve at the wrist, which may lead to symptoms of pain, paresthesia, and, ultimately, thenar muscle atrophy. Surgical intervention is indicated with persistent or progressive symptoms despite nonoperative management. Timely surgical decompression aims to halt progression of this disorder and prevent permanent peripheral nerve injury.
Carpal tunnel release (CTR) is the most common hand and wrist surgery in the United States, with about 400,000 operations performed annually.1,2 Several methods of decompressing the carpal tunnel have been described.3 These include standard open CTR (OCTR), mini-open approaches, and various endoscopic techniques. OCTR was initially described by Sir James Learmonth in 1933,4 and it remains the gold-standard surgical treatment for patients with symptomatic CTS. Uniform excellent results with high patient satisfaction and low complication rates have been reported in several series.5-9 Common to all techniques is complete proximal-to-distal division of the transverse carpal ligament (TCL). Magnetic resonance imaging studies have shown that TCL transection and the resulting diastasis between the radial and ulnar leaflets cause a significant increase in the volume of the carpal tunnel, leading to decreased pressure.10,11
Endoscopic CTR (ECTR) techniques were developed in an effort to reduce complications, scar sensitivity, and pillar pain and facilitate more rapid return to work.12-17 Outcome studies have demonstrated that both open and endoscopic releases yield patient-reported subjective improvements over preoperative symptoms.18-22 A randomized, controlled trial by Trumble and colleagues23 in 2002 found that ECTR led to improved patient outcomes in the early postoperative period (first 3 months), though differences in outcomes were reduced at final follow-up. More recently (2007), a Cochrane review of 33 trials concluded there was no strong evidence favoring use of alternative techniques over OCTR.3 Further, OCTR has been found to be technically less demanding and associated with decreased complications and costs.24
Indications
The benefit of median nerve decompression at the wrist for CTS is clear.6,7 Indications for surgery in patients with CTS include persistent symptoms despite nonoperative treatment, objective sensory disturbance or motor weakness, and thenar atrophy. Symptomatic response to corticosteroid injection is predictive of success after carpal tunnel surgery.25 More than 87% of patients who gain symptomatic relief from corticosteroid injection have an excellent surgical outcome.
Technique
OCTR allows direct visualization of the TCL and the distal volar forearm fascia (DVFF) and evaluation for the presence of anomalous branching patterns of the median nerve. OCTR traditionally was performed through a 4- to 5-cm longitudinal incision extending from the wrist crease proximally to the Kaplan cardinal line distally. The mini-open technique is identical with the exception of incision length. We routinely use a 2.5- to 3-cm incision. Regardless of incision length, each OCTR should proceed through the same reproducible steps.
We perform OCTR under tourniquet control. Choice of anesthesia is surgeon and patient preference. We prefer local anesthesia with conscious sedation. After conscious sedation is administered, we infiltrate the carpal tunnel and surrounding subcutaneous tissue with 10 mL of a 50:50 mixture of 0.5% bupivacaine and 1% lidocaine without epinephrine.
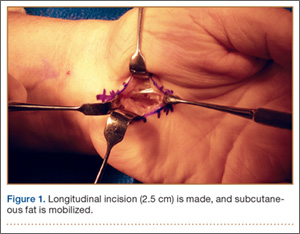
A 2.5- to 3-cm longitudinal incision is made along the axis of the radial border of the ring finger from the Kaplan cardinal line26 and extending about 3 cm proximally toward the wrist flexion crease ulnar to the palmaris longus if present (Figure 1).
After the skin is incised longitudinally, the subcutaneous fat is mobilized and cutaneous sensory branches identified and protected. The underlying superficial palmar fascia is incised in line with the skin incision. The underlying midportion of the TCL is now visualized.
Transverse Carpal Ligament Release
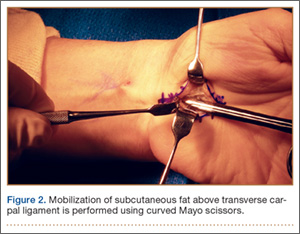
Occasionally, the investing fascia along the ulnar edge of the thenar musculature is mobilized radialward (if the thenar musculature is well developed) to visualize the proximal limb of the TCL. Injury to any anomalous motor branch of the median nerve is avoided by directly visualizing and then incising the TCL (Figure 2). The TCL is incised along its ulnar border just radial to the hook of hamate from distal to proximal in line with the radial border of the ring finger. Staying near the ulnar attachment of the TCL keeps the plane of ligament division farther away from the median nerve and its recurrent motor branches. Although the ulnar neurovascular bundle typically resides ulnar to the hook of hamate in the canal of Guyon, the surgeon must be aware that it can be located radial to the hook in some instances.27,28 In the elderly, the ulnar artery may be tortuous and enter the field and require retraction. The TCL is incised distally until the sentinel fat pad, which marks the superficial palmar arterial arch, is visualized. This bed of adipose tissue marks the distal edge of the TCL.29
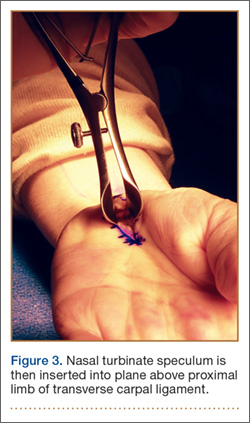
Proximally, subcutaneous tissues above the proximal limb of the TCL and DVFF are mobilized to about 2 cm proximal to the wrist flexion crease to create a plane for the fine long nasal turbinate speculum. The nasal turbinate speculum is then inserted into this plane above the proximal limb of the TCL and DVFF (Figure 3). Once inserted to the level of the confluence of the TCL and the DVFF, the speculum is opened.
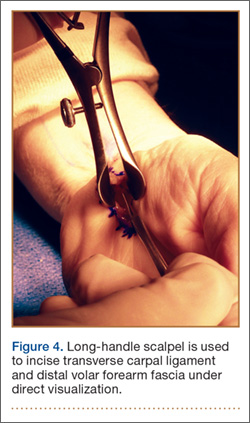
Topside visualization is now encountered with the ulnar neurovascular bundle protected by the ulnar blade of the speculum. A long-handle scalpel is used to incise the TCL and the DVFF under direct visualization from proximal to distal in line with the previously completed distal release (Figure 4). As the nasal turbinate speculum is stretching the TCL and putting it under tension, the TCL can be heard splitting as it is being incised. Once the TCL and the DVFF are divided, the speculum is slowly closed and removed. Wide diastasis of the radial and ulnar leaflets of the TCL and the DVFF is directly visualized. Complete decompression of the median nerve from the distal forearm fascia to the superficial palmar arch is confirmed.
Adhesions between the undersurface of the radial leaflet and the flexor tendons and median nerve are mobilized. The median nerve is assessed for “hourglass” morphology or atrophy. The flexor tendons can be swept radialward with a free elevator to inspect the floor of the carpal tunnel. Flexor tenosynovectomy is not routinely performed. The incision is closed with interrupted simple sutures using 4-0 nylon.
Study Results
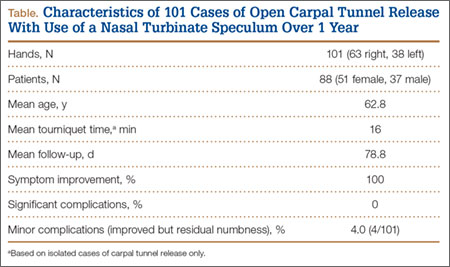
This study was conducted at Hand Surgery PC, Newton-Wellesley Hospital, Tufts University School of Medicine. Over a 10-month interval, 101 consecutive mini-OCTRs (63 right hands, 38 left hands) were performed with this proximal release modification in 88 patients (51 females, 37 males) by Dr. Ruchelsman and Dr. Belsky (Table). CTRs performed in the setting of wrist and/or carpal trauma were excluded. Mean age was 62.8 years. Mean follow-up was 11.3 weeks (~3 months). For isolated cases of CTR, mean tourniquet time was 16 minutes. CTS symptoms were relieved in all patients with a high degree of satisfaction as measured with history and examination findings at follow-up visits. There were no major complications (eg, infection, neural or vascular damage, severe residual pain). Four patients reported minor residual numbness in the fingers at latest follow-up but nevertheless had major improvement over preoperative baseline. These 4 patients had preoperative electromyograms or nerve conduction studies documenting the extent of their disease. There was 1 case of minor wound complication. Three weeks after surgery, the patient had a 1-cm wound opening, which closed with local wound care. The patient did not develop any drainage, infection, bleeding, or neurologic symptoms.
Discussion
Open release of the TCL—the gold standard of surgical treatment for CTS—produces reliable symptom relief in the vast majority of patients.25,30 Given that the most common complication of carpal tunnel surgery is incomplete release of the TCL,31,32 this technique, which uses a nasal turbinate speculum to better visualize the median nerve, could potentially reduce the reoperation rate. The nasal turbinate speculum allows the surgeon to see the confluence of the TCL and the DVFF. In addition, as the complete release can be visualized, there is minimal chance of injury.
The 2007 Cochrane review3 found no strong evidence supporting replacing OCTR with endoscopic techniques. Previous investigators have questioned the utility of ECTR given that it is higher in cost and more resource-intensive than OCTR1,33,34 and is associated with higher rates of certain complications.5,22,35-37 A 2004 meta-analysis of 13 randomized, controlled trials found a higher rate of reversible nerve damage with an odds ratio of 3.1 for ECTR versus OCTR.35 A more recent (2006) review of more than 80 studies found transient neurapraxias in 1.45% of ECTR cases and 0.25% of OCTR cases.5 The same study reported overall complication rates (reversible and major neurovascular structural injuries) of 0.74% for OCTR and 1.63% for ECTR (P < .005). Another limitation of ECTR is that endoscopic techniques require a higher degree of surgical skill, which makes teaching residents and fellows more challenging.
The novel nasal turbinate speculum technique presented here is easily reproducible and allows first-time surgeons to visualize all important structures. Given that this technique does not require an endoscope or an endoscope-viewing tower, it is likely more cost-effective and requires less time for turnover between cases. Patients obtain good relief of their CTS symptoms with this technique, and most return to their daily activities within weeks after operation.
1. Ono S, Clapham PJ, Chung KC. Optimal management of carpal tunnel syndrome. Int J Gen Med. 2010;3(4):255-261.
2. Concannon MJ, Brownfield ML, Puckett CL. The incidence of recurrence after endoscopic carpal tunnel release. Plast Reconstr Surg. 2000;105(5):1662-1665.
3. Scholten RJ, Mink van der Molen A, Uitdehaag BM, Bouter LM, de Vet HC. Surgical treatment options for carpal tunnel syndrome. Cochrane Database Syst Rev. 2007;(4):CD003905.
4. In memoriam Sir James Learmonth, K.C.V.O., C.B.E., hon. F.R.C.S. (1895-1967). Ann R Coll Surg Engl. 1967;41(5):438-439.
5. Benson LS, Bare AA, Nagle DJ, Harder VS, Williams CS, Visotsky JL. Complications of endoscopic and open carpal tunnel release. Arthroscopy. 2006;22(9):919-924, 924.e1-e2.
6. Jarvik JG, Comstock BA, Kliot M, et al. Surgery versus non-surgical therapy for carpal tunnel syndrome: a randomised parallel-group trial. Lancet. 2009;374(9695):1074-1081.
7. Verdugo RJ, Salinas RA, Castillo JL, et al. Surgical versus non-surgical treatment for carpal tunnel syndrome. Cochrane Database Syst Rev. 2008;(4):CD001552.
8. Garland H, Langworth EP, Taverner D, et al. Surgical treatment for the carpal tunnel syndrome. Lancet. 1964;1(7343):1129-1130.
9. Gerritsen AA, de Vet HC, Scholten RJ, et al. Splinting vs surgery in the treatment of carpal tunnel syndrome: a randomized controlled trial. JAMA. 2002;288(10):1245-1251.
10. Gelberman RH, Hergenroeder PT, Hargens AR, et al. The carpal tunnel syndrome. A study of carpal canal pressures. J Bone Joint Surg Am. 1981;63(3):380-383.
11. Sucher BM. Myofascial manipulative release of carpal tunnel syndrome: documentation with magnetic resonance imaging. J Am Osteopath Assoc. 1993;93(12):1273-1278.
12. Pereira EE, Miranda DA, Sere I, et al. Endoscopic release of the carpal tunnel: a 2-portal-modified technique. Tech Hand Up Extrem Surg. 2010;14(4):263-265.
13. Louis DS, Greene TL, Noellert RC. Complications of carpal tunnel surgery. J Neurosurg. 1985;62(3):352-356.
14. Mirza MA, King ET Jr, Tanveer S. Palmar uniportal extrabursal endoscopic carpal tunnel release. Arthroscopy. 1995;11(1):82-90.
15. Brown MG, Keyser B, Rothenberg ES. Endoscopic carpal tunnel release. J Hand Surg Am. 1992;17(6):1009-1011.
16. Agee JM, McCarroll HR Jr, Tortosa RD, et al. Endoscopic release of the carpal tunnel: a randomized prospective multicenter study. J Hand Surg Am. 1992;17(6):987-995.
17. Okutsu I, Ninomiya S, Takatori Y, et al. Endoscopic management of carpal tunnel syndrome. Arthroscopy. 1989;5(1):11-18.
18. Ghaly RF, Saban KL, Haley DA, et al. Endoscopic carpal tunnel release surgery: report of patient satisfaction. Neurol Res. 2000;22(6):551-555.
19. Lee WP, Plancher KD, Strickland JW. Carpal tunnel release with a small palmar incision. Hand Clin. 1996;12(2):271-284.
20. Biyani A, Downes EM. An open twin incision technique of carpal tunnel decompression with reduced incidence of scar tenderness. J Hand Surg Br. 1993;18(3):331-334.
21. Brown RA, Gelberman RH, Seiler JG 3rd, et al. Carpal tunnel release. A prospective, randomized assessment of open and endoscopic methods. J Bone Joint Surg Am. 1993;75(9):1265-1275.
22. Chow JC. Endoscopic release of the carpal ligament for carpal tunnel syndrome: 22-month clinical result. Arthroscopy. 1990;6(4):288-296.
23. Trumble TE, Diao E, Abrams RA, et al. Single-portal endoscopic carpal tunnel release compared with open release: a prospective, randomized trial. J Bone Joint Surg Am. 2002;84(7):1107-1115.
24. Gerritsen AA, Uitdehaag BM, van Geldere D, et al. Systematic review of randomized clinical trials of surgical treatment for carpal tunnel syndrome. Br J Surg. 2001;88(10):1285-1295.
25. Edgell SE, McCabe SJ, Breidenbach WC, et al. Predicting the outcome of carpal tunnel release. J Hand Surg Am. 2003;28(2):255-261.
26. Vella JC, Hartigan BJ, Stern PJ. Kaplan’s cardinal line. J Hand Surg Am. 2006;31(6):912-918.
27. Kwon JY, Kim JY, Hong JT, et al. Position change of the neurovascular structures around the carpal tunnel with dynamic wrist motion. J Korean Neurosurg Soc. 2011;50(4):377-380.
28. Netscher D, Polsen C, Thornby J, et al. Anatomic delineation of the ulnar nerve and ulnar artery in relation to the carpal tunnel by axial magnetic resonance imaging scanning. J Hand Surg Am. 1996;21(2):273-276.
29. Madhav TJ, To P, Stern PJ. The palmar fat pad is a reliable intraoperative landmark during carpal tunnel release. J Hand Surg Am. 2009;34(7):1204-1209.
30. Kulick MI, Gordillo G, Javidi T, et al. Long-term analysis of patients having surgical treatment for carpal tunnel syndrome. J Hand Surg Am. 1986;11(1):59-66.
31. Bland JD. Treatment of carpal tunnel syndrome. Muscle Nerve. 2007;36(2):167-171.
32. MacDonald RI, Lichtman DM, Hanlon JJ, et al. Complications of surgical release for carpal tunnel syndrome. J Hand Surg Am. 1978;3(1):70-76.
33. Atroshi I, Larsson GU, Ornstein E, Hofer M, Johnsson R, Ranstam J. Outcomes of endoscopic surgery compared with open surgery for carpal tunnel syndrome among employed patients: randomised controlled trial. BMJ. 2006;332(7556):1473.
34. Ferdinand RD, MacLean JG. Endoscopic versus open carpal tunnel release in bilateral carpal tunnel syndrome. A prospective, randomised, blinded assessment. J Bone Joint Surg Br. 2002;84(3):375-379.
35. Thoma A, Veltri K, Haines T, et al. A meta-analysis of randomized controlled trials comparing endoscopic and open carpal tunnel decompression. Plast Reconstr Surg. 2004;114(5):1137-1146.
36. Murphy RX Jr, Jennings JF, Wukich DK. Major neurovascular complications of endoscopic carpal tunnel release. J Hand Surg Am. 1994;19(1):114-118.
37. Palmer DH, Paulson JC, Lane-Larsen CL, et al. Endoscopic carpal tunnel release: a comparison of two techniques with open release. Arthroscopy. 1993;9(5):498-508.
Carpal tunnel syndrome (CTS) is a disorder characterized by entrapment of the median nerve at the wrist, which may lead to symptoms of pain, paresthesia, and, ultimately, thenar muscle atrophy. Surgical intervention is indicated with persistent or progressive symptoms despite nonoperative management. Timely surgical decompression aims to halt progression of this disorder and prevent permanent peripheral nerve injury.
Carpal tunnel release (CTR) is the most common hand and wrist surgery in the United States, with about 400,000 operations performed annually.1,2 Several methods of decompressing the carpal tunnel have been described.3 These include standard open CTR (OCTR), mini-open approaches, and various endoscopic techniques. OCTR was initially described by Sir James Learmonth in 1933,4 and it remains the gold-standard surgical treatment for patients with symptomatic CTS. Uniform excellent results with high patient satisfaction and low complication rates have been reported in several series.5-9 Common to all techniques is complete proximal-to-distal division of the transverse carpal ligament (TCL). Magnetic resonance imaging studies have shown that TCL transection and the resulting diastasis between the radial and ulnar leaflets cause a significant increase in the volume of the carpal tunnel, leading to decreased pressure.10,11
Endoscopic CTR (ECTR) techniques were developed in an effort to reduce complications, scar sensitivity, and pillar pain and facilitate more rapid return to work.12-17 Outcome studies have demonstrated that both open and endoscopic releases yield patient-reported subjective improvements over preoperative symptoms.18-22 A randomized, controlled trial by Trumble and colleagues23 in 2002 found that ECTR led to improved patient outcomes in the early postoperative period (first 3 months), though differences in outcomes were reduced at final follow-up. More recently (2007), a Cochrane review of 33 trials concluded there was no strong evidence favoring use of alternative techniques over OCTR.3 Further, OCTR has been found to be technically less demanding and associated with decreased complications and costs.24
Indications
The benefit of median nerve decompression at the wrist for CTS is clear.6,7 Indications for surgery in patients with CTS include persistent symptoms despite nonoperative treatment, objective sensory disturbance or motor weakness, and thenar atrophy. Symptomatic response to corticosteroid injection is predictive of success after carpal tunnel surgery.25 More than 87% of patients who gain symptomatic relief from corticosteroid injection have an excellent surgical outcome.
Technique
OCTR allows direct visualization of the TCL and the distal volar forearm fascia (DVFF) and evaluation for the presence of anomalous branching patterns of the median nerve. OCTR traditionally was performed through a 4- to 5-cm longitudinal incision extending from the wrist crease proximally to the Kaplan cardinal line distally. The mini-open technique is identical with the exception of incision length. We routinely use a 2.5- to 3-cm incision. Regardless of incision length, each OCTR should proceed through the same reproducible steps.
We perform OCTR under tourniquet control. Choice of anesthesia is surgeon and patient preference. We prefer local anesthesia with conscious sedation. After conscious sedation is administered, we infiltrate the carpal tunnel and surrounding subcutaneous tissue with 10 mL of a 50:50 mixture of 0.5% bupivacaine and 1% lidocaine without epinephrine.
A 2.5- to 3-cm longitudinal incision is made along the axis of the radial border of the ring finger from the Kaplan cardinal line26 and extending about 3 cm proximally toward the wrist flexion crease ulnar to the palmaris longus if present (Figure 1).
After the skin is incised longitudinally, the subcutaneous fat is mobilized and cutaneous sensory branches identified and protected. The underlying superficial palmar fascia is incised in line with the skin incision. The underlying midportion of the TCL is now visualized.
Transverse Carpal Ligament Release
Occasionally, the investing fascia along the ulnar edge of the thenar musculature is mobilized radialward (if the thenar musculature is well developed) to visualize the proximal limb of the TCL. Injury to any anomalous motor branch of the median nerve is avoided by directly visualizing and then incising the TCL (Figure 2). The TCL is incised along its ulnar border just radial to the hook of hamate from distal to proximal in line with the radial border of the ring finger. Staying near the ulnar attachment of the TCL keeps the plane of ligament division farther away from the median nerve and its recurrent motor branches. Although the ulnar neurovascular bundle typically resides ulnar to the hook of hamate in the canal of Guyon, the surgeon must be aware that it can be located radial to the hook in some instances.27,28 In the elderly, the ulnar artery may be tortuous and enter the field and require retraction. The TCL is incised distally until the sentinel fat pad, which marks the superficial palmar arterial arch, is visualized. This bed of adipose tissue marks the distal edge of the TCL.29
Proximally, subcutaneous tissues above the proximal limb of the TCL and DVFF are mobilized to about 2 cm proximal to the wrist flexion crease to create a plane for the fine long nasal turbinate speculum. The nasal turbinate speculum is then inserted into this plane above the proximal limb of the TCL and DVFF (Figure 3). Once inserted to the level of the confluence of the TCL and the DVFF, the speculum is opened.
Topside visualization is now encountered with the ulnar neurovascular bundle protected by the ulnar blade of the speculum. A long-handle scalpel is used to incise the TCL and the DVFF under direct visualization from proximal to distal in line with the previously completed distal release (Figure 4). As the nasal turbinate speculum is stretching the TCL and putting it under tension, the TCL can be heard splitting as it is being incised. Once the TCL and the DVFF are divided, the speculum is slowly closed and removed. Wide diastasis of the radial and ulnar leaflets of the TCL and the DVFF is directly visualized. Complete decompression of the median nerve from the distal forearm fascia to the superficial palmar arch is confirmed.
Adhesions between the undersurface of the radial leaflet and the flexor tendons and median nerve are mobilized. The median nerve is assessed for “hourglass” morphology or atrophy. The flexor tendons can be swept radialward with a free elevator to inspect the floor of the carpal tunnel. Flexor tenosynovectomy is not routinely performed. The incision is closed with interrupted simple sutures using 4-0 nylon.
Study Results
This study was conducted at Hand Surgery PC, Newton-Wellesley Hospital, Tufts University School of Medicine. Over a 10-month interval, 101 consecutive mini-OCTRs (63 right hands, 38 left hands) were performed with this proximal release modification in 88 patients (51 females, 37 males) by Dr. Ruchelsman and Dr. Belsky (Table). CTRs performed in the setting of wrist and/or carpal trauma were excluded. Mean age was 62.8 years. Mean follow-up was 11.3 weeks (~3 months). For isolated cases of CTR, mean tourniquet time was 16 minutes. CTS symptoms were relieved in all patients with a high degree of satisfaction as measured with history and examination findings at follow-up visits. There were no major complications (eg, infection, neural or vascular damage, severe residual pain). Four patients reported minor residual numbness in the fingers at latest follow-up but nevertheless had major improvement over preoperative baseline. These 4 patients had preoperative electromyograms or nerve conduction studies documenting the extent of their disease. There was 1 case of minor wound complication. Three weeks after surgery, the patient had a 1-cm wound opening, which closed with local wound care. The patient did not develop any drainage, infection, bleeding, or neurologic symptoms.
Discussion
Open release of the TCL—the gold standard of surgical treatment for CTS—produces reliable symptom relief in the vast majority of patients.25,30 Given that the most common complication of carpal tunnel surgery is incomplete release of the TCL,31,32 this technique, which uses a nasal turbinate speculum to better visualize the median nerve, could potentially reduce the reoperation rate. The nasal turbinate speculum allows the surgeon to see the confluence of the TCL and the DVFF. In addition, as the complete release can be visualized, there is minimal chance of injury.
The 2007 Cochrane review3 found no strong evidence supporting replacing OCTR with endoscopic techniques. Previous investigators have questioned the utility of ECTR given that it is higher in cost and more resource-intensive than OCTR1,33,34 and is associated with higher rates of certain complications.5,22,35-37 A 2004 meta-analysis of 13 randomized, controlled trials found a higher rate of reversible nerve damage with an odds ratio of 3.1 for ECTR versus OCTR.35 A more recent (2006) review of more than 80 studies found transient neurapraxias in 1.45% of ECTR cases and 0.25% of OCTR cases.5 The same study reported overall complication rates (reversible and major neurovascular structural injuries) of 0.74% for OCTR and 1.63% for ECTR (P < .005). Another limitation of ECTR is that endoscopic techniques require a higher degree of surgical skill, which makes teaching residents and fellows more challenging.
The novel nasal turbinate speculum technique presented here is easily reproducible and allows first-time surgeons to visualize all important structures. Given that this technique does not require an endoscope or an endoscope-viewing tower, it is likely more cost-effective and requires less time for turnover between cases. Patients obtain good relief of their CTS symptoms with this technique, and most return to their daily activities within weeks after operation.
1. Ono S, Clapham PJ, Chung KC. Optimal management of carpal tunnel syndrome. Int J Gen Med. 2010;3(4):255-261.
2. Concannon MJ, Brownfield ML, Puckett CL. The incidence of recurrence after endoscopic carpal tunnel release. Plast Reconstr Surg. 2000;105(5):1662-1665.
3. Scholten RJ, Mink van der Molen A, Uitdehaag BM, Bouter LM, de Vet HC. Surgical treatment options for carpal tunnel syndrome. Cochrane Database Syst Rev. 2007;(4):CD003905.
4. In memoriam Sir James Learmonth, K.C.V.O., C.B.E., hon. F.R.C.S. (1895-1967). Ann R Coll Surg Engl. 1967;41(5):438-439.
5. Benson LS, Bare AA, Nagle DJ, Harder VS, Williams CS, Visotsky JL. Complications of endoscopic and open carpal tunnel release. Arthroscopy. 2006;22(9):919-924, 924.e1-e2.
6. Jarvik JG, Comstock BA, Kliot M, et al. Surgery versus non-surgical therapy for carpal tunnel syndrome: a randomised parallel-group trial. Lancet. 2009;374(9695):1074-1081.
7. Verdugo RJ, Salinas RA, Castillo JL, et al. Surgical versus non-surgical treatment for carpal tunnel syndrome. Cochrane Database Syst Rev. 2008;(4):CD001552.
8. Garland H, Langworth EP, Taverner D, et al. Surgical treatment for the carpal tunnel syndrome. Lancet. 1964;1(7343):1129-1130.
9. Gerritsen AA, de Vet HC, Scholten RJ, et al. Splinting vs surgery in the treatment of carpal tunnel syndrome: a randomized controlled trial. JAMA. 2002;288(10):1245-1251.
10. Gelberman RH, Hergenroeder PT, Hargens AR, et al. The carpal tunnel syndrome. A study of carpal canal pressures. J Bone Joint Surg Am. 1981;63(3):380-383.
11. Sucher BM. Myofascial manipulative release of carpal tunnel syndrome: documentation with magnetic resonance imaging. J Am Osteopath Assoc. 1993;93(12):1273-1278.
12. Pereira EE, Miranda DA, Sere I, et al. Endoscopic release of the carpal tunnel: a 2-portal-modified technique. Tech Hand Up Extrem Surg. 2010;14(4):263-265.
13. Louis DS, Greene TL, Noellert RC. Complications of carpal tunnel surgery. J Neurosurg. 1985;62(3):352-356.
14. Mirza MA, King ET Jr, Tanveer S. Palmar uniportal extrabursal endoscopic carpal tunnel release. Arthroscopy. 1995;11(1):82-90.
15. Brown MG, Keyser B, Rothenberg ES. Endoscopic carpal tunnel release. J Hand Surg Am. 1992;17(6):1009-1011.
16. Agee JM, McCarroll HR Jr, Tortosa RD, et al. Endoscopic release of the carpal tunnel: a randomized prospective multicenter study. J Hand Surg Am. 1992;17(6):987-995.
17. Okutsu I, Ninomiya S, Takatori Y, et al. Endoscopic management of carpal tunnel syndrome. Arthroscopy. 1989;5(1):11-18.
18. Ghaly RF, Saban KL, Haley DA, et al. Endoscopic carpal tunnel release surgery: report of patient satisfaction. Neurol Res. 2000;22(6):551-555.
19. Lee WP, Plancher KD, Strickland JW. Carpal tunnel release with a small palmar incision. Hand Clin. 1996;12(2):271-284.
20. Biyani A, Downes EM. An open twin incision technique of carpal tunnel decompression with reduced incidence of scar tenderness. J Hand Surg Br. 1993;18(3):331-334.
21. Brown RA, Gelberman RH, Seiler JG 3rd, et al. Carpal tunnel release. A prospective, randomized assessment of open and endoscopic methods. J Bone Joint Surg Am. 1993;75(9):1265-1275.
22. Chow JC. Endoscopic release of the carpal ligament for carpal tunnel syndrome: 22-month clinical result. Arthroscopy. 1990;6(4):288-296.
23. Trumble TE, Diao E, Abrams RA, et al. Single-portal endoscopic carpal tunnel release compared with open release: a prospective, randomized trial. J Bone Joint Surg Am. 2002;84(7):1107-1115.
24. Gerritsen AA, Uitdehaag BM, van Geldere D, et al. Systematic review of randomized clinical trials of surgical treatment for carpal tunnel syndrome. Br J Surg. 2001;88(10):1285-1295.
25. Edgell SE, McCabe SJ, Breidenbach WC, et al. Predicting the outcome of carpal tunnel release. J Hand Surg Am. 2003;28(2):255-261.
26. Vella JC, Hartigan BJ, Stern PJ. Kaplan’s cardinal line. J Hand Surg Am. 2006;31(6):912-918.
27. Kwon JY, Kim JY, Hong JT, et al. Position change of the neurovascular structures around the carpal tunnel with dynamic wrist motion. J Korean Neurosurg Soc. 2011;50(4):377-380.
28. Netscher D, Polsen C, Thornby J, et al. Anatomic delineation of the ulnar nerve and ulnar artery in relation to the carpal tunnel by axial magnetic resonance imaging scanning. J Hand Surg Am. 1996;21(2):273-276.
29. Madhav TJ, To P, Stern PJ. The palmar fat pad is a reliable intraoperative landmark during carpal tunnel release. J Hand Surg Am. 2009;34(7):1204-1209.
30. Kulick MI, Gordillo G, Javidi T, et al. Long-term analysis of patients having surgical treatment for carpal tunnel syndrome. J Hand Surg Am. 1986;11(1):59-66.
31. Bland JD. Treatment of carpal tunnel syndrome. Muscle Nerve. 2007;36(2):167-171.
32. MacDonald RI, Lichtman DM, Hanlon JJ, et al. Complications of surgical release for carpal tunnel syndrome. J Hand Surg Am. 1978;3(1):70-76.
33. Atroshi I, Larsson GU, Ornstein E, Hofer M, Johnsson R, Ranstam J. Outcomes of endoscopic surgery compared with open surgery for carpal tunnel syndrome among employed patients: randomised controlled trial. BMJ. 2006;332(7556):1473.
34. Ferdinand RD, MacLean JG. Endoscopic versus open carpal tunnel release in bilateral carpal tunnel syndrome. A prospective, randomised, blinded assessment. J Bone Joint Surg Br. 2002;84(3):375-379.
35. Thoma A, Veltri K, Haines T, et al. A meta-analysis of randomized controlled trials comparing endoscopic and open carpal tunnel decompression. Plast Reconstr Surg. 2004;114(5):1137-1146.
36. Murphy RX Jr, Jennings JF, Wukich DK. Major neurovascular complications of endoscopic carpal tunnel release. J Hand Surg Am. 1994;19(1):114-118.
37. Palmer DH, Paulson JC, Lane-Larsen CL, et al. Endoscopic carpal tunnel release: a comparison of two techniques with open release. Arthroscopy. 1993;9(5):498-508.
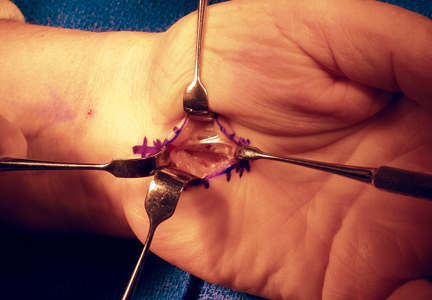
Excision of Symptomatic Spinous Process Nonunion in Adolescent Athletes
Fractures of the spinous process of the lower cervical spine or upper thoracic spine are frequently referred to as clay-shoveler’s fractures. Originally reported by Hall1 in 1940, these fractures were described in workers in Australia who dug drains in clay soil and threw the clay overhead with long shovels. Occasionally, the mud would not release from the shovel, causing excess force to be transmitted to the supraspinous ligaments and resulting in a forceful avulsion fracture of one or multiple spinous processes. The few reports following the earliest description in the literature frequently describe the mechanism of injury as being athletic in nature.2-4 The forceful contraction of the paraspinal and trapezius muscles on the supraspinous ligaments and the resultant attachment to the spinous processes make this a not uncommon injury during athletics, especially with a flexed position of the neck and shoulders. The resultant fracture or apophyseal avulsion is painful and often necessitates a visit to the physician, with plain films, computed tomography (CT) scans, or magnetic resonance imaging (MRI) confirming the diagnosis.5
Treatment of these fractures has not been well described, but frequently a period of rest followed by physical therapy will allow a return to activity. We present a series of adolescent athletes who developed nonunion of the fracture of the T1 spinous process with continued symptoms, despite rest and conservative therapy, and who underwent surgical excision of the ununited fragment.
Materials and Methods
We obtained institutional review board permission for this study and searched the surgical database between 2006 and 2013 for patients who had undergone resection of a spinous process nonunion. We collected demographic data on the patients, evaluated the radiographic studies, and reviewed operative reports and follow-up patient data.
Results
Dr. Hedequist operated on 3 patients with a spinous process nonunion over the study time period. The average age of the patients was 14 years; the location of the spinous process fracture was the T1 vertebra in all patients. Two patients sustained the injury while playing hockey and 1 during wrestling. The average duration of symptoms prior to operation was 10 months; all patients had seen physicians without a diagnosis prior to evaluation at out institution. All patients had a trial of physical therapy before surgery, and all had been unable to return to sport after injury secondary to pain.
Examination of all patients revealed pain directly over the fracture site and accentuated by forward flexion of the neck and shoulders. Evaluation of injury plain films revealed a fracture fragment in 2 patients (Figure 1). All 3 patients underwent MRI and CT scans confirming the diagnosis. MRI confirmed areas of increased signal at the tip of the T1 spinous process, with inflammation in the supraspinous ligament directly at that region (Figure 2). The CT scans confirmed the presence of a bony fragment correlating with the tip of the T1 spinous process (Figure 3).
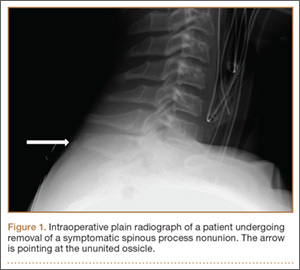
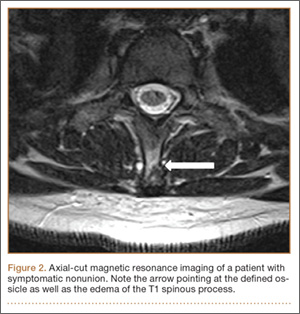
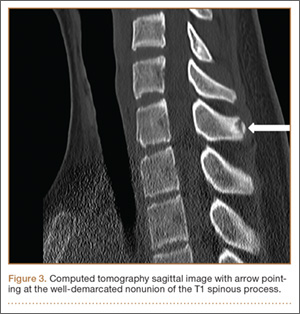
Surgery was performed under general endotracheal anesthesia via a midline incision over the affected area down to the spinous process. The supraspinous ligament was opened revealing an easily identified and definable ununited ossicle, which was removed without taking down the interspinous ligament. All 3 nonunions were noted to be atrophic with no evidence of surrounding inflammatory tissue or bursa. The residual end of the spinous process was smoothed down with a rongeur. Standard closure was performed. There were no surgical complications.
All patients had complete relief of pain at follow-up; 1 patient returned to full sports activity at 6 weeks and the other 2 returned to full sports activity at 3 months. There was no loss of cervical motion or trapezial strength at follow-up. All patients voiced satisfaction with the decision for surgical intervention.
Discussion
Clay-shoveler’s fracture is an injury well known to orthopedists. This fracture is thought to be caused by a forceful contraction of the thoracic paraspinal and trapezial muscles, causing an avulsion fracture with pain and frequently a “pop” experienced by the patient.1 Usually considered self-limiting injuries, treatment involves a period of rest and activity modification with occasional physical therapy. Return to sports has been reported with occasional pain but with patient satisfaction.3,5,6
Our series of patients represent a group of adolescent athletes who sustained spinous process fractures of the T1 vertebra and, despite a significant period of rest and activity modification, were unable to return to sports given their pain. The examination of these patients revealed focal tenderness at the tip of the spinous process. The diagnosis is made clinically, with radiographic studies confirming the diagnosis. In our series of patients, MRI was the original modality used to confirm injury to the area, with hyperintensity seen in the area of the supraspinous ligament and tip of the spinous process. CT confirmed the nonunion and presence of an ossicle in all patients. Surgical exposure of that area easily exposed the ununited ossicle, which was removed in all patients.
To our knowledge, this is the first report in the literature describing surgical excision of an ununited spinous process fracture in adolescent athletes. The original descriptive case series by Hall1 states “in the minds of surgeons who have seen many of these cases that early operative removal of the fragments is the proper routine treatment.” Since that original series, we have not found articles in the literature that support surgical removal; however, persistent symptoms after fracture are described.5 It is not surprising that these patients developed pain at the site of the fracture given the forces acting in that area. The trapezial and paraspinal muscles acting on that area are forceful and repetitive during activities, especially sports. All our patients had pain with attempts at activity and all had had a significant period of rest. In a recent article, this injury was described in adolescents without the patients having clear relief of symptoms despite a period of inactivity.5 While physical therapy is therapeutic in some patients experiencing pain, it can be a source of aggravation due to neck and shoulder motion and muscle contraction. It is not surprising that therapy would not help in most cases, as neck and shoulder motion and muscle contraction are the sources of continuing discomfort.
Clinical practice suggests that most patients with spinous process fractures will become pain-free; however, that is not universal. This series demonstrates that a small subset of patients with this injury will continue to have significant symptoms despite a period of rest. In those patients who desire a pain-free return to sports, we recommend consideration of surgical excision after confirmation of nonunion with radiographic studies. The inherent risks of surgical treatment are minimal with this procedure, and the benefits include return to pain-free sports activity, with the resultant physical and psychosocial benefits for adolescent athletes.
1. Hall RDM. Clay-shoveler’s fracture. J Bone Joint Surg Am. 1940;22(1):63-75.
2. Herrick RT. Clay-shoveler’s fracture in power-lifting. A case report. Am J Sports Med. 1981;9(1):29-30.
3. Hetsroni I, Mann G, Dolev E, Morgenstern D, Nyska M. Clay shoveler’s fracture in a volleyball player. Phys Sportsmed. 2005;33(7):38-42.
4. Kaloostian PE, Kim JE, Calabresi PA, Bydon A, Witham T. Clay-shoveler’s fracture during indoor rock climbing. Orthopedics. 2013;36(3):e381-e383.
5. Yamaguchi KT Jr, Myung KS, Alonso MA, Skaggs DL. Clay-shoveler’s fracture equivalent in children. Spine. 2012;37(26):e1672-e1675.
6. Kang DH, Lee SH. Multiple spinous process fractures of the thoracic vertebrae (clay-shoveler’s fracture) in a beginning golfer: a case report. Spine. 2009;34(15):e534-e537.
Fractures of the spinous process of the lower cervical spine or upper thoracic spine are frequently referred to as clay-shoveler’s fractures. Originally reported by Hall1 in 1940, these fractures were described in workers in Australia who dug drains in clay soil and threw the clay overhead with long shovels. Occasionally, the mud would not release from the shovel, causing excess force to be transmitted to the supraspinous ligaments and resulting in a forceful avulsion fracture of one or multiple spinous processes. The few reports following the earliest description in the literature frequently describe the mechanism of injury as being athletic in nature.2-4 The forceful contraction of the paraspinal and trapezius muscles on the supraspinous ligaments and the resultant attachment to the spinous processes make this a not uncommon injury during athletics, especially with a flexed position of the neck and shoulders. The resultant fracture or apophyseal avulsion is painful and often necessitates a visit to the physician, with plain films, computed tomography (CT) scans, or magnetic resonance imaging (MRI) confirming the diagnosis.5
Treatment of these fractures has not been well described, but frequently a period of rest followed by physical therapy will allow a return to activity. We present a series of adolescent athletes who developed nonunion of the fracture of the T1 spinous process with continued symptoms, despite rest and conservative therapy, and who underwent surgical excision of the ununited fragment.
Materials and Methods
We obtained institutional review board permission for this study and searched the surgical database between 2006 and 2013 for patients who had undergone resection of a spinous process nonunion. We collected demographic data on the patients, evaluated the radiographic studies, and reviewed operative reports and follow-up patient data.
Results
Dr. Hedequist operated on 3 patients with a spinous process nonunion over the study time period. The average age of the patients was 14 years; the location of the spinous process fracture was the T1 vertebra in all patients. Two patients sustained the injury while playing hockey and 1 during wrestling. The average duration of symptoms prior to operation was 10 months; all patients had seen physicians without a diagnosis prior to evaluation at out institution. All patients had a trial of physical therapy before surgery, and all had been unable to return to sport after injury secondary to pain.
Examination of all patients revealed pain directly over the fracture site and accentuated by forward flexion of the neck and shoulders. Evaluation of injury plain films revealed a fracture fragment in 2 patients (Figure 1). All 3 patients underwent MRI and CT scans confirming the diagnosis. MRI confirmed areas of increased signal at the tip of the T1 spinous process, with inflammation in the supraspinous ligament directly at that region (Figure 2). The CT scans confirmed the presence of a bony fragment correlating with the tip of the T1 spinous process (Figure 3).
Surgery was performed under general endotracheal anesthesia via a midline incision over the affected area down to the spinous process. The supraspinous ligament was opened revealing an easily identified and definable ununited ossicle, which was removed without taking down the interspinous ligament. All 3 nonunions were noted to be atrophic with no evidence of surrounding inflammatory tissue or bursa. The residual end of the spinous process was smoothed down with a rongeur. Standard closure was performed. There were no surgical complications.
All patients had complete relief of pain at follow-up; 1 patient returned to full sports activity at 6 weeks and the other 2 returned to full sports activity at 3 months. There was no loss of cervical motion or trapezial strength at follow-up. All patients voiced satisfaction with the decision for surgical intervention.
Discussion
Clay-shoveler’s fracture is an injury well known to orthopedists. This fracture is thought to be caused by a forceful contraction of the thoracic paraspinal and trapezial muscles, causing an avulsion fracture with pain and frequently a “pop” experienced by the patient.1 Usually considered self-limiting injuries, treatment involves a period of rest and activity modification with occasional physical therapy. Return to sports has been reported with occasional pain but with patient satisfaction.3,5,6
Our series of patients represent a group of adolescent athletes who sustained spinous process fractures of the T1 vertebra and, despite a significant period of rest and activity modification, were unable to return to sports given their pain. The examination of these patients revealed focal tenderness at the tip of the spinous process. The diagnosis is made clinically, with radiographic studies confirming the diagnosis. In our series of patients, MRI was the original modality used to confirm injury to the area, with hyperintensity seen in the area of the supraspinous ligament and tip of the spinous process. CT confirmed the nonunion and presence of an ossicle in all patients. Surgical exposure of that area easily exposed the ununited ossicle, which was removed in all patients.
To our knowledge, this is the first report in the literature describing surgical excision of an ununited spinous process fracture in adolescent athletes. The original descriptive case series by Hall1 states “in the minds of surgeons who have seen many of these cases that early operative removal of the fragments is the proper routine treatment.” Since that original series, we have not found articles in the literature that support surgical removal; however, persistent symptoms after fracture are described.5 It is not surprising that these patients developed pain at the site of the fracture given the forces acting in that area. The trapezial and paraspinal muscles acting on that area are forceful and repetitive during activities, especially sports. All our patients had pain with attempts at activity and all had had a significant period of rest. In a recent article, this injury was described in adolescents without the patients having clear relief of symptoms despite a period of inactivity.5 While physical therapy is therapeutic in some patients experiencing pain, it can be a source of aggravation due to neck and shoulder motion and muscle contraction. It is not surprising that therapy would not help in most cases, as neck and shoulder motion and muscle contraction are the sources of continuing discomfort.
Clinical practice suggests that most patients with spinous process fractures will become pain-free; however, that is not universal. This series demonstrates that a small subset of patients with this injury will continue to have significant symptoms despite a period of rest. In those patients who desire a pain-free return to sports, we recommend consideration of surgical excision after confirmation of nonunion with radiographic studies. The inherent risks of surgical treatment are minimal with this procedure, and the benefits include return to pain-free sports activity, with the resultant physical and psychosocial benefits for adolescent athletes.
1. Hall RDM. Clay-shoveler’s fracture. J Bone Joint Surg Am. 1940;22(1):63-75.
2. Herrick RT. Clay-shoveler’s fracture in power-lifting. A case report. Am J Sports Med. 1981;9(1):29-30.
3. Hetsroni I, Mann G, Dolev E, Morgenstern D, Nyska M. Clay shoveler’s fracture in a volleyball player. Phys Sportsmed. 2005;33(7):38-42.
4. Kaloostian PE, Kim JE, Calabresi PA, Bydon A, Witham T. Clay-shoveler’s fracture during indoor rock climbing. Orthopedics. 2013;36(3):e381-e383.
5. Yamaguchi KT Jr, Myung KS, Alonso MA, Skaggs DL. Clay-shoveler’s fracture equivalent in children. Spine. 2012;37(26):e1672-e1675.
6. Kang DH, Lee SH. Multiple spinous process fractures of the thoracic vertebrae (clay-shoveler’s fracture) in a beginning golfer: a case report. Spine. 2009;34(15):e534-e537.
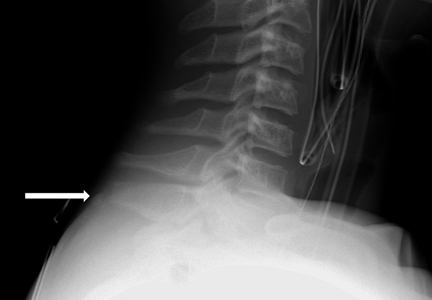
Academic Characteristics of Orthopedic Team Physicians Affiliated With High School, Collegiate, and Professional Teams
The responsibilities of team physicians have increased dramatically since the early 19th century, when these physicians first appeared on the sidelines during football games.1 Although the primary role of the team physician is to care for the athlete, other responsibilities include administrative and legal duties, equipment- and environment-related duties, teaching, and communication with parents, coaches, and other physicians.2-4 These responsibilities differ greatly by the level of the athlete and the team being covered. For example, compared with high school and collegiate sport physicians, physicians caring for professional athletes may have increased interaction with the media.5
Despite the increasing demands and responsibilities of team physicians, it is important that they continue to advance the field of sports medicine through teaching and research.3,6 Team physicians have direct access to athletes at multiple levels of competition, from novice to professional, and therefore have a unique understanding of the injuries that commonly affect these athletes. Efforts to both teach and study the prevention, diagnosis, and treatment of these injuries have dramatically advanced the field of sports medicine. In fact, several advancements in sports medicine have come from team physicians, including advancements in anterior cruciate ligament reconstruction,7,8 shoulder arthroscopy,9 and “Tommy John” surgery,10 to name a few.
Given the important role of team physicians (particularly orthopedic team physicians) in advancing sports medicine, it is important to understand the degree to which team physicians at all levels of sport contribute to teaching and research.
We conducted a study to determine the overall academic involvement of orthopedic team physicians at all levels of sport, including the degree to which these physicians are affiliated with academic medical centers (by level of sport and by professional sport) and the quantity and impact of these physicians’ scientific publications. We hypothesized that orthopedic physician academic involvement would be higher at the professional level of sport than at the collegiate or high school level and that the degree of physician academic involvement would differ between professional sporting leagues.
Materials and Methods
In August 2012, we performed a comprehensive telephone- and Internet-based search to identify a sample of team physicians caring for athletes at the high school, collegiate, and professional levels of sport. Data were collected on all team physicians, regardless of medical specialty. We defined a physician as any person listed as having either a doctor of medicine (MD) or a doctor of osteopathic medicine (DO) degree. A physician listed as a team physician at 2 different levels of competition (high school, college, professional) was included in both cohorts. A physician listed as a team physician in 2 different professional sports leagues was included independently for both leagues. All other medical personnel, including athletic trainers, therapists, and nursing staff, were excluded. Data on our sample population were collected as follows:
1. High school. Performing a comprehensive database search through the US Department of Education, we generated a list of all 20,989 US schools that include grades 9 to 12.11 We then used a random number generator (random.org) to randomly select a sample of 120 high schools. These schools were contacted by telephone and asked to identify the team physician(s) for their sports teams. Twenty of these schools reported not having an athletic team, so we randomly generated a list of 20 additional high schools. High schools that had an athletic team but denied having a team physician were included in the analysis.
2. College. We used the National Collegiate Athletic Association (NCAA) website (ncaa.org) to generate a list of all colleges affiliated with the NCAA. Of these colleges, 347 were Division I, 316 were Division II, and 443 were Division III. The random.org random number generator was used to generate a list of 40 schools for each division, for a total of 120 schools. An Internet-based search was then performed to identify any and all team physicians caring for athletes at that particular school. In select cases, telephone calls were made to determine all the team physicians involved in the care of athletes at that institution.
3. Professional. Team physician data were collected for 4 of the most popular professional sporting leagues12: Major League Baseball (MLB), National Basketball Association (NBA), National Football League (NFL), and National Hockey League (NHL). Each team’s official website was identified through its league website (mlb.com, nba.com, nfl.com, nhl.com), and the roster or directory listing of all team physicians was recorded. In 2 cases, the team’s medical personnel listing could not be retrieved through the Internet, and a telephone call had to be made to identify all team physicians. Team physicians were identified for 122 professional teams: 30 MLB, 30 NBA, 32 NFL, and 30 NHL.
For this study, all physicians were classified as either orthopedic or nonorthopedic. Orthopedic surgeons—the focus of this study—were defined as those who completed residency training in orthopedic surgery. Median number of orthopedic and nonorthopedic surgeons per team was calculated at the high school, collegiate, and professional levels.
After identifying all orthopedic team physicians, we performed additional Internet searches to determine any affiliation between each physician and an applicable academic medical center. Physicians were placed in 1 of 3 different categories based on “level” of academic affiliation. Orthopedists with no identifiable connection to an academic medical center were listed under none. The first 100 search results were studied before this determination was made. Orthopedists with any academic affiliation below the level of full professorship were placed in the category associate/assistant/adjunct professor, which included any physician who was an associate professor, adjunct professor, clinical instructor, or volunteer instructor at an academic medical center. Last, orthopedists listed as full professors were placed in the professor category.
Number of publications written by each orthopedic team physician was then calculated using SciVerse Scopus (scopus.com), a comprehensive abstract and citation database of research literature that offers complete coverage of the Medline and Embase databases.13 Scopus offers a Scopus Author Identifier, which assigns each author in Scopus a unique identification number.14 This number is based on an “algorithm that matches author names based on their affiliation, address, subject area, source title, dates of publication citations, and co-authors.”14 Authors whose names did not appear in Scopus were assumed to have no publications, and this was reported after cross-referencing with Medline to ensure no documents were missed. This study included all publications: original research articles, reviews, letters, and commentaries. Any level of authorship (first, second, etc) was included. All publications were scanned, and duplicate listings were not included. Median number of publications per orthopedic team physician was calculated at the high school, college, and professional levels.
We also determined the h-index for each orthopedic team physician. The h-index is used to measure the impact of the published work of a scholar: “A scientist has index h if h of his/her papers have at least h citations each, and the other papers have no more than h citations each.”15 For example, an h-index of 12 means that, out of an author’s total number of publications, 12 have been cited at least 12 times, and all of his or her other publications have been cited fewer than 12 times. All authors in Scopus are automatically assigned h-indexes, and we collected these numbers.16 Of note, citations for articles published before 1996 are not included in the h-index calculation. Median h-index score per orthopedic team physician was calculated at the high school, college, and professional levels.
Analysis of variance was used to compare continuous data (eg, number of publications per surgeon) across different groups (eg, physicians from respective sports). Chi-square tests were used to detect whole-number differences between groups (eg, difference in number of physicians per team across the various professional sports leagues). Statistical significance was set at P < .05.
Results
We identified 1054 team physicians among the 362 total high schools, colleges, and professional sports teams included in this study. Of the 1054 physicians, 678 (64%) were orthopedic surgeons (Table 1). Seventy-two (60%) of the 120 high schools did not have a team physician, whereas all the colleges and professional teams did. Number of orthopedic surgeons per team was higher at the collegiate level (2.29; range, 0-11) and professional level (2.21; range, 1-9) than at the high school level (1.11; range, 0-24) (Table 1). Median number of nonorthopedic surgeons was highest in professional sports (1.88; range, 0-9) followed by college sports (1.06; range, 0-9) and high school sports (0.16; range, 0-2) (Table 1).
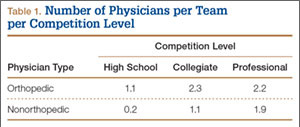
Of the 678 orthopedic team physicians, 298 (44%) were officially affiliated with an academic medical center, either as clinical instructor, associate/adjunct professor, or full professor. Percentage of orthopedists affiliated with an academic medical center was highest in professional sports (173/270, 64%) followed by collegiate sports (98/275, 36%) and high school sports (27/133, 20%) (P < .001, Table 2). Percentage of orthopedists identified as full professors was highest at the professional level (42/270, 16%) followed by the collegiate level (14/275, 5.1%) and the high school level (3/133, 2.3%) (P < .001, Table 2).
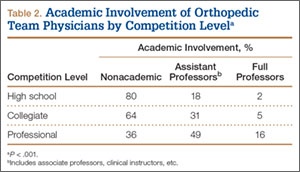
We found 12,036 publications written by the 678 orthopedic team physicians included in this study. Median number of publications per orthopedist was significantly higher in professional sports (30.6; range, 0-460) than in collegiate sports (10.7; range, 0-581) and high school sports (6.0; range, 0-220) (P < .001). Number of authors with more than 25 publications was highest at the professional level (82) followed by the collegiate level (27) and the high school level (7) (Table 3). Median number of publications per orthopedist was also higher at the professional level (12) than at the collegiate level (2) and high school level (1). Median h-index was higher among orthopedists in professional sports (7.1; range, 0-50) than at colleges (2.7; range, 0-63) and high schools (1.8; range, 0-32) (P < .001). Median h-index was also significantly higher at the professional level (5) than at the collegiate level (1) and high school level (0).
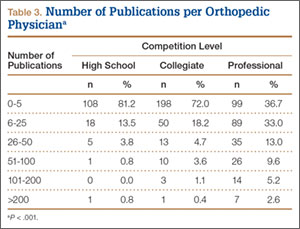
At the professional level of sports, we identified 499 team physicians (270 orthopedic, 54%; 229 nonorthopedic, 46%). Median number of orthopedic team physicians varied by sport, with MLB (2.8; range, 1-8) and the NFL (2.4; range, 1-4) having relatively more of these physicians than the NHL (2.0; range, 1-6) and the NBA (1.7; range, 1-9) (Table 4). Percentage of orthopedic team physicians affiliated with academic medical centers was highest in MLB (58/83, 69.9%) followed by the NFL (47/76, 61.8%), the NHL (37/60, 61.7%), and the NBA (31/51, 60.8%) (Table 5). Median number of publications by orthopedists also varied by sport, with the highest number in MLB (37.9; range, 0-225) followed by the NBA (32.0; range, 0-227) and the NFL (30.4; range, 0-460), with the lowest number in the NHL (20.7; range, 0-144) (Table 6). Median number of publications was the same (17.5) in MLB and the NFL and lower in the NBA (11) and the NHL (7.5). Median h-index was highest in the NFL (8.2; range, 0-50) and MLB (7.9; range, 0-32) followed by the NBA (6.6; range, 0-35) and the NHL (4.9; range, 0-20) (Table 7) Median h-index was the same (6) in MLB and the NFL and lower (3) in the NBA and the NHL.
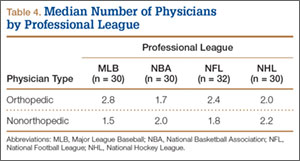
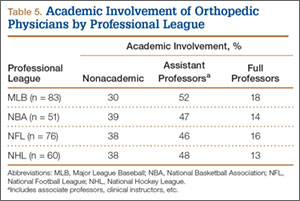
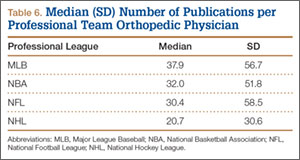
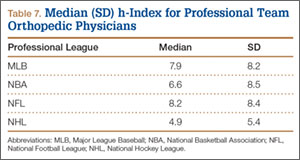
Discussion
To our knowledge, this is the first study of academic involvement and the research activities of orthopedic team physicians at the high school, college, and professional levels of sport. We found that, on average, there were almost twice as many orthopedists at the collegiate and professional levels than at the high school level—likely because 72 of the 120 high schools randomly selected did not have a team physician, despite having sports teams. We can attribute this to the organizational structure of teams in a high school setting, where it is fairly common that no medically educated health care provider is readily available for the student athletes.5 Although the median number of orthopedists was similar at the collegiate and professional levels, the number of nonorthopedic team physicians was higher at the professional level than at the collegiate level. Although most collegiate and professional teams have an internist and an orthopedist on staff, medical staff at the professional level may also include several subspecialists from a variety of medical fields (eg, dental medicine, ophthalmology, neurology).17
We found that a significantly larger proportion of orthopedists at the professional level (64%) were affiliated with academic medical centers as associate/adjunct professors and full professors compared with orthopedists at the collegiate level (36%) and high school level (20%). The academic relationship with collegiate teams was much lower than expected. Regarding professional sports, however, this finding confirmed our hypothesis, and the explanation is likely multifactorial and historical. Moreover, the median number of publications was higher for orthopedists at the professional level (30.8) than at the collegiate level (10.7) and high school level (6). In the late 1940s and early 1950s, many orthopedic team physicians entered into contracts with major universities.4 For many physicians, this contractual relationship increased their prestige, and some orthopedic groups were alleged to have endorsed scholarships at those schools.4 Given the high level of publicity and scrutiny surrounding medical decisions at the professional level of sports, it is possible that professional sports teams specifically seek orthopedists who are well respected within academia. Moreover, contracts between universities/academic medical centers and professional teams may mandate that a faculty member from that organization provide the orthopedic/medical care for the team. This may also increase the likelihood of professional teams being paired with academic orthopedic physicians. However, such contractual agreements are made between professional teams and large private medical groups as well.
In addition to measuring quantity of publications, we used the h-index to measure their quality. Following the same pattern as the publication rate, median h-index per orthopedic team physician was significantly higher at the professional level (7.1) than at the collegiate level (2.7) and high school level (1.8). As with publication volume, this is not entirely surprising, as h-index has been shown to correlate with academic rank in other surgical specialties,18 and there was a higher percentage of academic physicians at the professional level than at the collegiate and high school levels.
At the professional level of sports, 56% of all team physicians were orthopedic surgeons. Orthopedists caring for MLB teams had the highest median number of publications (37.9), followed by the NBA (32.0), the NFL (30.4), and the NHL (20.7). One likely explanation is the higher percentage of MLB physicians affiliated with academic medical centers. Regarding the h-index, MLB and NFL physicians had the highest values (7.9 and 8.2, respectively).
Our study had several limitations. First, we may not have captured data on all the team physicians at the high school, college, and professional levels. By following a detailed protocol in identifying surgeons, however, we tried to minimize the impact of any such omissions. In addition, teams may have had many unofficial consultants acting as team physicians, whether orthopedic or nonorthopedic, and, if these physicians were not listed in an official capacity, they may have been omitted from this study. We further realize that a true measure of academic productivity should also include book chapters and books published, research grants awarded, and patents registered. By including only peer-reviewed articles, we omitted these other criteria.
To our knowledge, the data presented here represent the first attempt to quantify the academic involvement and research productivity of orthopedic team physicians at the high school, college, and professional levels of sport. These data help us understand how research productivity varies by orthopedic team physicians at different levels of sport and may be useful to those considering a career as a team physician, as they can better evaluate their own productivity in the context of team physicians across different levels of competition.
1. Thorndike A. Athletic Injuries: Prevention, Diagnosis, and Treatment. Philadelphia, PA: Lea & Febiger; 1956.
2. The team physician. A statement of the Committee on the Medical Aspects of Sports of the American Medical Association, September 1967. J School Health. 1967;37(10):510-514.
3. Team physician consensus statement. Am J Sports Med. 2000;28(3):440-441.
4. Whiteside J, Andrews JR. Trends for the future as a team physician: Herodicus to hereafter. Clin Sports Med. 2007;26(2):285-304.
5. Goforth M, Almquist J, Matney M, et al. Understanding organization structures of the college, university, high school, clinical, and professional settings. Clin Sports Med. 2007;26(2):201-226.
6. Hughston JC. Want to be in sports medicine? Get involved. Am J Sports Med. 1979;7(2):79-80.
7. Marshall JL, Warren RF, Wickiewicz TL, Reider B. The anterior cruciate ligament: a technique of repair and reconstruction. Clin Orthop Relat Res. 1979;(143):97-106.
8. Clancy WG Jr, Nelson DA, Reider B, Narechania RG. Anterior cruciate ligament reconstruction using one-third of the patellar ligament, augmented by extra-articular tendon transfers. J Bone Joint Surg Am. 1982;64(3):352-359.
9. Andrews JR, Carson WG Jr, McLeod WD. Glenoid labrum tears related to the long head of the biceps. Am J Sports Med. 1985;13(5):337-341.
10. Indelicato PA, Jobe FW, Kerlan RK, Carter VS, Shields CL, Lombardo SJ. Correctable elbow lesions in professional baseball players: a review of 25 cases. Am J Sports Med. 1979;7(1):72-75.
11. Elementary/Secondary Information System (EISi). National Center for Education Statistics, Institute of Education Sciences, US Department of Education website. http://nces.ed.gov/ccd/elsi/. Accessed September 21, 2015.
12. Corso RA; Harris Interactive. Football is America’s favorite sport as lead over baseball continues to grow; college football and auto racing come next. Harris Interactive website. http://www.harrisinteractive.com/vault/Harris Poll 9 - Favorite sport_1.25.12.pdf. Harris Poll 9, January 25, 2012. Accessed September 21, 2015.
13. [Scopus content]. Elsevier website. http://www.elsevier.com/solutions/scopus/content. Accessed September 21, 2015.
14. Scopus Author Identifier. Scopus website. http://help.scopus.com/Content/h_autsrch_intro.htm. Accessed October 5, 2015.
15. Hirsch JE. An index to quantify an individual’s scientific research output. Proc Natl Acad Sci U S A. 2005;102(46):16569-16572.
16. Author Evaluator h Index Tab. Scopus website. http://help.scopus.com/Content/h_auteval_hindex.htm. Accessed October 5, 2015.
17. Boyd JL. Understanding the politics of being a team physician. Clin Sports Med. 2007;26(2):161-172.
18. Lee J, Kraus KL, Couldwell WT. Use of the h index in neurosurgery. Clinical article. J Neurosurg. 2009;111(2):387-
The responsibilities of team physicians have increased dramatically since the early 19th century, when these physicians first appeared on the sidelines during football games.1 Although the primary role of the team physician is to care for the athlete, other responsibilities include administrative and legal duties, equipment- and environment-related duties, teaching, and communication with parents, coaches, and other physicians.2-4 These responsibilities differ greatly by the level of the athlete and the team being covered. For example, compared with high school and collegiate sport physicians, physicians caring for professional athletes may have increased interaction with the media.5
Despite the increasing demands and responsibilities of team physicians, it is important that they continue to advance the field of sports medicine through teaching and research.3,6 Team physicians have direct access to athletes at multiple levels of competition, from novice to professional, and therefore have a unique understanding of the injuries that commonly affect these athletes. Efforts to both teach and study the prevention, diagnosis, and treatment of these injuries have dramatically advanced the field of sports medicine. In fact, several advancements in sports medicine have come from team physicians, including advancements in anterior cruciate ligament reconstruction,7,8 shoulder arthroscopy,9 and “Tommy John” surgery,10 to name a few.
Given the important role of team physicians (particularly orthopedic team physicians) in advancing sports medicine, it is important to understand the degree to which team physicians at all levels of sport contribute to teaching and research.
We conducted a study to determine the overall academic involvement of orthopedic team physicians at all levels of sport, including the degree to which these physicians are affiliated with academic medical centers (by level of sport and by professional sport) and the quantity and impact of these physicians’ scientific publications. We hypothesized that orthopedic physician academic involvement would be higher at the professional level of sport than at the collegiate or high school level and that the degree of physician academic involvement would differ between professional sporting leagues.
Materials and Methods
In August 2012, we performed a comprehensive telephone- and Internet-based search to identify a sample of team physicians caring for athletes at the high school, collegiate, and professional levels of sport. Data were collected on all team physicians, regardless of medical specialty. We defined a physician as any person listed as having either a doctor of medicine (MD) or a doctor of osteopathic medicine (DO) degree. A physician listed as a team physician at 2 different levels of competition (high school, college, professional) was included in both cohorts. A physician listed as a team physician in 2 different professional sports leagues was included independently for both leagues. All other medical personnel, including athletic trainers, therapists, and nursing staff, were excluded. Data on our sample population were collected as follows:
1. High school. Performing a comprehensive database search through the US Department of Education, we generated a list of all 20,989 US schools that include grades 9 to 12.11 We then used a random number generator (random.org) to randomly select a sample of 120 high schools. These schools were contacted by telephone and asked to identify the team physician(s) for their sports teams. Twenty of these schools reported not having an athletic team, so we randomly generated a list of 20 additional high schools. High schools that had an athletic team but denied having a team physician were included in the analysis.
2. College. We used the National Collegiate Athletic Association (NCAA) website (ncaa.org) to generate a list of all colleges affiliated with the NCAA. Of these colleges, 347 were Division I, 316 were Division II, and 443 were Division III. The random.org random number generator was used to generate a list of 40 schools for each division, for a total of 120 schools. An Internet-based search was then performed to identify any and all team physicians caring for athletes at that particular school. In select cases, telephone calls were made to determine all the team physicians involved in the care of athletes at that institution.
3. Professional. Team physician data were collected for 4 of the most popular professional sporting leagues12: Major League Baseball (MLB), National Basketball Association (NBA), National Football League (NFL), and National Hockey League (NHL). Each team’s official website was identified through its league website (mlb.com, nba.com, nfl.com, nhl.com), and the roster or directory listing of all team physicians was recorded. In 2 cases, the team’s medical personnel listing could not be retrieved through the Internet, and a telephone call had to be made to identify all team physicians. Team physicians were identified for 122 professional teams: 30 MLB, 30 NBA, 32 NFL, and 30 NHL.
For this study, all physicians were classified as either orthopedic or nonorthopedic. Orthopedic surgeons—the focus of this study—were defined as those who completed residency training in orthopedic surgery. Median number of orthopedic and nonorthopedic surgeons per team was calculated at the high school, collegiate, and professional levels.
After identifying all orthopedic team physicians, we performed additional Internet searches to determine any affiliation between each physician and an applicable academic medical center. Physicians were placed in 1 of 3 different categories based on “level” of academic affiliation. Orthopedists with no identifiable connection to an academic medical center were listed under none. The first 100 search results were studied before this determination was made. Orthopedists with any academic affiliation below the level of full professorship were placed in the category associate/assistant/adjunct professor, which included any physician who was an associate professor, adjunct professor, clinical instructor, or volunteer instructor at an academic medical center. Last, orthopedists listed as full professors were placed in the professor category.
Number of publications written by each orthopedic team physician was then calculated using SciVerse Scopus (scopus.com), a comprehensive abstract and citation database of research literature that offers complete coverage of the Medline and Embase databases.13 Scopus offers a Scopus Author Identifier, which assigns each author in Scopus a unique identification number.14 This number is based on an “algorithm that matches author names based on their affiliation, address, subject area, source title, dates of publication citations, and co-authors.”14 Authors whose names did not appear in Scopus were assumed to have no publications, and this was reported after cross-referencing with Medline to ensure no documents were missed. This study included all publications: original research articles, reviews, letters, and commentaries. Any level of authorship (first, second, etc) was included. All publications were scanned, and duplicate listings were not included. Median number of publications per orthopedic team physician was calculated at the high school, college, and professional levels.
We also determined the h-index for each orthopedic team physician. The h-index is used to measure the impact of the published work of a scholar: “A scientist has index h if h of his/her papers have at least h citations each, and the other papers have no more than h citations each.”15 For example, an h-index of 12 means that, out of an author’s total number of publications, 12 have been cited at least 12 times, and all of his or her other publications have been cited fewer than 12 times. All authors in Scopus are automatically assigned h-indexes, and we collected these numbers.16 Of note, citations for articles published before 1996 are not included in the h-index calculation. Median h-index score per orthopedic team physician was calculated at the high school, college, and professional levels.
Analysis of variance was used to compare continuous data (eg, number of publications per surgeon) across different groups (eg, physicians from respective sports). Chi-square tests were used to detect whole-number differences between groups (eg, difference in number of physicians per team across the various professional sports leagues). Statistical significance was set at P < .05.
Results
We identified 1054 team physicians among the 362 total high schools, colleges, and professional sports teams included in this study. Of the 1054 physicians, 678 (64%) were orthopedic surgeons (Table 1). Seventy-two (60%) of the 120 high schools did not have a team physician, whereas all the colleges and professional teams did. Number of orthopedic surgeons per team was higher at the collegiate level (2.29; range, 0-11) and professional level (2.21; range, 1-9) than at the high school level (1.11; range, 0-24) (Table 1). Median number of nonorthopedic surgeons was highest in professional sports (1.88; range, 0-9) followed by college sports (1.06; range, 0-9) and high school sports (0.16; range, 0-2) (Table 1).
Of the 678 orthopedic team physicians, 298 (44%) were officially affiliated with an academic medical center, either as clinical instructor, associate/adjunct professor, or full professor. Percentage of orthopedists affiliated with an academic medical center was highest in professional sports (173/270, 64%) followed by collegiate sports (98/275, 36%) and high school sports (27/133, 20%) (P < .001, Table 2). Percentage of orthopedists identified as full professors was highest at the professional level (42/270, 16%) followed by the collegiate level (14/275, 5.1%) and the high school level (3/133, 2.3%) (P < .001, Table 2).
We found 12,036 publications written by the 678 orthopedic team physicians included in this study. Median number of publications per orthopedist was significantly higher in professional sports (30.6; range, 0-460) than in collegiate sports (10.7; range, 0-581) and high school sports (6.0; range, 0-220) (P < .001). Number of authors with more than 25 publications was highest at the professional level (82) followed by the collegiate level (27) and the high school level (7) (Table 3). Median number of publications per orthopedist was also higher at the professional level (12) than at the collegiate level (2) and high school level (1). Median h-index was higher among orthopedists in professional sports (7.1; range, 0-50) than at colleges (2.7; range, 0-63) and high schools (1.8; range, 0-32) (P < .001). Median h-index was also significantly higher at the professional level (5) than at the collegiate level (1) and high school level (0).
At the professional level of sports, we identified 499 team physicians (270 orthopedic, 54%; 229 nonorthopedic, 46%). Median number of orthopedic team physicians varied by sport, with MLB (2.8; range, 1-8) and the NFL (2.4; range, 1-4) having relatively more of these physicians than the NHL (2.0; range, 1-6) and the NBA (1.7; range, 1-9) (Table 4). Percentage of orthopedic team physicians affiliated with academic medical centers was highest in MLB (58/83, 69.9%) followed by the NFL (47/76, 61.8%), the NHL (37/60, 61.7%), and the NBA (31/51, 60.8%) (Table 5). Median number of publications by orthopedists also varied by sport, with the highest number in MLB (37.9; range, 0-225) followed by the NBA (32.0; range, 0-227) and the NFL (30.4; range, 0-460), with the lowest number in the NHL (20.7; range, 0-144) (Table 6). Median number of publications was the same (17.5) in MLB and the NFL and lower in the NBA (11) and the NHL (7.5). Median h-index was highest in the NFL (8.2; range, 0-50) and MLB (7.9; range, 0-32) followed by the NBA (6.6; range, 0-35) and the NHL (4.9; range, 0-20) (Table 7) Median h-index was the same (6) in MLB and the NFL and lower (3) in the NBA and the NHL.
Discussion
To our knowledge, this is the first study of academic involvement and the research activities of orthopedic team physicians at the high school, college, and professional levels of sport. We found that, on average, there were almost twice as many orthopedists at the collegiate and professional levels than at the high school level—likely because 72 of the 120 high schools randomly selected did not have a team physician, despite having sports teams. We can attribute this to the organizational structure of teams in a high school setting, where it is fairly common that no medically educated health care provider is readily available for the student athletes.5 Although the median number of orthopedists was similar at the collegiate and professional levels, the number of nonorthopedic team physicians was higher at the professional level than at the collegiate level. Although most collegiate and professional teams have an internist and an orthopedist on staff, medical staff at the professional level may also include several subspecialists from a variety of medical fields (eg, dental medicine, ophthalmology, neurology).17
We found that a significantly larger proportion of orthopedists at the professional level (64%) were affiliated with academic medical centers as associate/adjunct professors and full professors compared with orthopedists at the collegiate level (36%) and high school level (20%). The academic relationship with collegiate teams was much lower than expected. Regarding professional sports, however, this finding confirmed our hypothesis, and the explanation is likely multifactorial and historical. Moreover, the median number of publications was higher for orthopedists at the professional level (30.8) than at the collegiate level (10.7) and high school level (6). In the late 1940s and early 1950s, many orthopedic team physicians entered into contracts with major universities.4 For many physicians, this contractual relationship increased their prestige, and some orthopedic groups were alleged to have endorsed scholarships at those schools.4 Given the high level of publicity and scrutiny surrounding medical decisions at the professional level of sports, it is possible that professional sports teams specifically seek orthopedists who are well respected within academia. Moreover, contracts between universities/academic medical centers and professional teams may mandate that a faculty member from that organization provide the orthopedic/medical care for the team. This may also increase the likelihood of professional teams being paired with academic orthopedic physicians. However, such contractual agreements are made between professional teams and large private medical groups as well.
In addition to measuring quantity of publications, we used the h-index to measure their quality. Following the same pattern as the publication rate, median h-index per orthopedic team physician was significantly higher at the professional level (7.1) than at the collegiate level (2.7) and high school level (1.8). As with publication volume, this is not entirely surprising, as h-index has been shown to correlate with academic rank in other surgical specialties,18 and there was a higher percentage of academic physicians at the professional level than at the collegiate and high school levels.
At the professional level of sports, 56% of all team physicians were orthopedic surgeons. Orthopedists caring for MLB teams had the highest median number of publications (37.9), followed by the NBA (32.0), the NFL (30.4), and the NHL (20.7). One likely explanation is the higher percentage of MLB physicians affiliated with academic medical centers. Regarding the h-index, MLB and NFL physicians had the highest values (7.9 and 8.2, respectively).
Our study had several limitations. First, we may not have captured data on all the team physicians at the high school, college, and professional levels. By following a detailed protocol in identifying surgeons, however, we tried to minimize the impact of any such omissions. In addition, teams may have had many unofficial consultants acting as team physicians, whether orthopedic or nonorthopedic, and, if these physicians were not listed in an official capacity, they may have been omitted from this study. We further realize that a true measure of academic productivity should also include book chapters and books published, research grants awarded, and patents registered. By including only peer-reviewed articles, we omitted these other criteria.
To our knowledge, the data presented here represent the first attempt to quantify the academic involvement and research productivity of orthopedic team physicians at the high school, college, and professional levels of sport. These data help us understand how research productivity varies by orthopedic team physicians at different levels of sport and may be useful to those considering a career as a team physician, as they can better evaluate their own productivity in the context of team physicians across different levels of competition.
1. Thorndike A. Athletic Injuries: Prevention, Diagnosis, and Treatment. Philadelphia, PA: Lea & Febiger; 1956.
2. The team physician. A statement of the Committee on the Medical Aspects of Sports of the American Medical Association, September 1967. J School Health. 1967;37(10):510-514.
3. Team physician consensus statement. Am J Sports Med. 2000;28(3):440-441.
4. Whiteside J, Andrews JR. Trends for the future as a team physician: Herodicus to hereafter. Clin Sports Med. 2007;26(2):285-304.
5. Goforth M, Almquist J, Matney M, et al. Understanding organization structures of the college, university, high school, clinical, and professional settings. Clin Sports Med. 2007;26(2):201-226.
6. Hughston JC. Want to be in sports medicine? Get involved. Am J Sports Med. 1979;7(2):79-80.
7. Marshall JL, Warren RF, Wickiewicz TL, Reider B. The anterior cruciate ligament: a technique of repair and reconstruction. Clin Orthop Relat Res. 1979;(143):97-106.
8. Clancy WG Jr, Nelson DA, Reider B, Narechania RG. Anterior cruciate ligament reconstruction using one-third of the patellar ligament, augmented by extra-articular tendon transfers. J Bone Joint Surg Am. 1982;64(3):352-359.
9. Andrews JR, Carson WG Jr, McLeod WD. Glenoid labrum tears related to the long head of the biceps. Am J Sports Med. 1985;13(5):337-341.
10. Indelicato PA, Jobe FW, Kerlan RK, Carter VS, Shields CL, Lombardo SJ. Correctable elbow lesions in professional baseball players: a review of 25 cases. Am J Sports Med. 1979;7(1):72-75.
11. Elementary/Secondary Information System (EISi). National Center for Education Statistics, Institute of Education Sciences, US Department of Education website. http://nces.ed.gov/ccd/elsi/. Accessed September 21, 2015.
12. Corso RA; Harris Interactive. Football is America’s favorite sport as lead over baseball continues to grow; college football and auto racing come next. Harris Interactive website. http://www.harrisinteractive.com/vault/Harris Poll 9 - Favorite sport_1.25.12.pdf. Harris Poll 9, January 25, 2012. Accessed September 21, 2015.
13. [Scopus content]. Elsevier website. http://www.elsevier.com/solutions/scopus/content. Accessed September 21, 2015.
14. Scopus Author Identifier. Scopus website. http://help.scopus.com/Content/h_autsrch_intro.htm. Accessed October 5, 2015.
15. Hirsch JE. An index to quantify an individual’s scientific research output. Proc Natl Acad Sci U S A. 2005;102(46):16569-16572.
16. Author Evaluator h Index Tab. Scopus website. http://help.scopus.com/Content/h_auteval_hindex.htm. Accessed October 5, 2015.
17. Boyd JL. Understanding the politics of being a team physician. Clin Sports Med. 2007;26(2):161-172.
18. Lee J, Kraus KL, Couldwell WT. Use of the h index in neurosurgery. Clinical article. J Neurosurg. 2009;111(2):387-
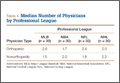
Conflict of Interest in Sports Medicine: Does It Affect Our Judgment?
As defined by the American Academy of Orthopaedic Surgeons (AAOS) in 1996, conflict of interest (COI) is the “circumstance that exists when, because of personal financial gain, an individual has the potential to be less than objective when called on to reach a judgment or interpret a result.”1 In medical research, COIs often occur in relationships between physician-researchers and pharmaceutical, medical device, and biotechnology companies. These relationships usually take the form of research grants but can also arise when the researcher has a financial interest in the product being tested or in the company that manufactures the product.
Although constructive collaboration between academic medicine and industry has worked to improve health care and ultimately benefit patients, potential drawbacks of such relationships include sequestration and suppression of results that may be disadvantageous to the industry sponsor,2 increased likelihood of reporting positive results (pro-industry),3-7 and biased study designs.8 The nature of such relationships may threaten the integrity of scientific studies, the objectivity of medical education, the quality of patient care, and the public’s trust in medicine.9
Financial relationships and affiliations are increasing as we seek to answer a growing number of clinical questions—with funding often being a limiting factor. At national scientific meetings, the number of presentations reporting COIs reflects this trend. Paper and poster presentations accepted for annual meetings of the Orthopaedic Trauma Association (OTA) and reporting a COI increased from 7.6% in 1993 to 12.6% in 2002 (P = .0129).2
Medical subspecialties outside of orthopedics are experiencing similar trends. Most notable is the American Psychiatric Association (APA). After the APA published a mandatory financial COI disclosure policy in the Diagnostic and Statistical Manual of Mental Disorders, Fifth Edition (DSM-5), the percentage of task force members reporting industry relationships increased by 12%.10 Analysis of the DSM-5 panels demonstrated that the panels with the largest percentage of reported COIs are those for which pharmacological treatment is the first-line intervention, including the panels for mood disorders (67%), psychotic disorders (83%) and sleep/wake disorders (100%).10 Moreover, the industry ties reported are to the pharmaceutical companies that manufacture the medications used to treat these disorders or to companies that service the pharmaceutical industry.10
The degree to which financial COIs affect the interpretation of the orthopedic literature has never been quantified. Although it is clear that COIs can confound the results and reporting of data, how the medical community uses disclosures when interpreting the literature and when formulating opinions that may or may not affect their practice patterns is largely unknown.
We conducted a study to evaluate how a hypothetical financial COI disclosure would influence the interpretation of data by orthopedic clinicians. We also wanted to determine the reliability of the data as perceived in association with different study designs, levels of evidence, research institutional settings, and reporting of positive or negative results.
Methods
We asked members of the Arthroscopy Association of North America (AANA) and the American Orthopaedic Society for Sports Medicine (AOSSM) to complete a multiple-choice situational questionnaire (Table). The questionnaire assesses the degree to which respondents use COI disclosures when interpreting the literature. It further explores the perceived clinical value of a study with a given reported COI, assuming variations in study design, research institutional setting, and significance of results. The fictional research team disclosed the project was funded by a pharmaceutical company and all team members received consulting compensation. The survey and study were reviewed and approved by our institutional review board. The survey consisted of 14 multiple-choice questions that allowed for only 1 answer selection per person and allowed survey takers to skip questions they did not wish to answer. The survey questions and associated response options appear in edited form in the Table. A link to the questionnaire (https://www.surveymonkey.com/s/MPCCLCX) was sent with a message explaining the study. The responses to the questionnaire constituted the data.
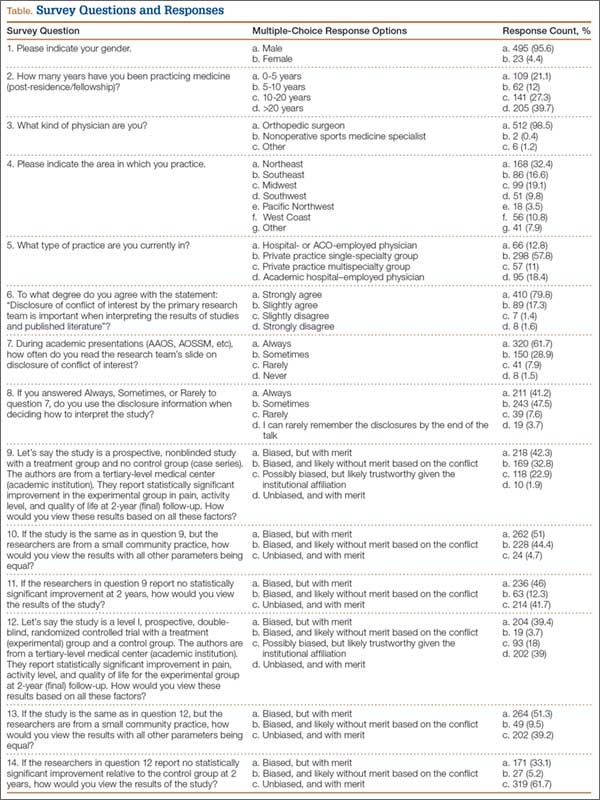
Results
We sent a request to participate in the survey to 750 physicians and received 522 responses (overall response rate, 70%). The response rate for each question equaled or exceeded 98%.
The majority of respondents (95.6%) were male. Ninety-nine percent of respondents were orthopedic surgeons. The Northeast (US) was the most common geographical practice location of respondents (32%), followed by the Midwest (19.1%) and the Southeast (16.6%). Most respondents (40%) had been in practice for more than 20 years; 67% had been in practice a minimum of 10 years. The majority (68.8%) were employed by private practice groups, either single specialty (57.8%) or multispecialty (11%).
Eighty percent of respondents strongly agreed that COI disclosure is important when interpreting study results, 62% reported always reading the disclosure slide during academy or other meeting presentations, and 41% reported always using this information when deciding how to interpret scientific data.
Seventy-five percent of respondents thought the study—an academic-center case series with significant results in favor of the pharmaceutical company funding the study—was biased (42% indicated biased with merit, 33% biased without merit). Twenty-three percent thought the study was possibly biased, but likely trustworthy given the academic institutional affiliation. When the study setting was changed to community hospital, 95% thought the study was biased (51% biased with merit, 44% biased without merit). With the same study performed at an academic center, and no statistically significant results (not in favor of the pharmaceutical company funding the study), 88% thought the study had merit (46% biased with merit, 42% unbiased with merit).
When the study design was changed to a randomized controlled trial (level I evidence) conducted at an academic center with negative results, an overwhelming 95% of respondents thought the study had merit (33% biased with merit, 62% unbiased with merit). Given the same study design at an academic center, with positive results, 78% still thought the study had merit (39% biased with merit, 39% unbiased with merit). An additional 18% thought the study was biased, but still likely trustworthy given the academic institutional affiliation. Finally, given a randomized controlled trial and positive results, but with the research setting a small community practice, 90% thought the study had merit (51% biased with merit, 39% unbiased with merit). The percentage of respondents who found the study biased and likely without merit increased from 3.7% to 9.5% when the institutional affiliation changed from academic to community.
Discussion
As governmental funding sources become increasingly limited, the role of industry sponsorship of orthopedic research has grown. Potential drawbacks and biases of such research support have been well described—most notably, increased positive result reporting, suppression of results that may be disadvantageous to the industry sponsor, and biased study designs.2-8 However, the extent to which financial COIs affect the orthopedic medical community’s interpretation of the literature has never been quantified. To our knowledge, the present study is the first to quantify the impact of reported COI on study interpretation.
Our goal was to examine how reported financial COIs influence the interpretation of the literature by the orthopedic medical community. Moreover, we wanted to determine the perceived reliability of the data when variables (study design, institutional affiliation, positive vs negative results) were changed. The results of our survey indicate that, when a financial COI is reported, study reliability is perceived as highest when negative results were found.
Our survey noted a discrepancy between the documented importance of the hypothetical research team’s COI disclosure and the use of such disclosures when interpreting study results. Eighty percent of respondents agreed that COI disclosure is important when interpreting study results, but only 62% reported always reading disclosures, and even fewer (41%) reported always using the information when interpreting results. It is unclear exactly why this trend exists, as one would expect the percentages to be more similar. These particular survey questions were formed around using COI disclosures when interpreting study results during academic presentations at national meetings and not during the review of published literature. It is possible that positioning the COI disclosure at the beginning of a presentation has an effect, but only 3.7% of respondents indicated they seldom remembered the disclosure by the end of the presentation. The results of our survey may have varied if the questions had targeted reading and interpreting the literature.
Interestingly, the results of these survey questions tended to be more consistent with rates of reported financial COI by presenters at national orthopedic meetings. A study published in the New England Journal of Medicine found that less than 80% of orthopedic surgeons reported their disclosures at a large annual meeting (AAOS), even when the disclosure involved payments pertinent to the research they were presenting.5 When the payments were indirectly related to the research, the percentage of surgeons reporting disclosures was 50%, almost the same as the disclosure rate for unrelated payments.5
When the study was changed to a level I randomized controlled trial, more survey respondents found it to be less biased and have more merit. Although it would seem intuitive for a study with a higher level of evidence to carry more clinical value during interpretation, this may not hold true in the setting of industry-sponsored clinical trials. Several studies have documented a significant association between the reporting of positive results and industry-sponsored randomized clinical trials. In 2008, Khan and colleagues3 examined 100 orthopedic randomized clinical trials reported in 5 major orthopedic subspecialty journals over a 2-year period. The association between industry funding and favorable outcome in all original randomized clinical trials was strong and significant (P < .001). This is not surprising, given the amount of time and money required for a well-designed clinical study. Commercial products with preclinical promise are pushed to testing in a clinical trial, whereas resources would not be wasted on products lacking preclinical merit.
The most important variable affecting interpretation of study merit by survey respondents was the reporting of negative results. As more researchers are developing COIs, many studies are discovering a relationship between COIs and outcomes of research studies. Reviewing the adult total joint literature, Ezzet8 found an industry funding rate of 50%. Positive results were reported in 93% of cases in commercially funded studies versus 37% of cases in independently funded studies. Furthermore, no negative results were reported by investigators who were receiving royalties from the respective companies.
Studies across the medical literature have also found this association between industry sponsorship and reporting of positive results. One such study, reported by Valachis and colleagues7 in the Journal of Clinical Oncology, examined more than 80 economic analyses of targeted oncologic therapies and found the studies funded by pharmaceutical companies were more likely to report favorable qualitative cost estimates. In addition, when studies with a COI disclosure were examined, those reporting any financial relationship with a manufacturer (eg, author affiliation, funding) were more likely than those without such a relationship to report favorable results.
Our study had several limitations. First, as most of the survey respondents were orthopedic surgeons, extrapolating their data to the medical community at large may not be appropriate, as each specialty may view industry affiliations differently. In addition, respondents were asked to base their interpretations of a study on conclusions we predetermined—no direct visualization of the data set or statistical testing methods. It is possible that these responses may have been different had the respondents had the opportunity to further evaluate the study in question. In a recent study, Altwairgi and colleagues11 found that 10% of randomized clinical trials involving lung cancer treatment were reported with different conclusions in their full manuscripts relative to their abstracts. We think our survey design perhaps best mimics an annual meeting environment in which participants have very limited ability to interpret studies and may rely more heavily on the factors we investigated—study design, significance of findings, and setting, all similar to information presented in an abstract—when making informed decisions. Although our response rate was only 70%, this is comparable to or better than the rates in similar survey studies that used email-based questionnaires.12,13
Another limitation was that our survey may have forced respondents into answers they did not entirely agree with, given the limited options of the multiple-choice response format and the specific wording of the questions. Our conclusions may have been more dramatic when we were evaluating whether the study was deemed meritorious or not. However, there is no adopted standard for evaluating the extent of bias perceived by a clinician. We thought it was important to include answer options indicating a study had merit despite obvious bias in design and execution. That a study had merit can mean different things. It may change clinical practice, may require further study and reproducibility, or may not be significant enough to matter. Asking follow-up questions to evaluate this perception among the respondents could have provided validity to the term merit. Further studies in this field are needed to determine how studies are interpreted and translated into clinical practice by various clinicians.
Conclusion
Although the present study is not a quantitative analysis of the determination of bias in the orthopedic community, it is the first to evaluate orthopedic surgeons’ perceptions on the basis of key fundamentals of orthopedic research relative to COI. It is clear from our study results that introducing levels of evidence to the orthopedic milieu has had a significant impact both on the quality of research and on the foundational use of deductive reasoning when interpreting the literature. Reporting negative outcomes is perhaps the most important factor in eliminating the perception of bias among orthopedic surgeons. To what extent a perceived COI plays into medical decision-making and the ultimate treatment of patients is still relatively unknown.
1. Lubahn JD, Mankin CJ, Mankin HJ, Kuhn PJ. Orthopaedics, ethics, and industry. Appropriateness of gifts, grants, and awards. Clin Orthop Relat Res. 2000;(371):256-263.
2. Kubiak EN, Park SS, Egol K, Zuckerman JD, Koval KJ. Increasingly conflicted: an analysis of conflicts of interest reported at the annual meetings of the Orthopaedic Trauma Association. Bull Hosp Jt Dis. 2006;63(3-4):83-87.
3. Khan SN, Mermer MJ, Myers E, Sandhu HS. The roles of funding source, clinical trial outcome, and quality of reporting in orthopedic surgery literature. Am J Orthop. 2008;37(12):E205-E212.
4. Okike K, Kocher MS, Mehlman CT, Bhandari M. Conflict of interest in orthopaedic research. An association between findings and funding in scientific presentations. J Bone Joint Surg Am. 2007;89(3):608-613.
5. Okike K, Kocher MS, Wei EX, Mehlman CT, Bhandari M. Accuracy of conflict-of-interest disclosures reported by physicians. N Engl J Med. 2009;361(15):1466-1474.
6. Shah RV, Albert TJ, Bruegel-Sanchez V, Vaccaro AR, Hilibrand AS, Grauer JN. Industry support and correlation to study outcome for papers published in Spine. Spine. 2005;30(9):1099-1104.
7. Valachis A, Polyzos NP, Nearchou A, Lind P, Mauri D. Financial relationships in economic analyses of targeted therapies in oncology. J Clin Oncol. 2012;30(12):1316-1320.
8. Ezzet KA. The prevalence of corporate funding in adult lower extremity research and its correlation with reported results. J Arthroplasty. 2003;18(7 suppl 1):138-145.
9. Lo B, Field MJ, eds; Institute of Medicine, Committee on Conflict of Interest in Medical Research, Education, and Practice, Board on Health Sciences Policy. Conflict of Interest in Medical Research, Education, and Practice. Washington, DC: National Academies Press; 2009. http://www.ncbi.nlm.nih.gov/books/NBK22942. Accessed September 29, 2015.
10. Cosgrove L, Krimsky S. A comparison of DSM-IV and DSM-5 panel members’ financial associations with industry: a pernicious problem persists. PLoS Med. 2012;9(3):e1001190.
11. Altwairgi AK, Booth CM, Hopman WM, Baetz TD. Discordance between conclusions stated in the abstract and conclusions in the article: analysis of published randomized controlled trials of systemic therapy in lung cancer. J Clin Oncol. 2012;30(28):3552-3557.
12. Decoster LC, Vailas JC, Swartz WG. Functional ACL bracing. A survey of current opinion and practice. Am J Orthop. 1995;24(11):838-843.
13. Mann BJ, Grana WA, Indelicato PA, O’Neill DF, George SZ. A survey of sports medicine physicians regarding psychological issues in patient-athletes. Am J Sports Med. 2007;35(12):2140-2147.
As defined by the American Academy of Orthopaedic Surgeons (AAOS) in 1996, conflict of interest (COI) is the “circumstance that exists when, because of personal financial gain, an individual has the potential to be less than objective when called on to reach a judgment or interpret a result.”1 In medical research, COIs often occur in relationships between physician-researchers and pharmaceutical, medical device, and biotechnology companies. These relationships usually take the form of research grants but can also arise when the researcher has a financial interest in the product being tested or in the company that manufactures the product.
Although constructive collaboration between academic medicine and industry has worked to improve health care and ultimately benefit patients, potential drawbacks of such relationships include sequestration and suppression of results that may be disadvantageous to the industry sponsor,2 increased likelihood of reporting positive results (pro-industry),3-7 and biased study designs.8 The nature of such relationships may threaten the integrity of scientific studies, the objectivity of medical education, the quality of patient care, and the public’s trust in medicine.9
Financial relationships and affiliations are increasing as we seek to answer a growing number of clinical questions—with funding often being a limiting factor. At national scientific meetings, the number of presentations reporting COIs reflects this trend. Paper and poster presentations accepted for annual meetings of the Orthopaedic Trauma Association (OTA) and reporting a COI increased from 7.6% in 1993 to 12.6% in 2002 (P = .0129).2
Medical subspecialties outside of orthopedics are experiencing similar trends. Most notable is the American Psychiatric Association (APA). After the APA published a mandatory financial COI disclosure policy in the Diagnostic and Statistical Manual of Mental Disorders, Fifth Edition (DSM-5), the percentage of task force members reporting industry relationships increased by 12%.10 Analysis of the DSM-5 panels demonstrated that the panels with the largest percentage of reported COIs are those for which pharmacological treatment is the first-line intervention, including the panels for mood disorders (67%), psychotic disorders (83%) and sleep/wake disorders (100%).10 Moreover, the industry ties reported are to the pharmaceutical companies that manufacture the medications used to treat these disorders or to companies that service the pharmaceutical industry.10
The degree to which financial COIs affect the interpretation of the orthopedic literature has never been quantified. Although it is clear that COIs can confound the results and reporting of data, how the medical community uses disclosures when interpreting the literature and when formulating opinions that may or may not affect their practice patterns is largely unknown.
We conducted a study to evaluate how a hypothetical financial COI disclosure would influence the interpretation of data by orthopedic clinicians. We also wanted to determine the reliability of the data as perceived in association with different study designs, levels of evidence, research institutional settings, and reporting of positive or negative results.
Methods
We asked members of the Arthroscopy Association of North America (AANA) and the American Orthopaedic Society for Sports Medicine (AOSSM) to complete a multiple-choice situational questionnaire (Table). The questionnaire assesses the degree to which respondents use COI disclosures when interpreting the literature. It further explores the perceived clinical value of a study with a given reported COI, assuming variations in study design, research institutional setting, and significance of results. The fictional research team disclosed the project was funded by a pharmaceutical company and all team members received consulting compensation. The survey and study were reviewed and approved by our institutional review board. The survey consisted of 14 multiple-choice questions that allowed for only 1 answer selection per person and allowed survey takers to skip questions they did not wish to answer. The survey questions and associated response options appear in edited form in the Table. A link to the questionnaire (https://www.surveymonkey.com/s/MPCCLCX) was sent with a message explaining the study. The responses to the questionnaire constituted the data.
Results
We sent a request to participate in the survey to 750 physicians and received 522 responses (overall response rate, 70%). The response rate for each question equaled or exceeded 98%.
The majority of respondents (95.6%) were male. Ninety-nine percent of respondents were orthopedic surgeons. The Northeast (US) was the most common geographical practice location of respondents (32%), followed by the Midwest (19.1%) and the Southeast (16.6%). Most respondents (40%) had been in practice for more than 20 years; 67% had been in practice a minimum of 10 years. The majority (68.8%) were employed by private practice groups, either single specialty (57.8%) or multispecialty (11%).
Eighty percent of respondents strongly agreed that COI disclosure is important when interpreting study results, 62% reported always reading the disclosure slide during academy or other meeting presentations, and 41% reported always using this information when deciding how to interpret scientific data.
Seventy-five percent of respondents thought the study—an academic-center case series with significant results in favor of the pharmaceutical company funding the study—was biased (42% indicated biased with merit, 33% biased without merit). Twenty-three percent thought the study was possibly biased, but likely trustworthy given the academic institutional affiliation. When the study setting was changed to community hospital, 95% thought the study was biased (51% biased with merit, 44% biased without merit). With the same study performed at an academic center, and no statistically significant results (not in favor of the pharmaceutical company funding the study), 88% thought the study had merit (46% biased with merit, 42% unbiased with merit).
When the study design was changed to a randomized controlled trial (level I evidence) conducted at an academic center with negative results, an overwhelming 95% of respondents thought the study had merit (33% biased with merit, 62% unbiased with merit). Given the same study design at an academic center, with positive results, 78% still thought the study had merit (39% biased with merit, 39% unbiased with merit). An additional 18% thought the study was biased, but still likely trustworthy given the academic institutional affiliation. Finally, given a randomized controlled trial and positive results, but with the research setting a small community practice, 90% thought the study had merit (51% biased with merit, 39% unbiased with merit). The percentage of respondents who found the study biased and likely without merit increased from 3.7% to 9.5% when the institutional affiliation changed from academic to community.
Discussion
As governmental funding sources become increasingly limited, the role of industry sponsorship of orthopedic research has grown. Potential drawbacks and biases of such research support have been well described—most notably, increased positive result reporting, suppression of results that may be disadvantageous to the industry sponsor, and biased study designs.2-8 However, the extent to which financial COIs affect the orthopedic medical community’s interpretation of the literature has never been quantified. To our knowledge, the present study is the first to quantify the impact of reported COI on study interpretation.
Our goal was to examine how reported financial COIs influence the interpretation of the literature by the orthopedic medical community. Moreover, we wanted to determine the perceived reliability of the data when variables (study design, institutional affiliation, positive vs negative results) were changed. The results of our survey indicate that, when a financial COI is reported, study reliability is perceived as highest when negative results were found.
Our survey noted a discrepancy between the documented importance of the hypothetical research team’s COI disclosure and the use of such disclosures when interpreting study results. Eighty percent of respondents agreed that COI disclosure is important when interpreting study results, but only 62% reported always reading disclosures, and even fewer (41%) reported always using the information when interpreting results. It is unclear exactly why this trend exists, as one would expect the percentages to be more similar. These particular survey questions were formed around using COI disclosures when interpreting study results during academic presentations at national meetings and not during the review of published literature. It is possible that positioning the COI disclosure at the beginning of a presentation has an effect, but only 3.7% of respondents indicated they seldom remembered the disclosure by the end of the presentation. The results of our survey may have varied if the questions had targeted reading and interpreting the literature.
Interestingly, the results of these survey questions tended to be more consistent with rates of reported financial COI by presenters at national orthopedic meetings. A study published in the New England Journal of Medicine found that less than 80% of orthopedic surgeons reported their disclosures at a large annual meeting (AAOS), even when the disclosure involved payments pertinent to the research they were presenting.5 When the payments were indirectly related to the research, the percentage of surgeons reporting disclosures was 50%, almost the same as the disclosure rate for unrelated payments.5
When the study was changed to a level I randomized controlled trial, more survey respondents found it to be less biased and have more merit. Although it would seem intuitive for a study with a higher level of evidence to carry more clinical value during interpretation, this may not hold true in the setting of industry-sponsored clinical trials. Several studies have documented a significant association between the reporting of positive results and industry-sponsored randomized clinical trials. In 2008, Khan and colleagues3 examined 100 orthopedic randomized clinical trials reported in 5 major orthopedic subspecialty journals over a 2-year period. The association between industry funding and favorable outcome in all original randomized clinical trials was strong and significant (P < .001). This is not surprising, given the amount of time and money required for a well-designed clinical study. Commercial products with preclinical promise are pushed to testing in a clinical trial, whereas resources would not be wasted on products lacking preclinical merit.
The most important variable affecting interpretation of study merit by survey respondents was the reporting of negative results. As more researchers are developing COIs, many studies are discovering a relationship between COIs and outcomes of research studies. Reviewing the adult total joint literature, Ezzet8 found an industry funding rate of 50%. Positive results were reported in 93% of cases in commercially funded studies versus 37% of cases in independently funded studies. Furthermore, no negative results were reported by investigators who were receiving royalties from the respective companies.
Studies across the medical literature have also found this association between industry sponsorship and reporting of positive results. One such study, reported by Valachis and colleagues7 in the Journal of Clinical Oncology, examined more than 80 economic analyses of targeted oncologic therapies and found the studies funded by pharmaceutical companies were more likely to report favorable qualitative cost estimates. In addition, when studies with a COI disclosure were examined, those reporting any financial relationship with a manufacturer (eg, author affiliation, funding) were more likely than those without such a relationship to report favorable results.
Our study had several limitations. First, as most of the survey respondents were orthopedic surgeons, extrapolating their data to the medical community at large may not be appropriate, as each specialty may view industry affiliations differently. In addition, respondents were asked to base their interpretations of a study on conclusions we predetermined—no direct visualization of the data set or statistical testing methods. It is possible that these responses may have been different had the respondents had the opportunity to further evaluate the study in question. In a recent study, Altwairgi and colleagues11 found that 10% of randomized clinical trials involving lung cancer treatment were reported with different conclusions in their full manuscripts relative to their abstracts. We think our survey design perhaps best mimics an annual meeting environment in which participants have very limited ability to interpret studies and may rely more heavily on the factors we investigated—study design, significance of findings, and setting, all similar to information presented in an abstract—when making informed decisions. Although our response rate was only 70%, this is comparable to or better than the rates in similar survey studies that used email-based questionnaires.12,13
Another limitation was that our survey may have forced respondents into answers they did not entirely agree with, given the limited options of the multiple-choice response format and the specific wording of the questions. Our conclusions may have been more dramatic when we were evaluating whether the study was deemed meritorious or not. However, there is no adopted standard for evaluating the extent of bias perceived by a clinician. We thought it was important to include answer options indicating a study had merit despite obvious bias in design and execution. That a study had merit can mean different things. It may change clinical practice, may require further study and reproducibility, or may not be significant enough to matter. Asking follow-up questions to evaluate this perception among the respondents could have provided validity to the term merit. Further studies in this field are needed to determine how studies are interpreted and translated into clinical practice by various clinicians.
Conclusion
Although the present study is not a quantitative analysis of the determination of bias in the orthopedic community, it is the first to evaluate orthopedic surgeons’ perceptions on the basis of key fundamentals of orthopedic research relative to COI. It is clear from our study results that introducing levels of evidence to the orthopedic milieu has had a significant impact both on the quality of research and on the foundational use of deductive reasoning when interpreting the literature. Reporting negative outcomes is perhaps the most important factor in eliminating the perception of bias among orthopedic surgeons. To what extent a perceived COI plays into medical decision-making and the ultimate treatment of patients is still relatively unknown.
1. Lubahn JD, Mankin CJ, Mankin HJ, Kuhn PJ. Orthopaedics, ethics, and industry. Appropriateness of gifts, grants, and awards. Clin Orthop Relat Res. 2000;(371):256-263.
2. Kubiak EN, Park SS, Egol K, Zuckerman JD, Koval KJ. Increasingly conflicted: an analysis of conflicts of interest reported at the annual meetings of the Orthopaedic Trauma Association. Bull Hosp Jt Dis. 2006;63(3-4):83-87.
3. Khan SN, Mermer MJ, Myers E, Sandhu HS. The roles of funding source, clinical trial outcome, and quality of reporting in orthopedic surgery literature. Am J Orthop. 2008;37(12):E205-E212.
4. Okike K, Kocher MS, Mehlman CT, Bhandari M. Conflict of interest in orthopaedic research. An association between findings and funding in scientific presentations. J Bone Joint Surg Am. 2007;89(3):608-613.
5. Okike K, Kocher MS, Wei EX, Mehlman CT, Bhandari M. Accuracy of conflict-of-interest disclosures reported by physicians. N Engl J Med. 2009;361(15):1466-1474.
6. Shah RV, Albert TJ, Bruegel-Sanchez V, Vaccaro AR, Hilibrand AS, Grauer JN. Industry support and correlation to study outcome for papers published in Spine. Spine. 2005;30(9):1099-1104.
7. Valachis A, Polyzos NP, Nearchou A, Lind P, Mauri D. Financial relationships in economic analyses of targeted therapies in oncology. J Clin Oncol. 2012;30(12):1316-1320.
8. Ezzet KA. The prevalence of corporate funding in adult lower extremity research and its correlation with reported results. J Arthroplasty. 2003;18(7 suppl 1):138-145.
9. Lo B, Field MJ, eds; Institute of Medicine, Committee on Conflict of Interest in Medical Research, Education, and Practice, Board on Health Sciences Policy. Conflict of Interest in Medical Research, Education, and Practice. Washington, DC: National Academies Press; 2009. http://www.ncbi.nlm.nih.gov/books/NBK22942. Accessed September 29, 2015.
10. Cosgrove L, Krimsky S. A comparison of DSM-IV and DSM-5 panel members’ financial associations with industry: a pernicious problem persists. PLoS Med. 2012;9(3):e1001190.
11. Altwairgi AK, Booth CM, Hopman WM, Baetz TD. Discordance between conclusions stated in the abstract and conclusions in the article: analysis of published randomized controlled trials of systemic therapy in lung cancer. J Clin Oncol. 2012;30(28):3552-3557.
12. Decoster LC, Vailas JC, Swartz WG. Functional ACL bracing. A survey of current opinion and practice. Am J Orthop. 1995;24(11):838-843.
13. Mann BJ, Grana WA, Indelicato PA, O’Neill DF, George SZ. A survey of sports medicine physicians regarding psychological issues in patient-athletes. Am J Sports Med. 2007;35(12):2140-2147.
Medial Patellar Subluxation: Diagnosis and Treatment
Medial patellar subluxation (MPS) is a disabling condition caused by an imbalance in the medial and lateral forces in the normal knee, allowing the patella to displace medially. Normally, the patella glides appropriately in the femoral trochlea, but alteration in this medial–lateral equilibrium can lead to pain and instability.1 MPS was first described in 1987 by Betz and colleagues2 as a complication of lateral retinacular release. Since then, multiple cases of iatrogenic, traumatic, and isolated medial subluxation have been reported.3–15 However, MPS after lateral release is the most common cause, accounting for the majority of published cases, whereas only 8 cases of isolated MPS have been reported to date.
Optimal treatment for MPS is not well understood. To better comprehend and manage MPS, we must fully appreciate the pathoanatomy, biomechanics, and current research. In this review, we focus on the anatomy of the lateral retinaculum, diagnosis and treatment of MPS, and outcomes of current treatment techniques.
Anatomy
In 1980, Fulkerson and Gossling16 delineated the anatomy of the knee joint lateral retinaculum. They described a 2-layered system with separate distinct anatomical structures. The lateral retinaculum is oriented longitudinally with the knee extended but exerts a posterolateral force on the lateral aspect of the patella as the knee is flexed. The superficial layer is composed of oblique fibers of the lateral retinaculum originating from the iliotibial band and the vastus lateralis fascia and inserting into the lateral margin of the patella and the patella tendon. The deep layer of the retinaculum consists of several structures, including the deep transverse retinaculum, lateral patellofemoral ligament (LPFL), and the patellotibial band.
Over the years, several studies have described the importance of the lateral retinaculum and, in particular, the LPFL. Examining the functional anatomy of the knee in 1962, Kaplan17 first described the lateral epicondylopatellar ligament as a palpable thickening of the joint capsule. Reider and colleagues18 later named this structure the lateral patellofemoral ligament in their anatomical study of 21 fresh cadaver knees. They described its width as ranging from 3 to 10 mm. In a comprehensive cadaveric study of the LPFL, Navarro and colleagues19,20 found it to be a distinct structure present in all 20 of their dissected specimens. They found its femoral insertion at the lateral epicondyle with a fanlike expansion of the fibers predominantly in the posterior region proximal to the lateral epicondyle. The patellar insertion was found in the posterior half and upper lateral aspect, also with expanded fibers. Mean length of the LPFL is 42.1 mm, and mean width is 16.1 mm.
Medial and lateral forces are balanced in a normal knee, and the patella glides appropriately in the femoral trochlea. Alteration in this medial–lateral equilibrium can lead to pain and instability.1 Normally, the patella lies laterally with the knee extended, but in early flexion the patella moves medially as it engages in the trochlea. As the knee continues to flex, the patella flexes and translates distally.21 By 45°, the patella is fully engaged in the trochlear groove throughout the remainder of the knee’s range of motion (ROM).
Lateral release procedures, as described in the literature, result in sectioning of both layers of the lateral retinaculum. In a biomechanical study, Merican and colleagues22 found that staged release of the lateral retinaculum reduced the medial stability of the patellofemoral joint progressively, making it easier to push the patella medially. At 30° of flexion, the transverse fibers of the midsection of the lateral retinaculum were found to be the main contributor to the lateral restraint of the patella. When the release extends too far proximally, the transverse fibers that anchor the lateral patella and the vastus lateralis oblique tendon to the iliotibial band are disrupted. Subsequent loss of a dynamic muscular pull in the orientation of the lateral stabilizing structures results in medial subluxation in a range from full knee extension to about 30° of flexion.
Furthermore, the attachments of the LPFL and the orientation of its fibers suggest that the LPFL may have a significant role in limiting medial excursion of the patella. Vieira and colleagues23 resected the LPFL in 10 fresh cadaver knees. They noticed that, after resection, the patella spontaneously traveled medially, demonstrating the importance of this ligament in patellar stability. In cases of isolated MPS, there have been no reports of associated pathology, such as muscular imbalance or coronal/rotational malalignment of the lower extremity. With an intact lateral retinaculum, medial subluxation is likely caused by pathology in the normal histologic structure of the LPFL and lateral retinaculum. However, the histologic structure of the LPFL and its contribution to the understanding of the pathoetiology of MPS have not been documented.
Diagnosis
MPS diagnosis can be challenging. Often, clinical examination findings are subtle, and radiographs may not show significant pathology. The most accurate diagnosis is obtained by combining patient history, physical examination findings, imaging studies, and diagnostic arthroscopy.
Patient History
Patients with MPS report chronic pain localized to the inferior medial patella and anterior-medial joint line. Occasionally, they complain of crepitus and intermittent swelling. Other symptoms include pain with knee flexion activity, such as squatting and climbing or descending stairs. Some patients describe episodes of giving way and feelings of instability. Often, they are aware the direction of instability is medial. The pain typically is not relieved by medication, physical therapy, or bracing.
Physical Examination
MPS must be identified by clinical examination. Peripatellar tenderness is typically noted. There is often no effusion or crepitus, but the patella is unstable in early flexion. Active and passive ROM is painful through the first 30° of knee flexion. The patient may have a positive medial apprehension test7 in which he or she experiences apprehension of the patella being subluxated with a medially directed force on the lateral border of the patella.
The gravity subluxation test described by Nonweiler and DeLee6 is useful in detecting MPS after lateral release and indicates that the vastus lateralis muscle has been detached from the patella and that the lateral retinaculum is lax. In this test, the patient is positioned in the lateral decubitus position with the involved knee farthest from the table. In this position, gravity causes the patella to subluxate out of the trochlea. The test is positive for MPS when a voluntary contraction of the quadriceps does not center the patella into the trochlear groove. Patients with MPS without previous lateral release can have the patella subluxate medially in the lateral decubitus position, but it is pulled back into the trochlea with active quadriceps contraction (Figure 1).
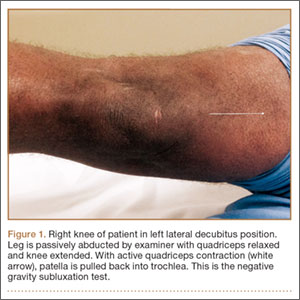
Patients with MPS often have lateral patellar laxity (LPL), which allows the patella to rotate upward on the lateral side and skid across the medial facet of the femoral trochlea. A physical examination sign combining lateral patellar glide and tilt was described by Shneider24 to identify LPL. This “lateral patellar float” sign is present when the patella translates laterally and rotates or tilts upward with medial pressure on the patella (Figure 2). Another maneuver to test for subtle MPS involves manually centering the patella in the trochlea during active knee flexion and extension. The involved knee is examined in the seated position. The examiner attempts to center the patella in the trochlea with a laterally directed force from the examiner’s thumb on the medial border of the patella. This will usually provide immediate relief as the patient actively ranges the knee.
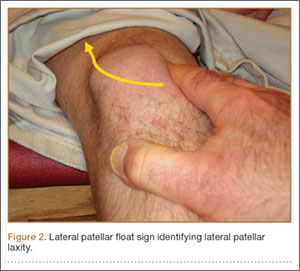
Imaging Studies
Diagnostic imaging is a crucial component of the evaluation and treatment decision process. Plain radiographs often are not helpful in diagnosing MPS but may provide additional information.5 A variety of radiographic measurements have been described as indicators of structural disease, but there is a lack of comprehensive information recommending radiographic evaluation and interpretation of patients with patellofemoral dysfunction. It is crucial that orthopedic surgeons have common and consistent radiographic views for plain radiographic assessment that can serve as a basis for accurate diagnosis and surgical decision-making.
Standard knee radiographs should include a standing anteroposterior view of bilateral knees, a standing lateral view of the symptomatic knee in 30° of flexion, a patellar axial view, and a tunnel view. These views, occasionally combined with magnetic resonance imaging (MRI), can yield information vital to surgical decision-making. Image quality is highly technique-dependent, and variability in patient positioning can substantially affect the ability to properly diagnose structural abnormalities. For improved diagnostic accuracy and disease classification, radiographs must be obtained with use of the same standardized imaging protocol.
Kinetic MRI was shown by Shellock and colleagues25 to provide diagnostic information related to patellar malalignment. As kinetic MRI can image the patellofemoral joint within the initial 20° to 30° of flexion, it is useful in detecting some of the more subtle patellar tracking problems. In their study of 43 knees (40 patients) with symptoms after lateral release, Shellock and colleagues25 found that 27 knees (63%) had medial subluxation of the patella as the knee moved from extension to flexion. Furthermore, MPS was noted on the contralateral, unoperated knee in 17 (43%) of the 40 patients.
Diagnostic Arthroscopy
Once MPS is suspected after a thorough history and physical examination, examination under anesthesia accompanied by diagnostic arthroscopy confirms the diagnosis. Lateral forces are applied to the patella in full knee extension and 30° of flexion (Figure 3). During arthroscopy, the patellofemoral compartment is viewed from the anterolateral portal. With the knee at full extension, the lateral laxity and medial tilt of the patella can be identified (Figure 4). As the knee is flexed to 30°, the patella moves medially and can subluxate over the edge of the medial facet of the trochlea (Figure 5).
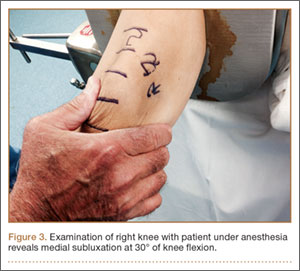
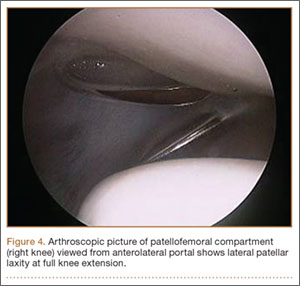
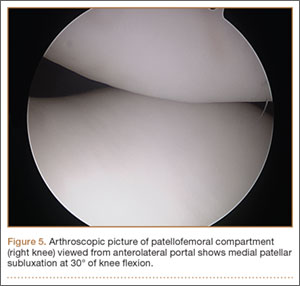
Treatment
Nonsurgical Management
Treatment of MPS depends entirely on making an accurate diagnosis and determining the degree of impairment. Patients with symptomatic MPS should initially undergo supervised rehabilitation focusing on balancing the medial and lateral forces that influence patellar tracking. Patients should be evaluated for specific muscle tightness, weakness, and biomechanical abnormalities. Each problem should be addressed with an individualized rehabilitation prescription. Emphasis is placed on balance, proprioception, and strengthening of the quadriceps, hip abductors/external rotators, and abdominal core muscle groups.
In some patients, symptomatic MPS may be reduced with a patella-stabilizing brace with a medial buttress.3,5,26 Although bracing should be regarded as an adjuvant to a structured physical therapy program, it can also be helpful in confirming the diagnosis of MPS. Shannon and Keene3 reported that all patients in their study experienced significant pain relief and decreased medial patellar subluxations when they wore a medial patella–stabilizing brace. Shellock and colleagues25 used kinematic MRI to investigate the effect of a patella-realignment brace and found that bracing counteracted patellar subluxation in the majority of knees studied.
Surgical Management
When conservative management fails and patients continue to experience pain and instability, surgical intervention is often required. Although various surgical techniques have been used (Table),3–6,8–10,14,15,27,28 the optimal surgical treatment for MPS has not been identified.
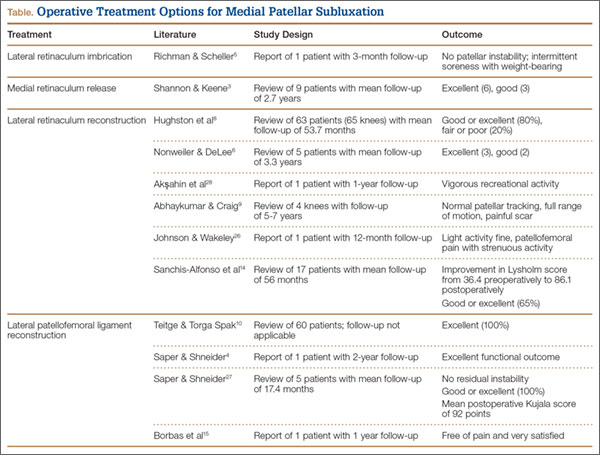
Lateral Retinaculum Imbrication. Lateral retinaculum imbrication has been used to centralize patella tracking and stabilize the patella. Richman and Scheller5 reported on a 17-year-old patient who had isolated medial subluxation of the patella without having undergone a previous lateral release. At 3-month follow-up, there was no recurrent instability; there was only intermittent medial knee soreness with weight-bearing activity.
Lateral Retinaculum Repair/Reconstruction. Hughston and colleagues8 treated 65 knees for MPS. Most had undergone lateral release. Of the 65 knees, 39 were treated with direct repair of the lateral retinaculum, and 26 with reconstruction of the lateral patellotibial ligament using locally available tissue, such as strips of iliotibial band or patellar tendon. Results were good to excellent in 80% of patients at a mean follow-up of 53.7 months. Nonweiler and DeLee6 reconstructed the lateral retinaculum in 5 patients with MPS that developed after isolated lateral retinacular release. Four (80%) of the 5 patients had no symptoms or physical signs of instability at a mean follow-up of 3.3 years. Results were excellent (3 knees) and good (2 knees) according to the Merchant and Mercer rating scale. Akşahin and colleagues28 reported on a single case of spontaneous medial patellar instability. At surgery, imbrication of the lateral structures failed to prevent the medial subluxation. Lateral patellotibial ligament augmentation was performed using an iliotibial band flap that effectively corrected the instability. At 1 year, the patient was characterized as engaging in vigorous recreational activity, according to the clinical score defined by Hughston and colleagues.8 He had mild pain with competitive sports but no pain with daily activity. Abhaykumar and Craig9 reported on 4 surgically treated knees with medial instability. They reconstructed the lateral retinaculum using a strip of fascia lata. By follow-up (5-7 years), each knee had its instability resolved and full ROM restored. Johnson and Wakeley26 reported on a case of iatrogenic MPS after lateral release. Treatment consisted of mobilization and direct repair of the lateral retinaculum. At 12-month follow-up, there was no instability. Although symptom-free with light activity, the patient had patellofemoral pain with strenuous activity. Sanchis-Alfonso and colleagues14 reported the results of isolated lateral retinacular reconstruction for iatrogenic MPS in 17 patients. At mean follow-up of 56 months, results were good or excellent in 65% of patients, and the Lysholm score improved from 36.4 preoperatively to 86.1 postoperatively.
Medial Retinaculum Release. Medial retinaculum release has been used as an alternative to open reconstruction. Shannon and Keene3 reported the results of medial retinacular release procedures on 9 knees. Four (44%) of the 9 patients had either spontaneous or traumatic onset of instability. All cases were treated with arthroscopic medial retinacular release, extending 2 cm medial to the superior pole of the patella down to the anteromedial portal. This avoided releasing the attachment of the vastus medialis oblique muscle to the patella and removing its dynamic medial stabilizing force. At a mean follow-up of 2.7 years, both medial subluxation and knee pain were relieved in all 9 knees without complications or further realignment surgery. Results were excellent in 6 knees (66.7%) and good in 3 knees (33.3%). Shannon and Keene3 emphasized that the procedure should not be used in patients with hypermobile patellae or in cases of failed lateral retinacular releases in which MPS is not clearly and carefully documented.
LPFL Reconstruction. Before coming to our practice, most patients have tried several months of formal physical rehabilitation, medications, and bracing. Many have already had surgical procedures, including arthroscopy, lateral release, and tibial tubercle transfer. When the diagnosis of MPS is suspected after a thorough history and physical examination, LPFL reconstruction is offered. Management of MPS with LPFL reconstruction has yielded excellent and reliable clinical results. Teitge and Torga Spak10 described an LPFL reconstruction technique that is used as a salvage procedure in managing medial iatrogenic patellar instability (the patient’s own quadriceps tendon is used). In their experience, direct repair or imbrication of the lateral retinaculum failed to provide long-term stability because medial excursion usually appeared after 1 year. The 60 patients’ outcomes were excellent with respect to patellar stability, and there were no cases of recurrent subluxation. Borbas and colleagues15 reported a case of LPFL reconstruction in a symptomatic medial subluxated patella resulting from TKA and extended lateral release. Using a free gracilis autograft through patellar bone tunnels to reconstruct the LPFL, the patient was free of pain and very satisfied with the result at 1 year postoperatively. Our current strategy is anatomical reconstruction of the LPFL using a quadriceps tendon graft and no bone tunnels, screws, or anchors in the patella.27 We previously reported a single case of isolated medial instability.4 At 2-year follow-up, there was no recurrent instability, and the functional outcome was excellent. This LPFL reconstruction method has been used in 10 patients with isolated MPS. There has been no residual medial subluxation on follow-up ranging from 3 months to 2 years. Outcome studies are in progress.
Rehabilitation. The initial goal of rehabilitation after surgical reconstruction of the lateral retinaculum or LPFL is to protect the healing soft tissues, restore normal knee ROM, and normalize gait. The knee is immobilized in a brace for weight-bearing activity for 4 to 6 weeks, until limb control is sufficient to prevent rotational stress on the knee. Gradual increase to full weight-bearing without bracing is permitted as quadriceps strength is restored. As motion is regained, strength, balance, and proprioception are emphasized for the entire lower extremity and core.
Functional limb training, including rotational activity, begins at 12 weeks. As strength and neuromuscular control progress, single-leg activity may be started with particular attention to proper alignment of the pelvis and the entire lower extremity. For competitive or recreational athletes, the final stages of rehabilitation focus on dynamic lower extremity control during sport-specific movements. Patients return to unrestricted activity by 6 months to 1 year after surgery.
Summary
MPS is a disabling condition that can limit daily functional activity because of apprehension and pain. Initially described as a complication of lateral retinacular release, isolated MPS can occur in the absence of a previous lateral release. Thorough physical examination and identification during arthroscopy are crucial for proper MPS diagnosis and management. When nonsurgical measures fail, LPFL reconstruction can provide patellofemoral stability and excellent functional outcomes.
1. Marumoto JM, Jordan C, Akins R. A biomechanical comparison of lateral retinacular releases. Am J Sports Med. 1995;23(2):151-155.
2. Betz RR, Magill JT, Lonergan RP. The percutaneous lateral retinacular release. Am J Sports Med. 1987;15(5):477-482.
3. Shannon BD, Keene JS. Results of arthroscopic medial retinacular release for treatment of medial subluxation of the patella. Am J Sports Med. 2007;35(7):1180-1187.
4. Saper MG, Shneider DA. Medial patellar subluxation without previous lateral release: a case report. J Pediatr Orthop B. 2014;23(4):350-353.
5. Richman NM, Scheller AD Jr. Medial subluxation of the patella without previous lateral retinacular release. Orthopedics. 1998;21(7):810-813.
6. Nonweiler DE, DeLee JC. The diagnosis and treatment of medial subluxation of the patella after lateral retinacular release. Am J Sports Med. 1994;22(5):680-686.
7. Hughston JC, Deese M. Medial subluxation of the patella as a complication of lateral retinacular release. Am J Sports Med. 1988;16(4):383-388.
8. Hughston JC, Flandry F, Brinker MR, Terry GC, Mills JC 3rd. Surgical correction of medial subluxation of the patella. Am J Sports Med. 1996;24(4):486-491.
9. Abhaykumar S, Craig DM. Fascia lata sling reconstruction for recurrent medial dislocation of the patella. The Knee. 1999;6(1):55-57.
10. Teitge RA, Torga Spak R. Lateral patellofemoral ligament reconstruction. Arthroscopy. 2004;20(9):998-1002.
11. Kusano M, Horibe S, Tanaka Y, et al. Simultaneous MPFL and LPFL reconstruction for recurrent lateral patellar dislocation with medial patellofemoral instability. Asia-Pac J Sports Med Arthrosc Rehabil Technol. 2014;1:42-46.
12. Saper MG, Shneider DA. Simultaneous medial and lateral patellofemoral ligament reconstruction for combined medial and lateral patellar subluxation. Arthrosc Tech. 2014,3(2):e227-e231.
13. Udagawa K, Niki Y, Matsumoto H, et al. Lateral patellar retinaculum reconstruction for medial patellar instability following lateral retinacular release: a case report. Knee. 2014;21(1):336-339.
14. Sanchis-Alfonso V, Montesinos-Berry E, Monllau JC, Merchant AC. Results of isolated lateral retinacular reconstruction for iatrogenic medial patellar instability. Arthroscopy. 2015;31(3):422-427.
15. Borbas P, Koch PP, Fucentese SF. Lateral patellofemoral ligament reconstruction using a free gracilis autograft. Orthopedics. 2014;37(7):e665-e668.
16. Fulkerson JP, Gossling H. Anatomy of the knee joint lateral retinaculum. Clin Orthop Relat Res. 1980;153:183-188.
17. Kaplan E. Some aspects of functional anatomy of the human knee joint. Clin Orthop Relat Res. 1962;23:18-29.
18. Reider B, Marshall J, Koslin B, Ring B, Girgis F. The anterior aspect of the knee joint. J Bone Joint Surg Am. 1981;63(3):351-356.
19. Navarro MS, Navarro RD, Akita Junior J, Cohen M. Anatomical study of the lateral patellofemoral ligament in cadaver knees. Rev Bras Ortop. 2008;43(7):300-307.
20. Navarro MS, Beltrani Filho CA, Akita Junior J, Navarro RD, Cohen M. Relationship between the lateral patellofemoral ligament and the width of the lateral patellar facet. Acta Ortop Bras. 2010;18(1):19-22.
21. Salsich GB, Ward SR, Terk MR, Powers CM. In vivo assessment of patellofemoral joint contact area in individuals who are pain free. Clin Orthop Relat Res. 2003;417:277-284.
22. Merican AM, Kondo E, Amis AA. The effect on patellofemoral joint stability of selective cutting of lateral retinacular and capsular structures. J Biomech. 2009;42(3):291-296.
23. Vieira EL, Vieira EÁ, da Silva RT, Berlfein PA, Abdalla RJ, Cohen M. An anatomic study of the iliotibial tract. Arthroscopy. 2007;23(3):269-274.
24. Shneider DA. Lateral patellar laxity—identification, significance, treatment. Poster session presented at: Annual Meeting of the American Academy of Orthopaedic Surgeons; February 25-28, 2009; Las Vegas, NV.
25. Shellock FG, Mink JH, Deutsch A, Fox JM, Ferkel RD. Evaluation of patients with persistent symptoms after lateral retinacular release by kinematic magnetic resonance imaging of the patellofemoral joint. Arthroscopy. 1990;6(3):226-234.
26. Johnson DP, Wakeley C. Reconstruction of the lateral patellar retinaculum following lateral release: a case report. Knee Surg Sports Traumatol Arthrosc. 2002;10(6):361-363.
27. Saper MG, Shneider DA. Lateral patellofemoral ligament reconstruction using a quadriceps tendon graft. Arthrosc Tech. 2014;3(4):e445-e448.
28. Akşahin E, Yumrukçal F, Yüksel HY, Doğruyol D, Celebi L. Role of pathophysiology of patellofemoral instability in the treatment of spontaneous medial patellofemoral subluxation: a case report. J Med Case Rep. 2010;4:148.
Medial patellar subluxation (MPS) is a disabling condition caused by an imbalance in the medial and lateral forces in the normal knee, allowing the patella to displace medially. Normally, the patella glides appropriately in the femoral trochlea, but alteration in this medial–lateral equilibrium can lead to pain and instability.1 MPS was first described in 1987 by Betz and colleagues2 as a complication of lateral retinacular release. Since then, multiple cases of iatrogenic, traumatic, and isolated medial subluxation have been reported.3–15 However, MPS after lateral release is the most common cause, accounting for the majority of published cases, whereas only 8 cases of isolated MPS have been reported to date.
Optimal treatment for MPS is not well understood. To better comprehend and manage MPS, we must fully appreciate the pathoanatomy, biomechanics, and current research. In this review, we focus on the anatomy of the lateral retinaculum, diagnosis and treatment of MPS, and outcomes of current treatment techniques.
Anatomy
In 1980, Fulkerson and Gossling16 delineated the anatomy of the knee joint lateral retinaculum. They described a 2-layered system with separate distinct anatomical structures. The lateral retinaculum is oriented longitudinally with the knee extended but exerts a posterolateral force on the lateral aspect of the patella as the knee is flexed. The superficial layer is composed of oblique fibers of the lateral retinaculum originating from the iliotibial band and the vastus lateralis fascia and inserting into the lateral margin of the patella and the patella tendon. The deep layer of the retinaculum consists of several structures, including the deep transverse retinaculum, lateral patellofemoral ligament (LPFL), and the patellotibial band.
Over the years, several studies have described the importance of the lateral retinaculum and, in particular, the LPFL. Examining the functional anatomy of the knee in 1962, Kaplan17 first described the lateral epicondylopatellar ligament as a palpable thickening of the joint capsule. Reider and colleagues18 later named this structure the lateral patellofemoral ligament in their anatomical study of 21 fresh cadaver knees. They described its width as ranging from 3 to 10 mm. In a comprehensive cadaveric study of the LPFL, Navarro and colleagues19,20 found it to be a distinct structure present in all 20 of their dissected specimens. They found its femoral insertion at the lateral epicondyle with a fanlike expansion of the fibers predominantly in the posterior region proximal to the lateral epicondyle. The patellar insertion was found in the posterior half and upper lateral aspect, also with expanded fibers. Mean length of the LPFL is 42.1 mm, and mean width is 16.1 mm.
Medial and lateral forces are balanced in a normal knee, and the patella glides appropriately in the femoral trochlea. Alteration in this medial–lateral equilibrium can lead to pain and instability.1 Normally, the patella lies laterally with the knee extended, but in early flexion the patella moves medially as it engages in the trochlea. As the knee continues to flex, the patella flexes and translates distally.21 By 45°, the patella is fully engaged in the trochlear groove throughout the remainder of the knee’s range of motion (ROM).
Lateral release procedures, as described in the literature, result in sectioning of both layers of the lateral retinaculum. In a biomechanical study, Merican and colleagues22 found that staged release of the lateral retinaculum reduced the medial stability of the patellofemoral joint progressively, making it easier to push the patella medially. At 30° of flexion, the transverse fibers of the midsection of the lateral retinaculum were found to be the main contributor to the lateral restraint of the patella. When the release extends too far proximally, the transverse fibers that anchor the lateral patella and the vastus lateralis oblique tendon to the iliotibial band are disrupted. Subsequent loss of a dynamic muscular pull in the orientation of the lateral stabilizing structures results in medial subluxation in a range from full knee extension to about 30° of flexion.
Furthermore, the attachments of the LPFL and the orientation of its fibers suggest that the LPFL may have a significant role in limiting medial excursion of the patella. Vieira and colleagues23 resected the LPFL in 10 fresh cadaver knees. They noticed that, after resection, the patella spontaneously traveled medially, demonstrating the importance of this ligament in patellar stability. In cases of isolated MPS, there have been no reports of associated pathology, such as muscular imbalance or coronal/rotational malalignment of the lower extremity. With an intact lateral retinaculum, medial subluxation is likely caused by pathology in the normal histologic structure of the LPFL and lateral retinaculum. However, the histologic structure of the LPFL and its contribution to the understanding of the pathoetiology of MPS have not been documented.
Diagnosis
MPS diagnosis can be challenging. Often, clinical examination findings are subtle, and radiographs may not show significant pathology. The most accurate diagnosis is obtained by combining patient history, physical examination findings, imaging studies, and diagnostic arthroscopy.
Patient History
Patients with MPS report chronic pain localized to the inferior medial patella and anterior-medial joint line. Occasionally, they complain of crepitus and intermittent swelling. Other symptoms include pain with knee flexion activity, such as squatting and climbing or descending stairs. Some patients describe episodes of giving way and feelings of instability. Often, they are aware the direction of instability is medial. The pain typically is not relieved by medication, physical therapy, or bracing.
Physical Examination
MPS must be identified by clinical examination. Peripatellar tenderness is typically noted. There is often no effusion or crepitus, but the patella is unstable in early flexion. Active and passive ROM is painful through the first 30° of knee flexion. The patient may have a positive medial apprehension test7 in which he or she experiences apprehension of the patella being subluxated with a medially directed force on the lateral border of the patella.
The gravity subluxation test described by Nonweiler and DeLee6 is useful in detecting MPS after lateral release and indicates that the vastus lateralis muscle has been detached from the patella and that the lateral retinaculum is lax. In this test, the patient is positioned in the lateral decubitus position with the involved knee farthest from the table. In this position, gravity causes the patella to subluxate out of the trochlea. The test is positive for MPS when a voluntary contraction of the quadriceps does not center the patella into the trochlear groove. Patients with MPS without previous lateral release can have the patella subluxate medially in the lateral decubitus position, but it is pulled back into the trochlea with active quadriceps contraction (Figure 1).
Patients with MPS often have lateral patellar laxity (LPL), which allows the patella to rotate upward on the lateral side and skid across the medial facet of the femoral trochlea. A physical examination sign combining lateral patellar glide and tilt was described by Shneider24 to identify LPL. This “lateral patellar float” sign is present when the patella translates laterally and rotates or tilts upward with medial pressure on the patella (Figure 2). Another maneuver to test for subtle MPS involves manually centering the patella in the trochlea during active knee flexion and extension. The involved knee is examined in the seated position. The examiner attempts to center the patella in the trochlea with a laterally directed force from the examiner’s thumb on the medial border of the patella. This will usually provide immediate relief as the patient actively ranges the knee.
Imaging Studies
Diagnostic imaging is a crucial component of the evaluation and treatment decision process. Plain radiographs often are not helpful in diagnosing MPS but may provide additional information.5 A variety of radiographic measurements have been described as indicators of structural disease, but there is a lack of comprehensive information recommending radiographic evaluation and interpretation of patients with patellofemoral dysfunction. It is crucial that orthopedic surgeons have common and consistent radiographic views for plain radiographic assessment that can serve as a basis for accurate diagnosis and surgical decision-making.
Standard knee radiographs should include a standing anteroposterior view of bilateral knees, a standing lateral view of the symptomatic knee in 30° of flexion, a patellar axial view, and a tunnel view. These views, occasionally combined with magnetic resonance imaging (MRI), can yield information vital to surgical decision-making. Image quality is highly technique-dependent, and variability in patient positioning can substantially affect the ability to properly diagnose structural abnormalities. For improved diagnostic accuracy and disease classification, radiographs must be obtained with use of the same standardized imaging protocol.
Kinetic MRI was shown by Shellock and colleagues25 to provide diagnostic information related to patellar malalignment. As kinetic MRI can image the patellofemoral joint within the initial 20° to 30° of flexion, it is useful in detecting some of the more subtle patellar tracking problems. In their study of 43 knees (40 patients) with symptoms after lateral release, Shellock and colleagues25 found that 27 knees (63%) had medial subluxation of the patella as the knee moved from extension to flexion. Furthermore, MPS was noted on the contralateral, unoperated knee in 17 (43%) of the 40 patients.
Diagnostic Arthroscopy
Once MPS is suspected after a thorough history and physical examination, examination under anesthesia accompanied by diagnostic arthroscopy confirms the diagnosis. Lateral forces are applied to the patella in full knee extension and 30° of flexion (Figure 3). During arthroscopy, the patellofemoral compartment is viewed from the anterolateral portal. With the knee at full extension, the lateral laxity and medial tilt of the patella can be identified (Figure 4). As the knee is flexed to 30°, the patella moves medially and can subluxate over the edge of the medial facet of the trochlea (Figure 5).
Treatment
Nonsurgical Management
Treatment of MPS depends entirely on making an accurate diagnosis and determining the degree of impairment. Patients with symptomatic MPS should initially undergo supervised rehabilitation focusing on balancing the medial and lateral forces that influence patellar tracking. Patients should be evaluated for specific muscle tightness, weakness, and biomechanical abnormalities. Each problem should be addressed with an individualized rehabilitation prescription. Emphasis is placed on balance, proprioception, and strengthening of the quadriceps, hip abductors/external rotators, and abdominal core muscle groups.
In some patients, symptomatic MPS may be reduced with a patella-stabilizing brace with a medial buttress.3,5,26 Although bracing should be regarded as an adjuvant to a structured physical therapy program, it can also be helpful in confirming the diagnosis of MPS. Shannon and Keene3 reported that all patients in their study experienced significant pain relief and decreased medial patellar subluxations when they wore a medial patella–stabilizing brace. Shellock and colleagues25 used kinematic MRI to investigate the effect of a patella-realignment brace and found that bracing counteracted patellar subluxation in the majority of knees studied.
Surgical Management
When conservative management fails and patients continue to experience pain and instability, surgical intervention is often required. Although various surgical techniques have been used (Table),3–6,8–10,14,15,27,28 the optimal surgical treatment for MPS has not been identified.
Lateral Retinaculum Imbrication. Lateral retinaculum imbrication has been used to centralize patella tracking and stabilize the patella. Richman and Scheller5 reported on a 17-year-old patient who had isolated medial subluxation of the patella without having undergone a previous lateral release. At 3-month follow-up, there was no recurrent instability; there was only intermittent medial knee soreness with weight-bearing activity.
Lateral Retinaculum Repair/Reconstruction. Hughston and colleagues8 treated 65 knees for MPS. Most had undergone lateral release. Of the 65 knees, 39 were treated with direct repair of the lateral retinaculum, and 26 with reconstruction of the lateral patellotibial ligament using locally available tissue, such as strips of iliotibial band or patellar tendon. Results were good to excellent in 80% of patients at a mean follow-up of 53.7 months. Nonweiler and DeLee6 reconstructed the lateral retinaculum in 5 patients with MPS that developed after isolated lateral retinacular release. Four (80%) of the 5 patients had no symptoms or physical signs of instability at a mean follow-up of 3.3 years. Results were excellent (3 knees) and good (2 knees) according to the Merchant and Mercer rating scale. Akşahin and colleagues28 reported on a single case of spontaneous medial patellar instability. At surgery, imbrication of the lateral structures failed to prevent the medial subluxation. Lateral patellotibial ligament augmentation was performed using an iliotibial band flap that effectively corrected the instability. At 1 year, the patient was characterized as engaging in vigorous recreational activity, according to the clinical score defined by Hughston and colleagues.8 He had mild pain with competitive sports but no pain with daily activity. Abhaykumar and Craig9 reported on 4 surgically treated knees with medial instability. They reconstructed the lateral retinaculum using a strip of fascia lata. By follow-up (5-7 years), each knee had its instability resolved and full ROM restored. Johnson and Wakeley26 reported on a case of iatrogenic MPS after lateral release. Treatment consisted of mobilization and direct repair of the lateral retinaculum. At 12-month follow-up, there was no instability. Although symptom-free with light activity, the patient had patellofemoral pain with strenuous activity. Sanchis-Alfonso and colleagues14 reported the results of isolated lateral retinacular reconstruction for iatrogenic MPS in 17 patients. At mean follow-up of 56 months, results were good or excellent in 65% of patients, and the Lysholm score improved from 36.4 preoperatively to 86.1 postoperatively.
Medial Retinaculum Release. Medial retinaculum release has been used as an alternative to open reconstruction. Shannon and Keene3 reported the results of medial retinacular release procedures on 9 knees. Four (44%) of the 9 patients had either spontaneous or traumatic onset of instability. All cases were treated with arthroscopic medial retinacular release, extending 2 cm medial to the superior pole of the patella down to the anteromedial portal. This avoided releasing the attachment of the vastus medialis oblique muscle to the patella and removing its dynamic medial stabilizing force. At a mean follow-up of 2.7 years, both medial subluxation and knee pain were relieved in all 9 knees without complications or further realignment surgery. Results were excellent in 6 knees (66.7%) and good in 3 knees (33.3%). Shannon and Keene3 emphasized that the procedure should not be used in patients with hypermobile patellae or in cases of failed lateral retinacular releases in which MPS is not clearly and carefully documented.
LPFL Reconstruction. Before coming to our practice, most patients have tried several months of formal physical rehabilitation, medications, and bracing. Many have already had surgical procedures, including arthroscopy, lateral release, and tibial tubercle transfer. When the diagnosis of MPS is suspected after a thorough history and physical examination, LPFL reconstruction is offered. Management of MPS with LPFL reconstruction has yielded excellent and reliable clinical results. Teitge and Torga Spak10 described an LPFL reconstruction technique that is used as a salvage procedure in managing medial iatrogenic patellar instability (the patient’s own quadriceps tendon is used). In their experience, direct repair or imbrication of the lateral retinaculum failed to provide long-term stability because medial excursion usually appeared after 1 year. The 60 patients’ outcomes were excellent with respect to patellar stability, and there were no cases of recurrent subluxation. Borbas and colleagues15 reported a case of LPFL reconstruction in a symptomatic medial subluxated patella resulting from TKA and extended lateral release. Using a free gracilis autograft through patellar bone tunnels to reconstruct the LPFL, the patient was free of pain and very satisfied with the result at 1 year postoperatively. Our current strategy is anatomical reconstruction of the LPFL using a quadriceps tendon graft and no bone tunnels, screws, or anchors in the patella.27 We previously reported a single case of isolated medial instability.4 At 2-year follow-up, there was no recurrent instability, and the functional outcome was excellent. This LPFL reconstruction method has been used in 10 patients with isolated MPS. There has been no residual medial subluxation on follow-up ranging from 3 months to 2 years. Outcome studies are in progress.
Rehabilitation. The initial goal of rehabilitation after surgical reconstruction of the lateral retinaculum or LPFL is to protect the healing soft tissues, restore normal knee ROM, and normalize gait. The knee is immobilized in a brace for weight-bearing activity for 4 to 6 weeks, until limb control is sufficient to prevent rotational stress on the knee. Gradual increase to full weight-bearing without bracing is permitted as quadriceps strength is restored. As motion is regained, strength, balance, and proprioception are emphasized for the entire lower extremity and core.
Functional limb training, including rotational activity, begins at 12 weeks. As strength and neuromuscular control progress, single-leg activity may be started with particular attention to proper alignment of the pelvis and the entire lower extremity. For competitive or recreational athletes, the final stages of rehabilitation focus on dynamic lower extremity control during sport-specific movements. Patients return to unrestricted activity by 6 months to 1 year after surgery.
Summary
MPS is a disabling condition that can limit daily functional activity because of apprehension and pain. Initially described as a complication of lateral retinacular release, isolated MPS can occur in the absence of a previous lateral release. Thorough physical examination and identification during arthroscopy are crucial for proper MPS diagnosis and management. When nonsurgical measures fail, LPFL reconstruction can provide patellofemoral stability and excellent functional outcomes.
1. Marumoto JM, Jordan C, Akins R. A biomechanical comparison of lateral retinacular releases. Am J Sports Med. 1995;23(2):151-155.
2. Betz RR, Magill JT, Lonergan RP. The percutaneous lateral retinacular release. Am J Sports Med. 1987;15(5):477-482.
3. Shannon BD, Keene JS. Results of arthroscopic medial retinacular release for treatment of medial subluxation of the patella. Am J Sports Med. 2007;35(7):1180-1187.
4. Saper MG, Shneider DA. Medial patellar subluxation without previous lateral release: a case report. J Pediatr Orthop B. 2014;23(4):350-353.
5. Richman NM, Scheller AD Jr. Medial subluxation of the patella without previous lateral retinacular release. Orthopedics. 1998;21(7):810-813.
6. Nonweiler DE, DeLee JC. The diagnosis and treatment of medial subluxation of the patella after lateral retinacular release. Am J Sports Med. 1994;22(5):680-686.
7. Hughston JC, Deese M. Medial subluxation of the patella as a complication of lateral retinacular release. Am J Sports Med. 1988;16(4):383-388.
8. Hughston JC, Flandry F, Brinker MR, Terry GC, Mills JC 3rd. Surgical correction of medial subluxation of the patella. Am J Sports Med. 1996;24(4):486-491.
9. Abhaykumar S, Craig DM. Fascia lata sling reconstruction for recurrent medial dislocation of the patella. The Knee. 1999;6(1):55-57.
10. Teitge RA, Torga Spak R. Lateral patellofemoral ligament reconstruction. Arthroscopy. 2004;20(9):998-1002.
11. Kusano M, Horibe S, Tanaka Y, et al. Simultaneous MPFL and LPFL reconstruction for recurrent lateral patellar dislocation with medial patellofemoral instability. Asia-Pac J Sports Med Arthrosc Rehabil Technol. 2014;1:42-46.
12. Saper MG, Shneider DA. Simultaneous medial and lateral patellofemoral ligament reconstruction for combined medial and lateral patellar subluxation. Arthrosc Tech. 2014,3(2):e227-e231.
13. Udagawa K, Niki Y, Matsumoto H, et al. Lateral patellar retinaculum reconstruction for medial patellar instability following lateral retinacular release: a case report. Knee. 2014;21(1):336-339.
14. Sanchis-Alfonso V, Montesinos-Berry E, Monllau JC, Merchant AC. Results of isolated lateral retinacular reconstruction for iatrogenic medial patellar instability. Arthroscopy. 2015;31(3):422-427.
15. Borbas P, Koch PP, Fucentese SF. Lateral patellofemoral ligament reconstruction using a free gracilis autograft. Orthopedics. 2014;37(7):e665-e668.
16. Fulkerson JP, Gossling H. Anatomy of the knee joint lateral retinaculum. Clin Orthop Relat Res. 1980;153:183-188.
17. Kaplan E. Some aspects of functional anatomy of the human knee joint. Clin Orthop Relat Res. 1962;23:18-29.
18. Reider B, Marshall J, Koslin B, Ring B, Girgis F. The anterior aspect of the knee joint. J Bone Joint Surg Am. 1981;63(3):351-356.
19. Navarro MS, Navarro RD, Akita Junior J, Cohen M. Anatomical study of the lateral patellofemoral ligament in cadaver knees. Rev Bras Ortop. 2008;43(7):300-307.
20. Navarro MS, Beltrani Filho CA, Akita Junior J, Navarro RD, Cohen M. Relationship between the lateral patellofemoral ligament and the width of the lateral patellar facet. Acta Ortop Bras. 2010;18(1):19-22.
21. Salsich GB, Ward SR, Terk MR, Powers CM. In vivo assessment of patellofemoral joint contact area in individuals who are pain free. Clin Orthop Relat Res. 2003;417:277-284.
22. Merican AM, Kondo E, Amis AA. The effect on patellofemoral joint stability of selective cutting of lateral retinacular and capsular structures. J Biomech. 2009;42(3):291-296.
23. Vieira EL, Vieira EÁ, da Silva RT, Berlfein PA, Abdalla RJ, Cohen M. An anatomic study of the iliotibial tract. Arthroscopy. 2007;23(3):269-274.
24. Shneider DA. Lateral patellar laxity—identification, significance, treatment. Poster session presented at: Annual Meeting of the American Academy of Orthopaedic Surgeons; February 25-28, 2009; Las Vegas, NV.
25. Shellock FG, Mink JH, Deutsch A, Fox JM, Ferkel RD. Evaluation of patients with persistent symptoms after lateral retinacular release by kinematic magnetic resonance imaging of the patellofemoral joint. Arthroscopy. 1990;6(3):226-234.
26. Johnson DP, Wakeley C. Reconstruction of the lateral patellar retinaculum following lateral release: a case report. Knee Surg Sports Traumatol Arthrosc. 2002;10(6):361-363.
27. Saper MG, Shneider DA. Lateral patellofemoral ligament reconstruction using a quadriceps tendon graft. Arthrosc Tech. 2014;3(4):e445-e448.
28. Akşahin E, Yumrukçal F, Yüksel HY, Doğruyol D, Celebi L. Role of pathophysiology of patellofemoral instability in the treatment of spontaneous medial patellofemoral subluxation: a case report. J Med Case Rep. 2010;4:148.
Study eyes liability associated with implantable devices for chronic pain
SAN DIEGO – The maintenance of implantable drug delivery systems for the management of chronic pain was associated with death, permanent brain damage, or permanent neurological injury from granuloma, and was largely associated with substandard care.
Those are key findings from an analysis of data from the Anesthesia Closed Claims Project that were presented by Dr. Dermot R. Fitzgibbon at the annual meeting of the American Society of Anesthesiologists.
“Implantable devices are relatively new in chronic pain management, and have only been available since the early 1990s,” said Dr. Fitzgibbon, professor of anesthesiology and pain medicine at the University of Washington, Seattle. Such devices are considered advanced techniques for refractory chronic pain and include implantable drug delivery systems, spinal cord stimulators, and peripheral nerve stimulators. Previous studies have demonstrated that morbidity and mortality from implantable drug delivery systems (IDDS) and spinal cord stimulators typically occur during implantation or removal of devices or during device maintenance (Neuromodulation. 2012;15[5]:467-82 and Clin J Pain. 2007;23[2]:180-95). The purpose of the current study was to investigate liability associated with implantable devices used to manage chronic pain.

Dr. Fitzgibbon and his associates used the Anesthesia Closed Claims Project Database to identify 970 claims related to chronic pain that have occurred since 1990. A total of 148 of these claims were related to implantable devices, and the majority of them were for surgical procedures (107 [72%] vs. 41 [28%] for IDDS maintenance).
Of the 107 surgical device procedures, 50% were for an IDDS system, followed by spinal cord stimulator (40%), tunneled epidural (7%), and peripheral nerve stimulator (3%). Temporary minor injury occurred in 74% of the surgical device procedures, followed by permanent cord injury (16%), death/permanent brain damage (8%), and other permanent injury (2%). The most common reasons for permanent spinal cord injury were needle or catheter trauma to the cord (7 cases), epidural hematoma (3 cases), and incorrect placement of the stimulator (2 cases). Infections occurred in 25 of the surgical device procedures. Among these 25 claims, 3 resulted in death or severe permanent injury, 7 involved retained parts and sponges, and 5 were cases of epidural abscess – 4 of which were associated with a tunneled epidural catheter.
Of the 41 damaging events that occurred during IDDS maintenance, 44% were temporary minor injuries, while 32% involved death or permanent brain damage from medication administration errors and 24% involved permanent spinal cord injury, primarily from a delay in recognition of granuloma formation at the catheter tip.
The researchers found that maintenance of IDDS, compared with claims related to other surgical devices, were more commonly associated with a risk of death or permanent damage, less commonly resulted in temporary minor injury, were more likely to have care deemed as substandard, and were more commonly associated with payments (P = .001 for all comparisons). The median payment for all claims was $274,000.
The Anesthesia Closed Claims Project is funded by the Anesthesia Quality Institute. Dr. Fitzgibbon reported having no financial disclosures.
SAN DIEGO – The maintenance of implantable drug delivery systems for the management of chronic pain was associated with death, permanent brain damage, or permanent neurological injury from granuloma, and was largely associated with substandard care.
Those are key findings from an analysis of data from the Anesthesia Closed Claims Project that were presented by Dr. Dermot R. Fitzgibbon at the annual meeting of the American Society of Anesthesiologists.
“Implantable devices are relatively new in chronic pain management, and have only been available since the early 1990s,” said Dr. Fitzgibbon, professor of anesthesiology and pain medicine at the University of Washington, Seattle. Such devices are considered advanced techniques for refractory chronic pain and include implantable drug delivery systems, spinal cord stimulators, and peripheral nerve stimulators. Previous studies have demonstrated that morbidity and mortality from implantable drug delivery systems (IDDS) and spinal cord stimulators typically occur during implantation or removal of devices or during device maintenance (Neuromodulation. 2012;15[5]:467-82 and Clin J Pain. 2007;23[2]:180-95). The purpose of the current study was to investigate liability associated with implantable devices used to manage chronic pain.
Dr. Fitzgibbon and his associates used the Anesthesia Closed Claims Project Database to identify 970 claims related to chronic pain that have occurred since 1990. A total of 148 of these claims were related to implantable devices, and the majority of them were for surgical procedures (107 [72%] vs. 41 [28%] for IDDS maintenance).
Of the 107 surgical device procedures, 50% were for an IDDS system, followed by spinal cord stimulator (40%), tunneled epidural (7%), and peripheral nerve stimulator (3%). Temporary minor injury occurred in 74% of the surgical device procedures, followed by permanent cord injury (16%), death/permanent brain damage (8%), and other permanent injury (2%). The most common reasons for permanent spinal cord injury were needle or catheter trauma to the cord (7 cases), epidural hematoma (3 cases), and incorrect placement of the stimulator (2 cases). Infections occurred in 25 of the surgical device procedures. Among these 25 claims, 3 resulted in death or severe permanent injury, 7 involved retained parts and sponges, and 5 were cases of epidural abscess – 4 of which were associated with a tunneled epidural catheter.
Of the 41 damaging events that occurred during IDDS maintenance, 44% were temporary minor injuries, while 32% involved death or permanent brain damage from medication administration errors and 24% involved permanent spinal cord injury, primarily from a delay in recognition of granuloma formation at the catheter tip.
The researchers found that maintenance of IDDS, compared with claims related to other surgical devices, were more commonly associated with a risk of death or permanent damage, less commonly resulted in temporary minor injury, were more likely to have care deemed as substandard, and were more commonly associated with payments (P = .001 for all comparisons). The median payment for all claims was $274,000.
The Anesthesia Closed Claims Project is funded by the Anesthesia Quality Institute. Dr. Fitzgibbon reported having no financial disclosures.
AT THE ASA ANNUAL MEETING
Key clinical point: Malpractice claims for implantable devices for chronic pain are most often associated with maintenance of implantable drug delivery systems (IDDS) rather than the surgical placement of the devices.
Major finding: Maintenance of IDDS, compared with claims related to other surgical devices, was more commonly associated with a risk of death or permanent damage, less commonly resulted in temporary minor injury, was more likely to have care deemed as substandard, and was more commonly associated with payments (P = .001 for all comparisons).
Data source: An analysis of 970 claims related to chronic pain that have occurred since 1990.
Disclosures: The Anesthesia Closed Claims Project is funded by the Anesthesia Quality Institute. The researchers reported having no financial disclosures.

Biceps Tenodesis and Superior Labrum Anterior to Posterior (SLAP) Tears
Injuries of the superior labrum–biceps complex (SLBC) have been recognized as a cause of shoulder pain since they were first described by Andrews and colleagues1 in 1985. Superior labrum anterior to posterior (SLAP) tears are relatively uncommon injuries of the shoulder, and their true incidence is difficult to establish. However, recently there has been a significant increase in the reported incidence and operative treatment of SLAP tears.2 SLAP tears can occur in isolation, but they are commonly seen in association with other shoulder lesions, including rotator cuff tear, Bankart lesion, glenohumeral arthritis, acromioclavicular joint pathology, and subacromial impingement.
Although SLAP tears are well described and classified,3-6 our understanding of symptomatic SLAP tears and of their contribution to glenohumeral instability is limited. Diagnosing a SLAP tear on the basis of history and physical examination is a clinical challenge. Pain is the most common presentation of SLAP tears, though localization and characterization of pain are variable and nonspecific.7 The mechanism of injury is helpful in acute presentation (traction injury; fall on outstretched, abducted arm), but an overhead athlete may present with no distinct mechanism other than chronic, repetitive use of the shoulder.8-11 Numerous provocative physical examination tests have been used to assist in the diagnosis of SLAP tear, yet there is no consensus regarding the ideal physical examination test, with high sensitivity, specificity, and accuracy.12-14 Magnetic resonance arthrography, the gold standard imaging modality, is highly sensitive and specific (>95%) for diagnosing SLAP tears.
SLAP tear management is based on lesion type and severity, age, functional demands, and presence of coexisting intra-articular lesions. Management options include nonoperative treatment, débridement or repair of SLBC, biceps tenotomy, and biceps tenodesis.15-19
In this 5-point review, we present an evidence-based analysis of the role of the SLBC in glenohumeral stability and the role of biceps tenodesis in the management of SLAP tears.
1. Role of SLBC in stability of glenohumeral joint
The anatomy of the SLBC has been well described,20,21 and there is consensus that SLBC pathology can be a source of shoulder pain. The superior labrum is relatively more mobile than the rest of the glenoid labrum, and it provides attachment to the long head of the biceps tendon (LHBT) and the superior glenohumeral and middle glenohumeral ligaments.
The functional role of the SLBC in glenohumeral stability and its contribution to the pathogenesis of shoulder instability are not clearly defined. Our understanding of SLBC function is largely derived from simulated cadaveric experiments of SLAP tears. Controlled laboratory studies with simulated type II SLAP tears in cadavers have shown significantly increased glenohumeral translation in the anterior-posterior and superior-inferior directions, suggesting a role of the superior labrum in maintaining glenohumeral stability.22-26 Interestingly, there is conflicting evidence regarding restoration of normal glenohumeral translation in cadaveric shoulders after repair of simulated SLAP lesions in the presence or absence of simulated anterior capsular laxity.22,25-27 However, it is important to understand the limitations of cadaveric experiments in order to appreciate and truly comprehend the results of these experiments. There are inconsistencies in the size of simulated type II SLAP lesions in different studies, which can affect the degree of glenohumeral translation and the results of repair.23-25,28 The amount of glenohumeral translation noticed after simulated SLAP tears in cadavers, though statistically significant, is small in amplitude, and its relevance may not translate to a clinically significant level. The impact of dynamic components of stability (eg, rotator cuff muscles), capsular stretch, and other in vivo variables that affect glenohumeral stability are unaccounted for during cadaveric experiments.
LHBT is a recognized cause of shoulder pain, but its contribution to shoulder stability is a point of continued debate. According to one school of thought, LHBT is a vestigial structure that can be sacrificed without any loss of stability. Another school of thought holds that LHBT is an important active stabilizer of the glenohumeral joint. Cadaveric studies have demonstrated that loading the LHBT decreases glenohumeral translation and rotational range of motion, especially in lower and mid ranges of abduction.23,29,30 Furthermore, LHBT contributes to anterior glenohumeral stability by resisting torsional forces in the abducted and externally rotated shoulder and reducing stress on the inferior glenohumeral ligaments.31-33 Strauss and colleagues22 recently found that simulated anterior and posterior type II SLAP lesions in cadaveric shoulders increased glenohumeral translation in all planes, and biceps tenodesis did not further worsen this abnormal glenohumeral translation. Furthermore, repair of posterior SLAP lesions along with biceps tenodesis restored abnormal glenohumeral translation with no significant difference from the baseline in any plane of motion. Again, the limitations of cadaveric studies should be considered when interpreting these results and applying them clinically.
2. Biceps tenodesis as primary treatment for SLAP tears
A growing body of evidence suggests that primary tenodesis of LHBT may be an effective alternative treatment to SLAP repairs in select patients.34-36 However, the evidence is weak, and high-quality studies comparing SLAP repair and primary biceps tenodesis are required in order to make a strong recommendation for one technique over another. Gupta and colleagues35 retrospectively analyzed 28 cases of concomitant SLAP tear and biceps tendonitis treated with primary open subpectoral biceps tenodesis. There was significant improvement in patients’ functional outcome scores postoperatively [SANE (Single Assessment Numeric Evaluation), ASES (American Shoulder and Elbow Surgeons shoulder index), SST (Simple Shoulder Test), VAS (visual analog scale), and SF-12 (Short Form-12)]. In addition, 80% of patients were satisfied with their outcome. Mean age was 43.7 years. Forty-two percent of patients had a worker’s compensation claim. Interestingly, 15 patients in this cohort had a type I SLAP tear. Boileau and colleagues34 prospectively followed 25 cases of type II SLAP tear treated with either SLAP repair (10 patients; mean age, 37 years) or primary arthroscopic biceps tenodesis (15 patients; mean age, 52 years). Compared with the SLAP repair group, the biceps tenodesis group had significantly higher rates of satisfaction and return to previous level of sports participation. However, group assignments were nonrandomized, and the decision to treat a patient with SLAP repair versus biceps tenodesis was made by the senior surgeon purely on the basis of age (SLAP repair for patients under 30 years). Ek and colleagues36 retrospectively compared the cases of 10 patients who underwent SLAP repair (mean age, 32 years) and 15 who underwent biceps tenodesis (mean age, 47 years) for type II SLAP tear. There was no significant difference between the groups with respect to outcome scores, return to play or preinjury activity level, or complications.
There continues to be significant debate as to which patient will benefit from primary SLAP repair versus biceps tenodesis. Multiple factors are involved: age, presence of associated shoulder pathology, occupation, preinjury activity level, and worker’s compensation status. Age has convincingly been shown to affect the outcomes of treatment of type II SLAP tears.34,35,37-40 There is consensus that patients over age 40 years will benefit from primary biceps tenodesis for SLAP tears. However, the evidence for this recommendation is weak.
3. Biceps tenodesis and failed SLAP repair
The definition of a failed SLAP repair is not well documented in the literature, but dissatisfaction after SLAP repair can result from continued shoulder pain, poor shoulder function, or inability to return to preinjury functional level.15,41 The etiologic determination and treatment of a failed SLAP repair are challenging, and outcomes of revision SLAP repair are not very promising.42,43 Biceps tenodesis has been proposed as an alternative treatment to revision SLAP repair for failed SLAP repair. McCormick and colleagues41 prospectively evaluated 42 patients (mean age, 39.2 years; minimum follow-up, 2 years) with failed type II SLAP repairs that were treated with open subpectoral biceps tenodesis. There was significant improvement in ASES, SANE, and Western Ontario Shoulder Instability Index (WOSI) outcome scores and in postoperative shoulder range of motion at a mean follow-up of 3.6 years. One patient had transient musculocutaneous neurapraxia after surgery. In a retrospective cohort study, Gupta and colleagues44 found significant improvement in ASES, SANE, SST, SF-12, and VAS outcome scores in 11 patients who underwent open subpectoral biceps tenodesis for failed arthroscopic SLAP repair (mean age at surgery, 40 years; mean follow-up, 26 months). Three of the 11 patients had worker’s compensation claims, and there were no complications and no revision surgeries required after biceps tenodesis. Werner and colleagues16 retrospectively evaluated 17 patients who underwent biceps tenodesis for failed SLAP repair (mean age, 39 years; minimum follow-up, 2 years). Twenty-nine percent of patients had worker’s compensation claims. Compared with the contralateral shoulder, the treated shoulder had better postoperative ASES, SANE, SST, and Veteran RAND 36-item health survey outcome scores; range of motion was near normal.
There are no high-quality studies comparing revision SLAP repair and biceps tenodesis in the management of failed SLAP repair.16,41-44 Case series studies have found improved outcomes and pain relief after biceps tenodesis for failed SLAP repair, but the quality of evidence has been poor (level IV evidence).16,41-44 The senior author recommends treating failed SLAP repairs with biceps tenodesis.
4. Biceps tenodesis as treatment option for SLAP tear in overhead throwing athletes
Biceps tenodesis is a potential alternative treatment to SLAP repair in overhead throwing athletes. Although outcome scores and satisfaction rates after SLAP repair are high in overhead athletes, the rates of return to sport are relatively low, especially in baseball players.38,45-47 In a level III cohort study, Boileau and colleagues34 found that 13 (87%) of 15 patients with type II SLAP tears, including 8 overhead athletes, had returned to their previous level of activity by a mean of 30 months after biceps tenodesis. In contrast, only 2 of 10 patients returned to their previous level of activity after SLAP repair. Interestingly, 3 patients who underwent biceps tenodesis for failed SLAP repair returned to overhead sports. Schöffl and colleagues48 reported on the outcomes of biceps tenodesis for SLAP lesions in 6 high-level rock climbers. By a mean follow-up of 6 months, all 6 patients had returned to their previous level of climbing. Their satisfaction rate was 96.8%. Gupta and colleagues35 reported on a cohort of 28 patients who underwent biceps tenodesis for SLAP tears and concomitant biceps tendonitis. Of the 8 athletes in the group, 5 were able to return to their previous level of play, and 1 was able to return to a lower level of sporting activity. There was significant improvement from preoperative to postoperative scores on ASES, SST, SANE, VAS, SF-12 overall, and SF-12 components.
Chalmers and colleagues49 recently described motion analyses with simultaneous surface electromyographic measurements in 18 baseball pitchers. Of these 18 players, 7 were uninjured (controls), 6 were pitching after SLAP repair, and 5 were pitching after subpectoral biceps tenodesis. There were no significant differences between controls and postoperative patients with respect to pitching kinematics. Interestingly, compared with the controls and the patients who underwent open biceps tenodesis, the patients who underwent SLAP repair had altered patterns of thoracic rotation during pitching. However, the clinical significance of this finding and the impact of this finding on pitching efficacy are not currently known.
Biceps tenodesis as a primary procedure for type II SLAP lesion in an overhead athlete is a concept in evolution. Increasing evidence suggests a role for primary biceps tenodesis in an overhead athlete with type II SLAP lesion and concomitant biceps pathology. However, this evidence is of poor quality, and the strength of the recommendation is weak. Still to be determined is whether return to preinjury performance level is better with primary biceps tenodesis or with SLAP repair in overhead athletes with type II SLAP lesion. As per the senior author’s treatment algorithm, we prefer SLAP repair for overhead athletes with type II SLAP tears and reserve biceps tenodesis for cases involving significant biceps pathology and/or clinical symptoms involving the bicipital groove consistent with extra-articular biceps pain.
5. Biceps tenodesis for type II SLAP tear in contact athletes and occupations demanding heavy labor (blue-collar jobs)
SLAP tears are less common in contact athletes, and there is general agreement that SLAP repair outcomes are better in contact athletes than in overhead athletes. In a retrospective review of 18 rugby players with SLAP tears, Funk and Snow50 reported excellent results and quicker return to sport after SLAP repair. Patients with isolated SLAP tears had the earliest return to play. Enad and colleagues51 reported SLAP repair outcomes in an active military population. SLAP tears are more common in the military versus the general population because of the unique physical demands placed on military personnel. The authors retrospectively reviewed 27 cases of type II SLAP tears treated with SLAP repair and suture anchors. Outcomes were measured at a mean of 30.5 months after surgery. Twenty-four (89%) of the 27 patients had good to excellent results, and 94% had returned to active duty by a mean of 4.4 months after SLAP repair.
Given the poor-quality evidence in the literature, we believe that biceps tenodesis should be reserved for revision surgery in contact athletes. There is insufficient evidence to recommend biceps tenodesis as primary treatment for type II SLAP tears in contact athletes. SLAP repair should be performed for primary SLAP lesions in contact athletes and for patients in physically demanding professions (eg, military, laborer, weightlifter).
Conclusion
SLAP tears can result in persistent shoulder pain and dysfunction. SLAP tear management depends on lesion type and severity, age, and functional demands. SLAP repair is the treatment of choice for type II SLAP lesions in young, active patients. Biceps tenodesis is a preferred alternative to SLAP repair in failed SLAP repair and in type II SLAP patients who are older than 40 years and who are less active and have a worker’s compensation claim. These recommendations are based on poor-quality evidence. There is an unmet need for randomized clinical studies comparing SLAP repair with biceps tenodesis for type II SLAP tears in different patient populations so as to optimize the current decision-making algorithm for SLAP tears.
1. Andrews JR, Carson WG Jr, McLeod WD. Glenoid labrum tears related to the long head of the biceps. Am J Sports Med. 1985;13(5):337-341.
2. Weber SC, Martin DF, Seiler JG 3rd, Harrast JJ. Superior labrum anterior and posterior lesions of the shoulder: incidence rates, complications, and outcomes as reported by American Board of Orthopaedic Surgery. Part II candidates. Am J Sports Med. 2012;40(7):1538-1543.
3. Snyder SJ, Karzel RP, Del Pizzo W, Ferkel RD, Friedman MJ. SLAP lesions of the shoulder. Arthroscopy. 1990;6(4):274-279.
4. Morgan CD, Burkhart SS, Palmeri M, Gillespie M. Type II SLAP lesions: three subtypes and their relationships to superior instability and rotator cuff tears. Arthroscopy. 1998;14(6):553-565.
5. Powell SE, Nord KD, Ryu RKN. The diagnosis, classification, and treatment of SLAP lesions. Oper Tech Sports Med. 2012;20(1):46-56.
6. Maffet MW, Gartsman GM, Moseley B. Superior labrum-biceps tendon complex lesions of the shoulder. Am J Sports Med. 1995;23(1):93-98.
7. Kim TK, Queale WS, Cosgarea AJ, McFarland EG. Clinical features of the different types of SLAP lesions: an analysis of one hundred and thirty-nine cases. J Bone Joint Surg Am. 2003;85(1):66-71.
8. Abrams GD, Safran MR. Diagnosis and management of superior labrum anterior posterior lesions in overhead athletes. Br J Sports Med. 2010;44(5):311-318.
9. Keener JD, Brophy RH. Superior labral tears of the shoulder: pathogenesis, evaluation, and treatment. J Am Acad Orthop Surg. 2009;17(10):627-637.
10. Abrams GD, Hussey KE, Harris JD, Cole BJ. Clinical results of combined meniscus and femoral osteochondral allograft transplantation: minimum 2-year follow-up. Arthroscopy. 2014;30(8):964-970.e1.
11. Burkhart SS, Morgan CD, Kibler WB. The disabled throwing shoulder: spectrum of pathology part I: pathoanatomy and biomechanics. Arthroscopy. 2003;19(4):404-420.
12. Virk MS, Arciero RA. Superior labrum anterior to posterior tears and glenohumeral instability. Instr Course Lect. 2013;62:501-514.
13. Calvert E, Chambers GK, Regan W, Hawkins RH, Leith JM. Special physical examination tests for superior labrum anterior posterior shoulder tears are clinically limited and invalid: a diagnostic systematic review. J Clin Epidemiol. 2009;62(5):558-563.
14. Jones GL, Galluch DB. Clinical assessment of superior glenoid labral lesions: a systematic review. Clin Orthop Relat Res. 2007;455:45-51.
15. Werner BC, Brockmeier SF, Miller MD. Etiology, diagnosis, and management of failed SLAP repair. J Am Acad Orthop Surg. 2014;22(9):554-565.
16. Werner BC, Pehlivan HC, Hart JM, et al. Biceps tenodesis is a viable option for salvage of failed SLAP repair. J Shoulder Elbow Surg. 2014;23(8):e179-e184.
17. Erickson J, Lavery K, Monica J, Gatt C, Dhawan A. Surgical treatment of symptomatic superior labrum anterior-posterior tears in patients older than 40 years: a systematic review. Am J Sports Med. 2015;43(5):1274-1282.
18. Huri G, Hyun YS, Garbis NG, McFarland EG. Treatment of superior labrum anterior posterior lesions: a literature review. Acta Orthop Traumatol Turc. 2014;48(3):290-297.
19. Li X, Lin TJ, Jager M, et al. Management of type II superior labrum anterior posterior lesions: a review of the literature. Orthop Rev. 2010;2(1):e6.
20. Cooper DE, Arnoczky SP, O’Brien SJ, Warren RF, DiCarlo E, Allen AA. Anatomy, histology, and vascularity of the glenoid labrum. An anatomical study. J Bone Joint Surg Am. 1992;74(1):46-52.
21. Vangsness CT, Jorgenson SS, Watson T, Johnson DL. The origin of the long head of the biceps from the scapula and glenoid labrum. An anatomical study of 100 shoulders. J Bone Joint Surg Br. 1994;76(6):951-954.
22. Strauss EJ, Salata MJ, Sershon RA, et al. Role of the superior labrum after biceps tenodesis in glenohumeral stability. J Shoulder Elbow Surg. 2014;23(4):485-491.
23. Pagnani MJ, Deng XH, Warren RF, Torzilli PA, Altchek DW. Effect of lesions of the superior portion of the glenoid labrum on glenohumeral translation. J Bone Joint Surg Am. 1995;77(7):1003-1010.
24. McMahon PJ, Burkart A, Musahl V, Debski RE. Glenohumeral translations are increased after a type II superior labrum anterior-posterior lesion: a cadaveric study of severity of passive stabilizer injury. J Shoulder Elbow Surg. 2004;13(1):39-44.
25. Burkart A, Debski R, Musahl V, McMahon P, Woo SL. Biomechanical tests for type II SLAP lesions of the shoulder joint before and after arthroscopic repair [in German]. Orthopade. 2003;32(7):600-607.
26. Panossian VR, Mihata T, Tibone JE, Fitzpatrick MJ, McGarry MH, Lee TQ. Biomechanical analysis of isolated type II SLAP lesions and repair. J Shoulder Elbow Surg. 2005;14(5):529-534.
27. Mihata T, McGarry MH, Tibone JE, Fitzpatrick MJ, Kinoshita M, Lee TQ. Biomechanical assessment of type II superior labral anterior-posterior (SLAP) lesions associated with anterior shoulder capsular laxity as seen in throwers: a cadaveric study. Am J Sports Med. 2008;36(8):1604-1610.
28. Youm T, Tibone JE, ElAttrache NS, McGarry MH, Lee TQ. Simulated type II superior labral anterior posterior lesions do not alter the path of glenohumeral articulation: a cadaveric biomechanical study. Am J Sports Med. 2008;36(4):767-774.
29. Youm T, ElAttrache NS, Tibone JE, McGarry MH, Lee TQ. The effect of the long head of the biceps on glenohumeral kinematics. J Shoulder Elbow Surg. 2009;18(1):122-129.
30. McGarry MH, Nguyen ML, Quigley RJ, Hanypsiak B, Gupta R, Lee TQ. The effect of long and short head biceps loading on glenohumeral joint rotational range of motion and humeral head position [published online ahead of print September 26, 2014]. Knee Surg Sports Traumatol Arthrosc.
31. Glousman R, Jobe F, Tibone J, Moynes D, Antonelli D, Perry J. Dynamic electromyographic analysis of the throwing shoulder with glenohumeral instability. J Bone Joint Surg Am. 1988;70(2):220-226.
32. Gowan ID, Jobe FW, Tibone JE, Perry J, Moynes DR. A comparative electromyographic analysis of the shoulder during pitching. Professional versus amateur pitchers. Am J Sports Med. 1987;15(6):586-590.
33. Rodosky MW, Harner CD, Fu FH. The role of the long head of the biceps muscle and superior glenoid labrum in anterior stability of the shoulder. Am J Sports Med. 1994;22(1):121-130.
34. Boileau P, Parratte S, Chuinard C, Roussanne Y, Shia D, Bicknell R. Arthroscopic treatment of isolated type II SLAP lesions: biceps tenodesis as an alternative to reinsertion. Am J Sports Med. 2009;37(5):929-936.
35. Gupta AK, Chalmers PN, Klosterman EL, et al. Subpectoral biceps tenodesis for bicipital tendonitis with SLAP tear. Orthopedics. 2015;38(1):e48-e53.
36. Ek ET, Shi LL, Tompson JD, Freehill MT, Warner JJ. Surgical treatment of isolated type II superior labrum anterior-posterior (SLAP) lesions: repair versus biceps tenodesis. J Shoulder Elbow Surg. 2014;23(7):1059-1065.
37. Alpert JM, Wuerz TH, O’Donnell TF, Carroll KM, Brucker NN, Gill TJ. The effect of age on the outcomes of arthroscopic repair of type II superior labral anterior and posterior lesions. Am J Sports Med. 2010;38(11):2299-2303.
38. Provencher MT, McCormick F, Dewing C, McIntire S, Solomon D. A prospective analysis of 179 type 2 superior labrum anterior and posterior repairs: outcomes and factors associated with success and failure. Am J Sports Med. 2013;41(4):880-886.
39. Denard PJ, Lädermann A, Burkhart SS. Long-term outcome after arthroscopic repair of type II SLAP lesions: results according to age and workers’ compensation status. Arthroscopy. 2012;28(4):451-457.
40. Burns JP, Bahk M, Snyder SJ. Superior labral tears: repair versus biceps tenodesis. J Shoulder Elbow Surg. 2011;20(2 suppl):S2-S8.
41. McCormick F, Nwachukwu BU, Solomon D, et al. The efficacy of biceps tenodesis in the treatment of failed superior labral anterior posterior repairs. Am J Sports Med. 2014;42(4):820-825.
42. Katz LM, Hsu S, Miller SL, et al. Poor outcomes after SLAP repair: descriptive analysis and prognosis. Arthroscopy. 2009;25(8):849-855.
43. Park S, Glousman RE. Outcomes of revision arthroscopic type II superior labral anterior posterior repairs. Am J Sports Med. 2011;39(6):1290-1294.
44. Gupta AK, Bruce B, Klosterman EL, McCormick F, Harris J, Romeo AA. Subpectoral biceps tenodesis for failed type II SLAP repair. Orthopedics. 2013;36(6):e723-e728.
45. Neuman BJ, Boisvert CB, Reiter B, Lawson K, Ciccotti MG, Cohen SB. Results of arthroscopic repair of type II superior labral anterior posterior lesions in overhead athletes: assessment of return to preinjury playing level and satisfaction. Am J Sports Med. 2011;39(9):1883-1888.
46. Fedoriw WW, Ramkumar P, McCulloch PC, Lintner DM. Return to play after treatment of superior labral tears in professional baseball players. Am J Sports Med. 2014;42(5):1155-1160.
47. Park JY, Chung SW, Jeon SH, Lee JG, Oh KS. Clinical and radiological outcomes of type 2 superior labral anterior posterior repairs in elite overhead athletes. Am J Sports Med. 2013;41(6):1372-1379.
48. Schöffl V, Popp D, Dickschass J, Küpper T. Superior labral anterior-posterior lesions in rock climbers—primary double tenodesis? Clin J Sport Med. 2011;21(3):261-263.
49. Chalmers PN, Trombley R, Cip J, et al. Postoperative restoration of upper extremity motion and neuromuscular control during the overhand pitch: evaluation of tenodesis and repair for superior labral anterior-posterior tears. Am J Sports Med. 2014;42(12):2825-2836.
50. Funk L, Snow M. SLAP tears of the glenoid labrum in contact athletes. Clin J Sport Med. 2007;17(1):1-4.
51. Enad JG, Gaines RJ, White SM, Kurtz CA. Arthroscopic superior labrum anterior-posterior repair in military patients. J Shoulder Elbow Surg. 2007;16(3):300-305.
Injuries of the superior labrum–biceps complex (SLBC) have been recognized as a cause of shoulder pain since they were first described by Andrews and colleagues1 in 1985. Superior labrum anterior to posterior (SLAP) tears are relatively uncommon injuries of the shoulder, and their true incidence is difficult to establish. However, recently there has been a significant increase in the reported incidence and operative treatment of SLAP tears.2 SLAP tears can occur in isolation, but they are commonly seen in association with other shoulder lesions, including rotator cuff tear, Bankart lesion, glenohumeral arthritis, acromioclavicular joint pathology, and subacromial impingement.
Although SLAP tears are well described and classified,3-6 our understanding of symptomatic SLAP tears and of their contribution to glenohumeral instability is limited. Diagnosing a SLAP tear on the basis of history and physical examination is a clinical challenge. Pain is the most common presentation of SLAP tears, though localization and characterization of pain are variable and nonspecific.7 The mechanism of injury is helpful in acute presentation (traction injury; fall on outstretched, abducted arm), but an overhead athlete may present with no distinct mechanism other than chronic, repetitive use of the shoulder.8-11 Numerous provocative physical examination tests have been used to assist in the diagnosis of SLAP tear, yet there is no consensus regarding the ideal physical examination test, with high sensitivity, specificity, and accuracy.12-14 Magnetic resonance arthrography, the gold standard imaging modality, is highly sensitive and specific (>95%) for diagnosing SLAP tears.
SLAP tear management is based on lesion type and severity, age, functional demands, and presence of coexisting intra-articular lesions. Management options include nonoperative treatment, débridement or repair of SLBC, biceps tenotomy, and biceps tenodesis.15-19
In this 5-point review, we present an evidence-based analysis of the role of the SLBC in glenohumeral stability and the role of biceps tenodesis in the management of SLAP tears.
1. Role of SLBC in stability of glenohumeral joint
The anatomy of the SLBC has been well described,20,21 and there is consensus that SLBC pathology can be a source of shoulder pain. The superior labrum is relatively more mobile than the rest of the glenoid labrum, and it provides attachment to the long head of the biceps tendon (LHBT) and the superior glenohumeral and middle glenohumeral ligaments.
The functional role of the SLBC in glenohumeral stability and its contribution to the pathogenesis of shoulder instability are not clearly defined. Our understanding of SLBC function is largely derived from simulated cadaveric experiments of SLAP tears. Controlled laboratory studies with simulated type II SLAP tears in cadavers have shown significantly increased glenohumeral translation in the anterior-posterior and superior-inferior directions, suggesting a role of the superior labrum in maintaining glenohumeral stability.22-26 Interestingly, there is conflicting evidence regarding restoration of normal glenohumeral translation in cadaveric shoulders after repair of simulated SLAP lesions in the presence or absence of simulated anterior capsular laxity.22,25-27 However, it is important to understand the limitations of cadaveric experiments in order to appreciate and truly comprehend the results of these experiments. There are inconsistencies in the size of simulated type II SLAP lesions in different studies, which can affect the degree of glenohumeral translation and the results of repair.23-25,28 The amount of glenohumeral translation noticed after simulated SLAP tears in cadavers, though statistically significant, is small in amplitude, and its relevance may not translate to a clinically significant level. The impact of dynamic components of stability (eg, rotator cuff muscles), capsular stretch, and other in vivo variables that affect glenohumeral stability are unaccounted for during cadaveric experiments.
LHBT is a recognized cause of shoulder pain, but its contribution to shoulder stability is a point of continued debate. According to one school of thought, LHBT is a vestigial structure that can be sacrificed without any loss of stability. Another school of thought holds that LHBT is an important active stabilizer of the glenohumeral joint. Cadaveric studies have demonstrated that loading the LHBT decreases glenohumeral translation and rotational range of motion, especially in lower and mid ranges of abduction.23,29,30 Furthermore, LHBT contributes to anterior glenohumeral stability by resisting torsional forces in the abducted and externally rotated shoulder and reducing stress on the inferior glenohumeral ligaments.31-33 Strauss and colleagues22 recently found that simulated anterior and posterior type II SLAP lesions in cadaveric shoulders increased glenohumeral translation in all planes, and biceps tenodesis did not further worsen this abnormal glenohumeral translation. Furthermore, repair of posterior SLAP lesions along with biceps tenodesis restored abnormal glenohumeral translation with no significant difference from the baseline in any plane of motion. Again, the limitations of cadaveric studies should be considered when interpreting these results and applying them clinically.
2. Biceps tenodesis as primary treatment for SLAP tears
A growing body of evidence suggests that primary tenodesis of LHBT may be an effective alternative treatment to SLAP repairs in select patients.34-36 However, the evidence is weak, and high-quality studies comparing SLAP repair and primary biceps tenodesis are required in order to make a strong recommendation for one technique over another. Gupta and colleagues35 retrospectively analyzed 28 cases of concomitant SLAP tear and biceps tendonitis treated with primary open subpectoral biceps tenodesis. There was significant improvement in patients’ functional outcome scores postoperatively [SANE (Single Assessment Numeric Evaluation), ASES (American Shoulder and Elbow Surgeons shoulder index), SST (Simple Shoulder Test), VAS (visual analog scale), and SF-12 (Short Form-12)]. In addition, 80% of patients were satisfied with their outcome. Mean age was 43.7 years. Forty-two percent of patients had a worker’s compensation claim. Interestingly, 15 patients in this cohort had a type I SLAP tear. Boileau and colleagues34 prospectively followed 25 cases of type II SLAP tear treated with either SLAP repair (10 patients; mean age, 37 years) or primary arthroscopic biceps tenodesis (15 patients; mean age, 52 years). Compared with the SLAP repair group, the biceps tenodesis group had significantly higher rates of satisfaction and return to previous level of sports participation. However, group assignments were nonrandomized, and the decision to treat a patient with SLAP repair versus biceps tenodesis was made by the senior surgeon purely on the basis of age (SLAP repair for patients under 30 years). Ek and colleagues36 retrospectively compared the cases of 10 patients who underwent SLAP repair (mean age, 32 years) and 15 who underwent biceps tenodesis (mean age, 47 years) for type II SLAP tear. There was no significant difference between the groups with respect to outcome scores, return to play or preinjury activity level, or complications.
There continues to be significant debate as to which patient will benefit from primary SLAP repair versus biceps tenodesis. Multiple factors are involved: age, presence of associated shoulder pathology, occupation, preinjury activity level, and worker’s compensation status. Age has convincingly been shown to affect the outcomes of treatment of type II SLAP tears.34,35,37-40 There is consensus that patients over age 40 years will benefit from primary biceps tenodesis for SLAP tears. However, the evidence for this recommendation is weak.
3. Biceps tenodesis and failed SLAP repair
The definition of a failed SLAP repair is not well documented in the literature, but dissatisfaction after SLAP repair can result from continued shoulder pain, poor shoulder function, or inability to return to preinjury functional level.15,41 The etiologic determination and treatment of a failed SLAP repair are challenging, and outcomes of revision SLAP repair are not very promising.42,43 Biceps tenodesis has been proposed as an alternative treatment to revision SLAP repair for failed SLAP repair. McCormick and colleagues41 prospectively evaluated 42 patients (mean age, 39.2 years; minimum follow-up, 2 years) with failed type II SLAP repairs that were treated with open subpectoral biceps tenodesis. There was significant improvement in ASES, SANE, and Western Ontario Shoulder Instability Index (WOSI) outcome scores and in postoperative shoulder range of motion at a mean follow-up of 3.6 years. One patient had transient musculocutaneous neurapraxia after surgery. In a retrospective cohort study, Gupta and colleagues44 found significant improvement in ASES, SANE, SST, SF-12, and VAS outcome scores in 11 patients who underwent open subpectoral biceps tenodesis for failed arthroscopic SLAP repair (mean age at surgery, 40 years; mean follow-up, 26 months). Three of the 11 patients had worker’s compensation claims, and there were no complications and no revision surgeries required after biceps tenodesis. Werner and colleagues16 retrospectively evaluated 17 patients who underwent biceps tenodesis for failed SLAP repair (mean age, 39 years; minimum follow-up, 2 years). Twenty-nine percent of patients had worker’s compensation claims. Compared with the contralateral shoulder, the treated shoulder had better postoperative ASES, SANE, SST, and Veteran RAND 36-item health survey outcome scores; range of motion was near normal.
There are no high-quality studies comparing revision SLAP repair and biceps tenodesis in the management of failed SLAP repair.16,41-44 Case series studies have found improved outcomes and pain relief after biceps tenodesis for failed SLAP repair, but the quality of evidence has been poor (level IV evidence).16,41-44 The senior author recommends treating failed SLAP repairs with biceps tenodesis.
4. Biceps tenodesis as treatment option for SLAP tear in overhead throwing athletes
Biceps tenodesis is a potential alternative treatment to SLAP repair in overhead throwing athletes. Although outcome scores and satisfaction rates after SLAP repair are high in overhead athletes, the rates of return to sport are relatively low, especially in baseball players.38,45-47 In a level III cohort study, Boileau and colleagues34 found that 13 (87%) of 15 patients with type II SLAP tears, including 8 overhead athletes, had returned to their previous level of activity by a mean of 30 months after biceps tenodesis. In contrast, only 2 of 10 patients returned to their previous level of activity after SLAP repair. Interestingly, 3 patients who underwent biceps tenodesis for failed SLAP repair returned to overhead sports. Schöffl and colleagues48 reported on the outcomes of biceps tenodesis for SLAP lesions in 6 high-level rock climbers. By a mean follow-up of 6 months, all 6 patients had returned to their previous level of climbing. Their satisfaction rate was 96.8%. Gupta and colleagues35 reported on a cohort of 28 patients who underwent biceps tenodesis for SLAP tears and concomitant biceps tendonitis. Of the 8 athletes in the group, 5 were able to return to their previous level of play, and 1 was able to return to a lower level of sporting activity. There was significant improvement from preoperative to postoperative scores on ASES, SST, SANE, VAS, SF-12 overall, and SF-12 components.
Chalmers and colleagues49 recently described motion analyses with simultaneous surface electromyographic measurements in 18 baseball pitchers. Of these 18 players, 7 were uninjured (controls), 6 were pitching after SLAP repair, and 5 were pitching after subpectoral biceps tenodesis. There were no significant differences between controls and postoperative patients with respect to pitching kinematics. Interestingly, compared with the controls and the patients who underwent open biceps tenodesis, the patients who underwent SLAP repair had altered patterns of thoracic rotation during pitching. However, the clinical significance of this finding and the impact of this finding on pitching efficacy are not currently known.
Biceps tenodesis as a primary procedure for type II SLAP lesion in an overhead athlete is a concept in evolution. Increasing evidence suggests a role for primary biceps tenodesis in an overhead athlete with type II SLAP lesion and concomitant biceps pathology. However, this evidence is of poor quality, and the strength of the recommendation is weak. Still to be determined is whether return to preinjury performance level is better with primary biceps tenodesis or with SLAP repair in overhead athletes with type II SLAP lesion. As per the senior author’s treatment algorithm, we prefer SLAP repair for overhead athletes with type II SLAP tears and reserve biceps tenodesis for cases involving significant biceps pathology and/or clinical symptoms involving the bicipital groove consistent with extra-articular biceps pain.
5. Biceps tenodesis for type II SLAP tear in contact athletes and occupations demanding heavy labor (blue-collar jobs)
SLAP tears are less common in contact athletes, and there is general agreement that SLAP repair outcomes are better in contact athletes than in overhead athletes. In a retrospective review of 18 rugby players with SLAP tears, Funk and Snow50 reported excellent results and quicker return to sport after SLAP repair. Patients with isolated SLAP tears had the earliest return to play. Enad and colleagues51 reported SLAP repair outcomes in an active military population. SLAP tears are more common in the military versus the general population because of the unique physical demands placed on military personnel. The authors retrospectively reviewed 27 cases of type II SLAP tears treated with SLAP repair and suture anchors. Outcomes were measured at a mean of 30.5 months after surgery. Twenty-four (89%) of the 27 patients had good to excellent results, and 94% had returned to active duty by a mean of 4.4 months after SLAP repair.
Given the poor-quality evidence in the literature, we believe that biceps tenodesis should be reserved for revision surgery in contact athletes. There is insufficient evidence to recommend biceps tenodesis as primary treatment for type II SLAP tears in contact athletes. SLAP repair should be performed for primary SLAP lesions in contact athletes and for patients in physically demanding professions (eg, military, laborer, weightlifter).
Conclusion
SLAP tears can result in persistent shoulder pain and dysfunction. SLAP tear management depends on lesion type and severity, age, and functional demands. SLAP repair is the treatment of choice for type II SLAP lesions in young, active patients. Biceps tenodesis is a preferred alternative to SLAP repair in failed SLAP repair and in type II SLAP patients who are older than 40 years and who are less active and have a worker’s compensation claim. These recommendations are based on poor-quality evidence. There is an unmet need for randomized clinical studies comparing SLAP repair with biceps tenodesis for type II SLAP tears in different patient populations so as to optimize the current decision-making algorithm for SLAP tears.
1. Andrews JR, Carson WG Jr, McLeod WD. Glenoid labrum tears related to the long head of the biceps. Am J Sports Med. 1985;13(5):337-341.
2. Weber SC, Martin DF, Seiler JG 3rd, Harrast JJ. Superior labrum anterior and posterior lesions of the shoulder: incidence rates, complications, and outcomes as reported by American Board of Orthopaedic Surgery. Part II candidates. Am J Sports Med. 2012;40(7):1538-1543.
3. Snyder SJ, Karzel RP, Del Pizzo W, Ferkel RD, Friedman MJ. SLAP lesions of the shoulder. Arthroscopy. 1990;6(4):274-279.
4. Morgan CD, Burkhart SS, Palmeri M, Gillespie M. Type II SLAP lesions: three subtypes and their relationships to superior instability and rotator cuff tears. Arthroscopy. 1998;14(6):553-565.
5. Powell SE, Nord KD, Ryu RKN. The diagnosis, classification, and treatment of SLAP lesions. Oper Tech Sports Med. 2012;20(1):46-56.
6. Maffet MW, Gartsman GM, Moseley B. Superior labrum-biceps tendon complex lesions of the shoulder. Am J Sports Med. 1995;23(1):93-98.
7. Kim TK, Queale WS, Cosgarea AJ, McFarland EG. Clinical features of the different types of SLAP lesions: an analysis of one hundred and thirty-nine cases. J Bone Joint Surg Am. 2003;85(1):66-71.
8. Abrams GD, Safran MR. Diagnosis and management of superior labrum anterior posterior lesions in overhead athletes. Br J Sports Med. 2010;44(5):311-318.
9. Keener JD, Brophy RH. Superior labral tears of the shoulder: pathogenesis, evaluation, and treatment. J Am Acad Orthop Surg. 2009;17(10):627-637.
10. Abrams GD, Hussey KE, Harris JD, Cole BJ. Clinical results of combined meniscus and femoral osteochondral allograft transplantation: minimum 2-year follow-up. Arthroscopy. 2014;30(8):964-970.e1.
11. Burkhart SS, Morgan CD, Kibler WB. The disabled throwing shoulder: spectrum of pathology part I: pathoanatomy and biomechanics. Arthroscopy. 2003;19(4):404-420.
12. Virk MS, Arciero RA. Superior labrum anterior to posterior tears and glenohumeral instability. Instr Course Lect. 2013;62:501-514.
13. Calvert E, Chambers GK, Regan W, Hawkins RH, Leith JM. Special physical examination tests for superior labrum anterior posterior shoulder tears are clinically limited and invalid: a diagnostic systematic review. J Clin Epidemiol. 2009;62(5):558-563.
14. Jones GL, Galluch DB. Clinical assessment of superior glenoid labral lesions: a systematic review. Clin Orthop Relat Res. 2007;455:45-51.
15. Werner BC, Brockmeier SF, Miller MD. Etiology, diagnosis, and management of failed SLAP repair. J Am Acad Orthop Surg. 2014;22(9):554-565.
16. Werner BC, Pehlivan HC, Hart JM, et al. Biceps tenodesis is a viable option for salvage of failed SLAP repair. J Shoulder Elbow Surg. 2014;23(8):e179-e184.
17. Erickson J, Lavery K, Monica J, Gatt C, Dhawan A. Surgical treatment of symptomatic superior labrum anterior-posterior tears in patients older than 40 years: a systematic review. Am J Sports Med. 2015;43(5):1274-1282.
18. Huri G, Hyun YS, Garbis NG, McFarland EG. Treatment of superior labrum anterior posterior lesions: a literature review. Acta Orthop Traumatol Turc. 2014;48(3):290-297.
19. Li X, Lin TJ, Jager M, et al. Management of type II superior labrum anterior posterior lesions: a review of the literature. Orthop Rev. 2010;2(1):e6.
20. Cooper DE, Arnoczky SP, O’Brien SJ, Warren RF, DiCarlo E, Allen AA. Anatomy, histology, and vascularity of the glenoid labrum. An anatomical study. J Bone Joint Surg Am. 1992;74(1):46-52.
21. Vangsness CT, Jorgenson SS, Watson T, Johnson DL. The origin of the long head of the biceps from the scapula and glenoid labrum. An anatomical study of 100 shoulders. J Bone Joint Surg Br. 1994;76(6):951-954.
22. Strauss EJ, Salata MJ, Sershon RA, et al. Role of the superior labrum after biceps tenodesis in glenohumeral stability. J Shoulder Elbow Surg. 2014;23(4):485-491.
23. Pagnani MJ, Deng XH, Warren RF, Torzilli PA, Altchek DW. Effect of lesions of the superior portion of the glenoid labrum on glenohumeral translation. J Bone Joint Surg Am. 1995;77(7):1003-1010.
24. McMahon PJ, Burkart A, Musahl V, Debski RE. Glenohumeral translations are increased after a type II superior labrum anterior-posterior lesion: a cadaveric study of severity of passive stabilizer injury. J Shoulder Elbow Surg. 2004;13(1):39-44.
25. Burkart A, Debski R, Musahl V, McMahon P, Woo SL. Biomechanical tests for type II SLAP lesions of the shoulder joint before and after arthroscopic repair [in German]. Orthopade. 2003;32(7):600-607.
26. Panossian VR, Mihata T, Tibone JE, Fitzpatrick MJ, McGarry MH, Lee TQ. Biomechanical analysis of isolated type II SLAP lesions and repair. J Shoulder Elbow Surg. 2005;14(5):529-534.
27. Mihata T, McGarry MH, Tibone JE, Fitzpatrick MJ, Kinoshita M, Lee TQ. Biomechanical assessment of type II superior labral anterior-posterior (SLAP) lesions associated with anterior shoulder capsular laxity as seen in throwers: a cadaveric study. Am J Sports Med. 2008;36(8):1604-1610.
28. Youm T, Tibone JE, ElAttrache NS, McGarry MH, Lee TQ. Simulated type II superior labral anterior posterior lesions do not alter the path of glenohumeral articulation: a cadaveric biomechanical study. Am J Sports Med. 2008;36(4):767-774.
29. Youm T, ElAttrache NS, Tibone JE, McGarry MH, Lee TQ. The effect of the long head of the biceps on glenohumeral kinematics. J Shoulder Elbow Surg. 2009;18(1):122-129.
30. McGarry MH, Nguyen ML, Quigley RJ, Hanypsiak B, Gupta R, Lee TQ. The effect of long and short head biceps loading on glenohumeral joint rotational range of motion and humeral head position [published online ahead of print September 26, 2014]. Knee Surg Sports Traumatol Arthrosc.
31. Glousman R, Jobe F, Tibone J, Moynes D, Antonelli D, Perry J. Dynamic electromyographic analysis of the throwing shoulder with glenohumeral instability. J Bone Joint Surg Am. 1988;70(2):220-226.
32. Gowan ID, Jobe FW, Tibone JE, Perry J, Moynes DR. A comparative electromyographic analysis of the shoulder during pitching. Professional versus amateur pitchers. Am J Sports Med. 1987;15(6):586-590.
33. Rodosky MW, Harner CD, Fu FH. The role of the long head of the biceps muscle and superior glenoid labrum in anterior stability of the shoulder. Am J Sports Med. 1994;22(1):121-130.
34. Boileau P, Parratte S, Chuinard C, Roussanne Y, Shia D, Bicknell R. Arthroscopic treatment of isolated type II SLAP lesions: biceps tenodesis as an alternative to reinsertion. Am J Sports Med. 2009;37(5):929-936.
35. Gupta AK, Chalmers PN, Klosterman EL, et al. Subpectoral biceps tenodesis for bicipital tendonitis with SLAP tear. Orthopedics. 2015;38(1):e48-e53.
36. Ek ET, Shi LL, Tompson JD, Freehill MT, Warner JJ. Surgical treatment of isolated type II superior labrum anterior-posterior (SLAP) lesions: repair versus biceps tenodesis. J Shoulder Elbow Surg. 2014;23(7):1059-1065.
37. Alpert JM, Wuerz TH, O’Donnell TF, Carroll KM, Brucker NN, Gill TJ. The effect of age on the outcomes of arthroscopic repair of type II superior labral anterior and posterior lesions. Am J Sports Med. 2010;38(11):2299-2303.
38. Provencher MT, McCormick F, Dewing C, McIntire S, Solomon D. A prospective analysis of 179 type 2 superior labrum anterior and posterior repairs: outcomes and factors associated with success and failure. Am J Sports Med. 2013;41(4):880-886.
39. Denard PJ, Lädermann A, Burkhart SS. Long-term outcome after arthroscopic repair of type II SLAP lesions: results according to age and workers’ compensation status. Arthroscopy. 2012;28(4):451-457.
40. Burns JP, Bahk M, Snyder SJ. Superior labral tears: repair versus biceps tenodesis. J Shoulder Elbow Surg. 2011;20(2 suppl):S2-S8.
41. McCormick F, Nwachukwu BU, Solomon D, et al. The efficacy of biceps tenodesis in the treatment of failed superior labral anterior posterior repairs. Am J Sports Med. 2014;42(4):820-825.
42. Katz LM, Hsu S, Miller SL, et al. Poor outcomes after SLAP repair: descriptive analysis and prognosis. Arthroscopy. 2009;25(8):849-855.
43. Park S, Glousman RE. Outcomes of revision arthroscopic type II superior labral anterior posterior repairs. Am J Sports Med. 2011;39(6):1290-1294.
44. Gupta AK, Bruce B, Klosterman EL, McCormick F, Harris J, Romeo AA. Subpectoral biceps tenodesis for failed type II SLAP repair. Orthopedics. 2013;36(6):e723-e728.
45. Neuman BJ, Boisvert CB, Reiter B, Lawson K, Ciccotti MG, Cohen SB. Results of arthroscopic repair of type II superior labral anterior posterior lesions in overhead athletes: assessment of return to preinjury playing level and satisfaction. Am J Sports Med. 2011;39(9):1883-1888.
46. Fedoriw WW, Ramkumar P, McCulloch PC, Lintner DM. Return to play after treatment of superior labral tears in professional baseball players. Am J Sports Med. 2014;42(5):1155-1160.
47. Park JY, Chung SW, Jeon SH, Lee JG, Oh KS. Clinical and radiological outcomes of type 2 superior labral anterior posterior repairs in elite overhead athletes. Am J Sports Med. 2013;41(6):1372-1379.
48. Schöffl V, Popp D, Dickschass J, Küpper T. Superior labral anterior-posterior lesions in rock climbers—primary double tenodesis? Clin J Sport Med. 2011;21(3):261-263.
49. Chalmers PN, Trombley R, Cip J, et al. Postoperative restoration of upper extremity motion and neuromuscular control during the overhand pitch: evaluation of tenodesis and repair for superior labral anterior-posterior tears. Am J Sports Med. 2014;42(12):2825-2836.
50. Funk L, Snow M. SLAP tears of the glenoid labrum in contact athletes. Clin J Sport Med. 2007;17(1):1-4.
51. Enad JG, Gaines RJ, White SM, Kurtz CA. Arthroscopic superior labrum anterior-posterior repair in military patients. J Shoulder Elbow Surg. 2007;16(3):300-305.
Caring for gender-nonconforming youth
As a member of a multidisciplinary clinic that cares for gender-nonconforming (GN) youth, I frequently field questions from providers about how to handle gender identity concerns in the primary care setting. The specific health care needs of these youth matter as GN youth are at increased risk of self-harm, suicide attempts, mood disorders, eating disorders, substance use, and low school performance.1, 2 These increased risks appear to be related to the rejection and stigma associated with gender nonconformity that can extend to the health care setting.

More than 50% of transgender adults report experiences of discrimination in health care.3 The literature suggests that creating a supportive and affirming environment for GN youth may decrease these risks. If we can do just that during their health care visits, we can make a positive impact on our patients.
Terminology
A review of terminology and clarification of the difference between biologic sex, gender identity, gender expression, and sexual orientation are necessary before discussing the care of GN youth. Biologic sex is typically assigned at birth and is determined by a person’s chromosomes, hormones, and anatomy. Sex most commonly is female or male. For a minority of the population, there may be disorders or differences of sex development in which the development of chromosomal, gonadal, or anatomic sex is atypical. Examples of these conditions are congenital adrenal hyperplasia and androgen insensitivity syndrome. Gender includes the behavioral, cultural, and psychological characteristics associated with femaleness or maleness.2 Gender identity is a person’s innate sense of feeling male, female, or somewhere in between. Individuals who have a gender identity that is congruent with their assigned sex are referred to as cisgender; those who have a gender identity that does not align with their birth sex are often referred to as transgender. Gender expression is how people choose to present themselves to the world. A person’s gender may or may not be consistent with his/her internal gender identity. For example, an individual may be female biologically (XX chromosomes, with a uterus, ovaries, and vagina) and self-identify as female, but express herself in a masculine way by having her hair cut short and wearing more masculine clothing.
Gender dysphoria occurs when an individual experiences psychological distress caused by the incongruence between his/her biologic sex and his/her internal gender identity, and this mismatch leads to clinically significant distress or impairment in daily functioning. Gender dysphoria is a diagnosis in the Diagnostic and Statistical Manual of Mental Disorders, Fifth Edition (DSM-5). It has replaced the earlier diagnosis of gender identity disorder in the DSM-IV. The new diagnosis focuses on the distress related to an incongruence between gender identity and biologic sex and does not label it as pathologic. Gender-nonconforming individuals do not follow other people’s ideas or stereotypes about how they should look or act based on the sex they were assigned at birth. It is important to note that an individual’s gender identity is separate from sexual orientation. Sexual orientation describes an individual’s pattern of sexual and physical attraction. An individual may be attracted to members of the same sex (homosexual, lesbian, gay), opposite sex (heterosexual), or both sexes (bisexual). Increasingly youth are using a variety of terms to describe their gender (for example, genderqueer, asexual, gender fluid) and sexual orientation (for example, pansexual, asexual). These terms may have different meanings for different youth, and it is important to respectfully ask and clarify what these terms mean to each individual patient.
Trajectory of gender identity
Experimenting with gender expression and gender roles is a normal part of childhood. The majority of young children with nonconforming gender identification will not persist with this identification through adolescence. Some of these children will go on to have a nonheterosexual sexual orientation when they are older. While it can be difficult to predict the trajectory of cross-gender identification in early childhood, those with a persistent, insistent, and consistent cross-gender identification in childhood are more likely to experience gender dysphoria and continue with a transgender identity into adulthood. Adolescence is a particularly difficult time for GN youth. The development of secondary sex characteristics that are not consistent with an individual’s identified gender, in addition to the psychosocial challenges of adolescent development, can lead to increased suicidal thoughts, self-harm behaviors, anxiety, isolation, and risk-taking behaviors. Gender dysphoria that increases with the onset of puberty rarely subsides with time.
Approach to GN patients in practice
Research is ongoing related to best practices for the care of GN youth. Clinical guidelines and standards of care have been published and endorsed by organizations including the Endocrine Society, Pediatric Endocrine Society, World Professional Association for Transgender Health, and the American Academy of Pediatrics. My recommendations for the care of GN youth are based on these guidelines.
Primary care providers are often the first place families turn when a child experiences gender identity concerns. Primary care providers can play an important role in providing a safe nonjudgmental environment for patients and families to discuss their concerns, and connecting patients and families to appropriate resources. Providers should first work to educate themselves and their staff about issues affecting GN youth and learn to provide culturally competent care to these youth. Asking youth their preferred names and preferred pronouns (for example, “he/him/his,” “she/her/hers,” “they/them/their,” or something else), documenting this in the medical record, and training clinic staff to use preferred names and pronouns creates an environment that validates, supports, and respects these youth.
It is important to ask all adolescents if they have questions or concerns about their gender identity, in addition to asking questions about sexual identity. It is important when asking these questions to avoid assumptions about an individual’s gender identity based on his or her gender expression. Providers also should familiarize themselves with local referral resources for these youth. As mentioned earlier, GN youth are at high risk for mental health complications including suicide, self-harm, and mood disorders. When referring patients for mental health services, you should be familiar with providers who have expertise in issues of gender identity. A recent report by the Substance Abuse and Mental Health Services Administration states that variations in gender identity are normal, and conversion therapies or other efforts to change gender identity are not effective, are harmful, and are not appropriate therapeutic practices.4
As increasing numbers of youth are identifying as transgender or gender nonconforming, the number of clinics that can coordinate with local providers to provide multidisciplinary care for GN patients is growing.
Resources for health care professionals
• National LGBT Health Education Center, the Fenway Institute. At its website, learning modules, webinars, and other educational resources are available for health care organizations.
• World Professional Association of Transgender Health. This website provides standards of care for transgender patients and a provider directory.
• The Genderbread Person. This website has a helpful infographic illustrating differences between biologic sex, gender identity, gender expression, and sexual orientation, which can be useful for education with patients, families, and trainees.
• Center of Excellence for Transgender Health. This organization works to increase access to comprehensive, effective, and affirming health care services for trans communities.
Resources for patients and families
• The Trevor Project. This website provides crisis intervention and suicide prevention services.
• National Center for Transgender Equality. This advocacy organization works to promote policy change to advance transgender equality.
• Family Acceptance Project. This research, intervention, education, and policy initiative works to prevent health and mental health risks for lesbian, gay, bisexual, and transgender children and youth, including suicide, homelessness, and HIV – in the context of their families, cultures, and faith communities.
References
1. Pediatrics. 2012 Mar;129(3):418-25.
2. Pediatrics. 2014 Dec;134(6):1184-92.
3. When Health Care Isn’t Caring: Lambda Legal’s Survey of Discrimination Against LGBT People and People with HIV, Lambda Legal, 2010. Available at www.lambdalegal.org/health-care-report.
4. Substance Abuse and Mental Health Services Administration. Ending Conversion Therapy: Supporting and Affirming LGBTQ Youth. HHS Publication No. (SMA) 15-4928. October 2015. Available at http://store.samhsa.gov/shin/content//SMA15-4928/SMA15-4928.pdf.
Dr. Chelvakumar is an attending physician in the division of adolescent medicine at Nationwide Children’s Hospital and an assistant professor of clinical pediatrics at the Ohio State University, both in Columbus.
As a member of a multidisciplinary clinic that cares for gender-nonconforming (GN) youth, I frequently field questions from providers about how to handle gender identity concerns in the primary care setting. The specific health care needs of these youth matter as GN youth are at increased risk of self-harm, suicide attempts, mood disorders, eating disorders, substance use, and low school performance.1, 2 These increased risks appear to be related to the rejection and stigma associated with gender nonconformity that can extend to the health care setting.
More than 50% of transgender adults report experiences of discrimination in health care.3 The literature suggests that creating a supportive and affirming environment for GN youth may decrease these risks. If we can do just that during their health care visits, we can make a positive impact on our patients.
Terminology
A review of terminology and clarification of the difference between biologic sex, gender identity, gender expression, and sexual orientation are necessary before discussing the care of GN youth. Biologic sex is typically assigned at birth and is determined by a person’s chromosomes, hormones, and anatomy. Sex most commonly is female or male. For a minority of the population, there may be disorders or differences of sex development in which the development of chromosomal, gonadal, or anatomic sex is atypical. Examples of these conditions are congenital adrenal hyperplasia and androgen insensitivity syndrome. Gender includes the behavioral, cultural, and psychological characteristics associated with femaleness or maleness.2 Gender identity is a person’s innate sense of feeling male, female, or somewhere in between. Individuals who have a gender identity that is congruent with their assigned sex are referred to as cisgender; those who have a gender identity that does not align with their birth sex are often referred to as transgender. Gender expression is how people choose to present themselves to the world. A person’s gender may or may not be consistent with his/her internal gender identity. For example, an individual may be female biologically (XX chromosomes, with a uterus, ovaries, and vagina) and self-identify as female, but express herself in a masculine way by having her hair cut short and wearing more masculine clothing.
Gender dysphoria occurs when an individual experiences psychological distress caused by the incongruence between his/her biologic sex and his/her internal gender identity, and this mismatch leads to clinically significant distress or impairment in daily functioning. Gender dysphoria is a diagnosis in the Diagnostic and Statistical Manual of Mental Disorders, Fifth Edition (DSM-5). It has replaced the earlier diagnosis of gender identity disorder in the DSM-IV. The new diagnosis focuses on the distress related to an incongruence between gender identity and biologic sex and does not label it as pathologic. Gender-nonconforming individuals do not follow other people’s ideas or stereotypes about how they should look or act based on the sex they were assigned at birth. It is important to note that an individual’s gender identity is separate from sexual orientation. Sexual orientation describes an individual’s pattern of sexual and physical attraction. An individual may be attracted to members of the same sex (homosexual, lesbian, gay), opposite sex (heterosexual), or both sexes (bisexual). Increasingly youth are using a variety of terms to describe their gender (for example, genderqueer, asexual, gender fluid) and sexual orientation (for example, pansexual, asexual). These terms may have different meanings for different youth, and it is important to respectfully ask and clarify what these terms mean to each individual patient.
Trajectory of gender identity
Experimenting with gender expression and gender roles is a normal part of childhood. The majority of young children with nonconforming gender identification will not persist with this identification through adolescence. Some of these children will go on to have a nonheterosexual sexual orientation when they are older. While it can be difficult to predict the trajectory of cross-gender identification in early childhood, those with a persistent, insistent, and consistent cross-gender identification in childhood are more likely to experience gender dysphoria and continue with a transgender identity into adulthood. Adolescence is a particularly difficult time for GN youth. The development of secondary sex characteristics that are not consistent with an individual’s identified gender, in addition to the psychosocial challenges of adolescent development, can lead to increased suicidal thoughts, self-harm behaviors, anxiety, isolation, and risk-taking behaviors. Gender dysphoria that increases with the onset of puberty rarely subsides with time.
Approach to GN patients in practice
Research is ongoing related to best practices for the care of GN youth. Clinical guidelines and standards of care have been published and endorsed by organizations including the Endocrine Society, Pediatric Endocrine Society, World Professional Association for Transgender Health, and the American Academy of Pediatrics. My recommendations for the care of GN youth are based on these guidelines.
Primary care providers are often the first place families turn when a child experiences gender identity concerns. Primary care providers can play an important role in providing a safe nonjudgmental environment for patients and families to discuss their concerns, and connecting patients and families to appropriate resources. Providers should first work to educate themselves and their staff about issues affecting GN youth and learn to provide culturally competent care to these youth. Asking youth their preferred names and preferred pronouns (for example, “he/him/his,” “she/her/hers,” “they/them/their,” or something else), documenting this in the medical record, and training clinic staff to use preferred names and pronouns creates an environment that validates, supports, and respects these youth.
It is important to ask all adolescents if they have questions or concerns about their gender identity, in addition to asking questions about sexual identity. It is important when asking these questions to avoid assumptions about an individual’s gender identity based on his or her gender expression. Providers also should familiarize themselves with local referral resources for these youth. As mentioned earlier, GN youth are at high risk for mental health complications including suicide, self-harm, and mood disorders. When referring patients for mental health services, you should be familiar with providers who have expertise in issues of gender identity. A recent report by the Substance Abuse and Mental Health Services Administration states that variations in gender identity are normal, and conversion therapies or other efforts to change gender identity are not effective, are harmful, and are not appropriate therapeutic practices.4
As increasing numbers of youth are identifying as transgender or gender nonconforming, the number of clinics that can coordinate with local providers to provide multidisciplinary care for GN patients is growing.
Resources for health care professionals
• National LGBT Health Education Center, the Fenway Institute. At its website, learning modules, webinars, and other educational resources are available for health care organizations.
• World Professional Association of Transgender Health. This website provides standards of care for transgender patients and a provider directory.
• The Genderbread Person. This website has a helpful infographic illustrating differences between biologic sex, gender identity, gender expression, and sexual orientation, which can be useful for education with patients, families, and trainees.
• Center of Excellence for Transgender Health. This organization works to increase access to comprehensive, effective, and affirming health care services for trans communities.
Resources for patients and families
• The Trevor Project. This website provides crisis intervention and suicide prevention services.
• National Center for Transgender Equality. This advocacy organization works to promote policy change to advance transgender equality.
• Family Acceptance Project. This research, intervention, education, and policy initiative works to prevent health and mental health risks for lesbian, gay, bisexual, and transgender children and youth, including suicide, homelessness, and HIV – in the context of their families, cultures, and faith communities.
References
1. Pediatrics. 2012 Mar;129(3):418-25.
2. Pediatrics. 2014 Dec;134(6):1184-92.
3. When Health Care Isn’t Caring: Lambda Legal’s Survey of Discrimination Against LGBT People and People with HIV, Lambda Legal, 2010. Available at www.lambdalegal.org/health-care-report.
4. Substance Abuse and Mental Health Services Administration. Ending Conversion Therapy: Supporting and Affirming LGBTQ Youth. HHS Publication No. (SMA) 15-4928. October 2015. Available at http://store.samhsa.gov/shin/content//SMA15-4928/SMA15-4928.pdf.
Dr. Chelvakumar is an attending physician in the division of adolescent medicine at Nationwide Children’s Hospital and an assistant professor of clinical pediatrics at the Ohio State University, both in Columbus.

High Self-Contamination among Healthcare Workers
Florescent lotion and black light revealed that health care workers often contaminate their skin and clothing while removing their protective gear, researchers say.
"It was surprising for the participants in the study to see that they frequently contaminated themselves during [personal protective equipment] removal," said senior author Dr. Curtis J. Donskey of the Cleveland Veterans Affairs Medical Center.
"Most of the participants appeared to be unaware of the high risk for contamination and many reported receiving minimal or no training in putting on and taking off [personal protective equipment]," he said by email.
The researchers recruited doctors, nurses and ancillary personnel such as phlebotomists and physical therapists at four Cleveland-area hospitals to participate in the simulations. More than half of the 435 simulations were performed by nurses.
As reported online October 12 in JAMA Internal Medicine, the participants put on protective gowns and gloves in their usual manner and then had a small amount of fluorescent lotion placed in the palm of their hands, which they then rubbed between their hands for 15 seconds to simulate dirtied gloves, then smeared the gloves over the chest and abdomen area of the gown. Then the gloves were exchanged for clean ones.
After they removed their gloves and gowns in their usual manners, researchers used a black light to check for lotion contamination of the hands, forearms, neck, face, hair or clothing.
Skin or clothing contamination happened 46% of the time, more frequently during glove removal.
Researchers also noted whether participants had used proper protective equipment technique, e.g., wearing gloves extended over the wrists of the gown, gown removed first by pulling away from the neck and body, and gloves removed second. Contamination happened 70% of the time when proper technique was not followed, compared to 30% of the time when it was followed.
"When dealing with pathogens that are potentially fatal, the goal has to be zero contamination," Dr. Donskey said. "In routine care settings, we would like personnel to be well trained and confident that they can minimize contamination, but would not insist on zero contamination."
It is important for personnel to perform hand hygiene after removing gloves and gowns, he said.
The researchers also conducted these tests with a group of personnel who had attended special infection control sessions, with a 10-minute video presentation and 20 minutes of demonstrations and practice in using and removing protective gear.
Before the training sessions, these individuals contaminated themselves 60% of the time, compared to roughly 19% after the sessions. The improvements were still seen at re-tests done one and three months later.
"This suggests that training using fluorescent lotion can be useful to identify minor deficiencies in technique that lead to contamination," Donskey said.
Recent experience with the Ebola virus in the U.S. showed that self-contamination during removal of protective equipment does occur, but this study exposes a more widespread issue that may be happening during routine patient care, said Dr. Michelle Doll of Virginia Commonwealth University in Richmond who coauthored a commentary on the new study.
"Use of gowns and gloves for contact precautions on a busy inpatient unit is costly on multiple levels," Doll said by email. "In situations when we do decide to use these tools for infection prevention, we need to optimize techniques to achieve the best efficacy possible. Otherwise it is wasteful of healthcare worker efforts and hospital resources."
The sight of fluorescent dye on one's face and hands would be a powerful and lasting lesson, she said.
"Being able to see where contamination occurs allows personnel to make adjustments in their technique," Dr. Donskey said. "Because training alone did not result in zero contamination, there is a need for other approaches such as improving [equipment] design or disinfection of [equipment] prior to removal."