User login
The Role of Liposomal Bupivacaine in Postsurgical Analgesia
A supplement to ACS Surgery News®. This supplement is sponsored by Pacira Pharmaceuticals, Inc.

Wound Infiltration Technique video:
TAP Infiltration Technique video
A supplement to ACS Surgery News®. This supplement is sponsored by Pacira Pharmaceuticals, Inc.
Wound Infiltration Technique video:
TAP Infiltration Technique video
A supplement to ACS Surgery News®. This supplement is sponsored by Pacira Pharmaceuticals, Inc.
Wound Infiltration Technique video:
TAP Infiltration Technique video
“I feel dizzy, Doctor”
› Refer a patient who reports that his dizziness is accompanied by hearing loss to an otolaryngologist for evaluation. C
› Use the HINTS (Head Impulse, Nystagmus, and Test of Skew) procedure to differentiate central from peripheral vertigo. A
› Use the Dix-Hallpike procedure to diagnose benign paroxysmal positional vertigo. B
Strength of recommendation (SOR)
A Good-quality patient-oriented evidence
B Inconsistent or limited-quality patient-oriented evidence
C Consensus, usual practice, opinion, disease-oriented evidence, case series
With an estimated lifetime prevalence of 17% to 30%,1 dizziness is a relatively common clinical symptom, but the underlying cause can be difficult to diagnose. That’s because patients’ descriptions of dizziness are often imprecise, and this symptom is associated with a wide range of conditions. A careful history and physical examination are key to diagnosis, as is an understanding of the mechanisms of dizziness.
This article covers the range of diagnoses that should be considered when a patient presents with dizziness, and provides insight regarding features of the patient’s history that can better elucidate the specific etiology.
What do patients mean when they say, “I feel dizzy”?
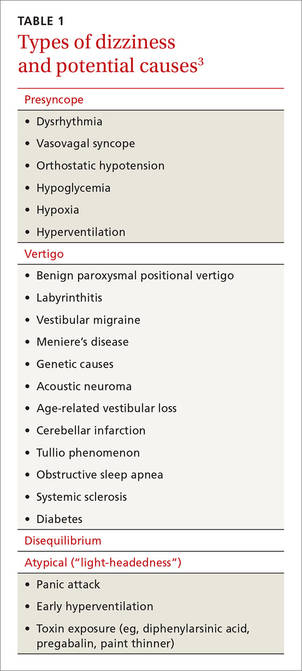
“Dizziness” is a vague term, and patients who report dizziness should be asked to further describe the sensation. Patients may use the word dizziness in an attempt to describe many sensations, including faintness, giddiness, light-headedness, or unsteadiness.2 In 1972, Drachman and Hart proposed a classification system for dizziness that describes 4 categories—presyncope, vertigo, disequilibrium, and atypical (TABLE 1).3 These classifications are still commonly used today, and the discussion that follows describes potential causes of dizziness in each of these 4 categories. A stepwise approach for evaluating a patient who reports dizziness can be found in the ALGORITHM.3-6
Syncopal-related dizziness can have a cardiovascular cause
Presyncope is a feeling of impending loss of consciousness that’s sometimes accompanied by generalized muscle weakness and/or partial vision loss. Taking a careful history regarding the events surrounding the episode should distinguish this type of dizziness, and doing so is essential because most of the underlying pathogenesis involves the cardiovascular system and requires specific interventions.
Dysrhythmias can cause syncope and may or may not be accompanied by a feeling of palpitations. Diagnosis is made by electrocardiogram (EKG) followed by the use of a Holter monitor.
Vasovagal syncope is caused by a sudden slowing of the pulse that’s the result of stimulation of the vagal nerve. It can occur from direct stimulation of the nerve from palpation (or strangulation), or from an intense autonomic discharge, as when people are frightened or confronted with something upsetting (eg, the sight of blood.)
Orthostatic hypotension results from a change in body position in which either autonomic mechanisms cannot maintain venous tone, causing a sudden drop in blood pressure, or in which the heart cannot compensate by speeding up, as when a patient is taking a beta-adrenergic antagonist or has first-degree heart block. It can also result from hypovolemia.
Measuring the patient’s blood pressure in the recumbent, seated, and standing positions can verify the diagnosis if an episode occurred soon before the examination. This kind of dizziness can be treated by instructing the patient to rise slowly, or by making appropriate medication adjustments. If conservative measures fail, medications such as midodrine or droxidopa can be tried.7
Hypoglycemia, hypoxia, or hyperventilation can also precipitate syncopal symptoms. Taking a careful history to assess for the presence of seizure-related features such as tonic/clonic movements or loss of bowel and bladder control can be helpful in distinguishing this form of dizziness.
Vertigo can have a central or peripheral cause
Vertigo is dizziness that is characterized by the sensation of spinning. The presence of vertigo implies disease of the inner ear or central nervous system. The “wiring diagram” of the vestibulo-ocular reflex is fairly straightforward, but sorting out the symptoms that arise from lesions within the system can be a diagnostic challenge. Vertigo has classically been divided into causes that are central (originating in the central nervous system) or peripheral (originating in the peripheral nervous system).
The HINTS (Head Impulse, Nystagmus, and Test of Skew) protocol is a group of 3 tests that can be used to differentiate central from peripheral vertigo (TABLE 2).8,9 To perform the head impulse test, the examiner asks the patient to focus his gaze on a target and then rapidly turns the patient’s head to the side, watching the eyes for any corrective movements.10 When the eyes make a corrective saccade, the test is considered to be positive for a peripheral lesion.
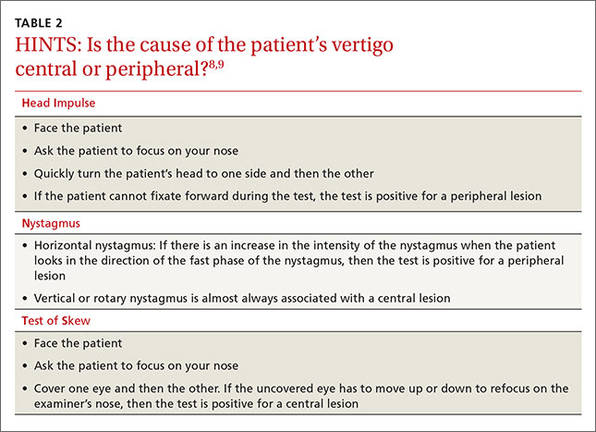
Horizontal nystagmus is assessed by having the patient look in the direction of the fast phase of the nystagmus. If the nystagmus increases in intensity, then the test is considered positive for a peripheral lesion.
Vertigo can have many possible causes
Finally, the “test of skew” is performed by again having the patient fixate on the examiner’s nose. Each eye is tested by being covered, and then uncovered. If the uncovered eye has to move to refocus on the examiner’s nose, then the test is positive for a central lesion. A positive head impulse, positive horizontal nystagmus, and negative test of skew is 100% sensitive and 96% specific for a peripheral lesion.11
Benign paroxysmal positional vertigo (BPPV) is vertigo that is triggered by movement of the head. It occurs when otoconia that are normally embedded in gel in the utricle become dislodged and migrate into the 3 fluid-filled semicircular canals, where they interfere with the normal fluid movement these canals use to sense head motion, causing the inner ear to send false signals to the brain.12
Diagnosis is confirmed by performing the Dix-Hallpike maneuver to elicit nystagmus. The patient is moved from a seated to a supine position with her head turned 45 degrees to the right and held for 30 seconds. For a demonstration of the Dix-Hallpike maneuver, see https://youtu.be/8RYB2QlO1N4. The Dix-Hallpike maneuver is also the first step of a treatment for BBPV known as the Epley maneuver. (See “The Epley maneuver: A procedure for treating BPPV”.13,14)
Benign paroxysmal positional vertigo (BPPV) can be treated with the Epley maneuver. Like the Dix-Hallpike maneuver, the Epley maneuver isolates the posterior semicircular canal of the affected ear. However, it goes a step further to reposition otolithic debris away from the ampulla of the posterior canal, rolling it through the canal and depositing it in the utricle, where it will not stimulate nerve endings and produce symptoms.
For a demonstration of the Epley maneuver, see https://youtu.be/jBzID5nVQjk. A computer-controlled form of the Epley maneuver has been developed and can be as effective as the manual version of this procedure.13
In 38% of patients, BPPV spontaneously resolves. The Epley maneuver can improve this rate to 64% with a single treatment, and one additional maneuver improves the success rate to 83.3%.14 If this procedure doesn’t work the first time, there may be more sediment that didn’t have enough time to settle during the procedure. Therefore, the Epley maneuver can be repeated 3 times a day, and performed on subsequent days as needed.
Labyrinthitis—inflammation of the inner ear that can cause vertigo—is suggested by an acute, non-recurrent episode of dizziness that is often preceded by an upper respiratory infection. If the external canal is extremely painful and/or develops a vesicular rash, the patient might have herpes zoster of the geniculate ganglion (Ramsay Hunt syndrome type 2).
Vertigo can have many possible causes
Vestibular migraine and Meniere’s disease. When a patient who has a history of migraines experiences symptoms of vertigo, vestibular migraine should be suspected, and treatment should focus on migraine therapy rather than vestibular therapy.15
Symptoms of Meniere’s disease and vestibular migraine can overlap.16 The current definition of Meniere’s disease requires ≥2 definitive episodes of vertigo with hearing loss plus tinnitus and/or aural symptoms.17 Thirty percent of vertigo episodes in patients with Meniere's disease can be attributed to BPPV.18
Acoustic neuroma. In addition to vertigo, acoustic neuroma is often associated with gradual hearing loss, tinnitus, and facial numbness (from compression of cranial nerve V preoperatively) or facial weakness (from compression of cranial nerve VII postoperatively). Unilateral hearing loss should prompt evaluation with magnetic resonance imaging.
“Acoustic neuroma” is a misnomer. The lesion arises from the vestibular (not the acoustic) portion of the 8th cranial nerve, and isn’t a neuroma; it is a schwannoma.19 Although it actually arises peripherally within the vestibular canal, it typically expands centrally and compresses other nerves centrally, which can make the clinical diagnosis more challenging if one were using the classical schema of differentiating between peripheral and central causes of vertigo.
Age-related vestibular loss occurs when the aging process causes deterioration of most of the components of the vestibulo-ocular reflex, resulting in dizziness and vertigo. Usually, the cerebral override mechanisms can compensate for the degeneration.
Other causes of vertigo include cerebellar infarction (3% of patients with vertigo),20 sound-induced vertigo (Tullio phenomenon),21 obstructive sleep apnea,22 and systemic sclerosis.23 Diabetes can cause a reduction in vestibular sensitivity that is evidenced by an increased reliance on visual stimuli to resolve vestibulo-visual conflict.24
Disequilibrium
Disequilibrium is predominantly a loss of balance. Patients with disequilibrium have the feeling that they are about to fall, specifically without the sensation of spinning. They may appear to sway, and will reach out for something to support them. Disequilibrium can be a component of vertigo, or it may suggest a more specific diagnosis, such as ataxia, which is a lack of coordination when walking.
Atypical causes of dizziness
“Light-headedness” may have an element of euphoria or may be indistinguishable from the early part of a syncopal episode. Because other causes of light-headedness can be difficult to distinguish from presyncope, it is important to consider syncope in the differential diagnosis.
The differential of light-headedness can also include panic attack, early hyperventilation, and toxin exposure (such as diphenylarsinic acid,25 pregabalin,26 or paint thinner27).
CORRESPONDENCE
Shannon Paul Starr, MD, Louisiana State University Health Sciences Center, 200 W. Esplanade #412, Kenner, LA 70065; [email protected].
1. Murdin L, Schilder AG. Epidemiology of balance symptoms and disorders in the community: a systematic review. Otol Neurotol. 2015;36:387-392.
2. Stedman TL. Stedman’s medical dictionary, illustrated. 24th ed. Baltimore, Md: William & Wilkins; 1982:419.
3. Drachman DA, Hart CW. An approach to the dizzy patient. Neurology. 1972;22:323-334.
4. Angtuaco EJ, Wippold FJ II, Cornelius RS, et al; Expert Panel on Neurologic Imaging. ACR appropriateness criteria: hearing loss and/or vertigo. 2013. American College of Radiology Web site. Available at: http://www.acr.org/~/media/914834f9cfa74e6c803e8e9c6909cd7e.pdf. Accessed September 3, 2015.
5. Dros J, Maarsingh OR, van der Windt DA, et al. Profiling dizziness in older primary care patients: an empirical study. PLoS One. 2011;6:e16481.
6. Post RE, Dickerson LM. Dizziness: a diagnostic approach. Am Fam Physician. 2010;82:361-369.
7. Biaggioni I. New developments in the management of neurogenic orthostatic hypotension. Curr Cardiol Rep. 2014;16:542.
8. Batuecas-Caletrío Á, Yáñez-González R, Sánchez-Blanco C, et al. [Peripheral vertigo versus central vertigo. Application of the HINTS protocol]. Rev Neurol. 2014;59:349-353.
9. Kattah JC, Talkad AV, Wang DZ, et al. HINTS to diagnose stroke in the acute vestibular syndrome: three-step bedside oculomotor examination more sensitive than early MRI diffusion-weighted imaging. Stroke. 2009;40:3504-3510.
10. Barraclough K, Bronstein A. Vertigo. BMJ. 2009;339:b3493.
11. Newman-Toker DE, Kerber KA, Hsieh YH, et al. HINTS outperforms ABCD2 to screen for stroke in acute continuous vertigo and dizziness. Acad Emerg Med. 2013;20:986-996.
12. Vestibular Disorders Association. Benign Paroxysmal Positional Vertigo. Vestibular Disorders Association Web site. Available at: http://vestibular.org/understanding-vestibular-disorders/types-vestibular-disorders/benign-paroxysmal-positional-vertigo. Accessed September 1, 2015.
13. Shan X, Peng X, Wang E. Efficacy of computer-controlled repositioning procedure for benign paroxysmal positional vertigo. Laryngoscope. 2015;125:715-719.
14. Lee JD, Shim DB, Park HJ, et al. A multicenter randomized double-blind study: comparison of the Epley, Semont, and sham maneuvers for the treatment of posterior canal benign paroxysmal positional vertigo. Audiol Neurootol. 2014;19:336-341.
15. Stolte B, Holle D, Naegel S, et al. Vestibular migraine. Cephalalgia. 2015;35:262-270.
16. Lopez-Escamez JA, Dlugaiczyk J, Jacobs J, et al. Accompanying symptoms overlap during attacks in Menière’s disease and vestibular migraine. Front Neurol. 2014;5:265.
17. Beasley NJ, Jones NS. Menière’s disease: evolution of a definition. J Laryngol Otol. 1996;110:1107-1113.
18. Taura A, Funabiki K, Ohgita H, et al. One-third of vertiginous episodes during the follow-up period are caused by benign paroxysmal positional vertigo in patients with Meniere’s disease. Acta Otolaryngol. 2014;134:1140-1145.
19. Pineda A, Feder BH. Acoustic neuroma: a misnomer. Is Surg. 1967;33:40-43.
20. Seemungal BM. Neuro-otological emergencies. Curr Opin Neurol. 2007;20:32-39.
21. Harrison RV. On the biological plausibility of Wind Turbine Syndrome. Int J Environ Health Res. 2015;25:463-468.
22. Kayabasi S, Iriz A, Cayonu M, et al. Vestibular functions were found to be impaired in patients with moderate-tosevere obstructive sleep apnea. Laryngoscope. 2015;125:1244-1248.
23. Rabelo MB, Corona AP. Auditory and vestibular dysfunctions in systemic sclerosis: literature review. Codas. 2014;26:337-342.
24. Razzak RA, Bagust J, Docherty S, et al. Augmented asymmetrical visual field dependence in asymptomatic diabetics: evidence of subclinical asymmetrical bilateral vestibular dysfunction. J Diabetes Complications. 2015;29:68-72.
25. Ogata T, Nakamura Y, Endo G, et al. [Subjective symptoms and miscarriage after drinking well water exposed to diphenylarsinic acid]. Nihon Koshu Eisei Zasshi. 2014;61:556-564.
26. Qu C, Xie Y, Qin F, et al. Neuropsychiatric symptoms accompanying thrombocytopenia following pregabalin treatment for neuralgia: a case report. Int J Clin Pharm. 2014;36:1138-1140.
27. Rahimi HR, Agin K, Shadnia S, et al. Clinical and biochemical analysis of acute paint thinner intoxication in adults: a retrospective descriptive study. Toxicol Mech Methods. 2015;25:42-47.
› Refer a patient who reports that his dizziness is accompanied by hearing loss to an otolaryngologist for evaluation. C
› Use the HINTS (Head Impulse, Nystagmus, and Test of Skew) procedure to differentiate central from peripheral vertigo. A
› Use the Dix-Hallpike procedure to diagnose benign paroxysmal positional vertigo. B
Strength of recommendation (SOR)
A Good-quality patient-oriented evidence
B Inconsistent or limited-quality patient-oriented evidence
C Consensus, usual practice, opinion, disease-oriented evidence, case series
With an estimated lifetime prevalence of 17% to 30%,1 dizziness is a relatively common clinical symptom, but the underlying cause can be difficult to diagnose. That’s because patients’ descriptions of dizziness are often imprecise, and this symptom is associated with a wide range of conditions. A careful history and physical examination are key to diagnosis, as is an understanding of the mechanisms of dizziness.
This article covers the range of diagnoses that should be considered when a patient presents with dizziness, and provides insight regarding features of the patient’s history that can better elucidate the specific etiology.
What do patients mean when they say, “I feel dizzy”?
“Dizziness” is a vague term, and patients who report dizziness should be asked to further describe the sensation. Patients may use the word dizziness in an attempt to describe many sensations, including faintness, giddiness, light-headedness, or unsteadiness.2 In 1972, Drachman and Hart proposed a classification system for dizziness that describes 4 categories—presyncope, vertigo, disequilibrium, and atypical (TABLE 1).3 These classifications are still commonly used today, and the discussion that follows describes potential causes of dizziness in each of these 4 categories. A stepwise approach for evaluating a patient who reports dizziness can be found in the ALGORITHM.3-6
Syncopal-related dizziness can have a cardiovascular cause
Presyncope is a feeling of impending loss of consciousness that’s sometimes accompanied by generalized muscle weakness and/or partial vision loss. Taking a careful history regarding the events surrounding the episode should distinguish this type of dizziness, and doing so is essential because most of the underlying pathogenesis involves the cardiovascular system and requires specific interventions.
Dysrhythmias can cause syncope and may or may not be accompanied by a feeling of palpitations. Diagnosis is made by electrocardiogram (EKG) followed by the use of a Holter monitor.
Vasovagal syncope is caused by a sudden slowing of the pulse that’s the result of stimulation of the vagal nerve. It can occur from direct stimulation of the nerve from palpation (or strangulation), or from an intense autonomic discharge, as when people are frightened or confronted with something upsetting (eg, the sight of blood.)
Orthostatic hypotension results from a change in body position in which either autonomic mechanisms cannot maintain venous tone, causing a sudden drop in blood pressure, or in which the heart cannot compensate by speeding up, as when a patient is taking a beta-adrenergic antagonist or has first-degree heart block. It can also result from hypovolemia.
Measuring the patient’s blood pressure in the recumbent, seated, and standing positions can verify the diagnosis if an episode occurred soon before the examination. This kind of dizziness can be treated by instructing the patient to rise slowly, or by making appropriate medication adjustments. If conservative measures fail, medications such as midodrine or droxidopa can be tried.7
Hypoglycemia, hypoxia, or hyperventilation can also precipitate syncopal symptoms. Taking a careful history to assess for the presence of seizure-related features such as tonic/clonic movements or loss of bowel and bladder control can be helpful in distinguishing this form of dizziness.
Vertigo can have a central or peripheral cause
Vertigo is dizziness that is characterized by the sensation of spinning. The presence of vertigo implies disease of the inner ear or central nervous system. The “wiring diagram” of the vestibulo-ocular reflex is fairly straightforward, but sorting out the symptoms that arise from lesions within the system can be a diagnostic challenge. Vertigo has classically been divided into causes that are central (originating in the central nervous system) or peripheral (originating in the peripheral nervous system).
The HINTS (Head Impulse, Nystagmus, and Test of Skew) protocol is a group of 3 tests that can be used to differentiate central from peripheral vertigo (TABLE 2).8,9 To perform the head impulse test, the examiner asks the patient to focus his gaze on a target and then rapidly turns the patient’s head to the side, watching the eyes for any corrective movements.10 When the eyes make a corrective saccade, the test is considered to be positive for a peripheral lesion.
Horizontal nystagmus is assessed by having the patient look in the direction of the fast phase of the nystagmus. If the nystagmus increases in intensity, then the test is considered positive for a peripheral lesion.
Vertigo can have many possible causes
Finally, the “test of skew” is performed by again having the patient fixate on the examiner’s nose. Each eye is tested by being covered, and then uncovered. If the uncovered eye has to move to refocus on the examiner’s nose, then the test is positive for a central lesion. A positive head impulse, positive horizontal nystagmus, and negative test of skew is 100% sensitive and 96% specific for a peripheral lesion.11
Benign paroxysmal positional vertigo (BPPV) is vertigo that is triggered by movement of the head. It occurs when otoconia that are normally embedded in gel in the utricle become dislodged and migrate into the 3 fluid-filled semicircular canals, where they interfere with the normal fluid movement these canals use to sense head motion, causing the inner ear to send false signals to the brain.12
Diagnosis is confirmed by performing the Dix-Hallpike maneuver to elicit nystagmus. The patient is moved from a seated to a supine position with her head turned 45 degrees to the right and held for 30 seconds. For a demonstration of the Dix-Hallpike maneuver, see https://youtu.be/8RYB2QlO1N4. The Dix-Hallpike maneuver is also the first step of a treatment for BBPV known as the Epley maneuver. (See “The Epley maneuver: A procedure for treating BPPV”.13,14)
Benign paroxysmal positional vertigo (BPPV) can be treated with the Epley maneuver. Like the Dix-Hallpike maneuver, the Epley maneuver isolates the posterior semicircular canal of the affected ear. However, it goes a step further to reposition otolithic debris away from the ampulla of the posterior canal, rolling it through the canal and depositing it in the utricle, where it will not stimulate nerve endings and produce symptoms.
For a demonstration of the Epley maneuver, see https://youtu.be/jBzID5nVQjk. A computer-controlled form of the Epley maneuver has been developed and can be as effective as the manual version of this procedure.13
In 38% of patients, BPPV spontaneously resolves. The Epley maneuver can improve this rate to 64% with a single treatment, and one additional maneuver improves the success rate to 83.3%.14 If this procedure doesn’t work the first time, there may be more sediment that didn’t have enough time to settle during the procedure. Therefore, the Epley maneuver can be repeated 3 times a day, and performed on subsequent days as needed.
Labyrinthitis—inflammation of the inner ear that can cause vertigo—is suggested by an acute, non-recurrent episode of dizziness that is often preceded by an upper respiratory infection. If the external canal is extremely painful and/or develops a vesicular rash, the patient might have herpes zoster of the geniculate ganglion (Ramsay Hunt syndrome type 2).
Vertigo can have many possible causes
Vestibular migraine and Meniere’s disease. When a patient who has a history of migraines experiences symptoms of vertigo, vestibular migraine should be suspected, and treatment should focus on migraine therapy rather than vestibular therapy.15
Symptoms of Meniere’s disease and vestibular migraine can overlap.16 The current definition of Meniere’s disease requires ≥2 definitive episodes of vertigo with hearing loss plus tinnitus and/or aural symptoms.17 Thirty percent of vertigo episodes in patients with Meniere's disease can be attributed to BPPV.18
Acoustic neuroma. In addition to vertigo, acoustic neuroma is often associated with gradual hearing loss, tinnitus, and facial numbness (from compression of cranial nerve V preoperatively) or facial weakness (from compression of cranial nerve VII postoperatively). Unilateral hearing loss should prompt evaluation with magnetic resonance imaging.
“Acoustic neuroma” is a misnomer. The lesion arises from the vestibular (not the acoustic) portion of the 8th cranial nerve, and isn’t a neuroma; it is a schwannoma.19 Although it actually arises peripherally within the vestibular canal, it typically expands centrally and compresses other nerves centrally, which can make the clinical diagnosis more challenging if one were using the classical schema of differentiating between peripheral and central causes of vertigo.
Age-related vestibular loss occurs when the aging process causes deterioration of most of the components of the vestibulo-ocular reflex, resulting in dizziness and vertigo. Usually, the cerebral override mechanisms can compensate for the degeneration.
Other causes of vertigo include cerebellar infarction (3% of patients with vertigo),20 sound-induced vertigo (Tullio phenomenon),21 obstructive sleep apnea,22 and systemic sclerosis.23 Diabetes can cause a reduction in vestibular sensitivity that is evidenced by an increased reliance on visual stimuli to resolve vestibulo-visual conflict.24
Disequilibrium
Disequilibrium is predominantly a loss of balance. Patients with disequilibrium have the feeling that they are about to fall, specifically without the sensation of spinning. They may appear to sway, and will reach out for something to support them. Disequilibrium can be a component of vertigo, or it may suggest a more specific diagnosis, such as ataxia, which is a lack of coordination when walking.
Atypical causes of dizziness
“Light-headedness” may have an element of euphoria or may be indistinguishable from the early part of a syncopal episode. Because other causes of light-headedness can be difficult to distinguish from presyncope, it is important to consider syncope in the differential diagnosis.
The differential of light-headedness can also include panic attack, early hyperventilation, and toxin exposure (such as diphenylarsinic acid,25 pregabalin,26 or paint thinner27).
CORRESPONDENCE
Shannon Paul Starr, MD, Louisiana State University Health Sciences Center, 200 W. Esplanade #412, Kenner, LA 70065; [email protected].
1. Murdin L, Schilder AG. Epidemiology of balance symptoms and disorders in the community: a systematic review. Otol Neurotol. 2015;36:387-392.
2. Stedman TL. Stedman’s medical dictionary, illustrated. 24th ed. Baltimore, Md: William & Wilkins; 1982:419.
3. Drachman DA, Hart CW. An approach to the dizzy patient. Neurology. 1972;22:323-334.
4. Angtuaco EJ, Wippold FJ II, Cornelius RS, et al; Expert Panel on Neurologic Imaging. ACR appropriateness criteria: hearing loss and/or vertigo. 2013. American College of Radiology Web site. Available at: http://www.acr.org/~/media/914834f9cfa74e6c803e8e9c6909cd7e.pdf. Accessed September 3, 2015.
5. Dros J, Maarsingh OR, van der Windt DA, et al. Profiling dizziness in older primary care patients: an empirical study. PLoS One. 2011;6:e16481.
6. Post RE, Dickerson LM. Dizziness: a diagnostic approach. Am Fam Physician. 2010;82:361-369.
7. Biaggioni I. New developments in the management of neurogenic orthostatic hypotension. Curr Cardiol Rep. 2014;16:542.
8. Batuecas-Caletrío Á, Yáñez-González R, Sánchez-Blanco C, et al. [Peripheral vertigo versus central vertigo. Application of the HINTS protocol]. Rev Neurol. 2014;59:349-353.
9. Kattah JC, Talkad AV, Wang DZ, et al. HINTS to diagnose stroke in the acute vestibular syndrome: three-step bedside oculomotor examination more sensitive than early MRI diffusion-weighted imaging. Stroke. 2009;40:3504-3510.
10. Barraclough K, Bronstein A. Vertigo. BMJ. 2009;339:b3493.
11. Newman-Toker DE, Kerber KA, Hsieh YH, et al. HINTS outperforms ABCD2 to screen for stroke in acute continuous vertigo and dizziness. Acad Emerg Med. 2013;20:986-996.
12. Vestibular Disorders Association. Benign Paroxysmal Positional Vertigo. Vestibular Disorders Association Web site. Available at: http://vestibular.org/understanding-vestibular-disorders/types-vestibular-disorders/benign-paroxysmal-positional-vertigo. Accessed September 1, 2015.
13. Shan X, Peng X, Wang E. Efficacy of computer-controlled repositioning procedure for benign paroxysmal positional vertigo. Laryngoscope. 2015;125:715-719.
14. Lee JD, Shim DB, Park HJ, et al. A multicenter randomized double-blind study: comparison of the Epley, Semont, and sham maneuvers for the treatment of posterior canal benign paroxysmal positional vertigo. Audiol Neurootol. 2014;19:336-341.
15. Stolte B, Holle D, Naegel S, et al. Vestibular migraine. Cephalalgia. 2015;35:262-270.
16. Lopez-Escamez JA, Dlugaiczyk J, Jacobs J, et al. Accompanying symptoms overlap during attacks in Menière’s disease and vestibular migraine. Front Neurol. 2014;5:265.
17. Beasley NJ, Jones NS. Menière’s disease: evolution of a definition. J Laryngol Otol. 1996;110:1107-1113.
18. Taura A, Funabiki K, Ohgita H, et al. One-third of vertiginous episodes during the follow-up period are caused by benign paroxysmal positional vertigo in patients with Meniere’s disease. Acta Otolaryngol. 2014;134:1140-1145.
19. Pineda A, Feder BH. Acoustic neuroma: a misnomer. Is Surg. 1967;33:40-43.
20. Seemungal BM. Neuro-otological emergencies. Curr Opin Neurol. 2007;20:32-39.
21. Harrison RV. On the biological plausibility of Wind Turbine Syndrome. Int J Environ Health Res. 2015;25:463-468.
22. Kayabasi S, Iriz A, Cayonu M, et al. Vestibular functions were found to be impaired in patients with moderate-tosevere obstructive sleep apnea. Laryngoscope. 2015;125:1244-1248.
23. Rabelo MB, Corona AP. Auditory and vestibular dysfunctions in systemic sclerosis: literature review. Codas. 2014;26:337-342.
24. Razzak RA, Bagust J, Docherty S, et al. Augmented asymmetrical visual field dependence in asymptomatic diabetics: evidence of subclinical asymmetrical bilateral vestibular dysfunction. J Diabetes Complications. 2015;29:68-72.
25. Ogata T, Nakamura Y, Endo G, et al. [Subjective symptoms and miscarriage after drinking well water exposed to diphenylarsinic acid]. Nihon Koshu Eisei Zasshi. 2014;61:556-564.
26. Qu C, Xie Y, Qin F, et al. Neuropsychiatric symptoms accompanying thrombocytopenia following pregabalin treatment for neuralgia: a case report. Int J Clin Pharm. 2014;36:1138-1140.
27. Rahimi HR, Agin K, Shadnia S, et al. Clinical and biochemical analysis of acute paint thinner intoxication in adults: a retrospective descriptive study. Toxicol Mech Methods. 2015;25:42-47.

Which is better for IBS pain in women—antispasmodics or antidepressants?
It’s unclear which therapy is more effective because the evidence is insufficient. What is known is that tricyclic antidepressants, peppermint oil, and antispasmodics all have been shown superior to placebo for treating abdominal pain in female patients with irritable bowel syndrome (IBS) (strength of recommendation: A, meta-analyses).
Antispasmodics and tricyclics alleviate abdominal pain
A 2011 Cochrane review of 56 randomized controlled trials (RCTs) with 3725 patients compared bulking agents, antispasmodics, or antidepressants with placebo for treating IBS.1 The pooled results from 13 RCTs with 1392 patients (65% female, mean age 45 years) showed that more patients had improved abdominal pain with antispasmodics than placebo over treatment periods varying from 6 days to 6 months (58% vs 46%; relative risk [RR]=1.3; 95% confidence interval [CI], 1.1-1.6; number needed to treat [NNT]=7).
The clinical relevance of the antispasmodic data is limited because the antispasmodics found effective for abdominal pain aren’t available in the United States. The pooled results from 8 RCTs with 517 patients (72% female, mean age 40) demonstrated greater improvement of abdominal pain with tricyclic and selective serotonin reuptake inhibitor antidepressants than placebo over 6 to 12 weeks (54% vs 37%; RR=1.5; 95% CI, 1.1–2.1; NNT=5). However, subgroup analysis found a statistically significant benefit for tricyclic antidepressants (4 trials; N=320; RR=1.3; 95% CI, 1.0-1.6) but no benefit for SSRIs (4 trials; N=197; RR=2.3; 95% CI, 0.79-6.7).
Effective antispasmodics aren’t available in the United States
A 2012 meta-analysis of 23 RCTs with 2585 patients examined the effect of antispasmodic agents, alone or in combination, to treat IBS.2 Pooled results from 13 RCTs with 2394 patients (69% female, ages 16 years or older) favored treatment with antispasmodics over placebo for abdominal pain (odds ratio [OR]=1.5; 95% CI, 1.3-1.8). No difference in adverse events was found between antispasmodics and placebo (9 trials; N=2239; OR=0.74; 95% CI, 0.54-0.98). The antispasmodics found effective for abdominal pain in this meta-analysis aren’t available in the United States.
Peppermint oil helps, but can cause heartburn
A 2013 meta-analysis of 9 RCTs with 726 patients compared various doses of enteric-coated peppermint oil with placebo over a minimum of 2 weeks’ treatment.3 Five RCTs with 357 patients (62% female, 13.4% children) demonstrated improvement of abdominal pain in 57% of patients taking peppermint oil compared with 27% receiving placebo (RR=2.1; 95% CI, 1.6-2.8; NNT=4 at 2 to 8 weeks). No statistically significant heterogeneity was identified among the treatment groups.
Pooled analysis found that peppermint oil patients were more likely than placebo patients to experience an adverse event (7 trials; N=474; 22% vs 13%; RR=1.7; 95% CI, 1.3-2.4), but that the events were generally mild and transient. The most frequently reported adverse event was heartburn.
1. Ruepert L, Quartero AO, de Wit NJ, et al. Bulking agents, antispasmodics, and antidepressants for the treatment of irritable bowel syndrome. Cochrane Database Syst Rev. 2011;(8):CD003460.
2. Martinez-Vasquez MA, Vasquez-Elizondro G, Gonzalez-Gonzalez JA, et al. Effect of antispasmodic agents, alone or in combination, in the treatment of irritable bowel syndrome: systematic review and meta-analysis. Rev Gastroenterol Mexico. 2012;77:82-90.
3. Khanna R, MacDonald JK, Levesque BG. Peppermint oil for the treatment of irritable bowel syndrome: a systematic review and meta-analysis. J Clin Gastroenterol. 2014;48:505-512.
It’s unclear which therapy is more effective because the evidence is insufficient. What is known is that tricyclic antidepressants, peppermint oil, and antispasmodics all have been shown superior to placebo for treating abdominal pain in female patients with irritable bowel syndrome (IBS) (strength of recommendation: A, meta-analyses).
Antispasmodics and tricyclics alleviate abdominal pain
A 2011 Cochrane review of 56 randomized controlled trials (RCTs) with 3725 patients compared bulking agents, antispasmodics, or antidepressants with placebo for treating IBS.1 The pooled results from 13 RCTs with 1392 patients (65% female, mean age 45 years) showed that more patients had improved abdominal pain with antispasmodics than placebo over treatment periods varying from 6 days to 6 months (58% vs 46%; relative risk [RR]=1.3; 95% confidence interval [CI], 1.1-1.6; number needed to treat [NNT]=7).
The clinical relevance of the antispasmodic data is limited because the antispasmodics found effective for abdominal pain aren’t available in the United States. The pooled results from 8 RCTs with 517 patients (72% female, mean age 40) demonstrated greater improvement of abdominal pain with tricyclic and selective serotonin reuptake inhibitor antidepressants than placebo over 6 to 12 weeks (54% vs 37%; RR=1.5; 95% CI, 1.1–2.1; NNT=5). However, subgroup analysis found a statistically significant benefit for tricyclic antidepressants (4 trials; N=320; RR=1.3; 95% CI, 1.0-1.6) but no benefit for SSRIs (4 trials; N=197; RR=2.3; 95% CI, 0.79-6.7).
Effective antispasmodics aren’t available in the United States
A 2012 meta-analysis of 23 RCTs with 2585 patients examined the effect of antispasmodic agents, alone or in combination, to treat IBS.2 Pooled results from 13 RCTs with 2394 patients (69% female, ages 16 years or older) favored treatment with antispasmodics over placebo for abdominal pain (odds ratio [OR]=1.5; 95% CI, 1.3-1.8). No difference in adverse events was found between antispasmodics and placebo (9 trials; N=2239; OR=0.74; 95% CI, 0.54-0.98). The antispasmodics found effective for abdominal pain in this meta-analysis aren’t available in the United States.
Peppermint oil helps, but can cause heartburn
A 2013 meta-analysis of 9 RCTs with 726 patients compared various doses of enteric-coated peppermint oil with placebo over a minimum of 2 weeks’ treatment.3 Five RCTs with 357 patients (62% female, 13.4% children) demonstrated improvement of abdominal pain in 57% of patients taking peppermint oil compared with 27% receiving placebo (RR=2.1; 95% CI, 1.6-2.8; NNT=4 at 2 to 8 weeks). No statistically significant heterogeneity was identified among the treatment groups.
Pooled analysis found that peppermint oil patients were more likely than placebo patients to experience an adverse event (7 trials; N=474; 22% vs 13%; RR=1.7; 95% CI, 1.3-2.4), but that the events were generally mild and transient. The most frequently reported adverse event was heartburn.
1. Ruepert L, Quartero AO, de Wit NJ, et al. Bulking agents, antispasmodics, and antidepressants for the treatment of irritable bowel syndrome. Cochrane Database Syst Rev. 2011;(8):CD003460.
2. Martinez-Vasquez MA, Vasquez-Elizondro G, Gonzalez-Gonzalez JA, et al. Effect of antispasmodic agents, alone or in combination, in the treatment of irritable bowel syndrome: systematic review and meta-analysis. Rev Gastroenterol Mexico. 2012;77:82-90.
3. Khanna R, MacDonald JK, Levesque BG. Peppermint oil for the treatment of irritable bowel syndrome: a systematic review and meta-analysis. J Clin Gastroenterol. 2014;48:505-512.
Evidence-based answers from the Family Physicians Inquiries Network
Is arthroscopic subacromial decompression effective for shoulder impingement?
It’s impossible to say for certain in the absence of randomized controlled trials. However, in patients whose impingement symptoms don’t improve after 3 to 6 months, arthroscopic subacromial decompression (ASD) is associated with modest (about 10%) long-term improvement in pain and function compared with open acromioplasty or baseline (strength of recommendation [SOR]: B, cohort studies).
Patients older than 57 years may do better with surgery than physical therapy (SOR: B, single cohort study).
EVIDENCE SUMMARY
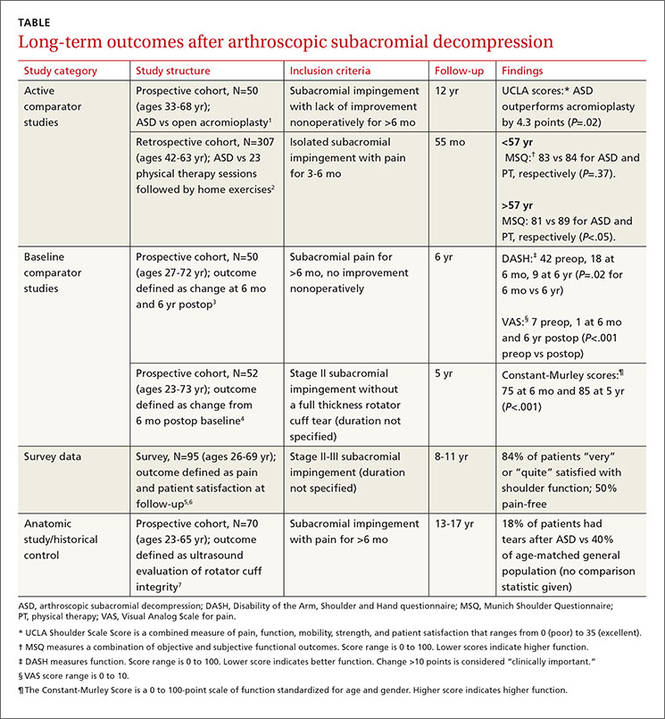
Six cohort studies found that patients who underwent ASD for subacromial impingement had improved pain and function scores at 4.5 to 12 years after surgery (TABLE1-7). Weaknesses of the overall data set include use of heterogeneous outcome measures across studies, lack of sham surgical controls, and lack of blinding.
ASD improves pain and function slightly more than other treatments
One prospective and one retrospective cohort trial compared ASD with another intervention. In the prospective trial, ASD was associated with a 10% better combined pain and function score than open acromioplasty at 12 years.1 In the retrospective trial, ASD was also associated with a 10% better combined pain and function score than prolonged physical therapy in patients older than 57 years (the median age of study participants) but not patients younger than 57 years.2
Two other studies found improvements in pain and function
Two other prospective cohort studies didn’t use a comparison group but followed changes in standardized shoulder pain and function scores for 5 to 6 years after ASD. In one study, pain decreased 6 points on a 10-point visual analog scale by 6 months postop (P<.001).3 In both studies, a 9% to 10% improvement in function was seen between 6 months and 5 to 6 years after surgery.3,4
A third cohort study that asked patients about overall pain and satisfaction 8 to 11 years after ASD found that most were “very” or “quite” satisfied and half were pain-free.5,6
Rotator cuff tears found less likely with ASD
An anatomic study obtained ultrasounds of patients 13 to 17 years after ASD and compared the findings to rotator cuff ultrasounds of the general population.7 Patients who had ASD were 22% less likely to demonstrate rotator cuff tears at the end of the study (no statistics were reported to measure significance).
RECOMMENDATIONS
Guidelines from the Washington State Department of Labor and Industry state that patients who should undergo isolated subacromial decompression (with or without acromioplasty) need to have documented subacromial impingement syndrome with magnetic resonance imaging evidence of rotator cuff tendonopathy or tear, have undergone 12 weeks of conservative therapy (including at least active assisted range of motion and home-based exercises), and have had a subacromial injection with a local anesthetic that has provided documented relief of pain.8
No current guidelines are available from national or international orthopedic or sports medicine organizations.
1. Odenbring S, Wagner P, Atroshi I. Long-term outcomes of arthroscopic acromioplasty of chronic shoulder impingement syndrome: a prospective cohort study with a minimum of 12 years’ follow-up. Arthroscopy. 2008;24:1092–1098.
2. Biberthaler P, Beirer M, Kirchhoff S, et al. Significant benefit for older patients after arthroscopic subacromial decompression: a long-term follow-up study. Int Orthop. 2013;37:457–462.
3. Lunsjo K, Bengtsson M, Nordqvist A, et al. Patients with shoulder impingement remain satisfied 6 years after arthroscopic subacromial decompression. Acta Orthop. 2011;82:711–713.
4. Dom K, Van Glabbeek F, Van Riet RP, et al. Arthroscopic subacromial decompression for advanced (stage II) impingement syndrome: a study of 52 patients with 5 year follow-up. Acta Orthop Belg. 2003;69:13–17.
5. Klintberg IH, Karlsson J, Svantesson U. Health-related quality of life, patient satisfaction, and physical activity 8–11 years after arthroscopic subacromial decompression. J Shoulder Elbow Surg. 2011;20:598–608.
6. Klintberg IH, Svantesson U, Karlsson J. Long-term patient satisfaction and functional outcome 8-11 years after subacromial decompression. Knee Surg Sports Traumatol Arthrosc. 2010;18:394–403.
7. Bjornsson H, Norlin R, Knutsson A, et al. Fewer rotator cuff tears fifteen years after arthroscopic subacromial decompression. J Shoulder Elbow Surg. 2010;19:111–115.
8. Washington State Department of Labor and Industries. Shoulder Conditions Diagnosis and Treatment Guideline. Available at: http://www.lni.wa.gov/ClaimsIns/Files/OMD/MedTreat/FINALguidelineShoulderConditionsOct242013.pdf. Accessed October 20, 2015.
It’s impossible to say for certain in the absence of randomized controlled trials. However, in patients whose impingement symptoms don’t improve after 3 to 6 months, arthroscopic subacromial decompression (ASD) is associated with modest (about 10%) long-term improvement in pain and function compared with open acromioplasty or baseline (strength of recommendation [SOR]: B, cohort studies).
Patients older than 57 years may do better with surgery than physical therapy (SOR: B, single cohort study).
EVIDENCE SUMMARY
Six cohort studies found that patients who underwent ASD for subacromial impingement had improved pain and function scores at 4.5 to 12 years after surgery (TABLE1-7). Weaknesses of the overall data set include use of heterogeneous outcome measures across studies, lack of sham surgical controls, and lack of blinding.
ASD improves pain and function slightly more than other treatments
One prospective and one retrospective cohort trial compared ASD with another intervention. In the prospective trial, ASD was associated with a 10% better combined pain and function score than open acromioplasty at 12 years.1 In the retrospective trial, ASD was also associated with a 10% better combined pain and function score than prolonged physical therapy in patients older than 57 years (the median age of study participants) but not patients younger than 57 years.2
Two other studies found improvements in pain and function
Two other prospective cohort studies didn’t use a comparison group but followed changes in standardized shoulder pain and function scores for 5 to 6 years after ASD. In one study, pain decreased 6 points on a 10-point visual analog scale by 6 months postop (P<.001).3 In both studies, a 9% to 10% improvement in function was seen between 6 months and 5 to 6 years after surgery.3,4
A third cohort study that asked patients about overall pain and satisfaction 8 to 11 years after ASD found that most were “very” or “quite” satisfied and half were pain-free.5,6
Rotator cuff tears found less likely with ASD
An anatomic study obtained ultrasounds of patients 13 to 17 years after ASD and compared the findings to rotator cuff ultrasounds of the general population.7 Patients who had ASD were 22% less likely to demonstrate rotator cuff tears at the end of the study (no statistics were reported to measure significance).
RECOMMENDATIONS
Guidelines from the Washington State Department of Labor and Industry state that patients who should undergo isolated subacromial decompression (with or without acromioplasty) need to have documented subacromial impingement syndrome with magnetic resonance imaging evidence of rotator cuff tendonopathy or tear, have undergone 12 weeks of conservative therapy (including at least active assisted range of motion and home-based exercises), and have had a subacromial injection with a local anesthetic that has provided documented relief of pain.8
No current guidelines are available from national or international orthopedic or sports medicine organizations.
1. Odenbring S, Wagner P, Atroshi I. Long-term outcomes of arthroscopic acromioplasty of chronic shoulder impingement syndrome: a prospective cohort study with a minimum of 12 years’ follow-up. Arthroscopy. 2008;24:1092–1098.
2. Biberthaler P, Beirer M, Kirchhoff S, et al. Significant benefit for older patients after arthroscopic subacromial decompression: a long-term follow-up study. Int Orthop. 2013;37:457–462.
3. Lunsjo K, Bengtsson M, Nordqvist A, et al. Patients with shoulder impingement remain satisfied 6 years after arthroscopic subacromial decompression. Acta Orthop. 2011;82:711–713.
4. Dom K, Van Glabbeek F, Van Riet RP, et al. Arthroscopic subacromial decompression for advanced (stage II) impingement syndrome: a study of 52 patients with 5 year follow-up. Acta Orthop Belg. 2003;69:13–17.
5. Klintberg IH, Karlsson J, Svantesson U. Health-related quality of life, patient satisfaction, and physical activity 8–11 years after arthroscopic subacromial decompression. J Shoulder Elbow Surg. 2011;20:598–608.
6. Klintberg IH, Svantesson U, Karlsson J. Long-term patient satisfaction and functional outcome 8-11 years after subacromial decompression. Knee Surg Sports Traumatol Arthrosc. 2010;18:394–403.
7. Bjornsson H, Norlin R, Knutsson A, et al. Fewer rotator cuff tears fifteen years after arthroscopic subacromial decompression. J Shoulder Elbow Surg. 2010;19:111–115.
8. Washington State Department of Labor and Industries. Shoulder Conditions Diagnosis and Treatment Guideline. Available at: http://www.lni.wa.gov/ClaimsIns/Files/OMD/MedTreat/FINALguidelineShoulderConditionsOct242013.pdf. Accessed October 20, 2015.
Evidence-based answers from the Family Physicians Inquiries Network
EHR use and patient satisfaction: What we learned
ABSTRACT
Purpose Few studies have quantitatively examined the degree to which the use of the computer affects patients’ satisfaction with the clinician and the quality of the visit. We conducted a study to examine this association.
Methods Twenty-three clinicians (21 internal medicine physicians, 2 nurse practitioners) were recruited from 4 Veteran Affairs Medical Center (VAMC) clinics located in San Diego, Calif. Five to 6 patients for most clinicians (one patient each for 2 of the clinicians) were recruited to participate in a study of patient-physician communication. The clinicians’ computer use and the patient-clinician interactions in the exam room were captured in real time via video recordings of the interactions and the computer screen, and through the use of the Morae usability testing software system, which recorded clinician clicks and scrolls on the computer. After the visit, patients were asked to complete a satisfaction survey.
Results The final sample consisted of 126 consultations. Total patient satisfaction (beta=0.014; P=.027) and patient satisfaction with patient-centered communication (beta=0.02; P=.02) were significantly associated with higher clinician “gaze time” at the patient. A higher percentage of gaze time during a visit (controlling for the length of the visit) was significantly associated with greater satisfaction with patient-centered communication (beta=0.628; P=.033).
Conclusions Higher clinician gaze time at the patient predicted greater patient satisfaction. This suggests that clinicians would be well served to refine their multitasking skills so that they communicate in a patient-centered manner while performing necessary computer-related tasks. These findings also have important implications for clinical training with respect to using an electronic health record (EHR) system in ways that do not impede the one-on-one conversation between clinician and patient.
Primary care physicians’ use of electronic health record (EHR) systems has markedly increased in recent years. For example, a 2008 study of more than 1000 randomly selected practicing physicians in Massachusetts found that 33% utilized an EHR.1 Many physicians believe that EHR systems are beneficial to patient care,2 and several studies have supported this perception, showing clear benefits of EHR use. A study of one component of EHR systems—computerized physician order entry (CPOE)—found that CPOEs resulted in a >50% decrease in serious medication errors.3 Other errors have declined with the use of EHR systems, as well; Virapongse et al1 found a trend towards fewer paid malpractice claims against physicians who used an EHR compared to those physicians using paper charting.
EHR systems may also improve efficiency. In a study of a health maintenance organization (HMO) model, initiating an EHR system improved efficiency by decreasing office visits.4 Widespread adoption of EHR systems could save an estimated $81 billion annually through reductions in errors and adverse events, and improved preventive care and chronic disease management.5 In a survey of approximately 300 patients who had been evaluated at a family medicine clinic for hypertension, high blood pressure without hypertension, or hyperlipidemia, 75% indicated that they felt EHRs had a positive impact on their care.6
However, some clinicians are concerned about the possible negative impact of EHR systems on health care. One major concern is that EHR systems might increase physician workload7 and the amount of time spent using a computer during patient visits. A study that examined physician EHR use found that while time spent on certain tasks, such as prescription writing and lab ordering, was reduced, there was an overall increase in time spent on computer tasks related to charting, preventive care, and chronic disease management.8 Baron et al9 also found an increase in time spent using the EHR during each clinic session in one private practice setting.
Physicians are also concerned that EHR systems might interfere with the patient-physician interaction (eg, maintaining eye contact, paying attention to patients’ concerns) by directing the physician’s attention away from the patient and toward the computer.10 In one study, this concern increased after physicians started utilizing a new EHR system.11 Although a survey of inpatients indicated that residents engaged in greater patient-physician communication after an EHR was implemented,12 a separate study conducted in an outpatient setting found physicians spent less time looking at patients after converting from a paper-based system to an EHR system.13
Very few studies have quantitatively examined the association of patient satisfaction with clinician EHR usage. The goal of this study was to examine the correlation of patient satisfaction with actual EHR usage in an ambulatory setting. The data reported in this paper are part of a larger study aimed at understanding EHR use in a VAMC.
METHODS

Study design and sample
The study participants were clinicians in 4 VAMC community clinics located in San Diego, Calif. Twenty-three clinicians (21 general internal medicine physicians and 2 nurse practitioners) were enrolled in the study. Most clinicians identified 5 to 6 patients from their practices to participate in the study (2 participants identified only one patient each). All patients were visiting their clinician for either an acute visit or a follow-up visit.
Although there were slight variations in clinic room size and shape, all rooms were equipped with a compact desk against a wall, a rolling desk chair, a desktop computer with keyboard and mouse, and a second, fixed chair placed diagonal to the physician’s chair. Two rooms had dual monitors. There was a standard examination table in all examination rooms.
The clinicians’ computer use and the patient-clinician interactions in the exam room were captured in real time via video recordings of the interactions and the computer screen. A usability testing software system (Morae) was used to record clinicians’ computer activities, including mouse clicks and scrolls on the computer. The Computerized Patient Records System (CPRS) was the EHR used by all clinicians in this study.
At the end of the visit, patients were asked to complete a satisfaction survey with questions in 3 domains: the physician’s engagement in patient-centered communication, the physician’s clinical skills, and the physician’s interpersonal skills.
Data analysis
Descriptive statistics were used to document patient characteristics, the clinicians’ EHR usage (total number of mouse clicks and scrolls during the visit) and interaction with the patient (gaze time at EHR vs at patient and companion), and to summarize patient satisfaction with the visit. To account for clinician cluster effect, a linear mixed effects model was used to assess the associations between patient satisfaction with the clinician and 2 variables: the amount of clinician time spent viewing or using the computer and the clinician time spent interacting with the patient.
We also assessed the above associations by controlling for visit length. Visit lengths not significant at P<.10 were reported as unadjusted analyses.
All analyses were performed using R statistical software, with a P value of <.05 interpreted as statistically significant.
RESULTS
Satisfaction surveys and video and Morae data were collected for 126 individual patient office visits to the 23 participating physicians and nurses. A majority of the patients who participated in the study were older (mean: 60.5 years; standard deviation [SD]=13.4 years), male as expected in a VA setting (96.8%), Caucasian (65.1%), and had at least some college education (81.7%, TABLE 1).
Patients rated their satisfaction in 3 domains—patient-centered communication, physician clinical skills, and physician interpersonal skills—using a 1 to 5 scale (1=least satisfied, 5=most satisfied). Patients in this study were highly satisfied with their physician or nurse in all 3 domains and overall (TABLE 2), with an average satisfaction score of 4.52 ± 0.51 for patient-centered communication, 4.71 ± 0.56 for physician clinical skills, 4.86 ± 0.32 for physician interpersonal skills, and 4.64 ± 0.38 for total satisfaction.
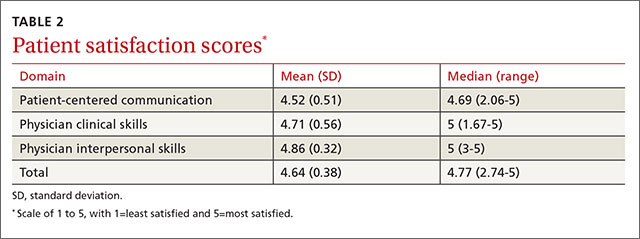
The physicians and nurses used their EHR system extensively during the visits as delineated by the number of clicks and scrolls on the computer. The average number of clicks and scrolls was 192, with a maximum of 685 clicks and scrolls during one visit. The average visit lasted 30.7 minutes, and on average the clinician spent 12.7 minutes (SD: 8.22 minutes), or an average of about 39.4% of total visit time, viewing or working on the EHR; an average of 10.8 minutes (SD: 5.63 minutes), or an average of about 36.3% of total visit time, was spent interacting with the patient (TABLE 3).
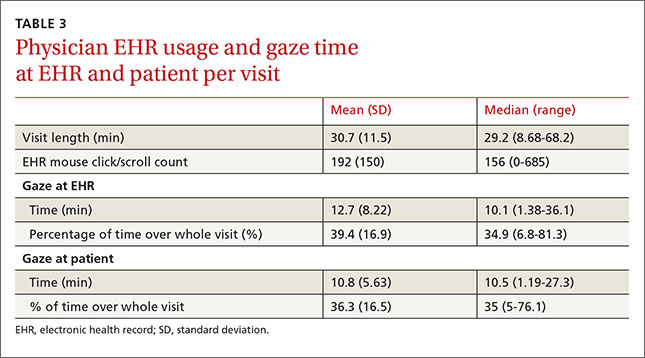
Without adjusting for visit length, patient satisfaction with the clinicians’ patientcentered communication (beta=0.02; P=.02) and total satisfaction (beta=0.014; P=.027) were significantly associated with clinicians’ gaze time at the patient; more clinician gaze time at the patient resulted in greater patient satisfaction (TABLE 4). Adding visit length to the above models had no significant effect (P>.10); therefore, we did not include it in the models.
Patient satisfaction with clinicians’ interpersonal skills was positively associated with gaze time at the patient (beta=0.013, P =.017) without adjusting for visit length. Since the normal assumption of residuals was not plausible based on a normal probability plot, we also assessed the association by dichotomizing the score (5=very satisfied vs <5=not very satisfied) and this significance disappeared. This association was not significant while controlling for visit length.
The percentage of gaze time at the patient (the fraction of patient gaze time over the entire visit) was not significantly associated with patient-centered communication (beta=0.483, P=.12, TABLE 4) when not adjusted for visit length. After adjusting for visit length (P=.052), the association became significant (beta=0.628, P=.033); thus, the higher percentage of time the clinician spent interacting with the patient, the more satisfied the patient was.
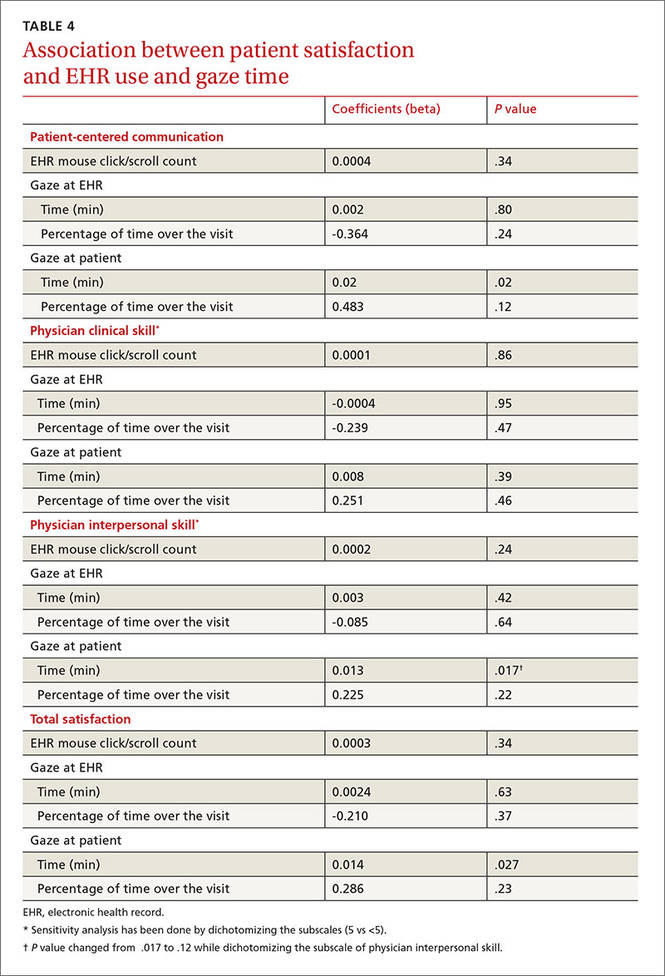
DISCUSSION
In this study, patients were highly satisfied with their clinicians despite often high usage of the EHR. Gadd and Penrod11 reported that patients perceived no impact on communication or eye contact with the clinician despite the initiation of an EHR system in 6 large academic medical practices. Another study demonstrated no significant differences in patient satisfaction with their physicians when comparing patients whose physicians used a paper charting system with those who used an EHR system.14
The fact that patients demonstrated high levels of satisfaction with patient-clinician communication even for clinicians with high EHR usage is somewhat surprising. However, Hsu et al15 found patients’ satisfaction with their clinicians’ communication about medical issues and familiarity with them increased 7 months after implementing an EHR system. In a different study that analyzed videotaped interactions between patients and 5 physicians, the patients found it disturbing not knowing what their doctor was doing when he or she worked on the computer, and preferred being able to see the computer screen.16 This study suggests that it’s advisable for clinicians to describe what they are doing when they use the computer, so that patients better understand how this time spent inputting data actually benefits them.
EHRs can be time-consuming. Physicians and nurses in our study interacted with the EHR a great deal during the office visit, as evidenced by the large average number of clicks and scrolls. This finding confirms clinicians’ perceptions of the amount of work the EHR system requires. For example, in a semi-structured interview of physicians regarding their use of a VA EHR system,10 one respondent noted that the reminders in the EHR required hundreds of clicks.
In our study, the average number of clicks and scrolls during the visit was 192, with some clinicians registering hundreds more. In fact, concerns about the time involved in the use of the EHR and about the adequacy of data collection may lead some clinicians who currently don’t have an EHR system to be reluctant to integrate one into their practices.17
Makoul et al18 found that compared with physicians who used a paper chart, physicians who used an EHR system were more active in clarifying information from the patient and encouraging patient questions during visits, although the study found a trend toward less active roles in more patient-centered communication when using an EHR system. This latter finding is similar to the concerns raised in our study.
Clinical and communication skills are factors, too. One study found that compared to patients who were cared for by more experienced physicians, patients seen by residents using EHRs were more likely to feel that the physician spent less time talking with them and examining them; they were also more likely to report that the visit felt less personal.19 Another study found that clinicians with poor baseline communication skills had more difficulties interacting with patients when an EHR system was introduced than those who had better baseline communication skills.20
Training needed to improve communication during EHR use. Research has shown that when used properly and thoughtfully, EHR use can result in greater patient engagement.21 But, as noted above, there are challenges, suggesting a need for training clinicians to more successfully use an EHR system while simultaneously communicating with their patients.
Study limitations. This study was conducted at a single site, using a single EHR system deployed in the VA clinics. We cannot generalize our findings to other sites or types of clinic systems. Other EHR systems may have different functionalities, which may affect the time required to provide the same type of medical care.
In addition, the study involved only 23 physicians and nurses in a single health system. Other clinicians may have patterns different from those we studied, although a wide range of patterns was seen among the participants, as demonstrated by the large variation in the number of clicks and scrolls. Another limitation is that study patients were not randomly selected, but rather referred by the provider, and the visits were not blinded to either the provider or patient. This may cause some selection bias.
In this study of VA clinicians’ EHR use, patients expressed satisfaction with the clinicians’ clinical skills and patient-centered communication when the clinician spent more time and a greater percentage of the visit engaging the patient. EHR systems need to be designed in a clinician-friendly manner that allows for increased time during the interaction for face-to-face communication between the clinician and the patient, and to ease the workload of EHR documentation. In the meantime, clinicians should be trained in how to expedite their use of the EHR during the clinical visit as well as outside of the exam room in order to improve their patients’ satisfaction.
CORRESPONDENCE
Neil J. Farber, MD, University of California, San Diego, 8939 Villa La Jolla Drive, La Jolla, CA 92037; [email protected].
1. Virapongse A, Bates DW, Shi P, et al. Electronic health records and malpractice claims in office practice. Arch Intern Med. 2008;168:2362-2367.
2. DesRoches CM, Campbell EG, Rao SR, et al. Electronic health records in ambulatory care—a national survey of physicians. N Engl J Med. 2008;359:50-60.
3. Bates DW, Leape LL, Cullen DJ, et al. Effect of computerized physician order entry and a team intervention on prevention of serious medication errors. JAMA. 1998;280:1311-1316.
4. Chen C, Garrido T, Chock D, et al. The Kaiser Permanente Electronic Health Record: transforming and streamlining modalities of care. Health Aff (Millwood). 2009;28:323-333.
5. Hillestad R, Bigelow J, Bower A, et al. Can electronic medical record systems transform health care? Potential health benefits, savings, and costs. Health Aff (Millwood). 2005;24:1103-1117.
6. Garrison GM, Bernard ME, Rasmussen NH. 21st-century health care: the effect of computer use by physicians on patient satisfaction at a family medicine clinic. Fam Med. 2002;34:362-368.
7. Likourezos A, Chalfin DB, Murphy DG, et al. Physician and nurse satisfaction with an Electronic Medical Record system. J Emerg Med. 2004;27:419-424.
8. Howard J, Clark EC, Friedman A, et al. Electronic health record impact on work burden in small, unaffiliated, community-based primary care practices. J Gen Intern Med. 2013;28:107-113.
9. Baron RJ. What’s keeping us so busy in primary care? A snapshot from one practice. N Engl J Med. 2010;362:1632-1636.
10. Bonner LM, Simons CE, Parker LE, et al. ‘To take care of the patients’: Qualitative analysis of Veterans Health Administration personnel experiences with a clinical informatics system. Implement Sci. 2010;5:63.
11. Gadd CS, Penrod LE. Dichotomy between physicians’ and patients’ attitudes regarding EMR use during outpatient encounters. Proc AMIA Symp. 2000:275-279.
12. Migdal CW, Namavar AA, Mosley VN, et al. Impact of electronic health records on the patient experience in a hospital setting. J Hosp Med. 2014;9:627-633.
13. Asan O, D Smith P, Montague E. More screen time, less face time - implications for EHR design. J Eval Clin Pract. 2014;20:896-901.
14. Legler JD, Oates R. Patients’ reactions to physician use of a computerized medical record system during clinical encounters. J Fam Pract. 1993;37:241-244.
15. Hsu J, Huang J, Fung V, et al. Health information technology and physician-patient interactions: impact of computers on communication during outpatient primary care visits. J Am Med Inform Assoc. 2005;12:474-480.
16. Als AB. The desk-top computer as a magic box: patterns of behaviour connected with the desk-top computer; GPs’ and patients’ perceptions. Fam Pract. 1997;14:17-23.
17. Bates DW. Physicians and ambulatory electronic health records. Health Aff (Millwood). 2005;24:1180-1189.
18. Makoul G, Curry RH, Tang PC. The use of electronic medical records: communication patterns in outpatient encounters. J Am Med Inform Assoc. 2001;8:610-615.
19. Rouf E, Whittle J, Lu N, et al. Computers in the exam room: differences in physician-patient interaction may be due to physician experience. J Gen Intern Med. 2007;22:43-48.
20. Frankel R, Altschuler A, George S, et al. Effects of exam-room computing on clinician-patient communication: a longitudinal qualitative study. J Gen Intern Med. 2005;20:677-682.
21. Asan O, Young HN, Chewning B, et al. How physician electronic health record screen sharing affects patient and doctor nonverbal communication in primary care. Patient Educ Couns. 2015;98:310-316.
ABSTRACT
Purpose Few studies have quantitatively examined the degree to which the use of the computer affects patients’ satisfaction with the clinician and the quality of the visit. We conducted a study to examine this association.
Methods Twenty-three clinicians (21 internal medicine physicians, 2 nurse practitioners) were recruited from 4 Veteran Affairs Medical Center (VAMC) clinics located in San Diego, Calif. Five to 6 patients for most clinicians (one patient each for 2 of the clinicians) were recruited to participate in a study of patient-physician communication. The clinicians’ computer use and the patient-clinician interactions in the exam room were captured in real time via video recordings of the interactions and the computer screen, and through the use of the Morae usability testing software system, which recorded clinician clicks and scrolls on the computer. After the visit, patients were asked to complete a satisfaction survey.
Results The final sample consisted of 126 consultations. Total patient satisfaction (beta=0.014; P=.027) and patient satisfaction with patient-centered communication (beta=0.02; P=.02) were significantly associated with higher clinician “gaze time” at the patient. A higher percentage of gaze time during a visit (controlling for the length of the visit) was significantly associated with greater satisfaction with patient-centered communication (beta=0.628; P=.033).
Conclusions Higher clinician gaze time at the patient predicted greater patient satisfaction. This suggests that clinicians would be well served to refine their multitasking skills so that they communicate in a patient-centered manner while performing necessary computer-related tasks. These findings also have important implications for clinical training with respect to using an electronic health record (EHR) system in ways that do not impede the one-on-one conversation between clinician and patient.
Primary care physicians’ use of electronic health record (EHR) systems has markedly increased in recent years. For example, a 2008 study of more than 1000 randomly selected practicing physicians in Massachusetts found that 33% utilized an EHR.1 Many physicians believe that EHR systems are beneficial to patient care,2 and several studies have supported this perception, showing clear benefits of EHR use. A study of one component of EHR systems—computerized physician order entry (CPOE)—found that CPOEs resulted in a >50% decrease in serious medication errors.3 Other errors have declined with the use of EHR systems, as well; Virapongse et al1 found a trend towards fewer paid malpractice claims against physicians who used an EHR compared to those physicians using paper charting.
EHR systems may also improve efficiency. In a study of a health maintenance organization (HMO) model, initiating an EHR system improved efficiency by decreasing office visits.4 Widespread adoption of EHR systems could save an estimated $81 billion annually through reductions in errors and adverse events, and improved preventive care and chronic disease management.5 In a survey of approximately 300 patients who had been evaluated at a family medicine clinic for hypertension, high blood pressure without hypertension, or hyperlipidemia, 75% indicated that they felt EHRs had a positive impact on their care.6
However, some clinicians are concerned about the possible negative impact of EHR systems on health care. One major concern is that EHR systems might increase physician workload7 and the amount of time spent using a computer during patient visits. A study that examined physician EHR use found that while time spent on certain tasks, such as prescription writing and lab ordering, was reduced, there was an overall increase in time spent on computer tasks related to charting, preventive care, and chronic disease management.8 Baron et al9 also found an increase in time spent using the EHR during each clinic session in one private practice setting.
Physicians are also concerned that EHR systems might interfere with the patient-physician interaction (eg, maintaining eye contact, paying attention to patients’ concerns) by directing the physician’s attention away from the patient and toward the computer.10 In one study, this concern increased after physicians started utilizing a new EHR system.11 Although a survey of inpatients indicated that residents engaged in greater patient-physician communication after an EHR was implemented,12 a separate study conducted in an outpatient setting found physicians spent less time looking at patients after converting from a paper-based system to an EHR system.13
Very few studies have quantitatively examined the association of patient satisfaction with clinician EHR usage. The goal of this study was to examine the correlation of patient satisfaction with actual EHR usage in an ambulatory setting. The data reported in this paper are part of a larger study aimed at understanding EHR use in a VAMC.
METHODS
Study design and sample
The study participants were clinicians in 4 VAMC community clinics located in San Diego, Calif. Twenty-three clinicians (21 general internal medicine physicians and 2 nurse practitioners) were enrolled in the study. Most clinicians identified 5 to 6 patients from their practices to participate in the study (2 participants identified only one patient each). All patients were visiting their clinician for either an acute visit or a follow-up visit.
Although there were slight variations in clinic room size and shape, all rooms were equipped with a compact desk against a wall, a rolling desk chair, a desktop computer with keyboard and mouse, and a second, fixed chair placed diagonal to the physician’s chair. Two rooms had dual monitors. There was a standard examination table in all examination rooms.
The clinicians’ computer use and the patient-clinician interactions in the exam room were captured in real time via video recordings of the interactions and the computer screen. A usability testing software system (Morae) was used to record clinicians’ computer activities, including mouse clicks and scrolls on the computer. The Computerized Patient Records System (CPRS) was the EHR used by all clinicians in this study.
At the end of the visit, patients were asked to complete a satisfaction survey with questions in 3 domains: the physician’s engagement in patient-centered communication, the physician’s clinical skills, and the physician’s interpersonal skills.
Data analysis
Descriptive statistics were used to document patient characteristics, the clinicians’ EHR usage (total number of mouse clicks and scrolls during the visit) and interaction with the patient (gaze time at EHR vs at patient and companion), and to summarize patient satisfaction with the visit. To account for clinician cluster effect, a linear mixed effects model was used to assess the associations between patient satisfaction with the clinician and 2 variables: the amount of clinician time spent viewing or using the computer and the clinician time spent interacting with the patient.
We also assessed the above associations by controlling for visit length. Visit lengths not significant at P<.10 were reported as unadjusted analyses.
All analyses were performed using R statistical software, with a P value of <.05 interpreted as statistically significant.
RESULTS
Satisfaction surveys and video and Morae data were collected for 126 individual patient office visits to the 23 participating physicians and nurses. A majority of the patients who participated in the study were older (mean: 60.5 years; standard deviation [SD]=13.4 years), male as expected in a VA setting (96.8%), Caucasian (65.1%), and had at least some college education (81.7%, TABLE 1).
Patients rated their satisfaction in 3 domains—patient-centered communication, physician clinical skills, and physician interpersonal skills—using a 1 to 5 scale (1=least satisfied, 5=most satisfied). Patients in this study were highly satisfied with their physician or nurse in all 3 domains and overall (TABLE 2), with an average satisfaction score of 4.52 ± 0.51 for patient-centered communication, 4.71 ± 0.56 for physician clinical skills, 4.86 ± 0.32 for physician interpersonal skills, and 4.64 ± 0.38 for total satisfaction.
The physicians and nurses used their EHR system extensively during the visits as delineated by the number of clicks and scrolls on the computer. The average number of clicks and scrolls was 192, with a maximum of 685 clicks and scrolls during one visit. The average visit lasted 30.7 minutes, and on average the clinician spent 12.7 minutes (SD: 8.22 minutes), or an average of about 39.4% of total visit time, viewing or working on the EHR; an average of 10.8 minutes (SD: 5.63 minutes), or an average of about 36.3% of total visit time, was spent interacting with the patient (TABLE 3).
Without adjusting for visit length, patient satisfaction with the clinicians’ patientcentered communication (beta=0.02; P=.02) and total satisfaction (beta=0.014; P=.027) were significantly associated with clinicians’ gaze time at the patient; more clinician gaze time at the patient resulted in greater patient satisfaction (TABLE 4). Adding visit length to the above models had no significant effect (P>.10); therefore, we did not include it in the models.
Patient satisfaction with clinicians’ interpersonal skills was positively associated with gaze time at the patient (beta=0.013, P =.017) without adjusting for visit length. Since the normal assumption of residuals was not plausible based on a normal probability plot, we also assessed the association by dichotomizing the score (5=very satisfied vs <5=not very satisfied) and this significance disappeared. This association was not significant while controlling for visit length.
The percentage of gaze time at the patient (the fraction of patient gaze time over the entire visit) was not significantly associated with patient-centered communication (beta=0.483, P=.12, TABLE 4) when not adjusted for visit length. After adjusting for visit length (P=.052), the association became significant (beta=0.628, P=.033); thus, the higher percentage of time the clinician spent interacting with the patient, the more satisfied the patient was.
DISCUSSION
In this study, patients were highly satisfied with their clinicians despite often high usage of the EHR. Gadd and Penrod11 reported that patients perceived no impact on communication or eye contact with the clinician despite the initiation of an EHR system in 6 large academic medical practices. Another study demonstrated no significant differences in patient satisfaction with their physicians when comparing patients whose physicians used a paper charting system with those who used an EHR system.14
The fact that patients demonstrated high levels of satisfaction with patient-clinician communication even for clinicians with high EHR usage is somewhat surprising. However, Hsu et al15 found patients’ satisfaction with their clinicians’ communication about medical issues and familiarity with them increased 7 months after implementing an EHR system. In a different study that analyzed videotaped interactions between patients and 5 physicians, the patients found it disturbing not knowing what their doctor was doing when he or she worked on the computer, and preferred being able to see the computer screen.16 This study suggests that it’s advisable for clinicians to describe what they are doing when they use the computer, so that patients better understand how this time spent inputting data actually benefits them.
EHRs can be time-consuming. Physicians and nurses in our study interacted with the EHR a great deal during the office visit, as evidenced by the large average number of clicks and scrolls. This finding confirms clinicians’ perceptions of the amount of work the EHR system requires. For example, in a semi-structured interview of physicians regarding their use of a VA EHR system,10 one respondent noted that the reminders in the EHR required hundreds of clicks.
In our study, the average number of clicks and scrolls during the visit was 192, with some clinicians registering hundreds more. In fact, concerns about the time involved in the use of the EHR and about the adequacy of data collection may lead some clinicians who currently don’t have an EHR system to be reluctant to integrate one into their practices.17
Makoul et al18 found that compared with physicians who used a paper chart, physicians who used an EHR system were more active in clarifying information from the patient and encouraging patient questions during visits, although the study found a trend toward less active roles in more patient-centered communication when using an EHR system. This latter finding is similar to the concerns raised in our study.
Clinical and communication skills are factors, too. One study found that compared to patients who were cared for by more experienced physicians, patients seen by residents using EHRs were more likely to feel that the physician spent less time talking with them and examining them; they were also more likely to report that the visit felt less personal.19 Another study found that clinicians with poor baseline communication skills had more difficulties interacting with patients when an EHR system was introduced than those who had better baseline communication skills.20
Training needed to improve communication during EHR use. Research has shown that when used properly and thoughtfully, EHR use can result in greater patient engagement.21 But, as noted above, there are challenges, suggesting a need for training clinicians to more successfully use an EHR system while simultaneously communicating with their patients.
Study limitations. This study was conducted at a single site, using a single EHR system deployed in the VA clinics. We cannot generalize our findings to other sites or types of clinic systems. Other EHR systems may have different functionalities, which may affect the time required to provide the same type of medical care.
In addition, the study involved only 23 physicians and nurses in a single health system. Other clinicians may have patterns different from those we studied, although a wide range of patterns was seen among the participants, as demonstrated by the large variation in the number of clicks and scrolls. Another limitation is that study patients were not randomly selected, but rather referred by the provider, and the visits were not blinded to either the provider or patient. This may cause some selection bias.
In this study of VA clinicians’ EHR use, patients expressed satisfaction with the clinicians’ clinical skills and patient-centered communication when the clinician spent more time and a greater percentage of the visit engaging the patient. EHR systems need to be designed in a clinician-friendly manner that allows for increased time during the interaction for face-to-face communication between the clinician and the patient, and to ease the workload of EHR documentation. In the meantime, clinicians should be trained in how to expedite their use of the EHR during the clinical visit as well as outside of the exam room in order to improve their patients’ satisfaction.
CORRESPONDENCE
Neil J. Farber, MD, University of California, San Diego, 8939 Villa La Jolla Drive, La Jolla, CA 92037; [email protected].
1. Virapongse A, Bates DW, Shi P, et al. Electronic health records and malpractice claims in office practice. Arch Intern Med. 2008;168:2362-2367.
2. DesRoches CM, Campbell EG, Rao SR, et al. Electronic health records in ambulatory care—a national survey of physicians. N Engl J Med. 2008;359:50-60.
3. Bates DW, Leape LL, Cullen DJ, et al. Effect of computerized physician order entry and a team intervention on prevention of serious medication errors. JAMA. 1998;280:1311-1316.
4. Chen C, Garrido T, Chock D, et al. The Kaiser Permanente Electronic Health Record: transforming and streamlining modalities of care. Health Aff (Millwood). 2009;28:323-333.
5. Hillestad R, Bigelow J, Bower A, et al. Can electronic medical record systems transform health care? Potential health benefits, savings, and costs. Health Aff (Millwood). 2005;24:1103-1117.
6. Garrison GM, Bernard ME, Rasmussen NH. 21st-century health care: the effect of computer use by physicians on patient satisfaction at a family medicine clinic. Fam Med. 2002;34:362-368.
7. Likourezos A, Chalfin DB, Murphy DG, et al. Physician and nurse satisfaction with an Electronic Medical Record system. J Emerg Med. 2004;27:419-424.
8. Howard J, Clark EC, Friedman A, et al. Electronic health record impact on work burden in small, unaffiliated, community-based primary care practices. J Gen Intern Med. 2013;28:107-113.
9. Baron RJ. What’s keeping us so busy in primary care? A snapshot from one practice. N Engl J Med. 2010;362:1632-1636.
10. Bonner LM, Simons CE, Parker LE, et al. ‘To take care of the patients’: Qualitative analysis of Veterans Health Administration personnel experiences with a clinical informatics system. Implement Sci. 2010;5:63.
11. Gadd CS, Penrod LE. Dichotomy between physicians’ and patients’ attitudes regarding EMR use during outpatient encounters. Proc AMIA Symp. 2000:275-279.
12. Migdal CW, Namavar AA, Mosley VN, et al. Impact of electronic health records on the patient experience in a hospital setting. J Hosp Med. 2014;9:627-633.
13. Asan O, D Smith P, Montague E. More screen time, less face time - implications for EHR design. J Eval Clin Pract. 2014;20:896-901.
14. Legler JD, Oates R. Patients’ reactions to physician use of a computerized medical record system during clinical encounters. J Fam Pract. 1993;37:241-244.
15. Hsu J, Huang J, Fung V, et al. Health information technology and physician-patient interactions: impact of computers on communication during outpatient primary care visits. J Am Med Inform Assoc. 2005;12:474-480.
16. Als AB. The desk-top computer as a magic box: patterns of behaviour connected with the desk-top computer; GPs’ and patients’ perceptions. Fam Pract. 1997;14:17-23.
17. Bates DW. Physicians and ambulatory electronic health records. Health Aff (Millwood). 2005;24:1180-1189.
18. Makoul G, Curry RH, Tang PC. The use of electronic medical records: communication patterns in outpatient encounters. J Am Med Inform Assoc. 2001;8:610-615.
19. Rouf E, Whittle J, Lu N, et al. Computers in the exam room: differences in physician-patient interaction may be due to physician experience. J Gen Intern Med. 2007;22:43-48.
20. Frankel R, Altschuler A, George S, et al. Effects of exam-room computing on clinician-patient communication: a longitudinal qualitative study. J Gen Intern Med. 2005;20:677-682.
21. Asan O, Young HN, Chewning B, et al. How physician electronic health record screen sharing affects patient and doctor nonverbal communication in primary care. Patient Educ Couns. 2015;98:310-316.

This Adjunct Medication Can Speed CAP Recovery
PRACTICE CHANGER
Prescribe oral prednisone 50 mg/d to hospitalized patients with mild-to-moderate community-acquired pneumonia. It decreases time to clinical stability and length of hospital stay.1
STRENGTH OF RECOMMENDATION
A: Based on a single good-quality randomized controlled trial (RCT) and meta-analysis.1
ILLUSTRATIVE CASE
A 75-year-old woman with hypertension and diabetes presents to the emergency department with shortness of breath, cough, and fever that she’s had for four days. On examination, her temperature is 38.2°C; heart rate, 110 beats/min; respiratory rate, 28 breaths/min; and O2 saturation, 91%. Rhonchi are heard in her right lower lung field; chest x-ray reveals infiltrate in her right lower lobe. The patient is admitted and started on IV antibiotics, IV fluids, acetaminophen for fever, and oxygen. Can anything else be done to speed her recovery?
Community-acquired pneumonia (CAP) is responsible for more than 1 million hospitalizations annually in the United States and is the eighth leading cause of death.2,3 Treatment of CAP typically consists of antibiotics and supportive measures (eg, IV fluids and antipyretics). Because the disease process involves extensive inflammation, adjunct treatment with corticosteroids may be beneficial.
Multiple studies have shown that treatment with corticosteroids can help patients with severe CAP, but the potential benefit in patients with less severe CAP has been uncertain.4,5 A Cochrane systematic review published in 2011 identified six small RCTs that evaluated the impact of corticosteroids on CAP recovery.4 It suggested that corticosteroids may decrease time to recovery, but the studies that included patients with less severe CAP had a relatively high risk for bias.
Subsequently, a 2012 meta-analysis of nine RCTs explored whether corticosteroids affected mortality in CAP; no benefit was observed in patients with less severe CAP.5 Most recently, a 2013 meta-analysis of eight moderate-quality RCTs showed that corticosteroid use was associated with shorter hospital stays but no change in mortality.6
The synthesis of small or moderate-quality studies suggests some potential benefit in treating less severe CAP with corticosteroids, but there has been a need for a large, definitive, high-quality RCT. This study investigated the impact of a short course of oral steroids on inpatients with less severe CAP.
STUDY SUMMARY
Prednisone hastens clinical stabilization, cuts hospital stay
In a multicenter, double-blind RCT, Blum et al1 enrolled 785 patients with CAP who were admitted to one of seven tertiary care hospitals in Switzerland from 2009 to 2014. Patients were eligible if they were 18 or older, had a new infiltrate on chest x-ray, and had at least one additional sign or symptom of respiratory illness (eg, cough, dyspnea, fever, abnormal breathing signs or rales, or elevated or decreased white blood cell count). Patients were excluded if they had a contraindication to corticosteroids, cystic fibrosis, or active tuberculosis.
Patients were randomized to receive either prednisone 50 mg/d or placebo for seven days. They were treated with antibiotics according to accepted local guidelines; most patients received either amoxicillin/clavulanic acid or ceftriaxone. Antibiotic treatment was adjusted according to susceptibility whenever a specific pathogen was identified. Nurses assessed all patients every 12 hours during hospitalization, and laboratory tests were obtained on hospital days 1, 3, 5, and 7, and before discharge. Follow-up telephone interviews were conducted on day 30.
The primary outcome was length of time to clinical stability (eg, at least 24 hours of stable vital signs). This composite endpoint required all of the following: temperature ≤ 37.8°C; heart rate ≤ 100 beats/min; spontaneous respiratory rate ≤ 24 breaths/min; systolic blood pressure ≥ 90 mm Hg (≥ 100 mm Hg for patients diagnosed with hypertension) without vasopressor support; mental status back to baseline; ability to take food by mouth; and adequate oxygenation on room air.
Secondary outcomes included length of hospital stay, pneumonia recurrence, hospital readmission, intensive care unit (ICU) admission, all-cause mortality, and duration of antibiotic treatment. Researchers also explored whether the rates of complications from pneumonia or corticosteroid use differed between the prednisone and placebo groups.
In an intention-to-treat analysis, the median time to clinical stability was shorter for the prednisone group at 3 days (interquartile range [IQR], 2.5 to 3.4) compared to the placebo group at 4.4 days (IQR, 4 - 5; hazard ratio [HR], 1.33). Median time to hospital discharge was also shorter for the prednisone group (6 d vs 7 d; HR, 1.19), as was duration of IV antibiotic treatment (4 d vs 5 d; difference, –0.89 d).
There were no statistically significant differences in pneumonia recurrence, hospital readmission, ICU admission, or all-cause mortality. Patients treated with prednisone were more likely to experience hyperglycemia that required insulin treatment during admission (19% vs 11%; odds ratio, 1.96).
WHAT’S NEW
This large, good-quality study reinforces previous evidence
This is the first rigorous study to show a clear decrease in both time to clinical stability and length of hospital stay. It also used an easy-to-administer dose of oral steroids, instead of the several-day course of IV steroids used in most other studies. The findings from this study were incorporated into a 2015 meta-analysis that confirmed that corticosteroid treatment in patients with less severe CAP results in a shorter length of hospital stay and decreased time to clinical stability.7
CAVEATS
It’s unclear if steroids benefit nonhospitalized patients
Because this study included hospitalized patients only, it’s not clear whether corticosteroids have a role in outpatient treatment of CAP. Additionally, although this was a large, well-designed study, it did not have a sufficient number of patients to examine whether corticosteroids impact mortality among patients with CAP.
Finally, the average length of hospital stay reported in this study was approximately 1.5 days longer than the typical length of stay in the US.2 The average length of stay has varied widely in studies examining corticosteroids in CAP, but good-quality studies have consistently shown a median reduction in length of stay of one day.7
CHALLENGES TO IMPLEMENTATION
Risk for adverse events
Treatment with prednisone increases risk for corticosteroid-related adverse events, primarily hyperglycemia and the need for insulin. This may not be well received by patients or providers. However, these effects appear to resolve quickly after treatment and do not impact the overall time to clinical stability.
REFERENCES
1. Blum CA, Nigro N, Briel M, et al. Adjunct prednisone therapy for patients with community-acquired pneumonia: a multicentre, double-blind, randomized, placebo-controlled trial. Lancet. 2015;385:1511-1518.
2. CDC. FastStats: Pneumonia. www.cdc.gov/nchs/fastats/pneumonia.htm. Accessed September 29, 2015.
3. CDC/National Center for Health Statistics. Top 10 leading causes of death: United States, 1999–2013. http://blogs.cdc.gov/nchs-data-visualization/2015/06/01/leading-causes-of-death. Accessed September 29, 2015.
4. Chen Y, Li K, Pu H, et al. Corticosteroids for pneumonia. Cochrane Database Syst Rev. 2011;3:CD007720.
5. Nie W, Zhang Y, Cheng J, et al. Corticosteroids in the treatment of community-acquired pneumonia in adults: a meta-analysis. PLoS One. 2012;7:e47926.
6. Shafiq M, Mansoor MS, Khan AA, et al. Adjuvant steroid therapy in community-acquired pneumonia: a systematic review and meta-analysis. J Hosp Med. 2013;8:68-75.
7. Siemieniuk RA, Meade MO, Alonso-Coello P, et al. Corticosteroid therapy for patients hospitalized with community-acquired pneumonia: a systematic review and meta-analysis. Ann Intern Med. 2015;163:519-528.
ACKNOWLEDGEMENT
The PURLs Surveillance System was supported in part by Grant Number UL1RR024999 from the National Center For Research Resources, a Clinical Translational Science Award to the University of Chicago. The content is solely the responsibility of the authors and does not necessarily represent the official views of the National Center For Research Resources or the National Institutes of Health.
Copyright © 2015. The Family Physicians Inquiries Network. All rights reserved.
Reprinted with permission from the Family Physicians Inquiries Network and The Journal of Family Practice. 2015;64(10):648-650.
Test your skills: Which imaging studies would you order for these neurologic complaints?
› Use clinical decision tools and American College of Radiology Appropriateness Criteria to determine levels of evidence for ordering specific imaging studies. A
› Consider ordering an imaging study when headache is accompanied by a new neurologic symptom. Computed tomography (CT) without contrast is best for patients who are acutely ill. In the non-emergent setting, magnetic resonance imaging (MRI) with contrast is the optimal study. A
› Order structural neuroimaging as part of the initial work-up of suspected dementia. MRI is the test of choice. A
Strength of recommendation (SOR)
A Good-quality patient-oriented evidence
B Inconsistent or limited-quality patient-oriented evidence
C Consensus, usual practice, opinion, disease-oriented evidence, case series
When patients present with neurologic complaints in outpatient primary care practice, 2 key questions often arise: Should brain imaging be ordered, and if so, which study? Careful history-taking and physical exam findings can suggest differential diagnoses and help determine whether imaging studies could identify potential underlying causes. Further considerations in making a decision are the type of information each modality offers, the possible need for contrast media, benefits vs radiation exposure risks, potential contraindications, and cost and local availability. In this article, we present 3 common outpatient scenarios, and in each case we describe the evidence to support clinical decision-making about imaging.
The American College of Radiology (ACR) Appropriateness Criteria Web site (http://www.acr.org/Quality-Safety/Appropriateness-Criteria) provides radiation exposure information, numerical ratings of imaging studies for individual clinical scenarios, evidence tables, and reference tables for each of its recommendations.1 ACR’s recommendations were developed by expert panels of diagnostic radiologists, interventional radiologists, and radiation oncologists, and designed to help physicians order the most appropriate imaging studies based on patients’ clinical conditions.2 We used these criteria to develop an evaluation strategy for each of our clinical scenarios.
CASE 1 › Carrie D is a 45-year-old woman with a history of migraine without aura generally controlled with Excedrin (acetaminophen, aspirin, and caffeine). She arrives at your office with a 2-day history of severe headache over the top of her head and associated tingling sensation over the left side of her face, but with no vision changes, weakness, or slurred speech. She denies any prior history of numbness or tinging with past headaches. She is a business executive and reports that in the last few weeks, her company has been involved in a high-profile merger. On physical exam, her vital signs are within normal limits. She does not appear acutely ill, but on exam she reports diminished sensation to light touch over the left side of her face, left arm, and left leg compared with the right side.
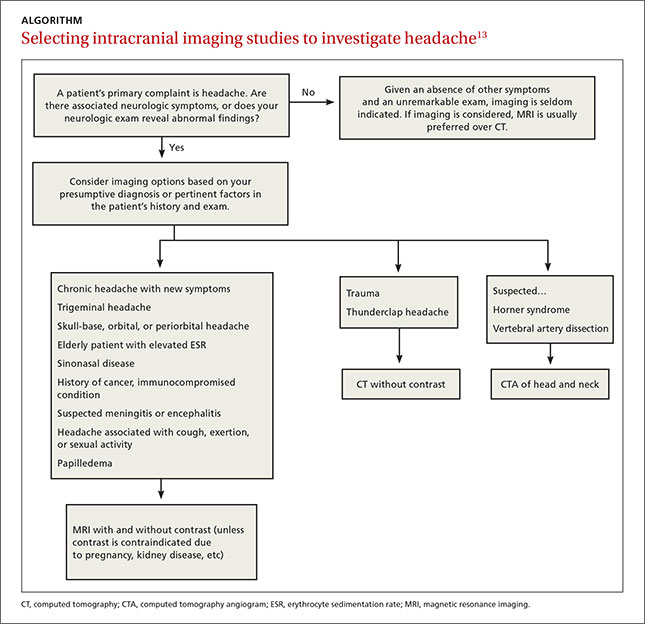
›› What imaging options might you consider?
A prospective review of physicians in an ambulatory family practice setting found that neurologic imaging was typically ordered for patients with headache who were suspected of having a brain tumor or subarachnoid hemorrhage.3 For our patient, who has a history of migraines without aura and whose current severe headache is accompanied by an abnormal sensation on one side of the face, the following questions are relevant: Is this presentation part of her primary headache syndrome or could there be a different cause? If there is a different cause, is it likely to be detected with brain imaging such as computed tomography (CT) or magnetic resonance imaging (MRI)?
Patients with isolated headache and an absence of neurologic symptoms or abnormalities on neurologic exam are unlikely to have a clinically significant intracranial abnormality.4-10 Imaging of the brain is typically not indicated for these patients.2 However, given that this patient does have a positive focal neurologic finding, a CT or MRI is indicated, as findings are more likely to influence management decisions.
The decision to order CT or MRI should be based on how acutely ill the patient is. CT without contrast is an excellent tool to rule out suspected emergent intracranial abnormalities such as an intracranial hemorrhage, hydrocephalus, or a mass.11 In patients presenting with symptoms suggesting acute illness such as carotid or vertebral artery dissection, the most appropriate test would be CT angiography of the head and neck.2
However, the list of less dire causes of headache is vast. Included in this list would be trauma, other vascular disorders such as arteriovenous malformation or temporal arteritis, infection, abnormal intracranial pressure (mass, pseudotumor cerebri, intracranial hypotension), and disorders of the head/face/spine (eg, temporomandibular joint disorder).12
In the non-acute setting where a patient has stable vital signs and is not in acute distress, an MRI with contrast would be the most appropriate test to identify such causes. Avoid contrast only if there is a firm contraindication, such as pregnancy, severely impaired renal function, or known allergy to gadolinium. If history and physical exam findings suggest possible stroke, arrange for MRI and MR angiography with contrast, even if the result of a head CT scan is negative. The ALGORITHM13 offers guidance for choosing imaging studies for headache based on history, physical exam, and laboratory findings.
›› And you order...
…an MRI of the brain with contrast.
Though Ms. D does have a focal neurologic finding in addition to her headache, she does not appear to be acutely ill. Ordering an MRI with contrast is the best first step.
CASE 2 › Anne B is a 72-year-old woman with a history of hypertension, hyperlipidemia, and type 2 diabetes. Her daughter brings her in to see you because she is concerned about Ms. B’s memory. Ms. B’s daughter reports that she has become increasingly forgetful over the past 6 months, often forgetting recent events. At first the forgetfulness was occasional, but now it seems to happen daily and interfere with activities of daily living (ADLs). The week before this visit, Ms. B left a pot heating on the stove because she forgot she had started cooking. She realized what had happened only when her smoke alarm went off. Ms. B’s daughter also thinks her mother may be taking some of her medications incorrectly.
Physical exam and laboratory findings are unremarkable. On the mental status exam, Ms. B has difficulty with registration and recall.
›› What imaging options might you consider?
Ms. B has exhibited progressive memory loss over 6 months and it is now affecting her ADLs. Her symptoms could be secondary to any one of many reversible medical causes, such as adverse medication effects, depression, or vitamin B12 deficiency. If clinical and laboratory evaluations exclude these reversible causes, consider dementia.
With numerous disorders having overlapping symptoms, the diagnosis of degenerative central nervous system (CNS) disease can be extremely tricky. Complicating the issue is the fact that a single patient can have 2 or more concurrent neurodegenerative diseases. Clinical testing is essential in the diagnosis and management of degenerative CNS diseases, but testing sensitivity and specificity are highly variable depending upon the disease.14
Neuroimaging is an important supplement to clinical testing in excluding intracranial abnormalities. There are significant negative consequences of missing reversible causes of memory problems and incorrectly assigning a clinical diagnosis of dementia. Neuroimaging can be subdivided into structural and functional imaging, and structural imaging is the first step in evaluation.15
The American Academy of Neurology recommends the use of structural neuroimaging with CT or MRI in the initial evaluation of patients with dementia to detect such treatable problems as a subdural hematoma, frontal lobe mass, or hydrocephalus.12 Structural imaging may also identify anatomic changes characteristic of degenerative CNS diseases such as Alzheimer’s disease, dementia with Lewy bodies, frontotemporal dementia, vascular dementia, Creutzfeldt-Jakob disease, and Huntington’s disease; however, sensitivities and specificities of testing are low.14
›› And you order...
…an MRI of the brain without contrast.
In Ms. B’s case, structural neuroimaging is indicated as part of the initial work-up of supposed dementia. An MRI without contrast is recommended over CT because it is more sensitive in detecting white matter changes in vascular dementia.16 In cases where an MRI >is unavailable or contraindicated (eg, a patient with a pacemaker), a CT is a reasonable alternative.
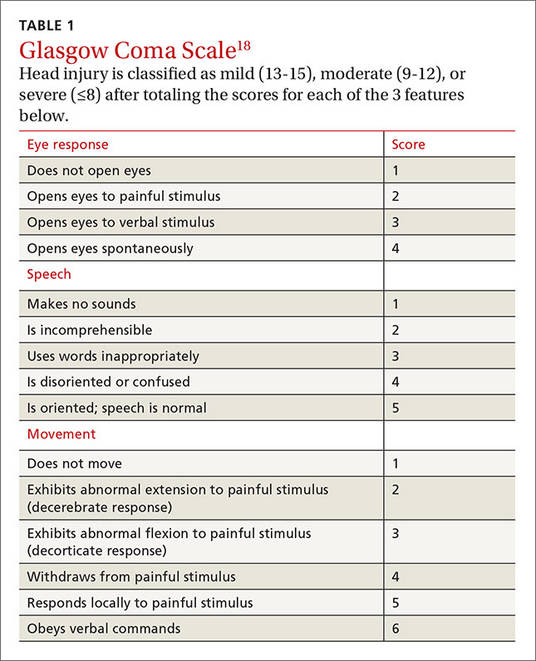
CASE 3 › Bob C is a 78-year-old man with a history of chronic obstructive pulmonary disease and hypertension who arrives at your walk-in clinic accompanied by his home health aide a few hours after having tripped and fallen over a rug at home. At baseline, Mr. C is ambulatory and independent in ADLs.
He takes all of his medications, including a daily baby aspirin (81 mg). Mr. C says he did not lose consciousness at the time of the fall and insists he feels fine, but you notice a bruise developing over his right temporal skull.
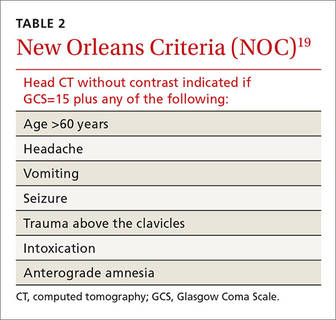
›› What imaging options might you consider?
With acute head trauma deemed severe enough clinically to warrant imaging, non-contrast CT is the most appropriate initial test to identify possible intracranial hemorrhage.11 The Glasgow Coma Scale (GCS) is the tool most widely used for clinical evaluation17 (TABLE 118). The score is based on an assessment of 3 features: eye response, speech, and movement. Head injury is classified as mild (13-15), moderate (9-12), or severe (≤8). It is universally agreed that patients with moderate or severe head injury should be further evaluated with a head CT.
With mild head injury, recommendations for follow-up are less straightforward. The New Orleans Criteria (NOC) and Canadian CT Head Rule (CCHR) are commonly used in triaging patients with minor head trauma in a cost effective way11 (TABLES 219 and 320). The cost-effectiveness of these assessment tools is still questionable, but both have very high sensitivity for identifying patients who will require neurosurgery intervention.21,22 Although the NOC is slightly more sensitive at identifying patients with nonsurgical clinically significant abnormalities, it has a greatly reduced specificity compared with the CCHR.23-25
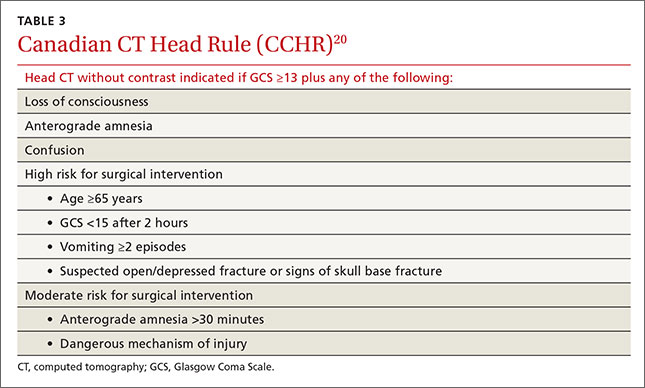
›› And you order...
…a non-contrast head CT.
Mr. C presents with a GCS of 15, indicating mild head trauma. However, in elderly patients, especially ones taking anticoagulation medication, even mild trauma can result in clinically significant abnormalities such as a subdural hematoma.1 Although Mr. C’s physical and neurologic exams are not worrisome, both the NOC and CCHR recommend further evaluation with a non-contrast head CT based on his age.
CORRESPONDENCE
Urmi A. Desai, MD, MS, Columbia University Medical Center, 610 West 158th Street, New York, NY 10032; [email protected].
1. American College of Radiology. Appropriateness criteria. American College of Radiology Web site. Available at: https://acsearch.acr.org/list. Accessed January 4, 2015.
2. American College of Radiology. About the ACR appropriateness criteria. American College of Radiology Web site. Available at: http://www.acr.org/Quality-Safety/Appropriateness-Criteria/About-AC. Accessed July 20, 2015.
3. Becker LA, Green LA, Beaufait D, et al. Use of CT scans for the investigation of headache: a report from ASPN, Part 1. J Fam Pract. 1993;37:129-134.
4. Sandrini G, Friberg L, Jänig W, et al. Neurophysiological tests and neuroimaging procedures in non-acute headache: guidelines and recommendations. Eur J Neurol. 2004;11:217-224.
5. Sempere AP, Porta-Etessam J, Medrano V, et al. Neuroimaging in the evaluation of patients with non-acute headache. Cephalalgia. 2005;25:30-35.
6. Gilbert JW, Johnson KM, Larkin GL, et al. Atraumatic headache in US emergency departments: recent trends in CT/MRI utilisation and factors associated with severe intracranial pathology. Emerg Med J. 2012;29:576-581.
7. Tsushima Y, Endo K. MR imaging in the evaluation of chronic or recurrent headache. Radiology. 2005;235:575-579.
8. Jordan JE, Ramirez GF, Bradley WG, et al. Economic and outcomes assessment of magnetic resonance imaging in the evaluation of headache. J Natl Med Assoc. 2000;92:573-578.
9. Mitchell CS, Osborn RE, Grosskreutz SR. Computed tomography in the headache patient: is routine evaluation really necessary? Headache. 1993;33:82-86.
10. Frishberg BM. The utility of neuroimaging in the evaluation of headache in patients with normal neurologic examinations. Neurology. 1994;44:1191-1197.
11. Osborn AG. Osborn’s Brain: Imaging, Pathology, and Anatomy. Salt Lake City, Utah: Amirsys Publishing; 2013.
12. Silberstein SD. Chronic daily headache. J Am Osteopath Assoc. 2005;105:23S-29S.
13. Douglas AC, Wippold FJ 2nd, Broderick DF, et al. ACR Appropriateness Criteria Headache. J Am Coll Radiol. 2014;11:657-667.
14. Knopman DS, DeKosky ST, Cummings JL, et al. Practice parameter: diagnosis of dementia (an evidence-based review). Report of the Quality Standards Subcommittee of the American Academy of Neurology. Neurology. 2001;56:1143-1153.
15. Wippold FJ 2nd, Brown DC, Broderick DF, et al. ACR Appropriateness Criteria Dementia and Movement Disorders. J Am Coll Radiol. 2015;12:19-28.
16. Kantarci K, Jack CR Jr. Neuroimaging in Alzheimer disease: an evidence-based review. Neuroimaging Clin N Am. 2003;13:197-209.
17. Teasdale G, Maas A, Lecky F, et al. The Glasgow Coma Scale at 40 years: standing the test of time. Lancet Neurol. 2014;13:844-854.
18. Teasdale G, Jennett B. Assessment of coma and impaired consciousness. A practical scale. Lancet. 1974;2:81-84.
19. Haydel MJ, Preston CA, Mills TJ, et al. Indications for computed tomography in patients with minor head injury. N Engl J Med. 2000;343:100-105.
20. Stiell IG, Wells GA, Vandemheen K, et al. The Canadian CT Head Rule for patients with minor head injury. Lancet. 2001;357:1391-1396.
21. Davis PC, Drayer BP, Anderson RE, et al. Head trauma. American College of Radiology. ACR Appropriateness Criteria. Radiology. 2000;215 Suppl:507-524.
22. Stiell IG, Clement CM, Grimshaw JM, et al. A prospective clusterrandomized trial to implement the Canadian CT Head Rule in emergency departments. CMAJ. 2010;182:1527-1532.
23. Smits M, Dippel DW, Nederkoorn PJ, et al. Minor head injury: CT-based strategies for management—a cost-effectiveness analysis. Radiology. 2010;254:532-540.
24. Stiell IG, Clement CM, Rowe BH, et al. Comparison of the Canadian CT Head Rule and the New Orleans Criteria in patients with minor head injury. JAMA. 2005;294:1511-1518.
25. Smits M, Dippel DW, de Haan GG, et al. External validation of the Canadian CT Head Rule and the New Orleans Criteria for CT scanning in patients with minor head injury. JAMA. 2005;294:1519-1525.
› Use clinical decision tools and American College of Radiology Appropriateness Criteria to determine levels of evidence for ordering specific imaging studies. A
› Consider ordering an imaging study when headache is accompanied by a new neurologic symptom. Computed tomography (CT) without contrast is best for patients who are acutely ill. In the non-emergent setting, magnetic resonance imaging (MRI) with contrast is the optimal study. A
› Order structural neuroimaging as part of the initial work-up of suspected dementia. MRI is the test of choice. A
Strength of recommendation (SOR)
A Good-quality patient-oriented evidence
B Inconsistent or limited-quality patient-oriented evidence
C Consensus, usual practice, opinion, disease-oriented evidence, case series
When patients present with neurologic complaints in outpatient primary care practice, 2 key questions often arise: Should brain imaging be ordered, and if so, which study? Careful history-taking and physical exam findings can suggest differential diagnoses and help determine whether imaging studies could identify potential underlying causes. Further considerations in making a decision are the type of information each modality offers, the possible need for contrast media, benefits vs radiation exposure risks, potential contraindications, and cost and local availability. In this article, we present 3 common outpatient scenarios, and in each case we describe the evidence to support clinical decision-making about imaging.
The American College of Radiology (ACR) Appropriateness Criteria Web site (http://www.acr.org/Quality-Safety/Appropriateness-Criteria) provides radiation exposure information, numerical ratings of imaging studies for individual clinical scenarios, evidence tables, and reference tables for each of its recommendations.1 ACR’s recommendations were developed by expert panels of diagnostic radiologists, interventional radiologists, and radiation oncologists, and designed to help physicians order the most appropriate imaging studies based on patients’ clinical conditions.2 We used these criteria to develop an evaluation strategy for each of our clinical scenarios.
CASE 1 › Carrie D is a 45-year-old woman with a history of migraine without aura generally controlled with Excedrin (acetaminophen, aspirin, and caffeine). She arrives at your office with a 2-day history of severe headache over the top of her head and associated tingling sensation over the left side of her face, but with no vision changes, weakness, or slurred speech. She denies any prior history of numbness or tinging with past headaches. She is a business executive and reports that in the last few weeks, her company has been involved in a high-profile merger. On physical exam, her vital signs are within normal limits. She does not appear acutely ill, but on exam she reports diminished sensation to light touch over the left side of her face, left arm, and left leg compared with the right side.
›› What imaging options might you consider?
A prospective review of physicians in an ambulatory family practice setting found that neurologic imaging was typically ordered for patients with headache who were suspected of having a brain tumor or subarachnoid hemorrhage.3 For our patient, who has a history of migraines without aura and whose current severe headache is accompanied by an abnormal sensation on one side of the face, the following questions are relevant: Is this presentation part of her primary headache syndrome or could there be a different cause? If there is a different cause, is it likely to be detected with brain imaging such as computed tomography (CT) or magnetic resonance imaging (MRI)?
Patients with isolated headache and an absence of neurologic symptoms or abnormalities on neurologic exam are unlikely to have a clinically significant intracranial abnormality.4-10 Imaging of the brain is typically not indicated for these patients.2 However, given that this patient does have a positive focal neurologic finding, a CT or MRI is indicated, as findings are more likely to influence management decisions.
The decision to order CT or MRI should be based on how acutely ill the patient is. CT without contrast is an excellent tool to rule out suspected emergent intracranial abnormalities such as an intracranial hemorrhage, hydrocephalus, or a mass.11 In patients presenting with symptoms suggesting acute illness such as carotid or vertebral artery dissection, the most appropriate test would be CT angiography of the head and neck.2
However, the list of less dire causes of headache is vast. Included in this list would be trauma, other vascular disorders such as arteriovenous malformation or temporal arteritis, infection, abnormal intracranial pressure (mass, pseudotumor cerebri, intracranial hypotension), and disorders of the head/face/spine (eg, temporomandibular joint disorder).12
In the non-acute setting where a patient has stable vital signs and is not in acute distress, an MRI with contrast would be the most appropriate test to identify such causes. Avoid contrast only if there is a firm contraindication, such as pregnancy, severely impaired renal function, or known allergy to gadolinium. If history and physical exam findings suggest possible stroke, arrange for MRI and MR angiography with contrast, even if the result of a head CT scan is negative. The ALGORITHM13 offers guidance for choosing imaging studies for headache based on history, physical exam, and laboratory findings.
›› And you order...
…an MRI of the brain with contrast.
Though Ms. D does have a focal neurologic finding in addition to her headache, she does not appear to be acutely ill. Ordering an MRI with contrast is the best first step.
CASE 2 › Anne B is a 72-year-old woman with a history of hypertension, hyperlipidemia, and type 2 diabetes. Her daughter brings her in to see you because she is concerned about Ms. B’s memory. Ms. B’s daughter reports that she has become increasingly forgetful over the past 6 months, often forgetting recent events. At first the forgetfulness was occasional, but now it seems to happen daily and interfere with activities of daily living (ADLs). The week before this visit, Ms. B left a pot heating on the stove because she forgot she had started cooking. She realized what had happened only when her smoke alarm went off. Ms. B’s daughter also thinks her mother may be taking some of her medications incorrectly.
Physical exam and laboratory findings are unremarkable. On the mental status exam, Ms. B has difficulty with registration and recall.
›› What imaging options might you consider?
Ms. B has exhibited progressive memory loss over 6 months and it is now affecting her ADLs. Her symptoms could be secondary to any one of many reversible medical causes, such as adverse medication effects, depression, or vitamin B12 deficiency. If clinical and laboratory evaluations exclude these reversible causes, consider dementia.
With numerous disorders having overlapping symptoms, the diagnosis of degenerative central nervous system (CNS) disease can be extremely tricky. Complicating the issue is the fact that a single patient can have 2 or more concurrent neurodegenerative diseases. Clinical testing is essential in the diagnosis and management of degenerative CNS diseases, but testing sensitivity and specificity are highly variable depending upon the disease.14
Neuroimaging is an important supplement to clinical testing in excluding intracranial abnormalities. There are significant negative consequences of missing reversible causes of memory problems and incorrectly assigning a clinical diagnosis of dementia. Neuroimaging can be subdivided into structural and functional imaging, and structural imaging is the first step in evaluation.15
The American Academy of Neurology recommends the use of structural neuroimaging with CT or MRI in the initial evaluation of patients with dementia to detect such treatable problems as a subdural hematoma, frontal lobe mass, or hydrocephalus.12 Structural imaging may also identify anatomic changes characteristic of degenerative CNS diseases such as Alzheimer’s disease, dementia with Lewy bodies, frontotemporal dementia, vascular dementia, Creutzfeldt-Jakob disease, and Huntington’s disease; however, sensitivities and specificities of testing are low.14
›› And you order...
…an MRI of the brain without contrast.
In Ms. B’s case, structural neuroimaging is indicated as part of the initial work-up of supposed dementia. An MRI without contrast is recommended over CT because it is more sensitive in detecting white matter changes in vascular dementia.16 In cases where an MRI >is unavailable or contraindicated (eg, a patient with a pacemaker), a CT is a reasonable alternative.
CASE 3 › Bob C is a 78-year-old man with a history of chronic obstructive pulmonary disease and hypertension who arrives at your walk-in clinic accompanied by his home health aide a few hours after having tripped and fallen over a rug at home. At baseline, Mr. C is ambulatory and independent in ADLs.
He takes all of his medications, including a daily baby aspirin (81 mg). Mr. C says he did not lose consciousness at the time of the fall and insists he feels fine, but you notice a bruise developing over his right temporal skull.
›› What imaging options might you consider?
With acute head trauma deemed severe enough clinically to warrant imaging, non-contrast CT is the most appropriate initial test to identify possible intracranial hemorrhage.11 The Glasgow Coma Scale (GCS) is the tool most widely used for clinical evaluation17 (TABLE 118). The score is based on an assessment of 3 features: eye response, speech, and movement. Head injury is classified as mild (13-15), moderate (9-12), or severe (≤8). It is universally agreed that patients with moderate or severe head injury should be further evaluated with a head CT.
With mild head injury, recommendations for follow-up are less straightforward. The New Orleans Criteria (NOC) and Canadian CT Head Rule (CCHR) are commonly used in triaging patients with minor head trauma in a cost effective way11 (TABLES 219 and 320). The cost-effectiveness of these assessment tools is still questionable, but both have very high sensitivity for identifying patients who will require neurosurgery intervention.21,22 Although the NOC is slightly more sensitive at identifying patients with nonsurgical clinically significant abnormalities, it has a greatly reduced specificity compared with the CCHR.23-25
›› And you order...
…a non-contrast head CT.
Mr. C presents with a GCS of 15, indicating mild head trauma. However, in elderly patients, especially ones taking anticoagulation medication, even mild trauma can result in clinically significant abnormalities such as a subdural hematoma.1 Although Mr. C’s physical and neurologic exams are not worrisome, both the NOC and CCHR recommend further evaluation with a non-contrast head CT based on his age.
CORRESPONDENCE
Urmi A. Desai, MD, MS, Columbia University Medical Center, 610 West 158th Street, New York, NY 10032; [email protected].
1. American College of Radiology. Appropriateness criteria. American College of Radiology Web site. Available at: https://acsearch.acr.org/list. Accessed January 4, 2015.
2. American College of Radiology. About the ACR appropriateness criteria. American College of Radiology Web site. Available at: http://www.acr.org/Quality-Safety/Appropriateness-Criteria/About-AC. Accessed July 20, 2015.
3. Becker LA, Green LA, Beaufait D, et al. Use of CT scans for the investigation of headache: a report from ASPN, Part 1. J Fam Pract. 1993;37:129-134.
4. Sandrini G, Friberg L, Jänig W, et al. Neurophysiological tests and neuroimaging procedures in non-acute headache: guidelines and recommendations. Eur J Neurol. 2004;11:217-224.
5. Sempere AP, Porta-Etessam J, Medrano V, et al. Neuroimaging in the evaluation of patients with non-acute headache. Cephalalgia. 2005;25:30-35.
6. Gilbert JW, Johnson KM, Larkin GL, et al. Atraumatic headache in US emergency departments: recent trends in CT/MRI utilisation and factors associated with severe intracranial pathology. Emerg Med J. 2012;29:576-581.
7. Tsushima Y, Endo K. MR imaging in the evaluation of chronic or recurrent headache. Radiology. 2005;235:575-579.
8. Jordan JE, Ramirez GF, Bradley WG, et al. Economic and outcomes assessment of magnetic resonance imaging in the evaluation of headache. J Natl Med Assoc. 2000;92:573-578.
9. Mitchell CS, Osborn RE, Grosskreutz SR. Computed tomography in the headache patient: is routine evaluation really necessary? Headache. 1993;33:82-86.
10. Frishberg BM. The utility of neuroimaging in the evaluation of headache in patients with normal neurologic examinations. Neurology. 1994;44:1191-1197.
11. Osborn AG. Osborn’s Brain: Imaging, Pathology, and Anatomy. Salt Lake City, Utah: Amirsys Publishing; 2013.
12. Silberstein SD. Chronic daily headache. J Am Osteopath Assoc. 2005;105:23S-29S.
13. Douglas AC, Wippold FJ 2nd, Broderick DF, et al. ACR Appropriateness Criteria Headache. J Am Coll Radiol. 2014;11:657-667.
14. Knopman DS, DeKosky ST, Cummings JL, et al. Practice parameter: diagnosis of dementia (an evidence-based review). Report of the Quality Standards Subcommittee of the American Academy of Neurology. Neurology. 2001;56:1143-1153.
15. Wippold FJ 2nd, Brown DC, Broderick DF, et al. ACR Appropriateness Criteria Dementia and Movement Disorders. J Am Coll Radiol. 2015;12:19-28.
16. Kantarci K, Jack CR Jr. Neuroimaging in Alzheimer disease: an evidence-based review. Neuroimaging Clin N Am. 2003;13:197-209.
17. Teasdale G, Maas A, Lecky F, et al. The Glasgow Coma Scale at 40 years: standing the test of time. Lancet Neurol. 2014;13:844-854.
18. Teasdale G, Jennett B. Assessment of coma and impaired consciousness. A practical scale. Lancet. 1974;2:81-84.
19. Haydel MJ, Preston CA, Mills TJ, et al. Indications for computed tomography in patients with minor head injury. N Engl J Med. 2000;343:100-105.
20. Stiell IG, Wells GA, Vandemheen K, et al. The Canadian CT Head Rule for patients with minor head injury. Lancet. 2001;357:1391-1396.
21. Davis PC, Drayer BP, Anderson RE, et al. Head trauma. American College of Radiology. ACR Appropriateness Criteria. Radiology. 2000;215 Suppl:507-524.
22. Stiell IG, Clement CM, Grimshaw JM, et al. A prospective clusterrandomized trial to implement the Canadian CT Head Rule in emergency departments. CMAJ. 2010;182:1527-1532.
23. Smits M, Dippel DW, Nederkoorn PJ, et al. Minor head injury: CT-based strategies for management—a cost-effectiveness analysis. Radiology. 2010;254:532-540.
24. Stiell IG, Clement CM, Rowe BH, et al. Comparison of the Canadian CT Head Rule and the New Orleans Criteria in patients with minor head injury. JAMA. 2005;294:1511-1518.
25. Smits M, Dippel DW, de Haan GG, et al. External validation of the Canadian CT Head Rule and the New Orleans Criteria for CT scanning in patients with minor head injury. JAMA. 2005;294:1519-1525.
Fever • eschars on right leg and groin • inguinal lymphadenopathy • Dx?
THE CASE
A 76-year-old man with a history of coronary artery disease presented with a fever, headache, and malaise one week after returning from a big game hunting trip in South Africa. Five days after his return, he noticed lesions on his right leg that eventually scabbed over. He sought care at his local emergency department and with his primary care physician, and completed an empiric trial of azithromycin. His symptoms, however, persisted and he was referred to our institution for evaluation and treatment.
On exam, he had a temperature of 100.5° F, inguinal lymphadenopathy, and 2 eschars: a 1.5 cm one on his right groin and an identical one on the medial aspect of the right popliteal fossa (FIGURE 1).
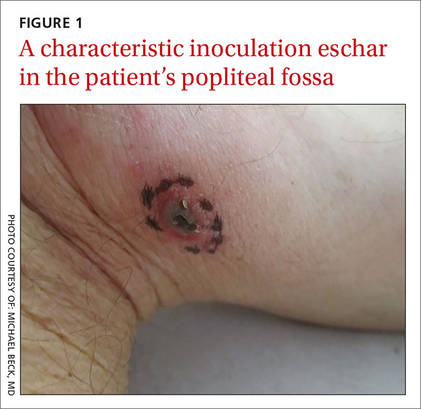
THE DIAGNOSIS
Laboratory studies showed a white blood cell count of 3000/mcL, hemoglobin of 14.1 g/dL, and platelet count of 142,000/mcL; peripheral blood smear was normal. Blood and urine cultures showed no growth. A malaria smear and antibodies for Lyme disease, dengue fever, Chikungunya virus, and Q fever were also negative. A biopsy of the eschar demonstrated epidermal and dermal necrosis consistent with infectious vasculitis caused by rickettsial disease (FIGURE 2). A polymerase chain reaction (PCR) for the spotted fever group (R rickettsii, R akari, and R conorii) and typhus fever group of rickettsial agents (R typhi and R prowazekii) were negative. However, a PCR was positive for R africae, confirming the diagnosis of African tick-bite fever (ATBF).
DISCUSSION
Two common reasons patients returning from international travel seek medical attention are fever and rash.1 Initial assessment should include a detailed travel history of urban and rural exposures and any possible exposure to ticks or fleas. The time course of symptoms is important because some tropical infections can have long incubation periods.2
Rickettsial diseases are the most common febrile illness in patients returning from international travel.1 ATBF caused by R africae is the most common rickettsiosis among returning travelers1 and may be the most widespread of all spotted fever group rickettsiae that are known to be pathogenic to humans.3R africae is endemic to South Africa. The risk of contracting R africae is 4 to 5 times higher than the risk of contracting malaria in South Africa.1
R africae is transmitted through cattle and game ticks (Amblyomma species),1-7 and tends to cause mild illness with rare progression to complicated disease.3 The risk of infection is particularly high from November to April,7 and our patient had traveled during April.
Most patients with ATBF present with fever, headache, and malaise, and 50% develop a variable rash.1,2 Local lymphadenopathy often develops, and marked neck stiffness can occur.2 An eschar is present in 95% of cases.2 The finding of an eschar is often indicative of rickettsial infection; however, not all rickettsioses show eschars, and the absence of an eschar does not exclude rickettsial infection.1
ATBF is usually benign and self-limiting, and no fatalities have been reported.2,4,8 Complications such as peripheral nerve involvement, encephalitis, and myocarditis are rare.5,8 Since rickettsial diseases may be more severe in elderly patients with underlying diseases, empiric treatment with inpatient monitoring is justifiable.5
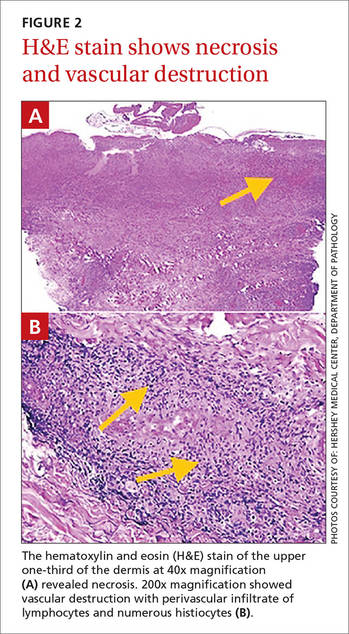
Don’t wait for lab confirmation to begin antibiotics
Laboratory findings in a patient with ATBF include pancytopenia, elevated serum C-reactive protein, and abnormal liver function tests.2,4 A blood PCR detects R africae,1,3 and if a rash or eschar is present, a biopsy can confirm the diagnosis.1 However, confirming the diagnosis is difficult if seroconversion has not occurred and PCR is not readily available.1 Also, antibodies may not be detected in patients who have a mild case of ATBF or those who are immunocompromised.5
If you suspect your patient has ATBF, don’t wait for laboratory confirmation; instead, initiate empiric treatment with doxycycline 100 mg bid twice daily for 5 to 7 days.1,2,4
Preventive measures include repellant lotions, clothing, and gear
Since there are no vaccines or prophylactic treatments for ATBF, counsel travelers on preventive measures.9 Instruct patients who plan to visit an endemic area such as sub-Saharan Africa or the West Indies to wear long-sleeved shirts, long pants, and hats. Individuals should also tuck their shirts into their pants and their pants into socks, as well as wear closed-toe shoes. When possible, it’s advisable to avoid woody and brushy areas.
Over-the-counter repellant lotions that contain ≥20% DEET are effective at preventing tick bites for several hours after an application, but should be reapplied as directed.9 These lotions should be applied after sunscreen. Advise patients that they can purchase clothing and gear that have been treated with the pesticide permethrin, or they can treat clothing and gear themselves. Explain, however, that permethrin should not be applied directly to skin.
Finally, instruct travelers to perform daily tick inspections and shower or bathe as soon as possible after returning from the outdoors.9 Educate patients on the proper technique for tick removal, which is described on the Centers for Disease Control and Prevention’s Web site at http://www.cdc.gov/ticks/removing_a_tick.html.
Our patient completed a 2-week course of doxycycline 100 mg bid. His symptoms and laboratory abnormalities completely resolved.
THE TAKEAWAY
ATBF is the most common rickettsiosis among patients returning from international travel. Because patients may present with several nonspecific symptoms, maintain a high index of suspicion for rickettsial infection among patients returning from sub-Saharan Africa or the West Indies. Though the disease usually can be successfully managed in the outpatient setting with doxycycline, elderly patients or those with comorbid conditions may require inpatient care. Educate patients who plan to travel to an endemic area about measures they can take to prevent exposure to ticks and subsequent infection.
1. Neumayr A, Hatz C, Blum J. Not to be missed! Differential diagnoses of common dermatological problems in returning travellers. Travel Med Infect Dis. 2013;11:337-349.
2. Yates J, Smith P. Fever and rash. Medicine. 2014;42:96-99.
3. Jensenius M, Fournier PE, Kelly P, et al. African tick bite fever. Lancet Infect Dis. 2003;3:557-564.
4. Frean J, Blumberg L, Ogunbanjo GA. Tick bite fever in South Africa. S Afr Fam Pract. 2008;50:33-35.
5. Roch N, Epaulard O, Pelloux I, et al. African tick bite fever in elderly patients: 8 cases in French tourists returning from South Africa. Clin Infect Dis. 2008;47:e28-e35.
6. Caruso G, Zasio C, Guzzo F, et al. Outbreak of African tick-bite fever in six Italian tourists returning from South Africa. Eur J Clin Microbiol Infect Dis. 2002;21:133-136.
7. Tsai YS, Wu YH, Kao PT, et al. African tick bite fever. J Formos Med Assoc. 2008;107:73-76.
8. Jensenius M, Fournier PE, Fladby T, et al. Sub-acute neuropathy in patients with African tick bite fever. Scand J Infect Dis. 2006;38:114-118.
9. Centers for Disease Control and Prevention. African tick-bite fever. Centers for Disease Control and Prevention Web site. Available at: http://wwwnc.cdc.gov/travel/diseases/african-tick-bite-fever. Accessed September 24, 2015.
THE CASE
A 76-year-old man with a history of coronary artery disease presented with a fever, headache, and malaise one week after returning from a big game hunting trip in South Africa. Five days after his return, he noticed lesions on his right leg that eventually scabbed over. He sought care at his local emergency department and with his primary care physician, and completed an empiric trial of azithromycin. His symptoms, however, persisted and he was referred to our institution for evaluation and treatment.
On exam, he had a temperature of 100.5° F, inguinal lymphadenopathy, and 2 eschars: a 1.5 cm one on his right groin and an identical one on the medial aspect of the right popliteal fossa (FIGURE 1).
THE DIAGNOSIS
Laboratory studies showed a white blood cell count of 3000/mcL, hemoglobin of 14.1 g/dL, and platelet count of 142,000/mcL; peripheral blood smear was normal. Blood and urine cultures showed no growth. A malaria smear and antibodies for Lyme disease, dengue fever, Chikungunya virus, and Q fever were also negative. A biopsy of the eschar demonstrated epidermal and dermal necrosis consistent with infectious vasculitis caused by rickettsial disease (FIGURE 2). A polymerase chain reaction (PCR) for the spotted fever group (R rickettsii, R akari, and R conorii) and typhus fever group of rickettsial agents (R typhi and R prowazekii) were negative. However, a PCR was positive for R africae, confirming the diagnosis of African tick-bite fever (ATBF).
DISCUSSION
Two common reasons patients returning from international travel seek medical attention are fever and rash.1 Initial assessment should include a detailed travel history of urban and rural exposures and any possible exposure to ticks or fleas. The time course of symptoms is important because some tropical infections can have long incubation periods.2
Rickettsial diseases are the most common febrile illness in patients returning from international travel.1 ATBF caused by R africae is the most common rickettsiosis among returning travelers1 and may be the most widespread of all spotted fever group rickettsiae that are known to be pathogenic to humans.3R africae is endemic to South Africa. The risk of contracting R africae is 4 to 5 times higher than the risk of contracting malaria in South Africa.1
R africae is transmitted through cattle and game ticks (Amblyomma species),1-7 and tends to cause mild illness with rare progression to complicated disease.3 The risk of infection is particularly high from November to April,7 and our patient had traveled during April.
Most patients with ATBF present with fever, headache, and malaise, and 50% develop a variable rash.1,2 Local lymphadenopathy often develops, and marked neck stiffness can occur.2 An eschar is present in 95% of cases.2 The finding of an eschar is often indicative of rickettsial infection; however, not all rickettsioses show eschars, and the absence of an eschar does not exclude rickettsial infection.1
ATBF is usually benign and self-limiting, and no fatalities have been reported.2,4,8 Complications such as peripheral nerve involvement, encephalitis, and myocarditis are rare.5,8 Since rickettsial diseases may be more severe in elderly patients with underlying diseases, empiric treatment with inpatient monitoring is justifiable.5
Don’t wait for lab confirmation to begin antibiotics
Laboratory findings in a patient with ATBF include pancytopenia, elevated serum C-reactive protein, and abnormal liver function tests.2,4 A blood PCR detects R africae,1,3 and if a rash or eschar is present, a biopsy can confirm the diagnosis.1 However, confirming the diagnosis is difficult if seroconversion has not occurred and PCR is not readily available.1 Also, antibodies may not be detected in patients who have a mild case of ATBF or those who are immunocompromised.5
If you suspect your patient has ATBF, don’t wait for laboratory confirmation; instead, initiate empiric treatment with doxycycline 100 mg bid twice daily for 5 to 7 days.1,2,4
Preventive measures include repellant lotions, clothing, and gear
Since there are no vaccines or prophylactic treatments for ATBF, counsel travelers on preventive measures.9 Instruct patients who plan to visit an endemic area such as sub-Saharan Africa or the West Indies to wear long-sleeved shirts, long pants, and hats. Individuals should also tuck their shirts into their pants and their pants into socks, as well as wear closed-toe shoes. When possible, it’s advisable to avoid woody and brushy areas.
Over-the-counter repellant lotions that contain ≥20% DEET are effective at preventing tick bites for several hours after an application, but should be reapplied as directed.9 These lotions should be applied after sunscreen. Advise patients that they can purchase clothing and gear that have been treated with the pesticide permethrin, or they can treat clothing and gear themselves. Explain, however, that permethrin should not be applied directly to skin.
Finally, instruct travelers to perform daily tick inspections and shower or bathe as soon as possible after returning from the outdoors.9 Educate patients on the proper technique for tick removal, which is described on the Centers for Disease Control and Prevention’s Web site at http://www.cdc.gov/ticks/removing_a_tick.html.
Our patient completed a 2-week course of doxycycline 100 mg bid. His symptoms and laboratory abnormalities completely resolved.
THE TAKEAWAY
ATBF is the most common rickettsiosis among patients returning from international travel. Because patients may present with several nonspecific symptoms, maintain a high index of suspicion for rickettsial infection among patients returning from sub-Saharan Africa or the West Indies. Though the disease usually can be successfully managed in the outpatient setting with doxycycline, elderly patients or those with comorbid conditions may require inpatient care. Educate patients who plan to travel to an endemic area about measures they can take to prevent exposure to ticks and subsequent infection.
1. Neumayr A, Hatz C, Blum J. Not to be missed! Differential diagnoses of common dermatological problems in returning travellers. Travel Med Infect Dis. 2013;11:337-349.
2. Yates J, Smith P. Fever and rash. Medicine. 2014;42:96-99.
3. Jensenius M, Fournier PE, Kelly P, et al. African tick bite fever. Lancet Infect Dis. 2003;3:557-564.
4. Frean J, Blumberg L, Ogunbanjo GA. Tick bite fever in South Africa. S Afr Fam Pract. 2008;50:33-35.
5. Roch N, Epaulard O, Pelloux I, et al. African tick bite fever in elderly patients: 8 cases in French tourists returning from South Africa. Clin Infect Dis. 2008;47:e28-e35.
6. Caruso G, Zasio C, Guzzo F, et al. Outbreak of African tick-bite fever in six Italian tourists returning from South Africa. Eur J Clin Microbiol Infect Dis. 2002;21:133-136.
7. Tsai YS, Wu YH, Kao PT, et al. African tick bite fever. J Formos Med Assoc. 2008;107:73-76.
8. Jensenius M, Fournier PE, Fladby T, et al. Sub-acute neuropathy in patients with African tick bite fever. Scand J Infect Dis. 2006;38:114-118.
9. Centers for Disease Control and Prevention. African tick-bite fever. Centers for Disease Control and Prevention Web site. Available at: http://wwwnc.cdc.gov/travel/diseases/african-tick-bite-fever. Accessed September 24, 2015.

Was this CT with contrast unnecessary—and harmful? ... Patient dies after being prescribed opioids right after detoxification
Was this CT with contrast unnecessary—and harmful?
A 52-YEAR-OLD WOMAN presented to the emergency department (ED) with leg pain and vaginal bleeding. The ED physicians ordered a computed tomography (CT) scan with contrast. Following the administration of the contrast dye, the patient’s blood pressure spiked and a brain aneurysm ruptured. The patient immediately underwent cranial surgery and recovered well. However, she still suffers from paralysis, cognitive issues, and weakness in her left arm and leg. She has been unable to return to her job.
PLAINTIFF’S CLAIM The doctors ran several unnecessary tests, including the CT scan, which caused her to have an allergic reaction.
THE DEFENSE The CT scan was necessary to rule out a stomach abscess, and the ruptured aneurysm was caused by her medical condition and not the dye.
VERDICT $3.62 million New Jersey verdict.
COMMENT Here is a sober reminder that doing more tests does not protect one from litigation. We are not told enough in this short report to know if there was a legitimate indication for a CT scan, but the large award suggests there was not. The Choosing Wisely campaign (http://www.choosingwisely.org), which has a goal of “advancing a national dialogue on avoiding wasteful or unnecessary medical tests, treatments and procedures,” is not just about saving money—it is about practicing medicine appropriately.
Patient dies after being prescribed opioids right after detoxification
A 52-YEAR-OLD WOMAN had been going to the same physician for 17 years. While she was under his care, she had been prescribed various narcotics, benzodiazepines, and barbiturates, and she had become addicted to them. The patient suffered a fall at home that was allegedly caused by an overdose of these medications. During a 3-week hospitalization after her fall, the woman went through a detoxification protocol to ease her dependence on the drugs. During her next appointment with her physician, he prescribed alprazolam and morphine sulfate daily. A week later, the woman died, allegedly due to an overdose of the alprazolam and morphine sulfate.
PLAINTIFF’S CLAIM The defendant’s failure to investigate the reason for the decedent’s hospitalization violated the standard of care. If the physician had inquired about his patient’s recent hospitalization, he would have been told about her detoxification, and wouldn’t have prescribed her any potentially addictive drugs.
THE DEFENSE The physician admitted that if he had known about his patient’s detoxification, he would not have prescribed her any medication. However, the doctor in charge of overseeing the detoxification told the patient not to see the defendant again, and not to take any prescriptions from him.
VERDICT $156,853 Illinois verdict.
COMMENT There is good reason to be wary of prescribing strong opioids and benzodiazepines for chronic pain in primary care practice. With the sharp increase in overdose deaths from opioids and the marginal evidence, at best, that supports the use of opioids for chronic, nonmalignant pain, such patients should—in my opinion—be managed directly in a pain/addiction program, or in close collaboration with one.
State Boards of Medicine are becoming appropriately stringent about opioids, so don’t risk losing your medical license or being sued. Use narcotic-use contracts, random drug testing, and co-management, and check your state narcotic prescribing database regularly if you treat chronic pain patients.
Contraception for the perimenopausal woman: What’s best?
› Consider long-acting reversible contraception, such as an intrauterine device or an implant, as a first-line option for women who have mild or no symptoms of perimenopause. A
› Unless contraindicated, prescribe combination hormonal contraceptives for women in their 40s who desire them, as they are generally safe and effective in treating perimenopausal symptoms. A
› Use the Centers for Disease Control and Prevention’s evidence-based recommendations to guide your choice of contraceptive for perimenopausal patients based on individual medical history. A
Strength of recommendation (SOR)
A Good-quality patient-oriented evidence
B Inconsistent or limited-quality patient-oriented evidence
C Consensus, usual practice, opinion, disease-oriented evidence, case series
It is no secret that about half of all pregnancies in the United States are unintended, and that teens have the highest rate of unplanned pregnancy. What’s not so well known is that women in their 40s have the second highest rate.1
Optimal use of contraception throughout perimenopause is crucial, but finding the right method of birth control for this patient population can be a bit of a balancing act. Long-acting reversible contraceptives (LARCs), such as an intrauterine device or progestin-only implant, are preferred first-line contraceptive options when preventing pregnancy is the primary goal, given their increased efficacy and limited number of contraindications.2,3 However, women experiencing perimenopausal symptoms often need a combination hormonal contraceptive (CHC)—typically an estrogen-containing pill, a patch, or a vaginal ring—for relief of vasomotor symptoms and cycle control.
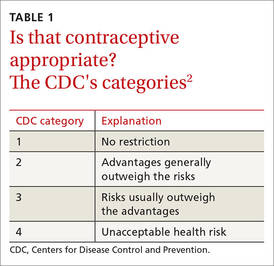
Women in their 40s should have access to a full array of options to help improve adherence. However, physicians may be reluctant to prescribe estrogen-containing products for patients who often have a more complex medical history than their younger counterparts, including increased risks for breast cancer, cardiovascular disease, and venous thromboembolism (VTE).
With this in mind, the Centers for Disease Control and Prevention (CDC) has identified medical conditions that may affect the use of the various types of contraceptives by perimenopausal women and issued evidence-based recommendations on the appropriateness of each method using a one-to-4 rating system (TABLE 1).2 To help you address the contraceptive needs of such patients, we review the key risk factors, CDC guidelines, and optimal choices in the 4 case studies that follow.
CASE 1 › Sara G: VTE risk
Sara G, a healthy 45-year-old, recently started dating again following her divorce. She wants to avoid pregnancy. She has no personal or family history of clotting disorders and does not smoke. However, she is obese (body mass index [BMI]=32 kg/m2), and her job as a visiting nurse requires her to spend most of the day in her car. Ms. G also has acne and wants an estrogen-containing contraceptive to help treat it.
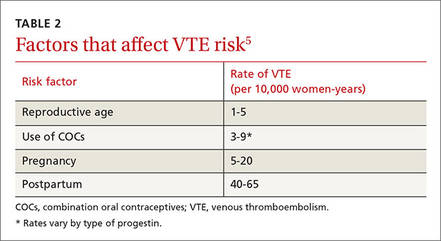
If Ms. G were your patient, what would you offer her?
The risk for VTE increases substantially for women older than 40 years. In a recent cohort study, those ages 45 to 49 faced approximately twice the risk of women ages 25 to 29. However, the absolute risk for the older women was still low (4.7-5.3 per 10,000 woman-years).4 What’s more, the risk of VTE from the use of a CHC is substantially less than the risk associated with pregnancy and the postpartum period (TABLE 2).5
Obesity increases the risk. Women like Ms. G who are obese (BMI >30) have an increased risk for VTE associated with CHCs, but the CDC rates them as a Category 2 risk, even for obese women in their 40s—a determination that the advantages outweigh the risks.2
Progestin choice and estrogen dose matter. Combination oral contraceptives (COCs) that contain certain third-generation progestins (gestodene and desogestrel) may be more thrombophilic than those containing first- or second-generation progestins (TABLE 3).6 The relative risk (RR) for VTE with third-generation vs second-generation progestins is 1.3 (95% confidence interval [CI], 1.0-1.8).7 Formulations containing higher doses of estrogen are also more likely to be associated with VTE.7
Drospirenone is a newer progestin. Found in several COCs, drospirenone has antimineralocorticoid properties that help to minimize bloating and fluid retention but may also lead to a hypercoagulable state.5 Numerous studies have investigated the association between drospirenone and VTE risk, with conflicting results.8 Most recently, a large international prospective observational study involving more than 85,000 women showed no increased risk for VTE among women taking COCs with drospirenone compared with pills that do not contain this progestin.9
Non-oral CHCs, including the vaginal ring and the patch, offer the convenience of weekly or monthly use while providing similar benefits to COCs. Some fear that the continuous exposure to hormones associated with these methods may increase the risk for VTE, but evidence is mixed.
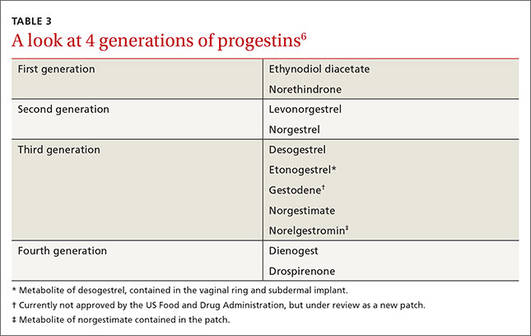
A large (N=1.6 million) Danish registry study published in 2012 demonstrated a 2-fold increased risk of VTE among vaginal ring users vs women taking COCs.4 But a multinational prospective cohort study of more than 33,000 women found no increased VTE risk in ring users,10 and a recent US database study involving more than 800,000 women reported nonsignificant VTE risk estimates for both the ring (RR=1.09; 95% CI, 0.55-2.16) and the patch (RR=1.35; 95% CI, 0.90-2.02) compared with COCs.11
THE BOTTOM LINE For Ms. G, the benefits of contraception likely outweigh any small increase in her absolute risk for VTE. To minimize her risk, however, select a pill that contains a low dose (20-35 mcg) of ethinyl estradiol (EE) combined with a progestin that has not been associated with an increased VTE risk. Because of their mechanism of action, most COCs will improve acne, regardless of the progestin in the formulation.12-14
CASE 2 › Stephanie T: CV risk
Stephanie T, 47, is in need of contraception and treatment for severe hot flashes. She has no significant past medical history, but she is obese (BMI =36), her blood pressure (BP) is 130/80 mm Hg, and her most recent labs reveal a fasting glucose of 115 and a hemoglobin A1c of 6.1%. Ms. T is concerned about arterial thromboembolic disease because of her family history: Her father had a myocardial infarction (MI) at age 56 and a maternal aunt had a stroke when she was 65.
What evidence should you consider?
Baseline arterial thromboembolic events are considerably more rare in premenopausal women than VTEs (13.2 MIs vs 24.2 thrombotic strokes per 100,000 woman-years).15 Thus, a small increased RR from a CHC is unlikely to have a significant clinical impact.
A systemic review and meta-analysis of studies between 1995 and 2012 showed that the odds ratio (OR) of ischemic stroke in users of COCs vs nonusers was 1.9 (95% CI, 1.24–2.91).16 This study included very few estrogen formulations with <35 mcg EE, however; even so, no increased risk of MI was found (OR=1.34; 95% CI, 0.87–2.08).16 A 15-year retrospective cohort study of 1.6 million Danish women showed that lowering the dose of EE to 20 mcg (from 30-40 mcg) significantly reduced the risk of arterial events.15 It is unclear whether the vaginal ring is associated with an increased RR of stroke compared with COCs because studies have had mixed results.10,15 There is no compelling evidence to suggest a difference in the risk of arterial events based on the type of progestin used in the COC.15
Hypertension is a key consideration. It is important to remember that perimenopausal women may have comorbid conditions that increase their risk of arterial thromboembolic events. CHCs should be used with caution in women with hypertension, even if BP is adequately controlled—a Category 3 recommendation from the CDC. In such patients, LARC or a progestin-only pill is preferred unless there is a compelling reason to use a CHC, such as acne, vasomotor symptoms, or hirsutism.2
CHCs are contraindicated for women with a BP ≥160/100 mm Hg and/or any manifestation of vascular disease (Category 4).2 Although progestin-only methods are often preferred for women with established vascular disease, depot medroxyprogesterone acetate (DMPA) is an exception (Category 3).2 DMPA is not a first-line choice for such patients because of its potential to cause weight gain and worsening lipids, glucose, and insulin metabolism. Women with hypertriglyceridemia should have follow-up testing of lipid levels after initiation of hormonal contraception, especially if it contains estrogen.
Diabetes is not an absolute contraindication. Many women with diabetes can safely use CHCs (Category 2). The exceptions: those who have vascular disease, nephropathy, retinopathy, or neuropathy (Category 4) or have had diabetes for >20 years and therefore have the potential for undiagnosed vascular disease.2 Generally, the use of insulin should not affect decisions regarding CHCs, and patients can be reassured that the hormones will not worsen their diabetes control.
When caring for women who have multiple risk factors for cardiovascular disease, it is important to exercise clinical judgment regarding the appropriateness of CHCs (Categories 3 and 4). Progestin-only methods have a more favorable risk profile for women at the highest risk and may provide ample relief of perimenopausal symptoms.2
THE BOTTOM LINE Ms. T may benefit from a CHC due to her severe hot flashes. She should be encouraged to adopt healthy lifestyle changes, including diet and exercise, to decrease her risk of arterial thromboembolism and VTE, but she has no contraindications to the use of a CHC at this time.
CASE 3 › Leslie C: Bone health
Leslie C, age 45, is happy with the contraceptive he has used for the past 3 years—DMPA injections every 3 months. She has no perimenopausal symptoms. However, her mother had an osteoporotic hip fracture at age 70 and Ms. C is concerned about the long-term use of DMPA.
Should Ms. C be worried?
Because of DMPA’s association with bone loss, the US Food and Drug Administration issued a black box warning in 2004 recommending that this method be used for more than 2 years only by women for whom other birth control methods are deemed inappropriate.17
The bone loss may be reversed. Evidence suggests that the bone loss is reversible, however, and the American College of Obstetricians and Gynecologists has stated that a potential fracture risk need not limit a woman’s use of DMPA to 2 years.18 A retrospective cohort review of 312,295 women in the United Kingdom did not find evidence of an increased risk of fracture with long-term use of DMPA.19 It is important to note, however, that because of declining estrogen levels, perimenopausal women have fewer years than their younger counterparts to recover bone density upon discontinuation of DMPA.20,21
THE BOTTOM LINE Because Ms. C has no perimenopausal symptoms, she may do well with LARC, which—like DMPA —would free her of the need to remember to take, apply, or insert a contraceptive regularly. It may help to point out that LARCs provide superior contraceptive efficacy compared with DMPA injections (99% vs 94%).3 Nonetheless, she and other women in their 40s who need ongoing contraception should not be discouraged from using DMPA if that is their preference.
CASE 4 › Alissa B: Breast cancer risk
Alissa B, 49, has polycystic ovaries and wonders if it is safe for her to continue her COC. She has been happy with the treatment for years because it gives her relief from hot flashes and regulates her cycles. Her 46-year-old sister was recently diagnosed with invasive breast cancer, however, and Ms. B is afraid that the hormones she takes put her at increased risk.
Should you recommend another method?
Breast cancer is an important concern for many women as they age. Although Ms. B’s family history increases her risk for developing breast cancer, a systematic review indicates that COCs do not add to this risk.22
Weak association between family history and OC use. The review included 10 observational studies and one meta-analysis that investigated the association between COC use and breast cancer in women with a family history of the disease. Only 2 fair-quality studies showed an association, one of which included women who had begun taking the pill before 1975, when formulations typically contained higher doses of estrogen than present-day preparations.22
Data from a recently published meta-analysis also indicate that there is no increased risk for breast cancer from COCs among women with BRCA 1 or BRCA 2 mutations. The summary RR for breast cancer in such patients was 1.13 (95% CI, 0.88-1.45), but OC users had a lower risk for ovarian cancer (summary RR=0.50; 95% CI, 0.33-0.75).23 Additionally, investigators found no association between specific currently used COC formulations and breast cancer.24
THE BOTTOM LINE Based on an independent review of the evidence, the CDC has given a family history of breast cancer a Category 1 rating. Thus, Ms. B can be reassured that she may safely continue taking her COC, which is unlikely to increase her breast cancer risk.
CORRESPONDENCE
Pelin Batur, MD, NCMP, CCD, Cleveland Clinic Independence Family Health Center, 5001 Rockside Road, IN30, Cleveland, OH 44131; [email protected].
1. Finer LB, Zolna MR. Unintended pregnancy in the United States: incidence and disparities, 2006. Contraception. 2011;84:478-485.
2. Centers for Disease Control and Prevention (CDC). U.S. medical eligibility criteria for contraceptive use, 2010. MMWR Recomm Rep. 2010;59:1-86.
3. Division of Reproductive Health, National Center for Chronic Disease Prevention and Health Promotion, Centers for Disease Control and Prevention (CDC). U.S. selected practice recommendations for contraceptive use, 2013: adapted from the World Health Organization selected practice recommendations for contraceptive use, 2nd edition. MMWR Recomm Rep. 2013;62:1-60.
4. Lidegaard O, Nielsen LH, Skovlund CW, et al. Venous thrombosis in users of non-oral hormonal contraception: follow-up study, Denmark 2001-10. BMJ. 2012;344:e2990.
5. Committee on gynecologic practice. ACOG committee opinion number 540: Risk of venous thromboembolism among users of drospirenone-containing oral contraceptive pills. Obstet Gynecol. 2012;120:1239-1242.
6. McNamara M, Batur P, DeSapri KT. In the clinic. Perimenopause. Ann Intern Med. 2015;162:ITC1-15.
7. de Bastos M, Stegeman BH, Rosendaal FR, et al. Combined oral contraceptives: venous thrombosis. Cochrane Database Syst Rev. 2014;3:CD010813.
8. Wu CQ, Grandi SM, Filion KB, et al. Drospirenone-containing oral contraceptive pills and the risk of venous and arterial thrombosis: a systematic review. BJOG. 2013;120:801-810.
9. Dinger J, Bardenheuer K, Heinemann K. Cardiovascular and general safety of a 24-day regimen of drospirenone-containing combined oral contraceptives: final results from the international active surveillance study of women taking oral contraceptives. Contraception. 2014;89:253-263.
10. Dinger J, Möhner S, Heinemann K. Cardiovascular risk associated with the use of an etonogestrel-containing vaginal ring. Obstet Gynecol. 2013;122:800-808.
11. Sidney S, Cheetham TC, Connell FA, et al. Recent combined hormonal contraceptives (CHCs) and the risk of thromboembolism and other cardiovascular events in new users. Contraception. 2013;87:93-100.
12. Arowojolu AO, Gallo MF, Lopez LM, et al. Combined oral contraceptive pills for treatment of acne. Cochrane Database Syst Rev. 2012;6:CD004425.
13. Koulianos GT. Treatment of acne with oral contraceptives: criteria for pill selection. Cutis. 2000;66:281-286.
14. Thorneycroft IH. Update on androgenicity. Am J Obstet Gynecol. 1999;180:288-294.
15. Lidegaard Ø, Løkkegaard E, Jensen A, et al. Thrombotic stroke and myocardial infarction with hormonal contraception. N Engl J Med. 2012;366:2257-2266.
16. Peragallo Urrutia R, Coeytaux RR, McBroom AJ, et al. Risk of acute thromboembolic events with oral contraceptive use: a systematic review and meta-analysis. Obstet Gynecol. 2013;122:380-389.
17. U.S. Food and Drug Administration. Safety: Depo-Provera (medroxyprogesterone acetate injectable suspension). U.S. Food and Drug Administration Web site. Available at: http://www.fda.gov/Safety/MedWatch/SafetyInformation/SafetyAlertsforHumanMedicalProducts/ucm154784.htm. Accessed April 20, 2015.
18. Committee Opinion No. 602: Depot medroxyprogesterone acetate and bone effects. Obstet Gynecol. 2014;123:1398-1402.
19. Lanza LL, McQuay LJ, Rothman KJ, et al. Use of depot medroxyprogesterone acetate contraception and incidence of bone fracture. Obstet Gynecol. 2013;121:593-600.
20. Ettinger B, Pressman A, Sklarin P, et al. Associations between low levels of serum estradiol, bone density, and fractures among elderly women: the study of osteoporotic fractures. J Clin Endocrinol Metab. 1998;83:2239-2243.
21. Reginster JY, Sarlet N, Deroisy R, et al. Minimal levels of serum estradiol prevent postmenopausal bone loss. Calcif Tissue Int. 1992;51:340-343.
22. Gaffield ME, Culwell KR, Ravi A. Oral contraceptives and family history of breast cancer. Contraception. 2009;80:372-380.
23. Iodice S, Barile M, Rotmensz N, et al. Oral contraceptive use and breast or ovarian cancer risk in BRCA1/2 carriers: a meta-analysis. Eur J Cancer. 2010;46:2275-2284.
24. Marchbanks PA, Curtis KM, Mandel MG, et al. Oral contraceptive formulation and risk of breast cancer. Contraception. 2012;85:342-350.
› Consider long-acting reversible contraception, such as an intrauterine device or an implant, as a first-line option for women who have mild or no symptoms of perimenopause. A
› Unless contraindicated, prescribe combination hormonal contraceptives for women in their 40s who desire them, as they are generally safe and effective in treating perimenopausal symptoms. A
› Use the Centers for Disease Control and Prevention’s evidence-based recommendations to guide your choice of contraceptive for perimenopausal patients based on individual medical history. A
Strength of recommendation (SOR)
A Good-quality patient-oriented evidence
B Inconsistent or limited-quality patient-oriented evidence
C Consensus, usual practice, opinion, disease-oriented evidence, case series
It is no secret that about half of all pregnancies in the United States are unintended, and that teens have the highest rate of unplanned pregnancy. What’s not so well known is that women in their 40s have the second highest rate.1
Optimal use of contraception throughout perimenopause is crucial, but finding the right method of birth control for this patient population can be a bit of a balancing act. Long-acting reversible contraceptives (LARCs), such as an intrauterine device or progestin-only implant, are preferred first-line contraceptive options when preventing pregnancy is the primary goal, given their increased efficacy and limited number of contraindications.2,3 However, women experiencing perimenopausal symptoms often need a combination hormonal contraceptive (CHC)—typically an estrogen-containing pill, a patch, or a vaginal ring—for relief of vasomotor symptoms and cycle control.
Women in their 40s should have access to a full array of options to help improve adherence. However, physicians may be reluctant to prescribe estrogen-containing products for patients who often have a more complex medical history than their younger counterparts, including increased risks for breast cancer, cardiovascular disease, and venous thromboembolism (VTE).
With this in mind, the Centers for Disease Control and Prevention (CDC) has identified medical conditions that may affect the use of the various types of contraceptives by perimenopausal women and issued evidence-based recommendations on the appropriateness of each method using a one-to-4 rating system (TABLE 1).2 To help you address the contraceptive needs of such patients, we review the key risk factors, CDC guidelines, and optimal choices in the 4 case studies that follow.
CASE 1 › Sara G: VTE risk
Sara G, a healthy 45-year-old, recently started dating again following her divorce. She wants to avoid pregnancy. She has no personal or family history of clotting disorders and does not smoke. However, she is obese (body mass index [BMI]=32 kg/m2), and her job as a visiting nurse requires her to spend most of the day in her car. Ms. G also has acne and wants an estrogen-containing contraceptive to help treat it.
If Ms. G were your patient, what would you offer her?
The risk for VTE increases substantially for women older than 40 years. In a recent cohort study, those ages 45 to 49 faced approximately twice the risk of women ages 25 to 29. However, the absolute risk for the older women was still low (4.7-5.3 per 10,000 woman-years).4 What’s more, the risk of VTE from the use of a CHC is substantially less than the risk associated with pregnancy and the postpartum period (TABLE 2).5
Obesity increases the risk. Women like Ms. G who are obese (BMI >30) have an increased risk for VTE associated with CHCs, but the CDC rates them as a Category 2 risk, even for obese women in their 40s—a determination that the advantages outweigh the risks.2
Progestin choice and estrogen dose matter. Combination oral contraceptives (COCs) that contain certain third-generation progestins (gestodene and desogestrel) may be more thrombophilic than those containing first- or second-generation progestins (TABLE 3).6 The relative risk (RR) for VTE with third-generation vs second-generation progestins is 1.3 (95% confidence interval [CI], 1.0-1.8).7 Formulations containing higher doses of estrogen are also more likely to be associated with VTE.7
Drospirenone is a newer progestin. Found in several COCs, drospirenone has antimineralocorticoid properties that help to minimize bloating and fluid retention but may also lead to a hypercoagulable state.5 Numerous studies have investigated the association between drospirenone and VTE risk, with conflicting results.8 Most recently, a large international prospective observational study involving more than 85,000 women showed no increased risk for VTE among women taking COCs with drospirenone compared with pills that do not contain this progestin.9
Non-oral CHCs, including the vaginal ring and the patch, offer the convenience of weekly or monthly use while providing similar benefits to COCs. Some fear that the continuous exposure to hormones associated with these methods may increase the risk for VTE, but evidence is mixed.
A large (N=1.6 million) Danish registry study published in 2012 demonstrated a 2-fold increased risk of VTE among vaginal ring users vs women taking COCs.4 But a multinational prospective cohort study of more than 33,000 women found no increased VTE risk in ring users,10 and a recent US database study involving more than 800,000 women reported nonsignificant VTE risk estimates for both the ring (RR=1.09; 95% CI, 0.55-2.16) and the patch (RR=1.35; 95% CI, 0.90-2.02) compared with COCs.11
THE BOTTOM LINE For Ms. G, the benefits of contraception likely outweigh any small increase in her absolute risk for VTE. To minimize her risk, however, select a pill that contains a low dose (20-35 mcg) of ethinyl estradiol (EE) combined with a progestin that has not been associated with an increased VTE risk. Because of their mechanism of action, most COCs will improve acne, regardless of the progestin in the formulation.12-14
CASE 2 › Stephanie T: CV risk
Stephanie T, 47, is in need of contraception and treatment for severe hot flashes. She has no significant past medical history, but she is obese (BMI =36), her blood pressure (BP) is 130/80 mm Hg, and her most recent labs reveal a fasting glucose of 115 and a hemoglobin A1c of 6.1%. Ms. T is concerned about arterial thromboembolic disease because of her family history: Her father had a myocardial infarction (MI) at age 56 and a maternal aunt had a stroke when she was 65.
What evidence should you consider?
Baseline arterial thromboembolic events are considerably more rare in premenopausal women than VTEs (13.2 MIs vs 24.2 thrombotic strokes per 100,000 woman-years).15 Thus, a small increased RR from a CHC is unlikely to have a significant clinical impact.
A systemic review and meta-analysis of studies between 1995 and 2012 showed that the odds ratio (OR) of ischemic stroke in users of COCs vs nonusers was 1.9 (95% CI, 1.24–2.91).16 This study included very few estrogen formulations with <35 mcg EE, however; even so, no increased risk of MI was found (OR=1.34; 95% CI, 0.87–2.08).16 A 15-year retrospective cohort study of 1.6 million Danish women showed that lowering the dose of EE to 20 mcg (from 30-40 mcg) significantly reduced the risk of arterial events.15 It is unclear whether the vaginal ring is associated with an increased RR of stroke compared with COCs because studies have had mixed results.10,15 There is no compelling evidence to suggest a difference in the risk of arterial events based on the type of progestin used in the COC.15
Hypertension is a key consideration. It is important to remember that perimenopausal women may have comorbid conditions that increase their risk of arterial thromboembolic events. CHCs should be used with caution in women with hypertension, even if BP is adequately controlled—a Category 3 recommendation from the CDC. In such patients, LARC or a progestin-only pill is preferred unless there is a compelling reason to use a CHC, such as acne, vasomotor symptoms, or hirsutism.2
CHCs are contraindicated for women with a BP ≥160/100 mm Hg and/or any manifestation of vascular disease (Category 4).2 Although progestin-only methods are often preferred for women with established vascular disease, depot medroxyprogesterone acetate (DMPA) is an exception (Category 3).2 DMPA is not a first-line choice for such patients because of its potential to cause weight gain and worsening lipids, glucose, and insulin metabolism. Women with hypertriglyceridemia should have follow-up testing of lipid levels after initiation of hormonal contraception, especially if it contains estrogen.
Diabetes is not an absolute contraindication. Many women with diabetes can safely use CHCs (Category 2). The exceptions: those who have vascular disease, nephropathy, retinopathy, or neuropathy (Category 4) or have had diabetes for >20 years and therefore have the potential for undiagnosed vascular disease.2 Generally, the use of insulin should not affect decisions regarding CHCs, and patients can be reassured that the hormones will not worsen their diabetes control.
When caring for women who have multiple risk factors for cardiovascular disease, it is important to exercise clinical judgment regarding the appropriateness of CHCs (Categories 3 and 4). Progestin-only methods have a more favorable risk profile for women at the highest risk and may provide ample relief of perimenopausal symptoms.2
THE BOTTOM LINE Ms. T may benefit from a CHC due to her severe hot flashes. She should be encouraged to adopt healthy lifestyle changes, including diet and exercise, to decrease her risk of arterial thromboembolism and VTE, but she has no contraindications to the use of a CHC at this time.
CASE 3 › Leslie C: Bone health
Leslie C, age 45, is happy with the contraceptive he has used for the past 3 years—DMPA injections every 3 months. She has no perimenopausal symptoms. However, her mother had an osteoporotic hip fracture at age 70 and Ms. C is concerned about the long-term use of DMPA.
Should Ms. C be worried?
Because of DMPA’s association with bone loss, the US Food and Drug Administration issued a black box warning in 2004 recommending that this method be used for more than 2 years only by women for whom other birth control methods are deemed inappropriate.17
The bone loss may be reversed. Evidence suggests that the bone loss is reversible, however, and the American College of Obstetricians and Gynecologists has stated that a potential fracture risk need not limit a woman’s use of DMPA to 2 years.18 A retrospective cohort review of 312,295 women in the United Kingdom did not find evidence of an increased risk of fracture with long-term use of DMPA.19 It is important to note, however, that because of declining estrogen levels, perimenopausal women have fewer years than their younger counterparts to recover bone density upon discontinuation of DMPA.20,21
THE BOTTOM LINE Because Ms. C has no perimenopausal symptoms, she may do well with LARC, which—like DMPA —would free her of the need to remember to take, apply, or insert a contraceptive regularly. It may help to point out that LARCs provide superior contraceptive efficacy compared with DMPA injections (99% vs 94%).3 Nonetheless, she and other women in their 40s who need ongoing contraception should not be discouraged from using DMPA if that is their preference.
CASE 4 › Alissa B: Breast cancer risk
Alissa B, 49, has polycystic ovaries and wonders if it is safe for her to continue her COC. She has been happy with the treatment for years because it gives her relief from hot flashes and regulates her cycles. Her 46-year-old sister was recently diagnosed with invasive breast cancer, however, and Ms. B is afraid that the hormones she takes put her at increased risk.
Should you recommend another method?
Breast cancer is an important concern for many women as they age. Although Ms. B’s family history increases her risk for developing breast cancer, a systematic review indicates that COCs do not add to this risk.22
Weak association between family history and OC use. The review included 10 observational studies and one meta-analysis that investigated the association between COC use and breast cancer in women with a family history of the disease. Only 2 fair-quality studies showed an association, one of which included women who had begun taking the pill before 1975, when formulations typically contained higher doses of estrogen than present-day preparations.22
Data from a recently published meta-analysis also indicate that there is no increased risk for breast cancer from COCs among women with BRCA 1 or BRCA 2 mutations. The summary RR for breast cancer in such patients was 1.13 (95% CI, 0.88-1.45), but OC users had a lower risk for ovarian cancer (summary RR=0.50; 95% CI, 0.33-0.75).23 Additionally, investigators found no association between specific currently used COC formulations and breast cancer.24
THE BOTTOM LINE Based on an independent review of the evidence, the CDC has given a family history of breast cancer a Category 1 rating. Thus, Ms. B can be reassured that she may safely continue taking her COC, which is unlikely to increase her breast cancer risk.
CORRESPONDENCE
Pelin Batur, MD, NCMP, CCD, Cleveland Clinic Independence Family Health Center, 5001 Rockside Road, IN30, Cleveland, OH 44131; [email protected].
1. Finer LB, Zolna MR. Unintended pregnancy in the United States: incidence and disparities, 2006. Contraception. 2011;84:478-485.
2. Centers for Disease Control and Prevention (CDC). U.S. medical eligibility criteria for contraceptive use, 2010. MMWR Recomm Rep. 2010;59:1-86.
3. Division of Reproductive Health, National Center for Chronic Disease Prevention and Health Promotion, Centers for Disease Control and Prevention (CDC). U.S. selected practice recommendations for contraceptive use, 2013: adapted from the World Health Organization selected practice recommendations for contraceptive use, 2nd edition. MMWR Recomm Rep. 2013;62:1-60.
4. Lidegaard O, Nielsen LH, Skovlund CW, et al. Venous thrombosis in users of non-oral hormonal contraception: follow-up study, Denmark 2001-10. BMJ. 2012;344:e2990.
5. Committee on gynecologic practice. ACOG committee opinion number 540: Risk of venous thromboembolism among users of drospirenone-containing oral contraceptive pills. Obstet Gynecol. 2012;120:1239-1242.
6. McNamara M, Batur P, DeSapri KT. In the clinic. Perimenopause. Ann Intern Med. 2015;162:ITC1-15.
7. de Bastos M, Stegeman BH, Rosendaal FR, et al. Combined oral contraceptives: venous thrombosis. Cochrane Database Syst Rev. 2014;3:CD010813.
8. Wu CQ, Grandi SM, Filion KB, et al. Drospirenone-containing oral contraceptive pills and the risk of venous and arterial thrombosis: a systematic review. BJOG. 2013;120:801-810.
9. Dinger J, Bardenheuer K, Heinemann K. Cardiovascular and general safety of a 24-day regimen of drospirenone-containing combined oral contraceptives: final results from the international active surveillance study of women taking oral contraceptives. Contraception. 2014;89:253-263.
10. Dinger J, Möhner S, Heinemann K. Cardiovascular risk associated with the use of an etonogestrel-containing vaginal ring. Obstet Gynecol. 2013;122:800-808.
11. Sidney S, Cheetham TC, Connell FA, et al. Recent combined hormonal contraceptives (CHCs) and the risk of thromboembolism and other cardiovascular events in new users. Contraception. 2013;87:93-100.
12. Arowojolu AO, Gallo MF, Lopez LM, et al. Combined oral contraceptive pills for treatment of acne. Cochrane Database Syst Rev. 2012;6:CD004425.
13. Koulianos GT. Treatment of acne with oral contraceptives: criteria for pill selection. Cutis. 2000;66:281-286.
14. Thorneycroft IH. Update on androgenicity. Am J Obstet Gynecol. 1999;180:288-294.
15. Lidegaard Ø, Løkkegaard E, Jensen A, et al. Thrombotic stroke and myocardial infarction with hormonal contraception. N Engl J Med. 2012;366:2257-2266.
16. Peragallo Urrutia R, Coeytaux RR, McBroom AJ, et al. Risk of acute thromboembolic events with oral contraceptive use: a systematic review and meta-analysis. Obstet Gynecol. 2013;122:380-389.
17. U.S. Food and Drug Administration. Safety: Depo-Provera (medroxyprogesterone acetate injectable suspension). U.S. Food and Drug Administration Web site. Available at: http://www.fda.gov/Safety/MedWatch/SafetyInformation/SafetyAlertsforHumanMedicalProducts/ucm154784.htm. Accessed April 20, 2015.
18. Committee Opinion No. 602: Depot medroxyprogesterone acetate and bone effects. Obstet Gynecol. 2014;123:1398-1402.
19. Lanza LL, McQuay LJ, Rothman KJ, et al. Use of depot medroxyprogesterone acetate contraception and incidence of bone fracture. Obstet Gynecol. 2013;121:593-600.
20. Ettinger B, Pressman A, Sklarin P, et al. Associations between low levels of serum estradiol, bone density, and fractures among elderly women: the study of osteoporotic fractures. J Clin Endocrinol Metab. 1998;83:2239-2243.
21. Reginster JY, Sarlet N, Deroisy R, et al. Minimal levels of serum estradiol prevent postmenopausal bone loss. Calcif Tissue Int. 1992;51:340-343.
22. Gaffield ME, Culwell KR, Ravi A. Oral contraceptives and family history of breast cancer. Contraception. 2009;80:372-380.
23. Iodice S, Barile M, Rotmensz N, et al. Oral contraceptive use and breast or ovarian cancer risk in BRCA1/2 carriers: a meta-analysis. Eur J Cancer. 2010;46:2275-2284.
24. Marchbanks PA, Curtis KM, Mandel MG, et al. Oral contraceptive formulation and risk of breast cancer. Contraception. 2012;85:342-350.