User login
Failure to find breast cancer; later diagnosed at Stage 3

Stroke during delivery: $35.4M verdict

Stroke during delivery: $35.4M verdict
During delivery, a 25-year-old woman had a hemorrhagic stroke that left her unable to care for herself or her child.
Patient’s claim The patient’s neurologist failed to advise the ObGyn that the patient had a history of brain aneurysm and a venous varix, which increased the risk for stroke during labor and delivery. The patient had shared her history with the ObGyn, and she requested that her neurologist contact the ObGyn.
Neurologist’s defense There was no negligence. The entire medical file had been delivered to the ObGyn. Any negligence was on the part of the ObGyn for failure to educate herself as to the patient’s condition.
Verdict A $35.4 million Massachusetts verdict was returned against the neurologist, including $12.9 million for past and future pain and suffering, $4 million for past medical care, $11 million for future medical care, $4.5 million for the husband’s loss of consortium, $1.5 million for lost wages, and $1.5 million for the child’s loss of consortium.
IUGR detected but not immediately treated: $15.5M settlement
During a prenatal visit at 38 weeks’ gestation, a mother’s ObGyn saw signs of intrauterine growth restriction (IUGR) but did not order ultrasono- graphy to confirm the diagnosis or induce labor. When born 15 days later, the baby had a low birth weight and low Apgar scores. The child has permanent brain injury due to hypoxia.
Parents’ claim The ObGyn should have confirmed the presence of IUGR and appropriately managed the mother’s prenatal care. The child’s injuries could have been prevented if an earlier delivery had occurred.
Physician’s defense The case was settled during the trial.
Verdict A $15.5 million Illinois settlement was reached.
Ureter injured during total abdominal hysterectomy
A 40-year-old woman with uterine fibroids, excessive bleeding, and pelvic pain underwent total abdominal hysterectomy performed by her ObGyn.
Postoperatively, the patient reported abdominal pain, but she was discharged from the hospital. Two days later, she returned to the emergency department reporting continued and increasing abdominal pain and urine leakage. The ObGyn referred her to a urologist who diagnosed stricture of the left ureter with a ureterovaginal fistula. A nephrostomy procedure was performed. Three months later, left ureter reimplantation surgery was completed.
Patient’s claim The ObGyn was negligent in injuring the ureter during hysterectomy, in not identifying the injury during surgery, and in not diagnosing and treating the injury in a timely manner, despite the patient’s reports of increasing pain.
Physician’s defense The case was settled during the trial.
Verdict A $350,000 Virginia settlement was reached.
Breech presentation but cesarean not performed
When her water broke, a mother was admitted to the hospital. The ObGyn ordered induction of labor but deferred vaginal examination to avoid infection. After labor was induced, a nurse noticed the presence of meconium. She performed a vaginal examination and found that the baby was in breech position; she did not immediately contact the ObGyn. After several hours of labor, the baby was born limp and not breathing with a heart rate of 50 bpm. The baby was resuscitated but sustained severe brain damage.
Parents’ claim The mother should have been examined before induction of labor. When it was determined that the baby was in breech position, a cesarean delivery should have been ordered. Communication between the nurse and ObGyn was poor.
Defendants' defense There was no negligence; labor was managed according to the standard of care.
Verdict A New Jersey defense verdict was returned.
Additional Medical Verdicts cases
Failure to find breast cancer; later diagnosed at Stage 3
Endometrial cancer after unopposed estrogen: $7.5M
Anxiety is poorly recognized, treated in children
NEW YORK – Of psychiatric issues affecting child development, generalized anxiety is not getting the attention it deserves and is frequently mistaken for attention-deficit/hyperactivity disorder (ADHD), according to a review of key diagnostic signs and evidence-based therapies presented at a psychopharmacology update held by the American Academy of Child and Adolescent Psychiatry.
“Pediatricians have an ASD [autism spectrum disorder] toolkit, they have an ADHD toolkit, and they now have a postpartum depression toolkit for moms, but they do not have an anxiety tool kit,” reported Dr. John T. Walkup, director of the division of child and adolescent psychiatry, Cornell University, New York. “So if a kid is 7 or 8 and is inattentive, they have two choices: Either he has ASD or he has ADHD.”

Confusion with ASD is less likely, because there is less symptom crossover, but the differential diagnosis with ADHD is more challenging. For anxiety, symptoms typically peak between the ages of 6 and 12 years. Although the onset of ADHD symptoms, like symptoms of ASD, generally occurs earlier, children with anxiety and ADHD often are brought to the attention of a physician within the same general window of time.
From the point of view of the complaints that initiated an evaluation, “generalized anxiety disorder and the inattentive subtype of ADHD are almost indistinguishable,” Dr. Walkup asserted. He suggested that children who are anxious have difficulty concentrating in class because their minds are “full of ideas, worries, and concerns.” Children with ADHD have difficulty concentrating in class because their minds are “susceptible to distraction,” but the result is the same.
Some children, even those who are only 7 or 8 years old, “can really describe to you that difference,” Dr. Walkup observed, although he said other features can be useful for distinguishing anxiety from other psychiatric disorders, including depression. In taking the history of a child with potential anxiety, key signs include difficulty coping with novel situations, excessive sensitivity to perceived threats, and shyness. These features are less likely to be in children with ADHD or depression.
Once children reach adolescence, social insecurity is more ubiquitous, making this complaint less useful for identifying a child with pathologic anxiety, but here there is also room for confusion without a careful history.
“We see a lot of kids who have social anxiety who get mislabeled as depressed. Socially anxious kids become demoralized, but they do not become anhedonic,” Dr. Walkup reported. In patients who are inhibited with their peers but who do not otherwise report disturbances in mood, generalized anxiety rather than depression may be driving the psychopathology, according to Dr. Walkup, who said this set of circumstances is common.
Once the diagnosis of anxiety is made, both SSRIs and cognitive-behavioral therapy are effective, with response rates of about 55%-60%, Dr. Walkup said. The response rates can climb as high as 80% when the two are combined, particularly when CBT is performed at experienced centers.
With SSRIs, one of the biggest concerns is activation, an adverse event that occurs in up to 10% of patients, Dr. Walkup said. If activation occurs, he advised switching patients to a nonactivating antidepressant, such as duloxetine, nefazodone, or a tricyclic agent, rather than rechallenging them with another SSRI. In his experience, activation on one agent predicts activation on another, but he cautioned against confusing activation with SSRI-induced mania.
“We do see so many kids who get activated on an SSRI and never see another antidepressant again, simply because the doc is afraid of precipitating mania,” Dr. Walkup said. He said mania is a very uncommon adverse event not typically observed, like activation, relatively quickly after initiating therapy. Because of the efficacy of SSRIs for pediatric anxiety, Dr. Walkup advised being slow in abandoning this drug class.
“Antidepressants work extremely well, and SSRIs are the medications of choice,” emphasized Dr. Walkup, who identified atypical antidepressants as a second-line choice in children and benzodiazepines, for which pediatric data are “limited,” as an option further down the list.
However, therapy first requires a diagnosis.
“Identifying anxiety is key,” Dr. Walkup said. “With evidence-based treatments available, there is a need to enhance public awareness and advocacy.”
Dr. Walkup reported no financial relationships.
NEW YORK – Of psychiatric issues affecting child development, generalized anxiety is not getting the attention it deserves and is frequently mistaken for attention-deficit/hyperactivity disorder (ADHD), according to a review of key diagnostic signs and evidence-based therapies presented at a psychopharmacology update held by the American Academy of Child and Adolescent Psychiatry.
“Pediatricians have an ASD [autism spectrum disorder] toolkit, they have an ADHD toolkit, and they now have a postpartum depression toolkit for moms, but they do not have an anxiety tool kit,” reported Dr. John T. Walkup, director of the division of child and adolescent psychiatry, Cornell University, New York. “So if a kid is 7 or 8 and is inattentive, they have two choices: Either he has ASD or he has ADHD.”
Confusion with ASD is less likely, because there is less symptom crossover, but the differential diagnosis with ADHD is more challenging. For anxiety, symptoms typically peak between the ages of 6 and 12 years. Although the onset of ADHD symptoms, like symptoms of ASD, generally occurs earlier, children with anxiety and ADHD often are brought to the attention of a physician within the same general window of time.
From the point of view of the complaints that initiated an evaluation, “generalized anxiety disorder and the inattentive subtype of ADHD are almost indistinguishable,” Dr. Walkup asserted. He suggested that children who are anxious have difficulty concentrating in class because their minds are “full of ideas, worries, and concerns.” Children with ADHD have difficulty concentrating in class because their minds are “susceptible to distraction,” but the result is the same.
Some children, even those who are only 7 or 8 years old, “can really describe to you that difference,” Dr. Walkup observed, although he said other features can be useful for distinguishing anxiety from other psychiatric disorders, including depression. In taking the history of a child with potential anxiety, key signs include difficulty coping with novel situations, excessive sensitivity to perceived threats, and shyness. These features are less likely to be in children with ADHD or depression.
Once children reach adolescence, social insecurity is more ubiquitous, making this complaint less useful for identifying a child with pathologic anxiety, but here there is also room for confusion without a careful history.
“We see a lot of kids who have social anxiety who get mislabeled as depressed. Socially anxious kids become demoralized, but they do not become anhedonic,” Dr. Walkup reported. In patients who are inhibited with their peers but who do not otherwise report disturbances in mood, generalized anxiety rather than depression may be driving the psychopathology, according to Dr. Walkup, who said this set of circumstances is common.
Once the diagnosis of anxiety is made, both SSRIs and cognitive-behavioral therapy are effective, with response rates of about 55%-60%, Dr. Walkup said. The response rates can climb as high as 80% when the two are combined, particularly when CBT is performed at experienced centers.
With SSRIs, one of the biggest concerns is activation, an adverse event that occurs in up to 10% of patients, Dr. Walkup said. If activation occurs, he advised switching patients to a nonactivating antidepressant, such as duloxetine, nefazodone, or a tricyclic agent, rather than rechallenging them with another SSRI. In his experience, activation on one agent predicts activation on another, but he cautioned against confusing activation with SSRI-induced mania.
“We do see so many kids who get activated on an SSRI and never see another antidepressant again, simply because the doc is afraid of precipitating mania,” Dr. Walkup said. He said mania is a very uncommon adverse event not typically observed, like activation, relatively quickly after initiating therapy. Because of the efficacy of SSRIs for pediatric anxiety, Dr. Walkup advised being slow in abandoning this drug class.
“Antidepressants work extremely well, and SSRIs are the medications of choice,” emphasized Dr. Walkup, who identified atypical antidepressants as a second-line choice in children and benzodiazepines, for which pediatric data are “limited,” as an option further down the list.
However, therapy first requires a diagnosis.
“Identifying anxiety is key,” Dr. Walkup said. “With evidence-based treatments available, there is a need to enhance public awareness and advocacy.”
Dr. Walkup reported no financial relationships.
EXPERT ANALYSIS FROM THE PSYCHOPHARMACOLOGY UPDATE INSTITUTE

VTE prophylaxis within 72 hours seems safe in severe TBI
SAN ANTONIO – Initiation of venous thromboembolism prophylaxis within 72 hours of severe traumatic brain injury (TBI) reduced the odds of venous thromboembolism by 50% without increasing subsequent intracranial complications or death in a large, propensity-matched cohort study from the University of Toronto.
The investigators matched 1,234 adult patients given prophylaxis before 72 hours – the early-prophylaxis (EP) group – to 1,234 given prophylaxis at 72 hours or later – the late-prophylaxis (LP) group – based on demographics, injury characteristics, intracranial lesions, early neurosurgical procedures, and prophylaxis type.

EP patients had a significantly lower rate of pulmonary embolism (1.1% vs. 2.4%; odds ratio, 0.48; 95% confidence interval, 0.25-0.91) and deep vein thrombosis (4.2% vs. 7.9%; OR, 0.51; 95% CI, 0.36-0.72), with no significant increase in the risk of death (9.8% EP vs. 9% LP; OR, 1.1; 95% CI 0.84-1.4) or late secondary craniotomy/-ectomy (EP 2.5% vs. LP 2.9%; OR, 0.86; 95% CI 0.53-1.4) or intracranial monitoring/drainage (EP 1.1% vs. LP 1.4%; OR, 0.76; 95% CI 0.37-1.6) from VTE complications or other reasons.
“Practice guidelines say we should initiate VTE [venous thromboembolism] prophylaxis” in severe TBI “as early as possible. It’s a very loose recommendation,” so some centers wait 72 hours or longer for fear of extending intracranial hemorrhages. Pending results from prospective trials, “our study lends evidence that early prophylaxis in this population may be safe,” said investigator and University of Toronto general surgery resident, Dr. James Byrne.
The study included 3,634 severe, adult TBI patients in the American College of Surgeons Trauma Quality Improvement Program database from 2012-2014. The subjects had head Abbreviated Injury Scale (AIS) scores of at least 3, Glasgow Coma Scale scores of no more than 8, and, in almost all cases, initial surgeries within 48 hours. Injury was due to blunt trauma. Patients who died or were discharged within 5 days of their injury and those with severe injuries to other body areas were excluded from the analysis.
The median time to starting VTE prophylaxis was 84 hours across the 186 trauma centers in the study, but ranged from 48-150 hours. Centers started prophylaxis within 72 hours in 18%-54% of patients. Fifty-five percent of patients had prophylaxis with low-molecular-weight heparin, and the rest with unfractionated heparin. Overall, 1.7% of patients developed pulmonary emboli, and 6.5% deep vein thromboses. Less than 3% had secondary neurosurgical interventions.
Prophylaxis was more likely to be delayed past 72 hours in patients with higher head AIS scores; subdural hematomas; subarachnoid hemorrhages; blood transfusions within 12 hours of admission; and early neurosurgery. Low-molecular-weight heparin was the more likely option past 72 hours.
Among the 114 centers who treated 10 or more patients, there was a continuous trend toward lower VTE rates with higher EP use, a rate of 9.1% in centers using EP in 18% of patients, but 6.1% in centers using it in 54% (P = .126).
The decision of when to start prophylaxis in severe TBI “still needs to be made at the patient level, but it may be safe to start earlier than 72 hours,” Dr. Byrne said.
The median age in the study was about 43 years, and three-quarters of the subjects were men. Most of the injuries were due to falls or motor vehicle crashes.
Dr. Byrne had no disclosures.
SAN ANTONIO – Initiation of venous thromboembolism prophylaxis within 72 hours of severe traumatic brain injury (TBI) reduced the odds of venous thromboembolism by 50% without increasing subsequent intracranial complications or death in a large, propensity-matched cohort study from the University of Toronto.
The investigators matched 1,234 adult patients given prophylaxis before 72 hours – the early-prophylaxis (EP) group – to 1,234 given prophylaxis at 72 hours or later – the late-prophylaxis (LP) group – based on demographics, injury characteristics, intracranial lesions, early neurosurgical procedures, and prophylaxis type.
EP patients had a significantly lower rate of pulmonary embolism (1.1% vs. 2.4%; odds ratio, 0.48; 95% confidence interval, 0.25-0.91) and deep vein thrombosis (4.2% vs. 7.9%; OR, 0.51; 95% CI, 0.36-0.72), with no significant increase in the risk of death (9.8% EP vs. 9% LP; OR, 1.1; 95% CI 0.84-1.4) or late secondary craniotomy/-ectomy (EP 2.5% vs. LP 2.9%; OR, 0.86; 95% CI 0.53-1.4) or intracranial monitoring/drainage (EP 1.1% vs. LP 1.4%; OR, 0.76; 95% CI 0.37-1.6) from VTE complications or other reasons.
“Practice guidelines say we should initiate VTE [venous thromboembolism] prophylaxis” in severe TBI “as early as possible. It’s a very loose recommendation,” so some centers wait 72 hours or longer for fear of extending intracranial hemorrhages. Pending results from prospective trials, “our study lends evidence that early prophylaxis in this population may be safe,” said investigator and University of Toronto general surgery resident, Dr. James Byrne.
The study included 3,634 severe, adult TBI patients in the American College of Surgeons Trauma Quality Improvement Program database from 2012-2014. The subjects had head Abbreviated Injury Scale (AIS) scores of at least 3, Glasgow Coma Scale scores of no more than 8, and, in almost all cases, initial surgeries within 48 hours. Injury was due to blunt trauma. Patients who died or were discharged within 5 days of their injury and those with severe injuries to other body areas were excluded from the analysis.
The median time to starting VTE prophylaxis was 84 hours across the 186 trauma centers in the study, but ranged from 48-150 hours. Centers started prophylaxis within 72 hours in 18%-54% of patients. Fifty-five percent of patients had prophylaxis with low-molecular-weight heparin, and the rest with unfractionated heparin. Overall, 1.7% of patients developed pulmonary emboli, and 6.5% deep vein thromboses. Less than 3% had secondary neurosurgical interventions.
Prophylaxis was more likely to be delayed past 72 hours in patients with higher head AIS scores; subdural hematomas; subarachnoid hemorrhages; blood transfusions within 12 hours of admission; and early neurosurgery. Low-molecular-weight heparin was the more likely option past 72 hours.
Among the 114 centers who treated 10 or more patients, there was a continuous trend toward lower VTE rates with higher EP use, a rate of 9.1% in centers using EP in 18% of patients, but 6.1% in centers using it in 54% (P = .126).
The decision of when to start prophylaxis in severe TBI “still needs to be made at the patient level, but it may be safe to start earlier than 72 hours,” Dr. Byrne said.
The median age in the study was about 43 years, and three-quarters of the subjects were men. Most of the injuries were due to falls or motor vehicle crashes.
Dr. Byrne had no disclosures.
AT THE EAST SCIENTIFIC ASSEMBLY
Key clinical point: VTE prophylaxis within 72 hours appears to be safe in patients with TBI.
Major finding: Patients who had prophylaxis within 72 hours had a significantly lower rate of pulmonary embolism, compared with those started later (1.1% vs. 2.4%); and deep vein thrombosis (4.2% vs. 7.9%).
Data source: More than 2,000 patients in a propensity-matched cohort study from the University of Toronto.
Disclosures: Dr. Byrne had no disclosures.

Surgeons dinged by incomplete risk adjustment for emergency cases
SAN ANTONIO – Perioperative risk factors affect postoperative morbidity and mortality differently in emergency and nonemergency surgery, according to an analysis of the ACS National Surgical Quality Improvement Program (ACS NSQIP) database by investigators from Massachusetts General Hospital, Boston.
“Instead of using the same risk-adjustment model for both ... as is currently being done, our findings strongly suggest the need to benchmark emergent and elective surgeries separately,” they concluded.
“Most risk-adjustment models simply have an on/off switch for whether or not the patient underwent emergency surgery and treat comorbidities and other perioperative variables the same.” Those variables, however, “don’t behave the same way in emergency surgery,” said investigator Dr. Jordan Bohnen, a surgical research resident at Mass General.
Because risk adjustment doesn’t take into account variables that have a particularly strong negative impact in emergency settings, acute care surgeons are getting “unnecessarily dinged for having higher complication rates,” he said at the Eastern Association for the Surgery of Trauma scientific assembly.
For example, the team found that preop transfusions and white blood counts (WBC) at or below 4.5 carry a significantly higher risk of 30-day major morbidity or mortality (MMM) in emergency versus nonemergency surgery. Conversely, ascites, preop anemia, and leukocytosis carry a greater MMM risk in nonemergent cases.
The findings come from a comparison of 110,182 nonemergent surgeries to 59,949 emergency cases – generally meaning surgery within 12 hours of emergency department (ED) admission – from the NSQIP database for 2011-2012.
As expected, the overall risk of MMM was significantly higher for emergency cases (16.75% vs. 9.73%; P less than .001), and four procedures – laparoscopic cholecystectomy, exploratory laparotomy, and umbilical and incisional hernia repairs – were relatively riskier when done emergently.
“As surgical quality improvement efforts mature, it’s increasingly important to apply accurate risk-adjustment models to benchmark quality improvement for surgeons, hospitals, and health care systems.” The current “assumption that perioperative variables have an equal impact on outcomes in emergent and nonemergent settings” is incorrect. “Risk factors for bad outcomes change depending on the setting,” Dr. Bohnen said.
Dr. Bohnen has no disclosures.
AT THE EAST SCIENTIFIC ASSEMBLY
Key clinical point: Emergent and elective surgeries need to be benchmarked separately.
Major finding: Preop transfusions and WBC counts at or below 4.5 carry a significantly higher risk of 30-day major morbidity or mortality (MMM) in emergency surgery. Conversely, ascites, preop anemia, and leukocytosis carry a greater MMM risk in nonemergent cases.
Data source: More than 170,000 cases in the NSQIP database
Disclosures: The presenter has no disclosures.

Lenalidomide shows promise for treating ATLL
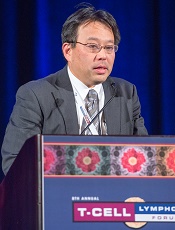
Photo by Larry Young
SAN FRANCISCO—Results of a phase 2 trial suggest lenalidomide may be a treatment option for patients with relapsed adult T-cell leukemia-lymphoma (ATLL).
Lenalidomide produced a 42% overall response rate (ORR) in this trial, and patients had a “favorable” median overall survival, according to Kisato Nosaka, MD, PhD, of the National Center for Global Health and Medicine in Tokyo, Japan.
He noted, however, that the survival data are still immature and may have been confounded by subsequent therapies.
Dr Nosaka presented these results at the 8th Annual T-cell Lymphoma Forum. The study was sponsored by Celgene K.K.
The trial included 26 Japanese patients with relapsed ATLL. Fifty-eight percent of patients had the acute subtype, 27% had the lymphoma subtype, and 15% had the unfavorable chronic subtype.
The patients’ median age was 68.5 (range, 53-81), and 65% of patients were 65 or older. Fifty percent of patients had an ECOG performance status of 0, 35% had a status of 1, and 15% had a status of 2.
Most patients had a low-risk simplified ATL-PI score (65%), but 35% had an intermediate-risk score. Fifteen percent had bone marrow involvement.
The median number of prior treatment regimens was 2 (range, 1-4). Forty-two percent of patients had prior mogamulizumab, and 35% had received LSG15 or modified LSG15.
Patients received lenalidomide at 25 mg per day, given continuously until disease progression or intolerability.
Safety
The median duration of treatment was 3.7 months (range, 0.4 to 18.3 months). There were no deaths during treatment or for 28 days after.
Nine patients (35%) experienced serious adverse events (AEs), but only 1 serious AE occurred in more than 1 patient. Two patients had serious thrombocytopenia.
The most frequent AEs were thrombocytopenia (77%), neutropenia (73%), lymphopenia (69%), and increased C-reactive protein (42%). The most frequent grade 3 or higher AEs were neutropenia (65%), leukopenia (38%), and lymphopenia (38%).
Response and survival
The median follow-up was 3.9 months. The ORR was 42%, including 5 complete responses/unconfirmed complete responses and 6 partial responses. Eight patients (31%) had stable disease, and 7 (27%) progressed.
Dr Nosaka noted that responses occurred in all disease subtypes and at all disease sites. The ORR was 33% (5/15) for the acute subtype, 50% (2/4) for the unfavorable chronic subtype, and 57% (4/7) for the lymphoma subtype.
The ORR was 31% (5/16) at the target lesion, 60% (6/10) in the peripheral blood, and 75% (6/8) for PGA (Physician’s Global Assessment of Clinical Condition, used to assess skin lesions).
Dr Nosaka also pointed out that the ORR was higher in patients who did not receive prior mogamulizumab (60%) than in patients who did (18%). However, he said the number of patients was too small for a definitive conclusion to be reached.
Similarly, the ORR was higher for patients in the low-risk simplified ATL-PI risk group than for those in the intermediate-risk group—53% and 22%, respectively.
Among the 11 responders, the median duration of response was not reached (range, 0.5 months to not reached). The mean duration of response was 5.2 months (range, 0 to 16.6 months).
The median progression-free survival was 3.8 months (range, 1.9 months to not reached). The median overall survival was 20.3 months (range, 9.1 months to not reached).
The overall survival was longer for patients in the low-risk ATL-PI group than the intermediate-risk group—not reached and 10.1 months, respectively (P=0.03).
In closing, Dr Nosaka said these results support lenalidomide as a possible treatment option for patients with relapsed/recurrent ATLL. ![]()
EHA creates ‘roadmap’ for hematology research

Photo by Daniel Sone
The European Hematology Association (EHA) has created a “roadmap” for hematology research in Europe.
This guidance document summarizes the current status of basic, translational, and clinical hematology research and identifies areas of unmet scientific and medical need in Europe.
It is intended to help European and national policy makers, funding agencies, charities, research institutes, and researchers make decisions on initiating, funding, or developing research.
The guidance, “The European Hematology Association Roadmap for European Hematology Research: A Consensus Document,” is published in this month’s issue of haematologica.
“For the first time, hematologists in Europe came together to develop a roadmap to guide hematology research in Europe” said Andreas Engert, MD, chair of the EHA Research Roadmap Task Force.
“Hematology in Europe has achieved a lot, but the discipline must focus and collaborate to be efficient and remain successful in improving patient outcomes. The roadmap does just that and will determine the research agenda in Europe in the coming years.”
Roughly 300 experts from more than 20 countries—including clinicians, basic researchers, and patients—contributed to the roadmap. Stakeholders such as national hematology societies, patient organizations, hematology trial groups, and other European organizations were consulted to comment on the final draft version.
The final roadmap has 9 sections: normal hematopoiesis, malignant lymphoid and myeloid diseases, anemias and related diseases, platelet disorders, blood coagulation and hemostatic disorders, transfusion medicine, infections in hematology, and hematopoietic stem cell transplantation.
The roadmap lists priorities and needs in these areas, including the need for targeted therapies based on genomic profiling and chemical biology, the need to eradicate minimal residual disease, and the need for treatments that are better tolerated by elderly patients.
“Now’s the time for Europe to pay attention,” said Ulrich Jäger, MD, chair of the EHA European Affairs Committee.
“With an aging population, the slow recovery from the financial and Euro crises, costly medical breakthroughs and innovations—quite a few of which involve hematology researchers—Europe faces increased health expenditures while budgets are limited.”
“Policy makers are rightfully cautious when spending the taxpayers’ money. So it is our responsibility to provide the policy makers with the information and evidence they need to decide where their support impacts knowledge and health most efficiently, to the benefit of patients and society. The Research Roadmap delivers on that. Now, it is up to the policy makers in the EU to deliver too.” ![]()
Olfactory receptor could be target for AML therapy

Investigators have discovered that an olfactory receptor in white blood cells responds to Sandalore, a synthetic odorant with a sandalwood note.
The team identified 7 olfactory receptors in a chronic myeloid leukemia (CML) cell line that were also present in white blood cells from patients with acute myeloid leukemia (AML).
One of the highest expressed receptors, OR2AT4, responded to Sandalore by fighting off the leukemia.
The investigators believe this finding could aid the development of new treatment for AML.
Hanns Hatt, PhD, DrMed, of the Ruhr-Universität Bochum in Germany, and his colleagues described this work in Cell Death Discovery.
The team found 7 olfactory receptors in the CML cell line K562—OR51B4, OR51B5, OR52D1, OR2W3, OR2B6, OR2AT4, and OR51I2. These receptors were also expressed in samples from AML patients.
The investigators then found that OR2AT4, one of the highest expressed olfactory receptors, is activated by Sandalore.
If Sandalore was used to activate the receptor, it inhibited leukemia cell proliferation and induced apoptosis in the leukemia cells. It also induced erythroid differentiation.
In 2014, Dr Hatt and his colleagues discovered that OR2AT4 is present in skin cells and that, by activating it with sandalwood aroma, wound healing is promoted. Through a series of tests, the team identified the signaling pathways underlying the observed effects.
With the current study, the investigators found that if Sandalore activates OR2AT4 in the context of CML or AML, processes similar to those in the olfactory cells in the nose start in blood cells.
The concentration of calcium ions in the cells increases. This, in turn, activates signaling pathways in which phosphate groups are transmitted to MAP kinases.
“This could be a new starting point for the development of leukemia treatment,” Dr Hatt said. “Acute myeloid leukemia, in particular, is a disease for which specific medication is not, as yet, available.” ![]()
Reducing the risk of Zika transmission via transfusion
The continued spread of the Zika virus has raised concerns about transmission via blood transfusion.
So organizations in the US are asking people who have visited Zika outbreak zones to defer their plans to donate blood.
The US Food and Drug Administration is currently reviewing its blood donation policy with regard to the virus, but the American Red Cross and AABB are recommending donor self-deferral.
Both organizations said people should refrain from donating blood for 28 days if they have visited Mexico, the Caribbean, Central America, or South America in the past 4 weeks.
AABB said blood collection facilities should implement self-deferral, but blood-center-documented donor deferral is not required.
AABB has also recommended that donors who don’t defer call the blood collection facility if they travelled to Zika outbreak areas or other tropical areas and develop an unexplained illness that includes 2 or more symptoms common to Zika, dengue, and chikungunya virus infection in the 14 days after they donate blood.
In addition, blood collection facilities should recall nontransfused products if an infected donor reports experiencing 2 or more such symptoms.
And if a blood collection facility receives a post-donation report of a confirmed case of Zika, the facility should recall any in-date products collected in the 14 days before the onset of symptoms and defer the donor for 28 days after the symptoms are resolved.
About the virus
Zika is a flavivirus transmitted by Aedes mosquitoes. The virus was first described in Africa, but it began to cause epidemics in the Pacific in 2007. In 2015, Zika was found in Brazil, and local transmission has since been reported in more than 20 countries and territories in the Western Hemisphere.
When symptomatic, Zika infection typically causes a mild illness characterized by fever, myalgia, rash, retro-orbital pain, and prostration. However, asymptomatic infection occurs in about 80% of Zika-infected individuals.
Microcephaly has been linked to the ongoing Zika epidemic in Brazil, although the connection has not been confirmed. It has been suggested that microcephaly may be a result of maternal transmission of the Zika virus to the fetus.
During the French Polynesian outbreak of Zika virus that occurred in 2013, there was a 20-fold increase in the number of individuals diagnosed with Guillain-Barré syndrome.
It is not clear what risk the Zika virus poses to the blood supply, but the potential for transfusion transmission was suggested during the French Polynesian outbreak.
The maximum duration of viremia is thought to be less than 28 days, which is why AABB and American Red Cross are recommending a 28-day deferral period for blood donors who may have the virus. ![]()
Red, swollen neck

The FP diagnosed cellulitis with a probable abscess over the neck. He explained that the pus over the neck needed to be drained and the grandmother (the child’s sole caretaker) gave her consent for the procedure. The area of maximal fluctuance was identified by palpation and the FP injected 1% lidocaine with epinephrine to numb the area. He then proceeded with the incision and drainage of the abscess, being careful to stay away from vital structures in the neck.
A significant amount of pus was drained and the finger of a sterile glove was cut off to place in the drainage site to allow for continued drainage. The patient was given ceftriaxone intravenously and the child remained in the community health center overnight with her grandmother and the nursing staff on duty.
The following day, the child was doing much better and her appetite started to return. Two days later, the child was afebrile and was sent home with her grandmother. The FP and the medical student mission team continued to make house calls daily and administer antibiotics until the child's infection was fully resolved.
The importance of incision and drainage cannot be overstated in this case. While cutting over the neck of a non-anesthetized child has its risks, allowing a neck abscess to remain surgically untreated can be life-threatening.
Photos and text for Photo Rounds Friday courtesy of Richard P. Usatine, MD. This case was adapted from: Usatine R. Cellulitis. In: Usatine R, Smith M, Mayeaux EJ, et al, eds. Color Atlas of Family Medicine. 2nd ed. New York, NY: McGraw-Hill; 2013:693-697.
To learn more about the Color Atlas of Family Medicine, see: www.amazon.com/Color-Family-Medicine-Richard-Usatine/dp/0071769641/
You can now get the second edition of the Color Atlas of Family Medicine as an app by clicking on this link: usatinemedia.com