User login
Endocrinologists report little training in transgender care
Although endocrinologists are often the go-to specialists for hormone therapy, more than 80% of those surveyed had no training in how to treat transgender patients, a study showed.
Meanwhile, more than a quarter of endocrinology fellowship directors surveyed said their programs don’t offer education in transgender care.

According to a June 2016 report by the Williams Institute at the University of California, Los Angeles, an estimated 0.58% of adults in the United States identify as transgender, with numbers reaching as high as 2.77% in Washington, D.C., 0.78% in Hawaii, 0.76% in California, and 0.75% in New Mexico and Georgia.
Endocrinologists are especially likely to see transgender patients in order to assist with hormone therapy. Of course, they also see them for general endocrinology needs, said lead study author Caroline Davidge-Pitts, MBBCh, of the Mayo Clinic’s department of endocrinology in Rochester, Minn.
For the current study of transgender care, “we wanted to assess what the current knowledge and practice is among practicing physicians as well as the state of education for our endocrinology fellows,” she said in an interview.
Dr. Davidge-Pitts and her colleagues sent an anonymous Internet survey to 104 endocrinology fellowship program directors (PDs) and 6,992 physician members of the Endocrine Society in the United States. Fifty-four of the program directors responded (51.9%), as did 411 of the clinicians (5.9%) (J Clin Endocrinol Metab. 2017 Jan 10. doi: 10.1210/jc.2016-3007).
The program directors represent 54 programs, of which 35 (72.2%) provide instruction regarding transgender care. All offer instruction about hormone therapy in this context.
Almost 94% of the program directors described education about transgender care as important. Forty-two respondents said challenges to better education regarding transgender care include lack of faculty interest or experience (59.5%), lack of resources for training (47.6%), and lack of money (40.5%).
Of 46 respondents, 91% said online training modules for students would be helpful; 71.7% pointed to modules for professors, and 71.7% mentioned lectures from visiting faculty.
Among clinicians, 79.8% said they had ever treated a transgender patient, and 55% reported treating more than five transgender patients a year. But 80.6% of 382 responders said they’d never had training in the treatment of these patients.
Most of the responding endocrinologists said they felt confident regarding definitions, taking a history, and prescribing hormones, but 42.4% or less felt that way about sex change operations, organ-specific screening guidelines, and psychosocial/legal issues.
Dr. Davidge-Pitts said the study indicates more education in transgender care is needed in fellowship programs: “We envision a more structured approach ... with an introductory curriculum in the first year of fellowship aligned to specific competencies, followed by a more advanced curriculum in the second or third year.”
Overall, “we need to allocate resources to develop online training modules to help our endocrine fellows and practitioners too, to give them the ability to get education in their office,” Dr. Davidge-Pitts said.
As for the clinical setting, the study supports changes to make transgender patients more comfortable, such as gender-neutral restrooms and training for staff about how to treat transgender patients with respect, she said.
Dr. Safer, medical director of the center for transgender medicine and surgery at Boston University and Boston Medical Center, said things have changed since he graduated from medical school in 1990. “I didn’t even hear the word transgender in medical school, residency, or fellowship,” he said, “and I don’t think much changed in the next 10-20 years.”
Now, there’s more focus on treating these patients sensitively, but “they still don’t still teach the underlying medicine, so the physicians are still not equipped with the basic knowledge they need to take care of the patients,” Dr. Safer said.
He suggested that endocrinologists who are interested in learning more about transgender care get in touch with the World Professional Association for Transgender Health at wpath.org.
Although endocrinologists are often the go-to specialists for hormone therapy, more than 80% of those surveyed had no training in how to treat transgender patients, a study showed.
Meanwhile, more than a quarter of endocrinology fellowship directors surveyed said their programs don’t offer education in transgender care.
According to a June 2016 report by the Williams Institute at the University of California, Los Angeles, an estimated 0.58% of adults in the United States identify as transgender, with numbers reaching as high as 2.77% in Washington, D.C., 0.78% in Hawaii, 0.76% in California, and 0.75% in New Mexico and Georgia.
Endocrinologists are especially likely to see transgender patients in order to assist with hormone therapy. Of course, they also see them for general endocrinology needs, said lead study author Caroline Davidge-Pitts, MBBCh, of the Mayo Clinic’s department of endocrinology in Rochester, Minn.
For the current study of transgender care, “we wanted to assess what the current knowledge and practice is among practicing physicians as well as the state of education for our endocrinology fellows,” she said in an interview.
Dr. Davidge-Pitts and her colleagues sent an anonymous Internet survey to 104 endocrinology fellowship program directors (PDs) and 6,992 physician members of the Endocrine Society in the United States. Fifty-four of the program directors responded (51.9%), as did 411 of the clinicians (5.9%) (J Clin Endocrinol Metab. 2017 Jan 10. doi: 10.1210/jc.2016-3007).
The program directors represent 54 programs, of which 35 (72.2%) provide instruction regarding transgender care. All offer instruction about hormone therapy in this context.
Almost 94% of the program directors described education about transgender care as important. Forty-two respondents said challenges to better education regarding transgender care include lack of faculty interest or experience (59.5%), lack of resources for training (47.6%), and lack of money (40.5%).
Of 46 respondents, 91% said online training modules for students would be helpful; 71.7% pointed to modules for professors, and 71.7% mentioned lectures from visiting faculty.
Among clinicians, 79.8% said they had ever treated a transgender patient, and 55% reported treating more than five transgender patients a year. But 80.6% of 382 responders said they’d never had training in the treatment of these patients.
Most of the responding endocrinologists said they felt confident regarding definitions, taking a history, and prescribing hormones, but 42.4% or less felt that way about sex change operations, organ-specific screening guidelines, and psychosocial/legal issues.
Dr. Davidge-Pitts said the study indicates more education in transgender care is needed in fellowship programs: “We envision a more structured approach ... with an introductory curriculum in the first year of fellowship aligned to specific competencies, followed by a more advanced curriculum in the second or third year.”
Overall, “we need to allocate resources to develop online training modules to help our endocrine fellows and practitioners too, to give them the ability to get education in their office,” Dr. Davidge-Pitts said.
As for the clinical setting, the study supports changes to make transgender patients more comfortable, such as gender-neutral restrooms and training for staff about how to treat transgender patients with respect, she said.
Dr. Safer, medical director of the center for transgender medicine and surgery at Boston University and Boston Medical Center, said things have changed since he graduated from medical school in 1990. “I didn’t even hear the word transgender in medical school, residency, or fellowship,” he said, “and I don’t think much changed in the next 10-20 years.”
Now, there’s more focus on treating these patients sensitively, but “they still don’t still teach the underlying medicine, so the physicians are still not equipped with the basic knowledge they need to take care of the patients,” Dr. Safer said.
He suggested that endocrinologists who are interested in learning more about transgender care get in touch with the World Professional Association for Transgender Health at wpath.org.
FROM THE JOURNAL OF CLINICAL ENDOCRINOLOGY & METABOLISM
Key clinical point:
Major finding: Of endocrinologists surveyed, 80.6% said they’d never received training in transgender care, while 72.2% of fellowship program directors reported offering instruction in how to treat these patients.
Data source: Responses to surveys from 54 endocrinology fellowship program directors and 411 clinical endocrinologists.
Disclosures: The study authors reported no relevant financial disclosures.

Home treatment of PE remains rare
Clinical question: What is the prevalence of outpatient treatment of acute pulmonary embolism (PE)?
Background: PE traditionally is perceived as a serious condition requiring hospitalization. Many studies, however, have shown that outpatient treatment of PE in low-risk, compliant patients is safe. Several scoring systems have been derived to identify patients with PE who are at low risk of adverse events and may be candidates for home treatment.
Setting: Five U.S. EDs.
Synopsis: Among 983 patients diagnosed with acute PE, 237 (24.1%) were unstable and hypoxic. Only a small proportion of patients (1.7%) were eligible for outpatient therapy, and an additional 16.2% of hospitalized patients were discharged early (2 days or less). Novel oral anticoagulants were administered to fewer than one-third of patients.
Bottom line: In the era of novel anticoagulants, the majority of patients with acute PE were hospitalized, and home treatment was infrequently selected for stable low-risk patients.
Citation: Stein PD, Matta F, Hughes PG, et al. Home treatment of pulmonary embolism in the era of novel oral anticoagulants. Am J Med. 2016;129(9):974-977.
Dr. Gummalla is an assistant professor at the University of Miami Miller School of Medicine and a hospitalist at University of Miami Hospital and Jackson Memorial Hospital.
Updated recommendations for managing gout
Clinical question: What are the new treatment options for gout?
Background: The 2006 European League Against Rheumatism (EULAR) guidelines recommend that acute flares of gout be treated as early as possible with either oral colchicine, oral corticosteroids, or intra-articular corticosteroids. Experts recommend starting urate-lowering therapy (ULT) only when certain severe clinical features occur, such as recurrent acute attacks and tophi.
Study design: Systematic review.
Setting: EULAR task force members from 12 European countries.
Synopsis: Since the last guidelines, interleukin-1 blockers (IL-1) were found to play a crucial role in crystal-induced inflammation. IL-1, NSAIDs, and corticosteroids should be considered in patients with frequent flares and contraindications to colchicine.
Unlike in the previous guidelines, ULT should be considered from first presentation of gout; for severe disease, serum uric acid (SUA) levels should be maintained at less than 6 mg/dL and less than 5 mg/dL.
Allopurinol is recommended for first-line ULT, and if the SUA target cannot be reached, it should be switched to another xanthine oxidase inhibitor (febuxostat) or a uricosuric or combined with a uricosuric.
Pegloticase is recommended for refractory gout.
Bottom line: The updated 2016 EULAR guidelines recommend new treatment options for gout and updated indications for ULT.
Citation: Richette P, Doherty M, Pascual E, et al. 2016 updated EULAR evidence-based recommendations for the management of gout [published online ahead of print July 25, 2016]. Ann Rheum Dis. doi: 10.1136/annrheumdis-2016-209707.
Dr. Gummalla is an assistant professor at the University of Miami Miller School of Medicine and a hospitalist at University of Miami Hospital and Jackson Memorial Hospital.
Diagnosis at a Glance: Partial Hydatidiform Molar Pregnancy
Case
A 26-year-old gravida 3, para 2-0-0-2, aborta 0 whose last menstrual period was 15 weeks 5 days, presented to the ED with complaints of mild vaginal spotting, which she first noted postcoitally the previous day. The patient denied fatigue, lightheadedness, dyspnea, abdominal pain, nausea, or vomiting.
Physical examination revealed a well-appearing patient with normal vital signs. The abdomen was soft and nontender, and the fundus was palpable at the level of the umbilicus. A speculum examination was unremarkable, with normal external genitalia, a closed cervical os, no adnexal masses or tenderness, and no blood in the vaginal vault. Laboratory studies were significant for a serum beta human chorionic gonadotropin (beta-hCG) of 7,442 mIU/mL (reference range for 15 weeks: 12,039-70,971 mIU/mL). The patient was Rh positive with a stable hematocrit.
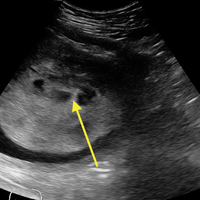
A bedside ultrasound, performed by an ultrasound-]trained emergency physician (EP), was noted to demonstrate a complex intrauterine mass comprised of several small, rounded anechoic clusters (Figure). 
An obstetric consultation was made and the patient was taken to the operating room the following day for a dilation and curettage (D&C) procedure. She was discharged home the next day without complications. The products of conception were sent to pathology, and confirmed a triploid karyotype and p57 trophoblastic immunopositivity, diagnostic of a partial hydatidiform mole.
Discussion
Hydatidiform moles are a subset of abnormal pregnancies termed gestational trophoblastic disease (GTD). The two greatest risk factors for GTD are previous GTD and extremis of maternal age.1 Patients often present to the ED because of painless heavy vaginal bleeding, hyperemesis gravidarum, symptoms of hyperthyroidism, or preeclampsia before 20 weeks.2 Clinically, these patients present with an enlarged uterus for gestational age and very high beta-hCG levels, often greater than 100,000 mIU/mL.3 The high beta-hCG levels can lead the patient to present with symptoms of hyperthyroidism, such as severe hypertension, given the similar chemical structures of beta-hCG and thyroid-stimulating hormone.4
After a D&C, interval beta-hCG levels need to be obtained to ensure resolution. A patient with beta-hCG levels that do not fall by 10% after 3 weeks, or are still present after 6 months, should be referred to a gynecologic oncologist.5,6 Furthermore, a chest X-ray is strongly suggested, as the lungs are often the first place of metastasis.7
Partial hydatidiform moles are formed by a dispermic fertilization of a normal ovum leading to a triploid pattern, and are clinically distinguished from complete molar pregnancies because affected patients have a uterus that is often small for gestational age.8 Also, while the beta-hCG is also abnormally elevated, the median value is more modest at approximately 50,000 mIU/mL.3
According to the American College of Radiology’s Appropriateness Criteria, ultrasound is the gold standard for evaluating gestational trophoblastic disease. While the classic sonographic appearance of a molar pregnancy is described as a “snowstorm” appearance, advancement in technology more clearly demonstrates a “cluster of grapes” or “honeycomb” appearance.9 On Doppler mode, increased vascularity peripherally can also be detected due to engorgement of the spiral arteries. While partial moles tend to have more focal lesions, the greatest distinguishing factor is the presence of embryonic or fetal tissue, which is not seen in complete moles. However, due to the heterogeneous appearance of the uterus in all GTD, molar pregnancies can sometimes be misinterpreted as missed abortions or clotted blood, so that pathological confirmation is mandatory for all products of conception in the United States and Canada.2,10
Summary
This case is of particular interest because it demonstrates an atypical presentation of a partial hydatidiform mole. While most classic presentations include older patients with heavy vaginal bleeding, a smaller uterus than expected, significantly elevated beta-hCGs, and hyperemesis gravidarum, our patient was relatively young with no history of molar pregnancies in the past, a larger-than-expected uterus, and no vaginal bleeding noted. Laboratory values also indicated a significantly lower-than-expected beta-hCG level. As such, bedside ultrasound findings were unexpected but resulted in the prompt diagnosis, an emergent obstetric consultation, and confirmatory radiology imaging. The ED bedside ultrasound findings did demonstrate the characteristic “cluster of grapes” appearance surrounded by the hyperechoic appearance of the spiral arteries (Figure). An intrauterine yolk sac was also identified by ultrasound, which strongly suggested a partial rather than a complete hydatidiform molar pregnancy.
While hydatidiform pregnancies are relatively rare, EPs should be aware of the clinical and sonographic features of these diseases. This case, particularly given the atypical clinical presentation for a partial molar pregnancy, highlights the importance of ultrasound in pregnancy, and the utility of bedside ultrasound in the evaluation of the etiology of vaginal bleeding in the early pregnant patient that presents to the ED.
1. Ngan H, Bender H, Benedet JL, et al. Gestational trophoblastic neoplasia, FIGO 2000 staging and classification. Int J Gynaecol Obstet. 2003;83 Suppl 1:175-177.
2. Tie W, Tajnert K, Plavsic SK. Ultrasound imaging of gestational trophoblastic disease. Donald School J Ultrasound Obstet Gynecol. 2013;7(1):105-112.
3. Berkowitz RS, Goldstein DP. Current advances in the management of gestational trophoblastic disease. Gynecol Oncol. 2013;128(1):3-5.
4. Cole LA, Butler S. Detection of hCG in trophoblastic disease: The USA hCG reference service experience. J Reprod Med. 2002;47(6):433-444.
5. Lavie I, Rao GG, Castrillon DH, Miller DS, Schorge JO. Duration of human chorionic gonadotropin surveillance for partial hydatidiform moles. Am J Obstet Gynecol. 2005;192(5):1362-1364.
6. Kenny L, Seckl MJ. Treatments for gestational trophoblastic disease. Expert Rev of Obstet Gynecol. 2010;5(2):215-225.
7. Soto-Wright V, Bernstein M, Goldstein DP, Berkowitz RS. The changing clinical presentation of complete molar pregnancy. Obstet Gynecol. 1995;86(5):775-779.
8. Berkowitz RS, Goldstein DP. Clinical practice. Molar pregnancy. N Engl J Med. 2009;360(16):1639-1645. doi: 10.1056/NEJMcp0900696.
9. Kirk E, Papageorghiou AT, Condous G, Bottomley C, Bourne T. The accuracy of first trimester ultrasound in the diagnosis of hydatidiform mole. Ultrasound Obstet Gynecol. 2007;29(1):70-75.
10. Wang Y, Zhao S. Vascular Biology of the Placenta. Chapter 4. Cell Types of the Placenta. San Rafael, CA: Morgan & Claypool Life Sciences; 2010.
Case
A 26-year-old gravida 3, para 2-0-0-2, aborta 0 whose last menstrual period was 15 weeks 5 days, presented to the ED with complaints of mild vaginal spotting, which she first noted postcoitally the previous day. The patient denied fatigue, lightheadedness, dyspnea, abdominal pain, nausea, or vomiting.
Physical examination revealed a well-appearing patient with normal vital signs. The abdomen was soft and nontender, and the fundus was palpable at the level of the umbilicus. A speculum examination was unremarkable, with normal external genitalia, a closed cervical os, no adnexal masses or tenderness, and no blood in the vaginal vault. Laboratory studies were significant for a serum beta human chorionic gonadotropin (beta-hCG) of 7,442 mIU/mL (reference range for 15 weeks: 12,039-70,971 mIU/mL). The patient was Rh positive with a stable hematocrit.
A bedside ultrasound, performed by an ultrasound-]trained emergency physician (EP), was noted to demonstrate a complex intrauterine mass comprised of several small, rounded anechoic clusters (Figure).
An obstetric consultation was made and the patient was taken to the operating room the following day for a dilation and curettage (D&C) procedure. She was discharged home the next day without complications. The products of conception were sent to pathology, and confirmed a triploid karyotype and p57 trophoblastic immunopositivity, diagnostic of a partial hydatidiform mole.
Discussion
Hydatidiform moles are a subset of abnormal pregnancies termed gestational trophoblastic disease (GTD). The two greatest risk factors for GTD are previous GTD and extremis of maternal age.1 Patients often present to the ED because of painless heavy vaginal bleeding, hyperemesis gravidarum, symptoms of hyperthyroidism, or preeclampsia before 20 weeks.2 Clinically, these patients present with an enlarged uterus for gestational age and very high beta-hCG levels, often greater than 100,000 mIU/mL.3 The high beta-hCG levels can lead the patient to present with symptoms of hyperthyroidism, such as severe hypertension, given the similar chemical structures of beta-hCG and thyroid-stimulating hormone.4
After a D&C, interval beta-hCG levels need to be obtained to ensure resolution. A patient with beta-hCG levels that do not fall by 10% after 3 weeks, or are still present after 6 months, should be referred to a gynecologic oncologist.5,6 Furthermore, a chest X-ray is strongly suggested, as the lungs are often the first place of metastasis.7
Partial hydatidiform moles are formed by a dispermic fertilization of a normal ovum leading to a triploid pattern, and are clinically distinguished from complete molar pregnancies because affected patients have a uterus that is often small for gestational age.8 Also, while the beta-hCG is also abnormally elevated, the median value is more modest at approximately 50,000 mIU/mL.3
According to the American College of Radiology’s Appropriateness Criteria, ultrasound is the gold standard for evaluating gestational trophoblastic disease. While the classic sonographic appearance of a molar pregnancy is described as a “snowstorm” appearance, advancement in technology more clearly demonstrates a “cluster of grapes” or “honeycomb” appearance.9 On Doppler mode, increased vascularity peripherally can also be detected due to engorgement of the spiral arteries. While partial moles tend to have more focal lesions, the greatest distinguishing factor is the presence of embryonic or fetal tissue, which is not seen in complete moles. However, due to the heterogeneous appearance of the uterus in all GTD, molar pregnancies can sometimes be misinterpreted as missed abortions or clotted blood, so that pathological confirmation is mandatory for all products of conception in the United States and Canada.2,10
Summary
This case is of particular interest because it demonstrates an atypical presentation of a partial hydatidiform mole. While most classic presentations include older patients with heavy vaginal bleeding, a smaller uterus than expected, significantly elevated beta-hCGs, and hyperemesis gravidarum, our patient was relatively young with no history of molar pregnancies in the past, a larger-than-expected uterus, and no vaginal bleeding noted. Laboratory values also indicated a significantly lower-than-expected beta-hCG level. As such, bedside ultrasound findings were unexpected but resulted in the prompt diagnosis, an emergent obstetric consultation, and confirmatory radiology imaging. The ED bedside ultrasound findings did demonstrate the characteristic “cluster of grapes” appearance surrounded by the hyperechoic appearance of the spiral arteries (Figure). An intrauterine yolk sac was also identified by ultrasound, which strongly suggested a partial rather than a complete hydatidiform molar pregnancy.
While hydatidiform pregnancies are relatively rare, EPs should be aware of the clinical and sonographic features of these diseases. This case, particularly given the atypical clinical presentation for a partial molar pregnancy, highlights the importance of ultrasound in pregnancy, and the utility of bedside ultrasound in the evaluation of the etiology of vaginal bleeding in the early pregnant patient that presents to the ED.
1. Ngan H, Bender H, Benedet JL, et al. Gestational trophoblastic neoplasia, FIGO 2000 staging and classification. Int J Gynaecol Obstet. 2003;83 Suppl 1:175-177.
2. Tie W, Tajnert K, Plavsic SK. Ultrasound imaging of gestational trophoblastic disease. Donald School J Ultrasound Obstet Gynecol. 2013;7(1):105-112.
3. Berkowitz RS, Goldstein DP. Current advances in the management of gestational trophoblastic disease. Gynecol Oncol. 2013;128(1):3-5.
4. Cole LA, Butler S. Detection of hCG in trophoblastic disease: The USA hCG reference service experience. J Reprod Med. 2002;47(6):433-444.
5. Lavie I, Rao GG, Castrillon DH, Miller DS, Schorge JO. Duration of human chorionic gonadotropin surveillance for partial hydatidiform moles. Am J Obstet Gynecol. 2005;192(5):1362-1364.
6. Kenny L, Seckl MJ. Treatments for gestational trophoblastic disease. Expert Rev of Obstet Gynecol. 2010;5(2):215-225.
7. Soto-Wright V, Bernstein M, Goldstein DP, Berkowitz RS. The changing clinical presentation of complete molar pregnancy. Obstet Gynecol. 1995;86(5):775-779.
8. Berkowitz RS, Goldstein DP. Clinical practice. Molar pregnancy. N Engl J Med. 2009;360(16):1639-1645. doi: 10.1056/NEJMcp0900696.
9. Kirk E, Papageorghiou AT, Condous G, Bottomley C, Bourne T. The accuracy of first trimester ultrasound in the diagnosis of hydatidiform mole. Ultrasound Obstet Gynecol. 2007;29(1):70-75.
10. Wang Y, Zhao S. Vascular Biology of the Placenta. Chapter 4. Cell Types of the Placenta. San Rafael, CA: Morgan & Claypool Life Sciences; 2010.
Cardiofaciocutaneous Syndrome and the Dermatologist’s Contribution to Diagnosis
To the Editor:
RASopathies, a class of developmental disorders, are caused by mutations in genes that encode protein components of the RAS/mitogen-activated protein kinase (MAPK) pathway. Each syndrome exhibits its phenotypic features; however, because all of them cause dysregulation of the RAS/MAPK pathway, there are numerous overlapping phenotypic features between the syndromes including cardiac defects, cutaneous abnormalities, characteristic facial features, neurocognitive impairment, and increased risk for developing some neoplastic disorders.
Cardiofaciocutaneous (CFC) syndrome is a RASopathy and is a genetic sporadic disease characterized by multiple congenital anomalies associated with mental retardation. It has a complex dermatological phenotype with many cutaneous features that can be helpful to differentiate CFC syndrome from Noonan and Costello syndromes, which also are classified as RASopathies.
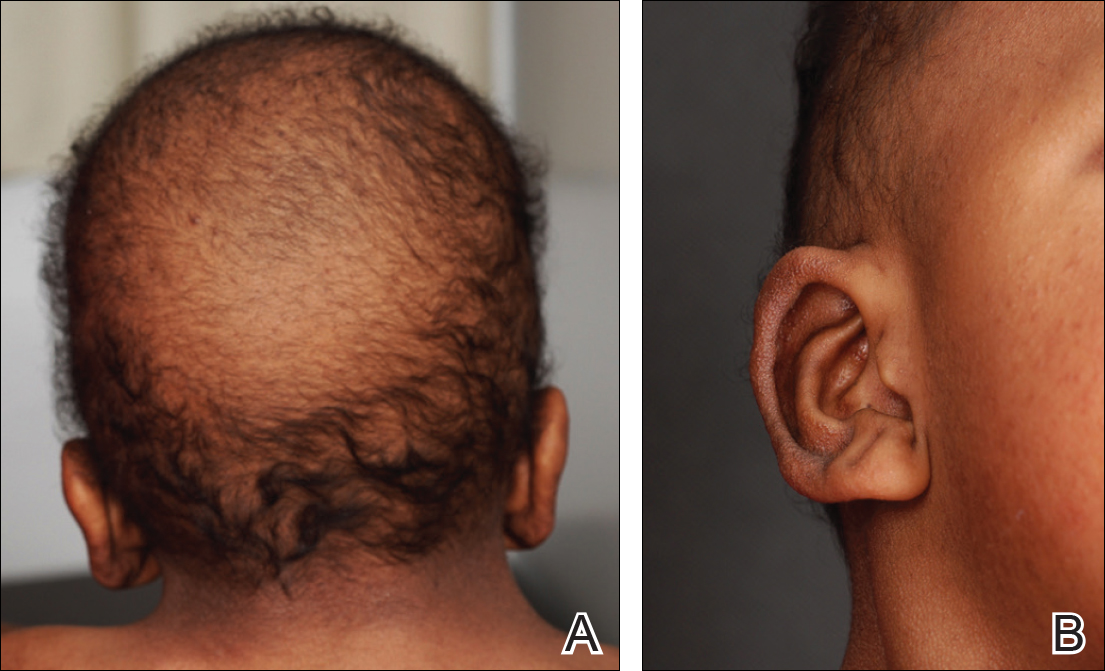
A 3-year-old girl presented with skin xerosis and follicular hyperkeratosis of the face, neck, trunk, and limbs (Figure 1). Facial follicular hyperkeratotic papules on an erythematous base were associated with alopecia of the eyebrows (ulerythema ophryogenes). Hair was sparse and curly (Figure 2A). Facial dysmorphic features included a prominent forehead with bitemporal constriction, bilateral ptosis, a broad nasal base, lip contour in a Cupid’s bow, low-set earlobes with creases (Figure 2B), and a short and webbed neck.

Congenital heart disease, hypothyroidism, bilateral hydronephrosis, delayed motor development, and seizures were noted for the first 2 years. Brain computed tomography detected a dilated ventricular system with hydrocephalus. There was no family history of consanguinity.
Pregnancy was complicated by polyhydramnios and preeclampsia. The neonate was delivered at full-term and was readmitted at 6 days of age due to respiratory failure secondary to congenital chylothorax. Cardiac malformation was diagnosed as the ostium secundum atrial septal defect and interventricular and atrioventricular septal defects. Up to this point she was being treated for Turner syndrome.
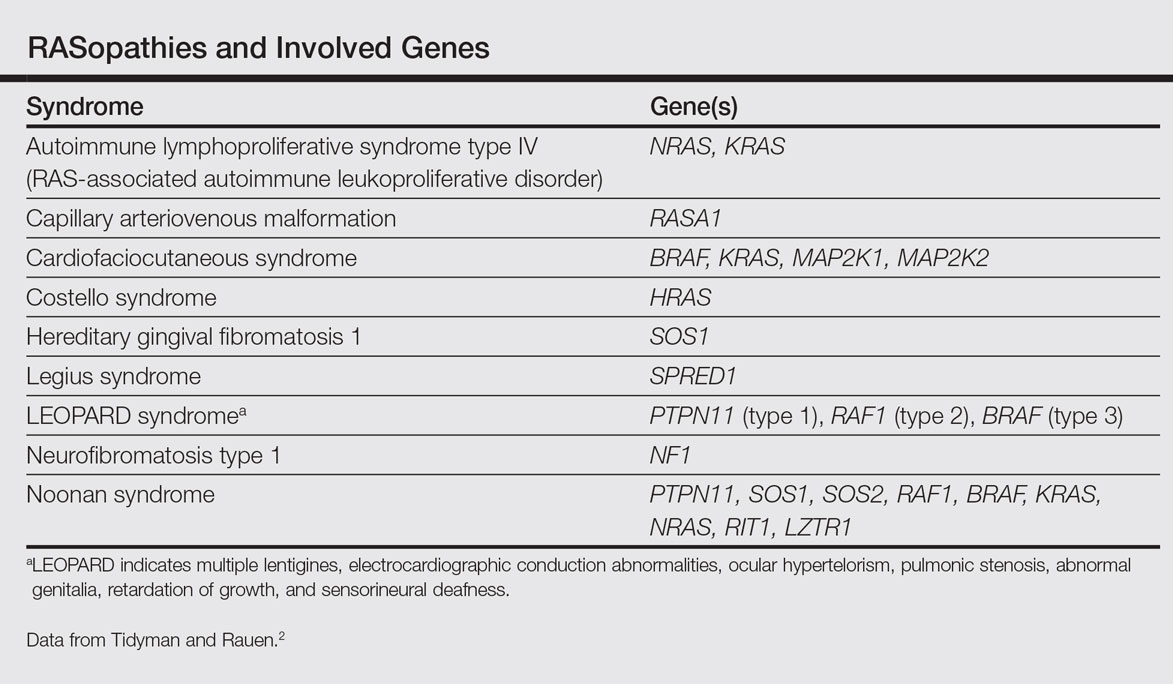
The RASopathies are a class of human genetic syndromes that are caused by germ line mutations in genes that encode components of the RAS/MAPK pathway.1 There are many syndromes classified as RASopathies (Table).2,3
Cardiofaciocutaneous syndrome (Online Mendelian Inheritance in Man [OMIM] 115150) is a genetic disorder first described by Reynolds et al4 and is characterized by several cutaneous abnormalities, cardiac defects, dysmorphic craniofacial features, gastrointestinal dysmotility, and mental retardation. It occurs sporadically and is caused by functional activation of mutations in 4 different genes—BRAF, KRAS, MAP2K1, MAP2K2—of the RAS extracellular signal–regulated kinase molecular cascade that regulates cell differentiation, proliferation, and apoptosis.1
As a RASopathy, CFC syndrome is a member of a family of syndromes with similar phenotypes, which includes mainly Noonan and Costello syndromes. Psychomotor retardation and physical anomalies, the common denominator of all syndromes, may be explained by the effects of the mutations during early development.5,6
In CFC, relative macrocephaly, prominent forehead, bitemporal constriction, absence of eyebrows, palpebral ptosis, broad nasal root, bulbous nasal tip, and small chin commonly are found. The eyes are widely spaced and the palpebral fissures are downward slanting with epicanthic folds.1,4,7
Follicular keratosis of the arms, legs, and face occurs in 80% of cases of CFC and ulerythema ophryogenes with sparse eyebrows in 90% of cases. Sparse, curly, and slow-growing hair is found in 93% of patients. Xerotic scaly skin, hyperkeratosis of the palms and soles, infantile hemangiomas, and multiple melanocytic nevi also may occur.8
Cardiac abnormalities are seen in 75.7% of patients.1 Other features include mental retardation, delayed motor development, and structural abnormalities in the central nervous system, as well as seizures and electroencephalogram abnormalities. Unlike Noonan and Costello syndromes, it is unclear if patients with CFC syndrome are at an increased risk for cancer.1
Noonan syndrome (OMIM #163950) is a disorder characterized by congenital heart defects, short stature, skeletal abnormalities, distinctive facial dysmorphic features, and variable cognitive deficits. Other associated features include cryptorchidism, lymphatic dysplasia, bleeding tendency, and occasional hematologic malignancies during childhood. This syndrome is related to mutations in the PTPN11, SOS1, SOS2, RAF1, BRAF, KRAS, NRAS, RIT1, and LZTR1 genes.2,9-11 The typical ear shape and placement in Noonan syndrome is oval with an overfolded helix that is low set and posteriorly angulated, which is uncommon in CFC syndrome. Noonan syndrome is characterized by an inverted triangular face; hypertelorism; blue or blue-green iris color; webbed neck; limited skin involvement, mainly represented by multiple nevi; and a much milder developmental delay compared to CFC and Costello syndromes.1,11
Costello syndrome (OMIM #218040) is a rare condition comprised of severe postnatal feeding difficulties, mental retardation, coarse facial features, cardiovascular abnormalities (eg, pulmonic stenosis, hypertrophic cardiomyopathy, atrial tachycardia), tumor predisposition, and skin and musculoskeletal abnormalities.12 Costello syndrome is clinically diagnosed. This syndrome shows coarse facies with macrocephaly, downward-slanting palpebral fissures, epicanthal folds, bulbous nose with anteversed nostrils and low nasal bridge, full cheeks, large mouth, thick lips, large tongue, nasal papillomas, cutis laxa, low-set ears, short neck, diffuse skin hyperpigmentation, ulnar deviation of the hands, and nail dystrophy that are not observed in CFC. It is now accepted that the term Costello syndrome should be reserved for patients with HRAS mutation because of the specific risk profile of these patients.12 Remarkably, patients with Costello syndrome are at increased tumor risk (eg, rhabdomyosarcoma, neuroblastoma, bladder carcinoma).2,12
The diagnosis of CFC syndrome is purely clinical. There have been many attempts to delineate the syndrome, but none of the described traits are pathognomonic. In 2002, Kavamura et al7 created the CFC index, a useful diagnostic approach based on 82 clinical characteristics and their frequencies in the CFC population.
Skin abnormalities are helpful manifestations to differentiate CFC syndrome from Noonan and Costello syndromes. Patients with CFC syndrome present with follicular hyperkeratosis and absent eyebrows. Absent eyebrows, narrowed temples, and Cupid’s bow lip are hallmark features of CFC syndrome and are absent in Noonan and Costello syndromes. The presentation of palmoplantar hyperkeratosis also is a differentiating feature; in patients with Costello syndrome, it is found outside the pressure zones, whereas in those with CFC syndrome, it is present mainly in the pressure zones.1 Dermatologists can assist geneticists in the differential diagnosis of these syndromes.
The treatment of disorders with follicular plugging and xerosis is challenging. Emollients with urea, glycolic acid, and lactic acid could improve the appearance of the skin. Treatment with mutated MEK gene inhibitors is under investigation to restore normal development of affected embryos with CFC.2,13 This case and theoretical data show that skin manifestations can be helpful to differentiate CFC syndrome from other RASopathies such as Noonan and Costello syndromes.
- Roberts A, Allanson J, Jadico SK, et al. The cardiofaciocutaneous syndrome. J Med Genet. 2006;43:833-842.
- Tidyman WE, Rauen KA. The RASopathies: developmental syndromes of Ras/MAPK pathway dysregulation. Curr Opin Genet Dev. 2009;19:230-236.
- Stevenson D, Viskochil D, Mao R, et al. Legius syndrome. In: Pagon RA, Bird TD, Dolan CR, et al, eds. GeneReviews. Seattle, WA: University of Washington, Seattle; 1993. http://www.ncbi.nlm.nih.gov/books/NBK47312.
- Reynolds JF, Neri G, Herrmann JP, et al. New multiple congenital anomalies/mental retardation syndrome with cardio-facio-cutaneous involvement—the CFC syndrome. Am J Med Genet. 1986;25:413-427.
- Zenker M, Lehmann K, Schulz AL, et al. Expansion of the genotypic and phenotypic spectrum in patients with KRAS germline mutations. J Med Genet. 2007;44:131-135.
- Rodriguez-Viciana P, Tetsu O, Tidyman WE, et al. Germline mutations in genes within the MAPK pathway cause cardio-facio-cutaneous syndrome. Science. 2006;311:1287-1290.
- Kavamura MI, Peres CA, Alchorne MM, et al. CFC index for the diagnosis of cardiofaciocutaneous syndrome. Am J Med Genet. 2002;112:12-16.
- Siegel DH, McKenzie J, Frieden IJ, et al. Dermatological findings in 61 mutation-positive individuals with cardiofaciocutaneous syndrome. Br J Dermatol. 2011;164:521-529.
- Tartaglia M, Zampino G, Gelb BD. Noonan syndrome: clinical aspects and molecular pathogenesis. Mol Syndromol. 2010;1:2-26.
- Lo FS, Lin JL, Kuo MT, et al. Noonan syndrome caused by germline KRAS mutation in Taiwan: report of two patients and a review of the literature. Eur J Pediatr. 2009;168:919-923.
- Allanson JE, Roberts AE. Noonan syndrome. In: Pagon RA, Bird TD, Dolan CR, et al, eds. GeneReviews. Seattle, WA: University of Washington, Seattle; 1993. http://www.ncbi.nlm.nih.gov/books/NBK1124/.
- Gripp KW, Lin AE. Costello syndrome. In: Pagon RA, Bird TD, Dolan CR, et al, eds. GeneReviews. Seattle, WA: University of Washington, Seattle; 1993. http://www.ncbi.nlm.nih.gov/books/NBK1507/.
- Inoue S, Moriya M, Watanabe Y, et al. New BRAF knockin mice provide a pathogenetic mechanism of developmental defects and a therapeutic approach in cardio-facio-cutaneous syndrome. Hum Mol Genet. 2014;23:6553-6566.
To the Editor:
RASopathies, a class of developmental disorders, are caused by mutations in genes that encode protein components of the RAS/mitogen-activated protein kinase (MAPK) pathway. Each syndrome exhibits its phenotypic features; however, because all of them cause dysregulation of the RAS/MAPK pathway, there are numerous overlapping phenotypic features between the syndromes including cardiac defects, cutaneous abnormalities, characteristic facial features, neurocognitive impairment, and increased risk for developing some neoplastic disorders.
Cardiofaciocutaneous (CFC) syndrome is a RASopathy and is a genetic sporadic disease characterized by multiple congenital anomalies associated with mental retardation. It has a complex dermatological phenotype with many cutaneous features that can be helpful to differentiate CFC syndrome from Noonan and Costello syndromes, which also are classified as RASopathies.
A 3-year-old girl presented with skin xerosis and follicular hyperkeratosis of the face, neck, trunk, and limbs (Figure 1). Facial follicular hyperkeratotic papules on an erythematous base were associated with alopecia of the eyebrows (ulerythema ophryogenes). Hair was sparse and curly (Figure 2A). Facial dysmorphic features included a prominent forehead with bitemporal constriction, bilateral ptosis, a broad nasal base, lip contour in a Cupid’s bow, low-set earlobes with creases (Figure 2B), and a short and webbed neck.
Congenital heart disease, hypothyroidism, bilateral hydronephrosis, delayed motor development, and seizures were noted for the first 2 years. Brain computed tomography detected a dilated ventricular system with hydrocephalus. There was no family history of consanguinity.
Pregnancy was complicated by polyhydramnios and preeclampsia. The neonate was delivered at full-term and was readmitted at 6 days of age due to respiratory failure secondary to congenital chylothorax. Cardiac malformation was diagnosed as the ostium secundum atrial septal defect and interventricular and atrioventricular septal defects. Up to this point she was being treated for Turner syndrome.
The RASopathies are a class of human genetic syndromes that are caused by germ line mutations in genes that encode components of the RAS/MAPK pathway.1 There are many syndromes classified as RASopathies (Table).2,3
Cardiofaciocutaneous syndrome (Online Mendelian Inheritance in Man [OMIM] 115150) is a genetic disorder first described by Reynolds et al4 and is characterized by several cutaneous abnormalities, cardiac defects, dysmorphic craniofacial features, gastrointestinal dysmotility, and mental retardation. It occurs sporadically and is caused by functional activation of mutations in 4 different genes—BRAF, KRAS, MAP2K1, MAP2K2—of the RAS extracellular signal–regulated kinase molecular cascade that regulates cell differentiation, proliferation, and apoptosis.1
As a RASopathy, CFC syndrome is a member of a family of syndromes with similar phenotypes, which includes mainly Noonan and Costello syndromes. Psychomotor retardation and physical anomalies, the common denominator of all syndromes, may be explained by the effects of the mutations during early development.5,6
In CFC, relative macrocephaly, prominent forehead, bitemporal constriction, absence of eyebrows, palpebral ptosis, broad nasal root, bulbous nasal tip, and small chin commonly are found. The eyes are widely spaced and the palpebral fissures are downward slanting with epicanthic folds.1,4,7
Follicular keratosis of the arms, legs, and face occurs in 80% of cases of CFC and ulerythema ophryogenes with sparse eyebrows in 90% of cases. Sparse, curly, and slow-growing hair is found in 93% of patients. Xerotic scaly skin, hyperkeratosis of the palms and soles, infantile hemangiomas, and multiple melanocytic nevi also may occur.8
Cardiac abnormalities are seen in 75.7% of patients.1 Other features include mental retardation, delayed motor development, and structural abnormalities in the central nervous system, as well as seizures and electroencephalogram abnormalities. Unlike Noonan and Costello syndromes, it is unclear if patients with CFC syndrome are at an increased risk for cancer.1
Noonan syndrome (OMIM #163950) is a disorder characterized by congenital heart defects, short stature, skeletal abnormalities, distinctive facial dysmorphic features, and variable cognitive deficits. Other associated features include cryptorchidism, lymphatic dysplasia, bleeding tendency, and occasional hematologic malignancies during childhood. This syndrome is related to mutations in the PTPN11, SOS1, SOS2, RAF1, BRAF, KRAS, NRAS, RIT1, and LZTR1 genes.2,9-11 The typical ear shape and placement in Noonan syndrome is oval with an overfolded helix that is low set and posteriorly angulated, which is uncommon in CFC syndrome. Noonan syndrome is characterized by an inverted triangular face; hypertelorism; blue or blue-green iris color; webbed neck; limited skin involvement, mainly represented by multiple nevi; and a much milder developmental delay compared to CFC and Costello syndromes.1,11
Costello syndrome (OMIM #218040) is a rare condition comprised of severe postnatal feeding difficulties, mental retardation, coarse facial features, cardiovascular abnormalities (eg, pulmonic stenosis, hypertrophic cardiomyopathy, atrial tachycardia), tumor predisposition, and skin and musculoskeletal abnormalities.12 Costello syndrome is clinically diagnosed. This syndrome shows coarse facies with macrocephaly, downward-slanting palpebral fissures, epicanthal folds, bulbous nose with anteversed nostrils and low nasal bridge, full cheeks, large mouth, thick lips, large tongue, nasal papillomas, cutis laxa, low-set ears, short neck, diffuse skin hyperpigmentation, ulnar deviation of the hands, and nail dystrophy that are not observed in CFC. It is now accepted that the term Costello syndrome should be reserved for patients with HRAS mutation because of the specific risk profile of these patients.12 Remarkably, patients with Costello syndrome are at increased tumor risk (eg, rhabdomyosarcoma, neuroblastoma, bladder carcinoma).2,12
The diagnosis of CFC syndrome is purely clinical. There have been many attempts to delineate the syndrome, but none of the described traits are pathognomonic. In 2002, Kavamura et al7 created the CFC index, a useful diagnostic approach based on 82 clinical characteristics and their frequencies in the CFC population.
Skin abnormalities are helpful manifestations to differentiate CFC syndrome from Noonan and Costello syndromes. Patients with CFC syndrome present with follicular hyperkeratosis and absent eyebrows. Absent eyebrows, narrowed temples, and Cupid’s bow lip are hallmark features of CFC syndrome and are absent in Noonan and Costello syndromes. The presentation of palmoplantar hyperkeratosis also is a differentiating feature; in patients with Costello syndrome, it is found outside the pressure zones, whereas in those with CFC syndrome, it is present mainly in the pressure zones.1 Dermatologists can assist geneticists in the differential diagnosis of these syndromes.
The treatment of disorders with follicular plugging and xerosis is challenging. Emollients with urea, glycolic acid, and lactic acid could improve the appearance of the skin. Treatment with mutated MEK gene inhibitors is under investigation to restore normal development of affected embryos with CFC.2,13 This case and theoretical data show that skin manifestations can be helpful to differentiate CFC syndrome from other RASopathies such as Noonan and Costello syndromes.
- Roberts A, Allanson J, Jadico SK, et al. The cardiofaciocutaneous syndrome. J Med Genet. 2006;43:833-842.
- Tidyman WE, Rauen KA. The RASopathies: developmental syndromes of Ras/MAPK pathway dysregulation. Curr Opin Genet Dev. 2009;19:230-236.
- Stevenson D, Viskochil D, Mao R, et al. Legius syndrome. In: Pagon RA, Bird TD, Dolan CR, et al, eds. GeneReviews. Seattle, WA: University of Washington, Seattle; 1993. http://www.ncbi.nlm.nih.gov/books/NBK47312.
- Reynolds JF, Neri G, Herrmann JP, et al. New multiple congenital anomalies/mental retardation syndrome with cardio-facio-cutaneous involvement—the CFC syndrome. Am J Med Genet. 1986;25:413-427.
- Zenker M, Lehmann K, Schulz AL, et al. Expansion of the genotypic and phenotypic spectrum in patients with KRAS germline mutations. J Med Genet. 2007;44:131-135.
- Rodriguez-Viciana P, Tetsu O, Tidyman WE, et al. Germline mutations in genes within the MAPK pathway cause cardio-facio-cutaneous syndrome. Science. 2006;311:1287-1290.
- Kavamura MI, Peres CA, Alchorne MM, et al. CFC index for the diagnosis of cardiofaciocutaneous syndrome. Am J Med Genet. 2002;112:12-16.
- Siegel DH, McKenzie J, Frieden IJ, et al. Dermatological findings in 61 mutation-positive individuals with cardiofaciocutaneous syndrome. Br J Dermatol. 2011;164:521-529.
- Tartaglia M, Zampino G, Gelb BD. Noonan syndrome: clinical aspects and molecular pathogenesis. Mol Syndromol. 2010;1:2-26.
- Lo FS, Lin JL, Kuo MT, et al. Noonan syndrome caused by germline KRAS mutation in Taiwan: report of two patients and a review of the literature. Eur J Pediatr. 2009;168:919-923.
- Allanson JE, Roberts AE. Noonan syndrome. In: Pagon RA, Bird TD, Dolan CR, et al, eds. GeneReviews. Seattle, WA: University of Washington, Seattle; 1993. http://www.ncbi.nlm.nih.gov/books/NBK1124/.
- Gripp KW, Lin AE. Costello syndrome. In: Pagon RA, Bird TD, Dolan CR, et al, eds. GeneReviews. Seattle, WA: University of Washington, Seattle; 1993. http://www.ncbi.nlm.nih.gov/books/NBK1507/.
- Inoue S, Moriya M, Watanabe Y, et al. New BRAF knockin mice provide a pathogenetic mechanism of developmental defects and a therapeutic approach in cardio-facio-cutaneous syndrome. Hum Mol Genet. 2014;23:6553-6566.
Practice Points
- RASopathies, a class of developmental disorders, are caused by mutations in genes that encode protein components of the RAS/mitogen-activated protein kinase pathway. Cardiofaciocutaneous (CFC) syndrome is a RASopathy.
- Skin manifestations may help in differentiating CFC syndrome from other RASopathies.
Bedside Cardiac Ultrasound to Aid in Diagnosing Takotsubo Cardiomyopathy
Cardiac ultrasound is among the many beneficial applications of point-of-care (POC) ultrasound in the ED. This modality can prove extremely beneficial in evaluating the critically ill patient. For example, POC cardiac ultrasound not only permits the emergency physician (EP) to diagnose a pericardial effusion and cardiac tamponade, but also perform a pericardiocentesis.1 The EP can also employ beside ultrasound to estimate an ejection fraction (EF) almost as well as cardiology services,2 look for signs of right-heart strain in patients with pulmonary embolism (PE),3 and guide fluid management in patients who have septic shock.4 In addition to only taking a few minutes to perform, POC cardiac ultrasound can also drastically change the course of management in some patients. Our case illustrates the use of POC ultrasound to diagnose Takotsubo cardiomyopathy in a 64-year-old patient and guide management when she became unstable prior to cardiac catheterization.
Case
A 64-year-old white woman with a medical history of diabetes, obesity, and nephrolithiasis presented to the ED with chest pain and shortness of breath, which she stated had begun earlier in the day. The patient’s chest pain did not intensify upon exertion, but the shortness of breath worsened when she was in the supine position.
Three months prior, the patient had also presented to our ED with chest pain. Evaluation during that visit included a negative stress echocardiogram with an EF of 55%. At this second visit, an electrocardiogram (ECG) showed new T-wave inversions in the anterior, lateral, and inferior leads. Vital signs at presentation were: blood pressure, 107/63 mm Hg; heart rate, 100 beats/min; respiratory rate, 18 breaths/min; and temperature, 97.9°F. Oxygen saturation was 97% on room air when patient was sitting upright, but decreased to 90% when she was supine. A chest X-ray showed left basilar atelectasis with a trace effusion. Laboratory evaluation was remarkable for the following: troponin I, 2.99 ng/mL; D-dimer, 294 ng/mL; and brain natriuretic peptide, 559 pg/mL.
Given the patient’s vital signs and positive troponin I level, a computed tomography (CT) scan was ordered to assess for a PE. This was done despite the patient’s negative D-dimer results, as it was felt that she was not low-risk for PE. At the same time the CT scan was ordered, a POC cardiac ultrasound was performed to assess for signs of right heart strain. 
Based on the ultrasound findings and a normal EF 3 months prior, there was concern for Takotsubo cardiomyopathy. The patient was further questioned as to the events surrounding the onset of her chest pain. She informed the EP the pain started when she learned that she might be evicted from her home.
The CT scan was negative for PE. The consulting cardiologist was informed of the results of the ultrasound findings, and the patient was given aspirin, heparin, morphine, and furosemide, and was admitted to the cardiac progressive unit. She was also initially given morphine for pain management, but due to intolerance, she was switched to nitroglycerin.
During the first evening of her inpatient stay, the patient experienced acute changes in her chest pain that resulted in activating the rapid response team. Secondary to the information gathered in the ED, the patient was managed conservatively and was evaluated by a physician extender who repeated laboratory studies, provided supplemental potassium and magnesium, and ordered another ECG in consultation with the cardiologist (who was caring for the patient via telephone). In the morning, the patient continued to have chest pain, and a repeat ECG showed worsening of previous T-wave inversions. Based on these findings, the cardiologist ordered cardiac catheterization.
On hospital day 2, the cardiologist performed another echocardiogram, which confirmed the low EF of 20% with severe global hypokinesis with sparing of the basal segments. Cardiac catheterization showed no significant disease (20% lesion in the mid-left anterior descending artery) with the left ventriculogram showing an EF of 10%, cardiac output of 3.7, and cardiac index of 1.8, confirming the diagnosis of Takotsubo cardiomyopathy. The patient remained in the hospital for a total of 8 days while awaiting a life vest; however, a repeat echocardiogram on hospital day 8 showed an EF of 55%.
Discussion
Takotsubo cardiomyopathy is an acute, stress-induced cardiomyopathy that was first described in Japan in the early 1990s.5 It is thought to be due to catecholamine-induced dysfunction from a stressful event,6-8 such as the death of a loved one, which is why it is often referred to as “broken heart syndrome.” However there are case reports highlighting other causes of Takotsubo cardiomyopathy, such as cocaine use,9 scuba diving,10 and diabetic ketoacidosis combined with hypothermia.11
Patients with Takotsubo cardiomyopathy will frequently have ECG abnormalities, including ST-segment elevation or depression, or T-wave changes; troponin levels also may be elevated. The majority of patients (>80%) are postmenopausal women, typically aged 50 to 75 years.6,12 Echocardiogram findings in Takotsubo cardiomyopathy show significant left ventricular (LV) dysfunction or regional dysfunction that is not in one coronary artery distribution.12,13 There will often be apical dilation or ballooning with dyskinesia but more preserved function at the base and normal dimensions.14,15 A negative cardiac catheterization or catheterization in the absence of significant disease is required to confirm the diagnosis.16 The LV function usually returns to baseline in 1 to 4 weeks, but there can be recurrence in some patients.6,17 The condition is also associated with a large burden of morbidity and mortality.6,18 In a case series by Gopalakrishnan et al6 of 56 patients, there was an 8.9% in-hospital mortality rate and an additional 17.9% out-of-hospital mortality rate even in patients in whom LV function had returned to normal.
In a review by Gianni et al,19 4.2% of patients with Takotsubo cardiomyopathy present with or go into cardiogenic shock at some point during admission, and up to 2% of patients who present with acute myocardial infarction have Takotsubo cardiomyopathy. Patients can go into cardiogenic shock due to depressed EF or LV outflow tract obstruction from hyperkinesis of the basilar segments. Some of these patients may be sent directly to the catheter laboratory based on ST elevations on ECG, in which case the diagnosis is made there. Our patient, however, did not have ST elevation and later became unstable on the floor. Citro et al20 suggest that a patient with a predisposition for Takotsubo cardiomyopathy (eg, postmenopausal patients, those who experienced a trigger event), in the right clinical setting and without ST-segment elevation on ECG, could be managed more conservatively with delayed cardiac angiography or CT angiography (CTA) evaluation of the coronary arteries (sparing the patient an invasive procedure)—as long as ultrasound was consistent with typical Takotsubo cardiomyopathy findings. However, CTA is still needed to make the diagnosis.
At this time, Takotsubo cardiomyopathy should remain an important part of the differential diagnosis for emergency patients who have chest pain—especially for postmenopausal women with a history of significant stressor—as early recognition can lead to better patient care.
Conclusion
This case highlights the importance of POC ultrasound in the management of patients in the ED and after admission. The care of our patient was enhanced by the ability to take a real-time look at her EF and cardiac function at the time of admission through bedside ultrasound. This information guided her management and optimized stabilization.
1. Goodman A, Perera P, Mailhot T, Mandavia D. The role of bedside ultrasound in the diagnosis of pericardial effusion and cardiac tamponade. J Emerg Trauma Shock. 2012;5(1):72-75. doi:10.4103/0974-2700.93118.
2. Unlüer EE, Karagöz A, Akoğlu H, Bayata S. Visual estimation of bedside echocardiographic ejection fraction by emergency physicians. West J Emerg Med. 2014;15(2):221-226. doi:10.5811/westjem.2013.9.16185.
3. McConnell MV, Solomon SD, Rayan ME, Come PC, Goldhaber SZ, Lee RT. Regional right ventricular dysfunction detected by echocardiography in acute pulmonary embolism. Am J Cardiol. 1996;78(4):469-473.
4. Coen D, Cortellaro F, Pasini S, et al. Towards a less invasive approach to the early goal-directed treatment of septic shock in the ED. Am J Emerg Med. 2014;32(6):563-568. doi:10.1016/j.ajem.2014.02.011.
5. Dote K, Sato H, Tateishi H, Uchida T, Ishihara M. [Myocardial stunning due to simultaneous multivessel coronary spasms: a review of 5 cases.] J Cardiol. 1991;21(2):203-214.
6. Gopalakrishnan M, Hassan A, Villines D, Nasr S, Chandrasekaran M, Klein LW. Predictors of short- and long-term outcomes of Takotsubo cardiomyopathy. Am J Cardiol. 2015;116(10):1586-1590. doi:10.1016/j.amjcard.2015.08.024.
7. Paur H, Wright PT, Sikkel MB, et al. High levels of circulating epinephrine trigger apical cardiodepression in a β2-adrenergic receptor/Gi-dependent manner: a new model of Takotsubo cardiomyopathy. Circulation. 2012;126(6):697-706. doi:10.1161/CIRCULATIONAHA.112.111591.
8. Wittstein IS, Thiemann DR, Lima JA, et al. Neurohumoral features of myocardial stunning due to sudden emotional stress. N Engl J Med. 2005;352(6):539-548. doi:10.1056/NEJMoa043046.
9. Butterfield M, Riguzzi C, Frenkel O, Nagdev A. Stimulant-related Takotsubo cardiomyopathy. Am J Emerg Med. 2015;33(3):476.e1-e3. doi:10.1016/j.ajem.2014.08.058.
10. Baber A, Nair SU, Duggal S, Bhatti S, Sundlof DW. Stress cardiomyopathy caused by diving: case report and review of the literature. J Emerg Med. 2016;50(2):277-280. doi:10.1016/j.jemermed.2015.09.045.
11. Katayama Y, Hifumi T, Inoue J, Koido Y. A case of Takotsubo cardiomyopathy induced by accidental hypothermia and diabetic ketoacidosis. BMJ Case Rep. 2013;2013:1-3. doi:10.1136/bcr-2012-008143.
12. Bybee KA, Kara T, Prasad A, et al. Systematic review: transient left ventricular apical ballooning: a syndrome that mimics ST-segment elevation myocardial infarction. Ann Intern Med. 2004;141(11):858-865.
13. Virani SS, Khan AN, Mendoza CE, Ferreira AC, de Marchena E. Takotsubo cardiomyopathy, or brokenheart syndrome. Tex Heart Inst J. 2007;34(1):76-79.
14. Okura H. Echocardiographic assessment of takotsubo cardiomyopathy: beyond apical ballooning. J Echocardiogr. 2016;14(1):13-20. doi:10.1007/s12574-015-0271-3.
15. Naser N, Buksa M, Kusljugic Z, Terzic I, Sokolovic S, Hodzic E. The role of echocardiography in diagnosis and follow up of patients with takotsubo cardiomyopathy or acute ballooning syndrome. Med Arh. 2011;65(5):287-290.
16. Ono R, Falcão LM. Takotsubo cardiomyopathy systematic review: Pathophysiologic process, clinical presentation and diagnostic approach to Takotsubo cardiomyopathy. Int J Cardiol. 2016;209:196-205. doi:10.1016/j.ijcard.2016.02.012.
17. Opolski G, Budnik M, Kochanowski J, Kowalik R, Piatkowski R, Kochman J. Four episodes of takotsubo cardiomyopathy in one patient. Int J Cardiol. 2016;203:53-54. doi:10.1016/j.ijcard.2015.10.048.
18. Templin C, Ghadri JR, Diekmann J, et al. Clinical features and outcomes of Takotsubo (stress) cardiomyopathy. N Engl J Med. 2015;373(10):929-938.
19. Gianni M, Dentali F, Grandi AM, Sumner G, Hiralal R, Lonn E. Apical ballooning syndrome or takotsubo cardiomyopathy: a systematic review. Eur Heart J. 2006;27(13):1523-1529. doi:10.1093/eurheartj/ehl032.
20. Citro R, Lyon AR, Meimoun P, et al. Standard and advanced echocardiography in Takotsubo (stress) cardiomyopathy: clinical and prognostic implications. J Am Soc Echocardiogr. 2015;28(1):57-74. doi:10.1016/j.echo.2014.08.020.
Cardiac ultrasound is among the many beneficial applications of point-of-care (POC) ultrasound in the ED. This modality can prove extremely beneficial in evaluating the critically ill patient. For example, POC cardiac ultrasound not only permits the emergency physician (EP) to diagnose a pericardial effusion and cardiac tamponade, but also perform a pericardiocentesis.1 The EP can also employ beside ultrasound to estimate an ejection fraction (EF) almost as well as cardiology services,2 look for signs of right-heart strain in patients with pulmonary embolism (PE),3 and guide fluid management in patients who have septic shock.4 In addition to only taking a few minutes to perform, POC cardiac ultrasound can also drastically change the course of management in some patients. Our case illustrates the use of POC ultrasound to diagnose Takotsubo cardiomyopathy in a 64-year-old patient and guide management when she became unstable prior to cardiac catheterization.
Case
A 64-year-old white woman with a medical history of diabetes, obesity, and nephrolithiasis presented to the ED with chest pain and shortness of breath, which she stated had begun earlier in the day. The patient’s chest pain did not intensify upon exertion, but the shortness of breath worsened when she was in the supine position.
Three months prior, the patient had also presented to our ED with chest pain. Evaluation during that visit included a negative stress echocardiogram with an EF of 55%. At this second visit, an electrocardiogram (ECG) showed new T-wave inversions in the anterior, lateral, and inferior leads. Vital signs at presentation were: blood pressure, 107/63 mm Hg; heart rate, 100 beats/min; respiratory rate, 18 breaths/min; and temperature, 97.9°F. Oxygen saturation was 97% on room air when patient was sitting upright, but decreased to 90% when she was supine. A chest X-ray showed left basilar atelectasis with a trace effusion. Laboratory evaluation was remarkable for the following: troponin I, 2.99 ng/mL; D-dimer, 294 ng/mL; and brain natriuretic peptide, 559 pg/mL.
Given the patient’s vital signs and positive troponin I level, a computed tomography (CT) scan was ordered to assess for a PE. This was done despite the patient’s negative D-dimer results, as it was felt that she was not low-risk for PE. At the same time the CT scan was ordered, a POC cardiac ultrasound was performed to assess for signs of right heart strain.
Based on the ultrasound findings and a normal EF 3 months prior, there was concern for Takotsubo cardiomyopathy. The patient was further questioned as to the events surrounding the onset of her chest pain. She informed the EP the pain started when she learned that she might be evicted from her home.
The CT scan was negative for PE. The consulting cardiologist was informed of the results of the ultrasound findings, and the patient was given aspirin, heparin, morphine, and furosemide, and was admitted to the cardiac progressive unit. She was also initially given morphine for pain management, but due to intolerance, she was switched to nitroglycerin.
During the first evening of her inpatient stay, the patient experienced acute changes in her chest pain that resulted in activating the rapid response team. Secondary to the information gathered in the ED, the patient was managed conservatively and was evaluated by a physician extender who repeated laboratory studies, provided supplemental potassium and magnesium, and ordered another ECG in consultation with the cardiologist (who was caring for the patient via telephone). In the morning, the patient continued to have chest pain, and a repeat ECG showed worsening of previous T-wave inversions. Based on these findings, the cardiologist ordered cardiac catheterization.
On hospital day 2, the cardiologist performed another echocardiogram, which confirmed the low EF of 20% with severe global hypokinesis with sparing of the basal segments. Cardiac catheterization showed no significant disease (20% lesion in the mid-left anterior descending artery) with the left ventriculogram showing an EF of 10%, cardiac output of 3.7, and cardiac index of 1.8, confirming the diagnosis of Takotsubo cardiomyopathy. The patient remained in the hospital for a total of 8 days while awaiting a life vest; however, a repeat echocardiogram on hospital day 8 showed an EF of 55%.
Discussion
Takotsubo cardiomyopathy is an acute, stress-induced cardiomyopathy that was first described in Japan in the early 1990s.5 It is thought to be due to catecholamine-induced dysfunction from a stressful event,6-8 such as the death of a loved one, which is why it is often referred to as “broken heart syndrome.” However there are case reports highlighting other causes of Takotsubo cardiomyopathy, such as cocaine use,9 scuba diving,10 and diabetic ketoacidosis combined with hypothermia.11
Patients with Takotsubo cardiomyopathy will frequently have ECG abnormalities, including ST-segment elevation or depression, or T-wave changes; troponin levels also may be elevated. The majority of patients (>80%) are postmenopausal women, typically aged 50 to 75 years.6,12 Echocardiogram findings in Takotsubo cardiomyopathy show significant left ventricular (LV) dysfunction or regional dysfunction that is not in one coronary artery distribution.12,13 There will often be apical dilation or ballooning with dyskinesia but more preserved function at the base and normal dimensions.14,15 A negative cardiac catheterization or catheterization in the absence of significant disease is required to confirm the diagnosis.16 The LV function usually returns to baseline in 1 to 4 weeks, but there can be recurrence in some patients.6,17 The condition is also associated with a large burden of morbidity and mortality.6,18 In a case series by Gopalakrishnan et al6 of 56 patients, there was an 8.9% in-hospital mortality rate and an additional 17.9% out-of-hospital mortality rate even in patients in whom LV function had returned to normal.
In a review by Gianni et al,19 4.2% of patients with Takotsubo cardiomyopathy present with or go into cardiogenic shock at some point during admission, and up to 2% of patients who present with acute myocardial infarction have Takotsubo cardiomyopathy. Patients can go into cardiogenic shock due to depressed EF or LV outflow tract obstruction from hyperkinesis of the basilar segments. Some of these patients may be sent directly to the catheter laboratory based on ST elevations on ECG, in which case the diagnosis is made there. Our patient, however, did not have ST elevation and later became unstable on the floor. Citro et al20 suggest that a patient with a predisposition for Takotsubo cardiomyopathy (eg, postmenopausal patients, those who experienced a trigger event), in the right clinical setting and without ST-segment elevation on ECG, could be managed more conservatively with delayed cardiac angiography or CT angiography (CTA) evaluation of the coronary arteries (sparing the patient an invasive procedure)—as long as ultrasound was consistent with typical Takotsubo cardiomyopathy findings. However, CTA is still needed to make the diagnosis.
At this time, Takotsubo cardiomyopathy should remain an important part of the differential diagnosis for emergency patients who have chest pain—especially for postmenopausal women with a history of significant stressor—as early recognition can lead to better patient care.
Conclusion
This case highlights the importance of POC ultrasound in the management of patients in the ED and after admission. The care of our patient was enhanced by the ability to take a real-time look at her EF and cardiac function at the time of admission through bedside ultrasound. This information guided her management and optimized stabilization.
1. Goodman A, Perera P, Mailhot T, Mandavia D. The role of bedside ultrasound in the diagnosis of pericardial effusion and cardiac tamponade. J Emerg Trauma Shock. 2012;5(1):72-75. doi:10.4103/0974-2700.93118.
2. Unlüer EE, Karagöz A, Akoğlu H, Bayata S. Visual estimation of bedside echocardiographic ejection fraction by emergency physicians. West J Emerg Med. 2014;15(2):221-226. doi:10.5811/westjem.2013.9.16185.
3. McConnell MV, Solomon SD, Rayan ME, Come PC, Goldhaber SZ, Lee RT. Regional right ventricular dysfunction detected by echocardiography in acute pulmonary embolism. Am J Cardiol. 1996;78(4):469-473.
4. Coen D, Cortellaro F, Pasini S, et al. Towards a less invasive approach to the early goal-directed treatment of septic shock in the ED. Am J Emerg Med. 2014;32(6):563-568. doi:10.1016/j.ajem.2014.02.011.
5. Dote K, Sato H, Tateishi H, Uchida T, Ishihara M. [Myocardial stunning due to simultaneous multivessel coronary spasms: a review of 5 cases.] J Cardiol. 1991;21(2):203-214.
6. Gopalakrishnan M, Hassan A, Villines D, Nasr S, Chandrasekaran M, Klein LW. Predictors of short- and long-term outcomes of Takotsubo cardiomyopathy. Am J Cardiol. 2015;116(10):1586-1590. doi:10.1016/j.amjcard.2015.08.024.
7. Paur H, Wright PT, Sikkel MB, et al. High levels of circulating epinephrine trigger apical cardiodepression in a β2-adrenergic receptor/Gi-dependent manner: a new model of Takotsubo cardiomyopathy. Circulation. 2012;126(6):697-706. doi:10.1161/CIRCULATIONAHA.112.111591.
8. Wittstein IS, Thiemann DR, Lima JA, et al. Neurohumoral features of myocardial stunning due to sudden emotional stress. N Engl J Med. 2005;352(6):539-548. doi:10.1056/NEJMoa043046.
9. Butterfield M, Riguzzi C, Frenkel O, Nagdev A. Stimulant-related Takotsubo cardiomyopathy. Am J Emerg Med. 2015;33(3):476.e1-e3. doi:10.1016/j.ajem.2014.08.058.
10. Baber A, Nair SU, Duggal S, Bhatti S, Sundlof DW. Stress cardiomyopathy caused by diving: case report and review of the literature. J Emerg Med. 2016;50(2):277-280. doi:10.1016/j.jemermed.2015.09.045.
11. Katayama Y, Hifumi T, Inoue J, Koido Y. A case of Takotsubo cardiomyopathy induced by accidental hypothermia and diabetic ketoacidosis. BMJ Case Rep. 2013;2013:1-3. doi:10.1136/bcr-2012-008143.
12. Bybee KA, Kara T, Prasad A, et al. Systematic review: transient left ventricular apical ballooning: a syndrome that mimics ST-segment elevation myocardial infarction. Ann Intern Med. 2004;141(11):858-865.
13. Virani SS, Khan AN, Mendoza CE, Ferreira AC, de Marchena E. Takotsubo cardiomyopathy, or brokenheart syndrome. Tex Heart Inst J. 2007;34(1):76-79.
14. Okura H. Echocardiographic assessment of takotsubo cardiomyopathy: beyond apical ballooning. J Echocardiogr. 2016;14(1):13-20. doi:10.1007/s12574-015-0271-3.
15. Naser N, Buksa M, Kusljugic Z, Terzic I, Sokolovic S, Hodzic E. The role of echocardiography in diagnosis and follow up of patients with takotsubo cardiomyopathy or acute ballooning syndrome. Med Arh. 2011;65(5):287-290.
16. Ono R, Falcão LM. Takotsubo cardiomyopathy systematic review: Pathophysiologic process, clinical presentation and diagnostic approach to Takotsubo cardiomyopathy. Int J Cardiol. 2016;209:196-205. doi:10.1016/j.ijcard.2016.02.012.
17. Opolski G, Budnik M, Kochanowski J, Kowalik R, Piatkowski R, Kochman J. Four episodes of takotsubo cardiomyopathy in one patient. Int J Cardiol. 2016;203:53-54. doi:10.1016/j.ijcard.2015.10.048.
18. Templin C, Ghadri JR, Diekmann J, et al. Clinical features and outcomes of Takotsubo (stress) cardiomyopathy. N Engl J Med. 2015;373(10):929-938.
19. Gianni M, Dentali F, Grandi AM, Sumner G, Hiralal R, Lonn E. Apical ballooning syndrome or takotsubo cardiomyopathy: a systematic review. Eur Heart J. 2006;27(13):1523-1529. doi:10.1093/eurheartj/ehl032.
20. Citro R, Lyon AR, Meimoun P, et al. Standard and advanced echocardiography in Takotsubo (stress) cardiomyopathy: clinical and prognostic implications. J Am Soc Echocardiogr. 2015;28(1):57-74. doi:10.1016/j.echo.2014.08.020.

Case Studies in Toxicology: The Perils of Playing Catch-up
Case
A 16-year-old girl, who recently emigrated from Haiti, was brought to the pediatric ED by her mother for evaluation of a 2-hour history of gastric discomfort. Upon arrival at the ED waiting area, the patient experienced a sudden onset of generalized tonic-clonic movement with altered sensorium, though she did not fall to the ground and was not injured. Vital signs from triage were: blood pressure, 110/76 mm Hg; heart rate, 112 beats/min; respiratory rate, 22 breaths/min; and temperature, 97°F. Oxygen saturation was 98% on room air.
The patient was immediately attached to a cardiac monitor, given oxygen via a face mask, and received airway suctioning. Despite receiving a total of 4 mg of lorazepam, the seizure continued. Physical examination revealed no signs of external injury, but the ongoing generalized status epilepticus made the examination difficult.
What are the causes of refractory seizures in an adolescent patient?
The differential diagnosis for pediatric patients presenting with refractory seizure is the same as that for adult patients and should include treatment noncompliance, infection, vascular event (eg, stroke, hemorrhage), trauma (eg, cerebral contusions), metabolic and electrolyte disturbances, anticonvulsant toxicity, and exposure to a convulsant toxin.
While certain drugs (eg, cocaine) may cause status epilepticus through a secondary effect such as ischemia or a bleed, some drugs can directly cause refractory seizures. A few drugs and toxins are responsible for the majority of such seizures: bupropion; carbon monoxide; diphenhydramine; ethanol (withdrawal); hypoglycemics; lead; theophylline; tramadol; and certain antibiotics, including cephalosporins, penicillins, quinolones, and, in particular, isoniazid (INH).1
Case Continuation
Upon further history-taking, the patient’s mother informed the ED staff that during a recent visit to a local clinic, her daughter tested positive on routine screening for tuberculosis and was given “some medications.” The patient’s mother further noted that her daughter was scheduled for a follow-up appointment at the same clinic later this morning. She believed the patient had taken “a few” of the prescribed pills at once to “catch-up” on missed doses prior to that appointment, and provided the ED staff with an empty bottle of INH that she had found in her daughter’s purse.
What are the signs and symptoms of acute isoniazid toxicity?
Isoniazid toxicity should be suspected in any patient who has access to INH—even if the drug was prescribed for someone other than the patient. Acute toxicity develops rapidly after the ingestion of supratherapeutic doses of INH and includes nausea, abdominal discomfort, vomiting, dizziness, and excessive fatigue or lethargy. Patients can present with tachycardia, stupor, agitation, mydriasis, increased anion gap metabolic acidosis, and encephalopathy.
Seizures occur due to an INH-induced functional pyridoxine deficiency. Isoniazid inhibits pyridoxine phosphokinase, the enzyme that converts pyridoxine (vitamin B6) to its physiologically active form, pyridoxal 5’-phosphate (PLP). Because the conversion of glutamate (an excitatory neurotransmitter) to gamma-aminobutyric acid (GABA; the body’s main inhibitory neurotransmitter) is dependent on PLP, an excess of glutamate and a deficiency of GABA occurs following INH overdose. The result is neuroexcitation, which manifests as generalized seizures in affected patients.
The most consequential effect of INH overdose, however, is the development of seizure refractory to conventional therapy, such as benzodiazepines. This occurs because benzodiazepines are indirect-acting GABA agonists, and require the presence of GABA to elicit their effect. Therefore, due to the impairment of GABA synthesis, benzodiazepines are limited or ineffective as anticonvulsants. Although INH doses in excess of 20 mg/kg may result in neuroexcitation, refractory seizures are uncommon with doses <70 mg/kg.
Complications of chronic INH use include hepatotoxicity, and patients will present with jaundice, hepatomegaly, and right upper quadrant pain and tenderness. Isoniazid must be discontinued rapidly in
How is acute isoniazid-induced seizure managed?
Management of patients with refractory seizure should initially include an assessment and management of the patient’s airway, breathing, and circulation. Although seizures induced by INH toxicity are often resistant to benzodiazepines, these agents remain the first-line therapy. For patients who fail to respond to a reasonable trial of benzodiazepines (eg, lorazepam 6 mg intravenously [IV]), pyridoxine should be administered.3 The recommended dose is 1 g pyridoxine per every 1 g of INH ingested—if the initial dose ingested is known—with a maximum dose of 5 g pyridoxine. If the initial dose of INH is not known, 70 mg/kg of pyridoxine, up to 5 g, is recommended. Repeated doses of pyridoxine can be administered if the seizure continues, up to a total dose of 10 g in an adult. At extremely high doses, pyridoxine itself can be neurotoxic, limiting the maximal antidotal dose.
Rapid initiation of pyridoxine is a challenge since typical stocks in most EDs are not in an adequate supply required for treatment. Additionally, a typical vial of pyridoxine contains 100 mg, highlighting the rare need to open dozens of vials for a single patient. Drawing up adequate doses of the IV formulation can be a challenge and time-consuming.
Regardless, the most reliable and rapid route of administration for pyridoxine is IV, at a rate of 0.5 to 1 g/min. Even if the seizure resolves prior to completion of the initial dose, the remaining doses should still be administered over a 4- to 6-hour period. Oral or (more likely) nasogastric administration of pyridoxine can be administered if the IV formulation is not available, but neither are optimal routes of delivery. Every effort should be made to stock pyridoxine in the antidote supply in the ED to avoid time delays involving finding, preparing, and administering the drug in these scenarios. Previous studies have found that most EDs are not prepared to handle pyridoxine replacement.4,5
Since benzodiazepines and barbiturates are GABA agonists with complementary mechanisms of actions to pyridoxine, they should be administered to potentiate the antiseizure effect of pyridoxine. If the seizure does not terminate, the use of propofol or general anesthesia may be required. Once the seizure is terminated, oral activated charcoal can be administered if the ingestion occurred within several hours of presentation. Given the rapid onset of effect of a large dose of INH, most patients will develop seizure shortly after exposure, limiting the benefits of both aggressive gastrointestinal decontamination and delayed activated charcoal. Charcoal also can be used for patients who overdose on INH but do not develop seizures.
Although the utility of a head computed tomography (CT) scan or laboratory studies is limited given the context of the exposure, these are generally obtained for patients with new-onset seizure. Since many patients with INH toxicity do not seize, such a patient may have a lower seizure threshold due to the existence of a subclinical cerebral lesion or metabolic abnormality.
Case Conclusion
The patient’s INH-induced refractory seizure was treated with pyridoxine. Her history suggested that she had ingested an unknown number of INH tablets within an hour. On this initial basis, an IV dose of 5,000 mg of pyridoxine was administered. The patient’s seizures terminated within 2 minutes of the infusion, and no additional doses of pyridoxine were required. Given the lack of concern for self-harm, an acetaminophen concentration was not obtained. A urine toxicology screen was negative for cocaine and amphetamines, and a CT scan of the head was negative for any abnormality. The patient was admitted to the pediatric intensive care unit for status epileptics and was discharged home on hospital day 2 after an uneventful stay.
1. Cock HR. Drug-induced status epilepticus. Epilepsy Behav. 2015;49:76-82. doi:10.1016/j.yebeh.2015.04.034.
2. Latent tuberculosis infection: a guide for primary health care providers. Centers for Disease Control and Prevention Web site. http://www.cdc.gov/tb/publications/LTBI/treatment.htm. Updated August 5, 2016. Accessed December 13, 2016.
3. Howland MA. Antidotes in depth: pyridoxine. In: Hoffman RS, Howland MA, Lewin NA, Nelson LS, Goldfrank LR, eds. Goldfrank’s Toxicologic Emergencies. 10th ed. New York, NY: McGraw-Hill; 2015:797-799.
4. Shah BR, Santucci K, Sinert R, Steiner P. Acute isoniazid neurotoxicity in an urban hospital. Pediatrics. 1995;95(5):700-704.
5. Santucci KA, Shah BR, Linakis JG. Acute isoniazid exposures and antidote availability. Pediatr Emerg Care. 1999;15(2):99-101.
Case
A 16-year-old girl, who recently emigrated from Haiti, was brought to the pediatric ED by her mother for evaluation of a 2-hour history of gastric discomfort. Upon arrival at the ED waiting area, the patient experienced a sudden onset of generalized tonic-clonic movement with altered sensorium, though she did not fall to the ground and was not injured. Vital signs from triage were: blood pressure, 110/76 mm Hg; heart rate, 112 beats/min; respiratory rate, 22 breaths/min; and temperature, 97°F. Oxygen saturation was 98% on room air.
The patient was immediately attached to a cardiac monitor, given oxygen via a face mask, and received airway suctioning. Despite receiving a total of 4 mg of lorazepam, the seizure continued. Physical examination revealed no signs of external injury, but the ongoing generalized status epilepticus made the examination difficult.
What are the causes of refractory seizures in an adolescent patient?
The differential diagnosis for pediatric patients presenting with refractory seizure is the same as that for adult patients and should include treatment noncompliance, infection, vascular event (eg, stroke, hemorrhage), trauma (eg, cerebral contusions), metabolic and electrolyte disturbances, anticonvulsant toxicity, and exposure to a convulsant toxin.
While certain drugs (eg, cocaine) may cause status epilepticus through a secondary effect such as ischemia or a bleed, some drugs can directly cause refractory seizures. A few drugs and toxins are responsible for the majority of such seizures: bupropion; carbon monoxide; diphenhydramine; ethanol (withdrawal); hypoglycemics; lead; theophylline; tramadol; and certain antibiotics, including cephalosporins, penicillins, quinolones, and, in particular, isoniazid (INH).1
Case Continuation
Upon further history-taking, the patient’s mother informed the ED staff that during a recent visit to a local clinic, her daughter tested positive on routine screening for tuberculosis and was given “some medications.” The patient’s mother further noted that her daughter was scheduled for a follow-up appointment at the same clinic later this morning. She believed the patient had taken “a few” of the prescribed pills at once to “catch-up” on missed doses prior to that appointment, and provided the ED staff with an empty bottle of INH that she had found in her daughter’s purse.
What are the signs and symptoms of acute isoniazid toxicity?
Isoniazid toxicity should be suspected in any patient who has access to INH—even if the drug was prescribed for someone other than the patient. Acute toxicity develops rapidly after the ingestion of supratherapeutic doses of INH and includes nausea, abdominal discomfort, vomiting, dizziness, and excessive fatigue or lethargy. Patients can present with tachycardia, stupor, agitation, mydriasis, increased anion gap metabolic acidosis, and encephalopathy.
Seizures occur due to an INH-induced functional pyridoxine deficiency. Isoniazid inhibits pyridoxine phosphokinase, the enzyme that converts pyridoxine (vitamin B6) to its physiologically active form, pyridoxal 5’-phosphate (PLP). Because the conversion of glutamate (an excitatory neurotransmitter) to gamma-aminobutyric acid (GABA; the body’s main inhibitory neurotransmitter) is dependent on PLP, an excess of glutamate and a deficiency of GABA occurs following INH overdose. The result is neuroexcitation, which manifests as generalized seizures in affected patients.
The most consequential effect of INH overdose, however, is the development of seizure refractory to conventional therapy, such as benzodiazepines. This occurs because benzodiazepines are indirect-acting GABA agonists, and require the presence of GABA to elicit their effect. Therefore, due to the impairment of GABA synthesis, benzodiazepines are limited or ineffective as anticonvulsants. Although INH doses in excess of 20 mg/kg may result in neuroexcitation, refractory seizures are uncommon with doses <70 mg/kg.
Complications of chronic INH use include hepatotoxicity, and patients will present with jaundice, hepatomegaly, and right upper quadrant pain and tenderness. Isoniazid must be discontinued rapidly in
How is acute isoniazid-induced seizure managed?
Management of patients with refractory seizure should initially include an assessment and management of the patient’s airway, breathing, and circulation. Although seizures induced by INH toxicity are often resistant to benzodiazepines, these agents remain the first-line therapy. For patients who fail to respond to a reasonable trial of benzodiazepines (eg, lorazepam 6 mg intravenously [IV]), pyridoxine should be administered.3 The recommended dose is 1 g pyridoxine per every 1 g of INH ingested—if the initial dose ingested is known—with a maximum dose of 5 g pyridoxine. If the initial dose of INH is not known, 70 mg/kg of pyridoxine, up to 5 g, is recommended. Repeated doses of pyridoxine can be administered if the seizure continues, up to a total dose of 10 g in an adult. At extremely high doses, pyridoxine itself can be neurotoxic, limiting the maximal antidotal dose.
Rapid initiation of pyridoxine is a challenge since typical stocks in most EDs are not in an adequate supply required for treatment. Additionally, a typical vial of pyridoxine contains 100 mg, highlighting the rare need to open dozens of vials for a single patient. Drawing up adequate doses of the IV formulation can be a challenge and time-consuming.
Regardless, the most reliable and rapid route of administration for pyridoxine is IV, at a rate of 0.5 to 1 g/min. Even if the seizure resolves prior to completion of the initial dose, the remaining doses should still be administered over a 4- to 6-hour period. Oral or (more likely) nasogastric administration of pyridoxine can be administered if the IV formulation is not available, but neither are optimal routes of delivery. Every effort should be made to stock pyridoxine in the antidote supply in the ED to avoid time delays involving finding, preparing, and administering the drug in these scenarios. Previous studies have found that most EDs are not prepared to handle pyridoxine replacement.4,5
Since benzodiazepines and barbiturates are GABA agonists with complementary mechanisms of actions to pyridoxine, they should be administered to potentiate the antiseizure effect of pyridoxine. If the seizure does not terminate, the use of propofol or general anesthesia may be required. Once the seizure is terminated, oral activated charcoal can be administered if the ingestion occurred within several hours of presentation. Given the rapid onset of effect of a large dose of INH, most patients will develop seizure shortly after exposure, limiting the benefits of both aggressive gastrointestinal decontamination and delayed activated charcoal. Charcoal also can be used for patients who overdose on INH but do not develop seizures.
Although the utility of a head computed tomography (CT) scan or laboratory studies is limited given the context of the exposure, these are generally obtained for patients with new-onset seizure. Since many patients with INH toxicity do not seize, such a patient may have a lower seizure threshold due to the existence of a subclinical cerebral lesion or metabolic abnormality.
Case Conclusion
The patient’s INH-induced refractory seizure was treated with pyridoxine. Her history suggested that she had ingested an unknown number of INH tablets within an hour. On this initial basis, an IV dose of 5,000 mg of pyridoxine was administered. The patient’s seizures terminated within 2 minutes of the infusion, and no additional doses of pyridoxine were required. Given the lack of concern for self-harm, an acetaminophen concentration was not obtained. A urine toxicology screen was negative for cocaine and amphetamines, and a CT scan of the head was negative for any abnormality. The patient was admitted to the pediatric intensive care unit for status epileptics and was discharged home on hospital day 2 after an uneventful stay.
1. Cock HR. Drug-induced status epilepticus. Epilepsy Behav. 2015;49:76-82. doi:10.1016/j.yebeh.2015.04.034.
2. Latent tuberculosis infection: a guide for primary health care providers. Centers for Disease Control and Prevention Web site. http://www.cdc.gov/tb/publications/LTBI/treatment.htm. Updated August 5, 2016. Accessed December 13, 2016.
3. Howland MA. Antidotes in depth: pyridoxine. In: Hoffman RS, Howland MA, Lewin NA, Nelson LS, Goldfrank LR, eds. Goldfrank’s Toxicologic Emergencies. 10th ed. New York, NY: McGraw-Hill; 2015:797-799.
4. Shah BR, Santucci K, Sinert R, Steiner P. Acute isoniazid neurotoxicity in an urban hospital. Pediatrics. 1995;95(5):700-704.
5. Santucci KA, Shah BR, Linakis JG. Acute isoniazid exposures and antidote availability. Pediatr Emerg Care. 1999;15(2):99-101.

First EDition: Liquid Nicotine Risks, more
Risks of Electronic Cigarettes Include Unintentional Ingestion of Liquid Nicotine
BY JEFF BAUER
A recent case report of a 6-year-old girl who developed severe toxicity and required intubation after an unintentional exposure to liquid nicotine emphasizes a potential danger of commercially available liquid nicotine, which is highly concentrated, unreliably packaged, and poorly regulated.
Liquid nicotine is commonly sold in concentrated “refill” solutions intended for electronic cigarette users to dilute themselves. Previous studies have found that these refill products have unreliable commercial labeling, and that the actual nicotine concentration of these solutions can vary widely from the advertised concentration.
In this case report, the girl’s mother had purchased a concentrated nicotine solution online and had used an empty ibuprofen bottle, which she relabeled as “NIC,” to dilute the solution. Afterward, the patient’s father gave his daughter a 10-mL dose of the liquid from the repurposed bottle, believing it to be ibuprofen. Immediately upon consumption, the girl experienced a burning sensation in her mouth and throat. When the father tasted the liquid, he realized it contained the nicotine solution.
Within 5 minutes of the ingestion, the patient’s father called the regional poison control center and emergency medical services, while the girl’s mother attempted to manually induce vomiting, which produced only a small amount of emesis. When the paramedics arrived, the girl was conscious and breathing spontaneously, but she did not respond to questions or follow commands. The only intervention the paramedics performed was insertion of a peripheral intravenous line.
The girl arrived at the ED approximately 25 minutes after having ingested the nicotine. Her vital signs were: temperature, 95.4°F; heart rate (HR), 140 to 150 beats/min; and blood pressure, 93/70 mm Hg. Oxygen saturation was 95% on room air. She was alternately agitated and unresponsive. Her HR decreased to 60 beats/min, and she developed vomiting, diaphoresis, fasciculations, obtundation, and copious secretions. She was given ondansetron (0.1 mg/kg) and lorazepam (0.05 mg/kg), and within 6 minutes from arrival, she was sedated and intubated. Activated charcoal (25 g) was administered via nasogastric tube, and she was admitted to the pediatric intensive care unit.
Laboratory results from blood drawn upon the girl’s arrival at the ED indicated elevated lactate, creatinine, and potassium levels. A serum sample obtained 60 minutes after the girl had ingested the liquid was notable for elevated levels of nicotine (348 ng/mL). With the parents’ permission, the liquid in the ibuprofen container was analyzed and found to contain nicotine, 70.3 mg/mL, which meant the girl had consumed 703 mg of nicotine, or 35 mg/kg. A recent review suggested a fatal nicotine dose of 500 to 1,000 mg in adults. Assuming the mother had correctly diluted the liquid nicotine by half as she had intended to, the original product’s nicotine concentration was 140.6 mg/mL, or 234% of the amount listed on the package (60 mg/mL).
The girl remained sedated and intubated overnight without requiring additional medication or treatment. She was extubated the next morning. Her lactate, creatinine, and potassium levels returned to normal, and electrocardiography and chest radiography results were normal. She was discharged home in stable condition. The Department of Human Services conducted a brief investigation, which they closed when the patient was discharged.
The authors of this case report concluded that emergency physicians (EPs) should be aware of the widespread availability of liquid nicotine products, and the potential of severe toxicity from ingestion of liquid nicotine.
Noble MJ, Longstreet B, Hendrickson RG, Gerona R. Unintentional pediatric ingestion of electronic cigarette nicotine refill liquid necessitating intubation. Ann Emerg Med. 2017;69(1):94-97. doi:10.1016/j.annemergmed.2016.08.448.
Emergency Radiologists’ Job Satisfaction Tied to How Often They Have to Work Overnight Shifts
BY JEFF BAUER
According to a recent survey of emergency radiologists, those who frequently work overnight shifts are less likely to be satisfied with their job than counterparts who work fewer or no overnight shifts.
Approximately 1,100 emergency radiologists received an e-mail invitation to complete an online survey; 327 did so (29.6% response rate). Seventy-three percent of respondents were male, 69% were age 40 years or older, and 87% practiced full-time. Respondents were asked to rate statements such as “I enjoy my job” and “At times I feel overwhelmed at work” on a Likert scale from “disagree or strongly disagree” to “agree or strongly agree.”
Overall, 81% of respondents reported some measure of job enjoyment. There was an association between the average number of overnight shifts performed per year and job enjoyment. Emergency radiologists who did no overnight shifts were 2.21 times more likely to report enjoying their job than those who worked 17 weeks or more of overnight shifts a year.
Hanna TN, Shekhani H, Lamoureux C, et al. Emergency radiology practice patterns: shifts, schedules, and job satisfaction. J Am Coll Radiol. 2016. Dec 4. [Epub ahead of print]. doi:10.1016/j.jacr.2016.09.018.
Discharging Select Diverticulitis Patients From the ED May Be Acceptable
DOUG BRUNK
FRONTLINE MEDICAL NEWS
Among patients diagnosed with diverticulitis via computed tomography (CT) scan in the ED who were discharged home, only 13% required a return visit to the hospital, results from a long-term retrospective analysis demonstrated.
“In select patients whose assessment includes a CT scan, discharge to home from the emergency department with treatment for diverticulitis is safe,” study author Anne-Marie Sirany, MD, said at the annual meeting of the Western Surgical Association.
According to Dr Sirany, a general surgery resident at Hennepin County Medical Center, Minneapolis, diverticulitis accounts for about 150,000 hospital admissions per year in the United States, and only 15% of these patients require surgical intervention. However, between 2006 and 2011, ED visits for diverticulitis increased by 21%, and the annual direct medical cost related to the condition is estimated to exceed $1.8 billion. At the same time, medical literature regarding uncomplicated diverticulitis is scarce. “Most of the literature focuses on complicated diverticulitis, which includes episodes associated with extraluminal air, free perforation, abscess, fistula, obstruction, and stricture,” Dr Sirany said.
A few years ago, researchers conducted a randomized trial to evaluate the treatment of uncomplicated diverticulitis. Patients were diagnosed with diverticulitis in the ED and randomized to either hospital admission or outpatient management at home. The investigators found no significant differences between the readmission rates of the inpatient and outpatient groups, but the health care costs were three times lower in the outpatient group. Dr Sirany and her associates set out to compare the outcomes of patients diagnosed with and treated for diverticulitis in the ED who were discharged to home, versus those who were admitted to the hospital. They reviewed the medical records of 240 patients with a primary diagnosis of diverticulitis by CT scan who were evaluated in the ED at one of four hospitals and one academic medical center from September 2010 to January 2012. The primary outcome was hospital readmission or return to the ED within 30 days, while the secondary outcomes were recurrent diverticulitis or surgical resection for diverticulitis.
The mean age of the 240 patients was 59 years, 45% were men, 22% had a Charlson Comorbidity Index (CCI) of >2, and 7.5% were on corticosteroids or immunosuppressant medications. More than half (62%) were admitted to the hospital, while the remaining 38% were discharged home on oral antibiotics. Compared with patients discharged home, those admitted to the hospital were more likely to be older than 65 years (43% vs 24%, respectively; P = .003), have a CCI of 2 or greater (28% vs 13%; P = .007), were more likely to be on immunosuppressant or steroid medications (11% vs 1%; P = .003), show extraluminal air on CT (30% vs 7%; P < .001), or show abscess on CT (19% vs 1%; P < .001). “Of note: We did not have any patients who had CT scan findings of pneumoperitoneum who were discharged home, and 48% of patients admitted to the hospital had uncomplicated diverticulitis,” she said.
After a median follow-up of 37 months, no significant differences were observed between patients discharged to home and those admitted to the hospital in readmission or return to the ED (13% vs 14%), recurrent diverticulitis (23% in each group), or in colon resection at subsequent encounter (16% vs 19%). “Among patients discharged to home, only one patient required emergency surgery, and this was 20 months after their index admission,” Dr Sirany said. “We think that the low rate of readmission in patients discharged home demonstrates that this is a safe approach to management of patients with diverticulitis, when using information from the CT scan.”
Closer analysis of patients who were discharged home revealed that six patients had extraluminal air on CT scan, three of whom returned to the ED or were admitted to the hospital. In addition, 11% of those with uncomplicated diverticulitis returned to the ED or were admitted to the hospital.
Dr Sirany acknowledged certain limitations of the study, including its retrospective design, a lack of complete follow-up for all patients, and the fact that it included patients with recurrent diverticulitis. “Despite the limitations, we recommend that young, relatively healthy patients with uncomplicated findings on CT scan can be discharged to home and managed as an outpatient,” she said. “In an era where there’s increasing attention to health care costs, we need to think more critically about which patients need to be admitted for management of uncomplicated diverticulitis.”
Microsensor Perfectly Distinguished Coagulopathy Patients From Controls
AMY KARON
FRONTLINE MEDICAL NEWS
Using less than a drop of blood, a portable microsensor provided a comprehensive coagulation profile in <15 minutes and perfectly distinguished various coagulopathies from normal blood samples—handily beating the results from both activated partial thromboplastin time (aPTT) and prothrombin time (PT).
Dubbed ClotChip, the disposable device detects coagulation factors and platelet activity using dielectric spectroscopy, Evi X. Stavrou, MD, said at the annual meeting of the American Society of Hematology. The development points the way for comprehensive, rapid, point-of-care (POC) assessment of critically ill or severely injured patients and those who need ongoing monitoring to evaluate response to anticoagulant therapy, she added.
Existing POC coagulation assays have several shortcomings, Dr Stavrou, of Case Western Reserve University, Cleveland, said during a press briefing at the conference. They are relatively insensitive, fail to measure platelet activity, or are only approved for specific subgroups of patients, such as those on warfarin, she specified.
To develop an alternative, Dr Stavrou and her associates added a parallel-plate capacitive sensing structure to an inexpensive, disposable microfluidic biochip designed to test 9 microliters (less than one drop) of blood. They built the microsensor from biocompatible and chemically inert materials to minimize the chances of artificial contact activation.
To test the device, the researchers used calcium dichloride to induce coagulation in whole blood samples from 11 controls with normal aPTT and PT values. Time curves of output from the microsensor showed that coagulation consistently peaked within 4.5 to 6 minutes.
Next, the investigators tested blood from 12 patients with coagulopathies, including hemophilia A, hemophilia B, acquired von Willebrand factor defect, and congenital hypodysfibrinogenemia. These samples all yielded abnormal curves, with prolonged times to peak that ranged between 7 and 15 minutes—significantly exceeding those of healthy controls (P = .002).
By plotting rates of true positives against rates of true negatives, the researchers obtained areas under the receiver-operating curves of 100% for ClotChip, 78% for aPTT, and 57% for PT. In other words, ClotChip correctly identified all cases and controls in this small patient cohort, while neither aPTT nor PT did.
Finally, the researchers used the microsensor to measure coagulation activity in normal blood samples that they treated with prostaglandin E2 to inhibit platelet aggregation. Normalized permittivity (an electrical measure) was significantly lower than in untreated control samples (P = .03), but time-to-peak values were the same in both groups. This finding confirms the chip can identify abnormal platelet function, Dr Stavrou said. “ClotChip is sensitive to the complete hemostasis process, exhibits better sensitivity and specificity than conventional coagulation assays, and discriminates between coagulation and platelet defects,” she concluded.
The investigators are recruiting volunteers for an expanded round of testing for the device, and are working to optimize construction to further enhance its sensitivity.
Survey: Overprescribing Is the Cause of the Opioid Crisis
M. ALEXANDER OTTO
FRONTLINE MEDICAL NEWS
Almost a third of doctors blamed overprescribing as the cause of the opioid crisis, according to a survey of 225 US primary care, emergency medicine, and pain management physicians by InCrowd, an online physician survey company.
Respondents said their and other physicians’ overprescribing is the single biggest factor fueling the leap in opioid abuse over the past 5 years.
“We were told…that [opioids] wouldn’t be addictive in the great majority of patients. This was obviously wrong,” said a Utah EP in practice for 38 years. Meanwhile, 24% of the respondents cited aggressive patient drug-seeking as the primary cause, and 18% blamed drug dealers.
In short, the survey pointed out what front-line doctors think needs to be fixed as the nation combats prescription opioid abuse and the subsequent heroin epidemic. Their insights “should be a rallying cry” for changes in 2017, said epidemiologist Diane Hayes, PhD, president and cofounder of InCrowd.
Making pain the “fifth vital sign” and allowing patients to downgrade doctors on surveys if they don’t prescribe or refill opioid prescriptions compounded the situation. Lengthy waits for specialists with better pain options, many of whom are not covered by Medicaid or the Affordable Care Act, also added to the problem, survey respondents said.
“We’re caught in the middle” between the Joint Commission on Accreditation of Healthcare Organization’s fifth vital sign and overprescribing, a primary care physician (PCP) said.
Seventy-three percent of survey respondents said that they want opioid alternatives, noting exasperation with nonsteroidal anti-inflammatory drugs, physical therapy, and exercise. About half recommend behavioral health interventions, while 20% recommend vitamin and herbal supplements. Only 10% recommend medical marijuana, probably because it is inaccessible to most US patients. Meanwhile, the respondents said they want opioid prescribing “hemmed in.” Almost two-thirds wanted refill limits and more frequent refill evaluations, and many agreed that there needs to be a weaning protocol before the drugs are even started. Some wanted to limit advertising.
Easton Jackson, MD, a PCP in West Valley City, Utah, who answered the survey, helped make the answers real by sharing his thoughts.
“We need to recognize that…people don’t set out to get addicted to opioids….We need to educate [patients] and assist them with their expectations. They need to understand that they’re going to have pain from surgery and injuries. Our goal isn’t to make them pain-free. It’s to manage their pain,” he said.
“We as physicians need to write for fewer pills and in lower doses. We need to see our patients back sooner. If it’s not working, stop increasing the dose and instead taper the patient off the medication. We need to be familiar with the adjuvant therapies. As easy as it is to say, ‘send them all to the pain specialist,’ there simply aren’t enough of them around,” Dr Jackson said.
Physician respondents to InCrowd’s opioid survey have practiced an average of 25 years, and were scattered around the United States. They filled out the four-question survey during October 27 to 28, 2016. They signed up to receive and answer InCrowd’s questions, and were paid nominally for their time.
Half (50%) of respondents estimated that they prescribed opioids to <10% of their patients; 38% said they prescribed to less than half of their patients; and 12% estimated they prescribed opioids to more than half of their patients.
Adding Respiratory Rate to Triage Criteria Improves Accurate Staging of Chest Trauma Patients
MICHELE G. SULLIVAN
FRONTLINE MEDICAL NEWS
Adding respiratory rate (RR) and suspected blunt chest injury to a trauma assessment in the field significantly improved the appropriate triaging of level III trauma patients.
When the assessment specifically evaluated for tachypnea in the setting of blunt chest injury, undertriaging improved by 1.2%, John Yonge, MD, said at the annual clinical congress of the American College of Surgeons.
“When we applied this new criteria to our 10-year study, we identified 661 patients who should have been activated as a level I or level II,” but instead were assessed as less critically injured, Dr Yonge said in an interview. This initial misstep significantly extended the time before patients could have critical surgical procedures and was related to higher mortality among them.
Dr Yonge, a surgical fellow at Oregon Health & Science University (OHSU), Portland, and his mentor Martin Schreiber, MD, conducted the retrospective study of 7,880 trauma patients admitted at level III activation from 2004 to 2014. The OHSU trauma system has three activation levels.
- Level I activations are reserved for the most critically injured patients; attending trauma surgeon and anesthesiologist presence is mandatory.
- Level II activations capture moderate-to-severe injuries; trauma surgeon and respiratory therapist presence is mandated.
- Level III activations are designed to capture patients who do not require an immediate lifesaving intervention; the presence of the trauma surgery chief resident and attending emergency medicine physician is mandatory.
Patients were considered undertriaged if they were admitted as level III activations, but then required a critical intervention (chest tube placement, intubation, needle thoracostomy, or intracranial pressure monitoring) in the ED or ultimately met level I or II activation criteria.
Among all the level III patients, 466 (6%) were undertriaged: 390 were undertriaged based on the existing level I or II activation criteria, and 76 were considered undertriaged based on the need for a critical intervention.
Most of the undertriaged patients (65%) met criteria for level I activation; the rest should have been triaged as level II patients. Compared with appropriately staged level III patients, mortality among the undertriaged patients was significantly higher (3.2% vs 0.6%). Undertriaged patients also experienced longer delays before initiation of major emergency surgery: a mean of 147 minutes, compared with 106 minutes for appropriately triaged level I patients and 62 minutes for appropriately triaged level II patients.
Dr Yonge then looked for clinical measures that would improve triage. Tachypnea (RR >20 breaths/min) in the field stood out as a significant factor. Tachypneic patients who had a suspected chest injury were 70% more likely to be undertriaged than were those with a normal RR. Tachypnea was significantly associated with a diagnosis of flail chest, ED intubation, and chest-tube placement.
The team then constructed a new triage criterion for patients with suspected chest injury—tachypnea combined with suspected blunt thoracic injury. By applying that model to their study population of level III patients, they determined that the level III undertriage rate would be reduced by 1.2%.
Tying the physiological marker of tachypnea to a suspected clinical diagnosis is a key factor, Dr Yonge noted. “Just adding tachypnea doesn’t help us. In fact, it would overwhelm us, because a trauma patient could very well be tachypneic because he’s experiencing panic. But tying it to a suspected clinical diagnosis gives us a meaningful result.”
He confirmed this linkage with an additional analysis. “We looked to see how severely injured these patients were and found that 71% of them had an Abbreviated Injury Score (AIS) to the chest of 3 or more, indicating a severe chest injury. Only 29% had an AIS of 2 or less. So this proves that respiratory rate is a valid triage criterion and can be used to identify patients who need a higher level of trauma care.”
The challenge now, Dr Yonge said, is incorporating the marker into clinical practice. “It doesn’t matter how many statistics you do, if you can’t educate the prehospital providers in this, it’s useless. They are the crux of the trauma system.”
Although national guidelines do recommend assessing RR as part of field triage, it often isn’t recorded or is only estimated, Dr Yonge said. That’s one reason he used the 20 breaths/min cutoff rate. “It doesn’t even take a full minute to assess this, but it can make a big improvement in care.”

Study: Docs could see financial losses under partial ACA repeal
An expected partial repeal of the Affordable Care Act would hit physicians’ bottom line, according to a new analysis from the Urban Institute.
Analysts using the vetoed January 2016 budget reconciliation bill as the basis for their projections estimate that the partial repeal could result in as many as 29.8 million Americans losing coverage through the elimination of the Medicaid expansion, the individual and employer mandates, and the insurance marketplace premium tax credits and cost-sharing reductions. In addition, there would be a surge in uncompensated care.
“The coverage losses would in turn decrease revenues for providers of all types,” the report states. “Providers’ variable costs would also decrease, but their fixed costs would not.”
The Urban Institute estimates that spending by insurers (public and private) and households on health care delivered to the nonelderly would decrease by $145.8 billion in 2019 and $1.7 trillion between 2019 and 2028. 
The increase in the uninsured would cause a spike of $88 billion in uncompensated care ($26.4 billion in hospital care, $11.9 billion in physician office care, $33.6 billion in other services, and $18.0 billion in prescription drugs), reaching $1.1 trillion between 2019 and 2028. At the same time, federal funding for uncompensated care would increase no more than $3.2 billion in 2019 and no more than $35 billion from 2019 and 2028, analysts state.
“There is no clear source of funding for the remainder,” the report notes. “If federal, state, and local governments do not allocate more funding for this care, the financial burden would fall on health care providers. Large increases in unmet need for the uninsured are likely because the additional costs would require a fourfold increase in provider funding of uncompensated care from current levels.”
Congressional Republicans plan to use the budget reconciliation process to partially repeal the revenue generating aspects of the ACA, a process that allows the repeal to go through with a simple majority in the Senate. However, repeal of the health care reform law’s other parts would require at least 60 votes in the Senate, requiring at least eight Democrats to side with the Republican majority, assuming none in the majority go against the party.
The Trump administration has signaled that it plans to maintain certain aspects of the ACA, including the ability for parents to cover children up to age 26 and the ban on denial of coverage for preexisting conditions.
Research for the report was funded by the Robert Wood Johnson Foundation.
This article was updated January 20, 2017 and February 9, 2017.
An expected partial repeal of the Affordable Care Act would hit physicians’ bottom line, according to a new analysis from the Urban Institute.
Analysts using the vetoed January 2016 budget reconciliation bill as the basis for their projections estimate that the partial repeal could result in as many as 29.8 million Americans losing coverage through the elimination of the Medicaid expansion, the individual and employer mandates, and the insurance marketplace premium tax credits and cost-sharing reductions. In addition, there would be a surge in uncompensated care.
“The coverage losses would in turn decrease revenues for providers of all types,” the report states. “Providers’ variable costs would also decrease, but their fixed costs would not.”
The Urban Institute estimates that spending by insurers (public and private) and households on health care delivered to the nonelderly would decrease by $145.8 billion in 2019 and $1.7 trillion between 2019 and 2028.
The increase in the uninsured would cause a spike of $88 billion in uncompensated care ($26.4 billion in hospital care, $11.9 billion in physician office care, $33.6 billion in other services, and $18.0 billion in prescription drugs), reaching $1.1 trillion between 2019 and 2028. At the same time, federal funding for uncompensated care would increase no more than $3.2 billion in 2019 and no more than $35 billion from 2019 and 2028, analysts state.
“There is no clear source of funding for the remainder,” the report notes. “If federal, state, and local governments do not allocate more funding for this care, the financial burden would fall on health care providers. Large increases in unmet need for the uninsured are likely because the additional costs would require a fourfold increase in provider funding of uncompensated care from current levels.”
Congressional Republicans plan to use the budget reconciliation process to partially repeal the revenue generating aspects of the ACA, a process that allows the repeal to go through with a simple majority in the Senate. However, repeal of the health care reform law’s other parts would require at least 60 votes in the Senate, requiring at least eight Democrats to side with the Republican majority, assuming none in the majority go against the party.
The Trump administration has signaled that it plans to maintain certain aspects of the ACA, including the ability for parents to cover children up to age 26 and the ban on denial of coverage for preexisting conditions.
Research for the report was funded by the Robert Wood Johnson Foundation.
This article was updated January 20, 2017 and February 9, 2017.
Children with infantile spasms or nonsyndromic epilepsy achieve similar outcomes
HOUSTON – Infants and children who had epilepsy that was not identified as being part of a syndrome fared slightly worse in developmental outcomes and pharmacoresistance than did those with West syndrome/infantile spasms, Dravet syndrome, or another type of syndromic epilepsy, according to a prospective multisite study.
But in the study of 775 patients from 17 American pediatric epilepsy centers, early age at diagnosis was associated with greater mortality, greater risk of developmental decline, and greater pharmacoresistance, regardless of seizure type.
Lead study author Anne Berg, PhD, and her colleagues wrote that they were surprised to see that children in their study population with nonsyndromic epilepsy (NSE) were slightly more likely to have pharmacoresistant seizures (PR).
Further, although logistic regression analysis showed that seizure etiology, younger age at onset, and PR all had independent contributions to developmental decline, “West/IS was not convincingly associated with developmental decline,” they said.
In a poster session at the annual meeting of the American Epilepsy Society, Dr. Berg, an epidemiologist and research professor of pediatric neurology at Northwestern University, Chicago, presented the findings of a study that examined outcomes for infants and children diagnosed with epilepsy.
Patients were prospectively identified during a 3-year period from 2012 to 2015. Patients were eligible if their epilepsy began before their third birthday, and if the epilepsy was initially diagnosed at one of the participating centers. Patient data were evaluated for seizure and developmental outcomes if the patient was followed for at least 6 months after diagnosis.
Of the 775 patients initially recruited, 367 (47.3%) were girls. The mean age of epilepsy onset (which usually meant age at first unprovoked seizure) was 11.1 months (standard deviation, 9.4). Most patients (n = 509; 65.7%) were diagnosed with epilepsy before the age of 1 year. Just 115 patients (14.8%) received their epilepsy diagnosis when they were older than 2 years.
A key outcome investigated by Dr. Berg and her colleagues was pharmacoresistance, identified as lack of seizure control (i.e., at least a 3-month seizure-free period) after trying two appropriate medications. Other outcome measures included tracking whether patients developed West/IS, and whether West/IS evolved into other seizure types. The investigators also tracked developmental delay after epilepsy diagnosis and collected data about deaths among participating patients.
About a quarter (27%) of patients had persistent PR; these were more likely to occur in children who were younger at the onset of epilepsy. PR were more common when seizures began before the age of 1 year, occurring in 30% of this patient population, whereas 20% of patients with seizure onset happening after 1 year of age had PR (P = .0008).
Other findings from the study revealed that infants whose NSE had an etiology of focal cortical dysplasia or of an acquired insult such as trauma were more than twice as likely to have their seizures evolve into WS/IS.
Of 214 children whose initial presentation was WS/IS, 49 (23%) developed new seizure types. Most of these (47 of 49) were infants. Patients with WS/IS due to tuberous sclerosis complex, infectious causes, hypoxic-ischemic encephalopathy, and cephalic brain disorders were more likely to develop new seizure types.
“At initial presentation of epilepsy, children with West/IS were more likely already to have developmental delay than children with other syndromes or NSE,” they said.
Of the 22 patient deaths that occurred during the study, all but 1 occurred in infants younger than 1 year. None of the deaths occurred in typically-developing children with unknown epilepsy etiology.
“West/IS is the only early life epilepsy with consensus guidelines for treatment,” noted Dr. Berg and her coauthors, speculating that the guidelines might contribute to the slightly better outcomes observed for this population in their study.
However, although some groups of infants and children in the study fared slightly better than others, “[F]or the most part, there are no clearly ‘low’ risk groups,” Dr. Berg and her colleagues said. “Our findings highlight that most, if not all, early life epilepsies pose serious risk for poor outcomes and are equally deserving of concerted efforts.”
Dr. Berg reported no relevant financial disclosures. The study was funded by the Pediatric Epilepsy Research Foundation, and conducted through the Pediatric Epilepsy Research Consortium.
[email protected]
On Twitter @karioakes
AT AES 2016
Key clinical point:
Major finding: Infantile spasms was not independently associated with worse developmental decline compared with nonsyndromic epilepsy.
Data source: Prospective study of 775 infants and children with epilepsy.
Disclosures: Dr. Berg reported no relevant financial disclosures. The study was funded by the Pediatric Epilepsy Research Foundation, and conducted through the Pediatric Epilepsy Research Consortium.