User login
Top 3 things I learned at the PAGS 2016 symposium
The video associated with this article is no longer available on this site. Please view all of our videos on the MDedge YouTube channel
The video associated with this article is no longer available on this site. Please view all of our videos on the MDedge YouTube channel
The video associated with this article is no longer available on this site. Please view all of our videos on the MDedge YouTube channel

LAA closure during cardiac surgery cuts late mortality
NEW ORLEANS – Surgical left atrial appendage closure at the time of open heart surgery in patients with atrial fibrillation doesn’t decrease patients’ early or late risk of stroke, but it does substantially reduce their risk of late mortality, Masahiko Ando, MD, reported at the American Heart Association scientific sessions.
Solid evidence demonstrates that percutaneous left atrial appendage (LAA) closure using the Watchman or other devices in patients with atrial fibrillation offers a potential alternative to lifelong oral anticoagulation.
In contrast, even though surgical LAA closure at the time of cardiac surgery is commonly done, the data as to its long-term impact are scanty. This was the impetus for Dr. Ando and his coinvestigators at Massachusetts General Hospital in Boston to perform a comprehensive systematic review of the medical literature. They also conducted a meta-analysis that involved 7,466 patients who underwent open-heart surgery with or without surgical LAA closure in 12 studies, 3 of which were randomized controlled trials, 2 propensity-matched comparisons, and the rest cohort studies.
At 30-day follow-up, LAA closure was not associated with any significant effect on the risks of stroke, death, reexploration for bleeding, or postoperative atrial fibrillation.
At the latest follow-up in the studies, however, surgical LAA closure was associated with a highly significant 36% reduction in mortality risk compared with the no–LAA-closure control group. This remained the case even after statistical adjustment for demographics, type of cardiac surgery, and the form of preoperative atrial fibrillation.
“Given that we generally add LAA closure to those who have a higher risk of embolization, which could have negatively affected the efficacy of LAA closure, this preventive effect of LAA closure on late mortality cannot be ignored,” said Dr. Ando.
The most likely explanation for the improved survival in surgical LAA closure recipients, he continued, is that the procedure enabled them to avoid aggressive lifelong oral anticoagulation, with its attendant risks.
Dr. Ando reported having no financial conflicts regarding his study.
AT THE AHA SCIENTIFIC SESSIONS
Key clinical point:
Major finding: Late mortality risk was reduced by 36% in patients with atrial fibrillation who underwent surgical LAA closure during open heart surgery, compared with those who did not.
Data source: This meta-analysis included 12 published studies and 7,466 patients who either did or did not undergo surgical LAA closure during open heart surgery.
Disclosures: The study presenter reported having no financial conflicts.
Understanding SSTI admission, treatment crucial to reducing disease burden
Decreasing the burden of treating skin and soft tissue infections is critical to improving care and reducing the costs that SSTIs place on health care facilities, according to a study published in Hospital Practice.
“Despite expert panel recommendations and treatment guidelines, there is no widely accepted classification system for grading SSTIs to outcomes,” wrote the study’s lead author, Kristin E. Linder, PharmD, of Hartford (Conn.) Hospital. “This leads to a considerable variation in treatment approach on initial presentation when deciding which patients should be admitted to receive intravenous (IV) antibiotic therapy or treated as outpatients.”
Dr. Linder and her coinvestigators conducted a single-center retrospective cohort study with the primary objective of determining rates of admission and re-presentation, along with average length-of-stay (LOS) and cost of care for both inpatients and outpatients with SSTIs. Patients aged 18 years and older who received a primary diagnosis of an SSTI during May and June of 2015 at Hartford Hospital were screened; 446 were deemed eligible, with 357 ultimately selected for inclusion (Hosp Pract. 2017 Jan 5. doi: 10.1080/21548331.2017.1279519).

Of the 357 patients included for analysis, 106 (29.7%) were admitted as inpatients while the remaining 251 (70.3%) were treated as outpatients. However, there were no significant differences found in re-presentation rates, either overall – 22.6% for inpatients and 28.3% for outpatients (P greater than .05) – or for SSTI-related re-presentation: 10.4% for inpatients and 15.1% for outpatients (P greater than .05). For those patients who did get admitted, mean LOS was 7.3 days.
Patients who presented with a Charlson Comorbidity Index (CCI) score of zero were admitted at a rate of 14.1%, compared to 30.1% of those with a CCI score of one, and 60.9% of those with a CCI score of two or higher. The biggest disparity, however, was in terms of cost of care; while outpatient care cost an average of $413 per patient, inpatient care cost an average of $13,313 per patient.
Wound and abscess cultures that were tested found methicillin-susceptible Staphylococcus aureus (MSSA) to be the most prevalent gram-positive organism (37.1%) found in inpatients, while for outpatients, methicillin-resistant S. aureus (MRSA) was the most common (66.7%). According to the investigators, Gram-negative bacteria were not isolated in every case, so “prevalent use of combination therapy in this setting may not be warranted.
“Understanding how and where patients with SSTI are treated and their re-presentation rate is important to understand to direct resources for this high frequency disease,” the authors concluded. “This study demonstrated that approximately 70% of patients presenting to the ED with SSTI were treated as outpatients [and] while 30-day re-presentation was similar for inpatient and outpatients, readmission was more likely in those previously admitted.”
This study was not funded, according to the authors. Dr. Linder did not report any relevant financial disclosures, but her coauthors disclosed receiving speakers’ and consultants’ fees from Astellas, Theravance. Bayer, Merck and Pfizer.
Decreasing the burden of treating skin and soft tissue infections is critical to improving care and reducing the costs that SSTIs place on health care facilities, according to a study published in Hospital Practice.
“Despite expert panel recommendations and treatment guidelines, there is no widely accepted classification system for grading SSTIs to outcomes,” wrote the study’s lead author, Kristin E. Linder, PharmD, of Hartford (Conn.) Hospital. “This leads to a considerable variation in treatment approach on initial presentation when deciding which patients should be admitted to receive intravenous (IV) antibiotic therapy or treated as outpatients.”
Dr. Linder and her coinvestigators conducted a single-center retrospective cohort study with the primary objective of determining rates of admission and re-presentation, along with average length-of-stay (LOS) and cost of care for both inpatients and outpatients with SSTIs. Patients aged 18 years and older who received a primary diagnosis of an SSTI during May and June of 2015 at Hartford Hospital were screened; 446 were deemed eligible, with 357 ultimately selected for inclusion (Hosp Pract. 2017 Jan 5. doi: 10.1080/21548331.2017.1279519).
Of the 357 patients included for analysis, 106 (29.7%) were admitted as inpatients while the remaining 251 (70.3%) were treated as outpatients. However, there were no significant differences found in re-presentation rates, either overall – 22.6% for inpatients and 28.3% for outpatients (P greater than .05) – or for SSTI-related re-presentation: 10.4% for inpatients and 15.1% for outpatients (P greater than .05). For those patients who did get admitted, mean LOS was 7.3 days.
Patients who presented with a Charlson Comorbidity Index (CCI) score of zero were admitted at a rate of 14.1%, compared to 30.1% of those with a CCI score of one, and 60.9% of those with a CCI score of two or higher. The biggest disparity, however, was in terms of cost of care; while outpatient care cost an average of $413 per patient, inpatient care cost an average of $13,313 per patient.
Wound and abscess cultures that were tested found methicillin-susceptible Staphylococcus aureus (MSSA) to be the most prevalent gram-positive organism (37.1%) found in inpatients, while for outpatients, methicillin-resistant S. aureus (MRSA) was the most common (66.7%). According to the investigators, Gram-negative bacteria were not isolated in every case, so “prevalent use of combination therapy in this setting may not be warranted.
“Understanding how and where patients with SSTI are treated and their re-presentation rate is important to understand to direct resources for this high frequency disease,” the authors concluded. “This study demonstrated that approximately 70% of patients presenting to the ED with SSTI were treated as outpatients [and] while 30-day re-presentation was similar for inpatient and outpatients, readmission was more likely in those previously admitted.”
This study was not funded, according to the authors. Dr. Linder did not report any relevant financial disclosures, but her coauthors disclosed receiving speakers’ and consultants’ fees from Astellas, Theravance. Bayer, Merck and Pfizer.
FROM HOSPITAL PRACTICE
Key clinical point:
Major finding: Re-presentation rates between inpatients and outpatients with SSTIs were not significantly different – 10.4% versus 15.1%, respectively (P greater than .05) – but cost of care was much higher for inpatients than outpatients: $13,313 versus $413, respectively.
Data source: Retrospective cohort study of 357 SSTI patients during May and June of 2015.
Disclosures: The study was not funded. Two authors reported potential financial conflicts.
Nailfold analysis can predict cardiopulmonary complications in systemic sclerosis
Nailfold videocapillaroscopy can help to predict which patients with systemic sclerosis may develop serious cardiopulmonary complications, according to findings from a Dutch cross-sectional study.
While individual autoantibodies seen in systemic sclerosis (SSc) are known to be associated with greater or lesser risk of cardiopulmonary involvement, in this study nailfold vascularization patterns independently predicted pulmonary artery hypertension or interstitial lung disease.

All patients in the study had NVC pattern data as well as anti-extractable nuclear antigen (anti-ENA) antibodies. The mean age of the patients was 54 years; 82% were female, and median disease duration was 3 years. Just over half the cohort had interstitial lung disease, and 16% had pulmonary artery hypertension.
Among the anti-ENA autoantibody subtypes, anti-ACA was seen in 37% of patients, anti-Scl-70 in 24%, anti-RNP in 9%, and anti-RNAPIII in 5%; other subtypes were rarer. SSc-specific NVC patterns were seen in 88% of patients, with 10% of the cohort showing an early (less severe microangiopathy) pattern, 42% an active pattern, and 36% a late pattern.
One of the study’s objectives was to determine whether one or more mechanisms was responsible for both autoantibody production and the microangiopathy seen in SSc.
If a joint mechanism is implicated, “more severe NVC patterns would be determined in patients with autoantibodies (such as anti-Scl-70 and anti-RNAPIII) that are associated with more severe disease,” wrote Dr. Markusse and her colleagues. “On the other hand, if specific autoantibodies and stage of microangiopathy reflect different processes in the disease, a combination of autoantibody status and NVC could be helpful for identifying patients at highest risk for cardiopulmonary involvement.”
The investigators reported finding a similar distribution of NVC abnormalities across the major SSc autoantibody subtypes (except for anti–RNP-positive patients), suggesting that combinations of the two variables would be most predictive of cardiopulmonary involvement. More severe NVC patterns were associated with a higher risk of cardiopulmonary involvement, independent of the presence of a specific autoantibody.
Notably, the researchers wrote, “prevalence of ILD [interstitial lung disease] is generally lower among ACA-positive patients. According to our data, even among ACA-positive patients there was a trend for more ILD being associated with more severe NVC patterns (OR = 1.33).”
A similar pattern was seen for pulmonary artery hypertension. “Based on anti-RNP and anti-RNAPIII positivity, patients did not have an increased risk of a [systolic pulmonary artery pressure] greater than 35 mm Hg; however, with a severe NVC pattern, this risk was significantly increased (OR = 2.33).”
The investigators cautioned that their findings should be confirmed in larger cohorts. The study by Dr. Markusse and her colleagues was conducted without outside funding, though manufacturers donated diagnostic antibody tests. One of the 11 study coauthors disclosed receiving financial support from Actelion.
Systemic sclerosis is a profoundly heterogeneous disorder, with the overall prevalence of major organ-specific manifestations, such as pulmonary arterial hypertension (PAH), broadly adhering to a 15% rule. As such, the majority of patients with SSc will not develop any given organ-specific complication. The major challenge for clinicians during the early stages of the disease is predicting the future occurrence of potentially life-threatening organ-specific manifestations, such as PAH.
The complementary association of nailfold videocapillaroscopy changes and autoantibody profile in predicting cardiopulmonary involvement reported by Dr. Markusse and her colleagues is novel, but otherwise supports the findings of previous cross-sectional studies identifying associations between advanced NVC changes and SSc complications, such as digital ischemic lesions and PAH. These studies provide intriguing insight into the relationship between the evolution of microangiopathy and the emergence of organ-specific manifestations of SSc, but also represent a shift in focus from the diagnostic to the prognostic utility of NVC in SSc.
There is potential clinical utility in these observations that has yet to be unlocked fully; particularly should the predictive value and timing of NVC progression be further characterized in longitudinal studies better defining the natural history of SSc organ-specific manifestations. If evolving NVC changes (in high-risk serological subgroups) are shown to pre-date the emergence of overt organ-specific manifestations of SSc, then we might be provided with a window of opportunity for escalation of therapy with treatments targeting endothelial function (such as phosphodiesterase inhibitors and/or endothelin receptor antagonists) and/or possible immunomodulatory approaches. This could potentially usher in a new era of preventive disease-modifying therapeutic intervention in SSc.
John D. Pauling, MD, PhD, is a consultant rheumatologist at the Royal National Hospital for Rheumatic Diseases, Bath, England, and Visiting Senior Lecturer in the department of pharmacy and pharmacology at the University of Bath. His commentary is derived from an editorial accompanying the study by Dr. Markusse and her associates (Rheumatology [Oxford]. 2016 Dec 30. doi: 10.1093/rheumatology/kew461). He disclosed having received grants and consultancy income from Actelion.
Nailfold videocapillaroscopy can help to predict which patients with systemic sclerosis may develop serious cardiopulmonary complications, according to findings from a Dutch cross-sectional study.
While individual autoantibodies seen in systemic sclerosis (SSc) are known to be associated with greater or lesser risk of cardiopulmonary involvement, in this study nailfold vascularization patterns independently predicted pulmonary artery hypertension or interstitial lung disease.
All patients in the study had NVC pattern data as well as anti-extractable nuclear antigen (anti-ENA) antibodies. The mean age of the patients was 54 years; 82% were female, and median disease duration was 3 years. Just over half the cohort had interstitial lung disease, and 16% had pulmonary artery hypertension.
Among the anti-ENA autoantibody subtypes, anti-ACA was seen in 37% of patients, anti-Scl-70 in 24%, anti-RNP in 9%, and anti-RNAPIII in 5%; other subtypes were rarer. SSc-specific NVC patterns were seen in 88% of patients, with 10% of the cohort showing an early (less severe microangiopathy) pattern, 42% an active pattern, and 36% a late pattern.
One of the study’s objectives was to determine whether one or more mechanisms was responsible for both autoantibody production and the microangiopathy seen in SSc.
If a joint mechanism is implicated, “more severe NVC patterns would be determined in patients with autoantibodies (such as anti-Scl-70 and anti-RNAPIII) that are associated with more severe disease,” wrote Dr. Markusse and her colleagues. “On the other hand, if specific autoantibodies and stage of microangiopathy reflect different processes in the disease, a combination of autoantibody status and NVC could be helpful for identifying patients at highest risk for cardiopulmonary involvement.”
The investigators reported finding a similar distribution of NVC abnormalities across the major SSc autoantibody subtypes (except for anti–RNP-positive patients), suggesting that combinations of the two variables would be most predictive of cardiopulmonary involvement. More severe NVC patterns were associated with a higher risk of cardiopulmonary involvement, independent of the presence of a specific autoantibody.
Notably, the researchers wrote, “prevalence of ILD [interstitial lung disease] is generally lower among ACA-positive patients. According to our data, even among ACA-positive patients there was a trend for more ILD being associated with more severe NVC patterns (OR = 1.33).”
A similar pattern was seen for pulmonary artery hypertension. “Based on anti-RNP and anti-RNAPIII positivity, patients did not have an increased risk of a [systolic pulmonary artery pressure] greater than 35 mm Hg; however, with a severe NVC pattern, this risk was significantly increased (OR = 2.33).”
The investigators cautioned that their findings should be confirmed in larger cohorts. The study by Dr. Markusse and her colleagues was conducted without outside funding, though manufacturers donated diagnostic antibody tests. One of the 11 study coauthors disclosed receiving financial support from Actelion.
FROM RHEUMATOLOGY
Key clinical point:
Major finding: Across the major autoantibody subtypes seen in an SSc cohort, NVC pattern showed a stable association with presence of interstitial lung disease (OR, 1.3-1.4) or elevated systolic pulmonary artery pressure (OR, 2.2-2.4).
Data source: A cross-section of 287 patients in a Dutch SSc cohort.
Disclosures: The study was conducted without outside funding, though manufacturers donated diagnostic antibody tests. One of the 11 study coauthors disclosed receiving financial support from Actelion.
Analyses of Fort Lauderdale shooting need a reset
Once again, there has been another senseless tragedy: a mass murder that leaves us all feeling vulnerable.
Last Friday, a gunman flew from Anchorage, Alaska, to Florida; retrieved a gun from his checked baggage; and opened fire on total strangers in the baggage claim area of the Fort Lauderdale airport, killing five people and wounding eight others. Why? The media always find a few facts that leave the public to piece together a theory that may or may not hold true.
I heard about the shooting while I was on vacation: The suspected gunman reportedly had visited ISIS websites and was killed at the scene. Later, I saw that he was not a terrorist and was not killed but had been taken into custody without a struggle.
The next reports noted that the 26-year-old man is a former soldier who had served in Iraq, and had come back traumatized and with psychological issues, according to his brother – or, according to what the media say his brother said, since the facts are sometimes selectively reported.
It was then announced that the gunman had gone to the FBI and reported that he was having concerns that U.S. intelligence agencies were infiltrating his brain and commanding him to look at ISIS websites. The FBI sent him for a psychiatric evaluation. His gun was taken by police; he spent a few days in the hospital, and had been released. Soon after, his firearm was returned, and he used it to commit a mass shooting.

So the story started as a terror attack and moved to the media’s default explanation for mass murder – mental illness. These few facts may be pieced together to tell a story of a man who was changed by war, struggled with posttraumatic symptoms that left him angry, and at some point, had a psychotic break that led him to fly across the continent and kill strangers at an airport in response to a command delusion. That’s one possible story that could be written with the very few facts we have.
My best guess is that as facts unfold, the story will change. Even if this story is right, one has to wonder why so many other young soldiers who return from military service so damaged, who also may coincidentally develop psychotic illnesses (or psychosis related to drug use) don’t routinely commit mass murder.
These stories are rare, but they capture the attention of the media in a way that common gun deaths in our inner cities do not. And they play out in a stereotyped way, regardless of how little we know: Mental health advocates use these examples to lobby for more involuntary care – “treatment before tragedy” in a population that does not recognize their own mental illnesses. Such incidents lead to calls to medicate every person with a psychotic illness, because that person may be the next killer, even though half of mass murderers don’t have mental disorders, and even though violence, in general, is more often caused by anger, substance abuse, and a history of exposure to violence. The plea for involuntary care goes out to a nation where voluntary care is often inaccessible to those who want it, where beds are scarce, where insurers – and not doctors – decide who can be hospitalized and for how long. One can only hope that if this young man was obviously dangerous, the hospital that evaluated him would not have discharged him, and that the police would not have returned his firearm. Predicting violence may seem plausible in retrospect, but it’s not always that obvious.
As more of the stereotyped response, antipsychiatry groups often assume mass murderers have been treated with psychotropic medications and use these events as one more example of how psychiatry is causing violence, suicide, and disability for unsuspecting souls who would have fared better without our interventions.
Among psychiatrists ourselves, these stories set off questions and fears. Why did a hospital release this patient? Was he given medications and follow up? What kind of follow up is even available in Alaska? Was he released because he’d taken medication that helped him, because a substance-induced psychosis cleared, or because he refused treatment and was not felt to be dangerous? Or was he released because he had no insurance, or because his insurance company refused to pay for continued treatment? Was a terrible outcome the result of negligence, or was the act of violence something that could not have been predicted? And finally, is the psychiatrist liable? The stock value for crystal balls rises, and we all wonder how we can know – and document – that our patients are safe, as it’s not unusual for distressed people to express violent fantasies. All of us have treated patients who have delusions – how many of those patients have gone on to become mass murderers? Have you ever treated a college student with depression, anxiety, and disturbing thoughts? Did he shoot 70 people in a movie theater and wire his apartment with explosives?
Finally, I’d like to share some concerns I have. First, before we talk about involuntary care to prevent such tragedies as those that happened in Fort Lauderdale last week, we need to be sure that everyone in our nation has access to high-quality, comprehensive psychiatric services, especially our veterans. In the plea for more forced psychiatric care, I believe we’ve become careless and disengaged. Patient rights’ groups have instituted barriers to involuntary treatment, while mental health advocates have touted the impossibility of convincing patients with anosognosia – an inability to see that they suffer from an illness – into accepting psychiatric treatment. Insurers chime in by managing benefits such that patients can be admitted only if they are dangerous, even if they are very sick and want to be in the hospital.
We need to use some commonsense: Patients with psychiatric disorders need to be offered voluntary care in much the same way that patients with other illnesses are approached. If someone in an ED refuses treatment for cancer or an MI, we don’t just say so be it, goodbye. Doctors cajole; they call family; they explain the risks and try quite hard to get the patient to accept help.
In psychiatry, we have stories where patients are asked if they are dangerous, and when they say no, they are sent out, without any further effort to engage them. Psychosis is often a tormenting state, and while patients may not be aware they have an illness, they can often be convinced to come into a hospital for respite, or to take medication to soothe the anxiety that accompanies paranoia or allow for restful sleep. Not everyone is beyond engagement, and the issue needs to be one of what is the best interests of any given patient – with involuntary care only as a true last resort– and not one of preventing mass murders.
Dr. Miller is coauthor of “Committed: The Battle Over Involuntary Care,” which was released last fall (Baltimore: Johns Hopkins University Press).
Once again, there has been another senseless tragedy: a mass murder that leaves us all feeling vulnerable.
Last Friday, a gunman flew from Anchorage, Alaska, to Florida; retrieved a gun from his checked baggage; and opened fire on total strangers in the baggage claim area of the Fort Lauderdale airport, killing five people and wounding eight others. Why? The media always find a few facts that leave the public to piece together a theory that may or may not hold true.
I heard about the shooting while I was on vacation: The suspected gunman reportedly had visited ISIS websites and was killed at the scene. Later, I saw that he was not a terrorist and was not killed but had been taken into custody without a struggle.
The next reports noted that the 26-year-old man is a former soldier who had served in Iraq, and had come back traumatized and with psychological issues, according to his brother – or, according to what the media say his brother said, since the facts are sometimes selectively reported.
It was then announced that the gunman had gone to the FBI and reported that he was having concerns that U.S. intelligence agencies were infiltrating his brain and commanding him to look at ISIS websites. The FBI sent him for a psychiatric evaluation. His gun was taken by police; he spent a few days in the hospital, and had been released. Soon after, his firearm was returned, and he used it to commit a mass shooting.
So the story started as a terror attack and moved to the media’s default explanation for mass murder – mental illness. These few facts may be pieced together to tell a story of a man who was changed by war, struggled with posttraumatic symptoms that left him angry, and at some point, had a psychotic break that led him to fly across the continent and kill strangers at an airport in response to a command delusion. That’s one possible story that could be written with the very few facts we have.
My best guess is that as facts unfold, the story will change. Even if this story is right, one has to wonder why so many other young soldiers who return from military service so damaged, who also may coincidentally develop psychotic illnesses (or psychosis related to drug use) don’t routinely commit mass murder.
These stories are rare, but they capture the attention of the media in a way that common gun deaths in our inner cities do not. And they play out in a stereotyped way, regardless of how little we know: Mental health advocates use these examples to lobby for more involuntary care – “treatment before tragedy” in a population that does not recognize their own mental illnesses. Such incidents lead to calls to medicate every person with a psychotic illness, because that person may be the next killer, even though half of mass murderers don’t have mental disorders, and even though violence, in general, is more often caused by anger, substance abuse, and a history of exposure to violence. The plea for involuntary care goes out to a nation where voluntary care is often inaccessible to those who want it, where beds are scarce, where insurers – and not doctors – decide who can be hospitalized and for how long. One can only hope that if this young man was obviously dangerous, the hospital that evaluated him would not have discharged him, and that the police would not have returned his firearm. Predicting violence may seem plausible in retrospect, but it’s not always that obvious.
As more of the stereotyped response, antipsychiatry groups often assume mass murderers have been treated with psychotropic medications and use these events as one more example of how psychiatry is causing violence, suicide, and disability for unsuspecting souls who would have fared better without our interventions.
Among psychiatrists ourselves, these stories set off questions and fears. Why did a hospital release this patient? Was he given medications and follow up? What kind of follow up is even available in Alaska? Was he released because he’d taken medication that helped him, because a substance-induced psychosis cleared, or because he refused treatment and was not felt to be dangerous? Or was he released because he had no insurance, or because his insurance company refused to pay for continued treatment? Was a terrible outcome the result of negligence, or was the act of violence something that could not have been predicted? And finally, is the psychiatrist liable? The stock value for crystal balls rises, and we all wonder how we can know – and document – that our patients are safe, as it’s not unusual for distressed people to express violent fantasies. All of us have treated patients who have delusions – how many of those patients have gone on to become mass murderers? Have you ever treated a college student with depression, anxiety, and disturbing thoughts? Did he shoot 70 people in a movie theater and wire his apartment with explosives?
Finally, I’d like to share some concerns I have. First, before we talk about involuntary care to prevent such tragedies as those that happened in Fort Lauderdale last week, we need to be sure that everyone in our nation has access to high-quality, comprehensive psychiatric services, especially our veterans. In the plea for more forced psychiatric care, I believe we’ve become careless and disengaged. Patient rights’ groups have instituted barriers to involuntary treatment, while mental health advocates have touted the impossibility of convincing patients with anosognosia – an inability to see that they suffer from an illness – into accepting psychiatric treatment. Insurers chime in by managing benefits such that patients can be admitted only if they are dangerous, even if they are very sick and want to be in the hospital.
We need to use some commonsense: Patients with psychiatric disorders need to be offered voluntary care in much the same way that patients with other illnesses are approached. If someone in an ED refuses treatment for cancer or an MI, we don’t just say so be it, goodbye. Doctors cajole; they call family; they explain the risks and try quite hard to get the patient to accept help.
In psychiatry, we have stories where patients are asked if they are dangerous, and when they say no, they are sent out, without any further effort to engage them. Psychosis is often a tormenting state, and while patients may not be aware they have an illness, they can often be convinced to come into a hospital for respite, or to take medication to soothe the anxiety that accompanies paranoia or allow for restful sleep. Not everyone is beyond engagement, and the issue needs to be one of what is the best interests of any given patient – with involuntary care only as a true last resort– and not one of preventing mass murders.
Dr. Miller is coauthor of “Committed: The Battle Over Involuntary Care,” which was released last fall (Baltimore: Johns Hopkins University Press).
Fecal transplant efficacy for Clostridium difficile infections
Clinical question: Is fecal microbiota transplantation (FMT) an efficacious and safe treatment approach for patients with recurrent Clostridium difficile infection (CDI)?
Background: FMT restores the normal composition of gut microbiota and is recommended when antibiotics fail to clear CDI. To date, only case series and open-labeled clinical trials support the use of FMT.
Study design: Randomized, controlled, double-blinded clinical trial.
Setting: Academic medical centers.
The primary endpoint was resolution of diarrhea without anti-CDI therapy after 8 weeks of follow-up. In the donor FMT group, 90.9% achieved clinical cure, compared with 62.5% in the autologous group. Patients who developed recurrent CDI were free of further disease after subsequent donor FMT.
The study included only patients who experienced three or more recurrences but excluded immunocompromised and older patients (older than 75 years of age).
Bottom line: Donor stool administered via colonoscopy was more effective than autologous FMT in preventing further CDI episodes.
Citation: Kelly CR, Khoruts A, Staley C, et al. Effect of fecal microbiota transplantation on recurrence in multiply recurrent Clostridium difficile infection: a randomized trial. Ann Intern Med. 2016;165(9):609-616.
Dr. Fernandez de la Vara is an instructor at the University of Miami Miller School of Medicine and chief medical resident at the University of Miami Hospital.
Healing of Leg Ulcers Associated With Granulomatosis With Polyangiitis (Wegener Granulomatosis) After Rituximab Therapy
To the Editor:
A 52-year-old woman with a history of arthralgia, rhinitis, sinusitis, and episodic epistaxis was admitted to the hospital with multiple nonhealing severe leg ulcerations. She noticed subcutaneous nodules on the legs 6 months prior to the development of ulcers. The lesions progressed from subcutaneous nodules to red-black skin discoloration, blister formation, and eventually ulceration. Over a period of months, the ulcers were treated with several courses of antibiotics and wound care including a single surgical debridement of one of the ulcers on the dorsum of the right foot. These interventions did not make a remarkable impact on ulcer healing.
On physical examination, the patient had scattered 4- to 5-mm palpable purpura on the knees, elbows, and feet bilaterally. She had multiple 1- to 8-cm indurated purple ulcerations with friable surfaces and raised irregular borders on the feet, toes, and lower legs bilaterally (Figure, A–C). One notably larger ulcer was found on the anterior aspect of the left thigh (Figure, A). Scattered 5- to 15-mm eschars were present on the legs bilaterally. She also had multiple large, firm, nonerythematous dermal plaques on the thighs bilaterally that measured several centimeters. There were no oral mucosal lesions and no ulcerations above the waist.
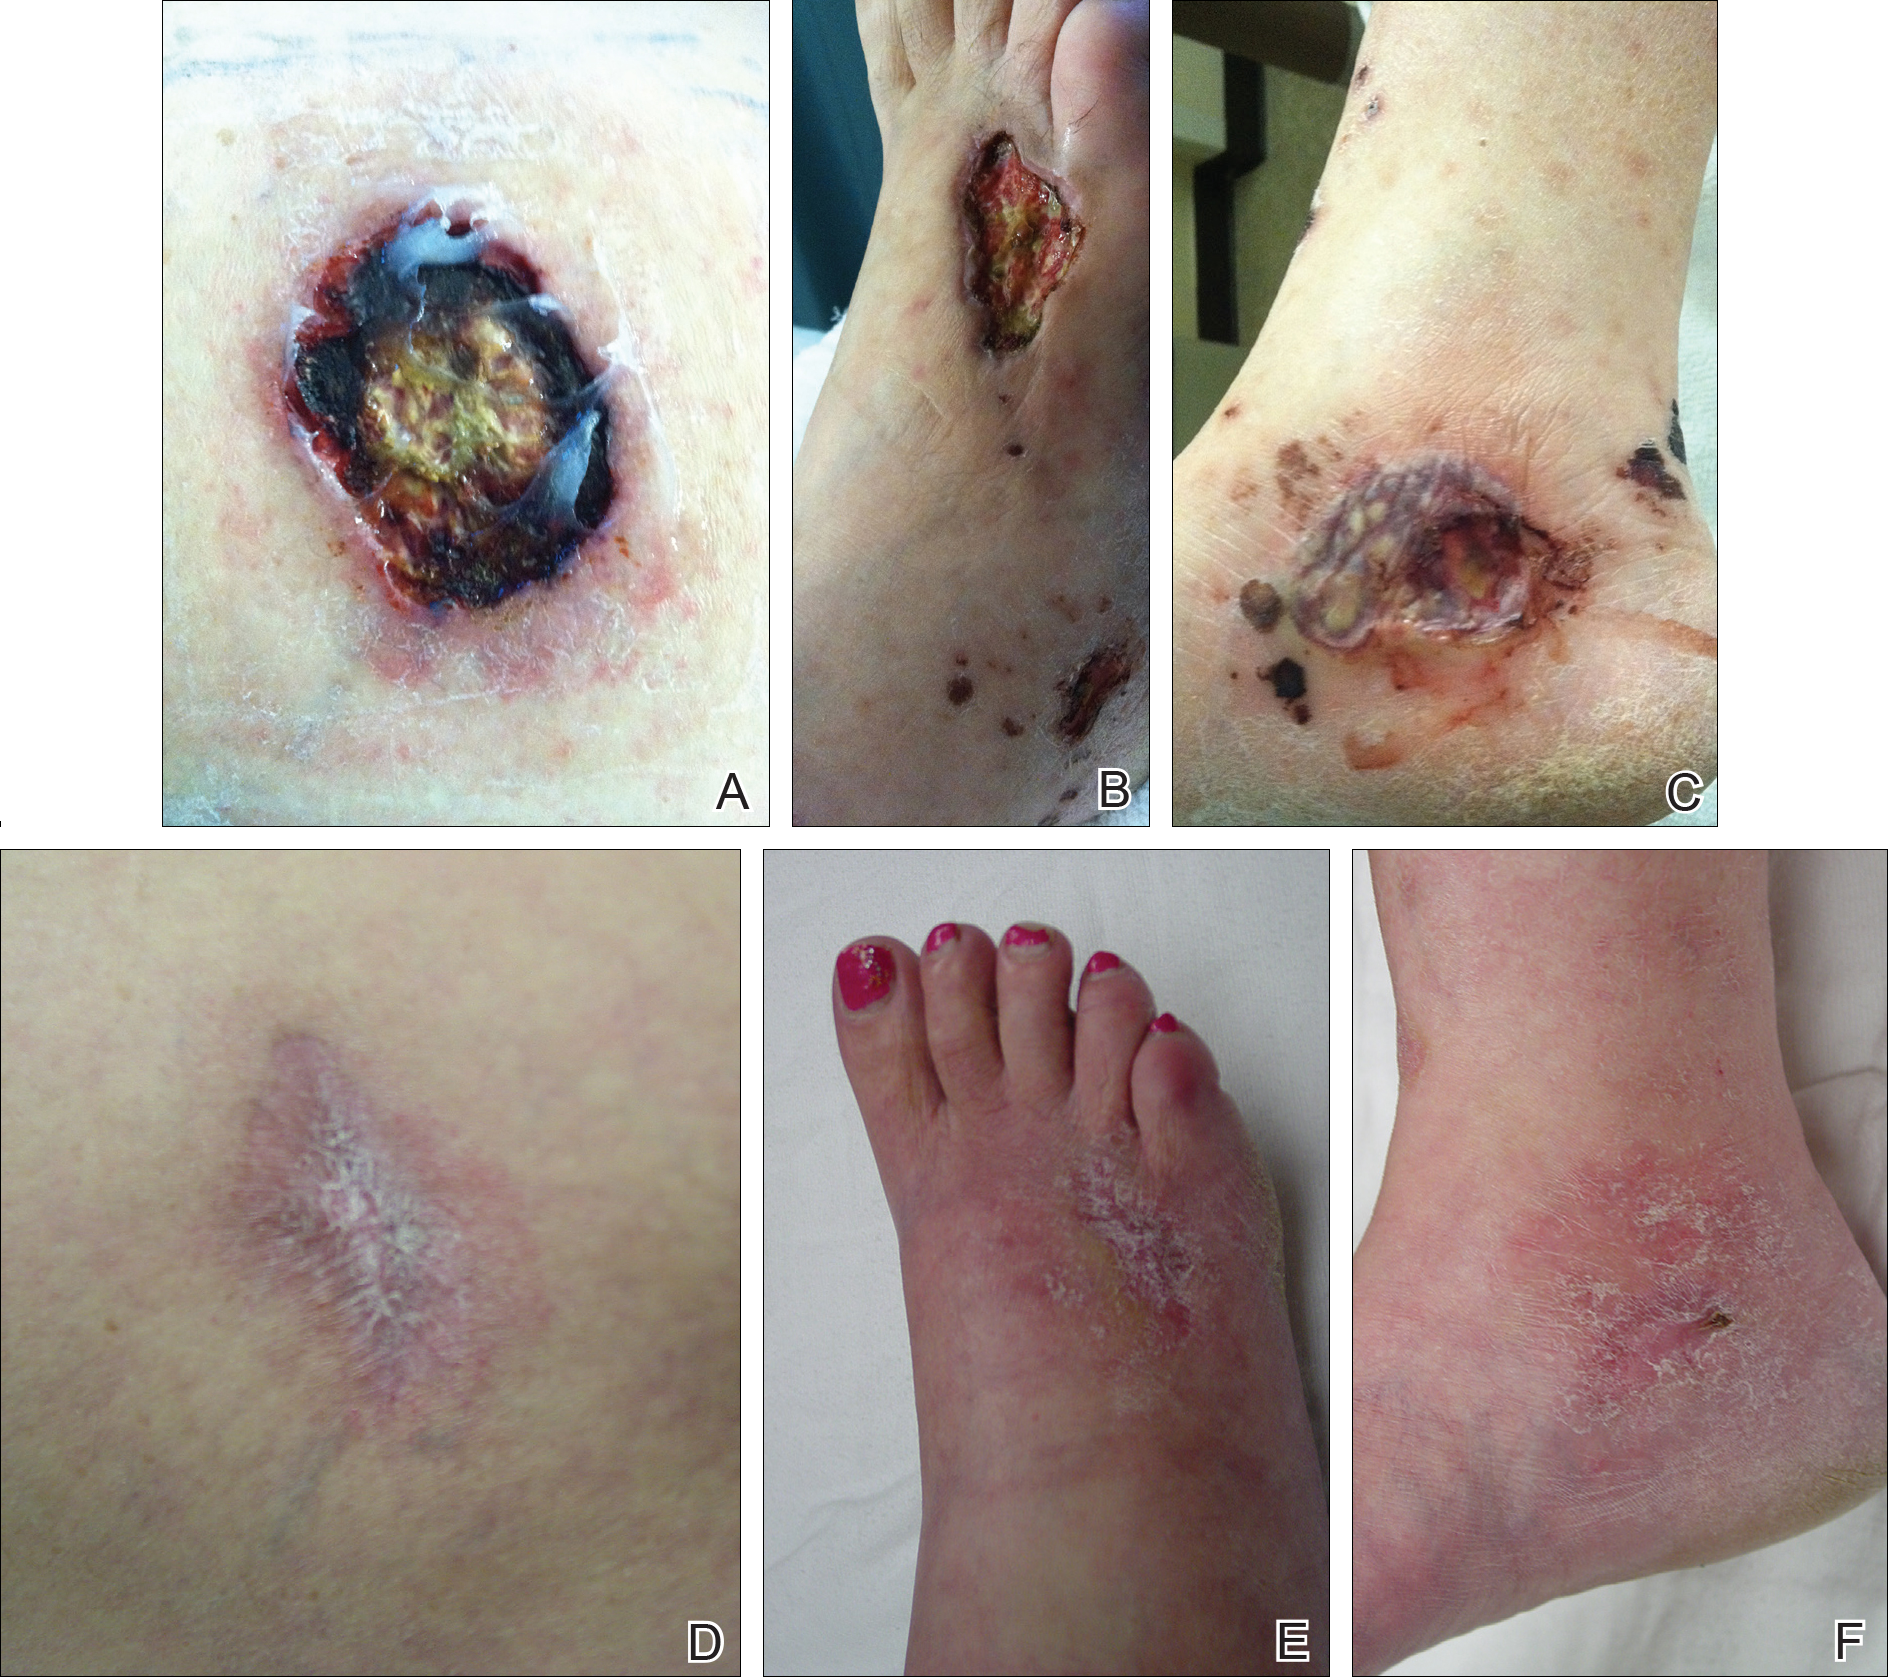
Magnetic resonance imaging of the foot showed some surrounding cellulitis but no osteomyelitis. Chest radiograph and computed tomography revealed bilateral apical nodules. Proteinase 3–antineutrophil cytoplasmic antibody (PR3-ANCA) testing was positive. Serum complement levels were normal. An antinuclear antibody test and rheumatoid factor were both negative. Skin biopsies were obtained from the thigh ulcer, foot ulcer, and purpuric lesions on the right knee. The results demonstrated leukocytoclastic vasculitis and neutrophilic small vessel vasculitis with necrotizing neutrophilic dermatitis and panniculitis. Granulomatosis with polyangiitis (GPA) was diagnosed based on these findings.
Initial inpatient treatment included intravenous methylprednisolone (100 mg every 8 hours for 3 doses), followed by oral prednisone 60 mg daily. Two weeks later the ulcers were reevaluated and only mild improvement had occurred with the steroids. Therefore, rituximab (RTX) was initiated at 375 mg/m2 (700 mg) intravenously once weekly for 4 weeks. After 3 doses of RTX, the ulcerations were healing dramatically and the treatment was well tolerated. A rapid prednisone taper was started, and the patient received her fourth and final dose of RTX. Two months after the initial infusion, the thigh ulcer and most of the ulcerations on the feet and lower legs had almost completely resolved. Photographs were taken 5 months after initial RTX infusion (Figure, D–F). A chest radiograph 4 months after initial RTX infusion showed resolution of lung nodules. Two months after RTX induction therapy, azathioprine was added for maintenance but was stopped due to poor tolerance. Oral methotrexate 17.5 mg once weekly was added 5 months after RTX for maintenance and was well tolerated. At that time the prednisone dose was 10 mg daily and was successfully tapered to 5 mg by 9 months after RTX induction therapy.
Granulomatosis with polyangiitis (Wegener granulomatosis) is a granulomatous small- and medium-sized vessel vasculitis that traditionally affects the upper and lower respiratory tract and kidneys.1 Skin lesions also are quite common and include palpable purpura, ulcers, vesicles, papules, and subcutaneous nodules. Patients with active GPA also tend to have ANCAs directed against proteinase 3 (PR3-ANCA). Although GPA was once considered a fatal disease, treatment with cyclophosphamide combined with corticosteroids has been shown to substantially improve outcomes.1 Rituximab, a chimeric monoclonal anti-CD20 antibody, works by depleting B lymphocytes and has been used with success to treat diseases such as lymphoma and rheumatoid arthritis.2,3 The US Food and Drug Administration approved RTX for GPA and microscopic polyangiitis in 2011, with a number of trials supporting its efficacy.4
The success of RTX in treating GPA has been documented in case reports as well as several trials with extended follow-up. A single-center observational study of 53 patients showed that RTX was safe and effective for induction and maintenance of remission in patients with refractory GPA. This study also uncovered the potential for predicting relapse based on following B cell and ANCA levels and preventing relapse by initializing further treatment.5 Other small studies and case reports have shown similar success using RTX for refractory GPA.6-10 These studies included various combinations of concurrent therapies and various follow-up intervals. The Rituximab in ANCA-Associated Vasculitis (RAVE) trial compared RTX versus cyclophosphamide for ANCA-positive vasculitis.11 This multicenter, randomized, double-blind study found that RTX was as efficacious as cyclophosphamide for induction of remission in severe GPA.The data also suggested that RTX may be superior for relapsing disease.11 Another multicenter, open-label, randomized trial (RITUXVAS) compared RTX to cyclophosphamide in ANCA-associated renal vasculitis. This trial also found the 2 treatments to be similar in both efficacy in inducing remission and adverse events.12
Some conflicting reports have appeared on the effectiveness of using RTX for the granulomatous versus vasculitic manifestations of GPA. Aires et al13 showed failure of improvement in most patients with granulomatous manifestations of GPA in a study of 8 patients. A retrospective study including 59 patients who were treated with RTX also showed that complete remission was more common in patients with primarily vasculitic manifestations, not granulomatous manifestations.14 However, some case series that included patients with refractory ophthalmic GPA, a primarily granulomatous manifestation, have found success using RTX.15,16 More studies are needed to determine if there truly is a difference and whether this difference has an effect on when to use RTX. The skin lesions our patient demonstrated were due to the vasculitic component of the disease, and consequently, the rapid and complete response we observed would be consistent with the premise that the therapy works best for vasculitis.
Most of the trials assessing the efficacy of RTX utilize a tool such as the Wegener granulomatosis-specific Birmingham Vasculitis Activity Score.17 This measure of treatment response does include a skin item, but it is part of the composite response score. Consequently, a specific statement regarding skin improvement cannot be made. Additionally, little is reported pertaining to the treatment of skin-related findings in GPA. One report did specifically address the treatment of dermatologic manifestations of GPA utilizing systemic tacrolimus with oral prednisone successfully in 1 patient with GPA and a history of recurrent lower extremity nodules and ulcers.18 The efficacy of RTX in limited GPA was good in a small study of 8 patients. However, the study had only 1 patient with purpura and 1 patient with a subcutaneous nodule.19 Several other case series and studies have included patients with various cutaneous findings associated with GPA.5-7,9,11 However, they did not comment specifically on skin response to treatment, and the focus appeared to be on other organ system involvement. One case series did report improvement of lower extremity gangrene with RTX therapy for ANCA-associated vasculitis.8 Our report demonstrates a case of severe skin disease that responded well to RTX. It is common to have various skin findings in GPA, and our patient presented with notable skin disease. Although skin findings may not be the more life-threatening manifestations of the disease, they can be quite debilitating, as shown in our case report.
Our patient with notable leg ulcerations required hospitalization due to GPA and received RTX in addition to corticosteroids for treatment. We observed a rapid and dramatic improvement in the skin findings, which seemed to exceed expectations from steroids alone. The other manifestations of the disease including lung nodules also improved. Although cyclophosphamide and corticosteroids have been quite successful in induction of remission, cyclophosphamide is not without serious adverse effects. There also are some patients who have contraindications to cyclophosphamide or do not see successful results. In our brief review of the literature, RTX, a B cell–depleting antibody, has shown to have success in treating refractory and severe GPA. There is little reported specifically about treating the skin manifestations of GPA. A few studies and case reports mention skin findings but do not comment on the success of RTX in treating them. Although the severity of other organ involvement in GPA may take precedence, the skin findings can be quite debilitating, as in our patient. Patients with GPA and notable skin findings may benefit from RTX, and it would be beneficial to include these results in future studies using RTX to treat GPA.
- Hoffman GS, Kerr GS, Leavitt RY, et al. Wegener granulomatosis: an analysis of 158 patients. Ann Intern Med. 1992;116:488-498.
- Plosker GL, Figgitt DP. Rituximab: a review of its use in non-Hodgkin’s lymphoma and chronic lymphocytic leukaemia. Drugs. 2003;63:803-843.
- Cohen SB, Emery P, Greenwald MW, et al. Rituximab for rheumatoid arthritis refractory to anti-tumor necrosis factor therapy: results of a multicenter, randomized, double-blind, placebo-controlled, phase III trial evaluating primary efficacy and safety at twenty-four weeks. Arthritis Rheum. 2006;54:2793-2806.
- FDA approves Rituxan to treat two rare disorders [news release]. Silver Spring, MD: US Food and Drug Administration; April 19, 2011. http://www.fda.gov/NewsEvents/Newsroom/PressAnnouncements/ucm251946.htm. Accessed January 6, 2017.
- Cartin-Ceba R, Golbin JM, Keogh KA, et al. Rituximab for remission induction and maintenance in refractory granulomatosis with polyangiitis (Wegener’s): ten-year experience at a single center. Arthritis Rheum. 2012;64:3770-3778.
- Keogh KA, Ytterberg SR, Fervenza FC, et al. Rituximab for refractory Wegener’s granulomatosis: report of a prospective, open-label pilot trial. Am J Respir Crit Care Med. 2006;173:180-187.
- Dalkilic E, Alkis N, Kamali S. Rituximab as a new therapeutic option in granulomatosis with polyangiitis: a report of two cases. Mod Rheumatol. 2012;22:463-466.
- Eriksson P. Nine patients with anti-neutrophil cytoplasmic antibody-positive vasculitis successfully treated with rituximab. J Intern Med. 2005;257:540-548.
- Oristrell J, Bejarano G, Jordana R, et al. Effectiveness of rituximab in severe Wegener’s granulomatosis: report of two cases and review of the literature. Open Respir Med J. 2009;3:94-99.
- Martinez Del Pero M, Chaudhry A, Jones RB, et al. B-cell depletion with rituximab for refractory head and neck Wegener’s granulomatosis: a cohort study. Clin Otolaryngol. 2009;34:328-335.
- Stone JH, Merkel PA, Spiera R, et al. Rituximab versus cyclophosphamide for ANCA-associated vasculitis. N Engl J Med. 2010;363:221-232.
- Jones RB, Tervaert JW, Hauser T, et al. Rituximab versus cyclophosphamide in ANCA-associated renal vasculitis. N Engl J Med. 2010;363:211-220.
- Aries PM, Hellmich B, Voswinkel J, et al. Lack of efficacy of rituximab in Wegener’s granulomatosis with refractory granulomatous manifestations. Ann Rheum Dis. 2006;65:853-858.
- Holle JU, Dubrau C, Herlyn K, et al. Rituximab for refractory granulomatosis with polyangiitis (Wegener’s granulomatosis): comparison of efficacy in granulomatous versus vasculitic manifestations. Ann Rheum Dis. 2012;71:327-333.
- Taylor SR, Salama AD, Joshi L, et al. Rituximab is effective in the treatment of refractory ophthalmic Wegener’s granulomatosis. Arthritis Rheum. 2009;60:1540-1547.
- Joshi L, Lightman SL, Salama AD, et al. Rituximab in refractory ophthalmic Wegener’s granulomatosis: PR3 titers may predict relapse, but repeat treatment can be effective. Ophthalmol. 2011;118:2498-2503.
- Stone JH, Hoffman GS, Merkel PA, et al. A disease-specific activity index for Wegener’s granulomatosis: modification of the Birmingham Vasculitis Activity Score. International Network for the Study of the Systemic Vasculitides (INSSYS). Arthritis Rheum. 2001;44:912-920.
- Wenzel J, Montag S, Wilsmann-Theis D, et al. Successful treatment of recalcitrant Wegener’s granulomatosis of the skin with tacrolimus (Prograf). Br J Dermatol. 2004;151:927-928.
- Seo P, Specks U, Keogh KA. Efficacy of rituximab in limited Wegener’s granulomatosis with refractory granulomatous manifestations. J Rheumatol. 2008;35:2017-2023.
To the Editor:
A 52-year-old woman with a history of arthralgia, rhinitis, sinusitis, and episodic epistaxis was admitted to the hospital with multiple nonhealing severe leg ulcerations. She noticed subcutaneous nodules on the legs 6 months prior to the development of ulcers. The lesions progressed from subcutaneous nodules to red-black skin discoloration, blister formation, and eventually ulceration. Over a period of months, the ulcers were treated with several courses of antibiotics and wound care including a single surgical debridement of one of the ulcers on the dorsum of the right foot. These interventions did not make a remarkable impact on ulcer healing.
On physical examination, the patient had scattered 4- to 5-mm palpable purpura on the knees, elbows, and feet bilaterally. She had multiple 1- to 8-cm indurated purple ulcerations with friable surfaces and raised irregular borders on the feet, toes, and lower legs bilaterally (Figure, A–C). One notably larger ulcer was found on the anterior aspect of the left thigh (Figure, A). Scattered 5- to 15-mm eschars were present on the legs bilaterally. She also had multiple large, firm, nonerythematous dermal plaques on the thighs bilaterally that measured several centimeters. There were no oral mucosal lesions and no ulcerations above the waist.
Magnetic resonance imaging of the foot showed some surrounding cellulitis but no osteomyelitis. Chest radiograph and computed tomography revealed bilateral apical nodules. Proteinase 3–antineutrophil cytoplasmic antibody (PR3-ANCA) testing was positive. Serum complement levels were normal. An antinuclear antibody test and rheumatoid factor were both negative. Skin biopsies were obtained from the thigh ulcer, foot ulcer, and purpuric lesions on the right knee. The results demonstrated leukocytoclastic vasculitis and neutrophilic small vessel vasculitis with necrotizing neutrophilic dermatitis and panniculitis. Granulomatosis with polyangiitis (GPA) was diagnosed based on these findings.
Initial inpatient treatment included intravenous methylprednisolone (100 mg every 8 hours for 3 doses), followed by oral prednisone 60 mg daily. Two weeks later the ulcers were reevaluated and only mild improvement had occurred with the steroids. Therefore, rituximab (RTX) was initiated at 375 mg/m2 (700 mg) intravenously once weekly for 4 weeks. After 3 doses of RTX, the ulcerations were healing dramatically and the treatment was well tolerated. A rapid prednisone taper was started, and the patient received her fourth and final dose of RTX. Two months after the initial infusion, the thigh ulcer and most of the ulcerations on the feet and lower legs had almost completely resolved. Photographs were taken 5 months after initial RTX infusion (Figure, D–F). A chest radiograph 4 months after initial RTX infusion showed resolution of lung nodules. Two months after RTX induction therapy, azathioprine was added for maintenance but was stopped due to poor tolerance. Oral methotrexate 17.5 mg once weekly was added 5 months after RTX for maintenance and was well tolerated. At that time the prednisone dose was 10 mg daily and was successfully tapered to 5 mg by 9 months after RTX induction therapy.
Granulomatosis with polyangiitis (Wegener granulomatosis) is a granulomatous small- and medium-sized vessel vasculitis that traditionally affects the upper and lower respiratory tract and kidneys.1 Skin lesions also are quite common and include palpable purpura, ulcers, vesicles, papules, and subcutaneous nodules. Patients with active GPA also tend to have ANCAs directed against proteinase 3 (PR3-ANCA). Although GPA was once considered a fatal disease, treatment with cyclophosphamide combined with corticosteroids has been shown to substantially improve outcomes.1 Rituximab, a chimeric monoclonal anti-CD20 antibody, works by depleting B lymphocytes and has been used with success to treat diseases such as lymphoma and rheumatoid arthritis.2,3 The US Food and Drug Administration approved RTX for GPA and microscopic polyangiitis in 2011, with a number of trials supporting its efficacy.4
The success of RTX in treating GPA has been documented in case reports as well as several trials with extended follow-up. A single-center observational study of 53 patients showed that RTX was safe and effective for induction and maintenance of remission in patients with refractory GPA. This study also uncovered the potential for predicting relapse based on following B cell and ANCA levels and preventing relapse by initializing further treatment.5 Other small studies and case reports have shown similar success using RTX for refractory GPA.6-10 These studies included various combinations of concurrent therapies and various follow-up intervals. The Rituximab in ANCA-Associated Vasculitis (RAVE) trial compared RTX versus cyclophosphamide for ANCA-positive vasculitis.11 This multicenter, randomized, double-blind study found that RTX was as efficacious as cyclophosphamide for induction of remission in severe GPA.The data also suggested that RTX may be superior for relapsing disease.11 Another multicenter, open-label, randomized trial (RITUXVAS) compared RTX to cyclophosphamide in ANCA-associated renal vasculitis. This trial also found the 2 treatments to be similar in both efficacy in inducing remission and adverse events.12
Some conflicting reports have appeared on the effectiveness of using RTX for the granulomatous versus vasculitic manifestations of GPA. Aires et al13 showed failure of improvement in most patients with granulomatous manifestations of GPA in a study of 8 patients. A retrospective study including 59 patients who were treated with RTX also showed that complete remission was more common in patients with primarily vasculitic manifestations, not granulomatous manifestations.14 However, some case series that included patients with refractory ophthalmic GPA, a primarily granulomatous manifestation, have found success using RTX.15,16 More studies are needed to determine if there truly is a difference and whether this difference has an effect on when to use RTX. The skin lesions our patient demonstrated were due to the vasculitic component of the disease, and consequently, the rapid and complete response we observed would be consistent with the premise that the therapy works best for vasculitis.
Most of the trials assessing the efficacy of RTX utilize a tool such as the Wegener granulomatosis-specific Birmingham Vasculitis Activity Score.17 This measure of treatment response does include a skin item, but it is part of the composite response score. Consequently, a specific statement regarding skin improvement cannot be made. Additionally, little is reported pertaining to the treatment of skin-related findings in GPA. One report did specifically address the treatment of dermatologic manifestations of GPA utilizing systemic tacrolimus with oral prednisone successfully in 1 patient with GPA and a history of recurrent lower extremity nodules and ulcers.18 The efficacy of RTX in limited GPA was good in a small study of 8 patients. However, the study had only 1 patient with purpura and 1 patient with a subcutaneous nodule.19 Several other case series and studies have included patients with various cutaneous findings associated with GPA.5-7,9,11 However, they did not comment specifically on skin response to treatment, and the focus appeared to be on other organ system involvement. One case series did report improvement of lower extremity gangrene with RTX therapy for ANCA-associated vasculitis.8 Our report demonstrates a case of severe skin disease that responded well to RTX. It is common to have various skin findings in GPA, and our patient presented with notable skin disease. Although skin findings may not be the more life-threatening manifestations of the disease, they can be quite debilitating, as shown in our case report.
Our patient with notable leg ulcerations required hospitalization due to GPA and received RTX in addition to corticosteroids for treatment. We observed a rapid and dramatic improvement in the skin findings, which seemed to exceed expectations from steroids alone. The other manifestations of the disease including lung nodules also improved. Although cyclophosphamide and corticosteroids have been quite successful in induction of remission, cyclophosphamide is not without serious adverse effects. There also are some patients who have contraindications to cyclophosphamide or do not see successful results. In our brief review of the literature, RTX, a B cell–depleting antibody, has shown to have success in treating refractory and severe GPA. There is little reported specifically about treating the skin manifestations of GPA. A few studies and case reports mention skin findings but do not comment on the success of RTX in treating them. Although the severity of other organ involvement in GPA may take precedence, the skin findings can be quite debilitating, as in our patient. Patients with GPA and notable skin findings may benefit from RTX, and it would be beneficial to include these results in future studies using RTX to treat GPA.
- Hoffman GS, Kerr GS, Leavitt RY, et al. Wegener granulomatosis: an analysis of 158 patients. Ann Intern Med. 1992;116:488-498.
- Plosker GL, Figgitt DP. Rituximab: a review of its use in non-Hodgkin’s lymphoma and chronic lymphocytic leukaemia. Drugs. 2003;63:803-843.
- Cohen SB, Emery P, Greenwald MW, et al. Rituximab for rheumatoid arthritis refractory to anti-tumor necrosis factor therapy: results of a multicenter, randomized, double-blind, placebo-controlled, phase III trial evaluating primary efficacy and safety at twenty-four weeks. Arthritis Rheum. 2006;54:2793-2806.
- FDA approves Rituxan to treat two rare disorders [news release]. Silver Spring, MD: US Food and Drug Administration; April 19, 2011. http://www.fda.gov/NewsEvents/Newsroom/PressAnnouncements/ucm251946.htm. Accessed January 6, 2017.
- Cartin-Ceba R, Golbin JM, Keogh KA, et al. Rituximab for remission induction and maintenance in refractory granulomatosis with polyangiitis (Wegener’s): ten-year experience at a single center. Arthritis Rheum. 2012;64:3770-3778.
- Keogh KA, Ytterberg SR, Fervenza FC, et al. Rituximab for refractory Wegener’s granulomatosis: report of a prospective, open-label pilot trial. Am J Respir Crit Care Med. 2006;173:180-187.
- Dalkilic E, Alkis N, Kamali S. Rituximab as a new therapeutic option in granulomatosis with polyangiitis: a report of two cases. Mod Rheumatol. 2012;22:463-466.
- Eriksson P. Nine patients with anti-neutrophil cytoplasmic antibody-positive vasculitis successfully treated with rituximab. J Intern Med. 2005;257:540-548.
- Oristrell J, Bejarano G, Jordana R, et al. Effectiveness of rituximab in severe Wegener’s granulomatosis: report of two cases and review of the literature. Open Respir Med J. 2009;3:94-99.
- Martinez Del Pero M, Chaudhry A, Jones RB, et al. B-cell depletion with rituximab for refractory head and neck Wegener’s granulomatosis: a cohort study. Clin Otolaryngol. 2009;34:328-335.
- Stone JH, Merkel PA, Spiera R, et al. Rituximab versus cyclophosphamide for ANCA-associated vasculitis. N Engl J Med. 2010;363:221-232.
- Jones RB, Tervaert JW, Hauser T, et al. Rituximab versus cyclophosphamide in ANCA-associated renal vasculitis. N Engl J Med. 2010;363:211-220.
- Aries PM, Hellmich B, Voswinkel J, et al. Lack of efficacy of rituximab in Wegener’s granulomatosis with refractory granulomatous manifestations. Ann Rheum Dis. 2006;65:853-858.
- Holle JU, Dubrau C, Herlyn K, et al. Rituximab for refractory granulomatosis with polyangiitis (Wegener’s granulomatosis): comparison of efficacy in granulomatous versus vasculitic manifestations. Ann Rheum Dis. 2012;71:327-333.
- Taylor SR, Salama AD, Joshi L, et al. Rituximab is effective in the treatment of refractory ophthalmic Wegener’s granulomatosis. Arthritis Rheum. 2009;60:1540-1547.
- Joshi L, Lightman SL, Salama AD, et al. Rituximab in refractory ophthalmic Wegener’s granulomatosis: PR3 titers may predict relapse, but repeat treatment can be effective. Ophthalmol. 2011;118:2498-2503.
- Stone JH, Hoffman GS, Merkel PA, et al. A disease-specific activity index for Wegener’s granulomatosis: modification of the Birmingham Vasculitis Activity Score. International Network for the Study of the Systemic Vasculitides (INSSYS). Arthritis Rheum. 2001;44:912-920.
- Wenzel J, Montag S, Wilsmann-Theis D, et al. Successful treatment of recalcitrant Wegener’s granulomatosis of the skin with tacrolimus (Prograf). Br J Dermatol. 2004;151:927-928.
- Seo P, Specks U, Keogh KA. Efficacy of rituximab in limited Wegener’s granulomatosis with refractory granulomatous manifestations. J Rheumatol. 2008;35:2017-2023.
Practice Points
- Recognition of the dermatologic manifestations of granulomatosis with polyangiitis (GPA) may aid in an earlier diagnosis and appropriate treatment.
- Rituximab combined with corticosteroids may be a rapid and effective therapy for severe cutaneous ulcers related to GPA.
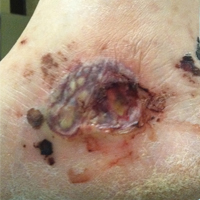
Resources and technologies are making teen drivers safer
SAN FRANCISCO – Clinicians and parents should capitalize on a variety of resources and new technologies that help keep teen drivers safe behind the wheel, according to Dr. Joseph O’Neil, a pediatrician at the Riley Hospital for Children in Indianapolis.
“As I like to share with parents, this is the one developmental milestone that parents really want their kids to have that is potentially lethal. This could really kill them,” he said at the annual meeting of the American Academy of Pediatrics. “Believe me, that’s a conversation stopper; they sort of look at you funny. But it’s true.”

“But there is some good news. We have been paying attention,” Dr. O’Neil said. Concerted safety efforts and campaigns led to a halving of young driver fatalities between 2005 and 2014, although a recent analysis suggesting a reversal of that trend has generated some concern.
Risk factors
Numerous factors increase the risk of crashes and deaths for teen drivers, beginning with their developmental stage, according to Dr. O’Neil. Youth are characterized by their striving for autonomy, impulsivity, risk taking, and greater susceptibility to peer influences, compounded by poor judgment of hazards.
“We know that their executive function is still improving, still maturing, They really don’t start getting to adult levels, if they ever do, until about 25,” he commented humorously.
Other risk factors include speeding, drinking and substance use, sleep deprivation, and distractions that range from cell phones, to eating and grooming, to all the gizmos on the dashboard today. Not wearing seat belts also plays a role, as teens are the age group least likely to buckle up, and risk rises with the number of young passengers in the vehicle.
The rate of fatal crashes among young drivers is more than twice as high at night, compared with during the day, with the hours of 9 p.m. to midnight being most hazardous. And the riskiest meteorologic conditions are, not surprisingly, snow and ice – something that parents should take into account in their typical rush to get driver’s education out of the way in the summer months, he said.
“Most of the evidence points to inexperience as probably the single most important risk factor because with inexperience, you’re going to use cell phones, you’re going to be distracted, you’re not going to be paying attention because you don’t have the experience to know that you should,” Dr. O’Neil said.
Graduated driver’s licenses
A key resource in addressing teen drivers’ inexperience and the fact that their crash rate is highest in their first year of driving are graduated driver licenses (GDLs). These licenses start with a learner’s permit mandating supervision and having many restrictions on conditions such as times when driving is permitted and number of passengers, and if there are no infractions, slowly lift these restrictions as the teen gains more driving experience, until he or she receives a full driver’s license.

Use of GDLs over the past 20 years or so been credited with a reduction of 10%-30% in the rate of motor vehicle fatalities among young teen drivers.
“The problem is that teens have smartened up; they are waiting until later, age 18, to start driving because they don’t want to go through the rigmarole of a GDL,” he said. “We know that that’s a problem because we have right shifted that curve, so we are not seeing as many 15- and 16-year-olds dying behind the wheel; we are seeing more of the 18- and 19-year-olds up to 25-year-olds.”
Clinicians should familiarize themselves with their state’s GDL, Dr. O’Neil recommended. As most states’ GDL laws end at age 18, legislators are now looking at options such as establishing a GDL requirement for all new drivers, regardless of age.
High-tech tools
Clinicians also should also be aware of a host of new high-tech tools designed to make teen drivers safer, often by extending parents’ supervisory role, Dr. O’Neil advised. “Your parents in your practices are going to ask you about these,” he said.
So-called black boxes on vehicles collect a wealth of data about driving and conditions inside the vehicle that can be made available to parents. If black boxes are used correctly, they can enable parents to give feedback to the young driver and reduce overall crash risk, he said.
New GPS monitors will track a vehicle’s speed and range, with an optional feature called geofencing whereby parents can prespecify geographic limits on where their teen driver can go. If the teen ventures outside those limits, the monitor sends a notification.
Video monitoring systems now on the market will record footage both inside and outside of the car. Some record continuously, whereas others capture only events. Parents can obtain a summary report, generally through a monthly subscription, delivered by telephone or email to see how their teen is driving when solo.
Other in-vehicle monitoring technologies include direct-feedback systems, such as the tones that sound when the driver fails to fasten his or her seat belt, changes lanes, or gets too close to another car. Some systems can be configured to send a text or email when these alerts are engaged.
Parents who want to be more proactive can, for certain vehicles, invest in smart keys that are programmed to control vehicle parameters, such as the vehicle speed or the volume on the radio, according to Dr. O’Neil.
Finally, downloadable apps for cell phones will block the user’s ability to call (except in an emergency), text, surf, and take selfies while driving. “This doesn’t mean the child won’t be able to use someone else’s phone, but it does do a nice job for that particular installation,” he commented.
Parent-teen driving agreements
“We’ve talked about a lot of neat things that are out there, but what it all boils down to in the end are the parents – mom and dad. Parents truly are the gatekeepers of the keys,” Dr. O’Neil asserted. “We know that they can have an influence on their teens’ behavior. Parents can set restrictions and regulations on driving, and make sure [teens] follow all the traffic laws and set limits on high-risk driving situations.”
However, parents often underestimate the risks that their teens take behind the wheel. “Everyone always thinks that it’s the other kid who’s going to be driving wildly,” he said. “It’s okay for us to say, ‘I know he’s a great kid, but it’s not the bad kids who get into crashes. All kids get into crashes,’” he said. “It’s important to remind parents that all kids are at risk.
“One of the most valuable things that we can do as physicians to help parents navigate these crazy waters is talk about parent-teen driving agreements or contracts,” Dr. O’Neil said. “This has been shown time and time again to have a positive effect on driving behavior.”
These agreements list rules and expectations, and consequences for breaking the rules. “Both mom and dad, and the teen sign it. You put your name on the line, and that’s important because that really means something. This is probably the first contract this kid will ever sign, and it’s probably the most important one that [the teen] will ever sign.” He recommended that a paper version of the agreement be placed in a prominent location, such as on the refrigerator door, for maximal effectiveness.
A variety of parent-teen driving agreements are available online through initiatives such as the Checkpoints Program, Parents Are the Key to Safe Teen Drivers, I Drive Safely, and the AAP’s Parent-Teen Driving Agreement. Overall, their use has been shown to reduce the risks of traffic violations and crashes by 40%-50%.
Of note, these contracts complement rather than replace GDLs. Additionally, “the law of the land doesn’t trump the law of reality and the law of physics,” Dr. O’Neil pointed out. “We know that the laws in our states are not really always best practice, so as we advocate for best practice laws, what we can do is let the parents set better limits on the teen’s driving.”
Anticipatory guidance
“I usually start talking [with families] about driving when the child is 12 or 13,” Dr. O’Neil said. “Anticipatory guidance does work. We know that for a lot of other things that we do, but parents often need help in trying to figure out what to do.”
He recommended the AAP’s Healthy Children website as a source of good information and resources, including a Young Driver Tool for parents. “This has been vetted through the PROS [Pediatric Research in Office Settings] network, and it has been shown that parents do use it, parents do like it,” he noted. “And really it makes your job easier, because it takes time to talk about all these risk factors, and you can say, ‘Hey, I want you to go look at this website for teen driving. This will help.’ ”
Clinicians should generally cover with families the various risk factors, limit setting, use of GDLs, and parent-teen driving agreements. “Talk to parents about all these things. Talk to the teen; the teen will listen to you; you are an authority figure,” and “use interventional motivational techniques,” he said.
As parents control the vehicle their child drives, they should be counseled to give their teen the family’s safest car, preferably a newer, mid- to full-size vehicle with a small engine and modern safety features, according to Dr. O’Neil. “And we really do try to discourage teens buying their own cars because that sort of limits the parents’ leverage over them when they are starting to drive.”
Clinicians also should familiarize themselves with the driver’s education and similar resources in their community, including safe-driving initiatives spearheaded by groups such as Mothers Against Drunk Driving (MADD). They also should work with schools and the police to support “risky driving” prevention efforts.
Special anticipatory guidance is warranted when the new teen driver has a relevant condition such as attention-deficit/hyperactivity disorder. These youth are two to four times more likely to have a motor vehicle accident than typical teen drivers.
They may benefit from extended-release ADHD medication or a booster dose of their medication to keep them covered while driving, according to Dr. O’Neil.
“You may want to talk to them about holding off. Maybe their brain hasn’t matured enough yet, and you want to delay their driving. You may want to do a longer period of supervised driving or consider other things we’ve talked about – electronic resources or using a bigger, safer vehicle,” he suggested. “And always, always, always encourage limiting of distractions while driving.”
Dr. O’Neil said he had no relevant conflicts of interest.
SAN FRANCISCO – Clinicians and parents should capitalize on a variety of resources and new technologies that help keep teen drivers safe behind the wheel, according to Dr. Joseph O’Neil, a pediatrician at the Riley Hospital for Children in Indianapolis.
“As I like to share with parents, this is the one developmental milestone that parents really want their kids to have that is potentially lethal. This could really kill them,” he said at the annual meeting of the American Academy of Pediatrics. “Believe me, that’s a conversation stopper; they sort of look at you funny. But it’s true.”
“But there is some good news. We have been paying attention,” Dr. O’Neil said. Concerted safety efforts and campaigns led to a halving of young driver fatalities between 2005 and 2014, although a recent analysis suggesting a reversal of that trend has generated some concern.
Risk factors
Numerous factors increase the risk of crashes and deaths for teen drivers, beginning with their developmental stage, according to Dr. O’Neil. Youth are characterized by their striving for autonomy, impulsivity, risk taking, and greater susceptibility to peer influences, compounded by poor judgment of hazards.
“We know that their executive function is still improving, still maturing, They really don’t start getting to adult levels, if they ever do, until about 25,” he commented humorously.
Other risk factors include speeding, drinking and substance use, sleep deprivation, and distractions that range from cell phones, to eating and grooming, to all the gizmos on the dashboard today. Not wearing seat belts also plays a role, as teens are the age group least likely to buckle up, and risk rises with the number of young passengers in the vehicle.
The rate of fatal crashes among young drivers is more than twice as high at night, compared with during the day, with the hours of 9 p.m. to midnight being most hazardous. And the riskiest meteorologic conditions are, not surprisingly, snow and ice – something that parents should take into account in their typical rush to get driver’s education out of the way in the summer months, he said.
“Most of the evidence points to inexperience as probably the single most important risk factor because with inexperience, you’re going to use cell phones, you’re going to be distracted, you’re not going to be paying attention because you don’t have the experience to know that you should,” Dr. O’Neil said.
Graduated driver’s licenses
A key resource in addressing teen drivers’ inexperience and the fact that their crash rate is highest in their first year of driving are graduated driver licenses (GDLs). These licenses start with a learner’s permit mandating supervision and having many restrictions on conditions such as times when driving is permitted and number of passengers, and if there are no infractions, slowly lift these restrictions as the teen gains more driving experience, until he or she receives a full driver’s license.
Use of GDLs over the past 20 years or so been credited with a reduction of 10%-30% in the rate of motor vehicle fatalities among young teen drivers.
“The problem is that teens have smartened up; they are waiting until later, age 18, to start driving because they don’t want to go through the rigmarole of a GDL,” he said. “We know that that’s a problem because we have right shifted that curve, so we are not seeing as many 15- and 16-year-olds dying behind the wheel; we are seeing more of the 18- and 19-year-olds up to 25-year-olds.”
Clinicians should familiarize themselves with their state’s GDL, Dr. O’Neil recommended. As most states’ GDL laws end at age 18, legislators are now looking at options such as establishing a GDL requirement for all new drivers, regardless of age.
High-tech tools
Clinicians also should also be aware of a host of new high-tech tools designed to make teen drivers safer, often by extending parents’ supervisory role, Dr. O’Neil advised. “Your parents in your practices are going to ask you about these,” he said.
So-called black boxes on vehicles collect a wealth of data about driving and conditions inside the vehicle that can be made available to parents. If black boxes are used correctly, they can enable parents to give feedback to the young driver and reduce overall crash risk, he said.
New GPS monitors will track a vehicle’s speed and range, with an optional feature called geofencing whereby parents can prespecify geographic limits on where their teen driver can go. If the teen ventures outside those limits, the monitor sends a notification.
Video monitoring systems now on the market will record footage both inside and outside of the car. Some record continuously, whereas others capture only events. Parents can obtain a summary report, generally through a monthly subscription, delivered by telephone or email to see how their teen is driving when solo.
Other in-vehicle monitoring technologies include direct-feedback systems, such as the tones that sound when the driver fails to fasten his or her seat belt, changes lanes, or gets too close to another car. Some systems can be configured to send a text or email when these alerts are engaged.
Parents who want to be more proactive can, for certain vehicles, invest in smart keys that are programmed to control vehicle parameters, such as the vehicle speed or the volume on the radio, according to Dr. O’Neil.
Finally, downloadable apps for cell phones will block the user’s ability to call (except in an emergency), text, surf, and take selfies while driving. “This doesn’t mean the child won’t be able to use someone else’s phone, but it does do a nice job for that particular installation,” he commented.
Parent-teen driving agreements
“We’ve talked about a lot of neat things that are out there, but what it all boils down to in the end are the parents – mom and dad. Parents truly are the gatekeepers of the keys,” Dr. O’Neil asserted. “We know that they can have an influence on their teens’ behavior. Parents can set restrictions and regulations on driving, and make sure [teens] follow all the traffic laws and set limits on high-risk driving situations.”
However, parents often underestimate the risks that their teens take behind the wheel. “Everyone always thinks that it’s the other kid who’s going to be driving wildly,” he said. “It’s okay for us to say, ‘I know he’s a great kid, but it’s not the bad kids who get into crashes. All kids get into crashes,’” he said. “It’s important to remind parents that all kids are at risk.
“One of the most valuable things that we can do as physicians to help parents navigate these crazy waters is talk about parent-teen driving agreements or contracts,” Dr. O’Neil said. “This has been shown time and time again to have a positive effect on driving behavior.”
These agreements list rules and expectations, and consequences for breaking the rules. “Both mom and dad, and the teen sign it. You put your name on the line, and that’s important because that really means something. This is probably the first contract this kid will ever sign, and it’s probably the most important one that [the teen] will ever sign.” He recommended that a paper version of the agreement be placed in a prominent location, such as on the refrigerator door, for maximal effectiveness.
A variety of parent-teen driving agreements are available online through initiatives such as the Checkpoints Program, Parents Are the Key to Safe Teen Drivers, I Drive Safely, and the AAP’s Parent-Teen Driving Agreement. Overall, their use has been shown to reduce the risks of traffic violations and crashes by 40%-50%.
Of note, these contracts complement rather than replace GDLs. Additionally, “the law of the land doesn’t trump the law of reality and the law of physics,” Dr. O’Neil pointed out. “We know that the laws in our states are not really always best practice, so as we advocate for best practice laws, what we can do is let the parents set better limits on the teen’s driving.”
Anticipatory guidance
“I usually start talking [with families] about driving when the child is 12 or 13,” Dr. O’Neil said. “Anticipatory guidance does work. We know that for a lot of other things that we do, but parents often need help in trying to figure out what to do.”
He recommended the AAP’s Healthy Children website as a source of good information and resources, including a Young Driver Tool for parents. “This has been vetted through the PROS [Pediatric Research in Office Settings] network, and it has been shown that parents do use it, parents do like it,” he noted. “And really it makes your job easier, because it takes time to talk about all these risk factors, and you can say, ‘Hey, I want you to go look at this website for teen driving. This will help.’ ”
Clinicians should generally cover with families the various risk factors, limit setting, use of GDLs, and parent-teen driving agreements. “Talk to parents about all these things. Talk to the teen; the teen will listen to you; you are an authority figure,” and “use interventional motivational techniques,” he said.
As parents control the vehicle their child drives, they should be counseled to give their teen the family’s safest car, preferably a newer, mid- to full-size vehicle with a small engine and modern safety features, according to Dr. O’Neil. “And we really do try to discourage teens buying their own cars because that sort of limits the parents’ leverage over them when they are starting to drive.”
Clinicians also should familiarize themselves with the driver’s education and similar resources in their community, including safe-driving initiatives spearheaded by groups such as Mothers Against Drunk Driving (MADD). They also should work with schools and the police to support “risky driving” prevention efforts.
Special anticipatory guidance is warranted when the new teen driver has a relevant condition such as attention-deficit/hyperactivity disorder. These youth are two to four times more likely to have a motor vehicle accident than typical teen drivers.
They may benefit from extended-release ADHD medication or a booster dose of their medication to keep them covered while driving, according to Dr. O’Neil.
“You may want to talk to them about holding off. Maybe their brain hasn’t matured enough yet, and you want to delay their driving. You may want to do a longer period of supervised driving or consider other things we’ve talked about – electronic resources or using a bigger, safer vehicle,” he suggested. “And always, always, always encourage limiting of distractions while driving.”
Dr. O’Neil said he had no relevant conflicts of interest.
Statin use increases risk of herpes zoster
Exposure to statins can significantly increase the odds of developing herpes zoster (HZ), according to a study published in the British Journal of Dermatology.
“The mechanisms by which statins may increase the risk of HZ are not established. As statins are commonly prescribed worldwide, any adverse effects may have substantial public health implications,” wrote Anthony Matthews of the London School of Hygiene and Tropical Medicine, and his colleagues. “An increased risk of HZ would not only have an impact on the quality of life of affected patients, but could also add to the burden on health services, given the high cost of treatment for PHN [postherpetic neuralgia].”

Each subject was matched with no more than four control patients – all of whom had no prior history of HZ or PHN – selected from the same databases. Matching was based on the following criteria: subject’s general practitioner (GP) practice, age (within 1 year of the HZ patient), sex, and lack of prior statin exposure. Ultimately 144,959 subjects were matched with 549,336 controls (Br J Dermatol. 2016 Dec;175[6]:1183-94).
The primary outcome was defined as incident diagnoses of HZ, which was measured via odds ratios (ORs) calculated from conditional logistic regression models and adjusted for any potential confounding factors. In addition, ORs were calculated to “explore the association between the risk of HZ and the dosage of the latest prescription (low, medium, high), stratified by time since last exposure,” the investigators noted.
Results showed an adjusted OR of 1.13 for HZ after any kind of statin treatment, indicating a significant increase in risk. There was also a higher adjusted OR for those who had stopped using statins 12-36 months prior to the study than those whose last exposure was greater than 36 months prior: 1.11 and 1.06, respectively (P less than .001). Those whose current statin usage was “high” had an adjusted OR of 1.27 versus 1.16 for those whose usage was “medium,” and 1.14 for those whose usage was “low” (P less than .001).
“It is clear that the preventive benefits of statin therapy are likely to outweigh the limited increase in HZ risk in many cases [but] this evidence should be taken into account by GPs when prescribing statins to those at high risk of HZ,” Mr. Matthews and his associates concluded. “We would also suggest that there may be an extra motivation to maximize HZ vaccine uptake among eligible patients who are also receiving a statin.”
Three coauthors disclosed individual funding sources: the Wellcome Trust/Royal Society Sir Henry Dale fellowship, the Senior Wellcome Fellowship in Clinical Science, and the National Institute for Health Research Clinician Scientist fellowship. The authors did not report any relevant financial disclosures.
“The present study by Matthews et al. observed a dose-response relationship between statin exposure and zoster risk. [It] is the first to explore the association between time since last statin use and the occurrence of zoster. As the time since last statin exposure increased, the risk of zoster decreased, suggesting that the risk for zoster is reduced after termination of statin treatment.
“Zoster is a significant contributor to morbidity, disability, and chronic pain, and constitutes a major public health concern. Zoster vaccination is recommended in most persons who are 50 years of age or older. Vaccination reduces the risk of zoster and postherpetic neuralgia. However, the price of zoster vaccine limits its use worldwide.
“The ‘take home’ message from the article is that in the setting of older age or immune suppression, dermatologists should consider recommending to their patients the use of a zoster vaccine, particularly in patients who receive statin therapy.”
Guy Shalom, MD, is a member of the department of dermatology and venereology, Soroka Medical Center in Beer-Sheva, Israel, and reported no relevant financial conflicts. Arnon D. Cohen, MD, is a member of the Siaal Research Center for Family Medicine and Primary Care at Ben-Gurion University of the Negev, Beer-Sheva, and reported financial ties to AbbVie, Dexcel Pharma, Janssen, Novartis, Perrigo, Pfizer, and Rafa as a consultant, adviser, or speaker. These comments were excerpted from their commentary accompanying Mr. Matthews’ article ( Br J Dermatol. 2017;175:1137-8 ).
Exposure to statins can significantly increase the odds of developing herpes zoster (HZ), according to a study published in the British Journal of Dermatology.
“The mechanisms by which statins may increase the risk of HZ are not established. As statins are commonly prescribed worldwide, any adverse effects may have substantial public health implications,” wrote Anthony Matthews of the London School of Hygiene and Tropical Medicine, and his colleagues. “An increased risk of HZ would not only have an impact on the quality of life of affected patients, but could also add to the burden on health services, given the high cost of treatment for PHN [postherpetic neuralgia].”
Each subject was matched with no more than four control patients – all of whom had no prior history of HZ or PHN – selected from the same databases. Matching was based on the following criteria: subject’s general practitioner (GP) practice, age (within 1 year of the HZ patient), sex, and lack of prior statin exposure. Ultimately 144,959 subjects were matched with 549,336 controls (Br J Dermatol. 2016 Dec;175[6]:1183-94).
The primary outcome was defined as incident diagnoses of HZ, which was measured via odds ratios (ORs) calculated from conditional logistic regression models and adjusted for any potential confounding factors. In addition, ORs were calculated to “explore the association between the risk of HZ and the dosage of the latest prescription (low, medium, high), stratified by time since last exposure,” the investigators noted.
Results showed an adjusted OR of 1.13 for HZ after any kind of statin treatment, indicating a significant increase in risk. There was also a higher adjusted OR for those who had stopped using statins 12-36 months prior to the study than those whose last exposure was greater than 36 months prior: 1.11 and 1.06, respectively (P less than .001). Those whose current statin usage was “high” had an adjusted OR of 1.27 versus 1.16 for those whose usage was “medium,” and 1.14 for those whose usage was “low” (P less than .001).
“It is clear that the preventive benefits of statin therapy are likely to outweigh the limited increase in HZ risk in many cases [but] this evidence should be taken into account by GPs when prescribing statins to those at high risk of HZ,” Mr. Matthews and his associates concluded. “We would also suggest that there may be an extra motivation to maximize HZ vaccine uptake among eligible patients who are also receiving a statin.”
Three coauthors disclosed individual funding sources: the Wellcome Trust/Royal Society Sir Henry Dale fellowship, the Senior Wellcome Fellowship in Clinical Science, and the National Institute for Health Research Clinician Scientist fellowship. The authors did not report any relevant financial disclosures.
FROM THE BRITISH JOURNAL OF DERMATOLOGY
Key clinical point:
Major finding: There is an odds ratio of 1.13 of contracting HZ if given a statin previously, with a significant increase (P less than .001) in risk in patients who used statins more recently.
Data source: Matched case-control study of 144,959 adults with HZ from 2000 through 2011.
Disclosures: Dr. Matthews and colleagues reported no relevant financial disclosures.
Adding entacapone to intestinal gel could lower levodopa effective dose
The addition of the catechol-O-methyltransferase inhibitor entacapone to levodopa-carbidopa intestinal gel provided adequate levodopa exposure at a lower dose than with levodopa-carbidopa intestinal gel alone in a small, open-label randomized, crossover study of patients with advanced Parkinson’s disease.
Over 2 consecutive days, Marina Senek and her associates randomized 11 patients who were on stable levodopa-carbidopa intestinal gel (LCIG; Duodopa) therapy to receive 14-hour infusions of new LCIG formulation with entacapone (LECIG) followed by LCIG alone the next day or vice versa. Five patients received LECIG morning doses that corresponded to 80% of their individual morning dose of LCIG and six received 90% of their individual morning dose. They received maintenance doses that were equal to 80% of the LCIG maintenance dose and extra doses that were equal to 80% of extra LCIG doses.
Dose-adjusted levodopa exposure was significantly higher during LECIG treatment, with 9 of 11 patients exceeding the 20% increase in levodopa exposure targeted. Systemic levodopa exposure did not differ significantly between treatment types.
Sixteen adverse events were reported: 6 by two patients during LCIG treatment, and 10 by five patients during LECIG treatment. Headache was the most common adverse event, experienced by one patient in the LCIG group and by three in the LECIG group. Other adverse events related to treatment were nausea, diarrhea, and dizziness. No serious adverse events were reported.
By blocking the second-largest metabolic pathway for levodopa, the administration of entacapone leads to less levodopa conversion to 3-O-methyldopa and thereby increases the levodopa plasma concentration, the investigators said.
“Because of the short treatment time, conclusions have to be drawn with caution, and long-term comparative efficacy studies are needed to confirm the results and investigate the possible long-term side effects with the addition of entacapone,” the investigators noted.
Read the full study in Movement Disorders (doi: 10.1002/mds.26855).
FROM MOVEMENT DISORDERS