User login
Rhinovirus most often caused HA-VRIs in two hospitals
Health care–associated viral respiratory infections (HA-VRIs) were common in two pediatric hospitals, with rhinovirus the most frequent cause of the infections in a 3-year analysis.
The incidence rate of laboratory-confirmed HA-VRIs was 1.29/1,000 patient-days in an examination of the hospitals’ patient data. Forty-eight percent of all 323 HA-VRI cases were caused by rhinovirus, with an overall incidence rate of 0.72/1,000 patient-days. Additionally, rhinovirus was the most frequently identified virus in cases of HA-VRI in all units of both hospitals, followed by parainfluenza virus and respiratory syncytial virus. An exception was the medical/surgical ward of Steven and Alexandra Cohen Children’s Medical Center (CCMC) of New York; in this unit of the CCMC, the incidence rate of parainfluenza virus was higher than that of rhinovirus (0.21/1,000 patient-days vs. 0.15/1,000 patient-days) (J Ped Inf Dis. 2016. doi: 10.1093/jpids/piw072).
The researchers used infection prevention and control surveillance databases from Montreal Children’s Hospital (MCH) in Quebec and the CCMC to identify HA-VRIs that occurred between April 1, 2010, and March 31, 2013, In both hospitals, HAIs were attributed to the unit to which the patient was admitted at the time of transmission. Both hospitals used a multiplex nucleic acid amplification test for respiratory virus detection on nasopharyngeal swabs or aspirates.
“An HA-VRI with an onset of symptoms after hospital discharge would be detected and included only for patients who presented to the emergency department or were readmitted for VRI and tested,” according to Caroline Quach, MD, of the Montreal Children’s Hospital, McGill University Health Centre, Quebec, and her colleagues.
The HA-VRI rate was 1.91/1,000 patient-days at Montreal Children’s Hospital, compared with 0.80/1,000 patient-days at the CCMC (P less than .0001). At the CCMC, the HA-VRI incidence rate was lowest in the neonatal ICU, but at Montgomery Children’s Hospital, the hematology/oncology ward had the lowest rate of HA-VRI.
Having less than 50% single rooms in a given unit was associated with a statistically significantly higher rate of HA-VRI, after the investigators adjusted for unit type and took the correlation of HA-VRI rates within a hospital into consideration. The study authors’ model predicted that units with less than 50% single rooms have 1.33 times higher HA-VRI rates than units with at least 50% single rooms, regardless of unit type.
Dr. Quach has received funding from GlaxoSmithKline, Pfizer, Sage, and AbbVie for an unrelated research project, while the other authors disclosed no financial relationships.
FROM THE JOURNAL OF THE PEDIATRIC INFECTIOUS DISEASES SOCIETY
Key clinical point:
Major finding: The incidence rate of HA-VRIs was 1.29/1,000 patient-days in an examination of two pediatric hospitals’ patient data between April 1, 2010, and March 31, 2013.
Data source: A retrospective comparison of two hospitals’ 3 years of infection prevention and control surveillance data.
Disclosures: Dr. Quach has received funding from GlaxoSmithKline, Pfizer, Sage, and AbbVie for an unrelated research project, while the other authors disclosed no relevant financial relationships.
Vent bundles and ventilator-associated pneumonia outcomes
Clinical question: Are the components of the ventilator bundles (VBs) associated with better outcomes for patients?
Background: VBs have been shown to prevent ventilator-associated pneumonia (VAP). However, most of the studies have analyzed outcomes based on the whole bundle without considering each individual component.
Study design: Retrospective cohort study.
Setting: Brigham and Women’s Hospital in Boston.
Spontaneous breathing trials were associated with lower hazards for VAEs (HR, 0.55; 95% CI, 0.40-0.76; P less than .001) and infection-related ventilator-associated complications (IVACs) (HR, 0.60; 95% CI, 0.37-1.00; P = .05). Head-of-bed elevation (HR, 1.38; 95% CI, 1.14-1.68; P = 0.001) and thromboembolism prophylaxis (HR, 2.57; 95% CI, 1.80-3.66; P less than .001) were associated with less time to extubation.
Oral care with chlorhexidine was associated with lower hazards for IVACs (HR, 0.60; 95% CI 0.36-1.00; P = .05) and for VAPs (HR, 0.55; 95% CI, 0.27-1.14; P = .11) but an increased risk for ventilator mortality (HR, 1.63; 95% CI, 1.15-2.31; P = .006). Stress ulcer prophylaxis was associated with higher risk for VAP (HR, 7.69; 95% CI, 1.44-41.10; P = .02).
Bottom line: Standard VB components merit revision to increase emphasis on beneficial components and eliminate potentially harmful ones.
Citation: Klompas M, Li L, Kleinman K, Szumita PM, Massaro AF. Association between ventilator bundle components and outcomes. JAMA Intern Med. 2016;176(9):1277-1283.
Dr. Mosetti is an assistant professor at the University of Miami Miller School of Medicine and a hospitalist at University of Miami Hospital and Jackson Memorial Hospital.
Overnight extubations associated with worse outcomes
Clinical question: Are overnight extubations in intensive care units associated with higher mortality rate?
Background: Little is known about the frequency, safety, and effectiveness of overnight extubations in the ICU.
Study design: Retrospective cohort study.
Setting: One-hundred sixty-five ICUs in the United States.
Synopsis: Using the Project IMPACT database, 97,844 adults undergoing mechanical ventilation (MV) admitted to ICUs were studied. Overnight extubation was defined as occurring between 7 p.m. and 6:59 a.m. Primary outcome was reintubation; secondary outcomes were ICU and hospital mortality and ICU and hospital length of stay.
Only one-fifth of patients with MV underwent overnight extubations. For MV duration of at least 12 hours, rates of reintubation were higher for patients undergoing overnight extubation (14.6% vs. 12.4%; P less than .001). Mortality was significantly higher for patients undergoing overnight versus daytime extubation in the ICU (11.2% vs. 6.1%; P less than.001) and in the hospital (16.0% vs. 11.1%; P less than .001). Length of ICU and hospital stays did not differ.
Bottom line: Overnight extubations occur in one of five patients in U.S. ICUs and are associated with worse outcomes, compared with daytime extubations.
Citation: Gershengorn HB, Scales DC, Kramer A, Wunsch H. Association between overnight extubations and outcomes in the intensive care unit. JAMA Intern Med. 2016;176(11):1651-1660.
Dr. Mosetti is an assistant professor at the University of Miami Miller School of Medicine and a hospitalist at University of Miami Hospital and Jackson Memorial Hospital.
High consumption of red meat increases diverticulitis risk in men
Men who consume higher quantities of red meat are at an increased risk of developing diverticulitis, especially if they’re eating unprocessed red meat, according to a new study published in Gut.
“In our prior analysis from a large prospective cohort study, the Health Professionals Follow-Up Study (HPFS), we found that red meat intake, independent of fiber, may be associated with a composite outcome of symptomatic diverticular disease, which included 385 incident cases over 4 years of follow-up,” wrote the authors, led by Andrew T. Chan, MD, of Massachusetts General Hospital, Boston. Dr. Chan added that “in the present study, we updated this analysis, which allowed us to prospectively examine the association between consumption of meat (total red meat, red unprocessed meat, red processed meat, poultry, and fish) with risk of incident diverticulitis in 764 cases over 26 years of follow-up.”
Dr. Chan and his coinvestigators conducted a prospective cohort study using subjects from the ongoing HPFS. Men who already had a diagnosis of diverticulitis, associated complications, inflammatory bowel disease, or a GI-related cancer at baseline were excluded from this analysis, leaving 46,461 eligible subjects. Of those, 764 developed diverticulitis.
The entirety of the follow-up period constituted 651,970 person-years. Average servings of total red meat per week were 1.2 in quintile 1, compared to 5.3 in quintile 3 and 13.5 in quintile 5. Those in the highest quintile had a multivariable risk ratio of 1.58 (95% CI, 1.19-2.11; P = .01), indicating a significantly higher risk for developing diverticulitis. In terms of unprocessed red meat, the average number of servings per week were 0.8 for the lower quintile, 3.2 for quintile 3, and 8.6 for quintile 5, yielding a risk ratio of 1.51 (95% CI, 1.12-2.03, P = .03) when comparing the highest and lowest cohorts. The increase in risk, however, leveled off after about 6 servings of red meat per week, and was found to be nonlinear (P = .002). Those who ate more servings of poultry or fish did not have a higher risk of diverticulitis.
“We also observed that unprocessed red meat, but not processed red meat, was the primary driver for the association between total red meat and risk of diverticulitis,” the authors explained. “Compared with processed meat, unprocessed meat (e.g., steak) is usually consumed in larger portions, which could lead to a larger undigested piece in the large bowel and induce different changes in colonic microbiota [and] higher cooking temperatures used in the preparation of unprocessed meat may influence bacterial composition or proinflammatory mediators in the colon.”
Although medical information and self-reports were validated, there are inherent possible limitations to self-reported data, such as misremembering the amount of meat consumed or reporting incorrect amounts. Residual confounding may have occurred despite adjustment of the data to account for it.
The National Institutes of Health funded the study. The authors reported no conflicts of interest.
Key clinical point:
Major finding: Men with the highest consumption of red meat per week had a risk ratio of 1.58 (95% CI, 1.19-2.11, P = .01) compared to those with the lowest consumption, with an RR of 1.51 (95% CI, 1.12-2.03, P = .03) when comparing unprocessed red meat consumption.
Data source: Prospective cohort study of 51,529 men aged 40-75 years, in the United States.
Disclosures: The National Institutes of Health funded the study. The authors reported no conflicts of interest.
Macitentan boosts quality of life in PAH patients
Macitentan, a recent addition to the drugs that treat pulmonary arterial hypertension (PAH), improves and stabilizes quality of life for patients with the condition, according to an industry-funded study.
Macitentan (Opsumit) remains tremendously expensive, costing as much as $100,000 per year in the United States, and the study provides little in the way of direct comparison to other drugs in its class. Still, the drug’s effects on quality of life are dramatic, said study lead author Sanjay Mehta, MD, FRCPC, FCCP, professor of medicine at the University of Western Ontario and director of the Southwest Ontario Pulmonary Hypertension Clinic at the London Health Sciences Center in London, Ont.
Researchers found that those who took the 10-mg dose, versus placebo, reported significant improvement in seven of eight quality-of-life domains, and in physical and mental components scores, as measured by the 36-item Short Form Health Survey (SF-36). In addition, the study linked 10-mg doses, versus placebo, to a lower risk of a decline of three points or more in the physical component score (hazard ratio [HR], 0.60; 95% CI, 0.47-0.76; P less than .0001] and the mental component scores (HR, 0.76; 95% CI, 0.61-0.95; P = .0173) until end of treatment.
“The drug has shown stability in patients’ quality of life over 6 months and 12 months,” Dr. Mehta said in an interview. “I can’t cure anybody, and they’ll get worse at some point, but I can improve them. They physically feel better, they’re less short of breath with less body pain, and they feel better psychologically.”
Macitentan, an endothelin receptor antagonist, received Food and Drug Administration approval in 2013 following a study that year (N Engl J Med. 2013 Aug 29;369[9]:809-18) that linked 10-mg doses to a significantly lower risk of death and various complications, compared with placebo and the 3-mg dose. The new study (Chest. 2017 Jan;151[1]:106-18), is an analysis of data from the 2013 study.
The PAH patients were randomly assigned to one of three groups: macitentan 10 mg once daily (234), macitentan 3 mg (237), and placebo (239). The study examined responses from 710 patients (76.9% were female, 55.2% were white, mean age was 45.5) to the SF-36 at baseline, 6 months, 12 months, and end of treatment.
Dr. Mehta noted that macitentan has not been clinically compared to the other drugs. The study, however, notes that it is the first PAH treatment to show improvement in seven of eight domains in the quality-of-life survey.
The new study was funded by Actelion Pharmaceuticals, maker of macitentan. Dr. Mehta has received consulting and speaking fees and institutional support for clinical trials from Actelion, among other drug companies. The other authors report various disclosures, including relationships with Actelion.
FROM CHEST
Key clinical point: Macitentan improves and stabilizes quality of life in patients with pulmonary arterial hypertension.
Major finding: Patients who took 10 mg daily macitentan improved in seven of eight quality-of-life domains and in combined physical and mental health measures.
Data source: Multicenter, double-blind, placebo-controlled, randomized phase III study of 710 patients (76.9% female, 55.2% white, mean age 45.5) assigned to placebo, macitentan 3 mg, or macitentan 10 mg once daily.
Disclosures: Actelion Pharmaceuticals, maker of macitentan, funded the study. The authors disclosed ties with Actelion.
Using a Modified Ball-Tip Guide Rod to Equalize Leg Length and Restore Femoral Offset
Take-Home Points
- Preoperative radiographic templating alerts surgeons to certain intraoperative issues that may arise during surgery.
- Intraoperative fluoroscopy has been shown to significantly improve the position and orientation of the implanted hip arthroplasty components.
- Numerous measuring devices have been designed to help restore leg length, but in many cases the purchase cost and required maintenance outweigh their utility.
- A radiopaque line generated by the guide rod serves as a reference point that permits immediate objective comparison of femoral leg length and offset intraoperatively.
- The modified ball-tip guide rod is relatively inexpensive and has several practical purposes in total joint surgery.
Patient satisfaction scores after total hip arthroplasty (THA) approach 100%.1 Goals of this surgery include pain alleviation, motion restoration, and normalization of leg-length inequality. Asymmetric leg lengths are associated with nerve traction injuries, lower extremity joint pain, sacroiliac discomfort, low back pain, and patient dissatisfaction.1-3 For these reasons, postoperative leg-length discrepancy has become the most common reason for THA-related litigation.1,4
With preoperative education, patients and surgeons can discuss realistic THA goals and expectations. Besides ensuring that the correct tools and implants are available for the procedure, radiographic templating alerts surgeons to certain intraoperative issues that may arise during cases. For instance, an extremity may need to be lengthened during the surgery in order to generate the amount of soft-tissue tension needed to convey adequate stability to the hip joint.
In asymptomatic populations, lower extremity leg lengths inherently vary by an average of 5 mm.5 Studies have found normal populations are unable to accurately perceive a leg-length inequality of <1 cm.3,6,7 Lengthening an extremity >2.5 cm causes sciatic nerve symptoms.2 Patients may notice a leg-length discrepancy during the first few months after hip replacement, but this perception often subsides as gait normalizes and soft tissues acclimatize.
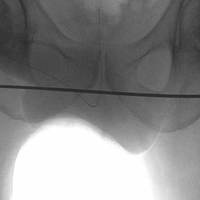
Our hospital uses a special arthroplasty table and intraoperative fluoroscopy for direct anterior (DA) THA cases. The table permits the operative extremity to undergo traction and the necessary mobility for proximal femur exposure. Fluoroscopy has been shown to significantly improve the position and orientation of the implanted hip components.8We have developed an innovative use for a ball-tip guide rod (3.0 mm × 1000 mm; Smith & Nephew) to help accurately restore leg length and femoral offset after DA-THA. The ball-tip guide rod was modified to a length of 500 mm and rough edges were smoothed.
Technique
After the patient is prepared and draped in standard fashion on the operating table, a 10-cm skin incision is made directly over the proximal aspect of the tensor fascia lata muscle. Soft tissues are dissected down to the hip capsule, which is then incised and tagged for closure at the end of the case.
The fluoroscopic C-arm is sterilely draped and positioned from the nonoperative side. The image intensifier is centered over the pubic symphysis and lowered within 1 inch of the perineal post and surgical drapes. The C-arm unit is then aimed 10° to 15° cephalad until the size and orientation of the obturator foramens on fluoroscopic imaging coincide with the preoperative template.
Next, the modified guide rod, ball tip first, is carefully advanced toward the nonoperative side and over the surgical drapes between the pelvis and the C-arm image intensifier. Care is taken to avoid violating the sterile field by inadvertently puncturing the surgical drapes with the guide rod. The lower extremities are externally rotated 20° to bring the lesser tuberosities into profile view. With use of several fluoroscopic views, the guide rod is aligned with the inferior borders of the ischial tuberosities or the obturator foramens, whichever are more readily identified on the intraoperative images. A skin marker is then used to illustrate the position of the guide rod on the operative drapes for future reference.
At this point, the relationship between the radiopaque guide rod and the lesser trochanters is noted to gain a sense of native femoral leg length and offset, and the image (Figure 1) is saved in the C-arm computer for later recall and comparison views.
Next, the femoral neck osteotomy is performed according to the preoperative template. Acetabular preparation and component insertion are completed under fluoroscopic guidance.
After appropriate soft-tissue releases, the operating table is used to position the operative leg in extension, external rotation, and adduction. The femur is then sequentially broached until the template size is reached or until there is an audible change in pitch. At this point, a trial neck with head ball is fixed to the broach, and the hip is reduced.
The fluoroscopic C-arm is then repositioned over the pelvis, as previously described, with the guide rod over the pelvis and tangential to the ischial tuberosities. A new image (Figure 2) is obtained with the trial components in place. 
The radiopaque line generated by the guide rod represents a reference point that permits objective comparison of femoral leg length and offset based on distance to the lesser trochanters. Different modular components can be trialed until the correct combination of variables accurately restores the desired parameters.
Once parameters are restored, trial femoral components are removed, and a corresponding monolithic femoral stem is gently impacted into the proximal femur and fitted with the appropriate head ball. A final image is obtained with the guide rod and implants in place and is saved as proof of restoration of leg length.
Discussion
Various techniques of assessing intraoperative leg length have been described, and each has its advantages and disadvantages. Relying on abductor tension or comparing leg lengths on the operating table is not always accurate and is strongly dependent on patient position.2,6
Referencing the tip of the greater trochanter to a Steinmann pin inserted into the ilium provides a precise reference point, but this invasive technique has the potential for fracture propagation through the drill hole.2,7Superimposing a trial femoral component over the proximal femur to determine the appropriate femoral neck osteotomy has been described, but this process can be difficult through a tight DA approach.9Numerous measuring devices have been designed to help restore leg length, but in many cases the purchase cost and required maintenance outweigh their utility.2 Gililland and colleagues10 developed a reusable fluoroscopic transparent grid system that significantly improves component positioning during DA-THA.
The modified ball-tip guide rod is relatively inexpensive (<$100) and has several practical purposes in total joint surgery. The guide rod historically has been used to sound the center of the femoral canal before broaching. In revision cases and in cases of poor bone stock, the tool can be used to verify that cortical perforation has not occurred during canal preparation. In this article, we describe another realistic use for the guide rod: to create, during DA-THA, a radiographic reference line that can be used to help restore leg length and femoral offset.
Several authors have mentioned surgeons’ drawing the reference line on paper printouts of intraoperative images.11 Not only is this practice fraught with potential contamination of the operative field, but valuable time is lost waiting for paper copies and putting on a new gown and gloves before reentering the sterile field.
We used to train a radiologic technician or operating room nurse to draw a computerized reference line connecting the lesser trochanters on the fluoroscopic image. Problems arose in working with revolving nursing staff and in distinguishing the thin black line on computer monitors. In contrast, the radiopaque line from the guide rod is easily differentiated on fluoroscopic images, the technique poses less of a risk to the sterile field, and proper orientation of the guide rod to obtain the appropriate reference line is entirely surgeon-dependent.
A drawback of this technique is the additional radiation exposure that occurs when extra images are obtained to ensure satisfactory alignment of the guide rod. Another issue is fluoroscopic parallax. Some machines in the operating department generate a magnetic field that can interfere with the fluoroscopy beam and thereby slightly distort the intraoperative images.8 Therefore, it is imperative that the guide rod remain perfectly straight to avoid confounding measurements.
Our modified guide rod technique is a reliable, quick, and inexpensive intraoperative tool that helps in accurately restoring leg length and femoral offset during DA-THA.
Am J Orthop. 2017;46(1):E10-E12. Copyright Frontline Medical Communications Inc. 2017. All rights reserved.
1. Whitehouse MR, Stefanovich-Lawbuary NS, Brunton LR, Blom AW. The impact of leg length discrepancy on patient satisfaction and functional outcome following total hip arthroplasty. J Arthroplasty. 2013;28(8):1408-1414.
2. Clark CR, Huddleston HD, Schoch EP 3rd, Thomas BJ. Leg-length discrepancy after total hip arthroplasty. J Am Acad Orthop Surg. 2006;14(1):38-45.
3. O’Brien S, Kernohan G, Fitzpatrick C, Hill J, Beverland D. Perception of imposed leg length inequality in normal subjects. Hip Int. 2010;20(4):505-511.
4. Hofmann AA, Skrzynski MC. Leg-length inequality and nerve palsy in total hip arthroplasty: a lawyer awaits! Orthopedics. 2000;23(9):943-944.
5. Knutson GA. Anatomic and functional leg-length inequality: a review and recommendation for clinical decision-making. Part I, anatomic leg-length inequality: prevalence, magnitude, effects and clinical significance. Chiropr Osteopat. 2005;13:11.
6. Iagulli ND, Mallory TH, Berend KR, et al. A simple and accurate method for determining leg length in primary total hip arthroplasty. Am J Orthop. 2006;35(10):455-457.
7. Ranawat CS, Rao RR, Rodriguez JA, Bhende HS. Correction of limb-length inequality during total hip arthroplasty. J Arthroplasty. 2001;16(6):715-720.
8. Weber M, Woerner M, Springorum R, et al. Fluoroscopy and imageless navigation enable an equivalent reconstruction of leg length and global and femoral offset in THA. Clin Orthop Relat Res. 2014;472(10):3150-3158.
9. Alazzawi S, Douglas SL, Haddad FS. A novel intra-operative technique to achieve accurate leg length and femoral offset during total hip replacement. Ann R Coll Surg Engl. 2012;94(4):281-282.
10. Gililland JM, Anderson LA, Boffeli SL, Pelt CE, Peters CL, Kubiak EN. A fluoroscopic grid in supine total hip arthroplasty: improving cup position, limb length, and hip offset. J Arthroplasty. 2012;27(8 suppl):111-116.
11. Matta JM, Shahrdar C, Ferguson T. Single-incision anterior approach for total hip arthroplasty on an orthopaedic table. Clin Orthop Relat Res. 2005;(441):115-124.
Take-Home Points
- Preoperative radiographic templating alerts surgeons to certain intraoperative issues that may arise during surgery.
- Intraoperative fluoroscopy has been shown to significantly improve the position and orientation of the implanted hip arthroplasty components.
- Numerous measuring devices have been designed to help restore leg length, but in many cases the purchase cost and required maintenance outweigh their utility.
- A radiopaque line generated by the guide rod serves as a reference point that permits immediate objective comparison of femoral leg length and offset intraoperatively.
- The modified ball-tip guide rod is relatively inexpensive and has several practical purposes in total joint surgery.
Patient satisfaction scores after total hip arthroplasty (THA) approach 100%.1 Goals of this surgery include pain alleviation, motion restoration, and normalization of leg-length inequality. Asymmetric leg lengths are associated with nerve traction injuries, lower extremity joint pain, sacroiliac discomfort, low back pain, and patient dissatisfaction.1-3 For these reasons, postoperative leg-length discrepancy has become the most common reason for THA-related litigation.1,4
With preoperative education, patients and surgeons can discuss realistic THA goals and expectations. Besides ensuring that the correct tools and implants are available for the procedure, radiographic templating alerts surgeons to certain intraoperative issues that may arise during cases. For instance, an extremity may need to be lengthened during the surgery in order to generate the amount of soft-tissue tension needed to convey adequate stability to the hip joint.
In asymptomatic populations, lower extremity leg lengths inherently vary by an average of 5 mm.5 Studies have found normal populations are unable to accurately perceive a leg-length inequality of <1 cm.3,6,7 Lengthening an extremity >2.5 cm causes sciatic nerve symptoms.2 Patients may notice a leg-length discrepancy during the first few months after hip replacement, but this perception often subsides as gait normalizes and soft tissues acclimatize.
Our hospital uses a special arthroplasty table and intraoperative fluoroscopy for direct anterior (DA) THA cases. The table permits the operative extremity to undergo traction and the necessary mobility for proximal femur exposure. Fluoroscopy has been shown to significantly improve the position and orientation of the implanted hip components.8We have developed an innovative use for a ball-tip guide rod (3.0 mm × 1000 mm; Smith & Nephew) to help accurately restore leg length and femoral offset after DA-THA. The ball-tip guide rod was modified to a length of 500 mm and rough edges were smoothed.
Technique
After the patient is prepared and draped in standard fashion on the operating table, a 10-cm skin incision is made directly over the proximal aspect of the tensor fascia lata muscle. Soft tissues are dissected down to the hip capsule, which is then incised and tagged for closure at the end of the case.
The fluoroscopic C-arm is sterilely draped and positioned from the nonoperative side. The image intensifier is centered over the pubic symphysis and lowered within 1 inch of the perineal post and surgical drapes. The C-arm unit is then aimed 10° to 15° cephalad until the size and orientation of the obturator foramens on fluoroscopic imaging coincide with the preoperative template.
Next, the modified guide rod, ball tip first, is carefully advanced toward the nonoperative side and over the surgical drapes between the pelvis and the C-arm image intensifier. Care is taken to avoid violating the sterile field by inadvertently puncturing the surgical drapes with the guide rod. The lower extremities are externally rotated 20° to bring the lesser tuberosities into profile view. With use of several fluoroscopic views, the guide rod is aligned with the inferior borders of the ischial tuberosities or the obturator foramens, whichever are more readily identified on the intraoperative images. A skin marker is then used to illustrate the position of the guide rod on the operative drapes for future reference.
At this point, the relationship between the radiopaque guide rod and the lesser trochanters is noted to gain a sense of native femoral leg length and offset, and the image (Figure 1) is saved in the C-arm computer for later recall and comparison views.
Next, the femoral neck osteotomy is performed according to the preoperative template. Acetabular preparation and component insertion are completed under fluoroscopic guidance.
After appropriate soft-tissue releases, the operating table is used to position the operative leg in extension, external rotation, and adduction. The femur is then sequentially broached until the template size is reached or until there is an audible change in pitch. At this point, a trial neck with head ball is fixed to the broach, and the hip is reduced.
The fluoroscopic C-arm is then repositioned over the pelvis, as previously described, with the guide rod over the pelvis and tangential to the ischial tuberosities. A new image (Figure 2) is obtained with the trial components in place.
The radiopaque line generated by the guide rod represents a reference point that permits objective comparison of femoral leg length and offset based on distance to the lesser trochanters. Different modular components can be trialed until the correct combination of variables accurately restores the desired parameters.
Once parameters are restored, trial femoral components are removed, and a corresponding monolithic femoral stem is gently impacted into the proximal femur and fitted with the appropriate head ball. A final image is obtained with the guide rod and implants in place and is saved as proof of restoration of leg length.
Discussion
Various techniques of assessing intraoperative leg length have been described, and each has its advantages and disadvantages. Relying on abductor tension or comparing leg lengths on the operating table is not always accurate and is strongly dependent on patient position.2,6
Referencing the tip of the greater trochanter to a Steinmann pin inserted into the ilium provides a precise reference point, but this invasive technique has the potential for fracture propagation through the drill hole.2,7Superimposing a trial femoral component over the proximal femur to determine the appropriate femoral neck osteotomy has been described, but this process can be difficult through a tight DA approach.9Numerous measuring devices have been designed to help restore leg length, but in many cases the purchase cost and required maintenance outweigh their utility.2 Gililland and colleagues10 developed a reusable fluoroscopic transparent grid system that significantly improves component positioning during DA-THA.
The modified ball-tip guide rod is relatively inexpensive (<$100) and has several practical purposes in total joint surgery. The guide rod historically has been used to sound the center of the femoral canal before broaching. In revision cases and in cases of poor bone stock, the tool can be used to verify that cortical perforation has not occurred during canal preparation. In this article, we describe another realistic use for the guide rod: to create, during DA-THA, a radiographic reference line that can be used to help restore leg length and femoral offset.
Several authors have mentioned surgeons’ drawing the reference line on paper printouts of intraoperative images.11 Not only is this practice fraught with potential contamination of the operative field, but valuable time is lost waiting for paper copies and putting on a new gown and gloves before reentering the sterile field.
We used to train a radiologic technician or operating room nurse to draw a computerized reference line connecting the lesser trochanters on the fluoroscopic image. Problems arose in working with revolving nursing staff and in distinguishing the thin black line on computer monitors. In contrast, the radiopaque line from the guide rod is easily differentiated on fluoroscopic images, the technique poses less of a risk to the sterile field, and proper orientation of the guide rod to obtain the appropriate reference line is entirely surgeon-dependent.
A drawback of this technique is the additional radiation exposure that occurs when extra images are obtained to ensure satisfactory alignment of the guide rod. Another issue is fluoroscopic parallax. Some machines in the operating department generate a magnetic field that can interfere with the fluoroscopy beam and thereby slightly distort the intraoperative images.8 Therefore, it is imperative that the guide rod remain perfectly straight to avoid confounding measurements.
Our modified guide rod technique is a reliable, quick, and inexpensive intraoperative tool that helps in accurately restoring leg length and femoral offset during DA-THA.
Am J Orthop. 2017;46(1):E10-E12. Copyright Frontline Medical Communications Inc. 2017. All rights reserved.
1. Whitehouse MR, Stefanovich-Lawbuary NS, Brunton LR, Blom AW. The impact of leg length discrepancy on patient satisfaction and functional outcome following total hip arthroplasty. J Arthroplasty. 2013;28(8):1408-1414.
2. Clark CR, Huddleston HD, Schoch EP 3rd, Thomas BJ. Leg-length discrepancy after total hip arthroplasty. J Am Acad Orthop Surg. 2006;14(1):38-45.
3. O’Brien S, Kernohan G, Fitzpatrick C, Hill J, Beverland D. Perception of imposed leg length inequality in normal subjects. Hip Int. 2010;20(4):505-511.
4. Hofmann AA, Skrzynski MC. Leg-length inequality and nerve palsy in total hip arthroplasty: a lawyer awaits! Orthopedics. 2000;23(9):943-944.
5. Knutson GA. Anatomic and functional leg-length inequality: a review and recommendation for clinical decision-making. Part I, anatomic leg-length inequality: prevalence, magnitude, effects and clinical significance. Chiropr Osteopat. 2005;13:11.
6. Iagulli ND, Mallory TH, Berend KR, et al. A simple and accurate method for determining leg length in primary total hip arthroplasty. Am J Orthop. 2006;35(10):455-457.
7. Ranawat CS, Rao RR, Rodriguez JA, Bhende HS. Correction of limb-length inequality during total hip arthroplasty. J Arthroplasty. 2001;16(6):715-720.
8. Weber M, Woerner M, Springorum R, et al. Fluoroscopy and imageless navigation enable an equivalent reconstruction of leg length and global and femoral offset in THA. Clin Orthop Relat Res. 2014;472(10):3150-3158.
9. Alazzawi S, Douglas SL, Haddad FS. A novel intra-operative technique to achieve accurate leg length and femoral offset during total hip replacement. Ann R Coll Surg Engl. 2012;94(4):281-282.
10. Gililland JM, Anderson LA, Boffeli SL, Pelt CE, Peters CL, Kubiak EN. A fluoroscopic grid in supine total hip arthroplasty: improving cup position, limb length, and hip offset. J Arthroplasty. 2012;27(8 suppl):111-116.
11. Matta JM, Shahrdar C, Ferguson T. Single-incision anterior approach for total hip arthroplasty on an orthopaedic table. Clin Orthop Relat Res. 2005;(441):115-124.
Ebola research update: December 2016
The struggle to defeat Ebola virus disease continues globally, although it may not always make the headlines. To catch up on what you may have missed, here are some notable news items and journal articles published over the past few weeks that are worth a second look.
The rVSV-ZEBOV recombinant vaccine offers substantial protection against Ebola virus disease, according to the results of a vaccine trial in Guinea, with no cases among vaccinated individuals from day 10 after vaccination in both randomized and nonrandomized clusters.
A new spatiotemporal analysis method may help to effectively control emerging infections like Ebola by exploiting available longitudinal incidence data at different geographical locations to monitor local epidemics, determine the extent of spatial spread, reveal the contribution of local and imported cases, and identify sources of introductions in uninfected areas.
A study in Guinea found that time to clearance of Ebola virus RNA from seminal fluid varies greatly between individuals and could be more than 13 months.
The results of a case study of a 9-month-old infant who died of Ebola virus disease with unknown epidemiologic link strongly suggest Ebola virus transmission to the child through breastfeeding.
The overall success in monitoring more than 99% of incoming travelers to the United States during the Ebola virus epidemic resulted, in part, because of the vigilance of state, local, and territorial health departments and the preparedness infrastructure that enabled jurisdictions to fully implement and follow Centers for Disease Control and Prevention guidance on monitoring of persons with potential Ebola exposure.
A study in the Journal of Infectious Diseases found the Cepheid Xpert Ebola assay to be accurate and precise for detecting Ebola virus in whole semen.
There is a need for a long-term follow-up of Ebola virus disease survivors in Guinea, according to a report in Tropical Medicine & International Health, and more efforts to support the social, professional, and economic reintegration of survivors, especially in rural areas.
A recent study in Sierra Leone supported the role of Ebola holding units as a safe method for isolation of suspect Ebola virus disease patients and the role of these units in limiting the spread of Ebola virus disease.
The modified Xpert Ebola virus assay for semen samples is optimal for large-scale monitoring of Ebola virus RNA persistence in male survivors, according to an analysis in the Journal of Infectious Diseases.
Researchers at Tufts University studied various hand hygiene techniques in communities facing Ebola virus outbreaks, and concluded that communities should use whichever hand-washing methods are most acceptable, available, and sustainable for community hand washing.
Indian investigators applied the queuing mathematical modeling technique to the Guinea 2014 Ebola virus disease outbreak and found that the use of two quarantine centers to combat the outbreak would have served as an adequate control measure. They said the queuing technique could be used to manage the manpower and material resources in the combat against Ebola virus disease outbreak.
[email protected]
On Twitter @richpizzi
ACA repeal will prove good for psychiatric practice
As a psychiatrist who ran a solo private practice for more than 40 years, I welcome the demise of the Affordable Care Act (ACA). Why? Because so many of the ACA’s requirements have worked against the best interests of my patients.
The reality is that patients want much greater power in a U.S. health care marketplace. Patient power will, or at least ought to be, an important objective for health care reform at all levels of government. The 2016 elections make it clear that citizens want to be personally invested when it comes to shopping for their health care insurance and engaging health care professionals of their choice. That means we as professionals must advocate for price transparency for our professional services, and give our patients much greater power to say where money goes to pay for their health care.

One ACA requirement that really turns off patients and clinical psychiatrists is government and third-party mandates that a patient’s clinical notes must be put on an electronic health record (EHR). (This requirement did not originate with the ACA but reinforces the HITECH mandate.)* Patient data privacy and confidentiality are essential to gaining and maintaining patient trust when doing psychotherapy and outpatient psychiatry, and more than 40% of U.S. clinical psychiatrists today are in solo or small group independent practices. They make patient data privacy and confidentiality a hallmark.
Unfortunately, the ACA does not support independent solo and small group psychiatric practices. Frustrations tied to the ACA’s current overreliance on payer-”provider” contracting in the private and public sectors are the reason for the growing interest in the Wedge of Health Freedom. The Wedge is a voluntary program conceived by the Citizens’ Council for Health Freedom to advance a “new vision of health care for patients and doctors” by eliminating third parties who “manage” medical care dollars and “medical necessity.” I know from the last 10 years that a direct pay (cash) practice experience is a necessary option and alternative to managed care for patients and doctors. Patient demand is spurring The Wedge concept, as Twila Brase, a registered nurse who serves as president of the Citizens’ Council for Health Freedom, has said.
“The right to pay cash, the right to accept cash, and the right to discount prices must be protected within the wedge of freedom,” Ms. Braise said in a 2014 presentation before the Association of American Physicians and Surgeons. “I’m asking you to engage your patients.”
To ensure continuity of care, patients need to have both access to competent professionals of their choice and discretion/control of how those professionals are paid. That is missing in the ACA.
The emphasis on patient (consumer) choice is one of many positive aspects of the ACA repeal legislation proposed in 2015 by Tom Price (R-Ga.), an orthopedic surgeon who has been nominated by President-Elect Donald J. Trump to be the next secretary of the U.S. Department of Health & Human Services. Health savings accounts (HSAs) are key, as are the use of indemnity (catastrophic) insurance offerings based on the costs of care. To incentivize insurance companies to develop and market insurance products appropriate to the demands and needs of all people, including young and healthy enrollees, federal and state laws involving third-party insurance, Medicaid, and Medicare must change. And they will.
Expanding high-risk pools can be accomplished only with help from the states. (Minnesota is now debating resurrecting a version of the 1976 high-risk pool called the Minnesota Comprehensive Health Association). New and innovative programs for Medicaid recipients allowing them to shop for care using debit cards is an interesting proposal. Financial “skin in the game” for patients (even when such discretionary money is provided by taxpayers) will empower patients to shop for services and coverage with real options for them if presented with diversion if they show up at emergency departments with needs for nonurgent health care services or primary care. Other appealing proposals involve primary care programs linking care access through concierge or direct-pay arrangements with patients.
Everyone with Internet access knows that he or she can purchase almost anything online. Other than legal considerations (often state-imposed sales taxes), there are no boundaries or constraints to most Internet purchases. If someone wants a product or service and has the money to buy it from a vendor anyplace in the world, all it takes is a few keystrokes, and, voila, the items are on the way! Soon, in fact, amazon.com may drop your “stuff” off via a drone on your front steps. So how is health care or the purchase of a doctor-patient relationship different from other “stuff” we buy online? And how, fundamentally, is the insurance that pays for health care different from other forms of insurance? Can we envision after a patient’s vetting and risk assessment that an Amazon drone might drop off an insurance contract or policy?
An important question and proposal for ACA replacement legislation is the opportunity for consumers to buy health care insurance across state lines. Competition based on coverage and price will drive down the cost of health care insurance for buyers. But there are serious obstacles to making interstate health care insurance a reality, such as state regulation of insurance, state licensure of health care professionals, and lack of a stomach by medical professionals for more “provider” networks.
Clearly, price transparency for health care services and insurance should be a first order priority for health care reform. There are no guarantees when it comes to markets, but it’s very unlikely that health insurance premiums will fall simply because people can buy health plans across state lines. Allowing companies to manage health plans in several states could bring down management expenses so long as there is real competition among insurance companies. That prospect, however, is countered by rampant consolidation of insurance companies, and associated oligopoly and antitrust issues.
In my view, health care insurance should be a contract between the enrollee (recipient) and the insurer rather than a deal that is usually hidden from consumers between “providers” of care and third-party payers.
We do need to get rid of individual and corporate ACA penalties for not having insurance while at the same time, make markets appealing to consumers of all incomes and needs. And people should be able to buy prepaid coverage from health maintenance organizations (HMOs) if people want prepaid care with its restrictions. We should expand HSAs, and encourage price disclosure/transparency for services and insurance coverage via the Internet.
I lobbied for mental health parity legislation for years, and the American Psychiatric Association supported the passage of the ACA in 2010 to ensure access to mental health benefits for Americans. But let’s stop kidding ourselves about the ACA’s real world consequences to the psychiatric care of our patients. Despite hard work over the years to expand parity for mental health services, psychiatric and substance use care at this moment is commonly restricted to managed care behavioral carve-out networks or time-limited programs. Those restrictions grew under the ACA.
In short, we need to create a true health care marketplace and access to insurance protections that enable psychiatrists and other mental health professionals to work for the best interests of our patients rather than the bottom line of health care organizations. Let’s urge our politicians to replace the ACA with measures that encourage and promote voluntary, motivated patients and their families to find quality professional relationships with competent professionals of their choice who are able to provide care continuity and confidential, data-safe practice environments.
Dr. Beecher is president of the Minnesota Physician-Patient Alliance (www.physician-patient.org), a health care think tank based in Saint Louis Park, Minn. He is a distinguished life fellow of the American Psychiatric Association and Fellow of the American Society of Addiction Medicine, and until 2015 served as adjunct professor of psychiatry at the University of Minnesota, Minneapolis.
*CORRECTION, 1/13/2017: The federal program that incentivizes physicians to use EHRs was part of the HITECH Act, which was part of the Recovery Act of 2009 and predates the ACA.
As a psychiatrist who ran a solo private practice for more than 40 years, I welcome the demise of the Affordable Care Act (ACA). Why? Because so many of the ACA’s requirements have worked against the best interests of my patients.
The reality is that patients want much greater power in a U.S. health care marketplace. Patient power will, or at least ought to be, an important objective for health care reform at all levels of government. The 2016 elections make it clear that citizens want to be personally invested when it comes to shopping for their health care insurance and engaging health care professionals of their choice. That means we as professionals must advocate for price transparency for our professional services, and give our patients much greater power to say where money goes to pay for their health care.
One ACA requirement that really turns off patients and clinical psychiatrists is government and third-party mandates that a patient’s clinical notes must be put on an electronic health record (EHR). (This requirement did not originate with the ACA but reinforces the HITECH mandate.)* Patient data privacy and confidentiality are essential to gaining and maintaining patient trust when doing psychotherapy and outpatient psychiatry, and more than 40% of U.S. clinical psychiatrists today are in solo or small group independent practices. They make patient data privacy and confidentiality a hallmark.
Unfortunately, the ACA does not support independent solo and small group psychiatric practices. Frustrations tied to the ACA’s current overreliance on payer-”provider” contracting in the private and public sectors are the reason for the growing interest in the Wedge of Health Freedom. The Wedge is a voluntary program conceived by the Citizens’ Council for Health Freedom to advance a “new vision of health care for patients and doctors” by eliminating third parties who “manage” medical care dollars and “medical necessity.” I know from the last 10 years that a direct pay (cash) practice experience is a necessary option and alternative to managed care for patients and doctors. Patient demand is spurring The Wedge concept, as Twila Brase, a registered nurse who serves as president of the Citizens’ Council for Health Freedom, has said.
“The right to pay cash, the right to accept cash, and the right to discount prices must be protected within the wedge of freedom,” Ms. Braise said in a 2014 presentation before the Association of American Physicians and Surgeons. “I’m asking you to engage your patients.”
To ensure continuity of care, patients need to have both access to competent professionals of their choice and discretion/control of how those professionals are paid. That is missing in the ACA.
The emphasis on patient (consumer) choice is one of many positive aspects of the ACA repeal legislation proposed in 2015 by Tom Price (R-Ga.), an orthopedic surgeon who has been nominated by President-Elect Donald J. Trump to be the next secretary of the U.S. Department of Health & Human Services. Health savings accounts (HSAs) are key, as are the use of indemnity (catastrophic) insurance offerings based on the costs of care. To incentivize insurance companies to develop and market insurance products appropriate to the demands and needs of all people, including young and healthy enrollees, federal and state laws involving third-party insurance, Medicaid, and Medicare must change. And they will.
Expanding high-risk pools can be accomplished only with help from the states. (Minnesota is now debating resurrecting a version of the 1976 high-risk pool called the Minnesota Comprehensive Health Association). New and innovative programs for Medicaid recipients allowing them to shop for care using debit cards is an interesting proposal. Financial “skin in the game” for patients (even when such discretionary money is provided by taxpayers) will empower patients to shop for services and coverage with real options for them if presented with diversion if they show up at emergency departments with needs for nonurgent health care services or primary care. Other appealing proposals involve primary care programs linking care access through concierge or direct-pay arrangements with patients.
Everyone with Internet access knows that he or she can purchase almost anything online. Other than legal considerations (often state-imposed sales taxes), there are no boundaries or constraints to most Internet purchases. If someone wants a product or service and has the money to buy it from a vendor anyplace in the world, all it takes is a few keystrokes, and, voila, the items are on the way! Soon, in fact, amazon.com may drop your “stuff” off via a drone on your front steps. So how is health care or the purchase of a doctor-patient relationship different from other “stuff” we buy online? And how, fundamentally, is the insurance that pays for health care different from other forms of insurance? Can we envision after a patient’s vetting and risk assessment that an Amazon drone might drop off an insurance contract or policy?
An important question and proposal for ACA replacement legislation is the opportunity for consumers to buy health care insurance across state lines. Competition based on coverage and price will drive down the cost of health care insurance for buyers. But there are serious obstacles to making interstate health care insurance a reality, such as state regulation of insurance, state licensure of health care professionals, and lack of a stomach by medical professionals for more “provider” networks.
Clearly, price transparency for health care services and insurance should be a first order priority for health care reform. There are no guarantees when it comes to markets, but it’s very unlikely that health insurance premiums will fall simply because people can buy health plans across state lines. Allowing companies to manage health plans in several states could bring down management expenses so long as there is real competition among insurance companies. That prospect, however, is countered by rampant consolidation of insurance companies, and associated oligopoly and antitrust issues.
In my view, health care insurance should be a contract between the enrollee (recipient) and the insurer rather than a deal that is usually hidden from consumers between “providers” of care and third-party payers.
We do need to get rid of individual and corporate ACA penalties for not having insurance while at the same time, make markets appealing to consumers of all incomes and needs. And people should be able to buy prepaid coverage from health maintenance organizations (HMOs) if people want prepaid care with its restrictions. We should expand HSAs, and encourage price disclosure/transparency for services and insurance coverage via the Internet.
I lobbied for mental health parity legislation for years, and the American Psychiatric Association supported the passage of the ACA in 2010 to ensure access to mental health benefits for Americans. But let’s stop kidding ourselves about the ACA’s real world consequences to the psychiatric care of our patients. Despite hard work over the years to expand parity for mental health services, psychiatric and substance use care at this moment is commonly restricted to managed care behavioral carve-out networks or time-limited programs. Those restrictions grew under the ACA.
In short, we need to create a true health care marketplace and access to insurance protections that enable psychiatrists and other mental health professionals to work for the best interests of our patients rather than the bottom line of health care organizations. Let’s urge our politicians to replace the ACA with measures that encourage and promote voluntary, motivated patients and their families to find quality professional relationships with competent professionals of their choice who are able to provide care continuity and confidential, data-safe practice environments.
Dr. Beecher is president of the Minnesota Physician-Patient Alliance (www.physician-patient.org), a health care think tank based in Saint Louis Park, Minn. He is a distinguished life fellow of the American Psychiatric Association and Fellow of the American Society of Addiction Medicine, and until 2015 served as adjunct professor of psychiatry at the University of Minnesota, Minneapolis.
*CORRECTION, 1/13/2017: The federal program that incentivizes physicians to use EHRs was part of the HITECH Act, which was part of the Recovery Act of 2009 and predates the ACA.
Approach may provide better treatment of GVHD, team says

Photo by Aaron Logan
Preclinical research suggests that targeting 2 kinases may provide an approach to treating graft-vs-host-disease (GVHD) that does not compromise the tumor-fighting capabilities of the immune system.
Researchers said that dual inhibition of Aurora kinase A and JAK2, attenuating CD28 costimulation and IL-6-mediated signal transduction, respectively, can fight GVHD without destroying potential antitumor cytotoxic T lymphocyte (CTL) responses.
The team detailed these findings in Science Translational Medicine.
“It is known that Aurora kinase A and JAK2 pathway activation contributes to GVHD,” said study author Brian C. Betts, MD, of H. Lee Moffitt Cancer Center & Research Institute in Tampa, Florida.
“However, drugs that inhibit either protein alone do not completely prevent GVHD. We hypothesized that co-treatment with drugs that target both Aurora kinase A and JAK2 could prevent GVHD better than either drug alone.”
In fact, Dr Betts and his colleagues engineered and tested 2 compounds that inhibit both Aurora kinase A and JAK2—AJI-100 and AJI-214.
The team then compared the AJI analogs to the Aurora kinase A inhibitor alisertib, the JAK2 inhibitor TG101348, the combination of alisertib and TG101348, and dimethyl sulfoxide (DMSO) control.
The researchers first found that AJI-214 and AJI-100 “exerted significant suppression of T cells” in vitro, suppressing alloreactive T-cell proliferation with a potency that was similar to that of alisertib and TG101348 in combination.
The team noted that inhibition of Aurora kinase A and JAK2—with either AJI analog or alisertib and TG101348 in combination—significantly reduced alloreactive conventional T cells (Tconv) and helper T cells (TH1 and TH17) but permitted the differentiation of inducible regulatory T cells (iTregs).
In fact, the researchers said that dual inhibition of Aurora kinase A and JAK2 supports potent CD39+ iTregs. They observed higher CD39 cell surface density among AJI-214–treated iTregs, which resulted in improved scavenging of extracellular adenosine triphosphate, when compared to DMSO-treated iTregs.
The team then tested AJI-100 in mouse models of GVHD, as this drug has better bioavailability than AJI-214.
AJI-100 significantly improved the overall survival of the mice and reduced the severity of GVHD, compared to vehicle control (P=0.003).
In comparison, alisertib and TG101348 in combination significantly delayed the onset and severity of GVHD when compared to vehicle or TG101348 alone (P<0.0001 and P=0.0001). But the combination did not significantly improve survival in the mice.
Next, the researchers tested the effects of AJI-100 on CTLs by generating human antitumor CTLs in xenotransplanted mice. The mice received AJI-100 or vehicle control, as well as irradiated U937 cells. Unvaccinated, xenotransplanted mice served as negative controls.
The team said AJI-100 did not inhibit CTL generation because CD8+ CTLs from AJI-100–treated and vehicle-treated mice demonstrated similarly enhanced killing capacity against U937 targets in vitro, when compared to unvaccinated controls.
Additional experiments in mice showed that AJI-100 significantly increases the ratio of Tregs to activated Tconv while eliminating TH17 and TH1 cells.
The researchers therefore concluded that inhibiting CD28 and IL-6 signal transduction pathways in donor T cells may increase the Treg/Tconv ratio, prevent GVHD, and preserve antitumor CTLs.
“This novel prevention strategy warrants further investigation because of its potential to reduce the risk of GVHD and possibly be more effective and selective than commonly used GVHD treatments currently available today,” Dr Betts said. ![]()
Malaria infection depends on number of parasites in mosquitoes

Photo by James Gathany
Mosquitoes carrying a greater number of malaria-causing parasites may be more likely to cause infection, according to a study published in PLOS Pathogens.
More than 100 years have passed since scientists first discovered that infectious mosquitoes inject malaria parasites when they bite people.
However, it hasn’t been clear whether injecting more parasites with each bite increases a person’s chances of infection or if all infectious bites are equally dangerous.
In the new study, researchers set out to determine whether the number of parasites found in the salivary glands of malaria-carrying mosquitos impacts disease transmission.
Via experiments in mice, the team determined that the more parasites present in a mosquito’s salivary glands, the more likely it was to be infectious and the faster an infection would develop.
“It is surprising that the relationship between parasite density and infectiousness has not been properly investigated before, but the studies are quite complex to carry out,” noted Andrew Blagborough, PhD, of Imperial College London in the UK.
For this study, he and his colleagues set up repeated cycles of infection so that groups of infected mosquitoes containing variable numbers of parasites repeatedly bit sedated mice, transmitting malaria to them under a range of transmission settings.
This allowed the researchers to track how many individual parasites different mosquitoes harbored, how many mice were infected as a result of exposure to them, and how long it took the mice to develop malaria.
The team also analyzed data from human volunteers who were exposed to bites from infectious mosquitoes.
Dissection of these mosquitoes revealed that infection was significantly more likely—and occurred sooner—after bites from mosquitoes with more than 1000 individual parasites in their salivary glands.
By conducting further studies with mice and human volunteers, the researchers were able to provide an explanation for why the malaria vaccine RTS,S is effective only some of the time and why any protection rapidly drops off after 3 years.
The vaccine was less effective when mice or humans were bitten by mosquitoes carrying a greater number of parasites. The researchers think this is because the vaccine can only kill a certain proportion of the parasites and is overwhelmed when the parasite population is too large.
“Vaccine development has come a long way, and this new insight should help future vaccine studies to be tested more rigorously,” said study author Thomas Churcher, PhD, of Imperial College London.
“However, in the end, it is unlikely that one magic bullet will eradicate malaria, and we should continue to seek and apply combinations of strategies for reducing the burden of this disease.” ![]()