User login
Early delivery by morbidly obese moms improves outcomes
LAS VEGAS – Delivery at 38 weeks’ gestation is linked with improved perinatal survival among singleton infants born to morbidly obese mothers in a retrospective review of more than 2 million U.S. births.
“If reasonable, consider delivery at 38 weeks in morbidly obese mothers” delivering singleton pregnancies, Ruofan Yao, MD, said at the annual Pregnancy Meeting sponsored by the Society for Maternal-Fetal Medicine.

When mothers have diabetes, hypertension, or cholestasis, they receive frequent prenatal testing and fetal growth measurements, and delivery is typically at 37, 38, or 39 weeks. “This is what we also need to think about for morbidly obese mothers,” Dr. Yao said.
“Because of increased fetal growth in morbidly obese mothers there is probably earlier placental insufficiency,” he said in an interview.
The upshot is that, once a morbidly obese mother reaches 38 weeks’ gestation, induced labor should be considered, according to Dr. Yao. Induction could start immediately if the mother’s cervix is ripe, or clinicians could first take steps to hasten cervical ripening.
Induction can be especially slow in morbidly obese women, who are generally less sensitive to oxytocin and can require multiple induction strategies.
While Dr. Yao considered the evidence he reported persuasive enough to recommend this strategy, he cautioned that, ideally, the benefits of an early-delivery approach should be confirmed in a prospective, randomized trial.
The study used delivery records maintained by the state of Texas for 2006-2011. Of the more than 2.4 million births recorded during the period, Dr. Yao excluded multiple deliveries, births at less than 34 weeks’ or more than 42 weeks’ gestation, deliveries from underweight mothers (less than 18.5 kg/m2), and fetal anomalies. This left 2,181,530 births, of which 52% were by normal weight mothers (18.5-24 kg/m2), 26% by overweight mothers (25-29 kg/m2), 18% by obese mothers (30-39 kg/m2), and 4% by morbidly obese mothers (40 kg/m2 or greater). The women averaged 27 years old, 4% had preeclampsia, and 4% had pregestational diabetes.
The researchers then calculated perinatal mortality rates relative to gestational age at birth for women in each body mass index stratum. The calculations showed no significant impact of gestational age among late-term deliveries by normal weight, overweight, and obese mothers, but, among morbidly obese mothers, early deliveries made a difference and were significantly linked with reduced perinatal mortality.
Every 400 deliveries, approximately, induced at 38 weeks among morbidly obese mothers resulted in one less perinatal death, Dr. Yao reported. This relationship held even when the researchers excluded mothers with preeclampsia or pregestational diabetes (about 8% of the study group).
Dr. Yao had no disclosures.
[email protected]
On Twitter @mitchelzoler
LAS VEGAS – Delivery at 38 weeks’ gestation is linked with improved perinatal survival among singleton infants born to morbidly obese mothers in a retrospective review of more than 2 million U.S. births.
“If reasonable, consider delivery at 38 weeks in morbidly obese mothers” delivering singleton pregnancies, Ruofan Yao, MD, said at the annual Pregnancy Meeting sponsored by the Society for Maternal-Fetal Medicine.
When mothers have diabetes, hypertension, or cholestasis, they receive frequent prenatal testing and fetal growth measurements, and delivery is typically at 37, 38, or 39 weeks. “This is what we also need to think about for morbidly obese mothers,” Dr. Yao said.
“Because of increased fetal growth in morbidly obese mothers there is probably earlier placental insufficiency,” he said in an interview.
The upshot is that, once a morbidly obese mother reaches 38 weeks’ gestation, induced labor should be considered, according to Dr. Yao. Induction could start immediately if the mother’s cervix is ripe, or clinicians could first take steps to hasten cervical ripening.
Induction can be especially slow in morbidly obese women, who are generally less sensitive to oxytocin and can require multiple induction strategies.
While Dr. Yao considered the evidence he reported persuasive enough to recommend this strategy, he cautioned that, ideally, the benefits of an early-delivery approach should be confirmed in a prospective, randomized trial.
The study used delivery records maintained by the state of Texas for 2006-2011. Of the more than 2.4 million births recorded during the period, Dr. Yao excluded multiple deliveries, births at less than 34 weeks’ or more than 42 weeks’ gestation, deliveries from underweight mothers (less than 18.5 kg/m2), and fetal anomalies. This left 2,181,530 births, of which 52% were by normal weight mothers (18.5-24 kg/m2), 26% by overweight mothers (25-29 kg/m2), 18% by obese mothers (30-39 kg/m2), and 4% by morbidly obese mothers (40 kg/m2 or greater). The women averaged 27 years old, 4% had preeclampsia, and 4% had pregestational diabetes.
The researchers then calculated perinatal mortality rates relative to gestational age at birth for women in each body mass index stratum. The calculations showed no significant impact of gestational age among late-term deliveries by normal weight, overweight, and obese mothers, but, among morbidly obese mothers, early deliveries made a difference and were significantly linked with reduced perinatal mortality.
Every 400 deliveries, approximately, induced at 38 weeks among morbidly obese mothers resulted in one less perinatal death, Dr. Yao reported. This relationship held even when the researchers excluded mothers with preeclampsia or pregestational diabetes (about 8% of the study group).
Dr. Yao had no disclosures.
[email protected]
On Twitter @mitchelzoler
AT THE PREGNANCY MEETING
Key clinical point:
Major finding: Every 400 deliveries at 38 weeks is linked with one fewer perinatal death, compared with full-term deliveries.
Data source: Review of 2,181,530 Texas births during 2006-2011.
Disclosures: Dr. Yao had no disclosures.
VIDEO: Molecular testing helps pinpoint ambiguous lesions
WAILEA, HAWAII – In a video interview, Pedram Gerami, MD, professor of dermatology, pathology, and pediatrics, Northwestern University, Chicago, discusses the use of molecular testing for melanoma and suspicious lesions.
Molecular tests are available for various components of diagnosis and prognosis of melanoma, and one of the most popular scenarios for their use is to confirm a diagnosis if a lesion is biopsied and the histopathologist “feels that the diagnosis is ambiguous by standard pathology methods,” Dr. Gerami said in a video interview at the Hawaii Dermatology Seminar provided by Global Academy for Medical Education/Skin Disease Education Foundation.
On average, between 1% and 5% of cases of suspicious lesions may need molecular testing to confirm the diagnosis, he noted. Of the available options for molecular testing, FISH (fluorescence in situ hybridization) testing is the most validated in the setting of ambiguous histology, he said.
Dr. Gerami disclosed serving as a consultant and researcher for Castle Biosciences, Myriad Genetics, and DermTech.
SDEF and this news organization are owned by the same parent company.
The video associated with this article is no longer available on this site. Please view all of our videos on the MDedge YouTube channel
AT SDEF HAWAII DERMATOLOGY SEMINAR

Hydrogel coils improve outcomes in medium-sized intracranial aneurysms
HOUSTON – Hydrogel coils significantly outperformed bare platinum coils in treating patients with medium-sized intracranial aneurysms, reducing the incidence of adverse outcomes by about 9% in an open-label, randomized trial.
Compared against the platinum coils, the self-expandable, hydrophilic coils scored significantly better on a composite endpoint of aneurysm recurrence at 18 months, re-treatment by 18 months, serious morbidity that prevented angiographic follow-up, and death, Christian Taschner, MD, said at the International Stroke Conference sponsored by the America Heart Association.

These are the company’s second-generation products, said Dr. Taschner, a neuroradiologist at University Hospital Freiburg (Germany). The initial hydrogel-coated coils were not well received because they were too stiff, he said in an interview.
The 18-month study comprised 513 patients and was conducted in 15 centers in France and 7 in Germany. Patients with medium-sized aneurysms (4-12 mm) were randomized to coiling with either the hydrogel coils or bare platinum coils and followed for 18 months. The cohort was stratified by rupture status in the analysis.
Angiographic images of the aneurysm were obtained before treatment, immediately after treatment, at 6 months, and at 18 months. All images were reviewed by an independent laboratory that was blinded to the treatment.
In addition to the primary composite outcome, the study assessed secondary endpoints of modified Rankin Scale (mRS) score at 18 months and coil packing density.
The final analysis included 484 patients. They were a mean of 52 years old, and about 70% were women. The aneurysms were ruptured at baseline in about 43% of cases. The mean aneurysm size was 7 mm, and the mean neck size, 3.5 mm. The dome-to-neck ratio was less than 1.5 in about a third of the group. Most lesions (89%) had anterior circulation.
Most patients needed some kind of adjunctive endovascular-assisting device during the procedure. These included balloon remodeling, which was necessary in about 50% of cases to help keep the coils from extruding into the parent vessel, and stents in 22%.
Intraoperative adverse events were uncommon in both groups. They were numerically, but not significantly, less common in the hydrogel group. These included thromboembolism (8 vs. 12), intraoperative rupture (3 vs. 7), parent vessel occlusion (1 vs. 3), and vessel perforation (one in each group). There were no vessel dissections.
By 18 months, 20% of the hydrogel group and 29% of the platinum coil group had experienced the composite primary endpoint. The 9% absolute difference was statistically significant. It was largely driven by the subcomponents of major recurrence (12% vs. 18%) and re-treatment (3% vs. 6%).
An mRS of 3-5 was used as the proxy for patients whose clinical status prevented them from having angiographic follow-up. That endpoint occurred in three patients in the hydrogel group but in none of the platinum coil group. Dr. Taschner said that difference was not statistically significant.
In an analysis that stratified by baseline rupture status and by aneurysm size, the hydrogel coils were largely superior to bare platinum. However, the hydrogel coils were not significantly more effective than the platinum coils for aneurysms 10 mm or larger, Dr. Taschner noted.
There was no significant difference in the secondary endpoint of mRS at 18 months. Most patients (85% vs. 86%) did well, with an mRS of 0. Scores of 1-2 were seen in 9% of each group. An mRS of 3-5 occurred in 3% of the hydrogel group and 1% of the platinum coil group. There were 17 deaths: 7 in the hydrogel group and 10 in the platinum coil group (3% vs. 4%). This was not a significant difference.
Patients whose aneurysms were unruptured at baseline did significantly better than did those with ruptured lesions, although the mRS scores did not vary significantly between treatment groups. Among those with intact lesions, 90% of the hydrogel and 94% of the platinum coil group achieved an mRS of 0, and 2% of each group died. Among those with ruptured lesions at baseline, 78% of the hydrogel group and 75% of the platinum coil group achieved an mRS of 0. Five patients in the hydrogel group and seven in the platinum coil group died.
On the technical outcome of coil volume, hydrogel did somewhat better (0.041 cm3 vs. 0.038 cm3). The mean packing density was significantly higher (39% vs. 31%).
Dr. Taschner said the study provides good support for using the hydrogel coils in medium-sized aneurysms, and that other recent data reaffirm this.
“A recent trial in Canada and the U.S. looked at hydrogel coils in aneurysms 12 mm or larger, with broad necks, and it failed to show a benefit of the hydrogel coils.”
Additionally, a study published in January found that hydrogel coils were no better than platinum coils in 250 patients with large or recurrent aneurysms (AJNR Am J Neuroradiol. 2017 Jan 12. doi: 10.3174/ajnr.A5101).
“I myself would use them in medium-sized aneurysms with an unfavorable dome-to-neck ratio, and in those that have a broad neck. In those instances, I do think that hydrogel coils have their place. I wouldn’t use them in really large aneurysms. I don’t think they are well suited for that. In those cases, I would probably use platinum coils in combination with a flow diverter. That really provides very stable aneurysm occlusion with acceptable complication rates.”
Dr. Taschner said that he received research support from MicroVention during the study.
[email protected]
On Twitter @alz_gal
HOUSTON – Hydrogel coils significantly outperformed bare platinum coils in treating patients with medium-sized intracranial aneurysms, reducing the incidence of adverse outcomes by about 9% in an open-label, randomized trial.
Compared against the platinum coils, the self-expandable, hydrophilic coils scored significantly better on a composite endpoint of aneurysm recurrence at 18 months, re-treatment by 18 months, serious morbidity that prevented angiographic follow-up, and death, Christian Taschner, MD, said at the International Stroke Conference sponsored by the America Heart Association.
These are the company’s second-generation products, said Dr. Taschner, a neuroradiologist at University Hospital Freiburg (Germany). The initial hydrogel-coated coils were not well received because they were too stiff, he said in an interview.
The 18-month study comprised 513 patients and was conducted in 15 centers in France and 7 in Germany. Patients with medium-sized aneurysms (4-12 mm) were randomized to coiling with either the hydrogel coils or bare platinum coils and followed for 18 months. The cohort was stratified by rupture status in the analysis.
Angiographic images of the aneurysm were obtained before treatment, immediately after treatment, at 6 months, and at 18 months. All images were reviewed by an independent laboratory that was blinded to the treatment.
In addition to the primary composite outcome, the study assessed secondary endpoints of modified Rankin Scale (mRS) score at 18 months and coil packing density.
The final analysis included 484 patients. They were a mean of 52 years old, and about 70% were women. The aneurysms were ruptured at baseline in about 43% of cases. The mean aneurysm size was 7 mm, and the mean neck size, 3.5 mm. The dome-to-neck ratio was less than 1.5 in about a third of the group. Most lesions (89%) had anterior circulation.
Most patients needed some kind of adjunctive endovascular-assisting device during the procedure. These included balloon remodeling, which was necessary in about 50% of cases to help keep the coils from extruding into the parent vessel, and stents in 22%.
Intraoperative adverse events were uncommon in both groups. They were numerically, but not significantly, less common in the hydrogel group. These included thromboembolism (8 vs. 12), intraoperative rupture (3 vs. 7), parent vessel occlusion (1 vs. 3), and vessel perforation (one in each group). There were no vessel dissections.
By 18 months, 20% of the hydrogel group and 29% of the platinum coil group had experienced the composite primary endpoint. The 9% absolute difference was statistically significant. It was largely driven by the subcomponents of major recurrence (12% vs. 18%) and re-treatment (3% vs. 6%).
An mRS of 3-5 was used as the proxy for patients whose clinical status prevented them from having angiographic follow-up. That endpoint occurred in three patients in the hydrogel group but in none of the platinum coil group. Dr. Taschner said that difference was not statistically significant.
In an analysis that stratified by baseline rupture status and by aneurysm size, the hydrogel coils were largely superior to bare platinum. However, the hydrogel coils were not significantly more effective than the platinum coils for aneurysms 10 mm or larger, Dr. Taschner noted.
There was no significant difference in the secondary endpoint of mRS at 18 months. Most patients (85% vs. 86%) did well, with an mRS of 0. Scores of 1-2 were seen in 9% of each group. An mRS of 3-5 occurred in 3% of the hydrogel group and 1% of the platinum coil group. There were 17 deaths: 7 in the hydrogel group and 10 in the platinum coil group (3% vs. 4%). This was not a significant difference.
Patients whose aneurysms were unruptured at baseline did significantly better than did those with ruptured lesions, although the mRS scores did not vary significantly between treatment groups. Among those with intact lesions, 90% of the hydrogel and 94% of the platinum coil group achieved an mRS of 0, and 2% of each group died. Among those with ruptured lesions at baseline, 78% of the hydrogel group and 75% of the platinum coil group achieved an mRS of 0. Five patients in the hydrogel group and seven in the platinum coil group died.
On the technical outcome of coil volume, hydrogel did somewhat better (0.041 cm3 vs. 0.038 cm3). The mean packing density was significantly higher (39% vs. 31%).
Dr. Taschner said the study provides good support for using the hydrogel coils in medium-sized aneurysms, and that other recent data reaffirm this.
“A recent trial in Canada and the U.S. looked at hydrogel coils in aneurysms 12 mm or larger, with broad necks, and it failed to show a benefit of the hydrogel coils.”
Additionally, a study published in January found that hydrogel coils were no better than platinum coils in 250 patients with large or recurrent aneurysms (AJNR Am J Neuroradiol. 2017 Jan 12. doi: 10.3174/ajnr.A5101).
“I myself would use them in medium-sized aneurysms with an unfavorable dome-to-neck ratio, and in those that have a broad neck. In those instances, I do think that hydrogel coils have their place. I wouldn’t use them in really large aneurysms. I don’t think they are well suited for that. In those cases, I would probably use platinum coils in combination with a flow diverter. That really provides very stable aneurysm occlusion with acceptable complication rates.”
Dr. Taschner said that he received research support from MicroVention during the study.
[email protected]
On Twitter @alz_gal
AT THE INTERNATIONAL STROKE CONFERENCE
Key clinical point:
Major finding: Compared with bare-metal coils, hydrogel coils reduced by 9% the incidence of a composite primary outcome of recurrence, re-treatment, morbidity, and death.
Data source: An 18-month, open-label, randomized study of 513 patients.
Disclosures: MicroVention sponsored the study. Dr. Taschner said that he received research support from the company during the study.
Docs create guideline to aid workup of acute leukemia

Two physician groups have published an evidence-based guideline that addresses the initial workup of acute leukemia.
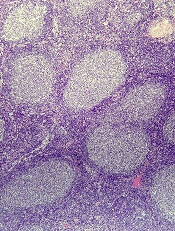
The guideline includes 27 recommendations intended to aid treating physicians and pathologists involved in the diagnostic and prognostic evaluation of acute leukemia samples, including those from patients with acute lymphoblastic leukemia, acute myeloid leukemia, and acute leukemias of ambiguous lineage.
The guideline, which was developed through a collaboration between the College of American Pathologists (CAP) and the American Society of Hematology (ASH), has been published in the Archives of Pathology and Laboratory Medicine.
The recommendations in the guideline will also be available in a pocket guide and via the ASH Pocket Guides app in March.
“With its multidisciplinary perspective, this guideline reflects contemporary, integrated cancer care, and, therefore, it will also help providers realize efficiencies in test management,” said ASH guideline co-chair James W. Vardiman, MD, of the University of Chicago in Illinois.
To create this guideline, Dr Vardiman and his colleagues sought and reviewed relevant published evidence.
The group set out to answer 6 questions for the initial diagnosis of acute leukemias:
1) What clinical and laboratory information should be available?
2) What samples and specimen types should be evaluated?
3) What tests are required for all patients during the initial evaluation?
4) What tests are required for only a subset of patients?
5) Where should laboratory testing be performed?
6) How should the results be reported?
The authors say the guideline’s 27 recommendations answer these questions, providing a framework for the steps involved in the evaluation of acute leukemia samples.
In particular, the guideline includes steps to coordinate and communicate across clinical teams, specifying information that must be shared—particularly among treating physicians and pathologists—for optimal patient outcomes and to avoid duplicative testing.
“The laboratory testing to diagnose acute leukemia and inform treatment is increasingly complex, making this guideline essential,” said CAP guideline co-chair Daniel A. Arber, MD, of the University of Chicago.
“New gene mutations and protein expressions have been described over the last decade in all types of acute leukemia, and many of them impact diagnosis or inform prognosis.” ![]()
Two physician groups have published an evidence-based guideline that addresses the initial workup of acute leukemia.
The guideline includes 27 recommendations intended to aid treating physicians and pathologists involved in the diagnostic and prognostic evaluation of acute leukemia samples, including those from patients with acute lymphoblastic leukemia, acute myeloid leukemia, and acute leukemias of ambiguous lineage.
The guideline, which was developed through a collaboration between the College of American Pathologists (CAP) and the American Society of Hematology (ASH), has been published in the Archives of Pathology and Laboratory Medicine.
The recommendations in the guideline will also be available in a pocket guide and via the ASH Pocket Guides app in March.
“With its multidisciplinary perspective, this guideline reflects contemporary, integrated cancer care, and, therefore, it will also help providers realize efficiencies in test management,” said ASH guideline co-chair James W. Vardiman, MD, of the University of Chicago in Illinois.
To create this guideline, Dr Vardiman and his colleagues sought and reviewed relevant published evidence.
The group set out to answer 6 questions for the initial diagnosis of acute leukemias:
1) What clinical and laboratory information should be available?
2) What samples and specimen types should be evaluated?
3) What tests are required for all patients during the initial evaluation?
4) What tests are required for only a subset of patients?
5) Where should laboratory testing be performed?
6) How should the results be reported?
The authors say the guideline’s 27 recommendations answer these questions, providing a framework for the steps involved in the evaluation of acute leukemia samples.
In particular, the guideline includes steps to coordinate and communicate across clinical teams, specifying information that must be shared—particularly among treating physicians and pathologists—for optimal patient outcomes and to avoid duplicative testing.
“The laboratory testing to diagnose acute leukemia and inform treatment is increasingly complex, making this guideline essential,” said CAP guideline co-chair Daniel A. Arber, MD, of the University of Chicago.
“New gene mutations and protein expressions have been described over the last decade in all types of acute leukemia, and many of them impact diagnosis or inform prognosis.” ![]()
First case of artemisinin resistance in Africa

Researchers have identified the first known case of artemisinin-resistant malaria originating in Africa, according to a letter published in NEJM.
Resistant Plasmodium falciparum parasites were detected in a Chinese man who had travelled from Equatorial Guinea to China.
The finding means Africa has joined Southeast Asia in hosting parasites that are partially resistant to the first-line antimalaria drug, artemisinin.
Researchers were able to confirm that the parasites in the current case carried a new mutation in the Kelch13 (K13) gene, the main driver for artemisinin resistance in Asia.
Then, the team set out to determine whether the parasite originated from Africa or Southeast Asia.
“We used whole-genome sequencing and bioinformatics tools we had previously developed—like detectives trying to link the culprit parasite to the crime scene,” explained Arnab Pain, PhD, of King Abdullah University of Science and Technology in Thuwal, Saudi Arabia.
Sequencing and analysis of P falciparum DNA unveiled its origin by disclosing the single nucleotide polymorphisms that vary according to the geographical source of the strain.
The researchers used the nuclear DNA, as well as the one present in 2 organelles of the parasite—the mitochondrium and the apicoplast.
Both methods independently validated the origin of the parasite as West African, confirming the first case of artemisinin resistance mediated by a K13 gene mutation on the African continent.
“The spread of artemisinin resistance in Africa would be a major setback in the fight against malaria, as ACT [artemisinin-based combination therapy] is the only effective and widely used antimalarial treatment at the moment,” Dr Pain said. “Therefore, it is very important to regularly monitor artemisinin resistance worldwide.” ![]()
Oncolytic virus can eradicate MM in mice

Myxoma virus (MYXV), a nonhuman oncolytic agent, has demonstrated efficacy in mouse models of multiple myeloma (MM), according to research published in Molecular Therapy—Oncolytics.
MYXV significantly improved overall survival in mice with MM, providing a modest delay in disease progression for about two-thirds of the mice and completely eradicating the disease in a quarter of them.
“[W]e could actually get rid of disease, and it didn’t appear to ever come back,” said study author Eric C. Bartee, PhD, of the Medical University of South Carolina in Charleston.
For the past several years, Dr Bartee has been using MYXV to treat MM in cell culture. He and his colleagues previously showed that MYXV was able to kill human MM cells.
The team found that treatment with MYXV could eradicate MM cells in patient stem cell samples prior to transplant, thereby preventing relapse of MM.
In the current study, Dr Bartee and his colleagues took this one step further by assessing whether treatment with MYXV also has a benefit on disease outside the context of transplantation.
Using a mouse model of MM, the researchers showed that systemic treatment with MYXV reduced tumor burden and led to a modest decrease in disease progression (about 6 days) in 66% of mice.
In 25% of mice, there was complete eradication of disease with no evidence of relapse.
Since MYXV does not replicate in MM cells, the researchers postulated that eradication was caused by the host’s immune system. Investigation of the bone marrow showed that it was unaffected by treatment with MYXV.
This suggested that the immune system remained functional and could combat MM. Indeed, treatment with MYXV led to an increase in CD8+ T cells in the bone marrow, indicating a strong antitumor response.
The researchers noted that, although these results are promising, there are hurdles that must be overcome before this treatment can be brought to the clinic. One hurdle is large-scale production of clinical-grade virus. Another is demonstrating a high response rate.
“I think the major next question is ‘How do you get that response rate from 25% to 50% to 80% to 100%?’” Dr Bartee said. “How do you define the patients in which it works?” ![]()
Eliminating tap water consumption may prevent M. abscessus outbreaks
Abstaining from the consumption of tap water at health care facilities can dramatically reduce the risk of Mycobacterium abscessus infections among patients and staff, according to a new study published in Clinical Infectious Diseases.
“Outbreaks of [M. abscessus] and other rapidly growing mycobacteria are common and have been associated with colonized plumbing systems in commercial buildings and health care facilities,” wrote the authors, led by Arthur W. Baker, MD, MPH, of Duke University, Durham, N.C., adding that “Infections due to M. abscessus are difficult to diagnose and typically require months of therapy using multiple antibiotics” (Clin Infect Dis. 2017 Jan 10. doi: 10.1093/cid/ciw877).
Phase 2 took place from December 2014 through June 2015; in between Phase 1 and Phase 2, tap water abstention was implemented to protect patients deemed high risk, such as those with lung transplants. Of the 71 infections that occurred during Phase 1, 39 (55%) were lung transplant patients, while 9 (13%) were in those who had a recent cardiac surgery, 5 (7%) had cancer, and 5 (7%) had hematopoietic stem cell transplants. Incidence rates decreased substantially, back to their baseline levels, and further measures were used to completely resolve the outbreak.
“Primary interventions included institution of an inpatient sterile water protocol for high-risk patients, implementation of a protocol for enhanced disinfection and sterile water use for [heater-cooler units] of [cardiopulmonary bypass] machines, and water engineering changes designed to decrease NTM [nontuberculous mycobacteria] burden in the plumbing system,” the authors explained. “Other health care facilities, particularly those with endemic NTM or newly constructed patient care facilities, should consider similar multifaceted strategies to improve water safety and decrease risk of health care–associated infection from NTM.”
The study was funded by the National Institutes of Health’s Transplant Infectious Disease Interdisciplinary Research Training Grant. Dr. Baker and his coauthors did not report any relevant financial disclosures.
FROM CLINICAL INFECTIOUS DISEASES
Key clinical point:
Major finding: After tap water avoidance, cases reduced from 3.0 cases per 10,000 patient-days to 0.7, the number at baseline pre-outbreak.
Data source: Prospective analysis of M. abscessus cases at a single institution during January 2013–December 2015.
Disclosures: Funded by a grant from the NIH. Authors reported no relevant disclosures.
Drug granted orphan status for follicular lymphoma
The US Food and Drug Administration (FDA) has granted orphan designation to G100 for the treatment of follicular lymphoma.
G100 is a synthetic small-molecule toll-like receptor-4 agonist, glucopyranosyl lipid A, formulated in a stable emulsion.
The FDA grants orphan designation to drugs and biologics intended to treat, diagnose, or prevent rare diseases/disorders affecting fewer than 200,000 people in the US.
Orphan designation provides companies with certain incentives to develop products for rare diseases. This includes a 50% tax break on research and development, a fee waiver, access to federal grants, and 7 years of market exclusivity if the product is approved.
G100 is being developed by Immune Design. The company says G100 works by leveraging the activation of innate and adaptive immunity in the tumor microenvironment to create an immune response against the tumor’s pre-existing antigens.
According to Immune Design, clinical and preclinical data have demonstrated G100’s ability to activate tumor-infiltrating lymphocytes, macrophages, and dendritic cells, and promote antigen-presentation and the recruitment of T cells to the tumor.
The ensuing induction of local and systemic immune responses has been shown to result in local and abscopal tumor control in preclinical studies.
In fact, G100, when combined with local radiation, demonstrated efficacy against A20 lymphoma in mice. This research was presented in a poster at the 2016 ASH Annual Meeting (abstract 4166).
In this study, investigators evaluated the immune response and therapeutic effects of intratumoral G100 alone, local radiation alone, and concomitant G100 and local radiation in mice with A20 lymphoma.
The investigators said the combination therapy demonstrated:
- Synergistic antitumor effects in both injected as well as uninjected tumors (abscopal effects)
- Synergistic induction of pro-inflammatory cytokine and chemokine environment, as well as induction of genes governing antigen processing and presentation
- Increased infiltration of T cells, including CD4 and CD8 T cells, in treated tumors.
In contrast, tumors that received only radiation had significantly lower T-cell levels than untreated tumors.
“These findings highlight the potential beneficial effect that immunotherapy with G100 could provide when given with radiation by modulating the tumor microenvironment to generate a systemic, durable, T-cell anti-tumor response,” said study investigator Ramesh Rengan, MD, of the University of Washington in Seattle.
“As shown in this model, G100 may hold potential as a treatment for lymphoma patients.”
To test that theory, Immune Design is conducting a phase 1/2 trial of G100 given with local radiation or the anti-PD-1 agent pembrolizumab to patients with follicular lymphoma. ![]()
Following infection, semen is Zika’s last refuge
SEATTLE – Zika virus RNA lingered longer in semen than in any other body fluid but was cleared by 95% of men after 3 months, according to investigators from the Centers for Disease Control and Prevention.
The findings support the agency’s recommendation that men abstain from sex or use a condom for 6 months after coming down with symptoms. There had been concern following case reports of two men with semen positive for Zika RNA beyond 180 days, but further study supported the recommendation.
Many wondered if 6 months was too short, creating “a lot of anxiety and some confusion. It was good to find that [6 months is fine],” said senior CDC epidemiologist and lead investigator Gabriela Paz-Bailey, MD. “Based on our findings, late detection seems rare,” and the longest any infectious virus has been found in semen is 69 days.
The investigation team collected body fluids for 6 months from 150 patients in Puerto Rico who had confirmed Zika infection. Samples included semen samples from 55 men and vaginal secretions from 95 women in the study. Most of the participants presented to a hospital with symptoms, but some were household contacts who didn’t remember symptoms until asked.
“We found that two out of every three people who have evidence of infection reported symptoms,” which was higher than what was expected for an infection thought to be asymptomatic in many who remembered symptoms only when drilled by persistent epidemiologists. “You have to ask the questions,” Dr. Paz-Bailey said at the annual Conference on Retroviruses & Opportunistic Infections in partnership with the International Antiviral Society.
The samples were tested by reverse transcriptase polymerase chain reaction to see how long viral RNA stayed in various body fluids. Urine often is used to screen patients for Zika RNA, but the team found that virus evidence lasts longer in serum. While half of patients still had Zika RNA in their serum 2 weeks after symptom onset, and 5% were positive after about 2 months, urine was positive for Zika RNA in half of patients for only about a week. After 39 days, only 5% had RNA in their urine.
“It was thought that you could detect the virus more often in urine. We found the opposite. This is new. Serum may be a superior diagnostic specimen compared to urine,” Dr. Paz-Bailey said.
Additionally, RNA was found in semen longer than any other fluid, with about half of men positive after a month and 5% at about 3 months. The maximum for detection of Zika RNA in semen was 125 days. Meanwhile, RNA was largely undetectable in saliva and vaginal fluids after a week.
Until now, the 6-month window for men has been based on case reports and cross-sectional observations, mostly of travelers returning to the United States. The new findings bolster the 6-month abstinence or condom use recommendation but also support advice that women avoid pregnancy for 2 months following symptom onset, although the evidence for a 2-month window in women isn’t as strong.
The serum findings “suggest that the risk of intrauterine transmission ... is small” in women trying to conceive toward the end of the 2-month period, but “we will continue to monitor women of reproductive age to inform evaluations of these recommendations,” Dr. Paz-Bailey and her colleagues said in a report published after the presentation (N Engl J Med. 2017 Feb 14. doi: 10.1056/NEJMoa1613108).
It’s unclear if finding Zika RNA in body fluids means that there’s still active virus that can be transmitted. The team is plating out their specimens to see if they grow live virus.
The results are from an interim analysis. CDC plans to recruit at least 300 people into the study.
Dr. Paz-Bailey had no relevant financial disclosures. CDC funded the work.
AT CROI
Key clinical point:
Major finding: Semen still had detectable Zika RNA in about half of men after a month and 5% at about 3 months. The maximum for detection in semen was 125 days.
Data source: A study of 150 patients in Puerto Rica with confirmed Zika infection.
Disclosures: The lead investigator had no disclosures. CDC funded the work.
Anticoagulant resumption after ICH aids patients
HOUSTON – Even when patients on an oral anticoagulant have the dreaded complication of an intracerebral hemorrhage, resumption of their oral anticoagulation regimen appears to produce the best midterm outcomes, based on a meta-analysis of data from more than 1,000 patients collected in three observational studies.
Resumption of oral anticoagulation therapy (OAT) is a “major dilemma” when managing patients who developed an intracerebral hemorrhage (ICH) while on OAT, said Alessandro Biffi, MD, explaining why he performed this meta-analysis that he presented at the International Stroke Conference sponsored by the American Heart Association.
He used individual patient data collected from a total of 1,027 patients enrolled in any of three different observational studies: the German-wide Multicenter Analysis of Oral Anticoagulation Associated Intracerebral Hemorrhage (RETRACE) study, the MGH longitudinal ICH study, or the Ethnic/Racial Variations of Intracerebral Hemorrhage (ERICH) study. Overall 26% of the patients resumed OAT following their ICH, although the rate ranged from a low of 20% in one study to a high of 42% in another. The vast majority of patients received a vitamin K antagonist as their anticoagulant; very few received a new oral anticoagulant.
Using propensity score matching to compare similar patients who resumed or stayed off OAT, Dr. Biffi found that, during the year following the index ICH, mortality was 71%-74% lower among patients who resumed OAT. Recurrent all-cause stroke was 49%-55% lower with resumed OAT, and favorable functional outcomes (a score of 0-3 on the modified Rankin scale) were more than fourfold higher with OAT resumption, he reported.
Dr. Biffi calculated these relative rates, both for patients with a lumbar location of their ICH and for those with a nonlumbar location, and found that location had no influence on responsiveness to OAT. Patients with an index ICH in a lumbar location had a trend toward more recurrent ICH on OAT, a 26% higher rate relative to patients not resumed on OAT, but this difference fell short of statistical significance.
The only factor he found that linked with whether or not patients resumed OAT was the severity of their index ICH. The more severe their bleed, the less likely were patients to resume. Aside from that, “there is a lot of variation in practice,” he said. “We are gathering additional data” to try to further address this question.
Dr. Biffi had no disclosures.
[email protected]
On Twitter @mitchelzoler
Resuming oral anticoagulation following an intracerebral hemorrhage is one of the most vexing problems today in vascular neurology. It’s a situation that often happens, and it will grow increasingly more common as the number of patients with atrial fibrillation escalates and even more people start oral anticoagulation.

It’s also very important to remember that patients like these who need oral anticoagulation but now have a history of ICH must have all their other cardiovascular disease risk factors very well controlled: their blood pressure, their diabetes, their smoking, etc. Oral anticoagulation may be important for these patients, but tight risk factor control is even more important.
I agree with Dr. Biffi that a prospective, randomized trial is the best way to get more information to help guide resuming oral anticoagulation. Observational studies are significantly limited by ascertainment bias, and for these patients there are also many variables – at least a dozen – that can influence whether or not a patient resumes oral anticoagulation. Dr. Biffi’s findings are interesting, but the limitations of his data prevent the results from being truly compelling.
It would be very helpful to have data from a trial that randomized ICH patients who required anticoagulation to a full-dose NOAC, a reduced-dose NOAC, or aspirin and see which group had the best long-term outcome. Whatever the results, it would change practice. It’s intriguing to speculate that a reduced-dose NOAC might provide adequate ischemic protection with a reduced risk for more bleeding.
Mark J. Alberts, MD , is chief of neurology at Hartford (Conn.) Hospital. He had no disclosures. He made these comments in an interview and during a press conference.
Resuming oral anticoagulation following an intracerebral hemorrhage is one of the most vexing problems today in vascular neurology. It’s a situation that often happens, and it will grow increasingly more common as the number of patients with atrial fibrillation escalates and even more people start oral anticoagulation.
It’s also very important to remember that patients like these who need oral anticoagulation but now have a history of ICH must have all their other cardiovascular disease risk factors very well controlled: their blood pressure, their diabetes, their smoking, etc. Oral anticoagulation may be important for these patients, but tight risk factor control is even more important.
I agree with Dr. Biffi that a prospective, randomized trial is the best way to get more information to help guide resuming oral anticoagulation. Observational studies are significantly limited by ascertainment bias, and for these patients there are also many variables – at least a dozen – that can influence whether or not a patient resumes oral anticoagulation. Dr. Biffi’s findings are interesting, but the limitations of his data prevent the results from being truly compelling.
It would be very helpful to have data from a trial that randomized ICH patients who required anticoagulation to a full-dose NOAC, a reduced-dose NOAC, or aspirin and see which group had the best long-term outcome. Whatever the results, it would change practice. It’s intriguing to speculate that a reduced-dose NOAC might provide adequate ischemic protection with a reduced risk for more bleeding.
Mark J. Alberts, MD , is chief of neurology at Hartford (Conn.) Hospital. He had no disclosures. He made these comments in an interview and during a press conference.
HOUSTON – Even when patients on an oral anticoagulant have the dreaded complication of an intracerebral hemorrhage, resumption of their oral anticoagulation regimen appears to produce the best midterm outcomes, based on a meta-analysis of data from more than 1,000 patients collected in three observational studies.
Resumption of oral anticoagulation therapy (OAT) is a “major dilemma” when managing patients who developed an intracerebral hemorrhage (ICH) while on OAT, said Alessandro Biffi, MD, explaining why he performed this meta-analysis that he presented at the International Stroke Conference sponsored by the American Heart Association.
He used individual patient data collected from a total of 1,027 patients enrolled in any of three different observational studies: the German-wide Multicenter Analysis of Oral Anticoagulation Associated Intracerebral Hemorrhage (RETRACE) study, the MGH longitudinal ICH study, or the Ethnic/Racial Variations of Intracerebral Hemorrhage (ERICH) study. Overall 26% of the patients resumed OAT following their ICH, although the rate ranged from a low of 20% in one study to a high of 42% in another. The vast majority of patients received a vitamin K antagonist as their anticoagulant; very few received a new oral anticoagulant.
Using propensity score matching to compare similar patients who resumed or stayed off OAT, Dr. Biffi found that, during the year following the index ICH, mortality was 71%-74% lower among patients who resumed OAT. Recurrent all-cause stroke was 49%-55% lower with resumed OAT, and favorable functional outcomes (a score of 0-3 on the modified Rankin scale) were more than fourfold higher with OAT resumption, he reported.
Dr. Biffi calculated these relative rates, both for patients with a lumbar location of their ICH and for those with a nonlumbar location, and found that location had no influence on responsiveness to OAT. Patients with an index ICH in a lumbar location had a trend toward more recurrent ICH on OAT, a 26% higher rate relative to patients not resumed on OAT, but this difference fell short of statistical significance.
The only factor he found that linked with whether or not patients resumed OAT was the severity of their index ICH. The more severe their bleed, the less likely were patients to resume. Aside from that, “there is a lot of variation in practice,” he said. “We are gathering additional data” to try to further address this question.
Dr. Biffi had no disclosures.
[email protected]
On Twitter @mitchelzoler
AT THE INTERNATIONAL STROKE CONFERENCE
Key clinical point:
Major finding: One-year mortality was 71%-74% lower among patients who resumed oral anticoagulation relative to those who did not.
Data source: Meta-analysis of data from 1,027 patients collected in three observational studies.
Disclosures: Dr. Biffi had no disclosures.