User login
Treating polycystic ovary syndrome: Start using dual medical therapy
Using the Rotterdam criteria, the diagnosis of polycystic ovary syndrome (PCOS) is made in the presence of 2 of the following 3 criteria1:
- oligo-ovulation or anovulation
- hyperandrogenism manifested by the presence of either hirsutism or elevated hormone levels (including serum testosterone androstenedione and/or dehydroepiandrosterone sulfate)
- ultrasonography evidence of multifollicular ovaries (≥12 follicles with a diameter of 2 mm to 9 mm in one or both ovaries; FIGURE) or ovarian stromal volume of 10 mL or more.

Among reproductive-age women, the prevalence of PCOS has been reported to range from 8% to 13% for different populations.2 Most clinicians initiate treatment for PCOS with oral estrogen−progestin (OEP) monotherapy. OEP treatment has many beneficial hormonal effects, including:
- a resulting decrease in pituitary luteinizing hormone (LH) secretion, which decreases ovarian androgen production
- an increase in liver production of sex hormone−binding globulin (SHBG), which decreases free testosterone levels
- protection against the development of endometrial hyperplasia
- induction of regular uterine withdrawal bleeding.
However, OEP therapy neither improves metabolic indices (insulin sensitivity and visceral fat secretion of adipokines) nor blocks androgen action in the skin.
Dual medical treatment for PCOS can address the issues that monotherapy cannot and, along with providing guidance on improving diet and exercise, many experts support the initial therapy of PCOS with dual medical therapy (OEP plus metformin or spironolactone).
Advantages of OEP plus metformin
For many women with PCOS, the syndrome is characterized by abnormalities in both the reproductive (increase in LH secretion) and metabolic (insulin resistance and increased adipokines) systems. OEP monotherapy does not improve the metabolic abnormalities of PCOS. Combination treatment with both OEP plus metformin, along with diet and exercise, can best treat these combined abnormalities.
Data support dual therapy with metformin. In one small, randomized trial in women with PCOS, OEP plus metformin (1,500 mg daily) resulted in a greater reduction in serum androstenedione and a greater increase in SHBG than OEP monotherapy.3 In addition, weight loss and a reduction in waist-to-hip ratio only occurred in the OEP plus metformin group.3 In another small randomized study in women with PCOS, OEP plus metformin (1,500 mg daily) resulted in a greater decrease in free androgen index than OEP monotherapy.4
In my clinical opinion, women who may best benefit from OEP plus metformin therapy have one of the following factors indicating the presence of insulin resistance5:
- body mass index >30 kg/m2
- waist-to-hip ratio ≥0.85
- waist circumference >35 in (89 cm)
- acanthosis nigricans
- personal history of gestational diabetes
- family history of type 2 diabetes mellitus (T2DM) in a first-degree relative
- diagnosis of the metabolic syndrome.
My preferred treatment approach
Metformin is a low cost and safe treatment for metabolic dysfunction due to insulin resistance and excess adipokines. I often start PCOS treatment for my patients with an OEP plus metformin extended release (XR) 750 mg with dinner. If the patient tolerates this dose, I increase the dose to metformin XR 1,500 mg with dinner.
Adverse effects. The most common side effects of metformin are gastrointestinal, including abdominal discomfort, flatulence, borborygmi, diarrhea, and nausea. Metformin reduces serum vitamin B12 levels by 5% to 10%; therefore, ensuring adequate vitamin B12 intake (2.6 µg daily) is helpful.6 Although metformin does reduce vitamin B12 levels, there is no strong relationship between metformin and anemia or peripheral neuropathy.7 Lactic acidosis is a rare complication of metformin.
Beneficial effects. In the treatment of PCOS, metformin may have many beneficial effects, including8:
- decrease in insulin resistance
- decrease in harmful adipokines
- reduction in visceral fat
- reduction in the incidence of T2DM.
- oral norethindrone acetate 5 mg daily (which can lower luteinizing hormone levels and block ovulation) plus metformin
- norethindrone acetate 5 mg plus spironolactone
- levonorgestrel-intrauterine device plus metformin or spironolactone.
OEP plus spironolactone
Many women with PCOS have increased LH secretion and increased androgen activity in the skin due to increased 5-alpha reductase enzyme activity, which catalyzes the conversion of testosterone to the powerful intracellular androgen dihydrotestosterone.9 Women with PCOS may present with a chief problem report of hirsutism, acne, or female androgenetic alopecia. OEP plus spironolactone may be an optimal initial treatment for women with a dominant dermatologic manifestation of PCOS. OEP treatment results in a decrease in pituitary LH secretion and ovarian androgen production. Spironolactone adds to this therapeutic effect by blocking androgen action in the skin.
The data on dual therapy with spironolactone. Many dermatologists recommend spironolactone in combination with cosmetic measures for the treatment of acne, but there are only a few randomized trials that demonstrate its efficacy.10 In one trial spironolactone was demonstrated to be superior to placebo for the treatment of inflammatory acne.10 Authors of multiple randomized trials report that the antiandrogens, spironolactone, or finasteride are superior to metformin to treat hirsutism.11 In addition, a few small trials report that spironolactone plus OEP is superior to either OEP or metformin monotherapy for hirsutism.11 Clinical trials of spironolactone for hirsutism have been rated as “low quality” and additional controlled trials of OEP monotherapy versus OEP plus spironolactone are warranted.12
My preferred treatment approach
Spironolactone is effective in the treatment of hirsutism at doses ranging from 50 mg to 200 mg daily. I routinely use a dose of spironolactone 100 mg daily because this dose is near of the top of the dose-response curve and has few adverse effects (such as intermittent uterine bleeding or spotting). With spironolactone monotherapy at a dose of 200 mg, irregular uterine bleeding or spotting is common, but concomitant treatment with an OEP tends to minimize this side effect. In my practice I rarely have patients report irregular uterine bleeding or spotting with the combination treatment of an OEP and spironolactone 100 mg daily.
Contraindications. Spironolactone should not be given to women with renal insufficiency because it can cause hyperkalemia. However, it is not necessary to check potassium levels in young women taking spironolactone with normal creatinine levels.13
Triple therapy: OEP plus metformin plus spironolactone
Some experts strongly recommend the initial treatment of PCOS in adolescents and young women with triple therapy: OEP plus an insulin sensitizer plus an antiandrogen.14 This recommendation is based in part on the observation that OEP monotherapy may be associated with an increase in circulating adipokines and visceral fat mass as determined by dual-energy x-ray absorptiometry.15 By contrast, triple treatment with an OEP plus metformin plus an antiandrogen is associated with a decrease in circulating adipokines and visceral fat mass.
What is the best progestin for PCOS?
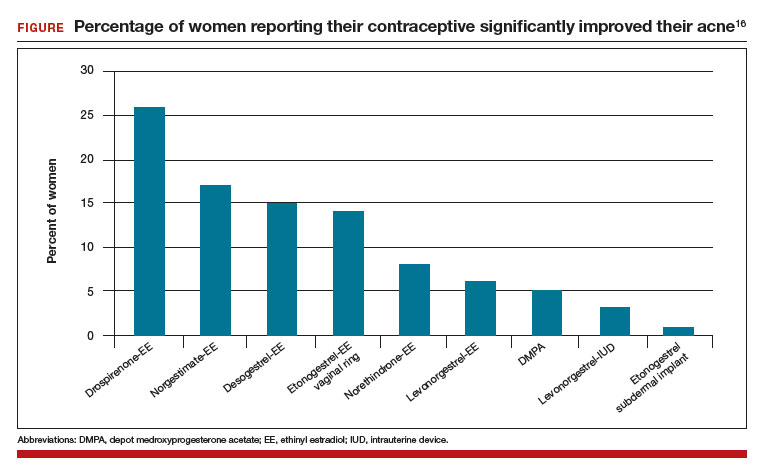
Any OEP is better than no OEP, regardless of the progestin used to treat the PCOS because ethinyl estradiol plus any synthetic progestin suppresses pituitary secretion of LH and decreases ovarian androgen production. However, for the treatment of acne, using a progestin that is less androgenic may be beneficial.16
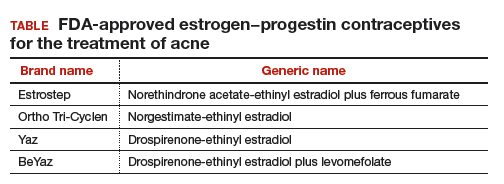
In one study, 2,147 consecutive women who were taking a contraceptive and presented for treatment of acne were asked if their contraceptive had a positive impact on their acne. The percentage of women reporting that their contraceptive significantly improved their acne ranged from 26% for those taking drospirenone-ethinyl estradiol (EE) to 1% for those taking the etonogestrel subdermal implant (FIGURE).16 The US Food and Drug Administration has approved 4 OEP contraceptives for the treatment of acne (TABLE). The OEPs with drospirenone, norgestimate, desogestrel, or norethindrone acetate may be optimal choices for the treatment of acne caused by PCOS.
The bottom line
PCOS is a common endocrine disorder treated primarily by obstetricians-gynecologists. Among adolescents and young women with PCOS chief problem reports include irregular menses, hirsutism, obesity, acne, and infertility. Among mid-life women the presentation of PCOS often evolves into chronic medical problems, including obesity, metabolic syndrome, hyperlipidemia, hypertension, T2DM, cardiovascular disease, and endometrial cancer.17–19 To optimally treat the multiple pathophysiologic disorders manifested in PCOS, I recommend initial dual medical therapy with an OEP plus metformin or an OEP plus spironolactone.
Share your thoughts! Send your Letter to the Editor to [email protected]. Please include your name and the city and state in which you practice.
- Rotterdam ESHRE/ASRM-sponsored PCOS Consensus Workshop Group. Revised 2003 consensus on diagnostic criteria and long-term health risks related to polycystic ovary syndrome (PCOS). Hum Reprod. 2004;19(1):41-47.
- Bozdag G, Mumusoglu S, Zengin D, Karabulut E, Yildiz BO. The prevalence and phenotypic features of polycystic ovary syndrome: a systematic review and meta-analysis. Hum Reprod. 2016;31(12):2841-2855.
- Elter K, Imir G, Durmusoglu F. Clinical, endocrine and metabolic effects of metformin added to ethinyl estradiol-cyproterone acetate in non-obese women with polycystic ovarian syndrome: a randomized controlled study. Hum Reprod. 2002;17(7):1729-1737.
- Cibula D, Fanta M, Vrbikova J, et al. The effect of combination therapy with metformin and combined oral contraceptives (COC) versus COC alone on insulin sensitivity, hyperandrogenism, SHBG and lipids in PCOS patients. Hum Reprod. 2005;20(1):180-184.
- Grundy SM, Brewer HB, Cleeman JI, Smith SC Jr, Lenfant C; American Heart Association; National Heart, Lung, and Blood Institute. Definition of metabolic syndrome: Report of the National Heart, Lung, and Blood Institute/American Heart Association conference on scientific issues related to definition. Circulation. 2004;109(3):433-438.
- Niafar M, Hai F, Porhomayon J, Nader ND. The role of metformin on vitamin B12 deficiency: a meta-analysis review. Intern Emerg Med. 2015;10(1):93-102.
- de Groot-Kamphuis DM, van Dijk PR, Groenier KH, Houweling St, Bilo HJ, Kleefstra N. Vitamin B12 deficiency and the lack of its consequences in type 2 diabetes patients using metformin. Neth J Med. 2013;71(7):386-390.
- Diamanti-Kandarakis E, Christakou CD, Kandaraki E, Economou FN. Metformin: an old medication of new fashion: evolving new molecular mechanisms and clinical implications in polycystic ovary syndrome. Eur J Endocrinol. 2010;162(2):193-212.
- Skalba P, Dabkowska-Huc A, Kazimierczak W, Samojedny A, Samojedny MP, Chelmicki Z. Content of 5-alph-reductase (type 1 and type 2) mRNA in dermal papillae from the lower abdominal region in women with hirsutism. Clin Exp Dermatol. 2006;31(4):564-570.
- Layton AM, Eady EA, Whitehouse H, Del Rosso JQ, Fedorowicz Z, van Zuuren EJ. Oral spironolactone for acne vulgaris in adult females: a hybrid systematic review. Am J Clin Dermatol. 2017;18(2):169-191.
- Swiglo BA, Cosma M, Flynn DN, et al. Clinical review: antiandrogens for the treatment of hirsutism: a systematic review and meta-analysis of randomized controlled trials. J Clin Endocrinol Metab. 2008;93(4):1153-1160.
- van Zuuren EJ, Fedorowicz Z. Interventions for hirsutism excluding laser and photoepilation therapy alone: abridged Cochrane systematic review including GRADE assessments. Br J Dermatol. 2016;175(1):45-61.
- Plovanich M, Weng QY, Mostaghimi A. Low usefulness of potassium monitoring among healthy young women taking spironolactone for acne. JAMA Dermatol. 2015;151(9):941-944.
- Ibanez L, de Zegher F. Low-dose combination of flutamide, metformin and an oral contraceptive for non-obese, young women with polycystic ovary syndrome. Hum Reprod. 2003;18(1):57-60.
- Ibanez L, de Zegher F. Ethinyl estradiol-drospirenone, flutamide-metformin or both for adolescents and women with hyperinsulinemic hyperandrogenism: opposite effects on adipocytokines and body adiposity. J Clin Endocrinol Metab. 2004;89(4):1592-1597.
- Lortscher D, Admani S, Stur N, Eichenfield LF. Hormonal contraceptives and acne: a retrospective analysis of 2147 patients. J Drugs Dermatol. 2016;15(6):670-674.
- Wang ET, Calderon-Margalit R, Cedars MI, et al. Polycystic ovary syndrome and risk for long-term diabetes and dyslipidemia. Obstet Gynecol. 2011;117(1):6-13.
- Joham AE, Raniasinha S, Zoungas S, Moran L, Teede HJ. Gestational diabetes and type 2 diabetes in reproductive aged women with polycystic ovary syndrome. J Clin Endocrinol Metab. 2014;99(3):e447-e452.
- Gottschau M, Kjaer SK, Jensen A, Munk C, Mellemkjaer L. Risk of cancer among women with polycystic ovary syndrome: a Danish cohort study. Gynecol Oncol. 2015;136(1):99-103.

Dr. Barbieri is Editor in Chief, OBG Management; Chair, Obstetrics and Gynecology, Brigham and Women’s Hospital; and Kate Macy Ladd Professor of Obstetrics, Gynecology, and Reproductive Biology, Harvard Medical School, Boston, Massachusetts.
Dr. Barbieri reports no financial relationships relevant to this article.
Using the Rotterdam criteria, the diagnosis of polycystic ovary syndrome (PCOS) is made in the presence of 2 of the following 3 criteria1:
- oligo-ovulation or anovulation
- hyperandrogenism manifested by the presence of either hirsutism or elevated hormone levels (including serum testosterone androstenedione and/or dehydroepiandrosterone sulfate)
- ultrasonography evidence of multifollicular ovaries (≥12 follicles with a diameter of 2 mm to 9 mm in one or both ovaries; FIGURE) or ovarian stromal volume of 10 mL or more.
Among reproductive-age women, the prevalence of PCOS has been reported to range from 8% to 13% for different populations.2 Most clinicians initiate treatment for PCOS with oral estrogen−progestin (OEP) monotherapy. OEP treatment has many beneficial hormonal effects, including:
- a resulting decrease in pituitary luteinizing hormone (LH) secretion, which decreases ovarian androgen production
- an increase in liver production of sex hormone−binding globulin (SHBG), which decreases free testosterone levels
- protection against the development of endometrial hyperplasia
- induction of regular uterine withdrawal bleeding.
However, OEP therapy neither improves metabolic indices (insulin sensitivity and visceral fat secretion of adipokines) nor blocks androgen action in the skin.
Dual medical treatment for PCOS can address the issues that monotherapy cannot and, along with providing guidance on improving diet and exercise, many experts support the initial therapy of PCOS with dual medical therapy (OEP plus metformin or spironolactone).
Advantages of OEP plus metformin
For many women with PCOS, the syndrome is characterized by abnormalities in both the reproductive (increase in LH secretion) and metabolic (insulin resistance and increased adipokines) systems. OEP monotherapy does not improve the metabolic abnormalities of PCOS. Combination treatment with both OEP plus metformin, along with diet and exercise, can best treat these combined abnormalities.
Data support dual therapy with metformin. In one small, randomized trial in women with PCOS, OEP plus metformin (1,500 mg daily) resulted in a greater reduction in serum androstenedione and a greater increase in SHBG than OEP monotherapy.3 In addition, weight loss and a reduction in waist-to-hip ratio only occurred in the OEP plus metformin group.3 In another small randomized study in women with PCOS, OEP plus metformin (1,500 mg daily) resulted in a greater decrease in free androgen index than OEP monotherapy.4
In my clinical opinion, women who may best benefit from OEP plus metformin therapy have one of the following factors indicating the presence of insulin resistance5:
- body mass index >30 kg/m2
- waist-to-hip ratio ≥0.85
- waist circumference >35 in (89 cm)
- acanthosis nigricans
- personal history of gestational diabetes
- family history of type 2 diabetes mellitus (T2DM) in a first-degree relative
- diagnosis of the metabolic syndrome.
My preferred treatment approach
Metformin is a low cost and safe treatment for metabolic dysfunction due to insulin resistance and excess adipokines. I often start PCOS treatment for my patients with an OEP plus metformin extended release (XR) 750 mg with dinner. If the patient tolerates this dose, I increase the dose to metformin XR 1,500 mg with dinner.
Adverse effects. The most common side effects of metformin are gastrointestinal, including abdominal discomfort, flatulence, borborygmi, diarrhea, and nausea. Metformin reduces serum vitamin B12 levels by 5% to 10%; therefore, ensuring adequate vitamin B12 intake (2.6 µg daily) is helpful.6 Although metformin does reduce vitamin B12 levels, there is no strong relationship between metformin and anemia or peripheral neuropathy.7 Lactic acidosis is a rare complication of metformin.
Beneficial effects. In the treatment of PCOS, metformin may have many beneficial effects, including8:
- decrease in insulin resistance
- decrease in harmful adipokines
- reduction in visceral fat
- reduction in the incidence of T2DM.
- oral norethindrone acetate 5 mg daily (which can lower luteinizing hormone levels and block ovulation) plus metformin
- norethindrone acetate 5 mg plus spironolactone
- levonorgestrel-intrauterine device plus metformin or spironolactone.
OEP plus spironolactone
Many women with PCOS have increased LH secretion and increased androgen activity in the skin due to increased 5-alpha reductase enzyme activity, which catalyzes the conversion of testosterone to the powerful intracellular androgen dihydrotestosterone.9 Women with PCOS may present with a chief problem report of hirsutism, acne, or female androgenetic alopecia. OEP plus spironolactone may be an optimal initial treatment for women with a dominant dermatologic manifestation of PCOS. OEP treatment results in a decrease in pituitary LH secretion and ovarian androgen production. Spironolactone adds to this therapeutic effect by blocking androgen action in the skin.
The data on dual therapy with spironolactone. Many dermatologists recommend spironolactone in combination with cosmetic measures for the treatment of acne, but there are only a few randomized trials that demonstrate its efficacy.10 In one trial spironolactone was demonstrated to be superior to placebo for the treatment of inflammatory acne.10 Authors of multiple randomized trials report that the antiandrogens, spironolactone, or finasteride are superior to metformin to treat hirsutism.11 In addition, a few small trials report that spironolactone plus OEP is superior to either OEP or metformin monotherapy for hirsutism.11 Clinical trials of spironolactone for hirsutism have been rated as “low quality” and additional controlled trials of OEP monotherapy versus OEP plus spironolactone are warranted.12
My preferred treatment approach
Spironolactone is effective in the treatment of hirsutism at doses ranging from 50 mg to 200 mg daily. I routinely use a dose of spironolactone 100 mg daily because this dose is near of the top of the dose-response curve and has few adverse effects (such as intermittent uterine bleeding or spotting). With spironolactone monotherapy at a dose of 200 mg, irregular uterine bleeding or spotting is common, but concomitant treatment with an OEP tends to minimize this side effect. In my practice I rarely have patients report irregular uterine bleeding or spotting with the combination treatment of an OEP and spironolactone 100 mg daily.
Contraindications. Spironolactone should not be given to women with renal insufficiency because it can cause hyperkalemia. However, it is not necessary to check potassium levels in young women taking spironolactone with normal creatinine levels.13
Triple therapy: OEP plus metformin plus spironolactone
Some experts strongly recommend the initial treatment of PCOS in adolescents and young women with triple therapy: OEP plus an insulin sensitizer plus an antiandrogen.14 This recommendation is based in part on the observation that OEP monotherapy may be associated with an increase in circulating adipokines and visceral fat mass as determined by dual-energy x-ray absorptiometry.15 By contrast, triple treatment with an OEP plus metformin plus an antiandrogen is associated with a decrease in circulating adipokines and visceral fat mass.
What is the best progestin for PCOS?
Any OEP is better than no OEP, regardless of the progestin used to treat the PCOS because ethinyl estradiol plus any synthetic progestin suppresses pituitary secretion of LH and decreases ovarian androgen production. However, for the treatment of acne, using a progestin that is less androgenic may be beneficial.16
In one study, 2,147 consecutive women who were taking a contraceptive and presented for treatment of acne were asked if their contraceptive had a positive impact on their acne. The percentage of women reporting that their contraceptive significantly improved their acne ranged from 26% for those taking drospirenone-ethinyl estradiol (EE) to 1% for those taking the etonogestrel subdermal implant (FIGURE).16 The US Food and Drug Administration has approved 4 OEP contraceptives for the treatment of acne (TABLE). The OEPs with drospirenone, norgestimate, desogestrel, or norethindrone acetate may be optimal choices for the treatment of acne caused by PCOS.
The bottom line
PCOS is a common endocrine disorder treated primarily by obstetricians-gynecologists. Among adolescents and young women with PCOS chief problem reports include irregular menses, hirsutism, obesity, acne, and infertility. Among mid-life women the presentation of PCOS often evolves into chronic medical problems, including obesity, metabolic syndrome, hyperlipidemia, hypertension, T2DM, cardiovascular disease, and endometrial cancer.17–19 To optimally treat the multiple pathophysiologic disorders manifested in PCOS, I recommend initial dual medical therapy with an OEP plus metformin or an OEP plus spironolactone.
Share your thoughts! Send your Letter to the Editor to [email protected]. Please include your name and the city and state in which you practice.
- Rotterdam ESHRE/ASRM-sponsored PCOS Consensus Workshop Group. Revised 2003 consensus on diagnostic criteria and long-term health risks related to polycystic ovary syndrome (PCOS). Hum Reprod. 2004;19(1):41-47.
- Bozdag G, Mumusoglu S, Zengin D, Karabulut E, Yildiz BO. The prevalence and phenotypic features of polycystic ovary syndrome: a systematic review and meta-analysis. Hum Reprod. 2016;31(12):2841-2855.
- Elter K, Imir G, Durmusoglu F. Clinical, endocrine and metabolic effects of metformin added to ethinyl estradiol-cyproterone acetate in non-obese women with polycystic ovarian syndrome: a randomized controlled study. Hum Reprod. 2002;17(7):1729-1737.
- Cibula D, Fanta M, Vrbikova J, et al. The effect of combination therapy with metformin and combined oral contraceptives (COC) versus COC alone on insulin sensitivity, hyperandrogenism, SHBG and lipids in PCOS patients. Hum Reprod. 2005;20(1):180-184.
- Grundy SM, Brewer HB, Cleeman JI, Smith SC Jr, Lenfant C; American Heart Association; National Heart, Lung, and Blood Institute. Definition of metabolic syndrome: Report of the National Heart, Lung, and Blood Institute/American Heart Association conference on scientific issues related to definition. Circulation. 2004;109(3):433-438.
- Niafar M, Hai F, Porhomayon J, Nader ND. The role of metformin on vitamin B12 deficiency: a meta-analysis review. Intern Emerg Med. 2015;10(1):93-102.
- de Groot-Kamphuis DM, van Dijk PR, Groenier KH, Houweling St, Bilo HJ, Kleefstra N. Vitamin B12 deficiency and the lack of its consequences in type 2 diabetes patients using metformin. Neth J Med. 2013;71(7):386-390.
- Diamanti-Kandarakis E, Christakou CD, Kandaraki E, Economou FN. Metformin: an old medication of new fashion: evolving new molecular mechanisms and clinical implications in polycystic ovary syndrome. Eur J Endocrinol. 2010;162(2):193-212.
- Skalba P, Dabkowska-Huc A, Kazimierczak W, Samojedny A, Samojedny MP, Chelmicki Z. Content of 5-alph-reductase (type 1 and type 2) mRNA in dermal papillae from the lower abdominal region in women with hirsutism. Clin Exp Dermatol. 2006;31(4):564-570.
- Layton AM, Eady EA, Whitehouse H, Del Rosso JQ, Fedorowicz Z, van Zuuren EJ. Oral spironolactone for acne vulgaris in adult females: a hybrid systematic review. Am J Clin Dermatol. 2017;18(2):169-191.
- Swiglo BA, Cosma M, Flynn DN, et al. Clinical review: antiandrogens for the treatment of hirsutism: a systematic review and meta-analysis of randomized controlled trials. J Clin Endocrinol Metab. 2008;93(4):1153-1160.
- van Zuuren EJ, Fedorowicz Z. Interventions for hirsutism excluding laser and photoepilation therapy alone: abridged Cochrane systematic review including GRADE assessments. Br J Dermatol. 2016;175(1):45-61.
- Plovanich M, Weng QY, Mostaghimi A. Low usefulness of potassium monitoring among healthy young women taking spironolactone for acne. JAMA Dermatol. 2015;151(9):941-944.
- Ibanez L, de Zegher F. Low-dose combination of flutamide, metformin and an oral contraceptive for non-obese, young women with polycystic ovary syndrome. Hum Reprod. 2003;18(1):57-60.
- Ibanez L, de Zegher F. Ethinyl estradiol-drospirenone, flutamide-metformin or both for adolescents and women with hyperinsulinemic hyperandrogenism: opposite effects on adipocytokines and body adiposity. J Clin Endocrinol Metab. 2004;89(4):1592-1597.
- Lortscher D, Admani S, Stur N, Eichenfield LF. Hormonal contraceptives and acne: a retrospective analysis of 2147 patients. J Drugs Dermatol. 2016;15(6):670-674.
- Wang ET, Calderon-Margalit R, Cedars MI, et al. Polycystic ovary syndrome and risk for long-term diabetes and dyslipidemia. Obstet Gynecol. 2011;117(1):6-13.
- Joham AE, Raniasinha S, Zoungas S, Moran L, Teede HJ. Gestational diabetes and type 2 diabetes in reproductive aged women with polycystic ovary syndrome. J Clin Endocrinol Metab. 2014;99(3):e447-e452.
- Gottschau M, Kjaer SK, Jensen A, Munk C, Mellemkjaer L. Risk of cancer among women with polycystic ovary syndrome: a Danish cohort study. Gynecol Oncol. 2015;136(1):99-103.

Moving or starting a practice? Consider Iowa
The federal government may or may not believe in global warming, but when it comes to states’ medical practice climates, Iowa trumps them all, according to the personal finance website WalletHub.
The Hawkeye State came out on top of WalletHub’s list of the Best States to Practice Medicine for 2017 with 68.7 out of a possible 100 points, while New York finished 51st (Washington, D.C., was 50th) with 28.5 points. Minnesota is the second-best state for physicians, followed by Idaho, Wisconsin, and Kansas. The rest of the bottom five included New Jersey at 49th, Maryland at 48th, and Rhode Island at 47th, WalletHub reported.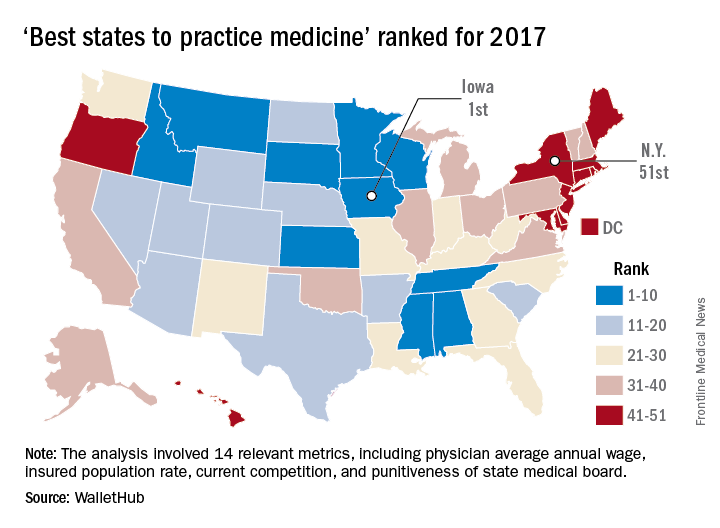
WalletHub compared the 50 states and Washington using 14 different metrics across two broad categories: “opportunity and competition” (70 points) and “medical environment” (30 points). Metrics included physicians’ average annual wage (adjusted for cost of living), hospitals per capita, quality of public hospital system, and annual malpractice liability insurance rate.
Vascular involvement may signify worse outcomes in lupus nephritis
MELBOURNE – Vascular involvement in patients with lupus nephritis is associated with poorer outcomes and could be a trigger for a more aggressive treatment approach, according to observational study results reported at an international congress on systemic lupus erythematosus.
Manish Rathi, MD, a nephrologist at the Postgraduate Institution of Medical Education & Research in Chandigarh, India, reported the results of a 5-year prospective cohort study in 241 patients with biopsy-proven lupus nephritis.

Researchers found that patients with vascular involvement had significantly higher serum creatinine at baseline than did those without it. At follow-up, they also had significantly higher proteinuria and serum creatinine, as well as significantly lower serum albumin.
This group was also less likely to achieve complete remission, compared with patients without vascular involvement (38.2% vs. 61.9%; P = .006), and had treatment-refractory disease almost twice as often (26.3% vs. 14.3%; P = .02).
Overall, vascular involvement was seen in 32.3% of patients, with the most common form being arteriosclerosis (22.8%), followed by vascular thrombotic microangiopathy (11.2%), asymptomatic vascular immune deposits (5.3%), vasculopathy (2%), and vasculitis (0.8%).
Three-quarters of all patients had nephrotic syndrome, and 41.9% were identified as Class IV, 18.7% as Class V, 10.4% as Class III, and 3.7% as Class II.
When researchers examined the presentation and outcomes among these subgroups, they found that patients with vascular thrombotic microangiopathy had a significantly higher serum creatinine and were less likely to respond to treatment, compared with patients without vascular thrombotic microangiopathy (60% vs. 79.1%).
Similarly, patients with arteriosclerosis had significantly lower incidence of complete remission, compared with those without arteriosclerosis (37.7% vs. 58.8%) although they had significantly higher rates of partial remission (35.8% vs. 19.4%).
“Lupus patients, if they had involvement of vascular compartment, they had more severe presentation at the time of presentation as well as poorer outcomes despite giving the standard therapy,” Dr. Rathi said.
In an interview, Dr. Rathi said the results had already influenced their own treatment approach with these patients.
“What we have started doing now is – if there is vascular involvement, particularly the thrombotic microangiopathy – we treat them as severe lupus nephritis [patients], so even if their class of lupus nephritis is less severe, we’ll be treating them as severe,” he said.
Commenting on the presentation, Frederic Houssiau, MD, PhD, a professor of rheumatology at the Cliniques Universitaires Saint-Luc in Brussels, said he agreed that vascular involvement was neglected in the current classification of lupus nephritis and that it should be taken into account.
“Maybe we should not only consider the class but also look in more detail to the pathophysiological findings,” Dr. Houssiau said in an interview. “When you have a lot of inflammation in the vessels, for instance, maybe we should use cyclophosphamide.”
No conflicts of interest were disclosed.
MELBOURNE – Vascular involvement in patients with lupus nephritis is associated with poorer outcomes and could be a trigger for a more aggressive treatment approach, according to observational study results reported at an international congress on systemic lupus erythematosus.
Manish Rathi, MD, a nephrologist at the Postgraduate Institution of Medical Education & Research in Chandigarh, India, reported the results of a 5-year prospective cohort study in 241 patients with biopsy-proven lupus nephritis.
Researchers found that patients with vascular involvement had significantly higher serum creatinine at baseline than did those without it. At follow-up, they also had significantly higher proteinuria and serum creatinine, as well as significantly lower serum albumin.
This group was also less likely to achieve complete remission, compared with patients without vascular involvement (38.2% vs. 61.9%; P = .006), and had treatment-refractory disease almost twice as often (26.3% vs. 14.3%; P = .02).
Overall, vascular involvement was seen in 32.3% of patients, with the most common form being arteriosclerosis (22.8%), followed by vascular thrombotic microangiopathy (11.2%), asymptomatic vascular immune deposits (5.3%), vasculopathy (2%), and vasculitis (0.8%).
Three-quarters of all patients had nephrotic syndrome, and 41.9% were identified as Class IV, 18.7% as Class V, 10.4% as Class III, and 3.7% as Class II.
When researchers examined the presentation and outcomes among these subgroups, they found that patients with vascular thrombotic microangiopathy had a significantly higher serum creatinine and were less likely to respond to treatment, compared with patients without vascular thrombotic microangiopathy (60% vs. 79.1%).
Similarly, patients with arteriosclerosis had significantly lower incidence of complete remission, compared with those without arteriosclerosis (37.7% vs. 58.8%) although they had significantly higher rates of partial remission (35.8% vs. 19.4%).
“Lupus patients, if they had involvement of vascular compartment, they had more severe presentation at the time of presentation as well as poorer outcomes despite giving the standard therapy,” Dr. Rathi said.
In an interview, Dr. Rathi said the results had already influenced their own treatment approach with these patients.
“What we have started doing now is – if there is vascular involvement, particularly the thrombotic microangiopathy – we treat them as severe lupus nephritis [patients], so even if their class of lupus nephritis is less severe, we’ll be treating them as severe,” he said.
Commenting on the presentation, Frederic Houssiau, MD, PhD, a professor of rheumatology at the Cliniques Universitaires Saint-Luc in Brussels, said he agreed that vascular involvement was neglected in the current classification of lupus nephritis and that it should be taken into account.
“Maybe we should not only consider the class but also look in more detail to the pathophysiological findings,” Dr. Houssiau said in an interview. “When you have a lot of inflammation in the vessels, for instance, maybe we should use cyclophosphamide.”
No conflicts of interest were disclosed.
AT LUPUS 2017
Key clinical point:
Major finding: Patients with vascular involvement in lupus nephritis are significantly less likely to achieve complete remission and have higher rates of treatment-refractory disease.
Data source: An observational cohort study in 241 patients with biopsy-proven lupus nephritis.
Disclosures: No conflicts of interest were declared.
Associate Fellows: Apply now for ACS Fellowship
Associate Fellows who are interested in pursuing the next level of membership and who meet the criteria for Fellowship are encouraged to start the application process now.
Applications for American College of Surgeons (ACS) Fellowship for induction at the 2018 Clinical Congress in Boston, MA, are due December 1, 2017.
ACS Fellowship is granted to physicians who devote their practice entirely to surgical services and who agree to practice in accordance with the College’s professional and ethical standards.
The College’s Fellowship Pledge and Statements on Principles, found on the ACS website at facs.org, outline the ACS standards of practice. All ACS Fellows and applicants for Fellowship are expected to adhere to these standards.
Surgeons voluntarily submit applications for Fellowship, thereby inviting an evaluation of their practice by their peers. In evaluating the eligibility of Fellowship applicants, the College investigates each applicant’s entire surgical practice. Applicants for Fellowship are required to provide to the appointed committees of the College all information deemed necessary for the investigation and evaluation of their surgical practice.
It is our intention that all Associate Fellows consider applying for Fellowship within the first six years of their surgical practice. To encourage that transition, Associate Fellowship is limited to surgeons who have been in practice less than six years.
Requirements
The basic requirements for Domestic (U.S. and Canada) Fellowship are as follows:
• Certification by an appropriate American Board of Medical Specialties surgical specialty board, an American Osteopathic Association surgical specialty board, or the Royal College of Surgeons in Canada
• One year of surgical practice after the completion of all formal training (including fellowships)
• A current appointment at a primary hospital with no reportable action pending
A full list of the domestic requirements can be accessed at facs.org/member-services/join/fellows. The list of requirements for International Fellowship is online at facs.org/member-services/join/international.
Associate Fellows who are current with their membership dues may apply online for free by visiting facs.org/member-services/join and clicking on the link for either Fellow or International Fellow. You will need your log-in information to access the application. If you do not have your log-in information, contact the College’s Member Services staff at 800-293-9623 or via e-mail at [email protected].
The application requests basic information regarding licensure, certification, education, and hospital affiliations. Applicants also are asked to provide the names of five Fellows of the College, preferably from their current practice location, to serve as references. Applicants do not need to request letters of recommendation; simply list the names in your application, and the College staff will contact your references.
If you need assistance finding ACS Fellows in your area, go to facs.org and click on the “Find a Surgeon” button.
When your application is processed, you will receive an e-mail notification providing details about the application timeline along with a request for your surgical case list.
All Fellowship applicants are required to participate in a personal interview by an ACS committee in their local area. Exceptions are made for military applicants. Following the interview, you will receive notification by July 15 of the action taken on your application. Approved applicants are designated as Initiates to be inducted as Fellows during the Convocation Ceremony at the Clinical Congress.
Contact Member Services with questions at any time throughout the application process. We look forward to you becoming a Fellow of the American College of Surgeons.
Psychiatry Innovation Lab aimed at transforming mental health
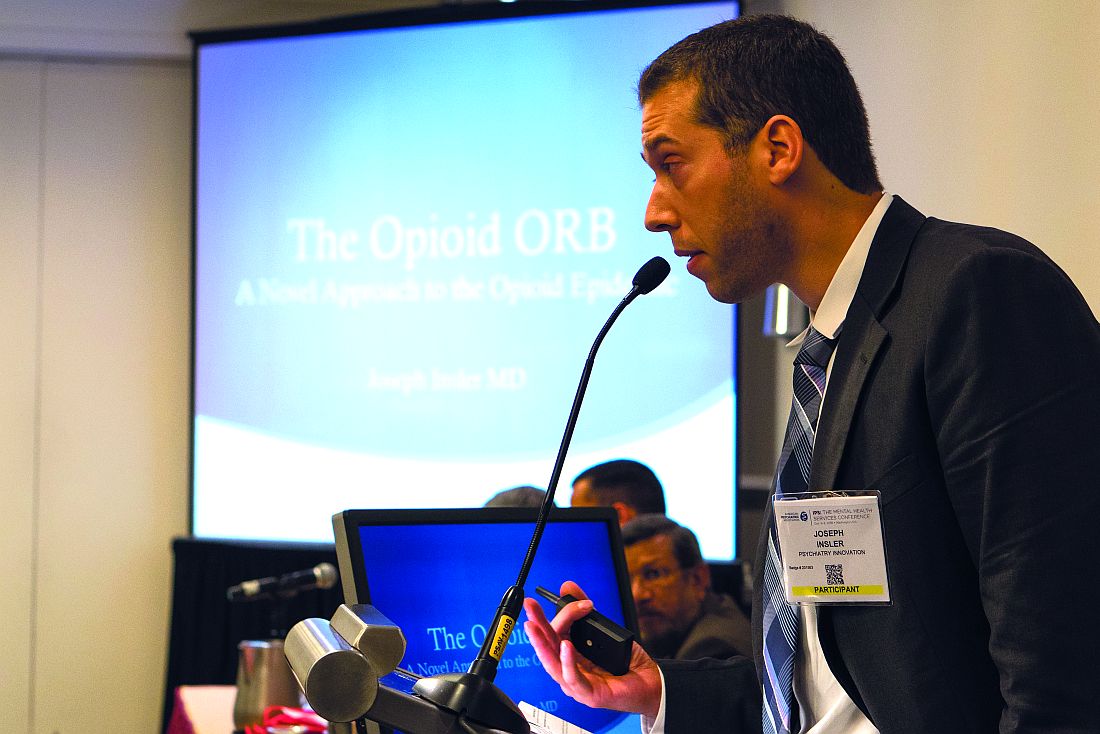
“Often, innovation is a product of desperation. I have seen too many of my patients die from opioid overdoses, and I’ve decided to create something that can stop this.”
This is the opening description of an innovative idea that Joseph Insler, MD, an early–career psychiatrist in Boston, pitched to the judges last October.
As one of the judges, this is how I described the item: “It’s like a Fitbit for people addicted to opioids, who are at risk of overdose. But, instead of tracking your footsteps and your sleep movements, it tracks your blood oxygen level, heart rate, and lack of movement. Based on an algorithm tuned to identify signs of an overdose, the Opioid Overdose Recovery Bracelet would give you a shot of medicine in your wrist. If you have accidentally overdosed, it will give you a premeasured dose of naloxone from its reservoir, likely saving your life.”
The goal of the Psychiatry Innovation Lab is to catalyze the formation of innovative ventures to transform mental health. “We nurture early stage ideas and ventures by investing in them with mentorship, education, funding, and collaboration opportunities with our community of mental health innovators,” Dr. Vasan said. At its core, the lab is an interactive exercise in experiential learning, where participants learn how to develop and pitch an entrepreneurial idea and then work together with experts in real time to improve their idea so that they leave with a solid plan for improving mental health. A panel of judges and leaders in innovation collaborate by providing feedback and mentoring. The competition event uses a “Shark Tank” style of winnowing out competitors but is a friendlier format than that of the TV show.
“There’s been a real call to action for using entrepreneurship to change the future, and the Psychiatry Innovation Lab is our answer to that call,” Dr. Vasan said. “We’ve had finalists ranging from high school students to emeritus professors. We’ve seen ideas for [anything from] advancing human rights all the way to using technology to improve access to care.”
Access to mental health and addiction care is one of the driving forces behind a recent wave of investment in behavioral health. There is a lot of interest now in how newer technologies can be leveraged in to improve access, screening, prevention, analytics, and treatments. Younger people coming into the field now have a much shorter path between idea and action. “Think of the lab as a place where people turn their idealism into impact. They learn how to create change that reflects our values: effective, measurable, collaborative, affordable, and sustainable.”

New lab will set records
On May 21, at the APA annual meeting in San Diego, the third Innovation Lab event will take place with record sponsorship and funding. More than $30,000 in prizes will be awarded to winning teams in the following categories: Grand Prize, Audience Choice, Outstanding Progress, Most Promising Innovation, and Most Disruptive Innovation. New this year, the Accelerator Prize will be awarded to the alumni team that has made the most progress since its participation in a previous Innovation Lab. A special prize from Google, worth $20,000, will be given to the innovation that best uses the potential of Cloud services, including Web applications, software, and machine learning.

Also, on May 21, the live Innovation Lab event will begin with the seven finalists giving initial pitches about their innovative ideas for improving mental health care delivery and how psychiatrists are diagnosing, treating, or managing patients. In addition, 10 semifinalists will be selected to deliver rapid pitches. Audience members will then vote from their devices, and the top semifinalist will proceed as a finalist. The event will end with an evening networking session aimed at building community and collaborations among mental health innovators, including clinicians, entrepreneurs, engineers, investors, and patients.
To learn more or watch videos about these innovators, go to www.psychiatryinnovation.com, or search for “APA innovation lab.”
Dr. Daviss is the chief medical informatics officer at M3 Information and chairs the American Psychiatric Association’s Committee on Mental Health Information Technology.
Psychiatry Innovation Lab alumni
Entrepreneurs from the October 2016 competition created products that addressed addiction, autism, Alzheimer’s, posttraumatic stress disorder, and other mental disorders.
Finalists
- Overdose Recovery Bracelet – “A novel solution to the opioid epidemic” – Joseph Insler
- Spectrum – “An app to encourage facial processing and emotion recognition in autism spectrum disorder” – Swathi Krishna
- Spring – “Enabling personalized behavioral healthcare using machine learning and big data” – April Koh
- Alzhelp – “Using augmented reality and intelligent personal assistant software to keep Alzheimer’s patients safe” – Akanksha Jain, Michelle Koh, and Priscilla Siow
- MiHelper – “Identifying patterns of distress and determining optimal periods for real time mental health interventions” – Kammarauche Isuzu and Mackenzie Drazan
- WEmbrace – “A mobile application for foreign-background psychiatric patients to effectively provide critical care” – Ellen Oh
Semifinalists
- Broadleaf Mental Health –“Reaching school-aged children in the rural eastern Himalayas” – Michael Matergia
- TechLink – “Connecting students and tech” – Akanksha Jain, Michelle Koh, and Priscilla Siow
- Beacon – “Smarter therapy. Together” – Shrenik Jain and Ravi Shah
- Muse – “Assisted meditation in mental health” – Graeme Moffat
- MiResource – “Helping adolescents find the right therapeutic fit” – Gabriela Asturias and Mackenzie Drazen
- BraVe Reality – “Virtual treatment for PTSD patients” – Monica Kullar
- SKNR – “A user-centric psychotherapy tool for the digital age” – Hyun-Hee Kim
- We2Link – “Connect better” – Michael Malone PRISM – “Helping patients gain insight through digital art mobile app” – Kenechi Ejebe and Whitney McFadden
SOURCE: Dr. Daviss
“Often, innovation is a product of desperation. I have seen too many of my patients die from opioid overdoses, and I’ve decided to create something that can stop this.”
This is the opening description of an innovative idea that Joseph Insler, MD, an early–career psychiatrist in Boston, pitched to the judges last October.
As one of the judges, this is how I described the item: “It’s like a Fitbit for people addicted to opioids, who are at risk of overdose. But, instead of tracking your footsteps and your sleep movements, it tracks your blood oxygen level, heart rate, and lack of movement. Based on an algorithm tuned to identify signs of an overdose, the Opioid Overdose Recovery Bracelet would give you a shot of medicine in your wrist. If you have accidentally overdosed, it will give you a premeasured dose of naloxone from its reservoir, likely saving your life.”
The goal of the Psychiatry Innovation Lab is to catalyze the formation of innovative ventures to transform mental health. “We nurture early stage ideas and ventures by investing in them with mentorship, education, funding, and collaboration opportunities with our community of mental health innovators,” Dr. Vasan said. At its core, the lab is an interactive exercise in experiential learning, where participants learn how to develop and pitch an entrepreneurial idea and then work together with experts in real time to improve their idea so that they leave with a solid plan for improving mental health. A panel of judges and leaders in innovation collaborate by providing feedback and mentoring. The competition event uses a “Shark Tank” style of winnowing out competitors but is a friendlier format than that of the TV show.
“There’s been a real call to action for using entrepreneurship to change the future, and the Psychiatry Innovation Lab is our answer to that call,” Dr. Vasan said. “We’ve had finalists ranging from high school students to emeritus professors. We’ve seen ideas for [anything from] advancing human rights all the way to using technology to improve access to care.”
Access to mental health and addiction care is one of the driving forces behind a recent wave of investment in behavioral health. There is a lot of interest now in how newer technologies can be leveraged in to improve access, screening, prevention, analytics, and treatments. Younger people coming into the field now have a much shorter path between idea and action. “Think of the lab as a place where people turn their idealism into impact. They learn how to create change that reflects our values: effective, measurable, collaborative, affordable, and sustainable.”
New lab will set records
On May 21, at the APA annual meeting in San Diego, the third Innovation Lab event will take place with record sponsorship and funding. More than $30,000 in prizes will be awarded to winning teams in the following categories: Grand Prize, Audience Choice, Outstanding Progress, Most Promising Innovation, and Most Disruptive Innovation. New this year, the Accelerator Prize will be awarded to the alumni team that has made the most progress since its participation in a previous Innovation Lab. A special prize from Google, worth $20,000, will be given to the innovation that best uses the potential of Cloud services, including Web applications, software, and machine learning.
Also, on May 21, the live Innovation Lab event will begin with the seven finalists giving initial pitches about their innovative ideas for improving mental health care delivery and how psychiatrists are diagnosing, treating, or managing patients. In addition, 10 semifinalists will be selected to deliver rapid pitches. Audience members will then vote from their devices, and the top semifinalist will proceed as a finalist. The event will end with an evening networking session aimed at building community and collaborations among mental health innovators, including clinicians, entrepreneurs, engineers, investors, and patients.
To learn more or watch videos about these innovators, go to www.psychiatryinnovation.com, or search for “APA innovation lab.”
Dr. Daviss is the chief medical informatics officer at M3 Information and chairs the American Psychiatric Association’s Committee on Mental Health Information Technology.
Psychiatry Innovation Lab alumni
Entrepreneurs from the October 2016 competition created products that addressed addiction, autism, Alzheimer’s, posttraumatic stress disorder, and other mental disorders.
Finalists
- Overdose Recovery Bracelet – “A novel solution to the opioid epidemic” – Joseph Insler
- Spectrum – “An app to encourage facial processing and emotion recognition in autism spectrum disorder” – Swathi Krishna
- Spring – “Enabling personalized behavioral healthcare using machine learning and big data” – April Koh
- Alzhelp – “Using augmented reality and intelligent personal assistant software to keep Alzheimer’s patients safe” – Akanksha Jain, Michelle Koh, and Priscilla Siow
- MiHelper – “Identifying patterns of distress and determining optimal periods for real time mental health interventions” – Kammarauche Isuzu and Mackenzie Drazan
- WEmbrace – “A mobile application for foreign-background psychiatric patients to effectively provide critical care” – Ellen Oh
Semifinalists
- Broadleaf Mental Health –“Reaching school-aged children in the rural eastern Himalayas” – Michael Matergia
- TechLink – “Connecting students and tech” – Akanksha Jain, Michelle Koh, and Priscilla Siow
- Beacon – “Smarter therapy. Together” – Shrenik Jain and Ravi Shah
- Muse – “Assisted meditation in mental health” – Graeme Moffat
- MiResource – “Helping adolescents find the right therapeutic fit” – Gabriela Asturias and Mackenzie Drazen
- BraVe Reality – “Virtual treatment for PTSD patients” – Monica Kullar
- SKNR – “A user-centric psychotherapy tool for the digital age” – Hyun-Hee Kim
- We2Link – “Connect better” – Michael Malone PRISM – “Helping patients gain insight through digital art mobile app” – Kenechi Ejebe and Whitney McFadden
SOURCE: Dr. Daviss
Outpatient Visits Involving CNS Polypharmacy Rising Among Elderly
The number of outpatient visits involving CNS polypharmacy by adults aged 65 and older more than doubled between 2004 and 2013, especially among those who reside in rural areas, according to research published online ahead of print February 13 in JAMA Internal Medicine.
“With each new revision of the Beers Criteria, the list of psychotropic medications considered potentially inappropriate in the elderly has grown,” said Donovan T. Maust, MD, Assistant Professor of Geriatric Psychiatry at the University of Michigan in Ann Arbor. “Opioids have recently been included in a Beers measure of CNS polypharmacy. Prescribing related drug combinations also received increased regulatory attention when the US Food and Drug Administration recently ordered a black box warning to alert patients of serious risks, including death, caused by opioids coprescribed with CNS depressants,” he said.

Dr. Maust and his colleagues analyzed data on 97,910 outpatients age 65 and older from the National Ambulatory Medical Care Survey (NAMCS) from 2004 through 2013. Patients met Beers CNS polypharmacy criteria if three or more of the following medications were initiated or continued: antipsychotics, benzodiazepines, nonbenzodiazepine benzodiazepine receptor agonists, tricyclic antidepressants, selective serotonin reuptake inhibitors, and opioids. The researchers recorded as many as three visit diagnoses and included information collected from NAMCS such as chronic medical conditions, whether psychotherapy was provided or ordered, whether stress management or other mental health counseling services were provided or ordered, and time spent with physician.
Dr. Maust and his associates found that annual CNS polypharmacy visits by adults age 65 or older increased from 1.50 million in 2004 to 3.68 million in 2013, or from 0.6% of visits in 2004 to 1.4% in 2013 (adjusted odds ratio [AOR], 3.12). The largest increases were observed among rural visits and among visits with no mental health or pain diagnoses (AOR, 4.99 and 2.65, respectively).
More than two-thirds of polypharmacy visits (68%) were by women, and 17% were by individuals who lived in rural areas. In addition, nearly half of polypharmacy visits studied (46%) included neither mental health nor pain diagnoses. No significant demographic differences were observed between polypharmacy visits with and without opioids. “Older adults have become more open to mental health treatment,” the researchers concluded. “Because of limited access to specialty care and a preference to receive treatment in primary care settings, it is unsurprising that mental health treatment has expanded in nonpsychiatric settings.”
—Doug Brunk
Suggested Reading
Maust DT, Gerlach LB, Gibson A, et al. Trends in central nervous system-active polypharmacy among older adults seen in outpatient care in the United States. JAMA Intern Med. 2017 Feb 13 [Epub ahead of print].
The number of outpatient visits involving CNS polypharmacy by adults aged 65 and older more than doubled between 2004 and 2013, especially among those who reside in rural areas, according to research published online ahead of print February 13 in JAMA Internal Medicine.
“With each new revision of the Beers Criteria, the list of psychotropic medications considered potentially inappropriate in the elderly has grown,” said Donovan T. Maust, MD, Assistant Professor of Geriatric Psychiatry at the University of Michigan in Ann Arbor. “Opioids have recently been included in a Beers measure of CNS polypharmacy. Prescribing related drug combinations also received increased regulatory attention when the US Food and Drug Administration recently ordered a black box warning to alert patients of serious risks, including death, caused by opioids coprescribed with CNS depressants,” he said.
Dr. Maust and his colleagues analyzed data on 97,910 outpatients age 65 and older from the National Ambulatory Medical Care Survey (NAMCS) from 2004 through 2013. Patients met Beers CNS polypharmacy criteria if three or more of the following medications were initiated or continued: antipsychotics, benzodiazepines, nonbenzodiazepine benzodiazepine receptor agonists, tricyclic antidepressants, selective serotonin reuptake inhibitors, and opioids. The researchers recorded as many as three visit diagnoses and included information collected from NAMCS such as chronic medical conditions, whether psychotherapy was provided or ordered, whether stress management or other mental health counseling services were provided or ordered, and time spent with physician.
Dr. Maust and his associates found that annual CNS polypharmacy visits by adults age 65 or older increased from 1.50 million in 2004 to 3.68 million in 2013, or from 0.6% of visits in 2004 to 1.4% in 2013 (adjusted odds ratio [AOR], 3.12). The largest increases were observed among rural visits and among visits with no mental health or pain diagnoses (AOR, 4.99 and 2.65, respectively).
More than two-thirds of polypharmacy visits (68%) were by women, and 17% were by individuals who lived in rural areas. In addition, nearly half of polypharmacy visits studied (46%) included neither mental health nor pain diagnoses. No significant demographic differences were observed between polypharmacy visits with and without opioids. “Older adults have become more open to mental health treatment,” the researchers concluded. “Because of limited access to specialty care and a preference to receive treatment in primary care settings, it is unsurprising that mental health treatment has expanded in nonpsychiatric settings.”
—Doug Brunk
Suggested Reading
Maust DT, Gerlach LB, Gibson A, et al. Trends in central nervous system-active polypharmacy among older adults seen in outpatient care in the United States. JAMA Intern Med. 2017 Feb 13 [Epub ahead of print].
Rate of heroin use in U.S. soars, especially among white individuals
Rates of heroin use and heroin use disorder rose dramatically between 2001-2002 and 2012-2013, and the trend was greatest among the white population. The rise among white individuals could be tied to the opioid epidemic, because nonmedical opioid also rose disproportionately in that group, according to research published online March 29.
The findings come from an analysis of 43,093 people who responded to the 2001-2002 National Epidemiologic Survey on Alcohol and Related Conditions (NESARC), and 36,309 respondents to the 2012-2013 NESARC-III.
In addition, Dr. Martins and her associates found a significant rise in the number of white heroin users who had started nonmedical prescription opioid (NMPO) use before heroin (35.83% to 52.83%; P =.01). In contrast, the percentage of nonwhite individuals who started off with NMPO use dropped from 44.12% to 26.20% (P = .04).
The increase in heroin use was larger among individuals at less than 100% of the poverty level (0.44% to 2.42%; P less than .001), as well as among people with education levels of less than high school (heroin use, 0.41% to 2.01%; P = .03; heroin use disorder, 0.24% to 0.87%; P = .08) and among those with no more than high school education (heroin use, 0.39% to 2.15%; P =.003; heroin use disorder, 0.29% to 1.11%; P = .003). The absolute values of the findings may be inexact, because the methods of the two surveys differed slightly. In addition, the investigators did not include homeless and incarcerated individuals.
Based on their analysis, Dr. Martins and her associates offered strategies aimed at addressing the crisis. “To curb the heroin epidemic, particularly among younger adults, collective prevention and intervention efforts may be most effective,” they wrote. “Promising examples include expansion of access to medication-assisted treatment (including methadone hydrochloride, buprenorphine hydrochloride, or injectable naltrexone hydrochloride), educational programs in schools and community settings, overdose prevention training in concert with comprehensive naloxone hydrochloride distribution programs, and consistent use of prescription drug–monitoring programs that implement best practices by prescribers.”
NESARC and NESARC-III were funded by the National Institute on Alcohol Abuse and Alcoholism and the National Institute on Drug Abuse. The authors received funding from several sources, including the National Institute on Drug Abuse, the New York State Psychiatric Institute, and the J. William Fulbright and the Colciencias doctoral scholarships. One of the study authors, Deborah S. Hasin, PhD, was a principal investigator on a study that was funded by InVentiv Health Consulting, which pool funds from nine pharmaceutical companies.
Opioid misuse can be prevented by the medical community with a change in prescribing practices aimed at limiting the supply of prescription opioids, Bertha K. Madras, PhD, wrote in an accompanying editorial (JAMA Psychiatry. 2017 Mar 29. doi: 10.1001/jamapsychiatry.2017.0163). Also, medical training “should include awareness of the risks posed by high opioid doses, immediate-release formulations, use combined with alcohol and/or benzodiazepines, history of overdoses, and other factors,” she wrote.
The United States has more than 14,000 drug treatment programs, but many are staffed with clinicians who are not licensed. One way to foster comprehensive services would be to develop an integrated medical and behavioral treatment system that would be supervised by a physician and substance abuse specialist. “Resources, training, and workforce issues are a concern, but the benefits of integrated health care and behavioral treatment conceivably outweigh the risks of maintaining the status quo,” she wrote.
Dr. Madras is affiliated with the department of psychiatry at Harvard Medical School in Boston, and McLean Hospital in Belmont, Mass. She also serves on the scientific advisory board of RiverMend Health and consults for Guidepoint.
Rates of heroin use and heroin use disorder rose dramatically between 2001-2002 and 2012-2013, and the trend was greatest among the white population. The rise among white individuals could be tied to the opioid epidemic, because nonmedical opioid also rose disproportionately in that group, according to research published online March 29.
The findings come from an analysis of 43,093 people who responded to the 2001-2002 National Epidemiologic Survey on Alcohol and Related Conditions (NESARC), and 36,309 respondents to the 2012-2013 NESARC-III.
In addition, Dr. Martins and her associates found a significant rise in the number of white heroin users who had started nonmedical prescription opioid (NMPO) use before heroin (35.83% to 52.83%; P =.01). In contrast, the percentage of nonwhite individuals who started off with NMPO use dropped from 44.12% to 26.20% (P = .04).
The increase in heroin use was larger among individuals at less than 100% of the poverty level (0.44% to 2.42%; P less than .001), as well as among people with education levels of less than high school (heroin use, 0.41% to 2.01%; P = .03; heroin use disorder, 0.24% to 0.87%; P = .08) and among those with no more than high school education (heroin use, 0.39% to 2.15%; P =.003; heroin use disorder, 0.29% to 1.11%; P = .003). The absolute values of the findings may be inexact, because the methods of the two surveys differed slightly. In addition, the investigators did not include homeless and incarcerated individuals.
Based on their analysis, Dr. Martins and her associates offered strategies aimed at addressing the crisis. “To curb the heroin epidemic, particularly among younger adults, collective prevention and intervention efforts may be most effective,” they wrote. “Promising examples include expansion of access to medication-assisted treatment (including methadone hydrochloride, buprenorphine hydrochloride, or injectable naltrexone hydrochloride), educational programs in schools and community settings, overdose prevention training in concert with comprehensive naloxone hydrochloride distribution programs, and consistent use of prescription drug–monitoring programs that implement best practices by prescribers.”
NESARC and NESARC-III were funded by the National Institute on Alcohol Abuse and Alcoholism and the National Institute on Drug Abuse. The authors received funding from several sources, including the National Institute on Drug Abuse, the New York State Psychiatric Institute, and the J. William Fulbright and the Colciencias doctoral scholarships. One of the study authors, Deborah S. Hasin, PhD, was a principal investigator on a study that was funded by InVentiv Health Consulting, which pool funds from nine pharmaceutical companies.
FROM JAMA PSYCHIATRY
Key clinical point: Campaigns are needed to educate the public about harms tied to heroin use, and access should be expanded to populations at risk for both heroin use and heroin use disorder.
Major finding: Rates of lifetime heroin use rose from 0.33% to 1.61%.
Data source: Retrospective analysis of 43,093 respondents to the 2001-2002 National Epidemiologic Survey on Alcohol and Related Conditions (NESARC), and 36,309 respondents to the 2012-2013 NESARC-III.
Disclosures: NESARC and NESARC-III were funded by the National Institute on Alcohol Abuse and Alcoholism and the National Institute on Drug Abuse. The authors received funding from several sources, including the National Institute on Drug Abuse, the New York State Psychiatric Institute, and the J. William Fulbright and the Colciencias doctoral scholarships. One of the study authors, Deborah S. Hasin, PhD, was a principal investigator on a study that was funded by InVentiv Health Consulting, which pools funds from nine pharmaceutical companies.
Disease-Modifying Treatment Changes in Clinical Practice
ORLANDO—Patients with multiple sclerosis (MS) and their physicians still consider self-injected immunomodulating medications as first-line agents, according to the results of a study presented at the ACTRIMS 2017 Forum. The results, based on data from a community health–based suburban neurology practice, also indicated that a smaller percentage than expected of patients on injectable medications switched to an oral medication, and a majority of untreated patients at the initial visit chose to star
There are currently 14 FDA-approved immunomodulating medications available for MS and one currently awaiting approval. “This has resulted in patients, in consultation with physicians, having the opportunity to switch from medications that are self injected to medications taken orally or by IV infusion,” said Susan M. Rubin, MD, and colleagues from the Department of Neurology at NorthShore University HealthSystem in Evanston, Illinois. “We speculated that this would result in a high level of treatment changes away from self-injected treatments to the newer options,” Dr. Rubin and colleagues said.

They optimized their electronic medical record by building structured clinical documentation support (SCDS) tools specific to MS practice that standardize initial and annual follow-up visits, write progress notes, and capture data. The toolkit they built documents immunomodulating medications taken, tracks efficacy and adverse events, and notes reasons for discontinuation.
Patients with MS who were referred to the Department of Neurology at NorthShore University HealthSystem were evaluated at initial and annual follow-up visits using SCDS tools by one of three subspecialty neurologists. The researchers created descriptive reports of their cohort, including gender, age at disease onset, disease duration, use of immunomodulating medications, and Expanded Disability Status Scale scores. Patient-reported treatments at their initial visit were compared with treatments at their first annual follow-up visit.
Of the 105 patients in the study, 78% were female. Disease duration was zero to 43 years, with a mean duration of six years. Nearly three-quarters (74%) were not on an immunomodulating medication at first visit. Of those on medication at first visit, 77% were taking an injectable medication. At the annual follow-up visit, 51% started or changed medication, and 49% remained on the same medication. Of the patients who started treatment, 65% started a self-injection medication, 26% started an oral medication, and 9% started an infusion agent.
“Despite the availability of new treatments,” the researchers said, “patients and their physicians were generally content with the current treatment.” They hypothesized that safety concerns reduced the likelihood of change. “It appears that both patients and physicians prioritized safety over possibly greater efficacy when switching medication.”
—Glenn S. Williams
ORLANDO—Patients with multiple sclerosis (MS) and their physicians still consider self-injected immunomodulating medications as first-line agents, according to the results of a study presented at the ACTRIMS 2017 Forum. The results, based on data from a community health–based suburban neurology practice, also indicated that a smaller percentage than expected of patients on injectable medications switched to an oral medication, and a majority of untreated patients at the initial visit chose to star
There are currently 14 FDA-approved immunomodulating medications available for MS and one currently awaiting approval. “This has resulted in patients, in consultation with physicians, having the opportunity to switch from medications that are self injected to medications taken orally or by IV infusion,” said Susan M. Rubin, MD, and colleagues from the Department of Neurology at NorthShore University HealthSystem in Evanston, Illinois. “We speculated that this would result in a high level of treatment changes away from self-injected treatments to the newer options,” Dr. Rubin and colleagues said.
They optimized their electronic medical record by building structured clinical documentation support (SCDS) tools specific to MS practice that standardize initial and annual follow-up visits, write progress notes, and capture data. The toolkit they built documents immunomodulating medications taken, tracks efficacy and adverse events, and notes reasons for discontinuation.
Patients with MS who were referred to the Department of Neurology at NorthShore University HealthSystem were evaluated at initial and annual follow-up visits using SCDS tools by one of three subspecialty neurologists. The researchers created descriptive reports of their cohort, including gender, age at disease onset, disease duration, use of immunomodulating medications, and Expanded Disability Status Scale scores. Patient-reported treatments at their initial visit were compared with treatments at their first annual follow-up visit.
Of the 105 patients in the study, 78% were female. Disease duration was zero to 43 years, with a mean duration of six years. Nearly three-quarters (74%) were not on an immunomodulating medication at first visit. Of those on medication at first visit, 77% were taking an injectable medication. At the annual follow-up visit, 51% started or changed medication, and 49% remained on the same medication. Of the patients who started treatment, 65% started a self-injection medication, 26% started an oral medication, and 9% started an infusion agent.
“Despite the availability of new treatments,” the researchers said, “patients and their physicians were generally content with the current treatment.” They hypothesized that safety concerns reduced the likelihood of change. “It appears that both patients and physicians prioritized safety over possibly greater efficacy when switching medication.”
—Glenn S. Williams
Can Vitamin D Benefit Patients With MS?

Vitamin D as a Risk Factor
Epidemiologic literature first suggested that vitamin D status might be related to the risk of MS. Researchers demonstrated that MS prevalence increases with distance from the equator. A series of retrospective and case–control studies subsequently suggested that patients with MS had lower levels of vitamin D than healthy individuals. These data, however, left open the possibility that having MS and its associated intolerance of heat led to reduced sun exposure, and thus lower levels of vitamin D.
In 2006, Munger and colleagues prospectively examined serum samples obtained from more than seven million US military personnel. They found that, among whites, the risk of MS significantly decreased with increasing levels of 25-hydroxyvitamin D. The effect was most significant in people with vitamin D levels higher than 40 ng/mL. The same association was observed in a later Swedish study that used 30 ng/mL as its threshold for vitamin D sufficiency. In 2016, Munger et al found that insufficient maternal vitamin D during pregnancy may increase the risk of MS in offspring.
Although research by Lucas and colleagues indicated an inverse association between serum vitamin D level and risk of MS, they found a stronger inverse association between ultraviolet (UV) light exposure and risk of MS. The strength of the latter association did not change, whether exposure was measured by skin damage or self-report. In 2017, however, Nielsen and colleagues compared serum vitamin D levels in newborns who subsequently developed MS with those of newborns who did not develop MS. They found a strong association between higher neonatal levels of vitamin D and lower risk of subsequent MS. “One could argue [that] this [result] makes the vitamin D hypothesis stronger than the UV [hypothesis], since the babies, in all likelihood, had not been exposed to much UV [light] at the time they were born,” said Dr. Mowry.
Vitamin D as a Prognostic Factor
Other research has suggested that serum vitamin D level may predict disease activity in MS. Dr. Mowry and colleagues evaluated blood samples taken from children who presented for longitudinal follow-up at pediatric MS centers. The total follow-up period was approximately 18 months. After adjusting for covariates, they found a strong association between higher levels of vitamin D and lower risk of subsequent relapse. “Each 10-ng/mL higher level of vitamin D … was associated with about a one-third reduction in the risk of subsequent relapse,” said Dr. Mowry. A prospective study conducted in Australia found similar results.
In 2012, Dr. Mowry and colleagues measured vitamin D levels in blood samples from 469 patients with relapsing-remitting MS or clinically isolated syndrome (CIS). They found that each additional 10-ng/mL increment of vitamin D level was associated with an approximately 15% lower risk of subsequent new T2 lesions and with an approximately 32% reduced risk of subsequent gadolinium-enhancing lesions. Higher levels of vitamin D also were associated with lower risk of subsequent relapse, but this finding was not statistically significant.
To discover whether vitamin D influences markers known to predict long-term disability, Dr. Mowry and colleagues examined data from a study of atorvastatin in 65 patients with CIS. They measured vitamin D levels at baseline and at month six, and the follow-up period was as long as 18 months. They found that each additional 10-ng/mL increment in vitamin D level was associated with an additional 7.8 mL of preserved gray matter volume. They also observed a trend toward an inverse association between vitamin D levels and the composite end point of three or more new T2 lesions or one or more relapses within a year.
Is Vitamin D Supplementation Appropriate?
“Just because [vitamin D] is available over the counter does not make it safe or effective,” and the supplement should be studied further in clinical trials, said Dr. Mowry. In 2010, Burton et al found that a dose of as much as 40,000 IU/day of vitamin D was safe in the short term and might have immunomodulatory effects in patients with MS. Furthermore, a small Finnish study suggested that a dose of 20,000 IU/week of vitamin D was safe in patients with MS, and also might slow the accumulation of disability.
Hupperts et al studied patients with relapsing-remitting MS who were receiving interferon beta-1a. They randomized 229 participants to vitamin D or placebo and followed them for 48 weeks. In preliminary analyses, the investigators found no difference between treatment groups with respect to the outcome of no evidence of disease activity. Patients who received vitamin D had a lower annualized relapse rate than controls, but the difference was not statistically significant. The active group did have significantly fewer gadolinium-enhancing lesions and new T2 hyperintense lesions, compared with controls, however.
In addition, Dr. Mowry and colleagues are comparing the effects of 5,000-IU and 600-IU doses of vitamin D in patients with MS who are receiving glatiramer acetate. The ongoing study is sponsored by the National MS Society. European studies of the clinical benefit of vitamin D also are under way.
Although the benefits of vitamin D are not completely understood, many neurologists recommend supplementation to their patients with MS. Pharmacokinetic studies have not shown a difference between daily, weekly, or monthly dosing regimens. “As long as you give the same dose of vitamin D, you will get the levels … to the same general area,” said Dr. Mowry. Nevertheless, some studies in other patient populations suggest that very high doses of vitamin D given monthly are probably toxic.
Many studies have suggested that vitamin D3 may be more potent than vitamin D2. “I tend to use [vitamin] D3 when I am supplementing,” said Dr. Mowry. “I aim for levels between 40 and 60 ng/mL, based on our observational data.... For my patients, that largely means they need somewhere between 2,000 and 4,000 IU/day, although sometimes more. I usually recheck the level in three months, based on what we know about the kinetics of vitamin D supplementation. I am cautious in individuals who may be at risk for hypercalcemia or hypercalciuria.”
—Erik Greb
Suggested Reading
Burton JM, Kimball S, Vieth R, et al. A phase I/II dose-escalation trial of vitamin D3 and calcium in multiple sclerosis. Neurology. 2010;74(23):1852-1859.
Mowry EM. Vitamin D: evidence for its role as a prognostic factor in multiple sclerosis. J Neurol Sci. 2011; 311(1-2):19-22.
Mowry EM, Pelletier D, Gao Z, et al. Vitamin D in clinically isolated syndrome: evidence for possible neuroprotection. Eur J Neurol. 2016;23(2):327-332.
Mowry EM, Waubant E, McCulloch CE, et al. Vitamin D status predicts new brain magnetic resonance imaging activity in multiple sclerosis. Ann Neurol. 2012;72(2):234-240.
Munger KL, Åivo J, Hongell K, et al. Vitamin D status during pregnancy and risk of multiple sclerosis in offspring of women in the Finnish Maternity Cohort. JAMA Neurol. 2016;73(5):515-519.
Munger KL, Levin LI, Hollis BW, et al. Serum 25-hydroxyvitamin D levels and risk of multiple sclerosis. JAMA. 2006;296(23):2832-2838.
Nielsen NM, Munger KL, Koch-Henriksen N, et al. Neonatal vitamin D status and risk of multiple sclerosis: a population-based case-control study. Neurology. 2017;88(1):44-51.
Tremlett H, van der Mei IA, Pittas F, et al. Monthly ambient sunlight, infections and relapse rates in multiple sclerosis. Neuroepidemiology. 2008;31(4):271-279.
Which treatments for pelvic floor disorders are backed by evidence?
EXPERT COMMENTARY
Care of women with pelvic floor disorders, primarily urinary incontinence and POP, involves:
- assessing the patient’s symptoms and determining how bothersome they are
- educating the patient about her condition and the options for treatment
- initiating treatment with the most conservative and least invasive therapies.
Safe treatments include PFMT and pessaries, and both can be effective. However, since approximately 25% of women experience one or more pelvic floor disorders during their life, surgical repair of these disorders is common. The lifetime risk of surgery for stress urinary incontinence (SUI) or POP is 20%,1 and one-third of patients will undergo reoperation for the same condition. Midurethral mesh slings are the gold standard for surgical management of SUI.2 Use of transvaginal mesh for primary prolapse repairs, however, is associated with challenging adverse effects, and its use should be reserved for carefully selected patients.
Data from 3 recent studies contribute to our evidence base on various treatments for pelvic floor disorders.
Details of the studies
PFMT for secondary prevention of POP. In a study conducted in the United Kingdom and New Zealand, Hagen and colleagues randomly assigned 414 women with POP, with or without symptoms, to an intervention group or a control group. The women had previously participated in a longitudinal study of postpartum pelvic floor function. Participants in the intervention group (n = 207) received 5 formal sessions of PFMT over 16 weeks, followed by Pilates-based classes focused on pelvic floor exercises; those in the control group (n = 207) received an informational leaflet about prolapse and lifestyle. The primary outcome was self-reported prolapse symptoms, assessed with the POP Symptom Score (POP-SS) at 2 years.
At study end, the mean (SD) POP-SS score in the intervention group was 3.2 (3.4), compared with a mean (SD) score of 4.2 (4.4) in the control group (adjusted mean difference, −1.01; 95% confidence interval [CI], −1.70 to −0.33; P = .004).
Investigators’ interpretation. The researchers concluded that the participants in the PFMT group had a small but significant—and clinically important—decrease in prolapse symptoms.
The PROSPECT study: Standard versus augmented surgical repair. In a multicenter trial in the United Kingdom by Glazener and associates, 1,352 women with symptomatic POP were randomly allocated to surgical repair with native tissue alone (standard repair) or to standard surgical repair augmented either with polypropylene mesh or with biological graft. The primary outcomes were participant-reported prolapse symptoms (assessed with POP-SS) and prolapse-related quality of life scores; these were measured at 1 year and at 2 years.
One year after surgery, failure rates (defined as prolapse beyond the hymen) were similar in all groups (range, 14%–18%); serious adverse events were also similar in all surgical groups (range, 6%–10%). Overall, 6% of women underwent reoperation for recurrent symptoms. Among women randomly assigned to repair with mesh, 12% to 14% experienced mesh-related adverse events; three-quarters of these women ultimately required surgical excision of the mesh.
Study takeaway. Thus, in terms of effectiveness, quality of life, and adverse effects, augmentation of a vaginal surgical repair with either mesh or graft material did not improve the outcomes of women with POP.
Adverse events after surgical procedures for pelvic floor disorders. In Scotland, Morling and colleagues performed a retrospective observational cohort study of first-time surgeries for SUI (mesh or colposuspension; 16,660 procedures) and prolapse (mesh or native tissue; 18,986 procedures).
After 5 years of follow-up, women who underwent midurethral mesh sling placement or colposuspension had similar rates of repeat surgery for recurrent SUI (adjusted incidence rate ratio, 0.90; 95% CI, 0.73–1.11). Use of mesh slings was associated with fewer immediate complications (adjusted relative risk, 0.44; 95% CI, 0.36–0.55) compared with nonmesh surgery.
Among women who underwent surgery for prolapse, those who had anterior and posterior repair with mesh experienced higher late complication rates than those who underwent native tissue repair. Risk for subsequent prolapse repair was similar with mesh and native-tissue procedures.
Authors’ commentary. The researchers noted that their data support the use of mesh procedures for incontinence but additional research on longer-term outcomes would be useful. However, for prolapse repair, the study results do not decidedly favor any one vault repair procedure.
--Meadow M. Good, DO
Share your thoughts! Send your Letter to the Editor to [email protected]. Please include your name and the city and state in which you practice.
- Wu JM, Matthews CA, Conover MM, Pate V, Funk MJ. Lifetime risk of stress incontinence or pelvic organ prolapse surgery. Obstet Gynecol. 2014;123(6):1201–1206.
- Nager C, Tulikangas P, Miller D, Rovner E, Goldman H. Position statement on mesh midurethral slings for stress urinary incontinence. Female Pelvic Med Reconstr Surg. 2014;20(3):123–125.
EXPERT COMMENTARY
Care of women with pelvic floor disorders, primarily urinary incontinence and POP, involves:
- assessing the patient’s symptoms and determining how bothersome they are
- educating the patient about her condition and the options for treatment
- initiating treatment with the most conservative and least invasive therapies.
Safe treatments include PFMT and pessaries, and both can be effective. However, since approximately 25% of women experience one or more pelvic floor disorders during their life, surgical repair of these disorders is common. The lifetime risk of surgery for stress urinary incontinence (SUI) or POP is 20%,1 and one-third of patients will undergo reoperation for the same condition. Midurethral mesh slings are the gold standard for surgical management of SUI.2 Use of transvaginal mesh for primary prolapse repairs, however, is associated with challenging adverse effects, and its use should be reserved for carefully selected patients.
Data from 3 recent studies contribute to our evidence base on various treatments for pelvic floor disorders.
Details of the studies
PFMT for secondary prevention of POP. In a study conducted in the United Kingdom and New Zealand, Hagen and colleagues randomly assigned 414 women with POP, with or without symptoms, to an intervention group or a control group. The women had previously participated in a longitudinal study of postpartum pelvic floor function. Participants in the intervention group (n = 207) received 5 formal sessions of PFMT over 16 weeks, followed by Pilates-based classes focused on pelvic floor exercises; those in the control group (n = 207) received an informational leaflet about prolapse and lifestyle. The primary outcome was self-reported prolapse symptoms, assessed with the POP Symptom Score (POP-SS) at 2 years.
At study end, the mean (SD) POP-SS score in the intervention group was 3.2 (3.4), compared with a mean (SD) score of 4.2 (4.4) in the control group (adjusted mean difference, −1.01; 95% confidence interval [CI], −1.70 to −0.33; P = .004).
Investigators’ interpretation. The researchers concluded that the participants in the PFMT group had a small but significant—and clinically important—decrease in prolapse symptoms.
The PROSPECT study: Standard versus augmented surgical repair. In a multicenter trial in the United Kingdom by Glazener and associates, 1,352 women with symptomatic POP were randomly allocated to surgical repair with native tissue alone (standard repair) or to standard surgical repair augmented either with polypropylene mesh or with biological graft. The primary outcomes were participant-reported prolapse symptoms (assessed with POP-SS) and prolapse-related quality of life scores; these were measured at 1 year and at 2 years.
One year after surgery, failure rates (defined as prolapse beyond the hymen) were similar in all groups (range, 14%–18%); serious adverse events were also similar in all surgical groups (range, 6%–10%). Overall, 6% of women underwent reoperation for recurrent symptoms. Among women randomly assigned to repair with mesh, 12% to 14% experienced mesh-related adverse events; three-quarters of these women ultimately required surgical excision of the mesh.
Study takeaway. Thus, in terms of effectiveness, quality of life, and adverse effects, augmentation of a vaginal surgical repair with either mesh or graft material did not improve the outcomes of women with POP.
Adverse events after surgical procedures for pelvic floor disorders. In Scotland, Morling and colleagues performed a retrospective observational cohort study of first-time surgeries for SUI (mesh or colposuspension; 16,660 procedures) and prolapse (mesh or native tissue; 18,986 procedures).
After 5 years of follow-up, women who underwent midurethral mesh sling placement or colposuspension had similar rates of repeat surgery for recurrent SUI (adjusted incidence rate ratio, 0.90; 95% CI, 0.73–1.11). Use of mesh slings was associated with fewer immediate complications (adjusted relative risk, 0.44; 95% CI, 0.36–0.55) compared with nonmesh surgery.
Among women who underwent surgery for prolapse, those who had anterior and posterior repair with mesh experienced higher late complication rates than those who underwent native tissue repair. Risk for subsequent prolapse repair was similar with mesh and native-tissue procedures.
Authors’ commentary. The researchers noted that their data support the use of mesh procedures for incontinence but additional research on longer-term outcomes would be useful. However, for prolapse repair, the study results do not decidedly favor any one vault repair procedure.
--Meadow M. Good, DO
Share your thoughts! Send your Letter to the Editor to [email protected]. Please include your name and the city and state in which you practice.
- Wu JM, Matthews CA, Conover MM, Pate V, Funk MJ. Lifetime risk of stress incontinence or pelvic organ prolapse surgery. Obstet Gynecol. 2014;123(6):1201–1206.
- Nager C, Tulikangas P, Miller D, Rovner E, Goldman H. Position statement on mesh midurethral slings for stress urinary incontinence. Female Pelvic Med Reconstr Surg. 2014;20(3):123–125.