User login
Boston - Rich History, Lively Cultural Scene
There is history around every corner in Boston. This vibrant city is rich with art, music, and dance institutions, theatre and cultural attractions, distinguished dining and nightlife venues, world-class shopping and championship sports teams that attract millions of visitors each year.
The city’s downtown neighborhoods, each with its own personality, offer endless unique experiences, and Boston’s proximity to other must-see sites all around New England make it one of the country’s most diverse and exciting locales.Each of the city’s neighborhoods has a remarkably different style and tone. From the Back Bay’s cosmopolitan streets and ornate Victorian townhouses to the aromas spilling into the narrow and jumbled 17th-century streets of Boston’s North End to the spirited and funky neighborhood squares of Cambridge – all within easy distance from one another.Boston is “America’s Walking City.” Even though it is one of the largest cities in the country, its accessibility is unparalleled. And while sightseeing on foot is easy, Boston also has an excellent public transportation system to help you get around.
Boston is also known as the mecca of medicine. Boston is home to some of the most prestigious hospitals and medical schools, physicians, and medical scientists in the world. Thoralf M. Sundt, III, MD, and the AATS Centennial Committee have organized an engaging social program for the AATS Centennial.
Tour 1: ITALIAN GASTRONOMY NORTH END MARKET TOUR
Sunday, April 30, 2017
10:30 a.m.– 1:15 p.m.
Cost: $95 per person

Tour 2: A VISIT TO THE ISABELLA STEWART GARDNER MUSEUM
Monday, May 1, 2017
12:15 p.m. – 2:45 p.m.
Cost: $85 per person

Enjoy the Gardners’ compilation of tapestries, exquisite antique furniture, and famous collections while hearing wonderful anecdotes about Mrs. Gardner’s sophisticated and eclectic life and the famous heist. A docent will be available to guidevisitors.
Tour 3: BEACON HILL CIRCLE “BEHIND THE BRAHMIN DOORS”
Tuesday, May 2, 2017
9:15 a.m. – 11:45 a.m.
Cost: $110 per person
![]()
*Preregistration for social events and tours are required. Tours require a minimum number of participants. All tours will depart from the Hynes Convention Center.
For additional visit information and things to do in Boston, go to https://www.bostonusa.com/things-to-do.
There is history around every corner in Boston. This vibrant city is rich with art, music, and dance institutions, theatre and cultural attractions, distinguished dining and nightlife venues, world-class shopping and championship sports teams that attract millions of visitors each year.
The city’s downtown neighborhoods, each with its own personality, offer endless unique experiences, and Boston’s proximity to other must-see sites all around New England make it one of the country’s most diverse and exciting locales.Each of the city’s neighborhoods has a remarkably different style and tone. From the Back Bay’s cosmopolitan streets and ornate Victorian townhouses to the aromas spilling into the narrow and jumbled 17th-century streets of Boston’s North End to the spirited and funky neighborhood squares of Cambridge – all within easy distance from one another.Boston is “America’s Walking City.” Even though it is one of the largest cities in the country, its accessibility is unparalleled. And while sightseeing on foot is easy, Boston also has an excellent public transportation system to help you get around.
Boston is also known as the mecca of medicine. Boston is home to some of the most prestigious hospitals and medical schools, physicians, and medical scientists in the world. Thoralf M. Sundt, III, MD, and the AATS Centennial Committee have organized an engaging social program for the AATS Centennial.
Tour 1: ITALIAN GASTRONOMY NORTH END MARKET TOUR
Sunday, April 30, 2017
10:30 a.m.– 1:15 p.m.
Cost: $95 per person
Tour 2: A VISIT TO THE ISABELLA STEWART GARDNER MUSEUM
Monday, May 1, 2017
12:15 p.m. – 2:45 p.m.
Cost: $85 per person
Enjoy the Gardners’ compilation of tapestries, exquisite antique furniture, and famous collections while hearing wonderful anecdotes about Mrs. Gardner’s sophisticated and eclectic life and the famous heist. A docent will be available to guidevisitors.
Tour 3: BEACON HILL CIRCLE “BEHIND THE BRAHMIN DOORS”
Tuesday, May 2, 2017
9:15 a.m. – 11:45 a.m.
Cost: $110 per person
![]()
*Preregistration for social events and tours are required. Tours require a minimum number of participants. All tours will depart from the Hynes Convention Center.
For additional visit information and things to do in Boston, go to https://www.bostonusa.com/things-to-do.

Off-the-shelf T cells an option for post-HCT viral infections
ORLANDO – Infusions of banked multivirus-specific T lymphocytes were associated with complete or partial responses in 93% of 42 patients who had undergone hematopoietic cell transplants and had drug-refractory viral illnesses. Further, these patients experienced minimal new or reactivated graft-versus-host disease (GVHD).
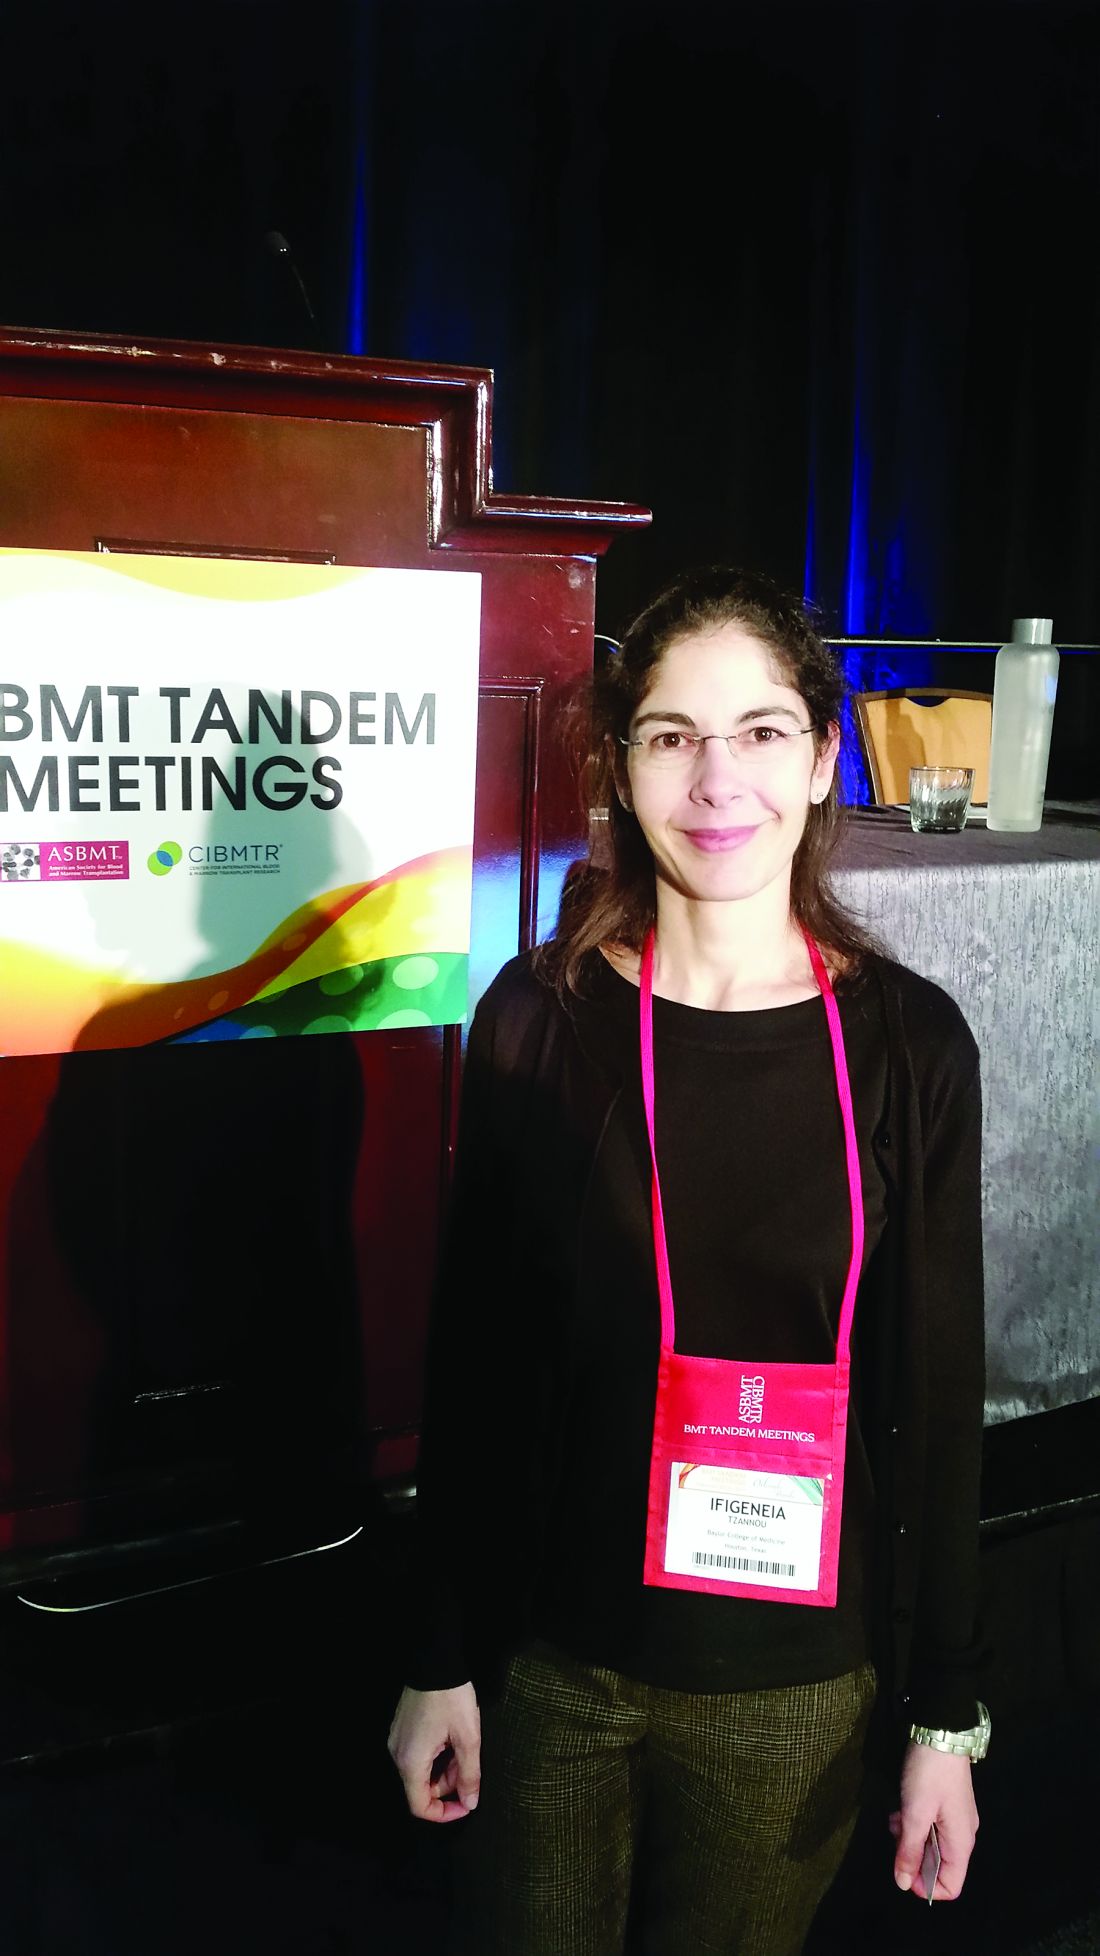
Viral infections cause nearly 40% of deaths after alternative donor hematopoietic cell transfer (HCT), Ifigeneia Tzannou, MD, said at the combined annual meetings of the Center for International Blood & Marrow Transplant Research and the American Society of Blood and Marrow Transplantation. Banked, “off-the-shelf” donor virus-resistant T cells can be an alternative to antiviral drugs, which are far from universally effective and may have serious side effects.
“Traditionally, we have generated T cells for infusion from the stem cell donor” by isolating and then stimulating and expanding the peripheral blood mononuclear cells for about 10 days ex vivo, said Dr. Tzannou. At that point, the clonal multivirus-resistant T cells can then be transferred to the recipient.
Donor-derived T cells have been used to prevent and treat Epstein-Barr virus (EBV), cytomegalovirus (CMV), adenovirus (AdV), BK virus (BKV), and human herpes virus 6 (HHV6) infections. The approach has been safe, reconstituting antiviral immunity and clearing disease effectively, with a 94% response rate reported in one recent study. However, said Dr. Tzannou, donor-derived virus-specific T cells (VSTs) have their limitations. Donors are increasingly younger and cord blood is being used more commonly, so there are growing numbers of donors who are seronegative for pathogenic viruses. In addition, the 10 days of production time and the additional week or 10 days required for release means that donor-derived VSTs can’t be urgently used.
The concept of banked third party VST therapy came about to address those limitations, said Dr. Tzannou of Baylor College of Medicine, Houston.
In a banked VST scenario, donor T cells with specific multiviral immunity are human leukocyte antigen (HLA) typed, expanded, and cryopreserved. A post-HCT patient with drug-refractory viral illness can receive T cells that are partially matched at HLA –A, HLA-B, or HLA-DR. Dr. Tzannou said that her group has now generated a bank of 59 VST lines to use in clinical testing of the third party approach.
In the study, Dr. Tzannou and her colleagues included both pediatric and adult post-allo-HCT patients with refractory EBV, CMV, AdV, BKV, and/or HHV6 infections. All had either failed a 14-day trial of antiviral therapy or could not tolerate antivirals. Patients could not be on more than 0.5 mg/kg per day of prednisone; they had to have an absolute neutrophil count above 500 per microliter and hemoglobin greater than 8 g/dL. Patients were excluded if they had acute GVHD of grade 2 or higher. There had to be a compatible VST line available that matched both the patient’s illness and HLA typing.
Patients initially received 20,000,000 VST cells per square meter of body surface area. If the investigators saw a partial response, patients could receive additional VST doses every 2 weeks.
Of the 42 patients infused, 23 received one infusion and 19 required two or more infusions. Seven study participants had two viral infections; 18 had CMV, 2 had EBV, 9 had AdV, 17 had BKV, and 3 had HHV6.
Dr. Tzannou and her colleagues tracked the virus-specific T cells and viral load for particular viruses. Virus-specific peripheral T cell counts also rose measurably and viral load plummeted within 2 weeks of VST infusions for most patients.
Overall, 93% of patients met the primary outcome measure of achieving complete or partial response; a partial response was defined as a 50% or better decrease in the viral load and/or clinical improvement.
All of the 17 BKV patients treated to date had tissue disease; 15 had hemorrhagic cystitis and 2 had nephritis. All responded to VSTs, and all of those with hemorrhagic cystitis had symptomatic improvement or resolution.
Overall, the safety profile for VST was good, said Dr. Tzannou. Four patients developed grade 1 acute cutaneous GVHD within 45 days of infusion; one of these developed de novo, but resolved with topical steroids. Another patient had a flare of gastrointestinal GVHD when immunosuppresion was being tapered. One more patient had a transient fever post infusion that resolved spontaneously, said Dr. Tzannou.
Next steps include a multicenter registration study, said Dr. Tzannou, who reports being a consultant for ViraCyte, which helped fund the study.
[email protected]
On Twitter @karioakes
ORLANDO – Infusions of banked multivirus-specific T lymphocytes were associated with complete or partial responses in 93% of 42 patients who had undergone hematopoietic cell transplants and had drug-refractory viral illnesses. Further, these patients experienced minimal new or reactivated graft-versus-host disease (GVHD).
Viral infections cause nearly 40% of deaths after alternative donor hematopoietic cell transfer (HCT), Ifigeneia Tzannou, MD, said at the combined annual meetings of the Center for International Blood & Marrow Transplant Research and the American Society of Blood and Marrow Transplantation. Banked, “off-the-shelf” donor virus-resistant T cells can be an alternative to antiviral drugs, which are far from universally effective and may have serious side effects.
“Traditionally, we have generated T cells for infusion from the stem cell donor” by isolating and then stimulating and expanding the peripheral blood mononuclear cells for about 10 days ex vivo, said Dr. Tzannou. At that point, the clonal multivirus-resistant T cells can then be transferred to the recipient.
Donor-derived T cells have been used to prevent and treat Epstein-Barr virus (EBV), cytomegalovirus (CMV), adenovirus (AdV), BK virus (BKV), and human herpes virus 6 (HHV6) infections. The approach has been safe, reconstituting antiviral immunity and clearing disease effectively, with a 94% response rate reported in one recent study. However, said Dr. Tzannou, donor-derived virus-specific T cells (VSTs) have their limitations. Donors are increasingly younger and cord blood is being used more commonly, so there are growing numbers of donors who are seronegative for pathogenic viruses. In addition, the 10 days of production time and the additional week or 10 days required for release means that donor-derived VSTs can’t be urgently used.
The concept of banked third party VST therapy came about to address those limitations, said Dr. Tzannou of Baylor College of Medicine, Houston.
In a banked VST scenario, donor T cells with specific multiviral immunity are human leukocyte antigen (HLA) typed, expanded, and cryopreserved. A post-HCT patient with drug-refractory viral illness can receive T cells that are partially matched at HLA –A, HLA-B, or HLA-DR. Dr. Tzannou said that her group has now generated a bank of 59 VST lines to use in clinical testing of the third party approach.
In the study, Dr. Tzannou and her colleagues included both pediatric and adult post-allo-HCT patients with refractory EBV, CMV, AdV, BKV, and/or HHV6 infections. All had either failed a 14-day trial of antiviral therapy or could not tolerate antivirals. Patients could not be on more than 0.5 mg/kg per day of prednisone; they had to have an absolute neutrophil count above 500 per microliter and hemoglobin greater than 8 g/dL. Patients were excluded if they had acute GVHD of grade 2 or higher. There had to be a compatible VST line available that matched both the patient’s illness and HLA typing.
Patients initially received 20,000,000 VST cells per square meter of body surface area. If the investigators saw a partial response, patients could receive additional VST doses every 2 weeks.
Of the 42 patients infused, 23 received one infusion and 19 required two or more infusions. Seven study participants had two viral infections; 18 had CMV, 2 had EBV, 9 had AdV, 17 had BKV, and 3 had HHV6.
Dr. Tzannou and her colleagues tracked the virus-specific T cells and viral load for particular viruses. Virus-specific peripheral T cell counts also rose measurably and viral load plummeted within 2 weeks of VST infusions for most patients.
Overall, 93% of patients met the primary outcome measure of achieving complete or partial response; a partial response was defined as a 50% or better decrease in the viral load and/or clinical improvement.
All of the 17 BKV patients treated to date had tissue disease; 15 had hemorrhagic cystitis and 2 had nephritis. All responded to VSTs, and all of those with hemorrhagic cystitis had symptomatic improvement or resolution.
Overall, the safety profile for VST was good, said Dr. Tzannou. Four patients developed grade 1 acute cutaneous GVHD within 45 days of infusion; one of these developed de novo, but resolved with topical steroids. Another patient had a flare of gastrointestinal GVHD when immunosuppresion was being tapered. One more patient had a transient fever post infusion that resolved spontaneously, said Dr. Tzannou.
Next steps include a multicenter registration study, said Dr. Tzannou, who reports being a consultant for ViraCyte, which helped fund the study.
[email protected]
On Twitter @karioakes
AT THE 2017 BMT TANDEM MEETINGS
Key clinical point:
Major finding: With banked multivirus-specific T cells, viral illnesses either improved or resolved in 93% of 42 patients.
Data source: Clinical trial of 42 postallogeneic hematopoietic cell transfer patients who had any of five viral illnesses and had either failed a 14-day trial of antiviral therapy or could not tolerate antivirals.
Disclosures: Dr. Tzannou is a consultant for Incyte, which partially funded the trial and is developing third-party VSTs.
Pruritic Rash on the Buttock
Cutaneous Larva Migrans
Cutaneous larva migrans (CLM) is caused by the larval migration of animal hookworms. Ancylostoma braziliense, Ancylostoma ceylanicum, and Ancylostoma caninum are the species most commonly associated with the disease. The hookworm is endemic to tropical and subtropical climates in areas such as Africa, Southeast Asia, South America, and the southeastern United States.1 Although cats and dogs are most commonly affected, humans can be infected if they are exposed to sand or soil containing hookworm larvae, often due to contamination from animal feces.2 Cutaneous larva migrans is characterized by pruritic erythematous papules and linear or serpiginous, reddish brown, elevated tracks most commonly appearing on the feet, buttocks, thighs, and lower legs; however, lesions can appear anywhere. In human hosts, the larvae travel in the epidermis and are unable to invade the dermis; it is speculated that they lack the collagenase enzymes required to penetrate the basement membrane before invading the dermis.2
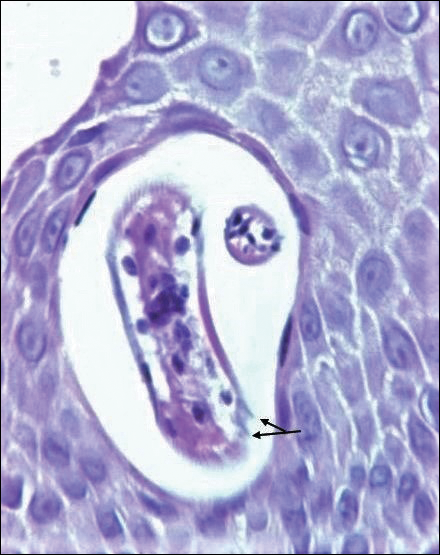
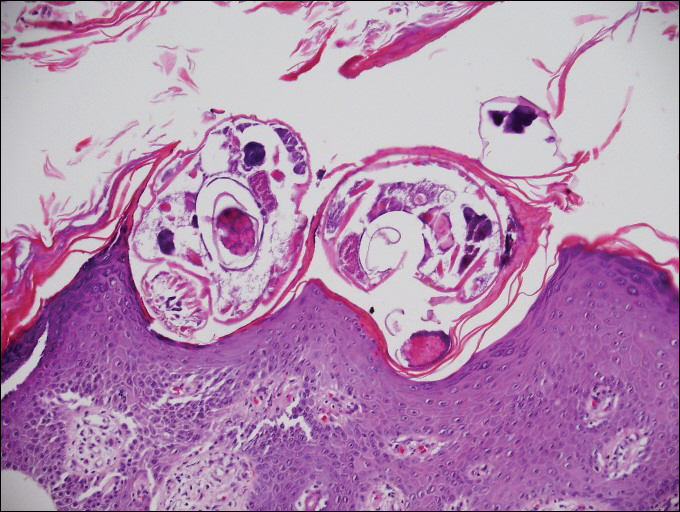
On histopathology, there typically are small cavities in the epidermis corresponding to the track of the larvae.3 There often is a spongiotic dermatitis with a mixed inflammatory infiltrate following the larvae with scattered eosinophils. The migrating larvae may be up to 1 mm in size and have bilateral double alae, or winglike projections, on the side of the body (Figure 1).4 The larvae are difficult to find on histopathology because they often travel beyond the areas that demonstrate clinical findings. The diagnosis of CLM is mostly clinical, but if a biopsy is performed, the specimen should be taken ahead of the track.
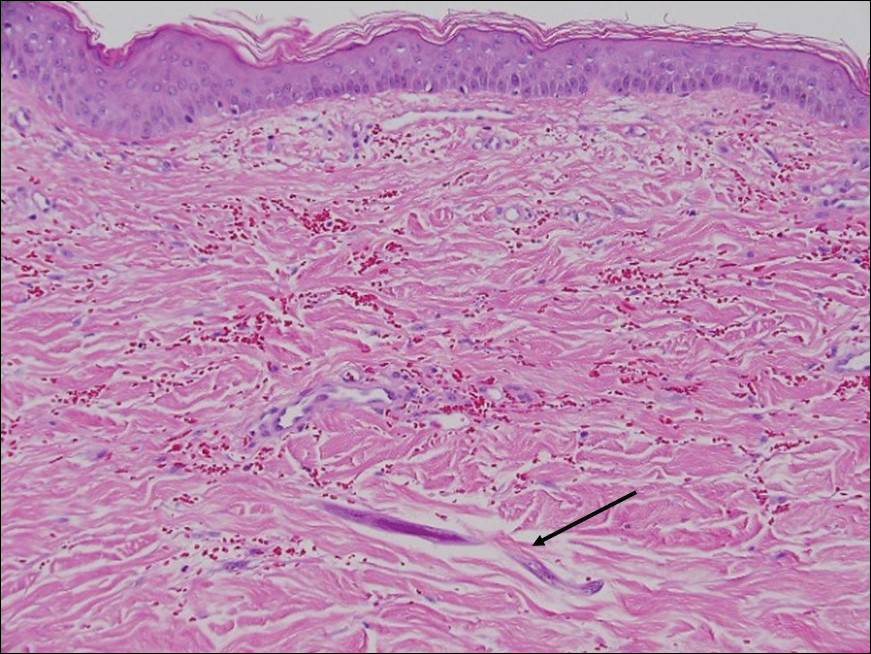
Disseminated strongyloidiasis is caused by Strongyloides stercoralis. When filariform larvae migrate out of the intestinal tract into the skin, they can cause an urticarial rash and serpiginous patterns on the skin that can move 5 to 15 cm per hour, a clinical condition known as larva currens. In immunocompromised individuals, there can be hyperinfection with diffuse petechial thumbprint purpura seen clinically, which characteristically radiate from the periumbilical area.1 On pathology, there may be numerous larvae found between the dermal collagen bundles, measuring 9 to 15 µm in diameter. Rarely, they also can be found in small blood vessels.3 They often are accompanied by extravasated red blood cells in the tissues (Figure 2).
Myiasis represents the largest pathogen in the differential diagnosis for CLM. In myiasis, fly larvae will infest human tissue, usually by forming a small cavity in the dermis or subcutaneous tissue. The larvae are visible to the human eye and can be up to several centimeters in length. In the skin, the histology of myiasis usually is accompanied by a heavy mixed inflammatory cell infiltrate with many eosinophils. Fragments of the larvae are seen encased by a thick chitinous cuticle with widely spaced spines or pigmented setae (Figure 3) on the surface of the cuticle.5 Layers of striated muscle and internal organs may be seen beneath the cuticle.3

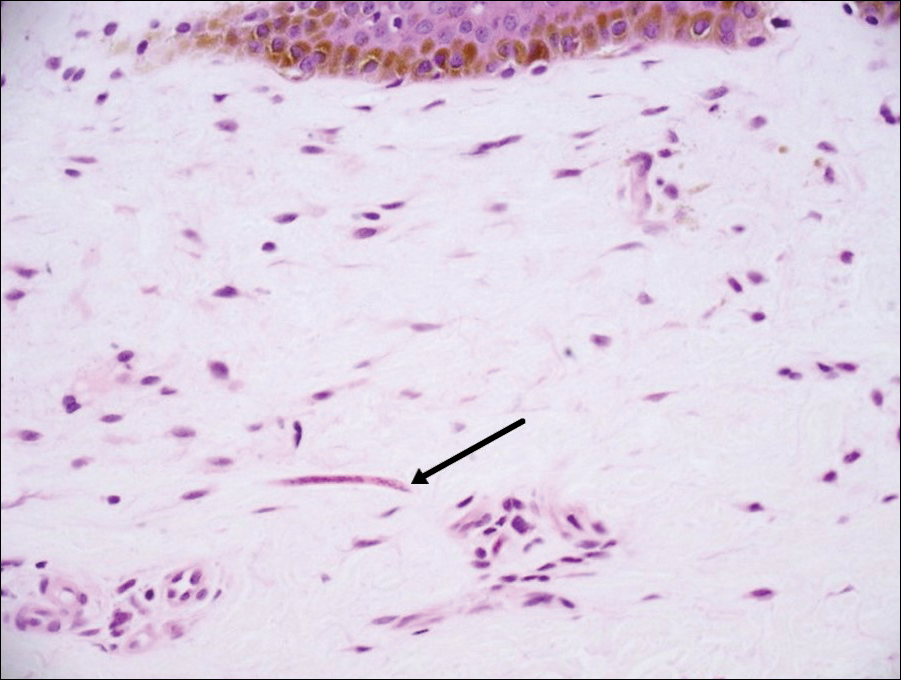
Onchocerciasis, or river blindness, is a parasitic disease caused by Onchocerca volvulus that is most often seen in sub-Saharan Africa. It may cause the skin finding of an onchocercoma, a subcutaneous nodule made up of Onchocerca nematodes. However, when the filaria disseminate, it may cause onchocerciasis with cutaneous findings of an eczematous dermatitis with itching and lichenification.1 In onchocercal dermatitis, microfilariae may be found in the dermis and there may be a mild dermal chronic inflammatory infiltrate with eosinophils.3 These microfilariae are smaller than Strongyloides larvae (Figure 4).
Sarcoptes scabiei are mites that are pathologically found limited to the stratum corneum. There often is a spongiotic dermatitis as the mite travels with an accompanying mixed cell inflammatory infiltrate with many eosinophils. One or more mites may be seen with or without eggs and excreta or scybala (Figure 5). Pink pigtails may be seen connected to the stratum corneum, representing egg fragments or casings left behind after the mite hatches.3 The female mite measures up to 0.4 mm in length.3
- Lupi O, Downing C, Lee M, et al. Mucocutaneous manifestations of helminth infections. J Am Acad Dermatol. 2015;73:929-944.
- James WD, Berger T, Elston D. Andrews' Diseases of the Skin: Clinical Dermatology. 12th ed. Philadelphia, PA: Elsevier; 2016.
- Patterson J. Weedon's Skin Pathology. 4th ed. London, England: Churchill Livingstone Elsevier; 2016.
- Milner D. Diagnostic Pathology: Infectious Diseases. Philadelphia, PA: Elsevier; 2015.
- Ferringer T, Peckham S, Ko CJ, et al. Dermatopathology. 2nd ed. Philadelphia, PA: Elsevier Saunders; 2013.
Cutaneous Larva Migrans
Cutaneous larva migrans (CLM) is caused by the larval migration of animal hookworms. Ancylostoma braziliense, Ancylostoma ceylanicum, and Ancylostoma caninum are the species most commonly associated with the disease. The hookworm is endemic to tropical and subtropical climates in areas such as Africa, Southeast Asia, South America, and the southeastern United States.1 Although cats and dogs are most commonly affected, humans can be infected if they are exposed to sand or soil containing hookworm larvae, often due to contamination from animal feces.2 Cutaneous larva migrans is characterized by pruritic erythematous papules and linear or serpiginous, reddish brown, elevated tracks most commonly appearing on the feet, buttocks, thighs, and lower legs; however, lesions can appear anywhere. In human hosts, the larvae travel in the epidermis and are unable to invade the dermis; it is speculated that they lack the collagenase enzymes required to penetrate the basement membrane before invading the dermis.2
On histopathology, there typically are small cavities in the epidermis corresponding to the track of the larvae.3 There often is a spongiotic dermatitis with a mixed inflammatory infiltrate following the larvae with scattered eosinophils. The migrating larvae may be up to 1 mm in size and have bilateral double alae, or winglike projections, on the side of the body (Figure 1).4 The larvae are difficult to find on histopathology because they often travel beyond the areas that demonstrate clinical findings. The diagnosis of CLM is mostly clinical, but if a biopsy is performed, the specimen should be taken ahead of the track.
Disseminated strongyloidiasis is caused by Strongyloides stercoralis. When filariform larvae migrate out of the intestinal tract into the skin, they can cause an urticarial rash and serpiginous patterns on the skin that can move 5 to 15 cm per hour, a clinical condition known as larva currens. In immunocompromised individuals, there can be hyperinfection with diffuse petechial thumbprint purpura seen clinically, which characteristically radiate from the periumbilical area.1 On pathology, there may be numerous larvae found between the dermal collagen bundles, measuring 9 to 15 µm in diameter. Rarely, they also can be found in small blood vessels.3 They often are accompanied by extravasated red blood cells in the tissues (Figure 2).
Myiasis represents the largest pathogen in the differential diagnosis for CLM. In myiasis, fly larvae will infest human tissue, usually by forming a small cavity in the dermis or subcutaneous tissue. The larvae are visible to the human eye and can be up to several centimeters in length. In the skin, the histology of myiasis usually is accompanied by a heavy mixed inflammatory cell infiltrate with many eosinophils. Fragments of the larvae are seen encased by a thick chitinous cuticle with widely spaced spines or pigmented setae (Figure 3) on the surface of the cuticle.5 Layers of striated muscle and internal organs may be seen beneath the cuticle.3
Onchocerciasis, or river blindness, is a parasitic disease caused by Onchocerca volvulus that is most often seen in sub-Saharan Africa. It may cause the skin finding of an onchocercoma, a subcutaneous nodule made up of Onchocerca nematodes. However, when the filaria disseminate, it may cause onchocerciasis with cutaneous findings of an eczematous dermatitis with itching and lichenification.1 In onchocercal dermatitis, microfilariae may be found in the dermis and there may be a mild dermal chronic inflammatory infiltrate with eosinophils.3 These microfilariae are smaller than Strongyloides larvae (Figure 4).
Sarcoptes scabiei are mites that are pathologically found limited to the stratum corneum. There often is a spongiotic dermatitis as the mite travels with an accompanying mixed cell inflammatory infiltrate with many eosinophils. One or more mites may be seen with or without eggs and excreta or scybala (Figure 5). Pink pigtails may be seen connected to the stratum corneum, representing egg fragments or casings left behind after the mite hatches.3 The female mite measures up to 0.4 mm in length.3
- Lupi O, Downing C, Lee M, et al. Mucocutaneous manifestations of helminth infections. J Am Acad Dermatol. 2015;73:929-944.
- James WD, Berger T, Elston D. Andrews' Diseases of the Skin: Clinical Dermatology. 12th ed. Philadelphia, PA: Elsevier; 2016.
- Patterson J. Weedon's Skin Pathology. 4th ed. London, England: Churchill Livingstone Elsevier; 2016.
- Milner D. Diagnostic Pathology: Infectious Diseases. Philadelphia, PA: Elsevier; 2015.
- Ferringer T, Peckham S, Ko CJ, et al. Dermatopathology. 2nd ed. Philadelphia, PA: Elsevier Saunders; 2013.
An 18-year-old man presented with a several-week history of an expanding pruritic serpiginous and linear eruption on the buttock. The patient recently had spent some time vacationing at the beach in the southeastern United States. Physical examination revealed erythematous linear papules and serpiginous raised tracks on the buttock. A biopsy of the lesion was performed.
Large Hyperpigmented Plaques on the Trunk of a Newborn
The Diagnosis: Cutaneous Mastocytoma
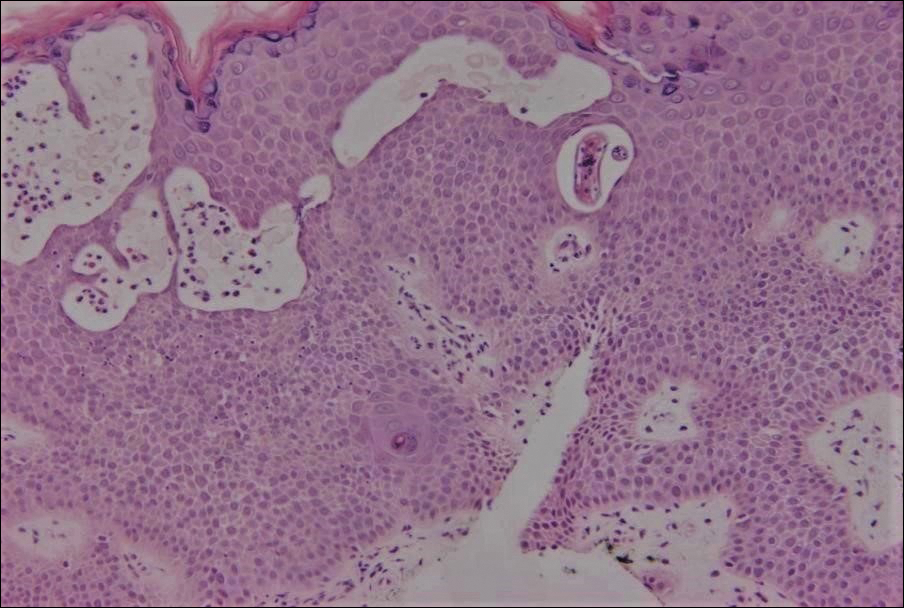
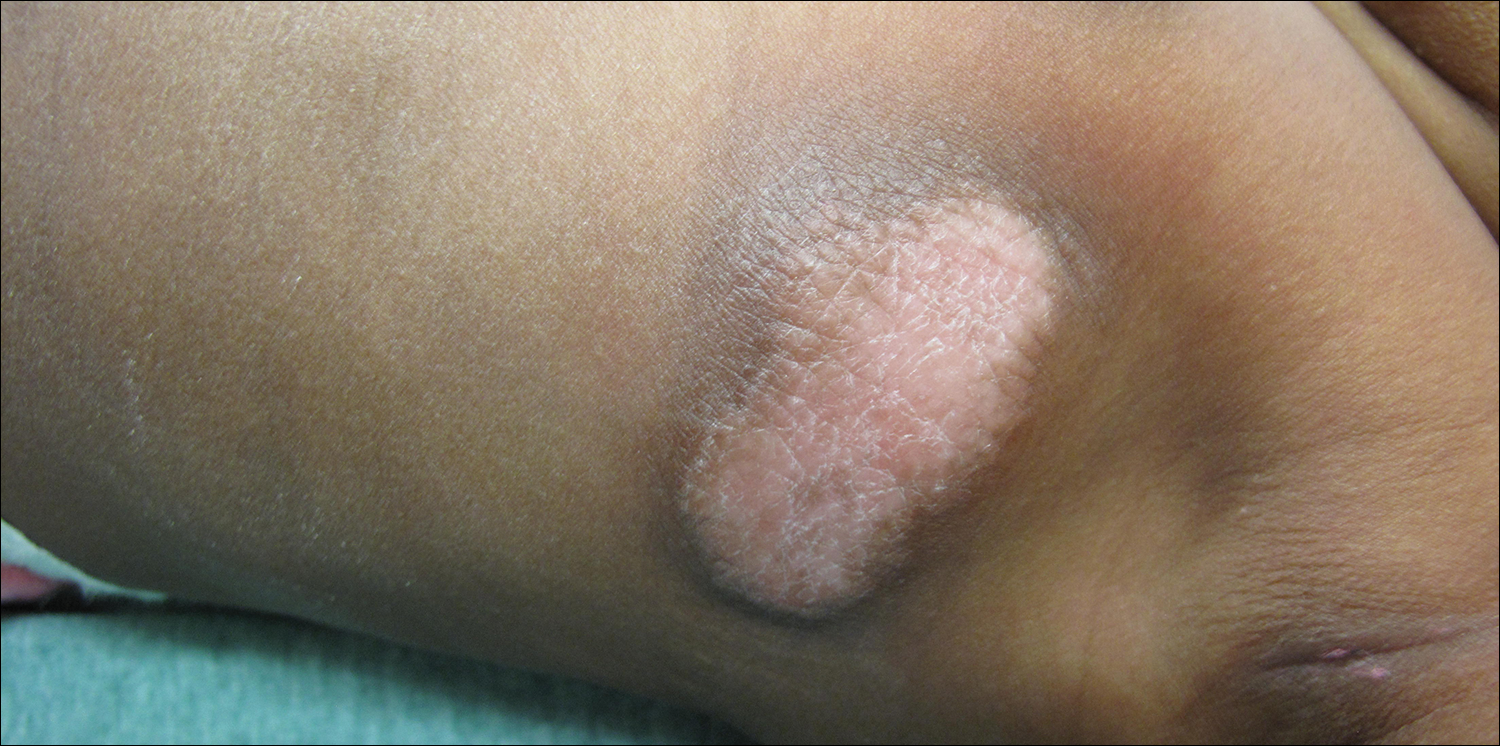
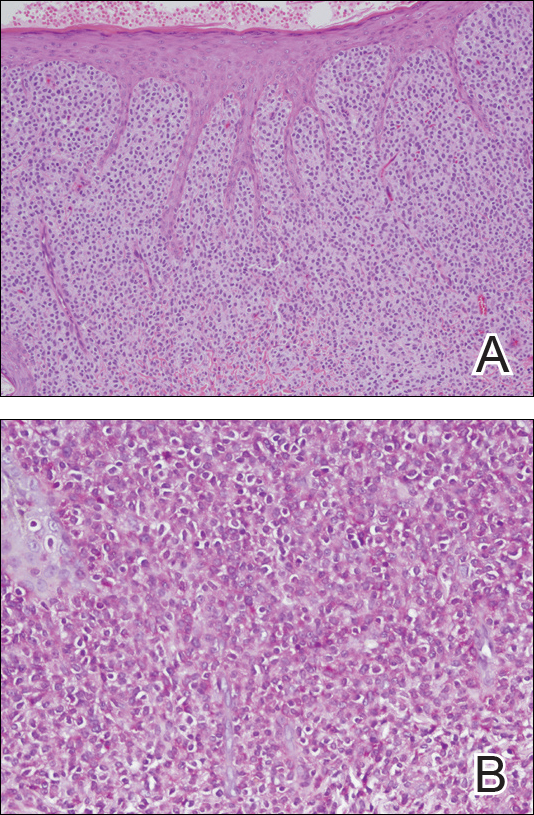
Physical examination revealed a 58×51-mm hyperpigmented plaque with central pink coloration and scale on the right side of the back as well as a 39×33-mm pink plaque with a hyperpigmented border on the left side of the flank (Figure 1). At follow-up 2 weeks later, the patient's parents reported that blisters formed within both of the plaques. The blisters ruptured a few hours after forming and drained clear fluid with scant blood. Both plaques contained erosions from the ruptured bullae but remained the same size with no surrounding erythema or warmth. A 4-mm punch biopsy was performed of intact skin from the back lesion (Figure 2A). Histologic examination revealed a cellular infiltrate of monotonous bland cells that completely filled the dermis without epidermal involvement, along with occasional intermixed eosinophils. The morphology of these infiltrating cells was compatible with mast cells confirmed by strongly positive Leder staining (Figure 2B).
Mastocytosis encompasses a rare group of disorders characterized by abnormal mast cell accumulation or mast cell mediator release in various tissues. These disorders can be classified as either systemic mastocytosis with mast cell infiltration into bone marrow or other extracutaneous organs, or cutaneous mastocytosis with disease limited to the skin.1 Mutations involving activation of the c-Kit receptor in stimulating mast cell growth and development have been implicated in both systemic and cutaneous forms of the disease.2,3
Cutaneous mastocytosis is most often diagnosed in childhood and typically is characterized by spontaneous regression before puberty in a majority of cases.1,4 Under the World Health Organization classification system, cutaneous mastocytosis can be further subdivided into 3 disorders (listed in order of most to least common): urticaria pigmentosa (also known as maculopapular cutaneous mastocytosis) with typical, plaque, and nodular forms; cutaneous mastocytoma (as seen in this patient); and diffuse cutaneous mastocytosis.5 Compared to the widespread distribution of small macules and papules in urticaria pigmentosa, the cutaneous mastocytoma subtype presents with 1 to 6 brown to orange-yellow plaques or nodules measuring more than 1 cm in diameter. Cutaneous mastocytoma typically presents in infancy and is located most commonly on the trunk and extremities, though it may be found on the face or scalp. The plaques of mastocytoma often have well-defined margins, and these lesions may become bullous or demonstrate Darier sign of urtication and erythema on physical stimulation. Patients most commonly experience pruritus from mast cell degranulation and rarely exhibit systemic symptoms of mast cell mediator release; however, generalized flushing, hypotension, headaches, and gastrointestinal symptoms may occur, particularly if the lesion is vigorously rubbed.6,7 Conditions in the differential include aplasia cutis congenita, connective tissue nevus, epidermal nevus, and epidermolysis bullosa. They should not elicit a blister if rubbed, except for epidermolysis bullosa, which can easily be differentiated based on histology.
The workup for cutaneous mastocytosis in the pediatric population may include a biopsy of lesional skin, though in many cases the characteristic cutaneous manifestations are sufficient to make a diagnosis. Histologically, biopsy results often reveal abundant diffuse dermal infiltration of mast cells, which are characterized by their large pink granular cytoplasm and round dense central nuclei. In pediatric patients, mast cells typically are restricted to the dermis, and there is a low risk for hematologic abnormalities, thereby precluding the need for bone marrow examination in the absence of organomegaly or notable peripheral blood abnormalities such as severe cytopenia.5,6
Management of cutaneous mastocytosis consists of avoidance of mast cell degranulation triggers and symptomatic treatment of histamine release. Triggers include certain medications (eg, narcotic analgesics, aspirin, nonsteroidal anti-inflammatory drugs, iodinated contrast agents, antibiotics, muscle relaxants), mechanical irritation, insect stings, spicy foods, stress, or extreme temperature changes.8 Symptomatic treatment can be achieved through topical corticosteroid or oral antihistamine use. Along with decreasing pruritus, topical corticosteroids also may be helpful in decreasing time to spontaneous resolution and healing.7 The patient in this case was treated with desonide ointment 0.05% daily to both lesions as well as mupirocin ointment 2% as needed for erosions. These treatments helped reduce the patient's symptoms, but her lesions persisted over a follow-up period of 4 months.
- Valent P, Sperr WR, Schwartz LB, et al. Diagnosis and classification of mast cell proliferative disorders: delineation from immunologic diseases and non-mast cell hematopoietic neoplasms. J Allergy Clin Immunol. 2004;114:3-11.
- Bibi S, Langenfeld F, Jeanningros S, et al. Molecular defects in mastocytosis: KIT and beyond KIT. Immunol Allergy Clin North Am. 2014;34:239-262.
- Yavuz AS, Lipsky PE, Yavuz S, et al. Evidence for the involvement of a hematopoietic progenitor cell in systemic mastocytosis from single-cell analysis of mutations in the c-kit gene. Blood. 2002;100:661-665.
- Méni C, Bruneau J, Georgin-Lavialle S, et al. Paediatric mastocytosis: a systematic review of 1747 cases. Br J Dermatol. 2015;172:642-651.
- Valent P, Horny HP, Escribano L, et al. Diagnostic criteria and classification of mastocytosis: a consensus proposal. Leuk Res. 2001;25:603-625.
- Wolff K, Komar M, Petzelbauer P. Clinical and histopathological aspects of cutaneous mastocytosis. Leuk Res. 2001;25:519-528.
- Patrizi A, Tabanelli M, Neri I, et al. Topical corticosteroids versus "wait and see" in the management of solitary mastocytoma in pediatric patients: a long-term follow-up. Dermatol Ther. 2015;28:57-61.
- Bonadonna P, Lombardo C. Drug allergy in mastocytosis. Immunol Allergy Clin North Am. 2014;34:397-405.
The Diagnosis: Cutaneous Mastocytoma
Physical examination revealed a 58×51-mm hyperpigmented plaque with central pink coloration and scale on the right side of the back as well as a 39×33-mm pink plaque with a hyperpigmented border on the left side of the flank (Figure 1). At follow-up 2 weeks later, the patient's parents reported that blisters formed within both of the plaques. The blisters ruptured a few hours after forming and drained clear fluid with scant blood. Both plaques contained erosions from the ruptured bullae but remained the same size with no surrounding erythema or warmth. A 4-mm punch biopsy was performed of intact skin from the back lesion (Figure 2A). Histologic examination revealed a cellular infiltrate of monotonous bland cells that completely filled the dermis without epidermal involvement, along with occasional intermixed eosinophils. The morphology of these infiltrating cells was compatible with mast cells confirmed by strongly positive Leder staining (Figure 2B).
Mastocytosis encompasses a rare group of disorders characterized by abnormal mast cell accumulation or mast cell mediator release in various tissues. These disorders can be classified as either systemic mastocytosis with mast cell infiltration into bone marrow or other extracutaneous organs, or cutaneous mastocytosis with disease limited to the skin.1 Mutations involving activation of the c-Kit receptor in stimulating mast cell growth and development have been implicated in both systemic and cutaneous forms of the disease.2,3
Cutaneous mastocytosis is most often diagnosed in childhood and typically is characterized by spontaneous regression before puberty in a majority of cases.1,4 Under the World Health Organization classification system, cutaneous mastocytosis can be further subdivided into 3 disorders (listed in order of most to least common): urticaria pigmentosa (also known as maculopapular cutaneous mastocytosis) with typical, plaque, and nodular forms; cutaneous mastocytoma (as seen in this patient); and diffuse cutaneous mastocytosis.5 Compared to the widespread distribution of small macules and papules in urticaria pigmentosa, the cutaneous mastocytoma subtype presents with 1 to 6 brown to orange-yellow plaques or nodules measuring more than 1 cm in diameter. Cutaneous mastocytoma typically presents in infancy and is located most commonly on the trunk and extremities, though it may be found on the face or scalp. The plaques of mastocytoma often have well-defined margins, and these lesions may become bullous or demonstrate Darier sign of urtication and erythema on physical stimulation. Patients most commonly experience pruritus from mast cell degranulation and rarely exhibit systemic symptoms of mast cell mediator release; however, generalized flushing, hypotension, headaches, and gastrointestinal symptoms may occur, particularly if the lesion is vigorously rubbed.6,7 Conditions in the differential include aplasia cutis congenita, connective tissue nevus, epidermal nevus, and epidermolysis bullosa. They should not elicit a blister if rubbed, except for epidermolysis bullosa, which can easily be differentiated based on histology.
The workup for cutaneous mastocytosis in the pediatric population may include a biopsy of lesional skin, though in many cases the characteristic cutaneous manifestations are sufficient to make a diagnosis. Histologically, biopsy results often reveal abundant diffuse dermal infiltration of mast cells, which are characterized by their large pink granular cytoplasm and round dense central nuclei. In pediatric patients, mast cells typically are restricted to the dermis, and there is a low risk for hematologic abnormalities, thereby precluding the need for bone marrow examination in the absence of organomegaly or notable peripheral blood abnormalities such as severe cytopenia.5,6
Management of cutaneous mastocytosis consists of avoidance of mast cell degranulation triggers and symptomatic treatment of histamine release. Triggers include certain medications (eg, narcotic analgesics, aspirin, nonsteroidal anti-inflammatory drugs, iodinated contrast agents, antibiotics, muscle relaxants), mechanical irritation, insect stings, spicy foods, stress, or extreme temperature changes.8 Symptomatic treatment can be achieved through topical corticosteroid or oral antihistamine use. Along with decreasing pruritus, topical corticosteroids also may be helpful in decreasing time to spontaneous resolution and healing.7 The patient in this case was treated with desonide ointment 0.05% daily to both lesions as well as mupirocin ointment 2% as needed for erosions. These treatments helped reduce the patient's symptoms, but her lesions persisted over a follow-up period of 4 months.
- Valent P, Sperr WR, Schwartz LB, et al. Diagnosis and classification of mast cell proliferative disorders: delineation from immunologic diseases and non-mast cell hematopoietic neoplasms. J Allergy Clin Immunol. 2004;114:3-11.
- Bibi S, Langenfeld F, Jeanningros S, et al. Molecular defects in mastocytosis: KIT and beyond KIT. Immunol Allergy Clin North Am. 2014;34:239-262.
- Yavuz AS, Lipsky PE, Yavuz S, et al. Evidence for the involvement of a hematopoietic progenitor cell in systemic mastocytosis from single-cell analysis of mutations in the c-kit gene. Blood. 2002;100:661-665.
- Méni C, Bruneau J, Georgin-Lavialle S, et al. Paediatric mastocytosis: a systematic review of 1747 cases. Br J Dermatol. 2015;172:642-651.
- Valent P, Horny HP, Escribano L, et al. Diagnostic criteria and classification of mastocytosis: a consensus proposal. Leuk Res. 2001;25:603-625.
- Wolff K, Komar M, Petzelbauer P. Clinical and histopathological aspects of cutaneous mastocytosis. Leuk Res. 2001;25:519-528.
- Patrizi A, Tabanelli M, Neri I, et al. Topical corticosteroids versus "wait and see" in the management of solitary mastocytoma in pediatric patients: a long-term follow-up. Dermatol Ther. 2015;28:57-61.
- Bonadonna P, Lombardo C. Drug allergy in mastocytosis. Immunol Allergy Clin North Am. 2014;34:397-405.
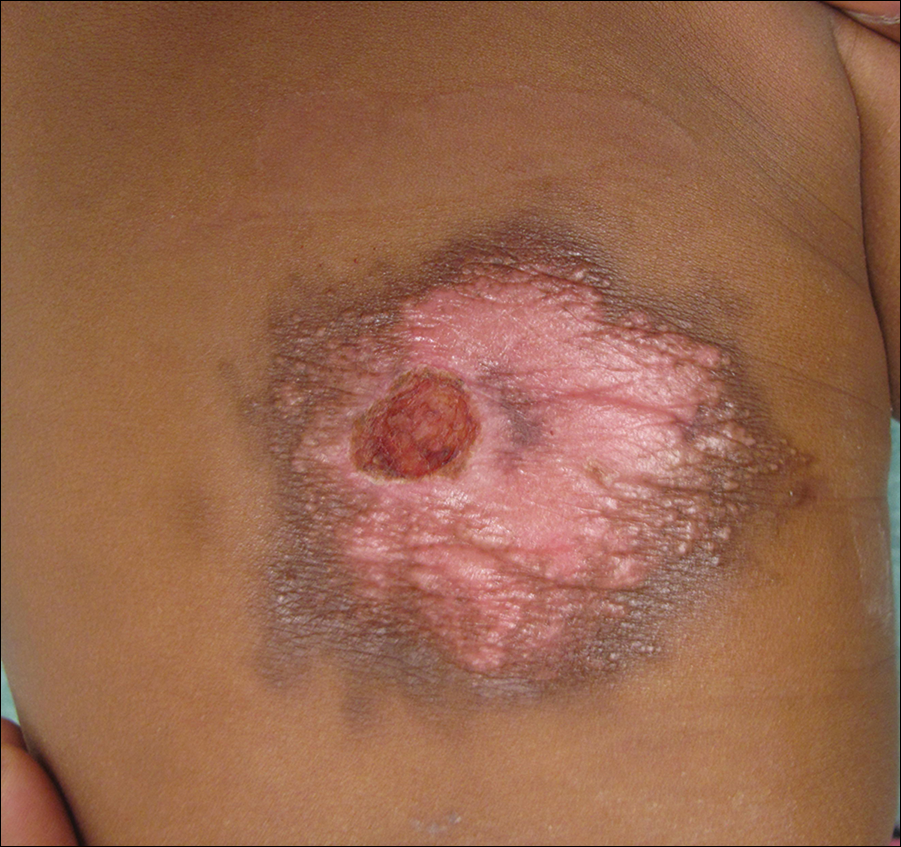
A 4-day-old girl with no notable medical history presented with 2 pink lesions on the right side of the back and left side of the flank. Both lesions were present at birth and had not changed in size, shape, or color in the first 4 days of life. She had no constitutional symptoms. The child was a full-term newborn, and her mother experienced no pregnancy or delivery complications. She had no family history of similar skin findings.
Systemic Hypothermia as Treatment for an Acute Cervical Spinal Cord Injury in a Professional Football Player: 9-Year Follow-Up
Take-Home Points
- Importance of on-field management.
- Preseason drilling of spinal injury management.
- Early and rapid intervention.
- Possible benefit of moderate systemic hypothermia as treatment for acute cervical injury.
In 2010, we reported the case of a professional American football player who sustained a complete cervical spinal cord injury (SCI) while tackling an opposing player.1 He received prompt medical and surgical care based on then-current recommendations, but was also treated with systemic hypothermia soon after his injury. Although systemic hypothermia had been used in the management of other neurologic injuries at that time, it had not been used in humans with acute SCI, except as described in 2 case reports.2,3 However, Dietrich4 described early emerging animal data on the efficacy of systemic hypothermia for acute SCI. We now provide a clinical update on our patient, who provided written informed consent for print and electronic publication of this case report.
Case Report
During a National Football League game, the player sustained a C3–C4 fracture-dislocation after a helmet-to-helmet hit on an opposing player. He fell face down on the ground and did not move. The team’s physician and trainer rushed to the player’s side, immediately assessed him, and initiated the emergency spinal resuscitation protocol.
As per protocol, the assigned team leader took charge of managing the player’s head to maintain in-line traction with the helmet in place until the head was secured in place on a backboard designed to accommodate the helmet. 
Complete motor paralysis and sensory loss (American Spinal Injury Association [ASIA] level A) were noted below the clavicles during physical examination by the head athletic trainer and 2 independent physicians, and by self-report. 

On arrival at the hospital, the patient had a core temperature of 98°F, which is substantially lower than the average core temperature (≤101.7°F) of an active football player.6He had a normal level of consciousness and normal cranial nerve function but remained without any voluntary motor function in the extremities and still had no sensation below the clavicles, except crude pressure sensation in one hand while in the emergency department. After the helmet and shoulder pads were removed, per National Athletic Trainers’ Association (NATA) protocol7 (Figure 2), he was stabilized, and a hard cervical collar was placed. A lateral radiograph (Figure 4) showed a C3–C4 facet dislocation with about 46% anterior translation of C3 on C4 and obvious disruption of the facets. 
About 3 hours after injury, the patient was taken to the operating room. Although closed reduction improved alignment dramatically, it failed to completely reduce the dislocated left C3–C4 facet. An hour later, anterior C3–C4 discectomy was performed from the front with instrumented anterior interbody fusion. This was immediately followed by posterior decompressive laminectomy, bilateral facet reduction, and fusion with instrumentation. Surgery was completed within about 4 hours, almost exactly 7 hours after injury. Anesthesia records indicated a core temperature range of 94.1°F to 95.3°F with passive cooling during surgery. CT and MRI performed within 4 hours after surgery showed excellent cord decompression.
The next morning, about 14.5 hours after injury, the patient demonstrated a flicker of the adductor muscles of the lower extremities. An examination an hour later revealed 1/5 quadriceps, 2/5 adductors, and 1/5 gastrocnemius/soleus. A nurse’s hourly examinations and the surgeon’s repeat examinations revealed no other motor function. Sensory function was more difficult to evaluate because of sedation, but rudimentary sensation was noted throughout the lower extremities, and proprioception and vibratory sensation were noted as well. With passive cooling, it was difficult to consistently maintain moderate hypothermia; the patient’s core temperature ranged from 94.8°F to 98.8°F by 6:00 a.m. Therefore, the decision was made to place a Cordis sheath in the left femoral vein and introduce an intra-vena cava cooling catheter through it. This catheter was highly effective in maintaining the patient’s temperature at about 92.5°F.
Over the next 36 hours, the patient demonstrated increased motor activity in the upper and lower extremities: 1/5 biceps, 2-3/5 triceps, 3/5 quadriceps. He was slowly rewarmed and, on postoperative day 3, extubated. 
At 2 years, the patient underwent another anterior-only cervical procedure: The inferior adjacent segment (C4–C5) was fused because of neck pain and deformity. 
With respect to the original injury and the evolution in cord appearance, the patient had solid arthrodesis from C3–C5 with instrumentation in good position. There was evidence of loss of lordosis at C5–C6 with disk dessication and broad-based bulging. The spinal cord had evidence of myelomalacia; this was noted when the patient was in rehabilitation, 1 month after injury. The 2-cm × 11-mm area of myelomalacia was directly posterior to the fused C3–C4 interval (original MRI, Figure 5; 2-week MRI, Figure 6).
Conclusion
At the time this player was injured, use of systemic hypothermia with standard therapy for acute SCI was unique and controversial. Since then, smaller randomized human studies have described the tolerable safety profile, efficacy, and potential benefits of this intervention in acute SCI in humans.8-10 Now, modest systemic hypothermia can be one of many tools considered in the treatment of acute SCI. Before it can become the standard of care, however, additional larger prospective randomized studies need to be completed.
Am J Orthop. 2017;46(2):E79-E82. Copyright Frontline Medical Communications Inc. 2017. All rights reserved.
1. Cappuccino A, Bisson LJ, Carpenter B, Marzo J, Dietrich WD 3rd, Cappuccino H. The use of systemic hypothermia for the treatment of an acute cervical spinal cord injury in a professional football player. Spine. 2010;35(2):E57-E62.
2. Goldstein J. Lowering body temp shows promise for trauma treatment. Spinal Cord Injury Information Pages news blog. http://www.sci-info-pages.com/2006/05/lowering-body-temp-shows-promise-for.html. Published May 3, 2006. Accessed March 19, 2009.
3. Hartemink KJ, Wisselink W, Rauwerda JA, Girbes AR, Polderman KH. Novel applications of therapeutic hypothermia: report of three cases. Crit Care. 2004;8(5):R343-R346.
4. Dietrich WD. Presidential address presented at: 34th Annual Meeting of the Cervical Spine Research Society; November 30, 2006; Palm Beach, FL.
5. Bracken MB, Shepard MJ, Collins WF, et al. A randomized, controlled trial of methylprednisolone or naloxone in the treatment of acute spinal-cord injury. Results of the second National Acute Spinal Cord Injury Study. N Engl J Med. 1990;322(20):1405-1411.
6. Horodyski MB, LuCante K, Escobar E, et al. Intermittent Cool, Dry Air Underneath Football Shoulder Pads Assists in Temperature Homeostasis. In: The American Orthopaedic Society for Sports Medicine Proceedings 2008; 87-88.
7. Kleiner DM, Almquist JL, Bailes J, et al; Inter-Association Task Force for Appropriate Care of the Spine-Injured Athlete. Prehospital Care of the Spine-Injured Athlete. Dallas, TX: National Athletic Trainers’ Association; 2001. http://www.msata.org/Resources/Documents/PreHospitalCare4SpineInjuredAthlete.pdf. Published March 2001. Accessed January 10, 2017.
8. Dididze M, Green BA, Dietrich WD, Vanni S, Wang MY, Levi AD. Systemic hypothermia in acute cervical spinal cord injury: a case-controlled study. Spinal Cord. 2013;51(5):395-400.
9. Levi AD, Casella G, Green BA, et al. Clinical outcomes using modest intravascular hypothermia after acute cervical spinal cord injury. Neurosurgery. 2010;66(4):670-677.
10. Levi AD, Green BA, Wang MY, et al. Clinical application of modest hypothermia after spinal cord injury. J Neurotrauma. 2009;26(3):407-415.
Take-Home Points
- Importance of on-field management.
- Preseason drilling of spinal injury management.
- Early and rapid intervention.
- Possible benefit of moderate systemic hypothermia as treatment for acute cervical injury.
In 2010, we reported the case of a professional American football player who sustained a complete cervical spinal cord injury (SCI) while tackling an opposing player.1 He received prompt medical and surgical care based on then-current recommendations, but was also treated with systemic hypothermia soon after his injury. Although systemic hypothermia had been used in the management of other neurologic injuries at that time, it had not been used in humans with acute SCI, except as described in 2 case reports.2,3 However, Dietrich4 described early emerging animal data on the efficacy of systemic hypothermia for acute SCI. We now provide a clinical update on our patient, who provided written informed consent for print and electronic publication of this case report.
Case Report
During a National Football League game, the player sustained a C3–C4 fracture-dislocation after a helmet-to-helmet hit on an opposing player. He fell face down on the ground and did not move. The team’s physician and trainer rushed to the player’s side, immediately assessed him, and initiated the emergency spinal resuscitation protocol.
As per protocol, the assigned team leader took charge of managing the player’s head to maintain in-line traction with the helmet in place until the head was secured in place on a backboard designed to accommodate the helmet.
Complete motor paralysis and sensory loss (American Spinal Injury Association [ASIA] level A) were noted below the clavicles during physical examination by the head athletic trainer and 2 independent physicians, and by self-report.
On arrival at the hospital, the patient had a core temperature of 98°F, which is substantially lower than the average core temperature (≤101.7°F) of an active football player.6He had a normal level of consciousness and normal cranial nerve function but remained without any voluntary motor function in the extremities and still had no sensation below the clavicles, except crude pressure sensation in one hand while in the emergency department. After the helmet and shoulder pads were removed, per National Athletic Trainers’ Association (NATA) protocol7 (Figure 2), he was stabilized, and a hard cervical collar was placed. A lateral radiograph (Figure 4) showed a C3–C4 facet dislocation with about 46% anterior translation of C3 on C4 and obvious disruption of the facets.
About 3 hours after injury, the patient was taken to the operating room. Although closed reduction improved alignment dramatically, it failed to completely reduce the dislocated left C3–C4 facet. An hour later, anterior C3–C4 discectomy was performed from the front with instrumented anterior interbody fusion. This was immediately followed by posterior decompressive laminectomy, bilateral facet reduction, and fusion with instrumentation. Surgery was completed within about 4 hours, almost exactly 7 hours after injury. Anesthesia records indicated a core temperature range of 94.1°F to 95.3°F with passive cooling during surgery. CT and MRI performed within 4 hours after surgery showed excellent cord decompression.
The next morning, about 14.5 hours after injury, the patient demonstrated a flicker of the adductor muscles of the lower extremities. An examination an hour later revealed 1/5 quadriceps, 2/5 adductors, and 1/5 gastrocnemius/soleus. A nurse’s hourly examinations and the surgeon’s repeat examinations revealed no other motor function. Sensory function was more difficult to evaluate because of sedation, but rudimentary sensation was noted throughout the lower extremities, and proprioception and vibratory sensation were noted as well. With passive cooling, it was difficult to consistently maintain moderate hypothermia; the patient’s core temperature ranged from 94.8°F to 98.8°F by 6:00 a.m. Therefore, the decision was made to place a Cordis sheath in the left femoral vein and introduce an intra-vena cava cooling catheter through it. This catheter was highly effective in maintaining the patient’s temperature at about 92.5°F.
Over the next 36 hours, the patient demonstrated increased motor activity in the upper and lower extremities: 1/5 biceps, 2-3/5 triceps, 3/5 quadriceps. He was slowly rewarmed and, on postoperative day 3, extubated.
At 2 years, the patient underwent another anterior-only cervical procedure: The inferior adjacent segment (C4–C5) was fused because of neck pain and deformity.
With respect to the original injury and the evolution in cord appearance, the patient had solid arthrodesis from C3–C5 with instrumentation in good position. There was evidence of loss of lordosis at C5–C6 with disk dessication and broad-based bulging. The spinal cord had evidence of myelomalacia; this was noted when the patient was in rehabilitation, 1 month after injury. The 2-cm × 11-mm area of myelomalacia was directly posterior to the fused C3–C4 interval (original MRI, Figure 5; 2-week MRI, Figure 6).
Conclusion
At the time this player was injured, use of systemic hypothermia with standard therapy for acute SCI was unique and controversial. Since then, smaller randomized human studies have described the tolerable safety profile, efficacy, and potential benefits of this intervention in acute SCI in humans.8-10 Now, modest systemic hypothermia can be one of many tools considered in the treatment of acute SCI. Before it can become the standard of care, however, additional larger prospective randomized studies need to be completed.
Am J Orthop. 2017;46(2):E79-E82. Copyright Frontline Medical Communications Inc. 2017. All rights reserved.
1. Cappuccino A, Bisson LJ, Carpenter B, Marzo J, Dietrich WD 3rd, Cappuccino H. The use of systemic hypothermia for the treatment of an acute cervical spinal cord injury in a professional football player. Spine. 2010;35(2):E57-E62.
2. Goldstein J. Lowering body temp shows promise for trauma treatment. Spinal Cord Injury Information Pages news blog. http://www.sci-info-pages.com/2006/05/lowering-body-temp-shows-promise-for.html. Published May 3, 2006. Accessed March 19, 2009.
3. Hartemink KJ, Wisselink W, Rauwerda JA, Girbes AR, Polderman KH. Novel applications of therapeutic hypothermia: report of three cases. Crit Care. 2004;8(5):R343-R346.
4. Dietrich WD. Presidential address presented at: 34th Annual Meeting of the Cervical Spine Research Society; November 30, 2006; Palm Beach, FL.
5. Bracken MB, Shepard MJ, Collins WF, et al. A randomized, controlled trial of methylprednisolone or naloxone in the treatment of acute spinal-cord injury. Results of the second National Acute Spinal Cord Injury Study. N Engl J Med. 1990;322(20):1405-1411.
6. Horodyski MB, LuCante K, Escobar E, et al. Intermittent Cool, Dry Air Underneath Football Shoulder Pads Assists in Temperature Homeostasis. In: The American Orthopaedic Society for Sports Medicine Proceedings 2008; 87-88.
7. Kleiner DM, Almquist JL, Bailes J, et al; Inter-Association Task Force for Appropriate Care of the Spine-Injured Athlete. Prehospital Care of the Spine-Injured Athlete. Dallas, TX: National Athletic Trainers’ Association; 2001. http://www.msata.org/Resources/Documents/PreHospitalCare4SpineInjuredAthlete.pdf. Published March 2001. Accessed January 10, 2017.
8. Dididze M, Green BA, Dietrich WD, Vanni S, Wang MY, Levi AD. Systemic hypothermia in acute cervical spinal cord injury: a case-controlled study. Spinal Cord. 2013;51(5):395-400.
9. Levi AD, Casella G, Green BA, et al. Clinical outcomes using modest intravascular hypothermia after acute cervical spinal cord injury. Neurosurgery. 2010;66(4):670-677.
10. Levi AD, Green BA, Wang MY, et al. Clinical application of modest hypothermia after spinal cord injury. J Neurotrauma. 2009;26(3):407-415.
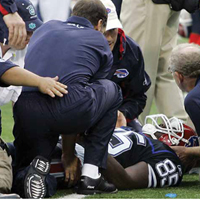
Involuntary treatment symposia at APA
Involuntary treatment is an everyday event in the emergency department and on the inpatient unit, but, for both patients and advocates, it remains the most distressing and controversial aspect of psychiatric care. We all value medical autonomy, and, even when people may be too ill to make decisions about their own care, the issue of whether to force treatment gets sticky. On the other hand, the decision not to force someone to get care when they are very sick has its own risks and distresses, and sometimes groups clash.
If you don’t believe me, check outside the convention center during the upcoming American Psychiatric Association’s annual meeting in San Diego this May. Every year, there are protesters: antipsychiatry groups who feel our treatments offer more harm than good. For those who believe the field is sullied by the pharmaceutical companies and that the treatments are harmful, forcing those treatments upon people is all the more egregious. Most years, protesters come from the Church of Scientology and MindFreedom International to make their feelings known. The pitch of the protests varies, as does the length of time they stay, but, some years, there are marchers, megaphones, and jumbotrons.

“The Battle Over Involuntary Psychiatric Care” will be held Wednesday, May 24, from 2 to 5 p.m. As the title suggests, the “combatants” will represent all sides. Roger Peele, MD, has been part of the APA’s governance since 1975. He will be traveling from Maryland to discuss why involuntary treatment is a good thing, an option that should be used more liberally with legislation that should be less restrictive. Former APA President Paul Appelbaum, MD, a forensic psychiatrist, will be coming from Columbia University in New York to talk about the APA’s stance on involuntary treatment over time.
On the other side of the debate, Elyn Saks, JD, PhD, will be talking about patient rights. Dr. Saks is the author of “The Center Cannot Hold: My Journey Through Madness” (New York: Hyperion, 2007), a memoir of her own experiences with treatment for schizophrenia. She is the founder of the Saks Institute for Mental Health Law, Policy, and Ethics at the University of Southern California in Los Angeles.
Finally, Al Galves, PhD, is on the board of directors of MindFreedom International, one of the groups that traditionally has picketed our meeting. He will be traveling from New Mexico to represent that group’s viewpoint. Dr. Galves also has a fascinating background: He holds degrees in government administration, as well as a doctorate in clinical psychology. He is the author of “Harness Your Dark Side: Mastering Jealousy, Rage, Frustration, and Other Negative Emotions” (Falls Hills, N.J.: New Horizon Press, 2012), and he has a long history of treatment for depression. I believe this is the first time that a member of MFI has spoken at an APA meeting.
Dr. Hanson will be the discussant who sums up what we learn from these diverse and esteemed speakers. I invite you to come for what is certain to be a lively symposium, but please leave your picket signs at the door. Our hope is not to fuel the battle but to provide an arena where diverse viewpoints can be expressed and heard. In our increasingly polarized world, we’d like to think that it is still possible to consider a variety of ideas without firing any artillery.
To add to the controversy, outpatient civil commitment continues to be held out as a panacea to get people treatment before they become dangerous. Still, each state handles outpatient care differently, if at all, so a symposium, “Outpatient Commitment: A Tour Across the States,” will be held on Tuesday, May 23, from 8 to 11 a.m. Two speakers will be coming from New York state, Ryan Bell, JD, MD, and Kimberly Butler, LCSW, MS, to talk about their experiences running an assisted outpatient treatment program in Rochester, N.Y. Erin Klekot, MD, will be talking about her experiences in Ohio. Adam Nelson, MD, will discuss the programs in California that are starting to be implemented.
Finally, Mustafa Mufti, MD, will be talking about the experience in Delaware, where they have had a great deal of experience with outpatient commitment – not without some contention – and where the state hospital and outpatient programs have been investigated by the Department of Justice. Our discussant will be Marvin Swartz, MD, from North Carolina. Dr. Swartz has coauthored the seminal studies on outpatient civil commitment results from both New York City and North Carolina.
If you’re coming to the APA, do join us. If not, both sessions are slated to be part of APA’s Meeting On Demand. Dr. Hanson will try to stream parts of the Battleground session on Periscope (wifi permitting) – follow her on Twitter if you’re interested in updates.
Finally, if you’d like to look up any session, either by topic or by presenter, the APA has provided a useful search function.
See you in San Diego!
To learn more about the latest book by Dr. Miller and Dr. Hanson, “Committed: The Battle Over Involuntary Psychiatric Care,” visit https://jhupbooks.press.jhu.edu/content/committed.
Involuntary treatment is an everyday event in the emergency department and on the inpatient unit, but, for both patients and advocates, it remains the most distressing and controversial aspect of psychiatric care. We all value medical autonomy, and, even when people may be too ill to make decisions about their own care, the issue of whether to force treatment gets sticky. On the other hand, the decision not to force someone to get care when they are very sick has its own risks and distresses, and sometimes groups clash.
If you don’t believe me, check outside the convention center during the upcoming American Psychiatric Association’s annual meeting in San Diego this May. Every year, there are protesters: antipsychiatry groups who feel our treatments offer more harm than good. For those who believe the field is sullied by the pharmaceutical companies and that the treatments are harmful, forcing those treatments upon people is all the more egregious. Most years, protesters come from the Church of Scientology and MindFreedom International to make their feelings known. The pitch of the protests varies, as does the length of time they stay, but, some years, there are marchers, megaphones, and jumbotrons.
“The Battle Over Involuntary Psychiatric Care” will be held Wednesday, May 24, from 2 to 5 p.m. As the title suggests, the “combatants” will represent all sides. Roger Peele, MD, has been part of the APA’s governance since 1975. He will be traveling from Maryland to discuss why involuntary treatment is a good thing, an option that should be used more liberally with legislation that should be less restrictive. Former APA President Paul Appelbaum, MD, a forensic psychiatrist, will be coming from Columbia University in New York to talk about the APA’s stance on involuntary treatment over time.
On the other side of the debate, Elyn Saks, JD, PhD, will be talking about patient rights. Dr. Saks is the author of “The Center Cannot Hold: My Journey Through Madness” (New York: Hyperion, 2007), a memoir of her own experiences with treatment for schizophrenia. She is the founder of the Saks Institute for Mental Health Law, Policy, and Ethics at the University of Southern California in Los Angeles.
Finally, Al Galves, PhD, is on the board of directors of MindFreedom International, one of the groups that traditionally has picketed our meeting. He will be traveling from New Mexico to represent that group’s viewpoint. Dr. Galves also has a fascinating background: He holds degrees in government administration, as well as a doctorate in clinical psychology. He is the author of “Harness Your Dark Side: Mastering Jealousy, Rage, Frustration, and Other Negative Emotions” (Falls Hills, N.J.: New Horizon Press, 2012), and he has a long history of treatment for depression. I believe this is the first time that a member of MFI has spoken at an APA meeting.
Dr. Hanson will be the discussant who sums up what we learn from these diverse and esteemed speakers. I invite you to come for what is certain to be a lively symposium, but please leave your picket signs at the door. Our hope is not to fuel the battle but to provide an arena where diverse viewpoints can be expressed and heard. In our increasingly polarized world, we’d like to think that it is still possible to consider a variety of ideas without firing any artillery.
To add to the controversy, outpatient civil commitment continues to be held out as a panacea to get people treatment before they become dangerous. Still, each state handles outpatient care differently, if at all, so a symposium, “Outpatient Commitment: A Tour Across the States,” will be held on Tuesday, May 23, from 8 to 11 a.m. Two speakers will be coming from New York state, Ryan Bell, JD, MD, and Kimberly Butler, LCSW, MS, to talk about their experiences running an assisted outpatient treatment program in Rochester, N.Y. Erin Klekot, MD, will be talking about her experiences in Ohio. Adam Nelson, MD, will discuss the programs in California that are starting to be implemented.
Finally, Mustafa Mufti, MD, will be talking about the experience in Delaware, where they have had a great deal of experience with outpatient commitment – not without some contention – and where the state hospital and outpatient programs have been investigated by the Department of Justice. Our discussant will be Marvin Swartz, MD, from North Carolina. Dr. Swartz has coauthored the seminal studies on outpatient civil commitment results from both New York City and North Carolina.
If you’re coming to the APA, do join us. If not, both sessions are slated to be part of APA’s Meeting On Demand. Dr. Hanson will try to stream parts of the Battleground session on Periscope (wifi permitting) – follow her on Twitter if you’re interested in updates.
Finally, if you’d like to look up any session, either by topic or by presenter, the APA has provided a useful search function.
See you in San Diego!
To learn more about the latest book by Dr. Miller and Dr. Hanson, “Committed: The Battle Over Involuntary Psychiatric Care,” visit https://jhupbooks.press.jhu.edu/content/committed.
Tips from 'the father of modern networking'
Ivan Misner once spent one week on Necker Island – the tony 74-acre island in the British Virgin Islands that is entirely owned by billionaire Sir Richard Branson – because he met a guy at a convention.
And Misner is really good at networking.
“I stayed in touch with the person, and when there was an opportunity, I got invited to this incredible ethics program on Necker where I had a chance to meet Sir Richard. It all comes from building relationships with people,” said Misner, founder and chairman of BNI (Business Network International), a 32-year-old global business networking platform based in Charlotte, N.C., that has led CNN to call him “the father of modern networking.”

The why doesn’t matter most, Misner said. A person’s approach to networking, regardless of the hoped-for outcome, should always remain the same.
“The two key themes that I would address would be the mindset and the skill set,” he said.
The mindset is making sure one’s approach doesn’t “feel artificial,” Misner said.
“A lot of people, when they go to some kind of networking environment, they feel like they need to get a shower afterwards and think, ‘Ick, I don’t like that,’” Misner said. “The best way to become an effective networker is to go to networking events with the idea of being willing to help people and really believe in that and practice that. I’ve been doing this a long time and where I see it done wrong is when people use face-to-face networking as a cold-calling opportunity.”
Instead, Misner suggests, approach networking like it is “more about farming than it is about hunting.” Cultivate relationships with time and tenacity and don’t just expect them to be instant. Once the approach is set, Misner has a process he calls VCP – visibility, credibility, and profitability.
“Credibility is what takes time,” he said. “You really want to build credibility with somebody. It doesn’t happen overnight. People have to get to know, like, and trust you. It is the most time consuming portion of the VCP process... then, and only then, can you get to profitability. Where people know who you are, they know what you do, they know you’re good at it, and they’re willing to refer a business to you. They’re willing to put you in touch with other people.”
But even when a relationship gets struck early on, networking must be more than a few minutes at an SHM conference, a local chapter mixer, or a medical school reunion.
It’s the follow-up that makes all the impact. Misner calls that process 24/7/30.
Within 24 hours, send the person a note. An email, or even the seemingly lost art of a hand-written card. (If your handwriting is sloppy, Misner often recommends services that will send out legible notes on your behalf.)
Within a week, connect on social media. Focus on whatever platform that person has on their business card, or email signature. Connect where they like to connect to show the person you’re willing to make the effort.
Within a month, reach out to the person and set a time to talk, either face-to-face or via a telecommunication service like Skype.
“It’s these touch points that you make with people that build the relationship,” Misner said. “Without building a real relationship, there is almost no value in the networking effort because you basically are just waiting to stumble upon opportunities as opposed to building relationships and opportunities. It has to be more than just bumping into somebody at a meeting... otherwise you’re really wasting your time.”
Misner also notes that the point of networking is collaboration at some point. That partnership could be working on a research paper or a pilot project. Or just even getting a phone call returned to talk about something important to you.
“It’s not what you know or who you know, it’s how well you know each other that really counts,” he added. “And meeting people at events like HM17 is only the start of the process. It’s not the end of the process by any means, if you want to do this well.”
Ivan Misner once spent one week on Necker Island – the tony 74-acre island in the British Virgin Islands that is entirely owned by billionaire Sir Richard Branson – because he met a guy at a convention.
And Misner is really good at networking.
“I stayed in touch with the person, and when there was an opportunity, I got invited to this incredible ethics program on Necker where I had a chance to meet Sir Richard. It all comes from building relationships with people,” said Misner, founder and chairman of BNI (Business Network International), a 32-year-old global business networking platform based in Charlotte, N.C., that has led CNN to call him “the father of modern networking.”
The why doesn’t matter most, Misner said. A person’s approach to networking, regardless of the hoped-for outcome, should always remain the same.
“The two key themes that I would address would be the mindset and the skill set,” he said.
The mindset is making sure one’s approach doesn’t “feel artificial,” Misner said.
“A lot of people, when they go to some kind of networking environment, they feel like they need to get a shower afterwards and think, ‘Ick, I don’t like that,’” Misner said. “The best way to become an effective networker is to go to networking events with the idea of being willing to help people and really believe in that and practice that. I’ve been doing this a long time and where I see it done wrong is when people use face-to-face networking as a cold-calling opportunity.”
Instead, Misner suggests, approach networking like it is “more about farming than it is about hunting.” Cultivate relationships with time and tenacity and don’t just expect them to be instant. Once the approach is set, Misner has a process he calls VCP – visibility, credibility, and profitability.
“Credibility is what takes time,” he said. “You really want to build credibility with somebody. It doesn’t happen overnight. People have to get to know, like, and trust you. It is the most time consuming portion of the VCP process... then, and only then, can you get to profitability. Where people know who you are, they know what you do, they know you’re good at it, and they’re willing to refer a business to you. They’re willing to put you in touch with other people.”
But even when a relationship gets struck early on, networking must be more than a few minutes at an SHM conference, a local chapter mixer, or a medical school reunion.
It’s the follow-up that makes all the impact. Misner calls that process 24/7/30.
Within 24 hours, send the person a note. An email, or even the seemingly lost art of a hand-written card. (If your handwriting is sloppy, Misner often recommends services that will send out legible notes on your behalf.)
Within a week, connect on social media. Focus on whatever platform that person has on their business card, or email signature. Connect where they like to connect to show the person you’re willing to make the effort.
Within a month, reach out to the person and set a time to talk, either face-to-face or via a telecommunication service like Skype.
“It’s these touch points that you make with people that build the relationship,” Misner said. “Without building a real relationship, there is almost no value in the networking effort because you basically are just waiting to stumble upon opportunities as opposed to building relationships and opportunities. It has to be more than just bumping into somebody at a meeting... otherwise you’re really wasting your time.”
Misner also notes that the point of networking is collaboration at some point. That partnership could be working on a research paper or a pilot project. Or just even getting a phone call returned to talk about something important to you.
“It’s not what you know or who you know, it’s how well you know each other that really counts,” he added. “And meeting people at events like HM17 is only the start of the process. It’s not the end of the process by any means, if you want to do this well.”
Transitioning from your current medical practice: an abbreviated step-by-step guide
You have decided it is time to move on from your current hospital or medical group position and transition into a new role. While this decision is exciting and well-earned after years of hard work, it is critical that you make a plan and take specific steps to ensure that the transition is seamless.
The steps below are recommendations to make this process smoother.
Step 1: Determine how you are leaving the practice and your proposed timeline
Before anything else, you should decide how you are leaving your practice. Are you leaving the practice of medicine altogether, or are you simply leaving your current position for a different position elsewhere? This distinction will dictate what steps are necessary. Timing is also critical when leaving a practice, as it will dictate what steps should be taken and when. Having specific but realistic goals is imperative. Select a goal date for leaving the practice, but be aware that this goal may need to be adjusted.
Step 2: Create your team of advisers
Whether you are leaving your current practice or transitioning to a different position, it is extremely important to have the right individuals on your team. You should consider enlisting an attorney, a financial adviser, and an accountant to help facilitate the process. Enlisting lawyers with certain areas of expertise, such as in the areas of employment restrictive covenants, health care, or tax, may also be extremely beneficial and helpful throughout the process.
Step 3: Review your current employment agreement
It is quite likely that at the onset of your current employment arrangement, you signed an employment agreement with your hospital or group. You will want to carefully review this agreement, as it may contain provisions that can affect the steps you should take before you leave your current practice and work elsewhere. These provisions include the following:
a) Noncompetition provisions
It is critical to determine whether or not there are any restrictive covenants in your employment agreement that limit where you can work after you transition from your current practice into a new role. Restrictive covenants include noncompetition and nonsolicitation provisions, and prohibit employees from working at certain places or in certain geographic areas after they leave their current place of employment. Rules surrounding restrictive covenants vary from state to state. If there are restrictive covenants in your agreement, be sure to understand the scope of the covenant, including the geographic and temporal scope, as well as the types of medicine you are prohibited from practicing. If the covenants seem too broad or unnecessarily restrictive, consult with an attorney, as overly broad or unduly burdensome covenants are often unenforceable. However, a state-by-state analysis is required.
b) Notice and termination provisions
It is important to review whether or not there are any notice requirements in your employment agreement, which may require you to notify your employer in advance of a departure. Make sure to comply with the time requirements in the notice provision to avoid a breach of the agreement. It is also critical to determine whether terminating an agreement early will result in any termination penalties. At times, employers will impose a penalty if an employee prematurely terminates a working relationship. Understanding the penalties associated with terminating your agreement will allow you to decide whether you want to cancel the agreement and pay the penalty or push back your timeline until the end of the agreement’s term to avoid termination fees.
Step 4: Licensure obligations

Further, if your practice bills Medicare, you will want to file certain forms with Medicare to show that you are either changing your practice location or leaving medicine. For example, if you are leaving the hospital or group to practice elsewhere, you will need to fill out forms in order for your old group to submit claims and receive payments for Medicare services you provided while you were still part of that group. Furthermore, you will need to file reassignment forms to allow your new practice to bill on your behalf. Understanding which forms to complete can be confusing, so enlisting the help of a healthcare attorney may be worthwhile.
Step 5: Discuss your transition with your insurance representative
Even after you leave your current practice, you may be exposed to litigation for services you provided while you were employed or otherwise retained by such practice. To ensure that you are protected, discuss your insurance policy with your insurance representative. Review whether your insurance policy is “occurrence” or “claims-made.” If you have an occurrence policy, you are protected from covered incidents that occur during the policy period, regardless if your policy is still in existence. Claims-made policies only provide coverage for claims where both the incident and the claim occur during the policy period. For example, if you cancel your policy on March 1, and are sued on April 1 for an incident that allegedly occurred on Feb. 1, your claims-made insurance policy will not protect you. Therefore, it is important to analyze your policies to determine if tail insurance is needed.
There are a number of other issues you will want to address before you leave your practice, including financial responsibilities and medical record and privacy obligations. To ensure that you leave your practice properly, you should contact an experienced lawyer who can help you navigate this process.
Steven M. Harris is a nationally recognized health care attorney and a member of the law firm McDonald Hopkins LLC in Chicago. Write to him at [email protected].
You have decided it is time to move on from your current hospital or medical group position and transition into a new role. While this decision is exciting and well-earned after years of hard work, it is critical that you make a plan and take specific steps to ensure that the transition is seamless.
The steps below are recommendations to make this process smoother.
Step 1: Determine how you are leaving the practice and your proposed timeline
Before anything else, you should decide how you are leaving your practice. Are you leaving the practice of medicine altogether, or are you simply leaving your current position for a different position elsewhere? This distinction will dictate what steps are necessary. Timing is also critical when leaving a practice, as it will dictate what steps should be taken and when. Having specific but realistic goals is imperative. Select a goal date for leaving the practice, but be aware that this goal may need to be adjusted.
Step 2: Create your team of advisers
Whether you are leaving your current practice or transitioning to a different position, it is extremely important to have the right individuals on your team. You should consider enlisting an attorney, a financial adviser, and an accountant to help facilitate the process. Enlisting lawyers with certain areas of expertise, such as in the areas of employment restrictive covenants, health care, or tax, may also be extremely beneficial and helpful throughout the process.
Step 3: Review your current employment agreement
It is quite likely that at the onset of your current employment arrangement, you signed an employment agreement with your hospital or group. You will want to carefully review this agreement, as it may contain provisions that can affect the steps you should take before you leave your current practice and work elsewhere. These provisions include the following:
a) Noncompetition provisions
It is critical to determine whether or not there are any restrictive covenants in your employment agreement that limit where you can work after you transition from your current practice into a new role. Restrictive covenants include noncompetition and nonsolicitation provisions, and prohibit employees from working at certain places or in certain geographic areas after they leave their current place of employment. Rules surrounding restrictive covenants vary from state to state. If there are restrictive covenants in your agreement, be sure to understand the scope of the covenant, including the geographic and temporal scope, as well as the types of medicine you are prohibited from practicing. If the covenants seem too broad or unnecessarily restrictive, consult with an attorney, as overly broad or unduly burdensome covenants are often unenforceable. However, a state-by-state analysis is required.
b) Notice and termination provisions
It is important to review whether or not there are any notice requirements in your employment agreement, which may require you to notify your employer in advance of a departure. Make sure to comply with the time requirements in the notice provision to avoid a breach of the agreement. It is also critical to determine whether terminating an agreement early will result in any termination penalties. At times, employers will impose a penalty if an employee prematurely terminates a working relationship. Understanding the penalties associated with terminating your agreement will allow you to decide whether you want to cancel the agreement and pay the penalty or push back your timeline until the end of the agreement’s term to avoid termination fees.
Step 4: Licensure obligations
Further, if your practice bills Medicare, you will want to file certain forms with Medicare to show that you are either changing your practice location or leaving medicine. For example, if you are leaving the hospital or group to practice elsewhere, you will need to fill out forms in order for your old group to submit claims and receive payments for Medicare services you provided while you were still part of that group. Furthermore, you will need to file reassignment forms to allow your new practice to bill on your behalf. Understanding which forms to complete can be confusing, so enlisting the help of a healthcare attorney may be worthwhile.
Step 5: Discuss your transition with your insurance representative
Even after you leave your current practice, you may be exposed to litigation for services you provided while you were employed or otherwise retained by such practice. To ensure that you are protected, discuss your insurance policy with your insurance representative. Review whether your insurance policy is “occurrence” or “claims-made.” If you have an occurrence policy, you are protected from covered incidents that occur during the policy period, regardless if your policy is still in existence. Claims-made policies only provide coverage for claims where both the incident and the claim occur during the policy period. For example, if you cancel your policy on March 1, and are sued on April 1 for an incident that allegedly occurred on Feb. 1, your claims-made insurance policy will not protect you. Therefore, it is important to analyze your policies to determine if tail insurance is needed.
There are a number of other issues you will want to address before you leave your practice, including financial responsibilities and medical record and privacy obligations. To ensure that you leave your practice properly, you should contact an experienced lawyer who can help you navigate this process.
Steven M. Harris is a nationally recognized health care attorney and a member of the law firm McDonald Hopkins LLC in Chicago. Write to him at [email protected].
Antibodies Part 3: In whose corner is genome editing’s best cut-man sitting?
We are in the midst of a revolution in genome editing. Science now exists in “AC,” or after CRISPR. Able to speedily and efficiently make genomic cuts with surgical precision, CRISPR/Cas9 is used almost ubiquitously now in the scientific community to study and alter DNA across fields ranging from medicine to agriculture to zoology. The possibilities of the biological and therapeutic implications are seemingly endless, as are the important ethical implications of their impact. Likely because of the latter, CRISPR technology has made its way from publications like Science and Nature into the lay public domains of Newsweek and NBC News.
In fact, CRISPR technology made its way into one of my favorite podcasts, WNYC’s “Radio Lab” in June 20151. The episode was entitled “Antibodies Part 1,” perhaps assuming that other technologies would also be discussed later although that has never happened. Actually, in an update early this year, the podcast jokingly addressed never moving on to “Part 2,” then followed with an update on how far CRISPR technology has progressed. Putting aside the technological advances and the early clinical applications, as well as the immense ethical considerations, CRISPR technology faces a new controversy, not one from a white coat but rather from a black robe.

In her CommonHealth blog2, Carey Goldberg of WBUR Boston Public Radio compared the case with the bout between undefeated Muhammad Ali and undefeated Joe Frazier at New York’s Madison Square Garden. Both men had legitimate claims to the title of World Heavyweight Champion. What transpired is now known as the “Fight of the Century.”
The analogy is apt. Boxing is about speed and control. Ali dominated the first three rounds with his jab, a punch that is both offensive with its attack and defensive in keeping one’s opponent at a distance. Dr. Doudna and her collaborator Emmanuelle Charpentier, PhD, published their work first (Science. 2012 Aug 17;337[6096]:816-21)3. UC Berkeley filed their patent first in May 2012.
Boxing is about timing and opportunity. Under the barrage of Ali’s jabs, Frazier found an inside position and caught Ali with a left hook. Dr. Zhang’s work followed closely after but had previously applied the technology in murine and human cells (Science. 2013 Feb 15; 339[6121]:819-23)4. The Broad Institute used this key difference to apply for its own patents under expedited review, which were granted in April 2014.
Boxing is about a punch and a counterpunch. Though fatigued, Ali continued to connect with combination punches. Frazier’s left hook pummeled Ali’s jaw. UC Berkeley filed an interference motion to invalidate the Broad Institute patent claim on the basis that the extension to eukaryotic cells was “obvious” based on the published work by Dr. Doudna’s group. In February, USPTO ruled that the Broad patent application may proceed, citing “patentably distinct subject matter.” Initial reports had indicated that Berkeley may appeal the decision, but no official filings have been made public.
Like the Fight of the Century, this case may go the distance and be decided by the judges. In a unanimous decision, Joe Frazier won the first of three epic bouts. The final scorecard is not known in the patent disputes; on March 28, the European Patent Office announced it will grant the patent application on behalf of Dr. Doudna and Dr. Charpentier.
Much like a prizefight, Wall Street has also been taking bets on who will prevail, with CRISPR-based biotech backing both sides mirroring the mid-bout odds, just as Ali dominated early with the jab, until Frazier evened the match with a left hook to the jaw. Ali fell to his knee on the canvas in the 11th round; will the European Patent Office decision prove to be a slip or a decisive knockdown? With so much at stake, the only assurance is that, as with the Ali-Frazier bout, there is likely more fighting to be done.
References:
1. Radio Lab
2. CommonHealth blog
3. Jinek M, et al., A programmable dual-RNA-guided DNA endonuclease in adaptive bacterial immunity. Science. 2012 Aug 17;337(6096):816-21.
4. Le Cong et al., Multiplex genome engineering using CRISPR/Cas Systems. Science. 2013 Feb 15;339(6121):819-23. Multiplex genome engineering using CRISPR/Cas Systems.
Science. 2017 Feb 15: Round one of CRISPR patent legal battle goes to the Broad Institute.
StreetInsider.com: CRISPR Therapeutics (CRSP) says EPO to grant CRISPR/Cas gene editing patent.
[email protected]
On Twitter @thedoctorisvin
Dr. Viny is with the Memorial Sloan-Kettering Cancer Center, N.Y., where he is a clinical instructor, is on the staff of the leukemia service, and is a clinical researcher in the Ross Levine Lab. Contact Dr. Viny at [email protected].
We are in the midst of a revolution in genome editing. Science now exists in “AC,” or after CRISPR. Able to speedily and efficiently make genomic cuts with surgical precision, CRISPR/Cas9 is used almost ubiquitously now in the scientific community to study and alter DNA across fields ranging from medicine to agriculture to zoology. The possibilities of the biological and therapeutic implications are seemingly endless, as are the important ethical implications of their impact. Likely because of the latter, CRISPR technology has made its way from publications like Science and Nature into the lay public domains of Newsweek and NBC News.
In fact, CRISPR technology made its way into one of my favorite podcasts, WNYC’s “Radio Lab” in June 20151. The episode was entitled “Antibodies Part 1,” perhaps assuming that other technologies would also be discussed later although that has never happened. Actually, in an update early this year, the podcast jokingly addressed never moving on to “Part 2,” then followed with an update on how far CRISPR technology has progressed. Putting aside the technological advances and the early clinical applications, as well as the immense ethical considerations, CRISPR technology faces a new controversy, not one from a white coat but rather from a black robe.
In her CommonHealth blog2, Carey Goldberg of WBUR Boston Public Radio compared the case with the bout between undefeated Muhammad Ali and undefeated Joe Frazier at New York’s Madison Square Garden. Both men had legitimate claims to the title of World Heavyweight Champion. What transpired is now known as the “Fight of the Century.”
The analogy is apt. Boxing is about speed and control. Ali dominated the first three rounds with his jab, a punch that is both offensive with its attack and defensive in keeping one’s opponent at a distance. Dr. Doudna and her collaborator Emmanuelle Charpentier, PhD, published their work first (Science. 2012 Aug 17;337[6096]:816-21)3. UC Berkeley filed their patent first in May 2012.
Boxing is about timing and opportunity. Under the barrage of Ali’s jabs, Frazier found an inside position and caught Ali with a left hook. Dr. Zhang’s work followed closely after but had previously applied the technology in murine and human cells (Science. 2013 Feb 15; 339[6121]:819-23)4. The Broad Institute used this key difference to apply for its own patents under expedited review, which were granted in April 2014.
Boxing is about a punch and a counterpunch. Though fatigued, Ali continued to connect with combination punches. Frazier’s left hook pummeled Ali’s jaw. UC Berkeley filed an interference motion to invalidate the Broad Institute patent claim on the basis that the extension to eukaryotic cells was “obvious” based on the published work by Dr. Doudna’s group. In February, USPTO ruled that the Broad patent application may proceed, citing “patentably distinct subject matter.” Initial reports had indicated that Berkeley may appeal the decision, but no official filings have been made public.
Like the Fight of the Century, this case may go the distance and be decided by the judges. In a unanimous decision, Joe Frazier won the first of three epic bouts. The final scorecard is not known in the patent disputes; on March 28, the European Patent Office announced it will grant the patent application on behalf of Dr. Doudna and Dr. Charpentier.
Much like a prizefight, Wall Street has also been taking bets on who will prevail, with CRISPR-based biotech backing both sides mirroring the mid-bout odds, just as Ali dominated early with the jab, until Frazier evened the match with a left hook to the jaw. Ali fell to his knee on the canvas in the 11th round; will the European Patent Office decision prove to be a slip or a decisive knockdown? With so much at stake, the only assurance is that, as with the Ali-Frazier bout, there is likely more fighting to be done.
References:
1. Radio Lab
2. CommonHealth blog
3. Jinek M, et al., A programmable dual-RNA-guided DNA endonuclease in adaptive bacterial immunity. Science. 2012 Aug 17;337(6096):816-21.
4. Le Cong et al., Multiplex genome engineering using CRISPR/Cas Systems. Science. 2013 Feb 15;339(6121):819-23. Multiplex genome engineering using CRISPR/Cas Systems.
Science. 2017 Feb 15: Round one of CRISPR patent legal battle goes to the Broad Institute.
StreetInsider.com: CRISPR Therapeutics (CRSP) says EPO to grant CRISPR/Cas gene editing patent.
[email protected]
On Twitter @thedoctorisvin
Dr. Viny is with the Memorial Sloan-Kettering Cancer Center, N.Y., where he is a clinical instructor, is on the staff of the leukemia service, and is a clinical researcher in the Ross Levine Lab. Contact Dr. Viny at [email protected].
Improving Patient Satisfaction in Dermatology: A Prospective Study of an Urban Dermatology Clinic
The Patient Protection and Affordable Care Act was signed into law in 2010, aiming to expand access to and improve the quality of health care in the United States. In the states that expanded Medicaid eligibility, uninsurance among adults decreased from 15.8% in September 2013 to 7.3% in March 2016, a decline of 53.8%.1 On average, these newly insured individuals were younger and more likely to report fair to poor health than those previously insured. Approximately half of the newly insured have family incomes at or below 138% of the federal poverty level.1
Improvement in quality in medicine is not as easily quantified. Several programs have been implemented through the Centers for Medicare & Medicaid Services to measure and reimburse hospital systems and providers based on the quality and value of care being provided. Because of the complexity in defining quality in medicine, patient satisfaction has become a proxy measurement tool.2 With higher numbers of insured patients and an increased demand for services, dermatologists are being challenged to improve availability of services and respond to patients’ needs and desires as expressed through satisfaction surveys.
Few studies have assessed patient satisfaction in dermatology practices. As patient satisfaction surveys move to the forefront under the Patient Protection and Affordable Care Act, hospitals and providers will try to demonstrate the quality of their care through positive survey responses from patients. Importantly, patient satisfaction is a strong determinate if patients will comply with treatment and continue seeing their practitioner.3 A better understanding of patients’ perceptions regarding quality will allow for targeted interventions to be implemented. This study assesses and analyzes patient satisfaction, nonattendance rates, and cycle times in an outpatient dermatology clinic to provide a snapshot of patient satisfaction in an urban dermatology clinic.
Dr. Adam Sutton discusses the results of this study with Editor-in-Chief Vincent A. DeLeo, MD, in a "Peer to Peer" audiocast, "Measuring Patient Satisfaction: How Do Patients Perceive Quality of Care Delivered by Dermatologists?"
Methods
We conducted a prospective study that was approved by the University of Southern California Health Sciences (Los Angeles, California) institutional review board. A convenience sample of patients 18 years and older who spoke English or Spanish were recruited to participate in the study and agreed to complete the Patient Satisfaction Questionnaire Short Form (PSQ-18) and a demographic questionnaire, both in English or Spanish, at the conclusion of their visit.
Based on schedules and availability, medical students came to our clinic and obtained the surveys in the following manner: After patients checked in, the students approached the patients in the waiting area and asked if they would be willing to participate in the study. If patients agreed to participate, they provided written consent and the medical student handed them an envelope containing paper copies of the survey in English or Spanish, depending on the patient’s preference. Patients were asked to complete the surveys at the end of the visit and return them to the student in the envelope. The medical students did not otherwise participate in the patient’s visit.
Surveys were collected over an 8-month period at Los Angeles County+USC Medical Center dermatology clinics, which are part of a large safety-net health system. Among this population, it is common for patients to lack reliable Internet access or permanent home addresses; therefore, we elected to use point-of-care printed survey forms. Midway through the survey collection, we moved our clinic location; however, patients and physicians did not change. The comparison between clinics showed no substantive differences and did not change the conclusions of the study.
Patient Demographics
Demographic variables were age, sex, ethnicity, highest education level, annual household income, and primary language. Patients were grouped into 4 age categories: 18 to 29 years, 30 to 49 years, 50 to 64 years, and 65 years and older. Ethnicity was classified as Hispanic/Latino or other. Highest education level was classified as high school diploma or lower, and some college or higher. Annual household income was grouped into 3 categories: less than $15,000, $15,000 to $35,000, and more than $35,000.
Patient Satisfaction Questionnaire
The PSQ-18 survey was developed by the RAND Corporation (Santa Monica, California) and has been validated.4 The survey asks patients to rate aspects of their care experience on a 5-point Likert scale (strongly agree, agree, uncertain, disagree, strongly disagree), with 5 representing highest satisfaction. The survey contains 18 questions and is scored on 7 subscales: general satisfaction, technical quality, interpersonal manner, communication, financial aspects, time spent with doctor, and accessibility and convenience. The survey typically takes less than 5 minutes to complete.
Cycle Times and Nonattendance Rates
Cycle time is defined as the total amount of time that a patient spends in a clinic from check in to checkout, which was collected from our scheduling system for each patient who agreed to participate in the study. Cycle times were grouped into 4 categories: 0 to 60 minutes, 61 to 90 minutes, 91 to 120 minutes, and 121 minutes or more. During the study period, data also were collected from the electronic health record system regarding the number of patients with appointments scheduled and the number of patients who attended each clinic. From these figures, the rate of nonattendance for each clinic was calculated.
Statistical Analysis
Demographic results were calculated using arithmetic means. The PSQ-18 subscale scores were compared among demographic subgroups using a generalized linear model. Covariates included age, sex, ethnicity, highest education level, annual household income, and primary language. All statistical analyses were conducted using SAS software version 9.2.
Results
Of the 298 participants surveyed, the average age was 49 years, 51% were male, 73% self-identified as Hispanic/Latino, 64% spoke Spanish, 58% had a high school diploma or lower, and 68% reported an annual household income of less than $15,000 (Table 1).
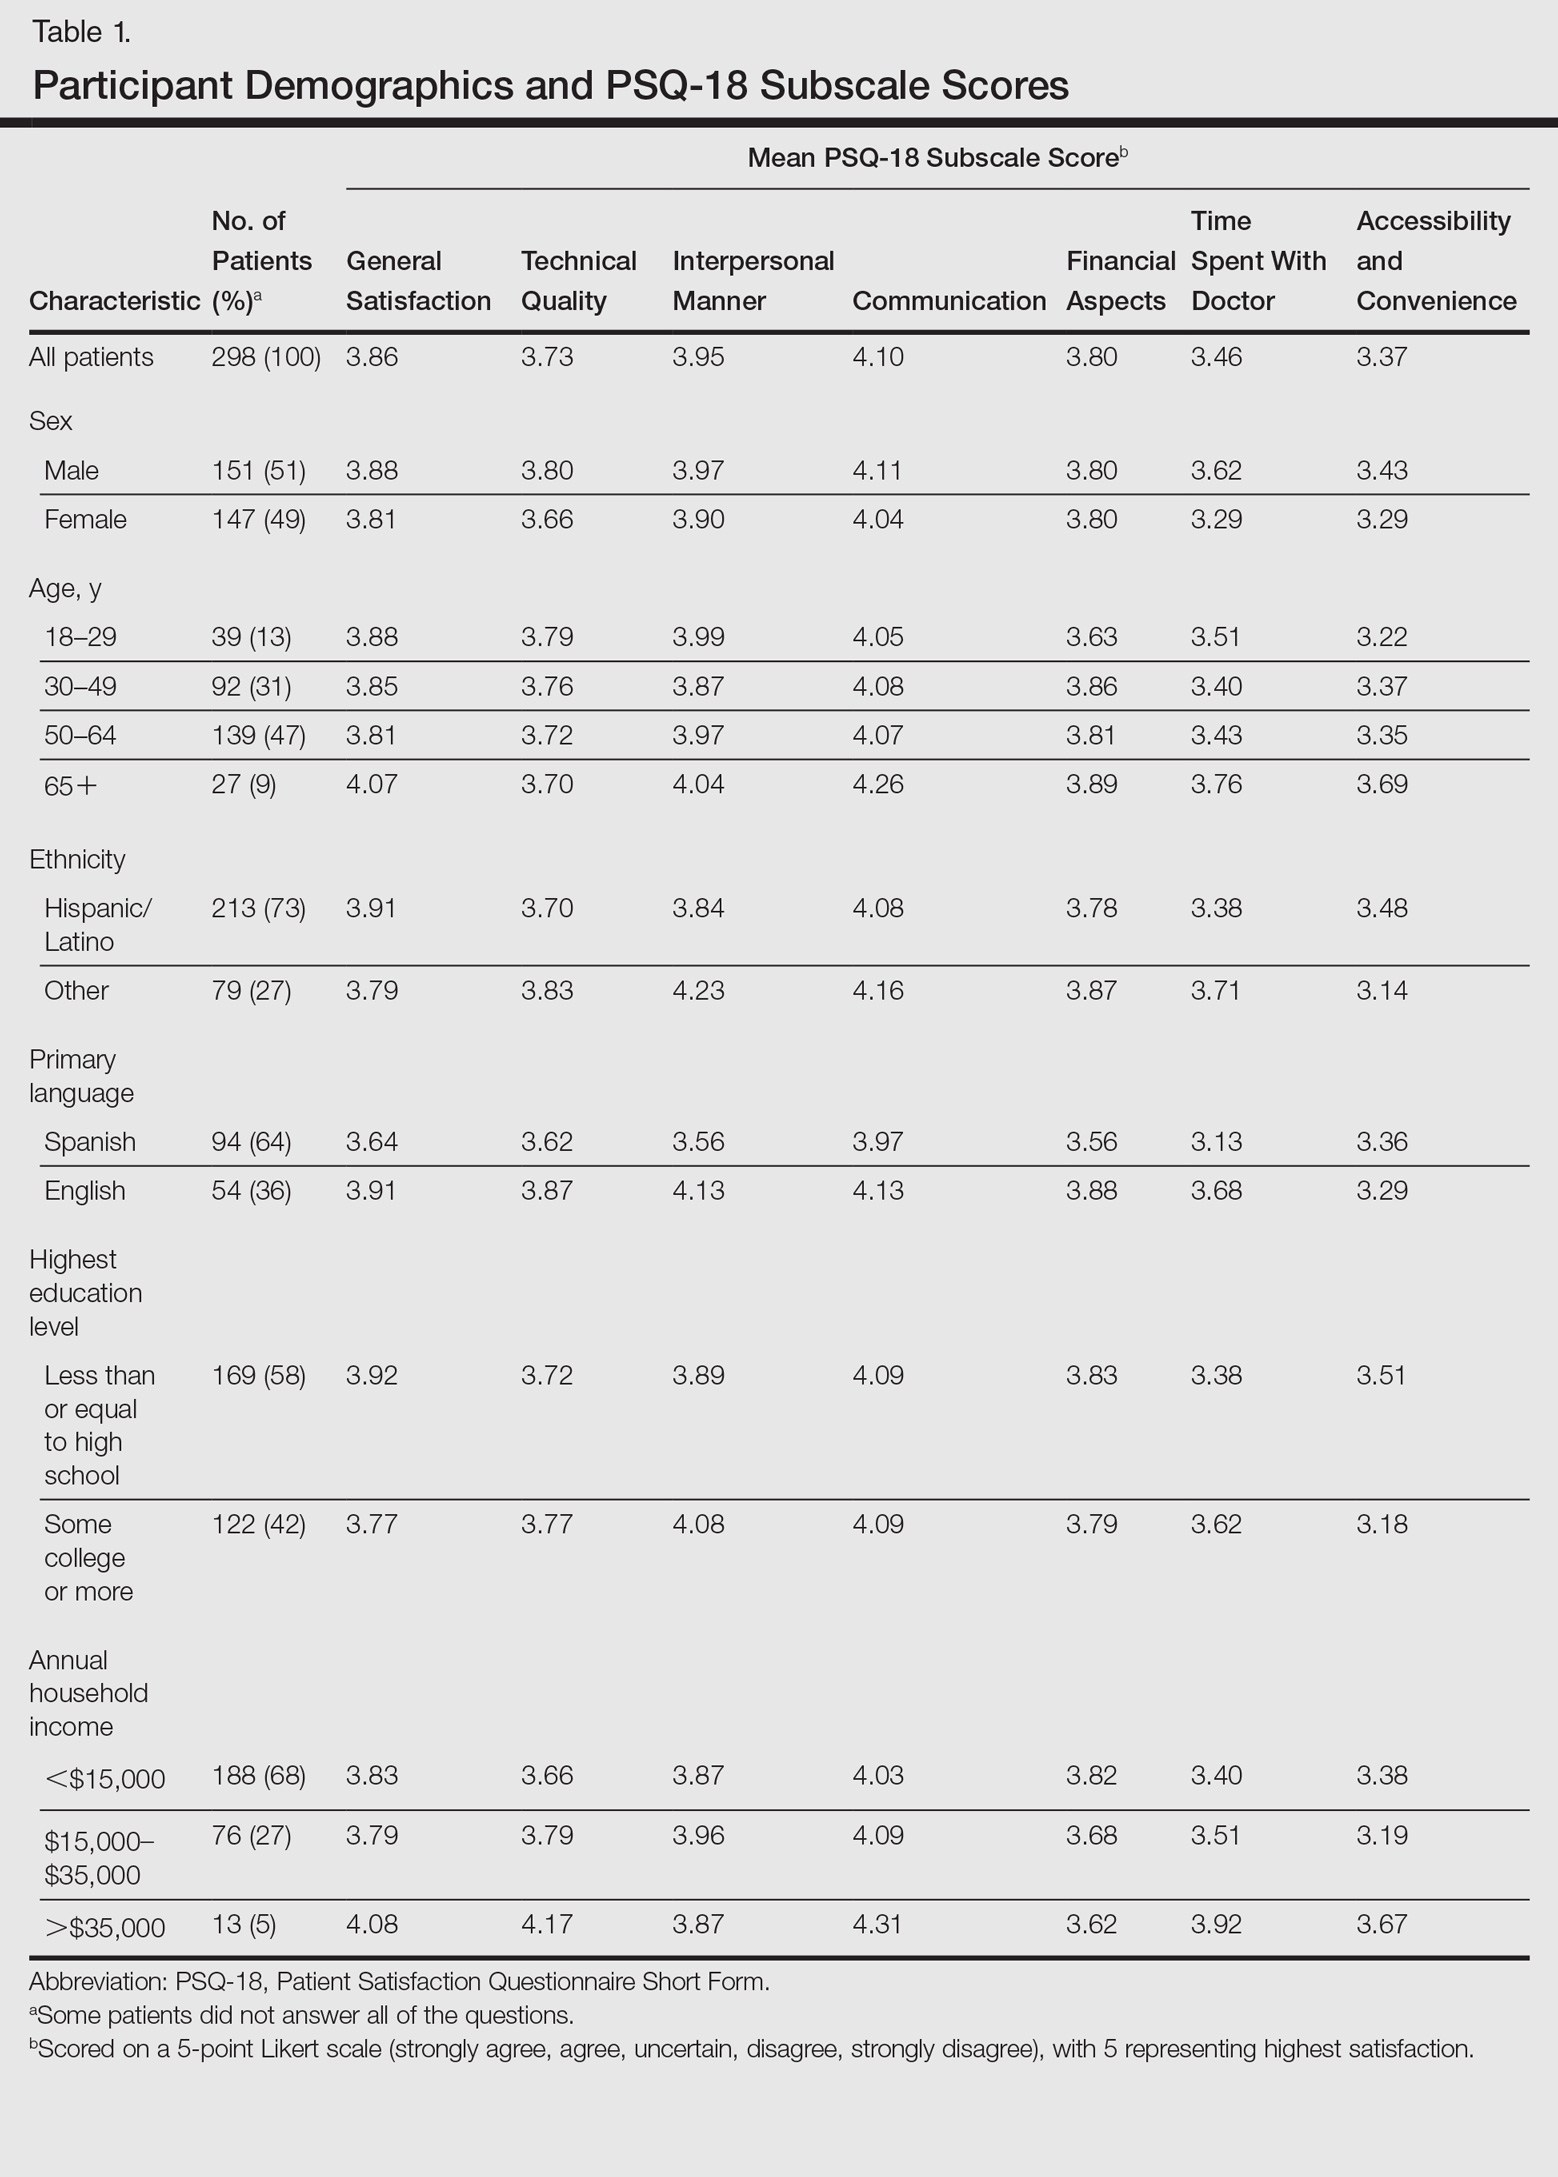
Table 1 shows PSQ-18 scores for all patients stratified by demographics. Notably, patients with some college or more were significantly more satisfied on the interpersonal manner (P<.03) and time spent with doctor (P<.007) subscales when compared to those who were less educated, but they had lower general satisfaction scores (P<.001). Patients with a reported annual household income of greater than $35,000 were more satisfied on the technical quality (P<.07) and time spent with doctor (P<.04) subscales when compared to those making less than $15,000. The patients with a household income greater than $35,000 also were more satisfied with accessibility and convenience (P<.05) than those making $15,000 to $35,000. When stratified by sex, the time spent with doctor subscale was significantly higher in males than females (P<.001). (Statistically significant differences when stratifying by age, ethnicity, and language are noted in the “Comment” section.)
Patients’ average cycle time from check in to checkout was 102 minutes (range, 24–177 minutes). There was no statistically significant difference in patient satisfaction subscale scores when stratifying patients by cycle time. During a period comparable to the time that surveys were collected, our mean (standard deviation [SD]) nonattendance rate was 30% (7%). Therefore, based on 2 SDs, there was a 95% chance that 16% to 44% of patients would not attend their scheduled appointments in each clinic.
Comment
Our dermatology clinic received an average general satisfaction subscale score of 3.86. Although the general impression of patients was positive, there were subscale scores in which the clinic performed below the general satisfaction score; the 2 lowest were time spent with doctor (3.46), and accessibility and convenience (3.37). One possible explanation for the lower time spent with doctor subscale score relates to visiting an academic medical center. Patients often are seen sequentially by a medical student, resident, and supervising physician. This educational model contributes to long cycle times; indeed, average patient visit length was more than 1.5 hours in our study. Meanwhile, patients may consider their “doctor” to be the last member of the medical team they see; thus, the percentage of the clinic visit time that a supervising physician spends with the patient may be perceived by patients as short compared to the overall time spent in the clinic.
Surprisingly, there was no statistically significant difference in patient satisfaction subscale scores, including time spent with doctor, for patients with longer cycle times compared to short cycle times (Table 2), which suggests that the length of clinic visits may have been longer than the threshold for further effect on satisfaction scores. To this point, prior research has shown that patient satisfaction notably drops after 15 minutes of waiting,5 defined as the time from check in to when the patient first sees the provider. Our data set did not allow us to analyze wait time by that definition. However, we used cycle time, which includes various periods of waiting during the patient’s visit. If we had more data points on cycle times less than 30 minutes, we might have detected a clearer relationship of cycle times to patient satisfaction scores.
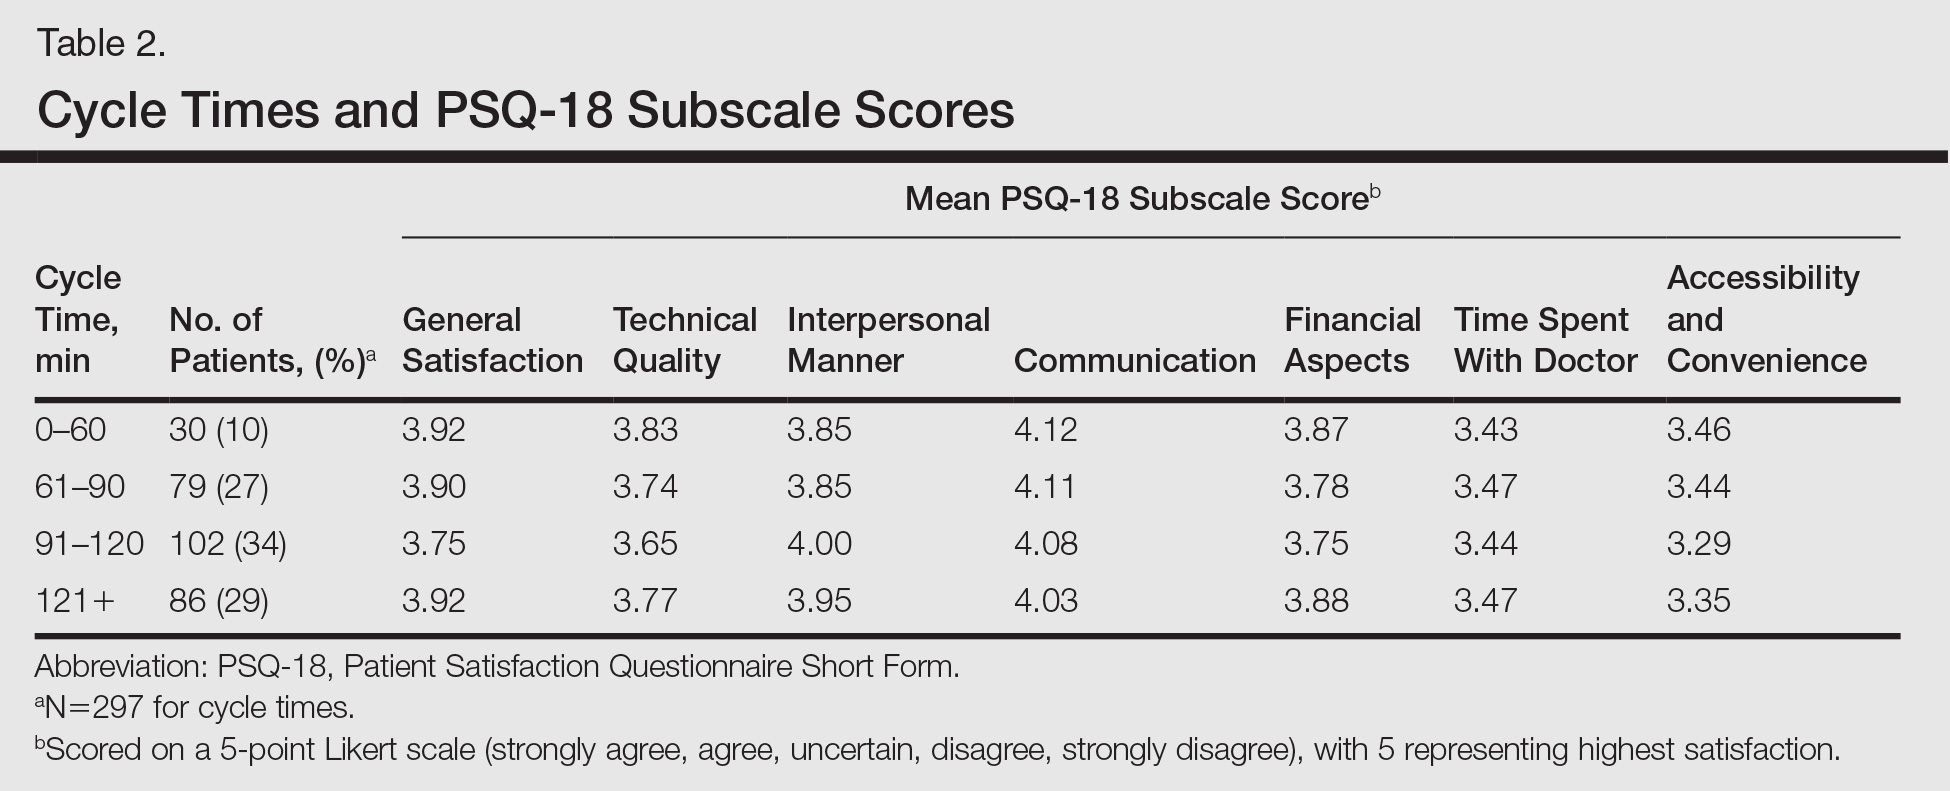
Satisfaction may not have varied with longer cycle times because differing perceptions might have balanced each other; in some cases, longer cycle times might reflect additional time spent with the provider, which could be perceived as valuable by the patient, and for others the long cycle time might be dissatisfying. Nevertheless, many of our patients were familiar with the county health system and expected to spend 90 minutes or more in clinic for each visit. Regardless, newly insured patients may have different expectations on how their health care should be delivered, an issue that could be investigated in the future.
The accessibility and convenience subscale scores reflected patients’ perception of timeliness and availability of medical care. The way that patients are scheduled at our clinic likely affected this subscale score, as patients must be referred through their primary care provider or the emergency department. We believe that many patients consider the wait for a primary care appointment as part of the overall wait for a dermatology appointment, which affects perception of accessibility and convenience for our clinic.
When we stratified by age, ethnicity, and language, other interesting trends occurred in satisfaction scores. Patients older than 65 years had a statistically significant higher accessibility and convenience subscale score when compared to the groups aged 18 to 29 years (P<.02) and 50 to 64 years (P<.05) as well as a higher but not statistically significant score compared to those aged 30 to 49 years (P<.07). Possible explanations include that older patients are familiar with the workings of our health system or that some of our patients older than 65 years may be retired and have fewer daily obligations. For the time spent with doctor subscale score, patients older than 65 years had higher scores when compared to those aged 30 to 49 years (P<.06) and 50 to 64 years (P<.07), perhaps because providers are spending more time with older individuals who may have more medical issues. A study involving a family medicine clinic also found that older patients were more satisfied with their overall care,6 which may be important given the changing demographics of Americans seeking medical care.
Differences in patient satisfaction when our patients were stratified by primary language and self-identified ethnicity also were noted. English-speaking patients were significantly more satisfied than Spanish-speaking patients in 4 subscales of satisfaction: technical quality (P<.01), interpersonal manner (P<.0001), financial aspects (P<.02), and time spent with doctor (P<.0006). For ethnicity, non-Hispanic/Latino patients had significantly higher subscale satisfaction scores for interpersonal manner (P<.0001) and time spent with doctor (P<.005). Variability in patient satisfaction based on primary language spoken and ethnicity has been described in other health care settings. Differences in satisfaction with care, understanding of potential side effects of a medication, compliance, and perceived rapport with physicians have been described.7-9
In addition to validating quality of care through patient satisfaction surveys, providers will be challenged to increase access to dermatologic services. Health systems that accept predominately Medicaid insurance, such as academic medical centers and safety-net hospitals, will be responsible for caring for millions of newly insured Medicaid patients. However, our high and variable nonattendance rates lead to inefficient use of our resources, often reducing the number of patients that are seen.
Canizares and Penneys10 studied an urban dermatology clinic over a 6-month period (N=508) and found that 17% of patients failed to keep their appointments; the subgroup of individuals with state-assisted insurance plans had the highest nonattendance rate (26%).10 In contrast, a group from Canada (N=5300) found that the nonattendance rate in a private dermatology practice was less than 8%.11 Our average nonattendance rate of 30% is within the range for urban clinics10,12; however, our SD of 7% leads to a high variability in patient volume each clinic day. As a result, on many days a reduced number of patients are seen resulting in a higher per-patient cost of delivering care.
Limitations
A potential bias is that the surveys were completed in the clinic and patients may have been concerned about possible repercussions for negative evaluations, which may have skewed results to be more positive than they otherwise would have been. We attempted to minimize this potential bias by having medical students who were not involved in the patients’ care administer the surveys. We also advised patients that their individual surveys would not be given to their providers and that any identifying information would be removed during data analysis. Our inferences could be affected by use of the terms satisfied and very satisfied in our patient satisfaction survey. Although we may interpret the results as patients reporting their degree of satisfaction, the patient may mean that there is room for improvement.13 Therefore, a survey that allows for more varied responses could potentially lead to different results.
Conclusion
Dermatology practitioners can support the specialty and validate the work they do by achieving high patient satisfaction scores. A study of online reviews compared patient ratings from 23 specialties and found that dermatology ranked second to last, ahead of only psychiatry.14 Our data has highlighted several opportunities to implement interventions that might improve patient satisfaction, though future studies would be required. Expanding or changing office hours, hiring more providers, or improving telephone access are potential interventions that might improve the accessibility and convenience subscale of patient satisfaction. Reducing the variability of nonattendance rates through the creation of resources to provide patients with clear directions and travel options, reminder calls, and instituting fees for missed appointments in some patient populations might allow for more predictable scheduling to optimize flow and the number of patients seen in each clinic.
Other approaches to improve satisfaction scores based on our results could include simple measures such as increasing the perception of time spent with the patient by having the physician sit down briefly in the examination room.15,16 It might be helpful to streamline translation assistance for patients who do not speak English as a primary language. It may be useful to recognize that younger patients have different expectations for clinic visits. For example, offering online scheduling to improve accessibility and convenience may improve satisfaction, particularly in patients who are accustomed to using technology.
It is our hope that while dermatologists continue to provide high quality care, they will work to demonstrate the value of their care by becoming leaders in patient satisfaction. Connecting their satisfaction with health care to patients’ quality of life has the potential to validate our specialty to insurers.
- Shatzer A, Long SK, Zuckerman S. Who are the newly insured as of early March 2014? Urban Institute Health Policy Center website. http://hrms.urban.org/briefs/Who-Are-the-Newly-Insured.html. Published May 22, 2014. Accessed March 17, 2017.
- Press I. Patient Satisfaction: Understanding and Measuring the Experience of Care. 2nd ed. Chicago, IL: Health Administration Press; 2006.
- Carr-Hill RA. The measurement of patient satisfaction. J Public Health Med. 1992;14:236-249.
- Thayparan A, Mahdi E. The Patient Satisfaction Questionnaire Short Form (PSQ-18) as an adaptable, reliable, and validated tool for use in various settings. Med Educ Online. 2013;18:21747.
- Garcia D, Kennedy C, Langager, J, et al. Pulse report 2009: outpatient: patient perspectives on American health care. South Bend, IN: Press Ganey Associates, Inc; 2009.
- Wetmore S, Boisvert L, Graham E, et al. Patient satisfaction with access and continuity of care in a multidisciplinary academic family medicine clinic. Can Fam Physician. 2014;60:E230-E236.
- Carrasquillo O, Orav EJ, Brennan TA, et al. Impact of language barriers on patient satisfaction in an emergency department. J Gen Intern Med. 1999;14:82-87.
- David RA, Rhee M. The impact of language as a barrier to effective health care in an underserved urban Hispanic community. Mt Sinai J Med. 1998;65:393-397.
- Ferguson WJ, Candib LM. Culture, language, and the doctor-patient relationship. Fam Med. 2002;34:353-361.
- Canizares MJ, Penneys NS. The incidence of nonattendance at an urgent care dermatology clinic. J Am Acad Dermatol. 2002;46:457-459.
- Pehr K. No show: incidence of nonattendance at a dermatology practice in a single universal payer model. J Cutan Med Surg. 2007;11:53-56.
- Penneys N, Glaser DA. The incidence of cancellation and non-attendance at a dermatology clinic. J Am Acad Dermatol. 1999;40:714-718.
- Collins K, O’Cathain A. The continuum of patient satisfaction—from satisfied to very satisfied. Soc Sci Med. 2003;57:2465-2470.
- Internet study: highest educated & trained doctors get poorest online reviews [news release]. Denver, CO: Vanguard Communications; April 22, 2015. https://vanguardcommunications.net/best-online-doctor-reviews/. Accessed November 28, 2016.
- Swayden KJ, Anderson KK, Connelly LM, et al. Effect of sitting vs. standing on perception of provider time at bedside: a pilot study. Patient Educ Couns. 2012;86:166-171.
- Sorenson E, Malakouti M, Brown G, et al. Enhancing patient satisfaction in dermatology. Am J Clin Dermatol. 2015;16:1-4.
The Patient Protection and Affordable Care Act was signed into law in 2010, aiming to expand access to and improve the quality of health care in the United States. In the states that expanded Medicaid eligibility, uninsurance among adults decreased from 15.8% in September 2013 to 7.3% in March 2016, a decline of 53.8%.1 On average, these newly insured individuals were younger and more likely to report fair to poor health than those previously insured. Approximately half of the newly insured have family incomes at or below 138% of the federal poverty level.1
Improvement in quality in medicine is not as easily quantified. Several programs have been implemented through the Centers for Medicare & Medicaid Services to measure and reimburse hospital systems and providers based on the quality and value of care being provided. Because of the complexity in defining quality in medicine, patient satisfaction has become a proxy measurement tool.2 With higher numbers of insured patients and an increased demand for services, dermatologists are being challenged to improve availability of services and respond to patients’ needs and desires as expressed through satisfaction surveys.
Few studies have assessed patient satisfaction in dermatology practices. As patient satisfaction surveys move to the forefront under the Patient Protection and Affordable Care Act, hospitals and providers will try to demonstrate the quality of their care through positive survey responses from patients. Importantly, patient satisfaction is a strong determinate if patients will comply with treatment and continue seeing their practitioner.3 A better understanding of patients’ perceptions regarding quality will allow for targeted interventions to be implemented. This study assesses and analyzes patient satisfaction, nonattendance rates, and cycle times in an outpatient dermatology clinic to provide a snapshot of patient satisfaction in an urban dermatology clinic.
Dr. Adam Sutton discusses the results of this study with Editor-in-Chief Vincent A. DeLeo, MD, in a "Peer to Peer" audiocast, "Measuring Patient Satisfaction: How Do Patients Perceive Quality of Care Delivered by Dermatologists?"
Methods
We conducted a prospective study that was approved by the University of Southern California Health Sciences (Los Angeles, California) institutional review board. A convenience sample of patients 18 years and older who spoke English or Spanish were recruited to participate in the study and agreed to complete the Patient Satisfaction Questionnaire Short Form (PSQ-18) and a demographic questionnaire, both in English or Spanish, at the conclusion of their visit.
Based on schedules and availability, medical students came to our clinic and obtained the surveys in the following manner: After patients checked in, the students approached the patients in the waiting area and asked if they would be willing to participate in the study. If patients agreed to participate, they provided written consent and the medical student handed them an envelope containing paper copies of the survey in English or Spanish, depending on the patient’s preference. Patients were asked to complete the surveys at the end of the visit and return them to the student in the envelope. The medical students did not otherwise participate in the patient’s visit.
Surveys were collected over an 8-month period at Los Angeles County+USC Medical Center dermatology clinics, which are part of a large safety-net health system. Among this population, it is common for patients to lack reliable Internet access or permanent home addresses; therefore, we elected to use point-of-care printed survey forms. Midway through the survey collection, we moved our clinic location; however, patients and physicians did not change. The comparison between clinics showed no substantive differences and did not change the conclusions of the study.
Patient Demographics
Demographic variables were age, sex, ethnicity, highest education level, annual household income, and primary language. Patients were grouped into 4 age categories: 18 to 29 years, 30 to 49 years, 50 to 64 years, and 65 years and older. Ethnicity was classified as Hispanic/Latino or other. Highest education level was classified as high school diploma or lower, and some college or higher. Annual household income was grouped into 3 categories: less than $15,000, $15,000 to $35,000, and more than $35,000.
Patient Satisfaction Questionnaire
The PSQ-18 survey was developed by the RAND Corporation (Santa Monica, California) and has been validated.4 The survey asks patients to rate aspects of their care experience on a 5-point Likert scale (strongly agree, agree, uncertain, disagree, strongly disagree), with 5 representing highest satisfaction. The survey contains 18 questions and is scored on 7 subscales: general satisfaction, technical quality, interpersonal manner, communication, financial aspects, time spent with doctor, and accessibility and convenience. The survey typically takes less than 5 minutes to complete.
Cycle Times and Nonattendance Rates
Cycle time is defined as the total amount of time that a patient spends in a clinic from check in to checkout, which was collected from our scheduling system for each patient who agreed to participate in the study. Cycle times were grouped into 4 categories: 0 to 60 minutes, 61 to 90 minutes, 91 to 120 minutes, and 121 minutes or more. During the study period, data also were collected from the electronic health record system regarding the number of patients with appointments scheduled and the number of patients who attended each clinic. From these figures, the rate of nonattendance for each clinic was calculated.
Statistical Analysis
Demographic results were calculated using arithmetic means. The PSQ-18 subscale scores were compared among demographic subgroups using a generalized linear model. Covariates included age, sex, ethnicity, highest education level, annual household income, and primary language. All statistical analyses were conducted using SAS software version 9.2.
Results
Of the 298 participants surveyed, the average age was 49 years, 51% were male, 73% self-identified as Hispanic/Latino, 64% spoke Spanish, 58% had a high school diploma or lower, and 68% reported an annual household income of less than $15,000 (Table 1).
Table 1 shows PSQ-18 scores for all patients stratified by demographics. Notably, patients with some college or more were significantly more satisfied on the interpersonal manner (P<.03) and time spent with doctor (P<.007) subscales when compared to those who were less educated, but they had lower general satisfaction scores (P<.001). Patients with a reported annual household income of greater than $35,000 were more satisfied on the technical quality (P<.07) and time spent with doctor (P<.04) subscales when compared to those making less than $15,000. The patients with a household income greater than $35,000 also were more satisfied with accessibility and convenience (P<.05) than those making $15,000 to $35,000. When stratified by sex, the time spent with doctor subscale was significantly higher in males than females (P<.001). (Statistically significant differences when stratifying by age, ethnicity, and language are noted in the “Comment” section.)
Patients’ average cycle time from check in to checkout was 102 minutes (range, 24–177 minutes). There was no statistically significant difference in patient satisfaction subscale scores when stratifying patients by cycle time. During a period comparable to the time that surveys were collected, our mean (standard deviation [SD]) nonattendance rate was 30% (7%). Therefore, based on 2 SDs, there was a 95% chance that 16% to 44% of patients would not attend their scheduled appointments in each clinic.
Comment
Our dermatology clinic received an average general satisfaction subscale score of 3.86. Although the general impression of patients was positive, there were subscale scores in which the clinic performed below the general satisfaction score; the 2 lowest were time spent with doctor (3.46), and accessibility and convenience (3.37). One possible explanation for the lower time spent with doctor subscale score relates to visiting an academic medical center. Patients often are seen sequentially by a medical student, resident, and supervising physician. This educational model contributes to long cycle times; indeed, average patient visit length was more than 1.5 hours in our study. Meanwhile, patients may consider their “doctor” to be the last member of the medical team they see; thus, the percentage of the clinic visit time that a supervising physician spends with the patient may be perceived by patients as short compared to the overall time spent in the clinic.
Surprisingly, there was no statistically significant difference in patient satisfaction subscale scores, including time spent with doctor, for patients with longer cycle times compared to short cycle times (Table 2), which suggests that the length of clinic visits may have been longer than the threshold for further effect on satisfaction scores. To this point, prior research has shown that patient satisfaction notably drops after 15 minutes of waiting,5 defined as the time from check in to when the patient first sees the provider. Our data set did not allow us to analyze wait time by that definition. However, we used cycle time, which includes various periods of waiting during the patient’s visit. If we had more data points on cycle times less than 30 minutes, we might have detected a clearer relationship of cycle times to patient satisfaction scores.
Satisfaction may not have varied with longer cycle times because differing perceptions might have balanced each other; in some cases, longer cycle times might reflect additional time spent with the provider, which could be perceived as valuable by the patient, and for others the long cycle time might be dissatisfying. Nevertheless, many of our patients were familiar with the county health system and expected to spend 90 minutes or more in clinic for each visit. Regardless, newly insured patients may have different expectations on how their health care should be delivered, an issue that could be investigated in the future.
The accessibility and convenience subscale scores reflected patients’ perception of timeliness and availability of medical care. The way that patients are scheduled at our clinic likely affected this subscale score, as patients must be referred through their primary care provider or the emergency department. We believe that many patients consider the wait for a primary care appointment as part of the overall wait for a dermatology appointment, which affects perception of accessibility and convenience for our clinic.
When we stratified by age, ethnicity, and language, other interesting trends occurred in satisfaction scores. Patients older than 65 years had a statistically significant higher accessibility and convenience subscale score when compared to the groups aged 18 to 29 years (P<.02) and 50 to 64 years (P<.05) as well as a higher but not statistically significant score compared to those aged 30 to 49 years (P<.07). Possible explanations include that older patients are familiar with the workings of our health system or that some of our patients older than 65 years may be retired and have fewer daily obligations. For the time spent with doctor subscale score, patients older than 65 years had higher scores when compared to those aged 30 to 49 years (P<.06) and 50 to 64 years (P<.07), perhaps because providers are spending more time with older individuals who may have more medical issues. A study involving a family medicine clinic also found that older patients were more satisfied with their overall care,6 which may be important given the changing demographics of Americans seeking medical care.
Differences in patient satisfaction when our patients were stratified by primary language and self-identified ethnicity also were noted. English-speaking patients were significantly more satisfied than Spanish-speaking patients in 4 subscales of satisfaction: technical quality (P<.01), interpersonal manner (P<.0001), financial aspects (P<.02), and time spent with doctor (P<.0006). For ethnicity, non-Hispanic/Latino patients had significantly higher subscale satisfaction scores for interpersonal manner (P<.0001) and time spent with doctor (P<.005). Variability in patient satisfaction based on primary language spoken and ethnicity has been described in other health care settings. Differences in satisfaction with care, understanding of potential side effects of a medication, compliance, and perceived rapport with physicians have been described.7-9
In addition to validating quality of care through patient satisfaction surveys, providers will be challenged to increase access to dermatologic services. Health systems that accept predominately Medicaid insurance, such as academic medical centers and safety-net hospitals, will be responsible for caring for millions of newly insured Medicaid patients. However, our high and variable nonattendance rates lead to inefficient use of our resources, often reducing the number of patients that are seen.
Canizares and Penneys10 studied an urban dermatology clinic over a 6-month period (N=508) and found that 17% of patients failed to keep their appointments; the subgroup of individuals with state-assisted insurance plans had the highest nonattendance rate (26%).10 In contrast, a group from Canada (N=5300) found that the nonattendance rate in a private dermatology practice was less than 8%.11 Our average nonattendance rate of 30% is within the range for urban clinics10,12; however, our SD of 7% leads to a high variability in patient volume each clinic day. As a result, on many days a reduced number of patients are seen resulting in a higher per-patient cost of delivering care.
Limitations
A potential bias is that the surveys were completed in the clinic and patients may have been concerned about possible repercussions for negative evaluations, which may have skewed results to be more positive than they otherwise would have been. We attempted to minimize this potential bias by having medical students who were not involved in the patients’ care administer the surveys. We also advised patients that their individual surveys would not be given to their providers and that any identifying information would be removed during data analysis. Our inferences could be affected by use of the terms satisfied and very satisfied in our patient satisfaction survey. Although we may interpret the results as patients reporting their degree of satisfaction, the patient may mean that there is room for improvement.13 Therefore, a survey that allows for more varied responses could potentially lead to different results.
Conclusion
Dermatology practitioners can support the specialty and validate the work they do by achieving high patient satisfaction scores. A study of online reviews compared patient ratings from 23 specialties and found that dermatology ranked second to last, ahead of only psychiatry.14 Our data has highlighted several opportunities to implement interventions that might improve patient satisfaction, though future studies would be required. Expanding or changing office hours, hiring more providers, or improving telephone access are potential interventions that might improve the accessibility and convenience subscale of patient satisfaction. Reducing the variability of nonattendance rates through the creation of resources to provide patients with clear directions and travel options, reminder calls, and instituting fees for missed appointments in some patient populations might allow for more predictable scheduling to optimize flow and the number of patients seen in each clinic.
Other approaches to improve satisfaction scores based on our results could include simple measures such as increasing the perception of time spent with the patient by having the physician sit down briefly in the examination room.15,16 It might be helpful to streamline translation assistance for patients who do not speak English as a primary language. It may be useful to recognize that younger patients have different expectations for clinic visits. For example, offering online scheduling to improve accessibility and convenience may improve satisfaction, particularly in patients who are accustomed to using technology.
It is our hope that while dermatologists continue to provide high quality care, they will work to demonstrate the value of their care by becoming leaders in patient satisfaction. Connecting their satisfaction with health care to patients’ quality of life has the potential to validate our specialty to insurers.
- Shatzer A, Long SK, Zuckerman S. Who are the newly insured as of early March 2014? Urban Institute Health Policy Center website. http://hrms.urban.org/briefs/Who-Are-the-Newly-Insured.html. Published May 22, 2014. Accessed March 17, 2017.
- Press I. Patient Satisfaction: Understanding and Measuring the Experience of Care. 2nd ed. Chicago, IL: Health Administration Press; 2006.
- Carr-Hill RA. The measurement of patient satisfaction. J Public Health Med. 1992;14:236-249.
- Thayparan A, Mahdi E. The Patient Satisfaction Questionnaire Short Form (PSQ-18) as an adaptable, reliable, and validated tool for use in various settings. Med Educ Online. 2013;18:21747.
- Garcia D, Kennedy C, Langager, J, et al. Pulse report 2009: outpatient: patient perspectives on American health care. South Bend, IN: Press Ganey Associates, Inc; 2009.
- Wetmore S, Boisvert L, Graham E, et al. Patient satisfaction with access and continuity of care in a multidisciplinary academic family medicine clinic. Can Fam Physician. 2014;60:E230-E236.
- Carrasquillo O, Orav EJ, Brennan TA, et al. Impact of language barriers on patient satisfaction in an emergency department. J Gen Intern Med. 1999;14:82-87.
- David RA, Rhee M. The impact of language as a barrier to effective health care in an underserved urban Hispanic community. Mt Sinai J Med. 1998;65:393-397.
- Ferguson WJ, Candib LM. Culture, language, and the doctor-patient relationship. Fam Med. 2002;34:353-361.
- Canizares MJ, Penneys NS. The incidence of nonattendance at an urgent care dermatology clinic. J Am Acad Dermatol. 2002;46:457-459.
- Pehr K. No show: incidence of nonattendance at a dermatology practice in a single universal payer model. J Cutan Med Surg. 2007;11:53-56.
- Penneys N, Glaser DA. The incidence of cancellation and non-attendance at a dermatology clinic. J Am Acad Dermatol. 1999;40:714-718.
- Collins K, O’Cathain A. The continuum of patient satisfaction—from satisfied to very satisfied. Soc Sci Med. 2003;57:2465-2470.
- Internet study: highest educated & trained doctors get poorest online reviews [news release]. Denver, CO: Vanguard Communications; April 22, 2015. https://vanguardcommunications.net/best-online-doctor-reviews/. Accessed November 28, 2016.
- Swayden KJ, Anderson KK, Connelly LM, et al. Effect of sitting vs. standing on perception of provider time at bedside: a pilot study. Patient Educ Couns. 2012;86:166-171.
- Sorenson E, Malakouti M, Brown G, et al. Enhancing patient satisfaction in dermatology. Am J Clin Dermatol. 2015;16:1-4.
Practice Points
- Patient experience can be measured through brief point-of-service patient satisfaction questionnaires.
- Stratifying and analyzing patient satisfaction allows for targeted interventions to be developed and implemented.
- Educational handouts in the patient's primary language may help increase satisfaction and improve compliance.