User login
May 2017 Digital Edition
Click here to access the May 2017 Digital Edition.
Table of Contents
- Providing Mental Health Care to All Veterans Regardless of Discharge Status
- Need for Mental Health Providers in Progressive Tinnitus Management
- Blood Loss and Need for Blood Transfusions in Total Knee and Total Hip Arthroplasty
- Peripheral Exudative Hemorrhagic Chorioretinopathy in Patients With Nonexudative Age-Related Macular Degeneration
- The Personal Health Inventory: Current Use, Perceived Barriers, and Benefits
- Dependence of Elevated Eosinophil Levels on Geographic Location
- The Design and Implementation of a Home-Based Cardiac Rehabilitation Program
- FRAX Prediction With and Without Bone Mineral Density Testing
- Improved Access to Drug Safety Labeling Changes Information
- Defining Pharmacy Leadership in the VA
- VA Nurses Advocate for Best Care

Caution patients about common food–drug interactions
Many individuals read about the health benefits of certain foods, such as coffee, grapefruit, and red wine, but psychiatrists might neglect to inform their patients that these common foods could interact with drugs, thereby preventing certain psychotropics from achieving maximum benefit or causing toxicity. Educate your patients about food–drug interactions and to refrain from alcohol and specific foods when taking psychotropics. Although far from comprehensive, we present a discussion of the most frequently encountered and preventable food/nutrient–drug interactions.
Grapefruit juice may alter bioavailability of many psychotropics by inhibiting cytochrome P450 (CYP) 3A4 and 1A2 isoforms, interfering with prehepatic metabolism, and enteric absorption. Common medications affected by this interaction include alprazolam, buspirone, sertraline, carbamazepine, and methadone.1 Patients should be advised about eating grapefruit or drinking grapefruit juice as it could require dose adjustment to avoid drug toxicity.
Table salt. Lithium is a salt, and less table salt intake could cause lithium levels to rise and vice versa. Lithium and other salts compete for absorption and secretion in the renal tubules, which are responsible for this interaction. Therefore, it is advisable to keep a stable salt intake throughout treatment. Patients should be cautioned about eating salty foods during the summer because excessive sweating could lead to lithium intoxication.
Caffeine is a widely used stimulant; however, it can decrease blood lithium levels and block clozapine clearance via inhibition of the CYP1A2 enzyme. Excessive caffeine intake can lead to clozapine toxicity.2
Beef liver, aged sausage and cheese, and wine contain tyramine. Tyramine is broken down by monoamine oxidase (MAO) enzymes in the body, which are inhibited by MAO inhibitors (MAOI) such as phenelzine and selegiline. A patient taking a MAOI cannot catabolize tyramine and other amines. These exogenous amines could cause a life-threatening hyperadrenergic crisis. Physicians should educate their patients about the MAOI diet and monitor adherence to the food avoidance list.
St. John’s wort is a herb commonly used for treating mild depression. It is a strong inducer of the CYP3A4 enzyme and reduces plasma concentrations and could decrease clinical effectiveness of aripiprazole, quetiapine, alprazolam, and oxycodone.3 It could interact with serotonin reuptake inhibitors causing serotonin syndrome.
Full vs empty stomach. Food is known to affect bioavailability and enteral absorption of different psychotropics. Some medications are best taken on a full stomach and some on an empty one. For example, the antipsychotic ziprasidone should be taken with meals of at least 500 calories for optimal and consistent bioavailability. Benzodiazepines are rapidly absorbed when taken on an empty stomach.
Discuss dietary habits with patients to encourage a healthy lifestyle and provide valuable direction about potential food/nutrient–drug interactions.
1. Pawełczyk T, Kłoszewska I. Grapefruit juice interactions with psychotropic drugs: advantages and potential risk [in Polish]. Przegl Lek. 2008;62(2):92-95.
2. Hägg S, Spigset O, Mjörndal T, et al. Effect of caffeine on clozapine pharmacokinetics in healthy volunteers. Br J Clin Pharmacol. 2000;49(1):59-63.
3. Markowitz JS, Donovan JL, DeVane CL, et al. Effect of St John’s wort on drug metabolism by induction of cytochrome P450 3A4 enzyme. JAMA. 2003;290(11):1500-1504.
Many individuals read about the health benefits of certain foods, such as coffee, grapefruit, and red wine, but psychiatrists might neglect to inform their patients that these common foods could interact with drugs, thereby preventing certain psychotropics from achieving maximum benefit or causing toxicity. Educate your patients about food–drug interactions and to refrain from alcohol and specific foods when taking psychotropics. Although far from comprehensive, we present a discussion of the most frequently encountered and preventable food/nutrient–drug interactions.
Grapefruit juice may alter bioavailability of many psychotropics by inhibiting cytochrome P450 (CYP) 3A4 and 1A2 isoforms, interfering with prehepatic metabolism, and enteric absorption. Common medications affected by this interaction include alprazolam, buspirone, sertraline, carbamazepine, and methadone.1 Patients should be advised about eating grapefruit or drinking grapefruit juice as it could require dose adjustment to avoid drug toxicity.
Table salt. Lithium is a salt, and less table salt intake could cause lithium levels to rise and vice versa. Lithium and other salts compete for absorption and secretion in the renal tubules, which are responsible for this interaction. Therefore, it is advisable to keep a stable salt intake throughout treatment. Patients should be cautioned about eating salty foods during the summer because excessive sweating could lead to lithium intoxication.
Caffeine is a widely used stimulant; however, it can decrease blood lithium levels and block clozapine clearance via inhibition of the CYP1A2 enzyme. Excessive caffeine intake can lead to clozapine toxicity.2
Beef liver, aged sausage and cheese, and wine contain tyramine. Tyramine is broken down by monoamine oxidase (MAO) enzymes in the body, which are inhibited by MAO inhibitors (MAOI) such as phenelzine and selegiline. A patient taking a MAOI cannot catabolize tyramine and other amines. These exogenous amines could cause a life-threatening hyperadrenergic crisis. Physicians should educate their patients about the MAOI diet and monitor adherence to the food avoidance list.
St. John’s wort is a herb commonly used for treating mild depression. It is a strong inducer of the CYP3A4 enzyme and reduces plasma concentrations and could decrease clinical effectiveness of aripiprazole, quetiapine, alprazolam, and oxycodone.3 It could interact with serotonin reuptake inhibitors causing serotonin syndrome.
Full vs empty stomach. Food is known to affect bioavailability and enteral absorption of different psychotropics. Some medications are best taken on a full stomach and some on an empty one. For example, the antipsychotic ziprasidone should be taken with meals of at least 500 calories for optimal and consistent bioavailability. Benzodiazepines are rapidly absorbed when taken on an empty stomach.
Discuss dietary habits with patients to encourage a healthy lifestyle and provide valuable direction about potential food/nutrient–drug interactions.
1. Pawełczyk T, Kłoszewska I. Grapefruit juice interactions with psychotropic drugs: advantages and potential risk [in Polish]. Przegl Lek. 2008;62(2):92-95.
2. Hägg S, Spigset O, Mjörndal T, et al. Effect of caffeine on clozapine pharmacokinetics in healthy volunteers. Br J Clin Pharmacol. 2000;49(1):59-63.
3. Markowitz JS, Donovan JL, DeVane CL, et al. Effect of St John’s wort on drug metabolism by induction of cytochrome P450 3A4 enzyme. JAMA. 2003;290(11):1500-1504.
Subjected to sexually inappropriate behavior? Set LIMITS
Everyone needs love, companionship, and intimacy. Unfortunately, mental illness often results in interpersonal dysfunction, thereby frustrating these desires. Patients might exhibit sexually inappropriate behavior (SIB), consisting of comments, requests, or actions. The causes of SIB include confusion, predation, loneliness, psychosis, social impairment, character pathology, and/or mania.
Such attention poses an issue for mental health providers; trainees could be particularly vulnerable. The impact can be disheartening and cause practitioners to withdraw from patients or question their work, which could be detrimental to both providers and patients. While maintaining their personal safety, it is important that clinicians approach patients with compassion. To help clinicians manage SIB, we propose setting LIMITS.
Look after personal safety. Clinicians are trained to care for all patients, but situations can arise where it is no longer safe to work with an individual. A clinician who feels threatened is less likely to help the patient, especially if real danger is posed. Such situations could necessitate transferring the patient’s care to another provider. Clinicians also can choose to interact with a patient exhibiting SIB while colleagues are present.
Identify the etiology. SIB arises from a variety of underlying states, and the clinician’s response can vary depending on the cause. Questions to consider before reacting include:
- What is the origin of the behavior?
- What form is the behavior taking?
- In what context is it occurring?
- How frequent is it occurring?
- What factors are contributing?
- What are the risks to all parties?1
Maintain a professional role. Although SIB can undermine the provider–patient relationship, the behavior could be unintended. To remain professional, practitioners should pause before reacting and consider how to respond. A particular concern is countertransference, meaning that the provider might react to a patient’s behavior based on personal bias. This could result in amorous, hateful, or angry responses from the provider, which could put the treatment relationship at risk, harm the patient, or result in medical–legal repercussions.
Implement appropriate boundaries. In man
Talk with a Supervisor. These scenarios often produce many emotions. Residents could be experiencing them for the first time, but even seasoned clinicians can find them challenging. When in doubt, seek guidance from colleagues, supervisors, or mentors to help you clarify the situation.
Acknowledgments
The authors thank Kristina Zdanys, MD, David Schmidt, DO, Joanna Chaurette, MD, PhD, and Shilpa Lad, MD, for their input.
1. Series H, Dégano P. Hypersexuality in dementia. Adv Psychiatr Treat. 2005; 11(6):424-431.
Everyone needs love, companionship, and intimacy. Unfortunately, mental illness often results in interpersonal dysfunction, thereby frustrating these desires. Patients might exhibit sexually inappropriate behavior (SIB), consisting of comments, requests, or actions. The causes of SIB include confusion, predation, loneliness, psychosis, social impairment, character pathology, and/or mania.
Such attention poses an issue for mental health providers; trainees could be particularly vulnerable. The impact can be disheartening and cause practitioners to withdraw from patients or question their work, which could be detrimental to both providers and patients. While maintaining their personal safety, it is important that clinicians approach patients with compassion. To help clinicians manage SIB, we propose setting LIMITS.
Look after personal safety. Clinicians are trained to care for all patients, but situations can arise where it is no longer safe to work with an individual. A clinician who feels threatened is less likely to help the patient, especially if real danger is posed. Such situations could necessitate transferring the patient’s care to another provider. Clinicians also can choose to interact with a patient exhibiting SIB while colleagues are present.
Identify the etiology. SIB arises from a variety of underlying states, and the clinician’s response can vary depending on the cause. Questions to consider before reacting include:
- What is the origin of the behavior?
- What form is the behavior taking?
- In what context is it occurring?
- How frequent is it occurring?
- What factors are contributing?
- What are the risks to all parties?1
Maintain a professional role. Although SIB can undermine the provider–patient relationship, the behavior could be unintended. To remain professional, practitioners should pause before reacting and consider how to respond. A particular concern is countertransference, meaning that the provider might react to a patient’s behavior based on personal bias. This could result in amorous, hateful, or angry responses from the provider, which could put the treatment relationship at risk, harm the patient, or result in medical–legal repercussions.
Implement appropriate boundaries. In man
Talk with a Supervisor. These scenarios often produce many emotions. Residents could be experiencing them for the first time, but even seasoned clinicians can find them challenging. When in doubt, seek guidance from colleagues, supervisors, or mentors to help you clarify the situation.
Acknowledgments
The authors thank Kristina Zdanys, MD, David Schmidt, DO, Joanna Chaurette, MD, PhD, and Shilpa Lad, MD, for their input.
1. Series H, Dégano P. Hypersexuality in dementia. Adv Psychiatr Treat. 2005; 11(6):424-431.
1. Series H, Dégano P. Hypersexuality in dementia. Adv Psychiatr Treat. 2005; 11(6):424-431.
Benefits and costs of accepting credit cards in your practice
Are you tired of waiting for checks in the mail? Do patients leave without paying their balance? Streamlining revenue collection by taking credit cards is a tantalizing antidote to these ills, but it has downsides. Weighing the value for you and your patients is necessary before you decide on this important practice management policy.
Clinical and practical advantages
Many patients prefer that their health care practitioners take credit cards, because it simplifies their busy lives—and who carries a checkbook anymore? Patients can put the whole session to good use without sacrificing time taking care of payment. They also can receive credit card rewards for their payment, or use health savings accounts, health reimbursement accounts, or flexible spending debit cards, making treatment more affordable.
Benefits of credit cards
Accepting credit cards has many benefits:
- Allows more time in a session to focus on clinical matters because you do not have to allocate time to collect payment, which might include dealing with a forgotten checkbook or a request for a change in your payment policies.
- Easier to collect payment for no-shows. This could result in a reduced no-show rate, because a patient might feel more accountable to show up knowing that his (her) credit card is on file.
- Saves time recording and depositing checks.
- Avoids bounced checks and collection agencies.
Money doesn’t grow on trees
Although there are advantages to accepting credit cards, several costs should be considered. Some practitioners feel that accepting credit cards makes their practice seem like a commercial business. There also is an expense of accepting credit cards, and understanding these costs can be confusing because there are different processing systems of rates. Whether the rate is flat, tiered, or wholesale, you always will pay a percentage of the transaction, plus a transaction fee.
Here are some general guidelines on rates:
- Debit cards are the least expensive to process but often have low spending limits.
- Rewards cards, such as frequent flyer cards, are the most expensive to process. Have you ever wondered who foots the bill for those frequent flyer miles? It’s not the airline; it’s the merchant (you).
- For tiered rates, swiping cards is typically cheaper than typing in the credit card info. Tiered rates often have low rates, known as “teaser” rates, because they are applicable in far fewer cases.
- For flat or wholesale rates, securely saving credit card numbers is not any more expensive than swiping a card, and saves time in the long run and potential awkwardness at the end of a session.
- A higher volume of processed credit cards might allow you to negotiate your rates.
- Check if your bank offers a less expensive option. Some banks offer preferred rates for their customers.
Also consider the time and possible expense of ensuring that you are Payment Card Industry Data Security Standard compliant (information security standards that aim to keep cardholder data secure).
Different methods of processing transactions have varying levels of requirements:
- A swiping reader with a terminal connected to a telephone line is more secure than through the Internet and carries fewer compliance burdens. Use a reader that can handle chip-cards, because you could be liable for fraudulent transactions.
- Do not save or store credit card numbers you typed yourself. Compliance is less burdensome if patients input credit card data into a secure portal.
- Store credit card data securely via your credit card processing partner, although the partner is still at risk of a data breach. Practitioners should weigh the value of convenience vs security.
- If there is a data breach and you are found negligent you could be fined $5,000 to $100,000 per month, depending on whether you are a large company or solo practice.
Bottom dollar
Credit card processing has significant advantages from both a practice management and clinical standpoint. Because prices for services vary, shop around to find the best rates and educate yourself about security requirements. Taking the time to research these matters can pay off in the long term.

How you can simplify your patient’s medication regimen to enhance adherence
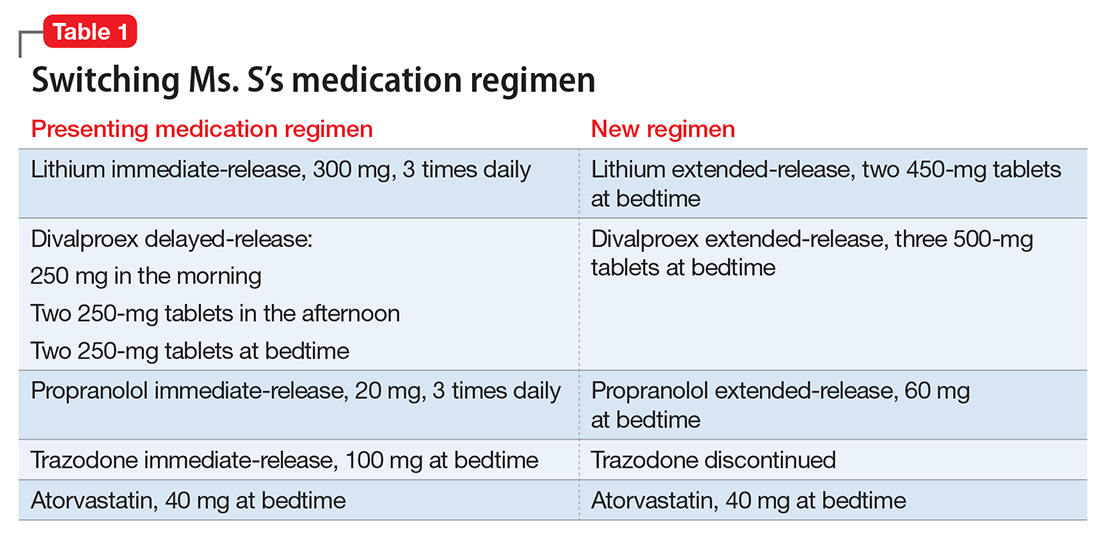
Ms. S, age 53, has bipolar disorder, dyslipidemia, and drug-induced tremor and presents to the clinic complaining of increasing depressive symptoms despite a history of response to her current medication regimen (Table 1). When informed that her lithium and divalproex levels are subtherapeutic, Ms. S admits that she doesn’t always take her medication. She understands her psychiatric and medical conditions and rationale for her current medications; however, she recently changed jobs, which has affected her ability to adhere to her regimen. Ms. S says the only thing preventing her from adhering to her medication is the frequency of administration.
Only approximately one-half of patients with chronic illness adhere to their medication regimen.1 Nonadherence has been reported in 20% to 72% of patients with schizophrenia, 20% to 50% of those with bipolar disorder, and 28% to 52% with major depressive disorder.2 Medication nonadherence can impact a patient’s health outcomes1 and could lead to increased hospitalizations, homelessness, substance use, decreased quality of life, and suicide; however, it is difficult to fully determine the extent of medication nonadherence due to lack of standard measurement methodology.2
Factors that affect medication adherence in patients with psychiatric diagnoses include:
- patient-related (ie, demographic factors)
- psychological (eg, lack of insight into illness, negative emotions toward medications)
- social and environmental (eg, therapeutic alliance with the physician, housing stability and support, and discharge planning)
- medication-related (eg, complex dosing schedule).2
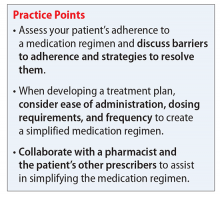

Medication regimen tolerability, complexity, and cost; patient understanding of medication indications and onset of therapeutic effect; and patient’s view of benefits can impact adherence.1,3 Assessing medication adherence and identifying barriers specific to the patient is essential when developing a treatment plan. If complexity is a barrier, simplify the medication regimen.
Claxton et al4 found an inverse relationship between medication dosing and adherence. Reviewing data from 76 studies that used electronic monitoring (records the time and date of actual dosing events) the overall rate of medication adherence was 71% ± 17%. Adherence rates were significantly higher with once daily (79% ± 14%) vs 3 times daily (65% ± 16%) or 4 times daily (51% ± 20%), and twice daily (69% ± 15%) was significantly better than 4 times daily dosing. Adherence between once daily and twice daily or twice daily and 3 times daily did not result in a significant difference. The authors noted that electronic monitoring has limitations; patients could have opened the medication bottle but not ingested the drug.4
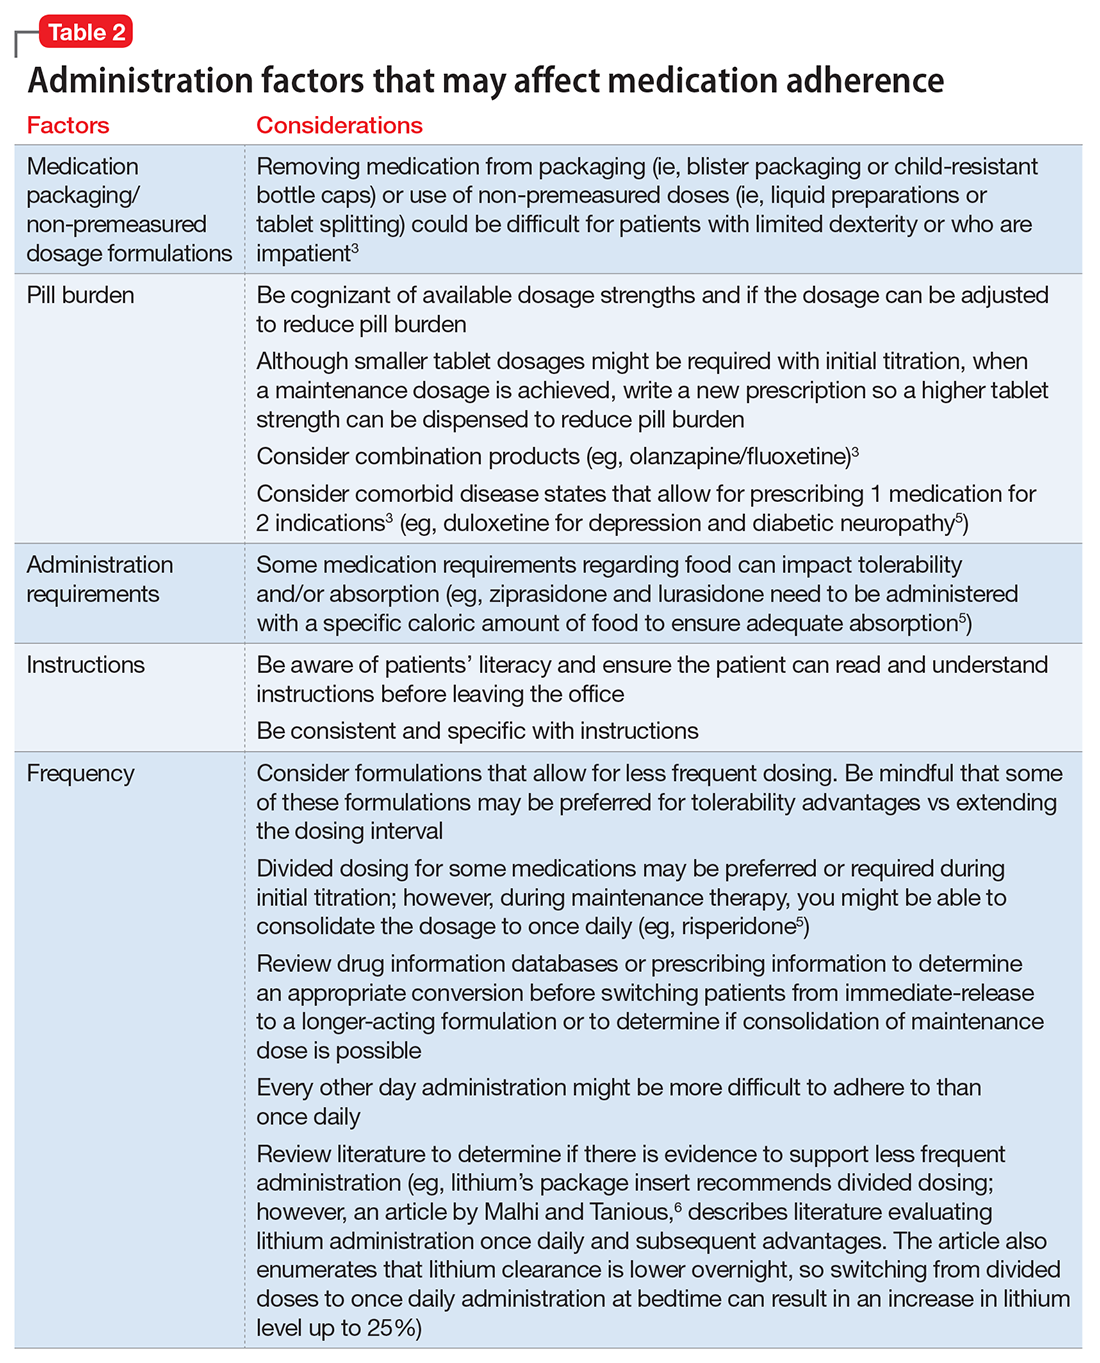
Consider these factors and strategies when developing a treatment plan (Table 2).3,5,6
Ease of administration
Medication packaging. Patients with limited dexterity might not be able to remove the medication from blister packaging or child-proof cap, measure non-unit dose liquid preparations, or split tablets in half.3 Patients with limited patience could get frustrated and skip medications that take longer to remove from packaging or have to be measured. Consult a pharmacist about medication packaging options or formulations that might be appropriate for some patients (ie, individuals with dysphagia), such as oral-disintegrating or sublingual tablets.
Assess pill burden. Although it might not be appropriate when titrating medications, consider adjusting the maintenance dosage to reduce the number of tablets (eg, a patient prescribed divalproex delayed-release, 2,750 mg/d, will take eleven 250-mg tablets vs taking divalproex delayed-release, 2,500 mg/d, which is five 500-mg tablets).
Keep in mind availability of combination medications (eg, olanzapine/fluoxetine) to reduce pill burden. Also, if possible, consider comorbid disease states that allow for prescribing 1 medication that can treat 2 conditions to reduce pill burden (eg, duloxetine for depression and diabetic neuropathy).3
Food recommendations. Review food requirements (ie, administration on an empty stomach vs the need for a specific caloric amount) and whether these are recommendations to improve tolerability or required to ensure adequate absorption. Nonadherence with dietary recommendations that can affect absorption may result in reduced effectiveness despite taking the medication.
Administration instructions
Keep administration instructions simple and be consistent with instructions and terminology.3 For example, if all medications are to be administered once daily in the morning, provide specific instructions (ie, “every morning”) because it may be confusing for patients if some medications are written for “once daily” and others for “every morning.” Some patients might prefer to have the medication indication noted in the administration instructions. Additionally, be aware of the patient’s literacy, and ensure the patient is able to read and understand instructions before leaving the office.
Administration frequency
Consider the required administration frequency and the patient’s self-reported ability to adhere to that frequency before initiating a new medication. Ask the patient what frequencies he (she) can best manage and evaluate his (her) regimen to determine if a less frequent schedule is possible. Consider formulations that may allow for less frequent dosing (eg, controlled-release, sustained-release, long-acting, or extended-release formulations) or consolidating divided doses to once daily if possible.3 Some of these formulations may be preferred for tolerability advantages vs extending the dosing interval (eg, regular-release and extended-release lithium tablets have the same half-life of approximately 18 to 36 hours; however, the extended-release formulation has a longer time to peak serum concentration, approximately 2 to 6 hours vs 0.5 to 3 hours, respectively. As a result, the extended-release formulation may offer improved tolerability in terms of peak-related side effects,5,7 which may be advantageous, especially when dosing lithium once daily). Keep in mind, for some patients every other day administration is more difficult to adhere to than once daily.
Review drug or prescribing information to determine an appropriate conversion before switching from an immediate-release to a longer-acting formulation. The switch may result in different drug serum concentrations (eg, propranolol sustained-release has different pharmacokinetics and produces lower blood levels than the immediate-release formulation). When switching between formulations, monitor patients to ensure the desired therapeutic effect is maintained.8
Consider collaborating with pharmacists, primary care providers, and other prescribers to simplify medical and psychiatric medications.
Other considerations
Lab monitoring requirements for drugs, such as clozapine, lithium, or divalproex, could affect a patient’s willingness to adhere. Use of weekly or monthly medication organizers, mobile apps, alarms (on cell phones or clocks), medication check-off sheets or calendars, and family or friend support could help improve medication adherence.
Case continued
After reviewing the medication regimen and consulting with a pharmacist, Ms. S’s regimen is simplified to once-daily administration, and pill burden is reduced by using extended-release formulations and consolidating doses at bedtime (Table 1). Additionally, trazodone is discontinued because divalproex, now taken once daily at bedtime, is sedating and aids in sleep.
For medications that require therapeutic blood monitoring such as lithium and divalproex, check drug levels when switching formulations. In the case of Ms. S, lithium, propranolol, and divalproex dosages were switched to extended-release preparations and consolidated to once daily at bedtime; the divalproex dosage was increased because an increase in total daily dose between 8% to 20% may be required to maintain similar serum concentrations.5 Lithium immediate-release was switched to the extended-release, which reduced the pill burden and could help tolerability if Ms. S experiences peak concentration-related side effects. Consolidating the lithium dosage from divided to once daily at bedtime can increase the lithium serum level by up to 25%.6
With a change in formulation, monitor tolerability and effectiveness of the medication regimen in regard to mood stabilization and tremor control, as well as check serum lithium and divalproex levels, creatinine, and sodium after 5 days, unless signs and symptoms of toxicity occur.
1. World Health Organization. Adherence to long-term therapies: evidence for action. http://apps.who.int/iris/bitstream/10665/42682/1/9241545992.pdf. Published 2003. Accessed November 29, 2015.
2. Julius RJ, Novitsky MA, Dubin WR. Medication adherence: a review of the literature and implications for clinical practice. J Psychiatr Pract. 2009;15(1):34-44.
3. Atreja A, Bellam N, Levy SR. Strategies to enhance patient adherence: making it simple. MedGenMed. 2005;7(1):4.
4. Claxton AJ, Cramer J, Pierce C. A systematic review of the associations between dose regimens and medication compliance. Clin Ther. 2001;23(8):1296-1310.
5. Lexicomp Online, Lexi-Drugs, Hudson, Ohio: Lexi-Comp, Inc.; February 28, 2016.
6. Malhi GS, Tanious M. Optimal frequency of lithium administration in the treatment of bipolar disorder: clinical and dosing considerations. CNS Drugs. 2011;25(4):289-298.
7. Jefferson JW, Greist JH, Ackerman DL, et al. Lithium: an overview. In: Lithium encyclopedia for clinical practice. 2nd ed. Washington, DC: American Psychiatric Press; 1987.
8. Inderal LA (propranolol extended release) [package insert]. Cranford, NJ: Akrimax Pharmaceuticals; November 2015.
Ms. S, age 53, has bipolar disorder, dyslipidemia, and drug-induced tremor and presents to the clinic complaining of increasing depressive symptoms despite a history of response to her current medication regimen (Table 1). When informed that her lithium and divalproex levels are subtherapeutic, Ms. S admits that she doesn’t always take her medication. She understands her psychiatric and medical conditions and rationale for her current medications; however, she recently changed jobs, which has affected her ability to adhere to her regimen. Ms. S says the only thing preventing her from adhering to her medication is the frequency of administration.
Only approximately one-half of patients with chronic illness adhere to their medication regimen.1 Nonadherence has been reported in 20% to 72% of patients with schizophrenia, 20% to 50% of those with bipolar disorder, and 28% to 52% with major depressive disorder.2 Medication nonadherence can impact a patient’s health outcomes1 and could lead to increased hospitalizations, homelessness, substance use, decreased quality of life, and suicide; however, it is difficult to fully determine the extent of medication nonadherence due to lack of standard measurement methodology.2
Factors that affect medication adherence in patients with psychiatric diagnoses include:
- patient-related (ie, demographic factors)
- psychological (eg, lack of insight into illness, negative emotions toward medications)
- social and environmental (eg, therapeutic alliance with the physician, housing stability and support, and discharge planning)
- medication-related (eg, complex dosing schedule).2
Medication regimen tolerability, complexity, and cost; patient understanding of medication indications and onset of therapeutic effect; and patient’s view of benefits can impact adherence.1,3 Assessing medication adherence and identifying barriers specific to the patient is essential when developing a treatment plan. If complexity is a barrier, simplify the medication regimen.
Claxton et al4 found an inverse relationship between medication dosing and adherence. Reviewing data from 76 studies that used electronic monitoring (records the time and date of actual dosing events) the overall rate of medication adherence was 71% ± 17%. Adherence rates were significantly higher with once daily (79% ± 14%) vs 3 times daily (65% ± 16%) or 4 times daily (51% ± 20%), and twice daily (69% ± 15%) was significantly better than 4 times daily dosing. Adherence between once daily and twice daily or twice daily and 3 times daily did not result in a significant difference. The authors noted that electronic monitoring has limitations; patients could have opened the medication bottle but not ingested the drug.4
Consider these factors and strategies when developing a treatment plan (Table 2).3,5,6
Ease of administration
Medication packaging. Patients with limited dexterity might not be able to remove the medication from blister packaging or child-proof cap, measure non-unit dose liquid preparations, or split tablets in half.3 Patients with limited patience could get frustrated and skip medications that take longer to remove from packaging or have to be measured. Consult a pharmacist about medication packaging options or formulations that might be appropriate for some patients (ie, individuals with dysphagia), such as oral-disintegrating or sublingual tablets.
Assess pill burden. Although it might not be appropriate when titrating medications, consider adjusting the maintenance dosage to reduce the number of tablets (eg, a patient prescribed divalproex delayed-release, 2,750 mg/d, will take eleven 250-mg tablets vs taking divalproex delayed-release, 2,500 mg/d, which is five 500-mg tablets).
Keep in mind availability of combination medications (eg, olanzapine/fluoxetine) to reduce pill burden. Also, if possible, consider comorbid disease states that allow for prescribing 1 medication that can treat 2 conditions to reduce pill burden (eg, duloxetine for depression and diabetic neuropathy).3
Food recommendations. Review food requirements (ie, administration on an empty stomach vs the need for a specific caloric amount) and whether these are recommendations to improve tolerability or required to ensure adequate absorption. Nonadherence with dietary recommendations that can affect absorption may result in reduced effectiveness despite taking the medication.
Administration instructions
Keep administration instructions simple and be consistent with instructions and terminology.3 For example, if all medications are to be administered once daily in the morning, provide specific instructions (ie, “every morning”) because it may be confusing for patients if some medications are written for “once daily” and others for “every morning.” Some patients might prefer to have the medication indication noted in the administration instructions. Additionally, be aware of the patient’s literacy, and ensure the patient is able to read and understand instructions before leaving the office.
Administration frequency
Consider the required administration frequency and the patient’s self-reported ability to adhere to that frequency before initiating a new medication. Ask the patient what frequencies he (she) can best manage and evaluate his (her) regimen to determine if a less frequent schedule is possible. Consider formulations that may allow for less frequent dosing (eg, controlled-release, sustained-release, long-acting, or extended-release formulations) or consolidating divided doses to once daily if possible.3 Some of these formulations may be preferred for tolerability advantages vs extending the dosing interval (eg, regular-release and extended-release lithium tablets have the same half-life of approximately 18 to 36 hours; however, the extended-release formulation has a longer time to peak serum concentration, approximately 2 to 6 hours vs 0.5 to 3 hours, respectively. As a result, the extended-release formulation may offer improved tolerability in terms of peak-related side effects,5,7 which may be advantageous, especially when dosing lithium once daily). Keep in mind, for some patients every other day administration is more difficult to adhere to than once daily.
Review drug or prescribing information to determine an appropriate conversion before switching from an immediate-release to a longer-acting formulation. The switch may result in different drug serum concentrations (eg, propranolol sustained-release has different pharmacokinetics and produces lower blood levels than the immediate-release formulation). When switching between formulations, monitor patients to ensure the desired therapeutic effect is maintained.8
Consider collaborating with pharmacists, primary care providers, and other prescribers to simplify medical and psychiatric medications.
Other considerations
Lab monitoring requirements for drugs, such as clozapine, lithium, or divalproex, could affect a patient’s willingness to adhere. Use of weekly or monthly medication organizers, mobile apps, alarms (on cell phones or clocks), medication check-off sheets or calendars, and family or friend support could help improve medication adherence.
Case continued
After reviewing the medication regimen and consulting with a pharmacist, Ms. S’s regimen is simplified to once-daily administration, and pill burden is reduced by using extended-release formulations and consolidating doses at bedtime (Table 1). Additionally, trazodone is discontinued because divalproex, now taken once daily at bedtime, is sedating and aids in sleep.
For medications that require therapeutic blood monitoring such as lithium and divalproex, check drug levels when switching formulations. In the case of Ms. S, lithium, propranolol, and divalproex dosages were switched to extended-release preparations and consolidated to once daily at bedtime; the divalproex dosage was increased because an increase in total daily dose between 8% to 20% may be required to maintain similar serum concentrations.5 Lithium immediate-release was switched to the extended-release, which reduced the pill burden and could help tolerability if Ms. S experiences peak concentration-related side effects. Consolidating the lithium dosage from divided to once daily at bedtime can increase the lithium serum level by up to 25%.6
With a change in formulation, monitor tolerability and effectiveness of the medication regimen in regard to mood stabilization and tremor control, as well as check serum lithium and divalproex levels, creatinine, and sodium after 5 days, unless signs and symptoms of toxicity occur.
1. World Health Organization. Adherence to long-term therapies: evidence for action. http://apps.who.int/iris/bitstream/10665/42682/1/9241545992.pdf. Published 2003. Accessed November 29, 2015.
2. Julius RJ, Novitsky MA, Dubin WR. Medication adherence: a review of the literature and implications for clinical practice. J Psychiatr Pract. 2009;15(1):34-44.
3. Atreja A, Bellam N, Levy SR. Strategies to enhance patient adherence: making it simple. MedGenMed. 2005;7(1):4.
4. Claxton AJ, Cramer J, Pierce C. A systematic review of the associations between dose regimens and medication compliance. Clin Ther. 2001;23(8):1296-1310.
5. Lexicomp Online, Lexi-Drugs, Hudson, Ohio: Lexi-Comp, Inc.; February 28, 2016.
6. Malhi GS, Tanious M. Optimal frequency of lithium administration in the treatment of bipolar disorder: clinical and dosing considerations. CNS Drugs. 2011;25(4):289-298.
7. Jefferson JW, Greist JH, Ackerman DL, et al. Lithium: an overview. In: Lithium encyclopedia for clinical practice. 2nd ed. Washington, DC: American Psychiatric Press; 1987.
8. Inderal LA (propranolol extended release) [package insert]. Cranford, NJ: Akrimax Pharmaceuticals; November 2015.
Valbenazine for tardive dyskinesia
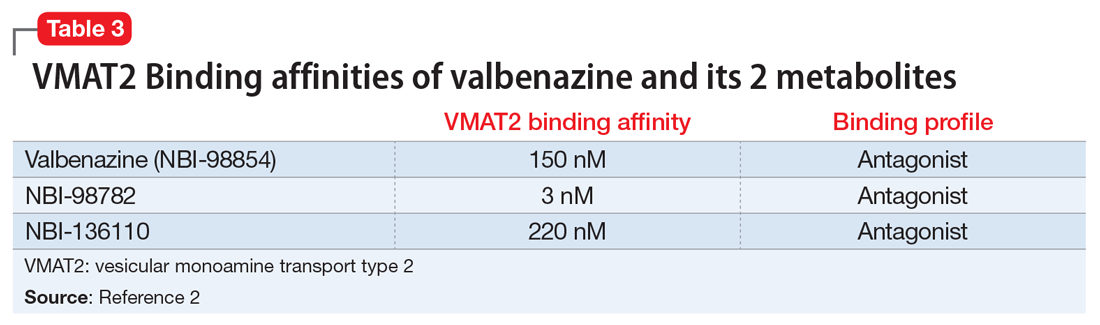
Despite improvements in the tolerability of antipsychotic medications, the development of tardive dyskinesia (TD) still is a significant area of concern; however, clinicians have had few treatment options. Valbenazine, a vesicular monoamine transport type 2 (VMAT2) inhibitor, is the only FDA-approved medication for TD (Table 1).1 By modulating dopamine transport into presynaptic vesicles, synaptic dopamine release is decreased, thereby reducing the postsynaptic stimulation of D2 receptors and the severity of dyskinetic movements.

In the pivotal 6-week clinical trial, valbenazine significantly reduced TD severity as measured by Abnormal Involuntary Movement Scale (AIMS) ratings.2 Study completion rates were high (87.6%), with only 2 dropouts because of adverse events in each of the placebo (n = 78) and 40-mg (n = 76) arms, and 3 in the 80-mg group (n = 80).
Before the development of valbenazine, tetrabenazine was the only effective option for treating TD. Despite tetrabenazine’s known efficacy for TD, it was not available in the United States until 2008 with the sole indication for movements related to Huntington’s disease. U.S. patients often were subjected to a litany of ineffective medications for TD, often at great expense. Moreover, tetrabenazine involved multiple daily dosing, required cytochrome P450 (CYP) 2D6 genotyping for doses >50 mg/d, had significant tolerability issues, and a monthly cost of $8,000 to $10,000. The availability of an agent that is effective for TD and does not have tetrabenazine’s kinetic limitations, adverse effect profile, or CYP2D6 monitoring requirements represents an enormous advance in the treatment of TD.
Clinical implications
Tardive dyskinesia remains a significant public health concern because of the increasing use of antipsychotics for disorders beyond the core indication for schizophrenia. Although exposure to dopamine D2 antagonism could result in postsynaptic receptor upregulation and supersensitivity, this process best explains what underlies withdrawal dyskinesia.3 The persistence of TD symptoms in 66% to 80% of patients after discontinuing offending agents has led to hypotheses that the underlying pathophysiology of TD might best be conceptualized as a problem with neuroplasticity. As with many disorders, environmental contributions (eg, oxidative stress) and genetic predisposition might play a role beyond that related to exposure to D2 antagonism.3
There have been trials of numerous agents, but no medication has been FDA-approved for treating TD, and limited data support the efficacy of a few existing medications (clonazepam, amantadine, and ginkgo biloba extract [EGb-761]),4 albeit with small effect sizes. A medical food, consisting of branched-chain amino acids, received FDA approval for the dietary management of TD in males, but is no longer commercially available except from compounding pharmacies.5
Tetrabenazine, a molecule developed in the mid-1950s to improve on the tolerability of reserpine, was associated with significant adverse effects such as orthostasis.6 Like reserpine, tetrabenazine subsequently was found to be effective for TD7 but without the peripheral adverse effects of reserpine. However, the kinetics of tetrabenazine necessitated multiple daily doses, and required CYP2D6 genotyping for doses >50 mg/d.8
Receptor blocking. The mechanism that differentiated reserpine’s and tetrabenazine’s clinical properties became clearer in the 1980s when researchers discovered that transporters were necessary to package neurotransmitters into the synaptic vesicles of presynaptic neurons.9 The vesicular monoamine transporter (VMAT) exists in 2 isoforms (VMAT1 and VMAT2) that vary in distribution, with VMAT1 expressed mainly in the peripheral nervous system and VMAT2 expressed mainly in monoaminergic cells of the central nervous system.10
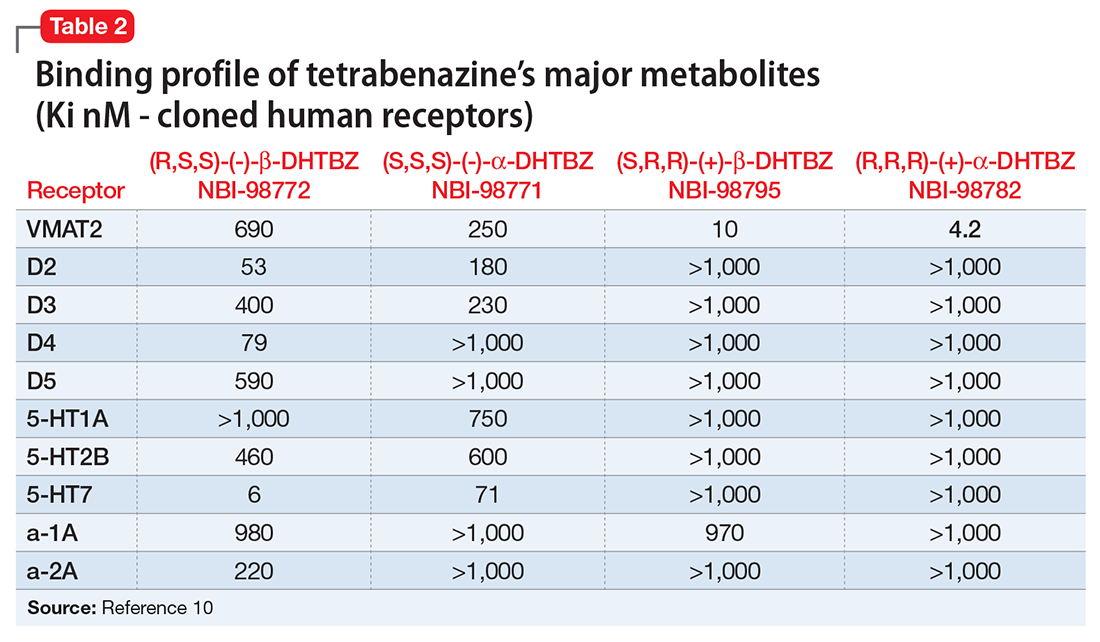
Tetrabenazine’s improved tolerability profile was related to the fact that it is a specific and reversible VMAT2 inhibitor, while reserpine is an irreversible and nonselective antagonist of both VMAT isoforms. Investigation of tetrabenazine’s metabolism revealed that it is rapidly and extensively converted into 2 isomers, α-dihydrotetrabenazine (DH-TBZ) and β-DH-TBZ. The isomeric forms of DH-TBZ have multiple chiral centers, and therefore numerous forms of which only 2 are significantly active at VMAT2.3 The α–DH-TBZ isomer is metabolized via CYP2D6 and 3A4 into inactive metabolites, while β-DH-TBZ is metabolized solely via 2D6.3 Because of the short half-life of DH-TBZ when generated from oral tetrabenazine, the existence of 2D6 polymorphisms, and the predominant activity deriving from only 2 isomers, a molecule was synthesized (valbenazine), that when metabolized would slowly be converted into the most active isomer of α–DH-TBZ designated as NBI-98782 (Table 2). This slower conversion to NBI-98782 from valbenazine (compared with its formation from oral tetrabenazine) yielded improved kinetics and permitted once-daily dosing; moreover, because the metabolism of NBI-98782 is not solely dependent on CYP2D6, the need for genotyping was removed. Neither of the 2 metabolites from valbenazine NBI-98782 and NB-136110 have significant affinity for targets other than VMAT2.11
Use in tardive dyskinesia. Recommended starting dosage is 40 mg once daily with or without food, increased to 80 mg after 1 week, based on the design and results from the phase-III clinical trial.12 The FDA granted breakthrough therapy designation for this compound, and only 1 phase-III trial was performed. Valbenazine produced significant improvement on the AIMS, with a mean 30% reduction in AIMS scores at the Week 6 endpoint from baseline of 10.4 ± 3.6.2 The effect size was large (Cohen’s d = 0.90) for the 80-mg dosage. Continuation of 40 mg/d may be considered for some patients based on tolerability, including those who are known CYP2D6 poor metabolizers, and those taking strong CYP2D6 inhibitors. Patients taking strong 3A4 inhibitors should not exceed 40 mg/d. The maximum daily dose is 40 mg for those who have moderate or severe hepatic impairment (Child-Pugh score, 7 to 15). Dosage adjustment is not required for mild to moderate renal impairment (creatinine clearance, 30 to 90 mL/min).
Pharmacologic profile, adverse reactions
Valbenazine and its 2 metabolites lack affinity for receptors other than VMAT2, leading to an absence of orthostasis in clinical trials.1,2 In the phase-II trial, 76% of participants receiving valbenazine (n = 51) were titrated to the maximum dosage of 75 mg/d. Common adverse reactions (incidence ≥5% and at least twice the rate of placebo) were headache (9.8% vs 4.1% placebo), fatigue (9.8% vs 4.1% placebo), and somnolence (5.9% vs 2% placebo).1 In the phase-III trial, participants were randomized 1:1:1 to valbenazine, 40 mg (n = 72), valbenazine, 80 mg (n = 79), or placebo (n = 76). In the clinical studies the most common diagnosis was schizophrenia or schizoaffective disorder, and 40% and 85% of participants in the phase-II and phase-III studies, respectively, remained on antipsychotics.1,2 There were no adverse effects with an incidence ≥5% and at least twice the rate of placebo in the phase-III trial.2
When data from all placebo-controlled studies were pooled, only 1 adverse effect occurred with an incidence ≥5% and twice that of placebo, somnolence with a rate of 10.9% for valbenazine vs 4.2% for placebo. The incidence of akathisia in the pooled analysis was 2.7% for valbenazine vs 0.5% for placebo. Importantly, in neither study was there a safety signal related to depression, suicidal ideation and behavior, or parkinsonism. There also were no clinically significant changes in measures of schizophrenia symptoms.
The mean QT prolongation for valbenazine in healthy participants was 6.7 milliseconds, with the upper bound of the double-sided 90% confidence interval reaching 8.4 milliseconds. For those taking strong 2D6 or 3A4 inhibitors, or known 2D6 poor metabolizers, the mean QT prolongation was 11.7 milliseconds (14.7 milliseconds upper bound of double-sided 90% CI). In the controlled trials, there was a dose-related increase in prolactin, alkaline phosphatase, and bilirubin. Overall, 3% of valbenazine-treated patients and 2% of placebo-treated patients discontinued because of adverse reactions.
As noted above, there were no adverse effects with an incidence ≥5% and at least twice the rate of placebo in the phase-III valbenazine trial. Aggregate data across all placebo-controlled studies found that somnolence was the only adverse effect that occurred with an incidence ≥5% and twice that of placebo (10.9% for valbenazine vs 4.2% for placebo).2 As a comparsion, rates of sedation and akathisia for tetrabenazine were higher in the pivotal Huntington’s disease trial: sedation/somnolence 31% vs 3% for placebo, and akathisia 19% vs 0% for placebo.8
How it works
Tetrabenazine, a selective VMAT2 inhibitor, is the only agent that has demonstrated significant efficacy and tolerability for TD management; however, its complex metabolism generates numerous isomers of the metabolites α-DH-TBZ and β-DH-TBZ, of which only 2 are significantly active (Table 3). By choosing an active isomer (NBI-98782) as the metabolite of interest because of its selective and potent activity at VMAT2 and having a metabolism not solely dependent on CYP2D6, a compound was generated (valbenazine) that when metabolized slowly converts into NBI-98782.
Pharmacokinetics
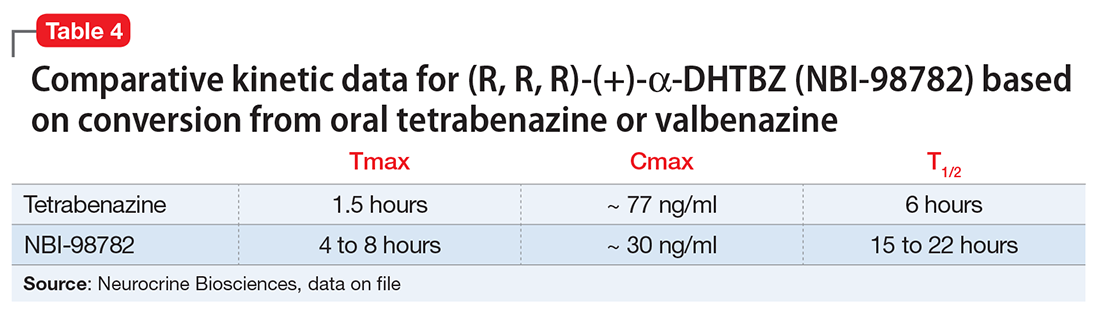
Valbenazine demonstrates dose-proportional pharmacokinetics after single oral dosages from 40 to 300 mg with no impact of food or fasting status on levels of the active metabolite. Valbenazine has a Tmax of 0.5 to 1.0 hours, with 49% oral bioavailability. The plasma half-life for valbenazine and for NBI-98782 ranges from 15 to 22 hours. The Tmax for NBI-98782 when formed from valbenazine occurs between 4 and 8 hours, with a Cmax of approximately 30 ng/mL. It should be noted that when NBI-98782 is generated from oral tetrabenazine, the mean half-life and Tmax are considerably shorter (6 hours and 1.5 hours, respectively), while the Cmax is much higher (approximately 77 ng/mL) (Table 4).
Valbenazine is metabolized through endogenous esterases to NBI-98782 and NBI-136110. NBI-98782, the active metabolite, is further metabolized through multiple CYP pathways, predominantly 3A4 and 2D6. Neither valbenazine nor its metabolites are inhibitors or inducers of major CYP enzymes. Aside from VMAT2, the results of in vitro studies suggest that valbenazine and its active metabolite are unlikely to inhibit most major drug transporters at clinically relevant concentrations. However, valbenazine increased digoxin levels because of inhibition of intestinal P-glycoprotein; therefore plasma digoxin level monitoring is recommended when these 2 are co-administered.
Efficacy
Efficacy was established in a 6-week, fixed-dosage, double-blind, placebo-controlled trial of adult patients with TD. Eligible participants had:
- DSM-IV diagnosis of antipsychotic-induced TD for ≥3 months before screening and moderate or severe TD, as indicated by AIMS item 8 (severity of abnormal movement), which was rated by a blinded, external reviewer using a video of the participant’s AIMS assessment at screening
- a DSM-IV diagnosis of schizophrenia or schizoaffective disorder or mood disorder (and stable per investigator)
- Brief Psychiatric Rating Scale score <50 at screening.
Exclusion criteria included clinically significant and unstable medical conditions within 1 month before screening; comorbid movement disorder (eg, parkinsonism, akathisia, truncal dystonia) that was more prominent than TD; and significant risk for active suicidal ideation, suicidal behavior, or violent behavior.2 Participants had a mean age of 56, 52% were male, and 65.7% of participants in the valbenazine 40-mg group had a schizophrenia spectrum disorder diagnosis, as did 65.8% in both the placebo and valbenazine 80-mg arms.
Antipsychotic treatments were permitted during the trial and >85% of participants continued taking these medications during the study. Participants (N = 234) were randomly allocated in a 1:1:1 manner to valbenazine 40 mg, 80 mg, or matched placebo. The primary outcome was change in AIMS total score (items 1 to 7) assessed by central, independent raters. Baseline AIMS scores were 9.9 ± 4.3 in the placebo group, and 9.8 ± 4.1 and 10.4 ± 3.6 in the valbenazine 40-mg and 80-mg arms, respectively.2
Outcome. A fixed-sequence testing procedure to control for family-wise error rate and multiplicity was employed, and the primary endpoint was change from baseline to Week 6 in AIMS total score (items 1 to 7) for valbenazine 80 mg vs placebo. Valbenazine, 40 mg, was associated with a 1.9 point decrease in AIMS score, while valbenazine, 80 mg, was associated with a 3.2 point decrease in AIMS score, compared with 0.1 point decrease for placebo (P < .05 for valbenazine, 40 mg, P < .001 for valbenazine, 80 mg). This difference for the 40-mg dosage did not meet the prespecified analysis endpoints; however, for the 80-mg valbenazine dosage, the effect size for this difference (Cohen’s d) was large 0.90. There also were statistically significant differences between 40 mg and 80 mg at weeks 2, 4, and 6 in the intent-to-treat population. Of the 79 participants, 43 taking the 80-mg dosage completed a 48-week extension. Efficacy was sustained in this group; however, when valbenazine was discontinued at Week 48, AIMS scores returned to baseline after 4 weeks.
Tolerability
Of the 234 randomized patients, 205 (87.6%) completed the 6-week trial. Discontinuations due to adverse events were low across all treatment groups: 2.6% and 2.8% in the placebo and valbenazine 40-mg arms, respectively, and 3.8% in valbenazine 80-mg cohort. There was no safety signal based on changes in depression, suicidality, parkinsonism rating, or changes in schizophrenia symptoms. Because valbenazine can cause somnolence, patients should not perform activities requiring mental alertness (eg, operating a vehicle or hazardous machinery) until they know how they will be affected by valbenazine.
Valbenazine should be avoided in patients with congenital long QT syndrome or with arrhythmias associated with a prolonged QT interval. For patients at increased risk of a prolonged QT interval, assess the QT interval before increasing the dosage.
Clinical considerations
Unique properties. Valbenazine is metabolized slowly to a potent, selective VMAT2 antagonist (NBI-98782) in a manner that permits once daily dosing, removes the need for CYP2D6 genotyping, and provides significant efficacy.
Why Rx? The reasons to prescribe valbenazine for TD patients include:
- currently the only agent with FDA approval for TD
- fewer tolerability issues seen with the only other effective agent, tetrabenazine
- no signal for effects on mood parameters or rates of parkinsonism
- lack of multiple daily dosing and possible need for 2D6 genotyping involved with TBZ prescribing.
Dosing
The recommended dosage of valbenazine is 80 mg/d administered as a single dose with or without food, starting at 40 mg once daily for 1 week. There is no dosage adjustment required in those with mild to moderate renal impairment; however, valbenazine is not recommended in those with severe renal impairment. The maximum dose is 40 mg/d for those who with moderate or severe hepatic impairment (Child-Pugh score, 7 to 15) however, valbenazine is not recommended for patients with severe renal impairment (creatinine clearance <30 mL/min) because the exposure to the active metabolite is reduced by approximately 75%. The combined efficacy and tolerability of dosages >80 mg/d has not been evaluated. Adverse effects seen with tetrabenazine at higher dosages include akathisia, anxiety, insomnia, parkinsonism, fatigue, and depression.
A daily dose of 40 mg may be considered for some patients based on tolerability, including those who are known CYP 2D6 poor metabolizers, and those taking strong CYP2D6 inhibitors.2 For those taking strong 3A4 inhibitors, the maximum daily dose is 40 mg. Concomitant use of valbenazine with strong 3A4 inducers is not recommended as the exposure to the active metabolite is reduced by approximately 75%.2 Lastly, because VMAT2 inhibition may alter synaptic levels of other monoamines, it is recommended that valbenazine not be administered with monoamine oxidase inhibitors, such as isocarboxazid, phenelzine, or selegiline.
Contraindications
There are no reported contraindications for valbenazine. As with most medications, there is limited available data on valbenazine use in pregnant women; however, administration of valbenazine to pregnant rats during organogenesis through lactation produced an increase in the number of stillborn pups and postnatal pup mortalities at doses under the maximum recommended human dose (MRHD) using body surface area based dosing (mg/m2). Pregnant women should be advised of the potential risk to a fetus. Valbenazine and its metabolites have been detected in rat milk at concentrations higher than in plasma after oral administration of valbenazine at doses 0.1 to 1.2 times the MRHD (based on mg/m2). Based on animal findings of increased perinatal mortality in exposed fetuses and pups, woman are advised not to breastfeed during valbenazine treatment and for 5 days after the final dose. No dosage adjustment is required for geriatric patients.
1. O’Brien CF, Jimenez R, Hauser RA, et al. NBI-98854, a selective monoamine transport inhibitor for the treatment of tardive dyskinesia: a randomized, double-blind, placebo-controlled study. Mov Disord. 2015;30(12):1681-1687.
2. Ingrezza [package insert]. San Diego, CA: Neurocrine Biosciences Inc.; 2017.
3. Marder S, Knesevich MA, Hauser RA, et al. KINECT 3: A randomized, double-blind, placebo-controlled phase 3 trial of valbenazine (NBI-98854) for tardive dyskinesia. Poster presented at the American Psychiatric Association Annual Meeting; May 14-18, 2016; Atlanta, GA.
4. Kazamatsuri H, Chien C, Cole JO. Treatment of tardive dyskinesia. I. Clinical efficacy of a dopamine-depleting agent, tetrabenazine. Arch Gen Psychiatry. 1972;27(1):95-99.
5. Richardson MA, Bevans ML, Read LL, et al. Efficacy of the branched-chain amino acids in the treatment of tardive dyskinesia in men. Am J Psychiatry. 2003;160(6):1117-1124.
6. Jankovic J, Clarence-Smith K. Tetrabenazine for the treatment of chorea and other hyperkinetic movement disorders. Expert Rev Neurother. 2011;11(11):1509-1523.
7. Meyer JM. Forgotten but not gone: new developments in the understanding and treatment of tardive dyskinesia. CNS Spectr. 2016;21(S1):13-24.
8. Bhidayasiri R, Fahn S, Weiner WJ, et al; American Academy of Neurology. Evidence-based guideline: treatment of tardive syndromes: report of the Guideline Development Subcommittee of the American Academy of Neurology. Neurology. 2013;81(5):463-469.
9. Quinn GP, Shore PA, Brodie BB. Biochemical and pharmacological studies of RO 1-9569 (tetrabenazine), a nonindole tranquilizing agent with reserpine-like effects. J Pharmacol Exp Ther. 1959;127:103-109.
10. Scherman D, Weber MJ. Characterization of the vesicular monoamine transporter in cultured rat sympathetic neurons: persistence upon induction of cholinergic phenotypic traits. Dev Biol. 1987;119(1):68-74.
11. Erickson JD, Schafer MK, Bonner TI, et al. Distinct pharmacological properties and distribution in neurons and endocrine cells of two isoforms of the human vesicular monoamine transporter. Proc Natl Acad Sci U S A. 1996;93(10):5166-5171.
12. Grigoriadis DE, Smith E, Madan A, et al. Pharmacologic characteristics of valbenazine (NBI-98854) and its metabolites. Poster presented at the U.S. Psychiatric & Mental Health Congress, October 21-24, 2016; San Antonio, TX.
Despite improvements in the tolerability of antipsychotic medications, the development of tardive dyskinesia (TD) still is a significant area of concern; however, clinicians have had few treatment options. Valbenazine, a vesicular monoamine transport type 2 (VMAT2) inhibitor, is the only FDA-approved medication for TD (Table 1).1 By modulating dopamine transport into presynaptic vesicles, synaptic dopamine release is decreased, thereby reducing the postsynaptic stimulation of D2 receptors and the severity of dyskinetic movements.
In the pivotal 6-week clinical trial, valbenazine significantly reduced TD severity as measured by Abnormal Involuntary Movement Scale (AIMS) ratings.2 Study completion rates were high (87.6%), with only 2 dropouts because of adverse events in each of the placebo (n = 78) and 40-mg (n = 76) arms, and 3 in the 80-mg group (n = 80).
Before the development of valbenazine, tetrabenazine was the only effective option for treating TD. Despite tetrabenazine’s known efficacy for TD, it was not available in the United States until 2008 with the sole indication for movements related to Huntington’s disease. U.S. patients often were subjected to a litany of ineffective medications for TD, often at great expense. Moreover, tetrabenazine involved multiple daily dosing, required cytochrome P450 (CYP) 2D6 genotyping for doses >50 mg/d, had significant tolerability issues, and a monthly cost of $8,000 to $10,000. The availability of an agent that is effective for TD and does not have tetrabenazine’s kinetic limitations, adverse effect profile, or CYP2D6 monitoring requirements represents an enormous advance in the treatment of TD.
Clinical implications
Tardive dyskinesia remains a significant public health concern because of the increasing use of antipsychotics for disorders beyond the core indication for schizophrenia. Although exposure to dopamine D2 antagonism could result in postsynaptic receptor upregulation and supersensitivity, this process best explains what underlies withdrawal dyskinesia.3 The persistence of TD symptoms in 66% to 80% of patients after discontinuing offending agents has led to hypotheses that the underlying pathophysiology of TD might best be conceptualized as a problem with neuroplasticity. As with many disorders, environmental contributions (eg, oxidative stress) and genetic predisposition might play a role beyond that related to exposure to D2 antagonism.3
There have been trials of numerous agents, but no medication has been FDA-approved for treating TD, and limited data support the efficacy of a few existing medications (clonazepam, amantadine, and ginkgo biloba extract [EGb-761]),4 albeit with small effect sizes. A medical food, consisting of branched-chain amino acids, received FDA approval for the dietary management of TD in males, but is no longer commercially available except from compounding pharmacies.5
Tetrabenazine, a molecule developed in the mid-1950s to improve on the tolerability of reserpine, was associated with significant adverse effects such as orthostasis.6 Like reserpine, tetrabenazine subsequently was found to be effective for TD7 but without the peripheral adverse effects of reserpine. However, the kinetics of tetrabenazine necessitated multiple daily doses, and required CYP2D6 genotyping for doses >50 mg/d.8
Receptor blocking. The mechanism that differentiated reserpine’s and tetrabenazine’s clinical properties became clearer in the 1980s when researchers discovered that transporters were necessary to package neurotransmitters into the synaptic vesicles of presynaptic neurons.9 The vesicular monoamine transporter (VMAT) exists in 2 isoforms (VMAT1 and VMAT2) that vary in distribution, with VMAT1 expressed mainly in the peripheral nervous system and VMAT2 expressed mainly in monoaminergic cells of the central nervous system.10
Tetrabenazine’s improved tolerability profile was related to the fact that it is a specific and reversible VMAT2 inhibitor, while reserpine is an irreversible and nonselective antagonist of both VMAT isoforms. Investigation of tetrabenazine’s metabolism revealed that it is rapidly and extensively converted into 2 isomers, α-dihydrotetrabenazine (DH-TBZ) and β-DH-TBZ. The isomeric forms of DH-TBZ have multiple chiral centers, and therefore numerous forms of which only 2 are significantly active at VMAT2.3 The α–DH-TBZ isomer is metabolized via CYP2D6 and 3A4 into inactive metabolites, while β-DH-TBZ is metabolized solely via 2D6.3 Because of the short half-life of DH-TBZ when generated from oral tetrabenazine, the existence of 2D6 polymorphisms, and the predominant activity deriving from only 2 isomers, a molecule was synthesized (valbenazine), that when metabolized would slowly be converted into the most active isomer of α–DH-TBZ designated as NBI-98782 (Table 2). This slower conversion to NBI-98782 from valbenazine (compared with its formation from oral tetrabenazine) yielded improved kinetics and permitted once-daily dosing; moreover, because the metabolism of NBI-98782 is not solely dependent on CYP2D6, the need for genotyping was removed. Neither of the 2 metabolites from valbenazine NBI-98782 and NB-136110 have significant affinity for targets other than VMAT2.11
Use in tardive dyskinesia. Recommended starting dosage is 40 mg once daily with or without food, increased to 80 mg after 1 week, based on the design and results from the phase-III clinical trial.12 The FDA granted breakthrough therapy designation for this compound, and only 1 phase-III trial was performed. Valbenazine produced significant improvement on the AIMS, with a mean 30% reduction in AIMS scores at the Week 6 endpoint from baseline of 10.4 ± 3.6.2 The effect size was large (Cohen’s d = 0.90) for the 80-mg dosage. Continuation of 40 mg/d may be considered for some patients based on tolerability, including those who are known CYP2D6 poor metabolizers, and those taking strong CYP2D6 inhibitors. Patients taking strong 3A4 inhibitors should not exceed 40 mg/d. The maximum daily dose is 40 mg for those who have moderate or severe hepatic impairment (Child-Pugh score, 7 to 15). Dosage adjustment is not required for mild to moderate renal impairment (creatinine clearance, 30 to 90 mL/min).
Pharmacologic profile, adverse reactions
Valbenazine and its 2 metabolites lack affinity for receptors other than VMAT2, leading to an absence of orthostasis in clinical trials.1,2 In the phase-II trial, 76% of participants receiving valbenazine (n = 51) were titrated to the maximum dosage of 75 mg/d. Common adverse reactions (incidence ≥5% and at least twice the rate of placebo) were headache (9.8% vs 4.1% placebo), fatigue (9.8% vs 4.1% placebo), and somnolence (5.9% vs 2% placebo).1 In the phase-III trial, participants were randomized 1:1:1 to valbenazine, 40 mg (n = 72), valbenazine, 80 mg (n = 79), or placebo (n = 76). In the clinical studies the most common diagnosis was schizophrenia or schizoaffective disorder, and 40% and 85% of participants in the phase-II and phase-III studies, respectively, remained on antipsychotics.1,2 There were no adverse effects with an incidence ≥5% and at least twice the rate of placebo in the phase-III trial.2
When data from all placebo-controlled studies were pooled, only 1 adverse effect occurred with an incidence ≥5% and twice that of placebo, somnolence with a rate of 10.9% for valbenazine vs 4.2% for placebo. The incidence of akathisia in the pooled analysis was 2.7% for valbenazine vs 0.5% for placebo. Importantly, in neither study was there a safety signal related to depression, suicidal ideation and behavior, or parkinsonism. There also were no clinically significant changes in measures of schizophrenia symptoms.
The mean QT prolongation for valbenazine in healthy participants was 6.7 milliseconds, with the upper bound of the double-sided 90% confidence interval reaching 8.4 milliseconds. For those taking strong 2D6 or 3A4 inhibitors, or known 2D6 poor metabolizers, the mean QT prolongation was 11.7 milliseconds (14.7 milliseconds upper bound of double-sided 90% CI). In the controlled trials, there was a dose-related increase in prolactin, alkaline phosphatase, and bilirubin. Overall, 3% of valbenazine-treated patients and 2% of placebo-treated patients discontinued because of adverse reactions.
As noted above, there were no adverse effects with an incidence ≥5% and at least twice the rate of placebo in the phase-III valbenazine trial. Aggregate data across all placebo-controlled studies found that somnolence was the only adverse effect that occurred with an incidence ≥5% and twice that of placebo (10.9% for valbenazine vs 4.2% for placebo).2 As a comparsion, rates of sedation and akathisia for tetrabenazine were higher in the pivotal Huntington’s disease trial: sedation/somnolence 31% vs 3% for placebo, and akathisia 19% vs 0% for placebo.8
How it works
Tetrabenazine, a selective VMAT2 inhibitor, is the only agent that has demonstrated significant efficacy and tolerability for TD management; however, its complex metabolism generates numerous isomers of the metabolites α-DH-TBZ and β-DH-TBZ, of which only 2 are significantly active (Table 3). By choosing an active isomer (NBI-98782) as the metabolite of interest because of its selective and potent activity at VMAT2 and having a metabolism not solely dependent on CYP2D6, a compound was generated (valbenazine) that when metabolized slowly converts into NBI-98782.
Pharmacokinetics
Valbenazine demonstrates dose-proportional pharmacokinetics after single oral dosages from 40 to 300 mg with no impact of food or fasting status on levels of the active metabolite. Valbenazine has a Tmax of 0.5 to 1.0 hours, with 49% oral bioavailability. The plasma half-life for valbenazine and for NBI-98782 ranges from 15 to 22 hours. The Tmax for NBI-98782 when formed from valbenazine occurs between 4 and 8 hours, with a Cmax of approximately 30 ng/mL. It should be noted that when NBI-98782 is generated from oral tetrabenazine, the mean half-life and Tmax are considerably shorter (6 hours and 1.5 hours, respectively), while the Cmax is much higher (approximately 77 ng/mL) (Table 4).
Valbenazine is metabolized through endogenous esterases to NBI-98782 and NBI-136110. NBI-98782, the active metabolite, is further metabolized through multiple CYP pathways, predominantly 3A4 and 2D6. Neither valbenazine nor its metabolites are inhibitors or inducers of major CYP enzymes. Aside from VMAT2, the results of in vitro studies suggest that valbenazine and its active metabolite are unlikely to inhibit most major drug transporters at clinically relevant concentrations. However, valbenazine increased digoxin levels because of inhibition of intestinal P-glycoprotein; therefore plasma digoxin level monitoring is recommended when these 2 are co-administered.
Efficacy
Efficacy was established in a 6-week, fixed-dosage, double-blind, placebo-controlled trial of adult patients with TD. Eligible participants had:
- DSM-IV diagnosis of antipsychotic-induced TD for ≥3 months before screening and moderate or severe TD, as indicated by AIMS item 8 (severity of abnormal movement), which was rated by a blinded, external reviewer using a video of the participant’s AIMS assessment at screening
- a DSM-IV diagnosis of schizophrenia or schizoaffective disorder or mood disorder (and stable per investigator)
- Brief Psychiatric Rating Scale score <50 at screening.
Exclusion criteria included clinically significant and unstable medical conditions within 1 month before screening; comorbid movement disorder (eg, parkinsonism, akathisia, truncal dystonia) that was more prominent than TD; and significant risk for active suicidal ideation, suicidal behavior, or violent behavior.2 Participants had a mean age of 56, 52% were male, and 65.7% of participants in the valbenazine 40-mg group had a schizophrenia spectrum disorder diagnosis, as did 65.8% in both the placebo and valbenazine 80-mg arms.
Antipsychotic treatments were permitted during the trial and >85% of participants continued taking these medications during the study. Participants (N = 234) were randomly allocated in a 1:1:1 manner to valbenazine 40 mg, 80 mg, or matched placebo. The primary outcome was change in AIMS total score (items 1 to 7) assessed by central, independent raters. Baseline AIMS scores were 9.9 ± 4.3 in the placebo group, and 9.8 ± 4.1 and 10.4 ± 3.6 in the valbenazine 40-mg and 80-mg arms, respectively.2
Outcome. A fixed-sequence testing procedure to control for family-wise error rate and multiplicity was employed, and the primary endpoint was change from baseline to Week 6 in AIMS total score (items 1 to 7) for valbenazine 80 mg vs placebo. Valbenazine, 40 mg, was associated with a 1.9 point decrease in AIMS score, while valbenazine, 80 mg, was associated with a 3.2 point decrease in AIMS score, compared with 0.1 point decrease for placebo (P < .05 for valbenazine, 40 mg, P < .001 for valbenazine, 80 mg). This difference for the 40-mg dosage did not meet the prespecified analysis endpoints; however, for the 80-mg valbenazine dosage, the effect size for this difference (Cohen’s d) was large 0.90. There also were statistically significant differences between 40 mg and 80 mg at weeks 2, 4, and 6 in the intent-to-treat population. Of the 79 participants, 43 taking the 80-mg dosage completed a 48-week extension. Efficacy was sustained in this group; however, when valbenazine was discontinued at Week 48, AIMS scores returned to baseline after 4 weeks.
Tolerability
Of the 234 randomized patients, 205 (87.6%) completed the 6-week trial. Discontinuations due to adverse events were low across all treatment groups: 2.6% and 2.8% in the placebo and valbenazine 40-mg arms, respectively, and 3.8% in valbenazine 80-mg cohort. There was no safety signal based on changes in depression, suicidality, parkinsonism rating, or changes in schizophrenia symptoms. Because valbenazine can cause somnolence, patients should not perform activities requiring mental alertness (eg, operating a vehicle or hazardous machinery) until they know how they will be affected by valbenazine.
Valbenazine should be avoided in patients with congenital long QT syndrome or with arrhythmias associated with a prolonged QT interval. For patients at increased risk of a prolonged QT interval, assess the QT interval before increasing the dosage.
Clinical considerations
Unique properties. Valbenazine is metabolized slowly to a potent, selective VMAT2 antagonist (NBI-98782) in a manner that permits once daily dosing, removes the need for CYP2D6 genotyping, and provides significant efficacy.
Why Rx? The reasons to prescribe valbenazine for TD patients include:
- currently the only agent with FDA approval for TD
- fewer tolerability issues seen with the only other effective agent, tetrabenazine
- no signal for effects on mood parameters or rates of parkinsonism
- lack of multiple daily dosing and possible need for 2D6 genotyping involved with TBZ prescribing.
Dosing
The recommended dosage of valbenazine is 80 mg/d administered as a single dose with or without food, starting at 40 mg once daily for 1 week. There is no dosage adjustment required in those with mild to moderate renal impairment; however, valbenazine is not recommended in those with severe renal impairment. The maximum dose is 40 mg/d for those who with moderate or severe hepatic impairment (Child-Pugh score, 7 to 15) however, valbenazine is not recommended for patients with severe renal impairment (creatinine clearance <30 mL/min) because the exposure to the active metabolite is reduced by approximately 75%. The combined efficacy and tolerability of dosages >80 mg/d has not been evaluated. Adverse effects seen with tetrabenazine at higher dosages include akathisia, anxiety, insomnia, parkinsonism, fatigue, and depression.
A daily dose of 40 mg may be considered for some patients based on tolerability, including those who are known CYP 2D6 poor metabolizers, and those taking strong CYP2D6 inhibitors.2 For those taking strong 3A4 inhibitors, the maximum daily dose is 40 mg. Concomitant use of valbenazine with strong 3A4 inducers is not recommended as the exposure to the active metabolite is reduced by approximately 75%.2 Lastly, because VMAT2 inhibition may alter synaptic levels of other monoamines, it is recommended that valbenazine not be administered with monoamine oxidase inhibitors, such as isocarboxazid, phenelzine, or selegiline.
Contraindications
There are no reported contraindications for valbenazine. As with most medications, there is limited available data on valbenazine use in pregnant women; however, administration of valbenazine to pregnant rats during organogenesis through lactation produced an increase in the number of stillborn pups and postnatal pup mortalities at doses under the maximum recommended human dose (MRHD) using body surface area based dosing (mg/m2). Pregnant women should be advised of the potential risk to a fetus. Valbenazine and its metabolites have been detected in rat milk at concentrations higher than in plasma after oral administration of valbenazine at doses 0.1 to 1.2 times the MRHD (based on mg/m2). Based on animal findings of increased perinatal mortality in exposed fetuses and pups, woman are advised not to breastfeed during valbenazine treatment and for 5 days after the final dose. No dosage adjustment is required for geriatric patients.
1. O’Brien CF, Jimenez R, Hauser RA, et al. NBI-98854, a selective monoamine transport inhibitor for the treatment of tardive dyskinesia: a randomized, double-blind, placebo-controlled study. Mov Disord. 2015;30(12):1681-1687.
2. Ingrezza [package insert]. San Diego, CA: Neurocrine Biosciences Inc.; 2017.
3. Marder S, Knesevich MA, Hauser RA, et al. KINECT 3: A randomized, double-blind, placebo-controlled phase 3 trial of valbenazine (NBI-98854) for tardive dyskinesia. Poster presented at the American Psychiatric Association Annual Meeting; May 14-18, 2016; Atlanta, GA.
4. Kazamatsuri H, Chien C, Cole JO. Treatment of tardive dyskinesia. I. Clinical efficacy of a dopamine-depleting agent, tetrabenazine. Arch Gen Psychiatry. 1972;27(1):95-99.
5. Richardson MA, Bevans ML, Read LL, et al. Efficacy of the branched-chain amino acids in the treatment of tardive dyskinesia in men. Am J Psychiatry. 2003;160(6):1117-1124.
6. Jankovic J, Clarence-Smith K. Tetrabenazine for the treatment of chorea and other hyperkinetic movement disorders. Expert Rev Neurother. 2011;11(11):1509-1523.
7. Meyer JM. Forgotten but not gone: new developments in the understanding and treatment of tardive dyskinesia. CNS Spectr. 2016;21(S1):13-24.
8. Bhidayasiri R, Fahn S, Weiner WJ, et al; American Academy of Neurology. Evidence-based guideline: treatment of tardive syndromes: report of the Guideline Development Subcommittee of the American Academy of Neurology. Neurology. 2013;81(5):463-469.
9. Quinn GP, Shore PA, Brodie BB. Biochemical and pharmacological studies of RO 1-9569 (tetrabenazine), a nonindole tranquilizing agent with reserpine-like effects. J Pharmacol Exp Ther. 1959;127:103-109.
10. Scherman D, Weber MJ. Characterization of the vesicular monoamine transporter in cultured rat sympathetic neurons: persistence upon induction of cholinergic phenotypic traits. Dev Biol. 1987;119(1):68-74.
11. Erickson JD, Schafer MK, Bonner TI, et al. Distinct pharmacological properties and distribution in neurons and endocrine cells of two isoforms of the human vesicular monoamine transporter. Proc Natl Acad Sci U S A. 1996;93(10):5166-5171.
12. Grigoriadis DE, Smith E, Madan A, et al. Pharmacologic characteristics of valbenazine (NBI-98854) and its metabolites. Poster presented at the U.S. Psychiatric & Mental Health Congress, October 21-24, 2016; San Antonio, TX.
Neuroscience-based Nomenclature: Classifying psychotropics by mechanism of action rather than indication
An important new initiative to reclassify psychiatric medications is underway. Currently, psychotropic drugs are named primarily for their clinical use, usually as a member of 1 of 6 classes: antipsychotic, anti‑depressant, mood stabilizer, stimulant, anxiolytic, and hypnotic.1,2
This naming system creates confusion because so-called antidepressants commonly are used as anxiolytics, antipsychotics increasingly are used as antidepressants, and so on.1,2
Vocabulary based on clinical indications also leads to difficulty in classifying new agents, especially those with novel mechanisms of action or clinical uses. Therefore, there is a need to make the names of psychotropic drugs more rational and scientifically based, rather than indication-based. A task force of experts from major psychopharmacology societies around the world is developing an alternative naming system that is increasingly being accepted by the major experts and journals throughout the world, called Neuroscience-based Nomenclature (NbN).3-5
So, what is NbN?

First and foremost, NbN renames the >100 known psychotropic drugs by 1 of the 11 principle pharmacological domains that include well-known terms such as serotonin dopamine, acetylcholine, and GABA (Table 1). Also included in NbN are 9 familiar modes of action, such as agonist, antagonist, reuptake inhibitor, and enzyme inhibitors (Table 2).3-5
NbN has 4 additional dimensions or layers3-5: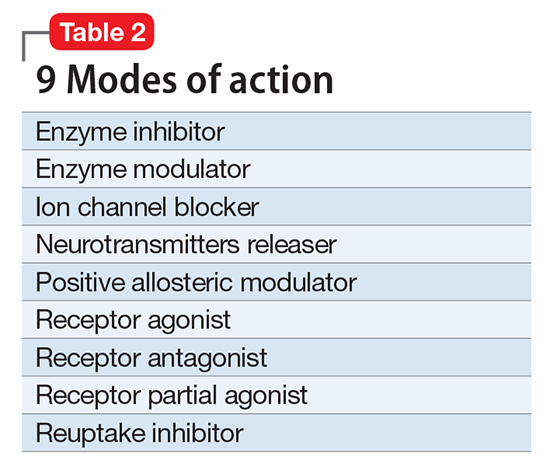
- The first layer enumerates the official indications as recognized by the regulatory agencies (ie, the FDA and other government organizations).
- The second layer states efficacy based on randomized controlled trials or substantial, evidence-based clinical data, as well as side effects (not the exhaustive list provided in manufacturers’ package inserts, but only the most common ones).
- The third layer is comprised of practical notes, highlighting potentially important drug interactions, metabolic issues, and specific warnings.
- The fourth section summarizes the neurobiological effects in laboratory animals and humans.
Specific dosages and titration regimens are not provided because they can vary among different countries, and NbN is intended for nomenclature and classification, not as a prescribing guide.
How does it work in practice?
Major journals in the field have begun adapting NbN for their published papers and
What is the current status?
Two international organizations endorse NbN, and the chief editors of nearly 3 dozen scientific journals, including
Clinicians should start adopting the NbN for the psychotropic drugs they prescribe every day. It is more scientific and consistent with the mechanism of action than with a specific disorder because many psychotropic medications have been found to be useful in >1 psychiatric disorder.
1. Nutt DJ. Beyond psychoanaleptics - can we improve antidepressant drug nomenclature? J Psychopharmacol. 2009;23(4):343-345.
2. Stahl SM. Classifying psychotropic drugs by mode of action not by target disorders. CNS Spectr. 2013;18(3):113-117.
3. Zohar J, Stahl S, Moller HJ, et al. A review of the current nomenclature for psychotropic agents and an introduction to the Neuroscience-based Nomenclature. Eur Neuropsychopharmacol. 2015; 25(12):2318-2325.
4. Zohar J, Stahl S, Moller HJ, et al. Neuroscience based nomenclature. Cambridge, United Kingdom: Cambridge University Press; 2014:254.
5. Neuroscience-based nomenclature. http://nbnomenclature.org. Accessed April 12, 2017.
An important new initiative to reclassify psychiatric medications is underway. Currently, psychotropic drugs are named primarily for their clinical use, usually as a member of 1 of 6 classes: antipsychotic, anti‑depressant, mood stabilizer, stimulant, anxiolytic, and hypnotic.1,2
This naming system creates confusion because so-called antidepressants commonly are used as anxiolytics, antipsychotics increasingly are used as antidepressants, and so on.1,2
Vocabulary based on clinical indications also leads to difficulty in classifying new agents, especially those with novel mechanisms of action or clinical uses. Therefore, there is a need to make the names of psychotropic drugs more rational and scientifically based, rather than indication-based. A task force of experts from major psychopharmacology societies around the world is developing an alternative naming system that is increasingly being accepted by the major experts and journals throughout the world, called Neuroscience-based Nomenclature (NbN).3-5
So, what is NbN?
First and foremost, NbN renames the >100 known psychotropic drugs by 1 of the 11 principle pharmacological domains that include well-known terms such as serotonin dopamine, acetylcholine, and GABA (Table 1). Also included in NbN are 9 familiar modes of action, such as agonist, antagonist, reuptake inhibitor, and enzyme inhibitors (Table 2).3-5
NbN has 4 additional dimensions or layers3-5:
- The first layer enumerates the official indications as recognized by the regulatory agencies (ie, the FDA and other government organizations).
- The second layer states efficacy based on randomized controlled trials or substantial, evidence-based clinical data, as well as side effects (not the exhaustive list provided in manufacturers’ package inserts, but only the most common ones).
- The third layer is comprised of practical notes, highlighting potentially important drug interactions, metabolic issues, and specific warnings.
- The fourth section summarizes the neurobiological effects in laboratory animals and humans.
Specific dosages and titration regimens are not provided because they can vary among different countries, and NbN is intended for nomenclature and classification, not as a prescribing guide.
How does it work in practice?
Major journals in the field have begun adapting NbN for their published papers and
What is the current status?
Two international organizations endorse NbN, and the chief editors of nearly 3 dozen scientific journals, including
Clinicians should start adopting the NbN for the psychotropic drugs they prescribe every day. It is more scientific and consistent with the mechanism of action than with a specific disorder because many psychotropic medications have been found to be useful in >1 psychiatric disorder.
1. Nutt DJ. Beyond psychoanaleptics - can we improve antidepressant drug nomenclature? J Psychopharmacol. 2009;23(4):343-345.
2. Stahl SM. Classifying psychotropic drugs by mode of action not by target disorders. CNS Spectr. 2013;18(3):113-117.
3. Zohar J, Stahl S, Moller HJ, et al. A review of the current nomenclature for psychotropic agents and an introduction to the Neuroscience-based Nomenclature. Eur Neuropsychopharmacol. 2015; 25(12):2318-2325.
4. Zohar J, Stahl S, Moller HJ, et al. Neuroscience based nomenclature. Cambridge, United Kingdom: Cambridge University Press; 2014:254.
5. Neuroscience-based nomenclature. http://nbnomenclature.org. Accessed April 12, 2017.

Suicide by cop: What motivates those who choose this method?
CASE Unresponsive and suicidal
Mr. Z, age 25, an unemployed immigrant from Eastern Europe, is found unresponsive at a subway station. Workup in the emergency room reveals a positive urine toxicology for benzodiazepines and a blood alcohol level of 101.6 mg/dL. When Mr. Z regains consciousness the next day, he says that he is suicidal. He recently broke up with his girlfriend and feels worthless, hopeless, and depressed. As a suicide attempt, he took quetiapine and diazepam chased with vodka.
Mr. Z reports a history of suicide attempts. He says he has been suffering from depression most of his life and has been diagnosed with bipolar I disorder and borderline personality disorder. His medication regimen consists of quetiapine, 200 mg/d, and duloxetine, 20 mg/d.
Before immigrating to the United States 5 years ago, he attempted to overdose on his mother’s prescribed diazepam and was in a coma for 2 days. Recently, he stole a bicycle with the intent of provoking the police to kill him. When caught, he deliberately disobeyed the officer’s order and advanced toward the officer in an aggressive manner. However, the officer stopped Mr. Z using a stun gun. Mr. Z reports that he still feels angry that his suicide attempt failed. He is an Orthodox Christian and says he is “very religious.”
[polldaddy:9731423]
The authors’ observations
The means of suicide differ among individuals. Some attempt suicide by themselves; others through the involuntary participation of others, such as the police. This is known as SBC. Other terms include “suicide by means of victim-precipitated homicide,”1 “hetero-suicide,”2 “suicide by proxy,”3 “copicide,”4 and “law enforcement-forced-assisted suicide.”5,6 SBC accounts for 10%7 to 36%6 of police shootings and can cause serious stress for the officers involved and creates a strain between the police and the community.8
SBC was first mentioned as “suicide by means of victim-precipitated homicide.” Wolfgang5 reported 588 cases of police officer-involved shooting in Philadelphia between January 1948 and December 31, 1952, and, concluded that 150 of these cases (26%) fit criteria for what the author termed “victim-precipitated homicide” because the victims involved were the direct precipitants of the situation leading to their death. Wolfgang stated:
Instead of a murderer performing the act of suicide by killing another person who represents the murder’s unconscious, and instead of a suicide representing the desire to kill turned on [the] self, the victim in these victim-precipitated homicide cases is considered to be a suicide prone [individual] who manifests his desire to destroy [him]self by engaging another person to perform the act.
The term “SBC” was coined in 1983 by Karl Harris, a Los Angeles County medical examiner.8 The social repercussions of this modality attracts media attention because of its negative social consequences.
Characteristics of SBC
SBC has characteristics similar to other means of suicide; it is more prevalent among men with psychiatric disorders, including major depression, bipolar disorders, schizophrenia, substance use disorders,9 poor stress response skills, recent stressors, and adverse life events,10 and history of suicide attempts.
Psychosocial characteristics include:
- mean age 31.8 years1
- male sex (98%)
- white (52%)
- approximately 40% involve some form of relationship conflict.6
In psychological autopsy studies, an estimated 70.5% of those involved in a SBC incident had ≥1 stressful life events,1 including terminal illness, loss of a job, a lawsuit, or domestic issues. However, the reason is unknown for the remaining 28% cases.2 Thirty-five percent of those involved in SBC incidents were married, 13.5% divorced, and 46.7% single.1 Seventy-seven percent had low socioeconomic status,11 with 49.3% unemployed at the time of the SBC incident.1
Pathological characteristics of SBC and other suicide means are similar. Among SBC cases, 39% had previously attempted suicide6; 56% have a psychiatric or chronic medical comorbidity. Alcohol and drug abuse were reported among 56% of individuals, and 66% had a criminal history.6 Additionally, comorbid psychiatric disorders, especially those of the impulsive and emotionally unstable types, such as borderline and antisocial personality disorder, have been found to play a major role in SBC incidents.12
Individual suicide vs SBC
Religious beliefs. The term “religiosity” is used to define an individual’s idiosyncratic religious belief or personal religious philosophy reconciling the concept of death by suicide and the afterlife. Although there are no studies that specifically reference the relationship between SBC and religiosity, religious belief and affiliation appear to be strong motivating factors. SBC victims might have an idiosyncratic view of religion related death by suicide. Whether suicide is performed while under delusional belief about God, the devil, or being possessed by demons,13 or to avoid the moral prohibition of most religious faiths in regard to suicide,6 the degree of religiosity in SBC is an important area for future research.
Mr. Z stated that his strong religious faith as an Orthodox Christian motivated the attempted SBC. He tried to provoke the officer to kill him, because as a devout Orthodox Christian, it is against his religious beliefs to kill himself. He reasoned that, because his beliefs preclude him from performing the suicidal act on his own,6,14 having an officer pull the trigger would relieve him from committing what he perceived as a sin.6
Lethal vs danger. Another difference is the level of urgency that individuals create around them when attempting SBC. Homant and Kennedy15 see this in terms of 2 ideas: lethal and danger. Lethal refers to the degree of harm posed toward the suicidal individual. Danger is the degree of harm posed by the suicidal individual toward others (ie, police officers, bystanders, hostages, family members, a spouse, etc.). SBC often is more dangerous and more lethal than other methods of suicide. SBC individuals might threaten the lives of others to provoke the police into using deadly force, such as aiming or brandishing a gun or weapon at police officers or bystanders, increasing the lethality and dangerousness of the situation. Individuals engaging in SBC might shoot or kill others to create a confrontation with the police in order to be killed in the process (Table16).
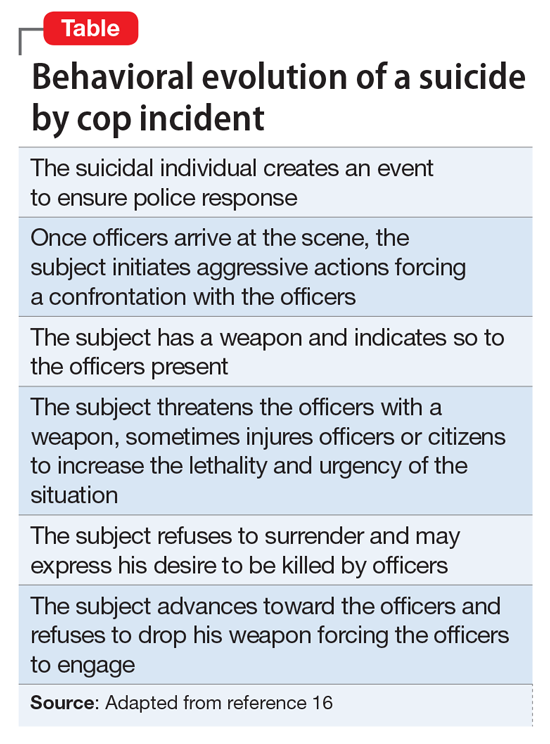
Instrumental vs expressive goals
Mohandie and Meloy6 identified 2 primary goals of those involved in SBC events: instrumental and expressive. Individuals in the instrumental category are:
- attempting to escape or avoid the consequences of criminal or shameful actions
- using the forced confrontation with police to reconcile a failed relationship
- hoping to avoid the exclusion clauses of life insurance policies
- rationalizing that while it may be morally wrong to commit suicide, being killed resolves the spiritual problem of suicide
- seeking what they believe to be a very effective and lethal means of accomplishing death.
An expressive goal is more personal and includes individuals who use the confrontation with the police to communicate:
- hopelessness, depression, and desperation
- a statement about their ultimate identification as victims
- their need to “save face” by dying or being forcibly overwhelmed rather than surrendering
- their intense power needs, rage, and revenge
- their need to draw attention to an important personal issue.
Mr. Z chose what he believed to be an efficiently lethal way of dying in accord with his religious faith, knowing that a confrontation with the police could have a fatal ending. This case represents an instrumental motivation to die by SBC that was religiously motivated.
[polldaddy:9731428]
The authors’ observations
SBC presents a specific and serious challenge for law enforcement personnel, and should be approached in a manner different than other crisis situations. Because many individuals engaging in SBC have a history of mental illness, officers with training in handling individuals with psychiatric disorders—known as Crisis Intervention Team (CIT) in many areas—should be deployed as first responders. CITs have been shown to:
- reduce arrest rates of individuals with psychiatric disorders
- increase referral rates to appropriate treatment
- decrease police injuries when responding to calls
- decrease the need for escalation with specialized tactical response teams, such as Special Weapons And Tactics.17
Identification of SBC behavior is crucial during police response. Indicators of a SBC include:
- refusal to comply with police order
- refusal to surrender
- lack of interest in getting out of a barricade or hostage situation alive.18
In approaching a SBC incident, responding officers should be non-confrontational and try to talk to the suicidal individual.8 If force is needed to resolve the crisis, non-lethal measures should be used first.8 Law enforcement and mental health professionals should suspect a SBC situation in individuals who have had prior police contact and are exhibiting behaviors outlined in the Table.16
Once suicidality is identified, it should be treated promptly. Patients who are at imminent risk to themselves or others should be hospitalized to maintain their safety. Similar to other suicide modalities, the primary risk factor for SBC is untreated or inadequately treated psychiatric illness. Therefore, the crux of managing SBC involves identifying and treating the underlying mental disorder.
Pharmacological treatment should be guided by the patient’s symptoms and psychiatric diagnosis. For suicidal behavior associated with bipolar depression and other affective disorders, lithium has evidence of reducing suicidality. Studies have shown a 5.5-fold reduction in suicide risk and a >13-fold reduction in completed suicides with lithium treatment.19 In patients with schizophrenia, clozapine has been shown to reduce suicide risk and is the only FDA-approved agent for this indication.19 Although antidepressants can effectively treat depression, there are no studies that show that 1 antidepressant is more effective than others in reducing suicidality. This might be because of the long latency period between treatment initiation and symptom relief. Ketamine, an N-methyl-
OUTCOME Medication adjustment
After Mr. Z is medically stable, he is voluntarily transferred to the inpatient psychiatric unit where he is stabilized on quetiapine, 200 mg/d, and duloxetine, 60 mg/d, and attends daily group activity, milieu, and individual therapy. Because of Mr. Z’s chronic affective instability and suicidality, we consider lithium for its anti-suicide effects, but decide against it because of lithium’s high lethality in an overdose and Mr. Z’s history of poor compliance and alcohol use.
Because of Mr. Z’s socioeconomic challenges, it is necessary to contact his extended family and social support system to be part of treatment and safety planning. After a week on the psychiatric unit, his mood symptoms stabilize and he is discharged to his family and friends in the area, with a short supply of quetiapine and duloxetine, and free follow-up care within 3 days of discharge. His mood is euthymic; his affect is broad range; his thought process is coherent and logical; he denies suicidal ideation; and can verbalize a logical and concrete safety plan. His support system assures us that Mr. Z will follow up with his appointments.
His DSM-522 discharge diagnoses are borderline personality disorder, bipolar I disorder, and suicidal behavior disorder, current.
The authors’ observations
SBC increases friction and mistrust between the police and the public, traumatizes officers who are forced to use deadly measures, and results in the death of the suicidal individual. As mental health professionals, we need to be aware of this form of suicide in our screening assessment. Training police to differentiate violent offenders from psychiatric patients could reduce the number of SBCs.9 As shown by the CIT model, educating officers on behaviors indicating a mental illness could lead to more psychiatric admissions rather than incarceration17 or death. We advocate for continuous collaborative work and cross training between the police and mental health professionals and for more research on the link between religiosity and the motivation to die by SBC, because there appears to be a not-yet quantified but strong link between them.
1. Hutson HR, Anglin D, Yarbrough J, et al. Suicide by cop. Ann Emerg Med. 1998;32(6):665-669.
2. Foote WE. Victim-precipitated homicide. In: Hall HV, ed. Lethal violence: a sourcebook on fatal domestic, acquaintance and stranger violence. London, United Kingdom: CRC Press; 1999:175-199.
3. Keram EA, Farrell BJ. Suicide by cop: issues in outcome and analysis. In: Sheehan DC, Warren JI, eds. Suicide and law enforcement. Quantico, VA: FBI Academy; 2001:587-597.
4. Violanti JM, Drylie JJ. Copicide: concepts, cases, and controversies of suicide by cop. Springfield, IL: Charles C Thomas Publisher, LTD; 2008.
5. Wolfgang ME. Suicide by means of victim-precipitated homicide. J Clin Exp Psychopathol Q Rev Psychiatry Neurol. 1959;20:335-349.
6. Mohandie K, Meloy JR. Clinical and forensic indicators of “suicide by cop.” J Forensic Sci. 2000;45(2):384-389.
7. Wright RK, Davis JH. Studies in the epidemiology of murder a proposed classification system. J Forensic Sci. 1977;22(2):464-470.
8. Miller L. Suicide by cop: causes, reactions, and practical intervention strategies. Int J Emerg Ment Health. 2006;8(3):165-174.
9. Dewey L, Allwood M, Fava J, et al. Suicide by cop: clinical risks and subtypes. Arch Suicide Res. 2013;17(4):448-461.
10. Foster T, Gillespie K, McClelland R, et al. Risk factors for suicide independent of DSM-III-R Axis I disorder. Case-control psychological autopsy study in Northern Ireland. Br J Psychiatry. 1999;175:175-179.
11. Lindsay M, Lester D. Criteria for suicide-by-cop incidents. Psychol Rep. 2008;102(2):603-605.
12. Cheng AT, Mann AH, Chan KA. Personality disorder and suicide. A case-control study. Br J Psychiatry. 1997;170:441-446.
13. Mohandie K, Meloy JR, Collins PI. Suicide by cop among officer‐involved shooting cases. J Forensic Sci. 2009;54(2):456-462.
14. Falk J, Riepert T, Rothschild MA. A case of suicide-by-cop. Leg Med (Tokyo). 2004;6(3):194-196.
15. Homant RJ, Kennedy DB. Suicide by police: a proposed typology of law enforcement officer-assisted suicide. Policing: An International Journal of Police Strategies & Management. 2000;23(3):339-355.
16. Lester D. Suicide as a staged performance. Comprehensive Psychology. 2015:4(1):1-6.
17. SpringerBriefs in psychology. Best practices for those with psychiatric disorder in the criminal justice system. In: Walker LE, Pann JM, Shapiro DL, et al. Best practices in law enforcement crisis Interventions with those with psychiatric disorder. 2015;11-18.
18. Homant RJ, Kennedy DB, Hupp R. Real and perceived danger in police officer assisted suicide. J Crim Justice. 2000;28(1):43-52.
19. Ernst CL, Goldberg JF. Antisuicide properties of psychotropic drugs: a critical review. Harv Review Psychiatry. 2004;12(1):14-41.
20. Al Jurdi RK, Swann A, Mathew SJ. Psychopharmacological agents and suicide risk reduction: ketamine and other approaches. Curr Psychiatry Rep. 2015;17(10):81.
21. Fink M, Kellner CH, McCall WV. The role of ECT in suicide prevention. Journal ECT. 2014;30(1):5-9.
22. Diagnostic and statistical manual of mental disorders, 5th ed. Washington, DC: American Psychiatric Association; 2013.
CASE Unresponsive and suicidal
Mr. Z, age 25, an unemployed immigrant from Eastern Europe, is found unresponsive at a subway station. Workup in the emergency room reveals a positive urine toxicology for benzodiazepines and a blood alcohol level of 101.6 mg/dL. When Mr. Z regains consciousness the next day, he says that he is suicidal. He recently broke up with his girlfriend and feels worthless, hopeless, and depressed. As a suicide attempt, he took quetiapine and diazepam chased with vodka.
Mr. Z reports a history of suicide attempts. He says he has been suffering from depression most of his life and has been diagnosed with bipolar I disorder and borderline personality disorder. His medication regimen consists of quetiapine, 200 mg/d, and duloxetine, 20 mg/d.
Before immigrating to the United States 5 years ago, he attempted to overdose on his mother’s prescribed diazepam and was in a coma for 2 days. Recently, he stole a bicycle with the intent of provoking the police to kill him. When caught, he deliberately disobeyed the officer’s order and advanced toward the officer in an aggressive manner. However, the officer stopped Mr. Z using a stun gun. Mr. Z reports that he still feels angry that his suicide attempt failed. He is an Orthodox Christian and says he is “very religious.”
[polldaddy:9731423]
The authors’ observations
The means of suicide differ among individuals. Some attempt suicide by themselves; others through the involuntary participation of others, such as the police. This is known as SBC. Other terms include “suicide by means of victim-precipitated homicide,”1 “hetero-suicide,”2 “suicide by proxy,”3 “copicide,”4 and “law enforcement-forced-assisted suicide.”5,6 SBC accounts for 10%7 to 36%6 of police shootings and can cause serious stress for the officers involved and creates a strain between the police and the community.8
SBC was first mentioned as “suicide by means of victim-precipitated homicide.” Wolfgang5 reported 588 cases of police officer-involved shooting in Philadelphia between January 1948 and December 31, 1952, and, concluded that 150 of these cases (26%) fit criteria for what the author termed “victim-precipitated homicide” because the victims involved were the direct precipitants of the situation leading to their death. Wolfgang stated:
Instead of a murderer performing the act of suicide by killing another person who represents the murder’s unconscious, and instead of a suicide representing the desire to kill turned on [the] self, the victim in these victim-precipitated homicide cases is considered to be a suicide prone [individual] who manifests his desire to destroy [him]self by engaging another person to perform the act.
The term “SBC” was coined in 1983 by Karl Harris, a Los Angeles County medical examiner.8 The social repercussions of this modality attracts media attention because of its negative social consequences.
Characteristics of SBC
SBC has characteristics similar to other means of suicide; it is more prevalent among men with psychiatric disorders, including major depression, bipolar disorders, schizophrenia, substance use disorders,9 poor stress response skills, recent stressors, and adverse life events,10 and history of suicide attempts.
Psychosocial characteristics include:
- mean age 31.8 years1
- male sex (98%)
- white (52%)
- approximately 40% involve some form of relationship conflict.6
In psychological autopsy studies, an estimated 70.5% of those involved in a SBC incident had ≥1 stressful life events,1 including terminal illness, loss of a job, a lawsuit, or domestic issues. However, the reason is unknown for the remaining 28% cases.2 Thirty-five percent of those involved in SBC incidents were married, 13.5% divorced, and 46.7% single.1 Seventy-seven percent had low socioeconomic status,11 with 49.3% unemployed at the time of the SBC incident.1
Pathological characteristics of SBC and other suicide means are similar. Among SBC cases, 39% had previously attempted suicide6; 56% have a psychiatric or chronic medical comorbidity. Alcohol and drug abuse were reported among 56% of individuals, and 66% had a criminal history.6 Additionally, comorbid psychiatric disorders, especially those of the impulsive and emotionally unstable types, such as borderline and antisocial personality disorder, have been found to play a major role in SBC incidents.12
Individual suicide vs SBC
Religious beliefs. The term “religiosity” is used to define an individual’s idiosyncratic religious belief or personal religious philosophy reconciling the concept of death by suicide and the afterlife. Although there are no studies that specifically reference the relationship between SBC and religiosity, religious belief and affiliation appear to be strong motivating factors. SBC victims might have an idiosyncratic view of religion related death by suicide. Whether suicide is performed while under delusional belief about God, the devil, or being possessed by demons,13 or to avoid the moral prohibition of most religious faiths in regard to suicide,6 the degree of religiosity in SBC is an important area for future research.
Mr. Z stated that his strong religious faith as an Orthodox Christian motivated the attempted SBC. He tried to provoke the officer to kill him, because as a devout Orthodox Christian, it is against his religious beliefs to kill himself. He reasoned that, because his beliefs preclude him from performing the suicidal act on his own,6,14 having an officer pull the trigger would relieve him from committing what he perceived as a sin.6
Lethal vs danger. Another difference is the level of urgency that individuals create around them when attempting SBC. Homant and Kennedy15 see this in terms of 2 ideas: lethal and danger. Lethal refers to the degree of harm posed toward the suicidal individual. Danger is the degree of harm posed by the suicidal individual toward others (ie, police officers, bystanders, hostages, family members, a spouse, etc.). SBC often is more dangerous and more lethal than other methods of suicide. SBC individuals might threaten the lives of others to provoke the police into using deadly force, such as aiming or brandishing a gun or weapon at police officers or bystanders, increasing the lethality and dangerousness of the situation. Individuals engaging in SBC might shoot or kill others to create a confrontation with the police in order to be killed in the process (Table16).
Instrumental vs expressive goals
Mohandie and Meloy6 identified 2 primary goals of those involved in SBC events: instrumental and expressive. Individuals in the instrumental category are:
- attempting to escape or avoid the consequences of criminal or shameful actions
- using the forced confrontation with police to reconcile a failed relationship
- hoping to avoid the exclusion clauses of life insurance policies
- rationalizing that while it may be morally wrong to commit suicide, being killed resolves the spiritual problem of suicide
- seeking what they believe to be a very effective and lethal means of accomplishing death.
An expressive goal is more personal and includes individuals who use the confrontation with the police to communicate:
- hopelessness, depression, and desperation
- a statement about their ultimate identification as victims
- their need to “save face” by dying or being forcibly overwhelmed rather than surrendering
- their intense power needs, rage, and revenge
- their need to draw attention to an important personal issue.
Mr. Z chose what he believed to be an efficiently lethal way of dying in accord with his religious faith, knowing that a confrontation with the police could have a fatal ending. This case represents an instrumental motivation to die by SBC that was religiously motivated.
[polldaddy:9731428]
The authors’ observations
SBC presents a specific and serious challenge for law enforcement personnel, and should be approached in a manner different than other crisis situations. Because many individuals engaging in SBC have a history of mental illness, officers with training in handling individuals with psychiatric disorders—known as Crisis Intervention Team (CIT) in many areas—should be deployed as first responders. CITs have been shown to:
- reduce arrest rates of individuals with psychiatric disorders
- increase referral rates to appropriate treatment
- decrease police injuries when responding to calls
- decrease the need for escalation with specialized tactical response teams, such as Special Weapons And Tactics.17
Identification of SBC behavior is crucial during police response. Indicators of a SBC include:
- refusal to comply with police order
- refusal to surrender
- lack of interest in getting out of a barricade or hostage situation alive.18
In approaching a SBC incident, responding officers should be non-confrontational and try to talk to the suicidal individual.8 If force is needed to resolve the crisis, non-lethal measures should be used first.8 Law enforcement and mental health professionals should suspect a SBC situation in individuals who have had prior police contact and are exhibiting behaviors outlined in the Table.16
Once suicidality is identified, it should be treated promptly. Patients who are at imminent risk to themselves or others should be hospitalized to maintain their safety. Similar to other suicide modalities, the primary risk factor for SBC is untreated or inadequately treated psychiatric illness. Therefore, the crux of managing SBC involves identifying and treating the underlying mental disorder.
Pharmacological treatment should be guided by the patient’s symptoms and psychiatric diagnosis. For suicidal behavior associated with bipolar depression and other affective disorders, lithium has evidence of reducing suicidality. Studies have shown a 5.5-fold reduction in suicide risk and a >13-fold reduction in completed suicides with lithium treatment.19 In patients with schizophrenia, clozapine has been shown to reduce suicide risk and is the only FDA-approved agent for this indication.19 Although antidepressants can effectively treat depression, there are no studies that show that 1 antidepressant is more effective than others in reducing suicidality. This might be because of the long latency period between treatment initiation and symptom relief. Ketamine, an N-methyl-
OUTCOME Medication adjustment
After Mr. Z is medically stable, he is voluntarily transferred to the inpatient psychiatric unit where he is stabilized on quetiapine, 200 mg/d, and duloxetine, 60 mg/d, and attends daily group activity, milieu, and individual therapy. Because of Mr. Z’s chronic affective instability and suicidality, we consider lithium for its anti-suicide effects, but decide against it because of lithium’s high lethality in an overdose and Mr. Z’s history of poor compliance and alcohol use.
Because of Mr. Z’s socioeconomic challenges, it is necessary to contact his extended family and social support system to be part of treatment and safety planning. After a week on the psychiatric unit, his mood symptoms stabilize and he is discharged to his family and friends in the area, with a short supply of quetiapine and duloxetine, and free follow-up care within 3 days of discharge. His mood is euthymic; his affect is broad range; his thought process is coherent and logical; he denies suicidal ideation; and can verbalize a logical and concrete safety plan. His support system assures us that Mr. Z will follow up with his appointments.
His DSM-522 discharge diagnoses are borderline personality disorder, bipolar I disorder, and suicidal behavior disorder, current.
The authors’ observations
SBC increases friction and mistrust between the police and the public, traumatizes officers who are forced to use deadly measures, and results in the death of the suicidal individual. As mental health professionals, we need to be aware of this form of suicide in our screening assessment. Training police to differentiate violent offenders from psychiatric patients could reduce the number of SBCs.9 As shown by the CIT model, educating officers on behaviors indicating a mental illness could lead to more psychiatric admissions rather than incarceration17 or death. We advocate for continuous collaborative work and cross training between the police and mental health professionals and for more research on the link between religiosity and the motivation to die by SBC, because there appears to be a not-yet quantified but strong link between them.
1. Hutson HR, Anglin D, Yarbrough J, et al. Suicide by cop. Ann Emerg Med. 1998;32(6):665-669.
2. Foote WE. Victim-precipitated homicide. In: Hall HV, ed. Lethal violence: a sourcebook on fatal domestic, acquaintance and stranger violence. London, United Kingdom: CRC Press; 1999:175-199.
3. Keram EA, Farrell BJ. Suicide by cop: issues in outcome and analysis. In: Sheehan DC, Warren JI, eds. Suicide and law enforcement. Quantico, VA: FBI Academy; 2001:587-597.
4. Violanti JM, Drylie JJ. Copicide: concepts, cases, and controversies of suicide by cop. Springfield, IL: Charles C Thomas Publisher, LTD; 2008.
5. Wolfgang ME. Suicide by means of victim-precipitated homicide. J Clin Exp Psychopathol Q Rev Psychiatry Neurol. 1959;20:335-349.
6. Mohandie K, Meloy JR. Clinical and forensic indicators of “suicide by cop.” J Forensic Sci. 2000;45(2):384-389.
7. Wright RK, Davis JH. Studies in the epidemiology of murder a proposed classification system. J Forensic Sci. 1977;22(2):464-470.
8. Miller L. Suicide by cop: causes, reactions, and practical intervention strategies. Int J Emerg Ment Health. 2006;8(3):165-174.
9. Dewey L, Allwood M, Fava J, et al. Suicide by cop: clinical risks and subtypes. Arch Suicide Res. 2013;17(4):448-461.
10. Foster T, Gillespie K, McClelland R, et al. Risk factors for suicide independent of DSM-III-R Axis I disorder. Case-control psychological autopsy study in Northern Ireland. Br J Psychiatry. 1999;175:175-179.
11. Lindsay M, Lester D. Criteria for suicide-by-cop incidents. Psychol Rep. 2008;102(2):603-605.
12. Cheng AT, Mann AH, Chan KA. Personality disorder and suicide. A case-control study. Br J Psychiatry. 1997;170:441-446.
13. Mohandie K, Meloy JR, Collins PI. Suicide by cop among officer‐involved shooting cases. J Forensic Sci. 2009;54(2):456-462.
14. Falk J, Riepert T, Rothschild MA. A case of suicide-by-cop. Leg Med (Tokyo). 2004;6(3):194-196.
15. Homant RJ, Kennedy DB. Suicide by police: a proposed typology of law enforcement officer-assisted suicide. Policing: An International Journal of Police Strategies & Management. 2000;23(3):339-355.
16. Lester D. Suicide as a staged performance. Comprehensive Psychology. 2015:4(1):1-6.
17. SpringerBriefs in psychology. Best practices for those with psychiatric disorder in the criminal justice system. In: Walker LE, Pann JM, Shapiro DL, et al. Best practices in law enforcement crisis Interventions with those with psychiatric disorder. 2015;11-18.
18. Homant RJ, Kennedy DB, Hupp R. Real and perceived danger in police officer assisted suicide. J Crim Justice. 2000;28(1):43-52.
19. Ernst CL, Goldberg JF. Antisuicide properties of psychotropic drugs: a critical review. Harv Review Psychiatry. 2004;12(1):14-41.
20. Al Jurdi RK, Swann A, Mathew SJ. Psychopharmacological agents and suicide risk reduction: ketamine and other approaches. Curr Psychiatry Rep. 2015;17(10):81.
21. Fink M, Kellner CH, McCall WV. The role of ECT in suicide prevention. Journal ECT. 2014;30(1):5-9.
22. Diagnostic and statistical manual of mental disorders, 5th ed. Washington, DC: American Psychiatric Association; 2013.
Opioid abuse
The video associated with this article is no longer available on this site. Please view all of our videos on the MDedge YouTube channel
The video associated with this article is no longer available on this site. Please view all of our videos on the MDedge YouTube channel
The video associated with this article is no longer available on this site. Please view all of our videos on the MDedge YouTube channel