User login
The End of a Season
Spring, it symbolizes a new beginning. The smell of fresh cut grass hangs in the air, and it’s my favorite time of the sports year. A new season has begun in baseball, and the NHL and NBA playoffs are underway. As a new season begins, two more draw to a close. In this fan’s opinion, there is nothing quite as exciting as playoff hockey, and this month AJO hopes to “Capital-ize” on that excitement by presenting the hockey issue.
In “The Ice Hockey Issue”, Popkin and colleagues present a review of upper extremity injuries in hockey, which will serve as a guide for sports medicine physicians covering hockey games. There’s even a segment covering dental and ocular injuries, in case you don’t have a dentist or ophthalmologist handy. While we typically no longer publish case reports, Degen and colleagues present a unique report detailing an unusual injury to a prominent NHL goaltender. AJO presents it to expand your diagnostic differential for neck injuries.
I had another reason in mind when I mentioned the end of a season in this month’s editorial. The new AJO has seen a lot of changes, and it is our Editorial Team’s goal to continuously improve the journal and to provide timely features that are directly relevant to your practice. We’ve updated our website, and we’ve added some features, such as QR codes and take-home points, to improve your reading experience. But our ability to further enhance the journal is limited in print, and our web statistics show that a large percentage of our readers view the articles on their smartphones.
As I’ve written before, these are challenging times for printed media. The digital age has arrived and technology has made traditional publications less appealing. Our younger readers now demand a portable, electronic, media-rich publication that provides information that directly benefits their practices. To provide this, we envision a digital journal that is immersed in a learning environment, with videos, technique guides, and supplementary materials just a click away.
A few months back, AJO tested the digital waters. Our trial met with a positive response, and so, it is with great excitement that we announce that beginning in 2018, AJO will be the first orthopedic journal to go “All Digital.”
To further our goal of creating material that directly impacts your practice, we will present each feature review article as a learning module. The articles will feature extensive photos and videos, PowerPoint presentations for download, test questions, and patient information sheets. We will publish authors’ preference cards and postoperative protocols.
We’re currently developing applications and tools to improve your interactive experience. In the coming months, look for announcements regarding new strategic partnerships and features that will become mainstays of our electronic environment.
I hope you share the excitement of a new beginning in the digital era. I know the transition will provide a greatly enhanced, valuable resource that will change the way we utilize journals in our practice.
Am J Orthop. 2017;46(3):122. Copyright Frontline Medical Communications Inc. 2017. All rights reserved.

Head, Neck, and Shoulder Injuries in Ice Hockey: Current Concepts
Take-Home Points
- Hockey is a high-speed collision sport with one of the highest injury rates among all sports.
- Use of a helmet with visors or full-face shields significantly reduces the risk for eye injury.
- Broken portions of teeth should be found and placed in a protective medium such as saline, saliva, or milk for transport.
- A player with unresolved concussion symptoms should not be allowed to return to the ice.
- Shoulder dominance, which determines stick grip, is an important consideration in the treatment of shoulder instability in an ice hockey player.
On a surface of ice in Windsor, Nova Scotia in the middle of the 19th century, the modern game of ice hockey evolved.1 A blend of hurley, a Gaelic sport, and lacrosse, from the native Mi’kmaq culture, the sport of ice hockey gained rapidly in popularity throughout Canada and is now the country’s national sport. Hockey quickly spread to the United States and then Europe. It is presently played in 77 countries across the world.2
Hockey players can reach speeds of up to 48 km (~30 miles) per hour on razor-sharp skates on an ice surface surrounded by rigid plastic composite boards topped with plexiglass.3 They use sticks made of wood, aluminum, or a composite material to advance a 6-ounce vulcanized rubber puck on the opposing goal, and this puck sometimes reaches speeds over 160 km (~100 miles) per hour. Older, male players are allowed to make physical contact with their opposing counterparts to separate them from the puck (body-checking). Not surprisingly, the potential risk for injury in hockey is high. At the 2010 Winter Olympics, men’s ice hockey players had the highest rate of injury of any other competitors there—more than 30% were affected.4 
Hockey is played and enjoyed by athletes ranging widely in age. Youth hockey leagues accept players as young as 5 years. Hockey can become a lifelong recreational activity. In North America, old timers’ leagues have many players up to age 70 years.6 According to International Ice Hockey Federation data for 2016, more than 543,000 and 639,500 people play hockey in the United States and Canada, respectively.2 Most of the rules, protective equipment, skates, ice surfaces, and goal sizes are the same in men’s and women’s hockey.7 The major difference is in body-checking—this practice is not allowed at any age in women’s ice hockey.
In this article, we review the evaluation and management of common head, neck, and shoulder hockey injuries for physicians who provide medical support and coverage for youth, amateur, and senior hockey teams.
Evaluation and Management of Common Hockey Injuries
Eye Injuries
Although eye injuries are less common than musculoskeletal injuries and concussions in hockey, they are a serious risk for recreational and competitive players alike. Furthermore, recovery may be difficult, and eye injuries can have serious lifelong consequences.8 In hockey, the most commonly reported eye injuries are periorbital contusions and lacerations, hyphema, corneal and conjunctival abrasions, orbital fractures, and ruptured globes (Table 2).9,10 
As a contact sport, hockey often involves high-impact, blunt-force trauma. The trauma in hockey results from collisions with other players, the boards, hockey sticks, and pucks. It is therefore not surprising that the most common ocular injuries in this sport are periorbital contusions. Although most contusions cause only mild swelling and ecchymosis of the soft tissues around the eye, there is potential for serious consequences. In a Scandinavia study, Leivo and colleagues10 found that 9% of patients who sustained a periocular contusion also had a clinically significant secondary diagnosis, such as retinal tear or hemorrhage, eyelid laceration, vitreous hemorrhage, or retinal detachment. Although the study was hospital-based, and therefore biased toward more severe cases, its findings highlight the potential severity of eye injuries in hockey. Furthermore, the study found that the majority of players who sustained blunt trauma to the eye itself required lifelong follow-up because of increased risk for glaucoma. This is particularly true for hyphema, as this finding indicates significant damage to intraocular tissues.10Players can also sustain fractures of the orbital bones, including orbital blowout fractures. Typical signs and symptoms of blowout fractures include diplopia, proptosis or enophthalmos, infraorbital hypoesthesia, painful and decreased extraocular movement (particularly upgaze), and palpable crepitance caused by sinus air entering the lower eyelid.11 If orbital fracture is suspected, as it should be in any case in which the injured player experiences pain with eye movement or diplopia, the player should be referred to the ED for computed tomography (CT) and ophthalmologic evaluation.12 Continued participation seriously risks making the injury much worse, particularly should another impact occur. In addition, given the impact needed to cause orbital fractures, consideration must be given to the potential for a coexisting concussion injury.
Severe direct trauma to the eye—from a puck, a stick, or a fist—can result in a ruptured globe, a particularly serious injury that requires immediate surgical attention. Signs and symptoms of a ruptured globe are rarely subtle, but associated eyelid swelling or laceration may obscure the injury, delaying proper diagnosis and treatment. More obvious signs include severely reduced vision, hemorrhagic chemosis (swelling) of the conjunctiva, and an irregular or peaked pupil. If a rupture or any significant intraocular injury is suspected, it is crucial to avoid applying any pressure to the globe, as this can significantly worsen the damage to the intraocular tissues. Use of a helmet with protective shields and cages attached markedly reduces the risk for such injuries.13All eye injuries require prompt assessment, which allows for appropriate management and prevention of secondary damage.14 Initial evaluation of a patient with ocular trauma should begin with external examination for lacerations, swelling, or orbital rim step-off deformity. The physician should also check visual acuity in order to assess for significant vision impairment (counting fingers or reading a sign in the arena; confrontation visual fields). This should be done before attending to any periocular injuries, with the uninjured side serving as a control. Next, the physician should assess the extraocular eye movements as well as the size, shape, and reactivity of the pupils. Particular attention should be paid to detecting any deficit in extraocular movement or irregularity in pupil size, shape, or reactivity, as such findings are highly suggestive of serious injury to the globe.13 Hyphema (blood in anterior chamber of eye anterior to pupil) should be suspected if vision is reduced and the pupil cannot be clearly visualized. However, a bright red clot is not always apparent at time of injury or if the amount of blood is small. An irregular pupil, or a pupil that does not constrict well to light, is also a red flag for serious contusion injury to the eye, and requires ophthalmologic evaluation. It is important to keep in mind that blunt trauma severe enough to produce hyphema or an irregular and poorly reactive pupil is often associated with retinal damage as well, including retinal edema or detachment.
Minor injuries (eg, small foreign bodies, minor periocular contusions and lacerations) can often be managed rink-side. Foreign bodies not embedded in the cornea, but lodged under the upper eyelid, can sometimes be removed by everting the eyelid and sweeping with a moistened cotton swab or using diffuse, sterile saline irrigation.11 Corneal abrasions generally cause severe pain, photophobia, and tearing and are easily diagnosed with use of topical fluorescein and a blue light. A topical anesthetic can be extremely helpful in this setting, as it allows for proper pain-free evaluation, but should never be used in an ongoing manner for pain relief. Small lacerations of the brow can be sutured with 5-0 or 6-0 nylon or closed with 2-Octyl cyanoacrylate tissue adhesive (Dermabond). Eyelid lacerations, unless very small, are best managed by an ophthalmologist; care must be taken to rule out injury to the deeper orbital tissues and eye. If serious injury is suspected, or the eye cannot be appropriately evaluated, it should be stabilized and protected with a protective shield or plastic cup, and the player should be transferred to an ED for appropriate ophthalmologic evaluation.13Most eye injuries are accidental, caused by sticks or deflected pucks, but 18% are acquired in fights.8 Use of visors or full-face cages effectively minimizes the rate of eye injuries.8,13,15,16 In a cohort study of 282 elite amateur ice hockey players, the risk of eye injury was 4.7 times higher in players without face protection than in players who used half-face shields; there were no eye injuries in players who used full-face protection.13 For visors to prevent eye injury, they must be positioned to cover the eyes and the lower edge of the nose in all projections.10
Dental Injuries
The incidence and type of facial and dental injuries depend directly on the type of face protection used.11,17,18 In a study of face, head, and neck injuries in elite amateur ice hockey players, Stuart and colleagues13 found game-related injury rates of 158.9 per 1000 player-hours in players without face protection, 73.5 in players who used half-face shields, and 23.2 in players who used full-face shields. Players who wore full-face shields had facial, head, and neck injury rates of only 23.2 per 1000 player-game hours.13 Other studies clearly support the important role face shields play in lowering injury risk in hockey. Face and head injuries account for 20% to 40% of all hockey-related injuries,3,16,19 and dental injuries up to 11.5%.20 In a study from Finland, Lahti and colleagues19 found that over a 2-year period, 479 hockey players sustained injuries, including 650 separate dental injuries. The most commonly diagnosed dental injury was an uncomplicated crown fracture, and the most common cause was a hit with a hockey stick, which accounted for 52.7% and 40.3% of dental injuries in games and practices, respectively.19
In the management of dental fractures, the broken portions of teeth should be found and placed in a transportation-protective medium, such as saline, saliva, or milk,16 which can improve functional and esthetic replacement outcomes.21,22 Loose pieces of teeth should not be left in the player’s mouth. The residual tooth should be stabilized and exposure to air and occlusion limited. Dental fractures can affect the enamel, the enamel and dentin structures (uncomplicated fracture), or enamel, dentin, and pulp (complicated).23 Fractures involving only the enamel do not require urgent dental evaluation. Dentin or pulp involvement may cause temperature and air sensitivity.23 If a tooth is air-sensitive, the player should be referred to a specialist immediately.11
Direct trauma can cause instability without displacement (subluxation) or complete displacement of the tooth from its alveolar socket (avulsion).23 An avulsed tooth should be handled by the crown to avoid further damage to the root and periodontal ligament.16,24 The tooth should be rinsed gently with saline and reimplanted in its socket, ideally within 5 to 10 minutes,23with the athlete biting down gently on gauze to hold the tooth in place. A 1-mL supraperiosteal infiltration of 1% or 2% lidocaine hydrochloride (1:100,000 epinephrine) can be given into the apex of the tooth being anesthetized (Figure 1). 
Concussions
A concussion is a “complex pathophysiological process affecting the brain, induced by traumatic biomechanical forces.”25 Concussion is largely a functional disturbance instead of a structural injury, owing to the rotational and/or shearing forces involved. Many studies have identified concussion as the most common type of injury in all of youth hockey.26 Concussions account for up to 19% of all injuries in men’s collegiate hockey.3
Concussion can be challenging to diagnose on the ice. The most important factor in concussion management is symptom reporting by the athlete.27 Despite significant efforts in education and awareness, student athletes, especially hockey players, withhold reporting a possible concussion.28 Reasons for underreporting include fear of letting down other players and coaches, thinking the injury is not severe enough to warrant evaluation, and fear of losing standing with the current team or future teams.28 
As postinjury concussion assessments are ideal when comparisons can be made with preseason (baseline) scores, preseason testing is becoming standard in professional, college, junior, and high school hockey. This testing involves the Sport Concussion Assessment Tool, 3rd edition (SCAT3), and the King-Devick (K-D) test.30,31 Some youth leagues have baseline testing as well, though the frequency of baseline testing in their players is controversial,32 as the adolescent mind’s processing speed and memory increase exponentially.33 For these younger athletes, it may be necessary to perform baseline testing more frequently than annually.32 A physician can use baseline test results to help diagnose a concussion at the rink and then track the athlete’s recovery and help with return-to-play decisions.29 Vision involves almost half of the brain’s circuits,34 including areas vulnerable to head impact. A neuro-ophthalmologic test can assess for irregularities in accommodation, convergence, ocular muscle balance, pursuit, and saccades.29 The K-D test is a visual performance examination that allows easy and objective assessment of eye movements. Use of both the K-D test and the SCAT3 at the rink may increase the number of concussions detected.29,35 We recommend that physicians use both tests to assess for concussion at the hockey rink.
Initial treatment involves a period of physical rest and relative cognitive rest. Acute worsening of symptoms warrants urgent imaging to rule out a subdural or subarachnoid bleed. Once a player is symptom-free, a graded return-to-play protocol should be followed (Table 4). 
On the prevention side, great efforts have been made to improve hockey helmets. (Some manufacturers claim to have made concussion-proof helmets, but there is no evidence supporting this claim.6) Numerous investigators have reported a lower overall injury rate in players who wear a helmet and a full-face shield.6,13 In addition, rule changes aimed at decreasing head contact have been implemented to decrease the incidence of sport-related concussions.36 Moreover, education on proper helmet use and wear should be emphasized. A study of the effects of hockey helmet fit on cervical motion found that 7 (39%) of 18 players wore a game or competition helmet so loosely that it could be removed without unbuttoning its chinstrap.37 Improperly worn helmets cannot prevent injury as well as properly worn helmets can.
Cervical Spine Injuries
Whereas American football is associated with a higher annual number of nonfatal catastrophic neck injuries, hockey has a 3 to 6 times higher incidence of cervical spine injuries and spinal cord damage.38,39 A Canadian Ice Hockey Spinal Injuries Registry review of the period 2006 to 2011 identified 44 cervical spine injuries, 7.3 per year on average.40 Severe injury, defined as complete motor and sensory loss, complete motor loss and incomplete sensory, or complete motor loss, occurred in 4 (9.1%) of the 44 injured players. In hockey, a major mechanism of cervical spine injury is an axial load to the slightly flexed spine.39 Of 355 hockey-related cervical spine injuries in a Canada study, 95 (35.5%) were caused by a check from behind.40,41 The Canadian neurosurgeons’ work led to rule changes prohibiting checks from behind, and this prohibition has reduced the incidence of cervical spine injuries in ice hockey.38,40
Team physicians should be comfortable managing serious neck and spine injuries on the ice. Initial evaluation should follow the standard ABCs (airway, breathing, circulation). The physician places a hand on each side of the head to stabilize the neck until the initial examination is complete. The goal is to minimize cervical spine motion until transportation to the hospital for advanced imaging and definitive treatment.37 The decision to remove or leave on the helmet is now controversial. Hockey helmets differ from football helmets in that their chinstraps do not afford significant cervical stabilization, and the helmets have less padding and cover less of the head; in addition, a shockingly high percentage of hockey players do not wear properly fitting helmets.37 In one study, 3-dimensional motion analysis of a hockey player during the logroll technique showed less transverse and sagittal cervical plane motion with the helmet removed than with the helmet (properly fitting or not) in place; the authors recommended removing the helmet to limit extraneous cervical spine motion during the technique.37 However, 2 other studies found that helmet removal can result in significantly increased cervical spine motion of the immobilized hockey player.42,43Recommendation 4 of the recently released interassociation consensus statement of the National Athletic Trainers’ Association reads, “Protective athletic equipment should be removed before transport to an emergency facility for an athlete-patient with suspected cervical spine instability.”44 This represents a shift from leaving the helmet and shoulder pads in place. For ice hockey players with suspected cervical spine injury, more research is needed on cervical motion during the entire sequence—partial logrolls, spine-boarding, placement of cervical collar before or after logroll, and different immobilization techniques for transport.37
The athlete must be carefully transferred to a spine board with either logroll or lift-and-slide. Although an extrication cervical collar can be placed before the spine board is placed, the effectiveness of this collar in executing the spine-board transfer is not proven.45 When the player is on the spine board, the head can be secured with pads and straps en route to the hospital.
Return-to-Play Criteria for Cervical Spine Injuries There is no clear consensus on return-to-play guidelines for cervical spine injuries in athletes.46 
Shoulder Injuries
For hockey players, the upper extremity traditionally has been considered a well-protected area.48 However, shoulder pads are considerably more flexible in hockey than in football and other collision sports. In addition, hockey gloves allow a fair amount of motion for stick handling, and the wrist may be in maximal flexion or extension when a hit against the boards or the ice occurs. Open-ice checking, board collisions, and hockey stick use have been postulated as reasons for the high incidence of upper extremity injuries in hockey. Researchers in Finland found that upper extremity injuries accounted for up to 31% of all hockey injuries.49 More than 50% of these injuries resulted from checking or board collisions. Furthermore, study findings highlighted a low rate of injury in younger players and indicated the rate increases with age.49,50
In hockey players, the acromioclavicular (AC) joint is the most commonly injured shoulder structure.51 The mechanism of injury can be a board collision or an open-ice hit, but most often is a direct blow to the shoulder. The collision disrupts the AC joint and can sprain or tear the coracoclavicular ligaments. The Rockwood classification is used to categorize AC joint injuries (Figure 2). 
Initial management involves icing the AC joint and placing a sling for comfort. Type I and type II injuries can be managed with progressive range-of-motion (ROM) exercises, strengthening, cryotherapy, and a period of rest. Treatment of type III injuries remains controversial,52 but in hockey players these injuries are almost always treated nonoperatively. Return to play requires full motion, normal strength, and minimal discomfort. Players return a few days to 2 weeks after a grade I injury; recovery from grade II injuries may take 2 to 3 weeks, and recovery from grade III injuries, 6 to 12 weeks. Surgical treatment is usually required in type IV and type V injuries, but we have had experience treating these injuries nonoperatively in high-level players. AC joint reinjury in hockey players is common, and surgical treatment should be approached cautiously, as delayed fracture after return to sport has been reported.53 Special precautions should be taken in collision athletes who undergo AC joint reconstruction. In the anatomical reconstruction described by Carofino and Mazzocca,54 2 holes are drilled in the clavicle; these holes are a potential source of fracture when the collision athlete returns to sport (Figure 3). 
Clavicle fracture is another common hockey injury.55 Studies have shown clavicle fractures proportionally occur most often in people 15 to 19 years old.49 The injury presents with pain and deformity over the clavicle; in more severe fractures, skin tenting is identified. Initial management of suspected clavicle fracture includes cryotherapy, sling, and radiographs. Radiographs should include an AP view and then a 45° cephalad view, which eliminates overshadowing from the ribs. Most clavicle fractures are successfully managed nonoperatively, though there is evidence that significantly displaced or comminuted fractures have better union rates and shoulder function when treated with open reduction and internal fixation.56 After a clavicle fracture, return to skating and noncontact practice usually takes 8 weeks, with return to full contact occurring around 12 weeks.
Sternoclavicular injuries are relatively uncommon, but potentially serious. Special attention should also be given to adolescent athletes with sternoclavicular pain. Although sternoclavicular dislocations have been reported in hockey players, instead these likely are fractures involving the medial clavicle physis.57 
The shoulder is the most commonly dislocated major joint, and the incidence of shoulder dislocation in elite hockey players is 8% to 21%.50,58 Anterior shoulder instability occurs from a fall with the shoulder in an abducted, externally rotated and extended position or from a direct anteriorly placed impact to the posterior shoulder. We recommend taking players off the ice for evaluation. Depending on physician comfort, the shoulder can be reduced in the training room, and the athlete sent for radiographs after reduction. If resources or support for closed reduction is not available at the rink, the athlete should be sent to the ED. Initial radiographic evaluation of a player with shoulder injury begins with plain radiographs, including a true AP (Grashey) view with the humerus in neutral, internal, and external rotation and an axillary view. The axillary radiograph is crucial in determining anterior or posterior dislocation. If the patient cannot tolerate the pain associated with having an axillary radiograph taken, a Velpeau radiograph can be used. This radiograph is taken with the patient’s arm in a sling and with the patient leaning back 30° while the x-ray beam is directed superior to inferior.
CT is performed for a suspected osseous injury. CT is more accurate than plain radiographs in showing glenoid and humeral fractures in the acute setting as well as the amount of bone loss in the case of chronic instability. Magnetic resonance arthrography is the imaging modality of choice for the diagnoses of capsulolabral injury.
After shoulder reduction, treatment with a sling, cryotherapy, and a nonsteroidal anti-inflammatory drug is initiated. In a Minnesota study of nonoperative management of shoulder instability, 9 of 10 hockey players were able to return to play the same season, and 6 of the 10 required surgery at the end of the season.59 
Compared with noncontact athletes, hockey players and other collision athletes are at increased risk for recurrence.60-62 For collision athletes who want to continue playing their sport after recurrent instability, surgery is recommended. A shoulder instability study in Toronto found that more than 54% of 24 professional hockey players had associated Hill-Sachs lesions, but only 3 shoulders (12.5%) had glenoid defects.50 Arthroscopic and open techniques both demonstrate good results, and identification of bone loss can help determine which surgery to recommend.63 Hockey players can usually return to sport 6 months after shoulder stabilization.
Another important consideration in managing shoulder instability in hockey players is shoulder dominance, which determines stick grip. A left-handed player places the right hand on top of the stick for support, but most of the motion associated with shooting the puck—including abduction and external rotation—occurs with the left shoulder. Thus, a left-handed player with a history of previous left-side shoulder dislocation may dislocate with each shot, but a right-handed player with left shoulder instability may have considerably less trouble on the ice.58Shoulder and rotator cuff contusions (RCCs) occur in hockey and other collision sports.49,64 RCCs almost always result from a direct blow to the shoulder, and present with shoulder function loss, weakness, and pain.

Summary
Hockey is a high-speed collision sport with one of the highest injury rates among all sports. Physicians caring for youth, amateur, and senior hockey teams see a range of acute head, neck, and shoulder injuries. Although treatment of eye injuries, dental injuries, and concussions is not always considered orthopedic care, an orthopedic surgeon who is covering hockey needs to be comfortable managing these injuries acutely. Quality rink-side care minimizes the impact of the injury, maximizes the functional result, and expedites the safe return of the injured player back to the ice.
Am J Orthop. 2017;46(3):123-134. Copyright Frontline Medical Communications Inc. 2017. All rights reserved.
1. Vaughan G. The Puck Starts Here: The Origin of Canada’s Great Winter Game, Ice Hockey. Fredericton, Canada: Goose Lane Editions; 1996.
2. IIHF member national associations. International Ice Hockey Federation website. http://www.iihf.com/iihf-home/the-iihf/members. Accessed April 6, 2017.
3. Flik K, Lyman S, Marx RG. American collegiate men’s ice hockey: an analysis of injuries. Am J Sports Med. 2005;33(2):183-187.
4. Engebretsen L, Steffen K, Alonso JM, et al. Sports injuries and illnesses during the Winter Olympic Games 2010. Br J Sports Med. 2010;44(11):772-780.
5. Deits J, Yard EE, Collins CL, Fields SK, Comstock RD. Patients with ice hockey injuries presenting to US emergency departments, 1990-2006. J Athl Train. 2010;45(5):467-474.
6. Brooks A, Loud KJ, Brenner JS, et al. Reducing injury risk from body checking in boys’ youth ice hockey. Pediatrics. 2014;133(6):1151-1157.
7. Agel J, Harvey EJ. A 7-year review of men’s and women’s ice hockey injuries in the NCAA. Can J Surg. 2010;53(5):319-323.
8. Micieli JA, Zurakowski D, Ahmed, II. Impact of visors on eye and orbital injuries in the National Hockey League. Can J Ophthalmol. 2014;49(3):243-248.
9. Pashby TJ. Ocular injuries in hockey. Int Ophthalmol Clin. 1988;28(3):228-231.
10. Leivo T, Haavisto AK, Sahraravand A. Sports-related eye injuries: the current picture. Acta Ophthalmol. 2015;93(3):224-231.
11. Cohn RM, Alaia MJ, Strauss EJ, Feldman AF. Rink-side management of ice hockey related injuries to the face, neck, and chest. Bull Hosp Jt Dis. 2013;71(4):253-256.
12. Reehal P. Facial injury in sport. Curr Sports Med Rep. 2010;9(1):27-34.
13. Stuart MJ, Smith AM, Malo-Ortiguera SA, Fischer TL, Larson DR. A comparison of facial protection and the incidence of head, neck, and facial injuries in Junior A hockey players. A function of individual playing time. Am J Sports Med. 2002;30(1):39-44.
14. MacEwen CJ, McLatchie GR. Eye injuries in sport. Scott Med J. 2010;55(2):22-24.
15. Stevens ST, Lassonde M, de Beaumont L, Keenan JP. The effect of visors on head and facial injury in National Hockey League players. J Sci Med Sport. 2006;9(3):238-242.
16. Moslener MD, Wadsworth LT. Ice hockey: a team physician’s perspective. Curr Sports Med Rep. 2010;9(3):134-138.
17. LaPrade RF, Burnett QM, Zarzour R, Moss R. The effect of the mandatory use of face masks on facial lacerations and head and neck injuries in ice hockey. A prospective study. Am J Sports Med. 1995;23(6):773-775.
18. Benson BW, Mohtadi NG, Rose MS, Meeuwisse WH. Head and neck injuries among ice hockey players wearing full face shields vs half face shields. JAMA. 1999;282(24):2328-2332.
19. Lahti H, Sane J, Ylipaavalniemi P. Dental injuries in ice hockey games and training. Med Sci Sports Exerc. 2002;34(3):400-402.
20. Sane J, Ylipaavalniemi P, Leppanen H. Maxillofacial and dental ice hockey injuries. Med Sci Sports Exerc. 1988;20(2):202-207.
21. Emerich K, Kaczmarek J. First aid for dental trauma caused by sports activities: state of knowledge, treatment and prevention. Sports Med. 2010;40(5):361-366.
22. Rosenberg H, Rosenberg H, Hickey M. Emergency management of a traumatic tooth avulsion. Ann Emerg Med. 2011;57(4):375-377.
23. Young EJ, Macias CR, Stephens L. Common dental injury management in athletes. Sports Health. 2015;7(3):250-255.
24. Andersson L, Andreasen JO, Day P, et al. International Association of Dental Traumatology guidelines for the management of traumatic dental injuries: 2. Avulsion of permanent teeth. Dent Traumatol. 2012;28(2):88-96.
25. McCrory P, Meeuwisse W, Johnston K, et al. Consensus statement on concussion in sport 3rd International Conference on Concussion in Sport held in Zurich, November 2008. Clin J Sport Med. 2009;19(3):185-200.
26. Schneider KJ, Meeuwisse WH, Kang J, Schneider GM, Emery CA. Preseason reports of neck pain, dizziness, and headache as risk factors for concussion in male youth ice hockey players. Clin J Sport Med. 2013;23(4):267-272.
27. McCrory P, Meeuwisse WH, Aubry M, et al. Consensus statement on concussion in sport: the 4th International Conference on Concussion in Sport held in Zurich, November 2012. Br J Sports Med. 2013;47(5):250-258.
28. Delaney JS, Lamfookon C, Bloom GA, Al-Kashmiri A, Correa JA. Why university athletes choose not to reveal their concussion symptoms during a practice or game. Clin J Sport Med. 2015;25(2):113-125.
29. Ventura RE, Balcer LJ, Galetta SL. The concussion toolbox: the role of vision in the assessment of concussion. Semin Neurol. 2015;35(5):599-606.
30. Vartiainen MV, Holm A, Peltonen K, Luoto TM, Iverson GL, Hokkanen L. King-Devick test normative reference values for professional male ice hockey players. Scand J Med Sci Sports. 2015;25(3):e327-e330.
31. Galetta MS, Galetta KM, McCrossin J, et al. Saccades and memory: baseline associations of the King-Devick and SCAT2 SAC tests in professional ice hockey players. J Neurol Sci. 2013;328(1-2):28-31.
32. Vernau BT, Grady MF, Goodman A, et al. Oculomotor and neurocognitive assessment of youth ice hockey players: baseline associations and observations after concussion. Dev Neuropsychol. 2015;40(1):7-11.
33. Fry AF, Hale S. Relationships among processing speed, working memory, and fluid intelligence in children. Biol Psychol. 2000;54(1-3):1-34.
34. Felleman DJ, Van Essen DC. Distributed hierarchical processing in the primate cerebral cortex. Cereb Cortex. 1991;1(1):1-47.
35. Guskiewicz KM, Register-Mihalik J, McCrory P, et al. Evidence-based approach to revising the SCAT2: introducing the SCAT3. Br J Sports Med. 2013;47(5):289-293.
36. Smith AM, Stuart MJ, Dodick DW, et al. Ice Hockey Summit II: zero tolerance for head hits and fighting. Curr Sports Med Rep. 2015;14(2):135-144.
37. Mihalik JP, Beard JR, Petschauer MA, Prentice WE, Guskiewicz KM. Effect of ice hockey helmet fit on cervical spine motion during an emergency log roll procedure. Clin J Sport Med. 2008;18(5):394-398.
38. Banerjee R, Palumbo MA, Fadale PD. Catastrophic cervical spine injuries in the collision sport athlete, part 1: epidemiology, functional anatomy, and diagnosis. Am J Sports Med. 2004;32(4):1077-1087.
39. Reynen PD, Clancy WG Jr. Cervical spine injury, hockey helmets, and face masks. Am J Sports Med. 1994;22(2):167-170.
40. Tator CH, Provvidenza C, Cassidy JD. Update and overview of spinal injuries in Canadian ice hockey, 1943 to 2011: the continuing need for injury prevention and education. Clin J Sport Med. 2016;26(3):232-238.
41. Tator CH, Edmonds VE, Lapczak L, Tator IB. Spinal injuries in ice hockey players, 1966-1987. Can J Surg. 1991;34(1):63-69.
42. Laprade RF, Schnetzler KA, Broxterman RJ, Wentorf F, Gilbert TJ. Cervical spine alignment in the immobilized ice hockey player. A computed tomographic analysis of the effects of helmet removal. Am J Sports Med. 2000;28(6):800-803.
43. Metz CM, Kuhn JE, Greenfield ML. Cervical spine alignment in immobilized hockey players: radiographic analysis with and without helmets and shoulder pads. Clin J Sport Med. 1998;8(2):92-95.
44. National Athletic Trainers’ Association. Appropriate prehospital management of the spine-injured athlete: updated from 1998 document. http://www.nata.org/sites/default/files/Executive-Summary-Spine-Injury-updated.pdf. Updated August 5, 2015. Accessed April 6, 2017.
45. Del Rossi G, Heffernan TP, Horodyski M, Rechtine GR. The effectiveness of extrication collars tested during the execution of spine-board transfer techniques. Spine J. 2004;4(6):619-623.
46. Morganti C, Sweeney CA, Albanese SA, Burak C, Hosea T, Connolly PJ. Return to play after cervical spine injury. Spine. 2001;26(10):1131-1136.
47. Huang P, Anissipour A, McGee W, Lemak L. Return-to-play recommendations after cervical, thoracic, and lumbar spine injuries: a comprehensive review. Sports Health. 2016;8(1):19-25.
48. Shindle MK, Marx RG, Kelly BT, Bisson L, Burke CJ 3rd. Hockey injuries: a pediatric sport update. Curr Opin Pediatr. 2010;22(1):54-60.
49. Molsa J, Kujala U, Myllynen P, Torstila I, Airaksinen O. Injuries to the upper extremity in ice hockey: analysis of a series of 760 injuries. Am J Sports Med. 2003;31(5):751-757.
50. Dwyer T, Petrera M, Bleakney R, Theodoropoulos JS. Shoulder instability in ice hockey players: incidence, mechanism, and MRI findings. Clin Sports Med. 2013;32(4):803-813.
51. LaPrade RF, Wijdicks CA, Griffith CJ. Division I intercollegiate ice hockey team coverage. Br J Sports Med. 2009;43(13):1000-1005.
52. Willimon SC, Gaskill TR, Millett PJ. Acromioclavicular joint injuries: anatomy, diagnosis, and treatment. Phys Sportsmed. 2011;39(1):116-122.
53. Martetschlager F, Horan MP, Warth RJ, Millett PJ. Complications after anatomic fixation and reconstruction of the coracoclavicular ligaments. Am J Sports Med. 2013;41(12):2896-2903.
54. Carofino BC, Mazzocca AD. The anatomic coracoclavicular ligament reconstruction: surgical technique and indications. J Shoulder Elbow Surg. 2010;19(2 suppl):37-46.
55. Laprade RF, Surowiec RK, Sochanska AN, et al. Epidemiology, identification, treatment and return to play of musculoskeletal-based ice hockey injuries. Br J Sports Med. 2014;48(1):4-10.
56. Canadian Orthopaedic Trauma Society. Nonoperative treatment compared with plate fixation of displaced midshaft clavicular fractures. A multicenter, randomized clinical trial. J Bone Joint Surg Am. 2007;89(1):1-10.
57. Lee JT, Nasreddine AY, Black EM, Bae DS, Kocher MS. Posterior sternoclavicular joint injuries in skeletally immature patients. J Pediatr Orthop. 2014;34(4):369-375.
58. Hovelius L. Shoulder dislocation in Swedish ice hockey players. Am J Sports Med. 1978;6(6):373-377.
59. Buss DD, Lynch GP, Meyer CP, Huber SM, Freehill MQ. Nonoperative management for in-season athletes with anterior shoulder instability. Am J Sports Med. 2004;32(6):1430-1433.
60. Mazzocca AD, Brown FM Jr, Carreira DS, Hayden J, Romeo AA. Arthroscopic anterior shoulder stabilization of collision and contact athletes. Am J Sports Med. 2005;33(1):52-60.
61. Harris JD, Romeo AA. Arthroscopic management of the contact athlete with instability. Clin Sports Med. 2013;32(4):709-730.
62. Cho NS, Hwang JC, Rhee YG. Arthroscopic stabilization in anterior shoulder instability: collision athletes versus noncollision athletes. Arthroscopy. 2006;22(9):947-953.
63. Griffin JW, Brockmeier SF. Shoulder instability with concomitant bone loss in the athlete. Orthop Clin North Am. 2015;46(1):89-103.
64. Cohen SB, Towers JD, Bradley JP. Rotator cuff contusions of the shoulder in professional football players: epidemiology and magnetic resonance imaging findings. Am J Sports Med. 2007;35(3):442-447.
65. Lorentzon R, Wedrèn H, Pietilä T. Incidence, nature, and causes of ice hockey injuries. A three-year prospective study of a Swedish elite ice hockey team. Am J Sports Med. 1988;16(4):392-396.
66. Stuart MJ, Smith A. Injuries in Junior A ice hockey. A three-year prospective study. Am J Sports Med. 1995;23(4):458-461.
67. Voaklander DC, Saunders LD, Quinney HA, Macnab RB. Epidemiology of recreational and old-timer ice hockey injuries. Clin J Sport Med. 1996;6(1):15-21.
68. Mölsä J, Airaksinen O, Näsman O, Torstila I. Ice hockey injuries in Finland. A prospective epidemiologic study. Am J Sports Med. 1997;25(4):495-499.
69. Ferrara MS, Schurr KT. Intercollegiate ice hockey injuries: a casual analysis. Clin J Sport Med. 1999;9(1):30-33.
70. Pinto M, Kuhn JE, Greenfield ML, Hawkins RJ. Prospective analysis of ice hockey injuries at the Junior A level over the course of one season. Clin J Sport Med. 1999;9(2):70-74.
71. Emery CA, Meeuwisse WH. Injury rates, risk factors, and mechanisms of injury in minor hockey. Am J Sports Med. 2006;34(12):1960-1969.
72. Kuzuhara K, Shimamoto H, Mase Y. Ice hockey injuries in a Japanese elite team: a 3-year prospective study. J Athl Train. 2009;44(2):208-214.
73. Rishiraj N, Lloyd-Smith R, Lorenz T, Niven B, Michel M. University men’s ice hockey: rates and risk of injuries over 6-years. J Sports Med Phys Fitness. 2009;49(2):159-166.
74. Tuominen M, Stuart MJ, Aubry M, Kannus P, Parkkari J. Injuries in men’s international ice hockey: a 7-year study of the International Ice Hockey Federation Adult World Championship Tournaments and Olympic Winter Games. Br J Sports Med. 2015;49(1):30-36.
75. Heckman JD, Bucholz RW. In: Rockwood CA, Green DP, Heckman JD, Bucholz RW, eds. Rockwood and Green’s Fractures in Adults, Volume 1. Philadelphia, PA: Lippincott Williams & Wilkins; 2001.
Take-Home Points
- Hockey is a high-speed collision sport with one of the highest injury rates among all sports.
- Use of a helmet with visors or full-face shields significantly reduces the risk for eye injury.
- Broken portions of teeth should be found and placed in a protective medium such as saline, saliva, or milk for transport.
- A player with unresolved concussion symptoms should not be allowed to return to the ice.
- Shoulder dominance, which determines stick grip, is an important consideration in the treatment of shoulder instability in an ice hockey player.
On a surface of ice in Windsor, Nova Scotia in the middle of the 19th century, the modern game of ice hockey evolved.1 A blend of hurley, a Gaelic sport, and lacrosse, from the native Mi’kmaq culture, the sport of ice hockey gained rapidly in popularity throughout Canada and is now the country’s national sport. Hockey quickly spread to the United States and then Europe. It is presently played in 77 countries across the world.2
Hockey players can reach speeds of up to 48 km (~30 miles) per hour on razor-sharp skates on an ice surface surrounded by rigid plastic composite boards topped with plexiglass.3 They use sticks made of wood, aluminum, or a composite material to advance a 6-ounce vulcanized rubber puck on the opposing goal, and this puck sometimes reaches speeds over 160 km (~100 miles) per hour. Older, male players are allowed to make physical contact with their opposing counterparts to separate them from the puck (body-checking). Not surprisingly, the potential risk for injury in hockey is high. At the 2010 Winter Olympics, men’s ice hockey players had the highest rate of injury of any other competitors there—more than 30% were affected.4
Hockey is played and enjoyed by athletes ranging widely in age. Youth hockey leagues accept players as young as 5 years. Hockey can become a lifelong recreational activity. In North America, old timers’ leagues have many players up to age 70 years.6 According to International Ice Hockey Federation data for 2016, more than 543,000 and 639,500 people play hockey in the United States and Canada, respectively.2 Most of the rules, protective equipment, skates, ice surfaces, and goal sizes are the same in men’s and women’s hockey.7 The major difference is in body-checking—this practice is not allowed at any age in women’s ice hockey.
In this article, we review the evaluation and management of common head, neck, and shoulder hockey injuries for physicians who provide medical support and coverage for youth, amateur, and senior hockey teams.
Evaluation and Management of Common Hockey Injuries
Eye Injuries
Although eye injuries are less common than musculoskeletal injuries and concussions in hockey, they are a serious risk for recreational and competitive players alike. Furthermore, recovery may be difficult, and eye injuries can have serious lifelong consequences.8 In hockey, the most commonly reported eye injuries are periorbital contusions and lacerations, hyphema, corneal and conjunctival abrasions, orbital fractures, and ruptured globes (Table 2).9,10
As a contact sport, hockey often involves high-impact, blunt-force trauma. The trauma in hockey results from collisions with other players, the boards, hockey sticks, and pucks. It is therefore not surprising that the most common ocular injuries in this sport are periorbital contusions. Although most contusions cause only mild swelling and ecchymosis of the soft tissues around the eye, there is potential for serious consequences. In a Scandinavia study, Leivo and colleagues10 found that 9% of patients who sustained a periocular contusion also had a clinically significant secondary diagnosis, such as retinal tear or hemorrhage, eyelid laceration, vitreous hemorrhage, or retinal detachment. Although the study was hospital-based, and therefore biased toward more severe cases, its findings highlight the potential severity of eye injuries in hockey. Furthermore, the study found that the majority of players who sustained blunt trauma to the eye itself required lifelong follow-up because of increased risk for glaucoma. This is particularly true for hyphema, as this finding indicates significant damage to intraocular tissues.10Players can also sustain fractures of the orbital bones, including orbital blowout fractures. Typical signs and symptoms of blowout fractures include diplopia, proptosis or enophthalmos, infraorbital hypoesthesia, painful and decreased extraocular movement (particularly upgaze), and palpable crepitance caused by sinus air entering the lower eyelid.11 If orbital fracture is suspected, as it should be in any case in which the injured player experiences pain with eye movement or diplopia, the player should be referred to the ED for computed tomography (CT) and ophthalmologic evaluation.12 Continued participation seriously risks making the injury much worse, particularly should another impact occur. In addition, given the impact needed to cause orbital fractures, consideration must be given to the potential for a coexisting concussion injury.
Severe direct trauma to the eye—from a puck, a stick, or a fist—can result in a ruptured globe, a particularly serious injury that requires immediate surgical attention. Signs and symptoms of a ruptured globe are rarely subtle, but associated eyelid swelling or laceration may obscure the injury, delaying proper diagnosis and treatment. More obvious signs include severely reduced vision, hemorrhagic chemosis (swelling) of the conjunctiva, and an irregular or peaked pupil. If a rupture or any significant intraocular injury is suspected, it is crucial to avoid applying any pressure to the globe, as this can significantly worsen the damage to the intraocular tissues. Use of a helmet with protective shields and cages attached markedly reduces the risk for such injuries.13All eye injuries require prompt assessment, which allows for appropriate management and prevention of secondary damage.14 Initial evaluation of a patient with ocular trauma should begin with external examination for lacerations, swelling, or orbital rim step-off deformity. The physician should also check visual acuity in order to assess for significant vision impairment (counting fingers or reading a sign in the arena; confrontation visual fields). This should be done before attending to any periocular injuries, with the uninjured side serving as a control. Next, the physician should assess the extraocular eye movements as well as the size, shape, and reactivity of the pupils. Particular attention should be paid to detecting any deficit in extraocular movement or irregularity in pupil size, shape, or reactivity, as such findings are highly suggestive of serious injury to the globe.13 Hyphema (blood in anterior chamber of eye anterior to pupil) should be suspected if vision is reduced and the pupil cannot be clearly visualized. However, a bright red clot is not always apparent at time of injury or if the amount of blood is small. An irregular pupil, or a pupil that does not constrict well to light, is also a red flag for serious contusion injury to the eye, and requires ophthalmologic evaluation. It is important to keep in mind that blunt trauma severe enough to produce hyphema or an irregular and poorly reactive pupil is often associated with retinal damage as well, including retinal edema or detachment.
Minor injuries (eg, small foreign bodies, minor periocular contusions and lacerations) can often be managed rink-side. Foreign bodies not embedded in the cornea, but lodged under the upper eyelid, can sometimes be removed by everting the eyelid and sweeping with a moistened cotton swab or using diffuse, sterile saline irrigation.11 Corneal abrasions generally cause severe pain, photophobia, and tearing and are easily diagnosed with use of topical fluorescein and a blue light. A topical anesthetic can be extremely helpful in this setting, as it allows for proper pain-free evaluation, but should never be used in an ongoing manner for pain relief. Small lacerations of the brow can be sutured with 5-0 or 6-0 nylon or closed with 2-Octyl cyanoacrylate tissue adhesive (Dermabond). Eyelid lacerations, unless very small, are best managed by an ophthalmologist; care must be taken to rule out injury to the deeper orbital tissues and eye. If serious injury is suspected, or the eye cannot be appropriately evaluated, it should be stabilized and protected with a protective shield or plastic cup, and the player should be transferred to an ED for appropriate ophthalmologic evaluation.13Most eye injuries are accidental, caused by sticks or deflected pucks, but 18% are acquired in fights.8 Use of visors or full-face cages effectively minimizes the rate of eye injuries.8,13,15,16 In a cohort study of 282 elite amateur ice hockey players, the risk of eye injury was 4.7 times higher in players without face protection than in players who used half-face shields; there were no eye injuries in players who used full-face protection.13 For visors to prevent eye injury, they must be positioned to cover the eyes and the lower edge of the nose in all projections.10
Dental Injuries
The incidence and type of facial and dental injuries depend directly on the type of face protection used.11,17,18 In a study of face, head, and neck injuries in elite amateur ice hockey players, Stuart and colleagues13 found game-related injury rates of 158.9 per 1000 player-hours in players without face protection, 73.5 in players who used half-face shields, and 23.2 in players who used full-face shields. Players who wore full-face shields had facial, head, and neck injury rates of only 23.2 per 1000 player-game hours.13 Other studies clearly support the important role face shields play in lowering injury risk in hockey. Face and head injuries account for 20% to 40% of all hockey-related injuries,3,16,19 and dental injuries up to 11.5%.20 In a study from Finland, Lahti and colleagues19 found that over a 2-year period, 479 hockey players sustained injuries, including 650 separate dental injuries. The most commonly diagnosed dental injury was an uncomplicated crown fracture, and the most common cause was a hit with a hockey stick, which accounted for 52.7% and 40.3% of dental injuries in games and practices, respectively.19
In the management of dental fractures, the broken portions of teeth should be found and placed in a transportation-protective medium, such as saline, saliva, or milk,16 which can improve functional and esthetic replacement outcomes.21,22 Loose pieces of teeth should not be left in the player’s mouth. The residual tooth should be stabilized and exposure to air and occlusion limited. Dental fractures can affect the enamel, the enamel and dentin structures (uncomplicated fracture), or enamel, dentin, and pulp (complicated).23 Fractures involving only the enamel do not require urgent dental evaluation. Dentin or pulp involvement may cause temperature and air sensitivity.23 If a tooth is air-sensitive, the player should be referred to a specialist immediately.11
Direct trauma can cause instability without displacement (subluxation) or complete displacement of the tooth from its alveolar socket (avulsion).23 An avulsed tooth should be handled by the crown to avoid further damage to the root and periodontal ligament.16,24 The tooth should be rinsed gently with saline and reimplanted in its socket, ideally within 5 to 10 minutes,23with the athlete biting down gently on gauze to hold the tooth in place. A 1-mL supraperiosteal infiltration of 1% or 2% lidocaine hydrochloride (1:100,000 epinephrine) can be given into the apex of the tooth being anesthetized (Figure 1).
Concussions
A concussion is a “complex pathophysiological process affecting the brain, induced by traumatic biomechanical forces.”25 Concussion is largely a functional disturbance instead of a structural injury, owing to the rotational and/or shearing forces involved. Many studies have identified concussion as the most common type of injury in all of youth hockey.26 Concussions account for up to 19% of all injuries in men’s collegiate hockey.3
Concussion can be challenging to diagnose on the ice. The most important factor in concussion management is symptom reporting by the athlete.27 Despite significant efforts in education and awareness, student athletes, especially hockey players, withhold reporting a possible concussion.28 Reasons for underreporting include fear of letting down other players and coaches, thinking the injury is not severe enough to warrant evaluation, and fear of losing standing with the current team or future teams.28
As postinjury concussion assessments are ideal when comparisons can be made with preseason (baseline) scores, preseason testing is becoming standard in professional, college, junior, and high school hockey. This testing involves the Sport Concussion Assessment Tool, 3rd edition (SCAT3), and the King-Devick (K-D) test.30,31 Some youth leagues have baseline testing as well, though the frequency of baseline testing in their players is controversial,32 as the adolescent mind’s processing speed and memory increase exponentially.33 For these younger athletes, it may be necessary to perform baseline testing more frequently than annually.32 A physician can use baseline test results to help diagnose a concussion at the rink and then track the athlete’s recovery and help with return-to-play decisions.29 Vision involves almost half of the brain’s circuits,34 including areas vulnerable to head impact. A neuro-ophthalmologic test can assess for irregularities in accommodation, convergence, ocular muscle balance, pursuit, and saccades.29 The K-D test is a visual performance examination that allows easy and objective assessment of eye movements. Use of both the K-D test and the SCAT3 at the rink may increase the number of concussions detected.29,35 We recommend that physicians use both tests to assess for concussion at the hockey rink.
Initial treatment involves a period of physical rest and relative cognitive rest. Acute worsening of symptoms warrants urgent imaging to rule out a subdural or subarachnoid bleed. Once a player is symptom-free, a graded return-to-play protocol should be followed (Table 4).
On the prevention side, great efforts have been made to improve hockey helmets. (Some manufacturers claim to have made concussion-proof helmets, but there is no evidence supporting this claim.6) Numerous investigators have reported a lower overall injury rate in players who wear a helmet and a full-face shield.6,13 In addition, rule changes aimed at decreasing head contact have been implemented to decrease the incidence of sport-related concussions.36 Moreover, education on proper helmet use and wear should be emphasized. A study of the effects of hockey helmet fit on cervical motion found that 7 (39%) of 18 players wore a game or competition helmet so loosely that it could be removed without unbuttoning its chinstrap.37 Improperly worn helmets cannot prevent injury as well as properly worn helmets can.
Cervical Spine Injuries
Whereas American football is associated with a higher annual number of nonfatal catastrophic neck injuries, hockey has a 3 to 6 times higher incidence of cervical spine injuries and spinal cord damage.38,39 A Canadian Ice Hockey Spinal Injuries Registry review of the period 2006 to 2011 identified 44 cervical spine injuries, 7.3 per year on average.40 Severe injury, defined as complete motor and sensory loss, complete motor loss and incomplete sensory, or complete motor loss, occurred in 4 (9.1%) of the 44 injured players. In hockey, a major mechanism of cervical spine injury is an axial load to the slightly flexed spine.39 Of 355 hockey-related cervical spine injuries in a Canada study, 95 (35.5%) were caused by a check from behind.40,41 The Canadian neurosurgeons’ work led to rule changes prohibiting checks from behind, and this prohibition has reduced the incidence of cervical spine injuries in ice hockey.38,40
Team physicians should be comfortable managing serious neck and spine injuries on the ice. Initial evaluation should follow the standard ABCs (airway, breathing, circulation). The physician places a hand on each side of the head to stabilize the neck until the initial examination is complete. The goal is to minimize cervical spine motion until transportation to the hospital for advanced imaging and definitive treatment.37 The decision to remove or leave on the helmet is now controversial. Hockey helmets differ from football helmets in that their chinstraps do not afford significant cervical stabilization, and the helmets have less padding and cover less of the head; in addition, a shockingly high percentage of hockey players do not wear properly fitting helmets.37 In one study, 3-dimensional motion analysis of a hockey player during the logroll technique showed less transverse and sagittal cervical plane motion with the helmet removed than with the helmet (properly fitting or not) in place; the authors recommended removing the helmet to limit extraneous cervical spine motion during the technique.37 However, 2 other studies found that helmet removal can result in significantly increased cervical spine motion of the immobilized hockey player.42,43Recommendation 4 of the recently released interassociation consensus statement of the National Athletic Trainers’ Association reads, “Protective athletic equipment should be removed before transport to an emergency facility for an athlete-patient with suspected cervical spine instability.”44 This represents a shift from leaving the helmet and shoulder pads in place. For ice hockey players with suspected cervical spine injury, more research is needed on cervical motion during the entire sequence—partial logrolls, spine-boarding, placement of cervical collar before or after logroll, and different immobilization techniques for transport.37
The athlete must be carefully transferred to a spine board with either logroll or lift-and-slide. Although an extrication cervical collar can be placed before the spine board is placed, the effectiveness of this collar in executing the spine-board transfer is not proven.45 When the player is on the spine board, the head can be secured with pads and straps en route to the hospital.
Return-to-Play Criteria for Cervical Spine Injuries There is no clear consensus on return-to-play guidelines for cervical spine injuries in athletes.46
Shoulder Injuries
For hockey players, the upper extremity traditionally has been considered a well-protected area.48 However, shoulder pads are considerably more flexible in hockey than in football and other collision sports. In addition, hockey gloves allow a fair amount of motion for stick handling, and the wrist may be in maximal flexion or extension when a hit against the boards or the ice occurs. Open-ice checking, board collisions, and hockey stick use have been postulated as reasons for the high incidence of upper extremity injuries in hockey. Researchers in Finland found that upper extremity injuries accounted for up to 31% of all hockey injuries.49 More than 50% of these injuries resulted from checking or board collisions. Furthermore, study findings highlighted a low rate of injury in younger players and indicated the rate increases with age.49,50
In hockey players, the acromioclavicular (AC) joint is the most commonly injured shoulder structure.51 The mechanism of injury can be a board collision or an open-ice hit, but most often is a direct blow to the shoulder. The collision disrupts the AC joint and can sprain or tear the coracoclavicular ligaments. The Rockwood classification is used to categorize AC joint injuries (Figure 2).
Initial management involves icing the AC joint and placing a sling for comfort. Type I and type II injuries can be managed with progressive range-of-motion (ROM) exercises, strengthening, cryotherapy, and a period of rest. Treatment of type III injuries remains controversial,52 but in hockey players these injuries are almost always treated nonoperatively. Return to play requires full motion, normal strength, and minimal discomfort. Players return a few days to 2 weeks after a grade I injury; recovery from grade II injuries may take 2 to 3 weeks, and recovery from grade III injuries, 6 to 12 weeks. Surgical treatment is usually required in type IV and type V injuries, but we have had experience treating these injuries nonoperatively in high-level players. AC joint reinjury in hockey players is common, and surgical treatment should be approached cautiously, as delayed fracture after return to sport has been reported.53 Special precautions should be taken in collision athletes who undergo AC joint reconstruction. In the anatomical reconstruction described by Carofino and Mazzocca,54 2 holes are drilled in the clavicle; these holes are a potential source of fracture when the collision athlete returns to sport (Figure 3).
Clavicle fracture is another common hockey injury.55 Studies have shown clavicle fractures proportionally occur most often in people 15 to 19 years old.49 The injury presents with pain and deformity over the clavicle; in more severe fractures, skin tenting is identified. Initial management of suspected clavicle fracture includes cryotherapy, sling, and radiographs. Radiographs should include an AP view and then a 45° cephalad view, which eliminates overshadowing from the ribs. Most clavicle fractures are successfully managed nonoperatively, though there is evidence that significantly displaced or comminuted fractures have better union rates and shoulder function when treated with open reduction and internal fixation.56 After a clavicle fracture, return to skating and noncontact practice usually takes 8 weeks, with return to full contact occurring around 12 weeks.
Sternoclavicular injuries are relatively uncommon, but potentially serious. Special attention should also be given to adolescent athletes with sternoclavicular pain. Although sternoclavicular dislocations have been reported in hockey players, instead these likely are fractures involving the medial clavicle physis.57
The shoulder is the most commonly dislocated major joint, and the incidence of shoulder dislocation in elite hockey players is 8% to 21%.50,58 Anterior shoulder instability occurs from a fall with the shoulder in an abducted, externally rotated and extended position or from a direct anteriorly placed impact to the posterior shoulder. We recommend taking players off the ice for evaluation. Depending on physician comfort, the shoulder can be reduced in the training room, and the athlete sent for radiographs after reduction. If resources or support for closed reduction is not available at the rink, the athlete should be sent to the ED. Initial radiographic evaluation of a player with shoulder injury begins with plain radiographs, including a true AP (Grashey) view with the humerus in neutral, internal, and external rotation and an axillary view. The axillary radiograph is crucial in determining anterior or posterior dislocation. If the patient cannot tolerate the pain associated with having an axillary radiograph taken, a Velpeau radiograph can be used. This radiograph is taken with the patient’s arm in a sling and with the patient leaning back 30° while the x-ray beam is directed superior to inferior.
CT is performed for a suspected osseous injury. CT is more accurate than plain radiographs in showing glenoid and humeral fractures in the acute setting as well as the amount of bone loss in the case of chronic instability. Magnetic resonance arthrography is the imaging modality of choice for the diagnoses of capsulolabral injury.
After shoulder reduction, treatment with a sling, cryotherapy, and a nonsteroidal anti-inflammatory drug is initiated. In a Minnesota study of nonoperative management of shoulder instability, 9 of 10 hockey players were able to return to play the same season, and 6 of the 10 required surgery at the end of the season.59
Compared with noncontact athletes, hockey players and other collision athletes are at increased risk for recurrence.60-62 For collision athletes who want to continue playing their sport after recurrent instability, surgery is recommended. A shoulder instability study in Toronto found that more than 54% of 24 professional hockey players had associated Hill-Sachs lesions, but only 3 shoulders (12.5%) had glenoid defects.50 Arthroscopic and open techniques both demonstrate good results, and identification of bone loss can help determine which surgery to recommend.63 Hockey players can usually return to sport 6 months after shoulder stabilization.
Another important consideration in managing shoulder instability in hockey players is shoulder dominance, which determines stick grip. A left-handed player places the right hand on top of the stick for support, but most of the motion associated with shooting the puck—including abduction and external rotation—occurs with the left shoulder. Thus, a left-handed player with a history of previous left-side shoulder dislocation may dislocate with each shot, but a right-handed player with left shoulder instability may have considerably less trouble on the ice.58Shoulder and rotator cuff contusions (RCCs) occur in hockey and other collision sports.49,64 RCCs almost always result from a direct blow to the shoulder, and present with shoulder function loss, weakness, and pain.
Summary
Hockey is a high-speed collision sport with one of the highest injury rates among all sports. Physicians caring for youth, amateur, and senior hockey teams see a range of acute head, neck, and shoulder injuries. Although treatment of eye injuries, dental injuries, and concussions is not always considered orthopedic care, an orthopedic surgeon who is covering hockey needs to be comfortable managing these injuries acutely. Quality rink-side care minimizes the impact of the injury, maximizes the functional result, and expedites the safe return of the injured player back to the ice.
Am J Orthop. 2017;46(3):123-134. Copyright Frontline Medical Communications Inc. 2017. All rights reserved.
1. Vaughan G. The Puck Starts Here: The Origin of Canada’s Great Winter Game, Ice Hockey. Fredericton, Canada: Goose Lane Editions; 1996.
2. IIHF member national associations. International Ice Hockey Federation website. http://www.iihf.com/iihf-home/the-iihf/members. Accessed April 6, 2017.
3. Flik K, Lyman S, Marx RG. American collegiate men’s ice hockey: an analysis of injuries. Am J Sports Med. 2005;33(2):183-187.
4. Engebretsen L, Steffen K, Alonso JM, et al. Sports injuries and illnesses during the Winter Olympic Games 2010. Br J Sports Med. 2010;44(11):772-780.
5. Deits J, Yard EE, Collins CL, Fields SK, Comstock RD. Patients with ice hockey injuries presenting to US emergency departments, 1990-2006. J Athl Train. 2010;45(5):467-474.
6. Brooks A, Loud KJ, Brenner JS, et al. Reducing injury risk from body checking in boys’ youth ice hockey. Pediatrics. 2014;133(6):1151-1157.
7. Agel J, Harvey EJ. A 7-year review of men’s and women’s ice hockey injuries in the NCAA. Can J Surg. 2010;53(5):319-323.
8. Micieli JA, Zurakowski D, Ahmed, II. Impact of visors on eye and orbital injuries in the National Hockey League. Can J Ophthalmol. 2014;49(3):243-248.
9. Pashby TJ. Ocular injuries in hockey. Int Ophthalmol Clin. 1988;28(3):228-231.
10. Leivo T, Haavisto AK, Sahraravand A. Sports-related eye injuries: the current picture. Acta Ophthalmol. 2015;93(3):224-231.
11. Cohn RM, Alaia MJ, Strauss EJ, Feldman AF. Rink-side management of ice hockey related injuries to the face, neck, and chest. Bull Hosp Jt Dis. 2013;71(4):253-256.
12. Reehal P. Facial injury in sport. Curr Sports Med Rep. 2010;9(1):27-34.
13. Stuart MJ, Smith AM, Malo-Ortiguera SA, Fischer TL, Larson DR. A comparison of facial protection and the incidence of head, neck, and facial injuries in Junior A hockey players. A function of individual playing time. Am J Sports Med. 2002;30(1):39-44.
14. MacEwen CJ, McLatchie GR. Eye injuries in sport. Scott Med J. 2010;55(2):22-24.
15. Stevens ST, Lassonde M, de Beaumont L, Keenan JP. The effect of visors on head and facial injury in National Hockey League players. J Sci Med Sport. 2006;9(3):238-242.
16. Moslener MD, Wadsworth LT. Ice hockey: a team physician’s perspective. Curr Sports Med Rep. 2010;9(3):134-138.
17. LaPrade RF, Burnett QM, Zarzour R, Moss R. The effect of the mandatory use of face masks on facial lacerations and head and neck injuries in ice hockey. A prospective study. Am J Sports Med. 1995;23(6):773-775.
18. Benson BW, Mohtadi NG, Rose MS, Meeuwisse WH. Head and neck injuries among ice hockey players wearing full face shields vs half face shields. JAMA. 1999;282(24):2328-2332.
19. Lahti H, Sane J, Ylipaavalniemi P. Dental injuries in ice hockey games and training. Med Sci Sports Exerc. 2002;34(3):400-402.
20. Sane J, Ylipaavalniemi P, Leppanen H. Maxillofacial and dental ice hockey injuries. Med Sci Sports Exerc. 1988;20(2):202-207.
21. Emerich K, Kaczmarek J. First aid for dental trauma caused by sports activities: state of knowledge, treatment and prevention. Sports Med. 2010;40(5):361-366.
22. Rosenberg H, Rosenberg H, Hickey M. Emergency management of a traumatic tooth avulsion. Ann Emerg Med. 2011;57(4):375-377.
23. Young EJ, Macias CR, Stephens L. Common dental injury management in athletes. Sports Health. 2015;7(3):250-255.
24. Andersson L, Andreasen JO, Day P, et al. International Association of Dental Traumatology guidelines for the management of traumatic dental injuries: 2. Avulsion of permanent teeth. Dent Traumatol. 2012;28(2):88-96.
25. McCrory P, Meeuwisse W, Johnston K, et al. Consensus statement on concussion in sport 3rd International Conference on Concussion in Sport held in Zurich, November 2008. Clin J Sport Med. 2009;19(3):185-200.
26. Schneider KJ, Meeuwisse WH, Kang J, Schneider GM, Emery CA. Preseason reports of neck pain, dizziness, and headache as risk factors for concussion in male youth ice hockey players. Clin J Sport Med. 2013;23(4):267-272.
27. McCrory P, Meeuwisse WH, Aubry M, et al. Consensus statement on concussion in sport: the 4th International Conference on Concussion in Sport held in Zurich, November 2012. Br J Sports Med. 2013;47(5):250-258.
28. Delaney JS, Lamfookon C, Bloom GA, Al-Kashmiri A, Correa JA. Why university athletes choose not to reveal their concussion symptoms during a practice or game. Clin J Sport Med. 2015;25(2):113-125.
29. Ventura RE, Balcer LJ, Galetta SL. The concussion toolbox: the role of vision in the assessment of concussion. Semin Neurol. 2015;35(5):599-606.
30. Vartiainen MV, Holm A, Peltonen K, Luoto TM, Iverson GL, Hokkanen L. King-Devick test normative reference values for professional male ice hockey players. Scand J Med Sci Sports. 2015;25(3):e327-e330.
31. Galetta MS, Galetta KM, McCrossin J, et al. Saccades and memory: baseline associations of the King-Devick and SCAT2 SAC tests in professional ice hockey players. J Neurol Sci. 2013;328(1-2):28-31.
32. Vernau BT, Grady MF, Goodman A, et al. Oculomotor and neurocognitive assessment of youth ice hockey players: baseline associations and observations after concussion. Dev Neuropsychol. 2015;40(1):7-11.
33. Fry AF, Hale S. Relationships among processing speed, working memory, and fluid intelligence in children. Biol Psychol. 2000;54(1-3):1-34.
34. Felleman DJ, Van Essen DC. Distributed hierarchical processing in the primate cerebral cortex. Cereb Cortex. 1991;1(1):1-47.
35. Guskiewicz KM, Register-Mihalik J, McCrory P, et al. Evidence-based approach to revising the SCAT2: introducing the SCAT3. Br J Sports Med. 2013;47(5):289-293.
36. Smith AM, Stuart MJ, Dodick DW, et al. Ice Hockey Summit II: zero tolerance for head hits and fighting. Curr Sports Med Rep. 2015;14(2):135-144.
37. Mihalik JP, Beard JR, Petschauer MA, Prentice WE, Guskiewicz KM. Effect of ice hockey helmet fit on cervical spine motion during an emergency log roll procedure. Clin J Sport Med. 2008;18(5):394-398.
38. Banerjee R, Palumbo MA, Fadale PD. Catastrophic cervical spine injuries in the collision sport athlete, part 1: epidemiology, functional anatomy, and diagnosis. Am J Sports Med. 2004;32(4):1077-1087.
39. Reynen PD, Clancy WG Jr. Cervical spine injury, hockey helmets, and face masks. Am J Sports Med. 1994;22(2):167-170.
40. Tator CH, Provvidenza C, Cassidy JD. Update and overview of spinal injuries in Canadian ice hockey, 1943 to 2011: the continuing need for injury prevention and education. Clin J Sport Med. 2016;26(3):232-238.
41. Tator CH, Edmonds VE, Lapczak L, Tator IB. Spinal injuries in ice hockey players, 1966-1987. Can J Surg. 1991;34(1):63-69.
42. Laprade RF, Schnetzler KA, Broxterman RJ, Wentorf F, Gilbert TJ. Cervical spine alignment in the immobilized ice hockey player. A computed tomographic analysis of the effects of helmet removal. Am J Sports Med. 2000;28(6):800-803.
43. Metz CM, Kuhn JE, Greenfield ML. Cervical spine alignment in immobilized hockey players: radiographic analysis with and without helmets and shoulder pads. Clin J Sport Med. 1998;8(2):92-95.
44. National Athletic Trainers’ Association. Appropriate prehospital management of the spine-injured athlete: updated from 1998 document. http://www.nata.org/sites/default/files/Executive-Summary-Spine-Injury-updated.pdf. Updated August 5, 2015. Accessed April 6, 2017.
45. Del Rossi G, Heffernan TP, Horodyski M, Rechtine GR. The effectiveness of extrication collars tested during the execution of spine-board transfer techniques. Spine J. 2004;4(6):619-623.
46. Morganti C, Sweeney CA, Albanese SA, Burak C, Hosea T, Connolly PJ. Return to play after cervical spine injury. Spine. 2001;26(10):1131-1136.
47. Huang P, Anissipour A, McGee W, Lemak L. Return-to-play recommendations after cervical, thoracic, and lumbar spine injuries: a comprehensive review. Sports Health. 2016;8(1):19-25.
48. Shindle MK, Marx RG, Kelly BT, Bisson L, Burke CJ 3rd. Hockey injuries: a pediatric sport update. Curr Opin Pediatr. 2010;22(1):54-60.
49. Molsa J, Kujala U, Myllynen P, Torstila I, Airaksinen O. Injuries to the upper extremity in ice hockey: analysis of a series of 760 injuries. Am J Sports Med. 2003;31(5):751-757.
50. Dwyer T, Petrera M, Bleakney R, Theodoropoulos JS. Shoulder instability in ice hockey players: incidence, mechanism, and MRI findings. Clin Sports Med. 2013;32(4):803-813.
51. LaPrade RF, Wijdicks CA, Griffith CJ. Division I intercollegiate ice hockey team coverage. Br J Sports Med. 2009;43(13):1000-1005.
52. Willimon SC, Gaskill TR, Millett PJ. Acromioclavicular joint injuries: anatomy, diagnosis, and treatment. Phys Sportsmed. 2011;39(1):116-122.
53. Martetschlager F, Horan MP, Warth RJ, Millett PJ. Complications after anatomic fixation and reconstruction of the coracoclavicular ligaments. Am J Sports Med. 2013;41(12):2896-2903.
54. Carofino BC, Mazzocca AD. The anatomic coracoclavicular ligament reconstruction: surgical technique and indications. J Shoulder Elbow Surg. 2010;19(2 suppl):37-46.
55. Laprade RF, Surowiec RK, Sochanska AN, et al. Epidemiology, identification, treatment and return to play of musculoskeletal-based ice hockey injuries. Br J Sports Med. 2014;48(1):4-10.
56. Canadian Orthopaedic Trauma Society. Nonoperative treatment compared with plate fixation of displaced midshaft clavicular fractures. A multicenter, randomized clinical trial. J Bone Joint Surg Am. 2007;89(1):1-10.
57. Lee JT, Nasreddine AY, Black EM, Bae DS, Kocher MS. Posterior sternoclavicular joint injuries in skeletally immature patients. J Pediatr Orthop. 2014;34(4):369-375.
58. Hovelius L. Shoulder dislocation in Swedish ice hockey players. Am J Sports Med. 1978;6(6):373-377.
59. Buss DD, Lynch GP, Meyer CP, Huber SM, Freehill MQ. Nonoperative management for in-season athletes with anterior shoulder instability. Am J Sports Med. 2004;32(6):1430-1433.
60. Mazzocca AD, Brown FM Jr, Carreira DS, Hayden J, Romeo AA. Arthroscopic anterior shoulder stabilization of collision and contact athletes. Am J Sports Med. 2005;33(1):52-60.
61. Harris JD, Romeo AA. Arthroscopic management of the contact athlete with instability. Clin Sports Med. 2013;32(4):709-730.
62. Cho NS, Hwang JC, Rhee YG. Arthroscopic stabilization in anterior shoulder instability: collision athletes versus noncollision athletes. Arthroscopy. 2006;22(9):947-953.
63. Griffin JW, Brockmeier SF. Shoulder instability with concomitant bone loss in the athlete. Orthop Clin North Am. 2015;46(1):89-103.
64. Cohen SB, Towers JD, Bradley JP. Rotator cuff contusions of the shoulder in professional football players: epidemiology and magnetic resonance imaging findings. Am J Sports Med. 2007;35(3):442-447.
65. Lorentzon R, Wedrèn H, Pietilä T. Incidence, nature, and causes of ice hockey injuries. A three-year prospective study of a Swedish elite ice hockey team. Am J Sports Med. 1988;16(4):392-396.
66. Stuart MJ, Smith A. Injuries in Junior A ice hockey. A three-year prospective study. Am J Sports Med. 1995;23(4):458-461.
67. Voaklander DC, Saunders LD, Quinney HA, Macnab RB. Epidemiology of recreational and old-timer ice hockey injuries. Clin J Sport Med. 1996;6(1):15-21.
68. Mölsä J, Airaksinen O, Näsman O, Torstila I. Ice hockey injuries in Finland. A prospective epidemiologic study. Am J Sports Med. 1997;25(4):495-499.
69. Ferrara MS, Schurr KT. Intercollegiate ice hockey injuries: a casual analysis. Clin J Sport Med. 1999;9(1):30-33.
70. Pinto M, Kuhn JE, Greenfield ML, Hawkins RJ. Prospective analysis of ice hockey injuries at the Junior A level over the course of one season. Clin J Sport Med. 1999;9(2):70-74.
71. Emery CA, Meeuwisse WH. Injury rates, risk factors, and mechanisms of injury in minor hockey. Am J Sports Med. 2006;34(12):1960-1969.
72. Kuzuhara K, Shimamoto H, Mase Y. Ice hockey injuries in a Japanese elite team: a 3-year prospective study. J Athl Train. 2009;44(2):208-214.
73. Rishiraj N, Lloyd-Smith R, Lorenz T, Niven B, Michel M. University men’s ice hockey: rates and risk of injuries over 6-years. J Sports Med Phys Fitness. 2009;49(2):159-166.
74. Tuominen M, Stuart MJ, Aubry M, Kannus P, Parkkari J. Injuries in men’s international ice hockey: a 7-year study of the International Ice Hockey Federation Adult World Championship Tournaments and Olympic Winter Games. Br J Sports Med. 2015;49(1):30-36.
75. Heckman JD, Bucholz RW. In: Rockwood CA, Green DP, Heckman JD, Bucholz RW, eds. Rockwood and Green’s Fractures in Adults, Volume 1. Philadelphia, PA: Lippincott Williams & Wilkins; 2001.
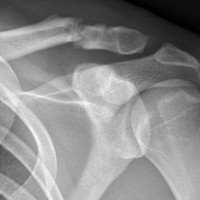
Arthroscopic Excision of Bipartite Patella With Preservation of Lateral Retinaculum in an Adolescent Ice Hockey Player
Take-Home Points
- Bipartite patella is an asymptomatic anatomical variant.
- Occasionally, some adolescent athletes can present with AKP, resulting in decreased participation and performance.
- Bipartite patella is classified in type I, inferior pole; type II, lateral margin; and type III, superior lateral pole, depending on where the accessory patellar fragment is.
- Nonoperative treatment is advocated first. If symptoms persist surgical treatment should be attempted.
In 2% to 3% of the general population, the finding of bipartite patella on knee radiographs is often incidental.1,2 During development, the patella normally originates in a primary ossification center. Occasionally, secondary ossification centers emerge around the margins of the primary center and typically join that center. In some cases, the secondary2 center remains separated, leading to patella partita and an accessory patellar fragment.3,4
The bipartite patella is connected to the primary patella by fibrocartilage. The fibrous attachment may become irritated or separated as a result of trauma, overuse, or strenuous activity.1,5-7 Saupe classification of bipartite patella is based on accessory patellar fragment location: type I, inferior pole; type II, lateral margin; and type III, superior lateral pole.8 When an individual with a bipartite patella becomes symptomatic, anterior knee pain (AKP) is the most common complaint—it has been described in adolescent athletes in numerous sports.7,9-11For most patients, first-line treatment is nonoperative management. A typical regimen includes reduced activity, use of nonsteroidal anti-inflammatory drugs, physical therapy, and isometric quadriceps-strengthening exercises.1,12 Other nonoperative approaches described in the literature are immobilization,5,10 steroid and anesthetic injection, and ultrasound therapy.13 If symptoms do not improve, surgical treatment should be considered. Surgical treatment options include open excision of fragment,3,9,12 arthroscopic excision of fragment,7,14,15 tension band wiring,5,16 open reduction and internal fixation,17 open or arthroscopic vastus lateralis release,18-20 and lateral retinacular release.21 However, the optimal surgical option remains controversial.
In this case report, we present a modification of an arthroscopic surgical technique for excising a symptomatic bipartite patella and report midterm clinical outcomes. The patient provided written informed consent for print and electronic publication of this report.
Case Report
A 16-year-old elite male ice hockey player presented to clinic with a 2-week history of left AKP. He could not recall a specific injury that triggered the symptoms. Radiographs were obtained at an outside institution, and knee patellar fracture was diagnosed. The patient, placed in a straight-leg immobilizer, later presented to a referral clinic for a second opinion and further evaluation. Physical examination revealed significant tenderness to palpation of the lateral aspect of the patella. Range of motion was symmetric and fully intact. Patellar mobility was excellent. However, the patient could not perform a straight-leg raise because of the pain.
We obtained anteroposterior and lateral radiographs (Figures 1A, 1B), which showed evidence of a Saupe type III bipartite patella with separation at the superolateral pole. 

Two years later, the patient returned with left AKP, again localized to the lateral aspect of the patella, over the bipartite fragment. The pain was significant with compression. Given the patient’s history, arthroscopic excision of the bipartite patella was recommended. After discussing all treatment options, the patient elected to proceed with the surgery.
Surgical Technique
The patient was positioned supine on the operating table. Medial and lateral parapatellar arthroscopic portals were created. Menisci, cruciate ligaments, and tibiofemoral articular cartilage were arthroscopically visualized and determined to be normal. The bipartite patella was easily visualized, and notably loose when probed. Grade 2 chondromalacia was present diffusely throughout the bipartite patella and on the far lateral aspect of the patella, at the fragment interface.
Attention was then turned to arthroscopic removal of the accessory patellar fragment (Figures 3A, 3B). 

Postoperative Rehabilitation
Rehabilitation focused on protection of the healing patella and accelerated rehabilitation for early return to play. Range-of-motion exercises and stationary bicycling were initiated on postoperative day 1. Weight-bearing was allowed as tolerated. Quadriceps sets, straight-leg raises, and ankle pumps were performed 5 times daily for 6 weeks. Six weeks after surgery, the patient was cleared, and he returned to full on-ice activities.
Outcomes
This study was approved by an Institutional Review Board. Preoperative and postoperative outcomes were obtained and stored in a data registry. The patient’s Lysholm score22 improved from 71 before surgery to 100 at 31-month follow-up. In addition, his subjective International Knee Documentation Committee score23 improved from 65.5 before surgery to 72.4 after surgery. At follow-up, patient satisfaction with outcome was 10/10. In addition, the patient had returned to playing hockey at a higher national level without functional limitation.
Discussion
The most important finding in this case is that arthroscopic excision of a bipartite patella with preservation of the lateral retinaculum in an elite adolescent hockey player resulted in improved subjective clinical outcomes scores and early return to competition. Arthroscopic excision was favored over open excision in this patient because of potential quicker recovery,14 less pain, and expedited return to competition. In addition, previous arthroscopic techniques were modified to shorten postoperative rehabilitation. The modified technique included preservation of the lateral retinaculum and total arthroscopic excision of the accessory bipartite patella fragment.
Although results of open techniques have been favorable,3,8,9 these procedures are far more invasive than arthroscopic techniques and may result in loss of quadriceps strength and prolonged rehabilitation.18 Weckström and colleagues12 followed 25 male military recruits for a minimum of 10 years after open excision of symptomatic bipartite patella. Mean Kujala score was 95 (range, 75-100), and median visual analog scale score for knee pain was 1.0 (range, 0.0-6.0). In a study by Bourne and Bianco,3 13 of 16 patients who were followed for an average of 7 years experienced complete pain relief with an average recovery time of 2 months.
Other studies have described the arthroscopic excision technique for symptomatic bipartite patella,7,14,15 but outcomes are underreported, especially for follow-ups longer than 2 years. Felli and colleagues7 described a case of arthroscopic excision and lateral release in a 23-year-old female professional volleyball player; at 1-year follow-up, the patient was symptom-free and back to full athletic participation. Azarbod and colleagues14 also reported on a patient who was symptom-free, 6 weeks after arthroscopic excision of bipartite patella. Carney and colleagues15 indicated that successful excision of bipartite patella was evident on 6-month radiographic follow-up. Our 31-month follow-up is the longest of any study on arthroscopic excision of bipartite patella. Clinical outcomes were excellent both in our patient’s case and in the earlier studies.
Our patient was a high-level hockey player who wanted to return to competition as quickly as possible. Conservative management, including physical therapy, initially resolved his symptoms and allowed him to resume on-ice activities after 6 weeks. In time, however, his symptoms returned and began limiting his on-ice performance. Arthroscopic removal of the bipartite patella accessory fragment allowed him to return to full on-ice activities after 6 weeks. His case provides evidence that arthroscopic management of bipartite patella with preservation of the vastus lateralis and lateral retinaculum may be an excellent treatment option for patients who want to return to athletics as quickly as possible.
Our technique of arthroscopic excision with preservation of lateral retinaculum is an excellent treatment option for symptomatic bipartite patella. This option, combined with an aggressive rehabilitation protocol, allows for pain relief and expedited return to competition.
Am J Orthop. 2017;46(3):135-138. Copyright Frontline Medical Communications Inc. 2017. All rights reserved.
1. Atesok K, Doral MN, Lowe J, Finsterbush A. Symptomatic bipartite patella: treatment alternatives. J Am Acad Orthop Surg. 2008;16(8):455-461.
2. Insall J. Current concepts review: patellar pain. J Bone Joint Surg Am. 1982;64(1):147-152.
3. Bourne MH, Bianco AJ Jr. Bipartite patella in the adolescent: results of surgical excision. J Pediatr Orthop. 1990;10(1):69-73.
4. Oohashi Y, Koshino T, Oohashi Y. Clinical features and classification of bipartite or tripartite patella. Knee Surg Sports Traumatol Arthrosc. 2010;18(11):1465-1469.
5. Okuno H, Sugita T, Kawamata T, Ohnuma M, Yamada N, Yoshizumi Y. Traumatic separation of a type I bipartite patella: a report of four knees. Clin Orthop Relat Res. 2004;(420):257-260.
6. Yoo JH, Kim EH, Ryu HK. Arthroscopic removal of separated bipartite patella causing snapping knee syndrome. Orthopedics. 2008;31(7):717.
7. Felli L, Fiore M, Biglieni L. Arthroscopic treatment of symptomatic bipartite patella. Knee Surg Sports Traumatol Arthrosc. 2011;19(3):398-399.
8. Green WT Jr. Painful bipartite patellae. A report of three cases. Clin Orthop Relat Res. 1975;(110):197-200.
9. Ishikawa H, Sakurai A, Hirata S, et al. Painful bipartite patella in young athletes. The diagnostic value of skyline views taken in squatting position and the results of surgical excision. Clin Orthop Relat Res. 1994;(305):223-228.
10. Stocker RL, van Laer L. Injury of a bipartite patella in a young upcoming sportsman. Arch Orthop Trauma Surg. 2011;131(1):75-78.
11. Wong CK. Bipartite patella in a young athlete. J Orthop Sports Phys Ther. 2009;39(7):560.
12. Weckström M, Parviainen M, Pihlajamäki HK. Excision of painful bipartite patella: good long-term outcome in young adults. Clin Orthop Relat Res. 2008;466(11):2848-2855.
13. Kumahashi N, Uchio Y, Iwasa J, Kawasaki K, Adachi N, Ochi M. Bone union of painful bipartite patella after treatment with low-intensity pulsed ultrasound: report of two cases. Knee. 2008;15(1):50-53.
14. Azarbod P, Agar G, Patel V. Arthroscopic excision of a painful bipartite patella fragment. Arthroscopy. 2005;21(8):1006.
15. Carney J, Thompson D, O’Daniel J, Cassidy J. Arthroscopic excision of a painful bipartite patella fragment. Am J Orthop. 2010;39(1):40-43.
16. Tauber M, Matis N, Resch H. Traumatic separation of an uncommon bipartite patella type: a case report. Knee Surg Sports Traumatol Arthrosc. 2007;15(1):83-87.
17. Werner S, Durkan M, Jones J, Quilici S, Crawford D. Symptomatic bipartite patella: three subtypes, three representative cases. J Knee Surg. 2013;26(suppl 1):S72-S76.
18. Adachi N, Ochi M, Yamaguchi H, Uchio Y, Kuriwaka M. Vastus lateralis release for painful bipartite patella. Arthroscopy. 2002;18(4):404-411.
19. Maeno S, Hashimoto D, Otani T, Masumoto K, Hui C. The “coiling-up procedure”: a novel technique for extra-articular arthroscopy. Arthroscopy. 2010;26(11):1551-1555.
20. Ogata K. Painful bipartite patella. A new approach to operative treatment. J Bone Joint Surg Am. 1994;76(4):573-578.
21. Mori Y, Okumo H, Iketani H, Kuroki Y. Efficacy of lateral retinacular release for painful bipartite patella. Am J Sports Med. 1995;23(1):13-18.
22. Lysholm J, Gillquist J. Evaluation of knee ligament surgery results with special emphasis on use of a scoring scale. Am J Sports Med. 1982;10(3):150-154
23. Grevnerts HT, Terwee CB, Kvist J. The measurement properties of the IKDC-subjective knee form. Knee Surg Sports Traumatol Arthrosc. 2015;23(12):3698-3706.
Take-Home Points
- Bipartite patella is an asymptomatic anatomical variant.
- Occasionally, some adolescent athletes can present with AKP, resulting in decreased participation and performance.
- Bipartite patella is classified in type I, inferior pole; type II, lateral margin; and type III, superior lateral pole, depending on where the accessory patellar fragment is.
- Nonoperative treatment is advocated first. If symptoms persist surgical treatment should be attempted.
In 2% to 3% of the general population, the finding of bipartite patella on knee radiographs is often incidental.1,2 During development, the patella normally originates in a primary ossification center. Occasionally, secondary ossification centers emerge around the margins of the primary center and typically join that center. In some cases, the secondary2 center remains separated, leading to patella partita and an accessory patellar fragment.3,4
The bipartite patella is connected to the primary patella by fibrocartilage. The fibrous attachment may become irritated or separated as a result of trauma, overuse, or strenuous activity.1,5-7 Saupe classification of bipartite patella is based on accessory patellar fragment location: type I, inferior pole; type II, lateral margin; and type III, superior lateral pole.8 When an individual with a bipartite patella becomes symptomatic, anterior knee pain (AKP) is the most common complaint—it has been described in adolescent athletes in numerous sports.7,9-11For most patients, first-line treatment is nonoperative management. A typical regimen includes reduced activity, use of nonsteroidal anti-inflammatory drugs, physical therapy, and isometric quadriceps-strengthening exercises.1,12 Other nonoperative approaches described in the literature are immobilization,5,10 steroid and anesthetic injection, and ultrasound therapy.13 If symptoms do not improve, surgical treatment should be considered. Surgical treatment options include open excision of fragment,3,9,12 arthroscopic excision of fragment,7,14,15 tension band wiring,5,16 open reduction and internal fixation,17 open or arthroscopic vastus lateralis release,18-20 and lateral retinacular release.21 However, the optimal surgical option remains controversial.
In this case report, we present a modification of an arthroscopic surgical technique for excising a symptomatic bipartite patella and report midterm clinical outcomes. The patient provided written informed consent for print and electronic publication of this report.
Case Report
A 16-year-old elite male ice hockey player presented to clinic with a 2-week history of left AKP. He could not recall a specific injury that triggered the symptoms. Radiographs were obtained at an outside institution, and knee patellar fracture was diagnosed. The patient, placed in a straight-leg immobilizer, later presented to a referral clinic for a second opinion and further evaluation. Physical examination revealed significant tenderness to palpation of the lateral aspect of the patella. Range of motion was symmetric and fully intact. Patellar mobility was excellent. However, the patient could not perform a straight-leg raise because of the pain.
We obtained anteroposterior and lateral radiographs (Figures 1A, 1B), which showed evidence of a Saupe type III bipartite patella with separation at the superolateral pole.
Two years later, the patient returned with left AKP, again localized to the lateral aspect of the patella, over the bipartite fragment. The pain was significant with compression. Given the patient’s history, arthroscopic excision of the bipartite patella was recommended. After discussing all treatment options, the patient elected to proceed with the surgery.
Surgical Technique
The patient was positioned supine on the operating table. Medial and lateral parapatellar arthroscopic portals were created. Menisci, cruciate ligaments, and tibiofemoral articular cartilage were arthroscopically visualized and determined to be normal. The bipartite patella was easily visualized, and notably loose when probed. Grade 2 chondromalacia was present diffusely throughout the bipartite patella and on the far lateral aspect of the patella, at the fragment interface.
Attention was then turned to arthroscopic removal of the accessory patellar fragment (Figures 3A, 3B).
Postoperative Rehabilitation
Rehabilitation focused on protection of the healing patella and accelerated rehabilitation for early return to play. Range-of-motion exercises and stationary bicycling were initiated on postoperative day 1. Weight-bearing was allowed as tolerated. Quadriceps sets, straight-leg raises, and ankle pumps were performed 5 times daily for 6 weeks. Six weeks after surgery, the patient was cleared, and he returned to full on-ice activities.
Outcomes
This study was approved by an Institutional Review Board. Preoperative and postoperative outcomes were obtained and stored in a data registry. The patient’s Lysholm score22 improved from 71 before surgery to 100 at 31-month follow-up. In addition, his subjective International Knee Documentation Committee score23 improved from 65.5 before surgery to 72.4 after surgery. At follow-up, patient satisfaction with outcome was 10/10. In addition, the patient had returned to playing hockey at a higher national level without functional limitation.
Discussion
The most important finding in this case is that arthroscopic excision of a bipartite patella with preservation of the lateral retinaculum in an elite adolescent hockey player resulted in improved subjective clinical outcomes scores and early return to competition. Arthroscopic excision was favored over open excision in this patient because of potential quicker recovery,14 less pain, and expedited return to competition. In addition, previous arthroscopic techniques were modified to shorten postoperative rehabilitation. The modified technique included preservation of the lateral retinaculum and total arthroscopic excision of the accessory bipartite patella fragment.
Although results of open techniques have been favorable,3,8,9 these procedures are far more invasive than arthroscopic techniques and may result in loss of quadriceps strength and prolonged rehabilitation.18 Weckström and colleagues12 followed 25 male military recruits for a minimum of 10 years after open excision of symptomatic bipartite patella. Mean Kujala score was 95 (range, 75-100), and median visual analog scale score for knee pain was 1.0 (range, 0.0-6.0). In a study by Bourne and Bianco,3 13 of 16 patients who were followed for an average of 7 years experienced complete pain relief with an average recovery time of 2 months.
Other studies have described the arthroscopic excision technique for symptomatic bipartite patella,7,14,15 but outcomes are underreported, especially for follow-ups longer than 2 years. Felli and colleagues7 described a case of arthroscopic excision and lateral release in a 23-year-old female professional volleyball player; at 1-year follow-up, the patient was symptom-free and back to full athletic participation. Azarbod and colleagues14 also reported on a patient who was symptom-free, 6 weeks after arthroscopic excision of bipartite patella. Carney and colleagues15 indicated that successful excision of bipartite patella was evident on 6-month radiographic follow-up. Our 31-month follow-up is the longest of any study on arthroscopic excision of bipartite patella. Clinical outcomes were excellent both in our patient’s case and in the earlier studies.
Our patient was a high-level hockey player who wanted to return to competition as quickly as possible. Conservative management, including physical therapy, initially resolved his symptoms and allowed him to resume on-ice activities after 6 weeks. In time, however, his symptoms returned and began limiting his on-ice performance. Arthroscopic removal of the bipartite patella accessory fragment allowed him to return to full on-ice activities after 6 weeks. His case provides evidence that arthroscopic management of bipartite patella with preservation of the vastus lateralis and lateral retinaculum may be an excellent treatment option for patients who want to return to athletics as quickly as possible.
Our technique of arthroscopic excision with preservation of lateral retinaculum is an excellent treatment option for symptomatic bipartite patella. This option, combined with an aggressive rehabilitation protocol, allows for pain relief and expedited return to competition.
Am J Orthop. 2017;46(3):135-138. Copyright Frontline Medical Communications Inc. 2017. All rights reserved.
1. Atesok K, Doral MN, Lowe J, Finsterbush A. Symptomatic bipartite patella: treatment alternatives. J Am Acad Orthop Surg. 2008;16(8):455-461.
2. Insall J. Current concepts review: patellar pain. J Bone Joint Surg Am. 1982;64(1):147-152.
3. Bourne MH, Bianco AJ Jr. Bipartite patella in the adolescent: results of surgical excision. J Pediatr Orthop. 1990;10(1):69-73.
4. Oohashi Y, Koshino T, Oohashi Y. Clinical features and classification of bipartite or tripartite patella. Knee Surg Sports Traumatol Arthrosc. 2010;18(11):1465-1469.
5. Okuno H, Sugita T, Kawamata T, Ohnuma M, Yamada N, Yoshizumi Y. Traumatic separation of a type I bipartite patella: a report of four knees. Clin Orthop Relat Res. 2004;(420):257-260.
6. Yoo JH, Kim EH, Ryu HK. Arthroscopic removal of separated bipartite patella causing snapping knee syndrome. Orthopedics. 2008;31(7):717.
7. Felli L, Fiore M, Biglieni L. Arthroscopic treatment of symptomatic bipartite patella. Knee Surg Sports Traumatol Arthrosc. 2011;19(3):398-399.
8. Green WT Jr. Painful bipartite patellae. A report of three cases. Clin Orthop Relat Res. 1975;(110):197-200.
9. Ishikawa H, Sakurai A, Hirata S, et al. Painful bipartite patella in young athletes. The diagnostic value of skyline views taken in squatting position and the results of surgical excision. Clin Orthop Relat Res. 1994;(305):223-228.
10. Stocker RL, van Laer L. Injury of a bipartite patella in a young upcoming sportsman. Arch Orthop Trauma Surg. 2011;131(1):75-78.
11. Wong CK. Bipartite patella in a young athlete. J Orthop Sports Phys Ther. 2009;39(7):560.
12. Weckström M, Parviainen M, Pihlajamäki HK. Excision of painful bipartite patella: good long-term outcome in young adults. Clin Orthop Relat Res. 2008;466(11):2848-2855.
13. Kumahashi N, Uchio Y, Iwasa J, Kawasaki K, Adachi N, Ochi M. Bone union of painful bipartite patella after treatment with low-intensity pulsed ultrasound: report of two cases. Knee. 2008;15(1):50-53.
14. Azarbod P, Agar G, Patel V. Arthroscopic excision of a painful bipartite patella fragment. Arthroscopy. 2005;21(8):1006.
15. Carney J, Thompson D, O’Daniel J, Cassidy J. Arthroscopic excision of a painful bipartite patella fragment. Am J Orthop. 2010;39(1):40-43.
16. Tauber M, Matis N, Resch H. Traumatic separation of an uncommon bipartite patella type: a case report. Knee Surg Sports Traumatol Arthrosc. 2007;15(1):83-87.
17. Werner S, Durkan M, Jones J, Quilici S, Crawford D. Symptomatic bipartite patella: three subtypes, three representative cases. J Knee Surg. 2013;26(suppl 1):S72-S76.
18. Adachi N, Ochi M, Yamaguchi H, Uchio Y, Kuriwaka M. Vastus lateralis release for painful bipartite patella. Arthroscopy. 2002;18(4):404-411.
19. Maeno S, Hashimoto D, Otani T, Masumoto K, Hui C. The “coiling-up procedure”: a novel technique for extra-articular arthroscopy. Arthroscopy. 2010;26(11):1551-1555.
20. Ogata K. Painful bipartite patella. A new approach to operative treatment. J Bone Joint Surg Am. 1994;76(4):573-578.
21. Mori Y, Okumo H, Iketani H, Kuroki Y. Efficacy of lateral retinacular release for painful bipartite patella. Am J Sports Med. 1995;23(1):13-18.
22. Lysholm J, Gillquist J. Evaluation of knee ligament surgery results with special emphasis on use of a scoring scale. Am J Sports Med. 1982;10(3):150-154
23. Grevnerts HT, Terwee CB, Kvist J. The measurement properties of the IKDC-subjective knee form. Knee Surg Sports Traumatol Arthrosc. 2015;23(12):3698-3706.

Internal Carotid Artery Dissection After Indirect Blunt Cervical Trauma in an Ice Hockey Goaltender
Take-Home Points
- ICA dissections may occur from direct or indirect trauma.
- Symptoms can be mild, including a persistent headache.
- High clinical suspicion is required for diagnosis when symptoms are mild.
- Neuroimaging is required for definitive diagnosis.
- Conservative management with serial imaging can yield successful outcomes.
Cervical artery dissection (CAD) is an uncommon but potentially life-threatening condition that accounts for a high proportion of ischemic strokes in patients under the age of 45 years.1-4 The extracranial internal carotid arteries (ICAs) and vertebral arteries are most commonly involved; dissections can occur after either direct trauma to the neck, or indirect trauma resulting in acute hyperextension or hyperflexion.4-7 ICA dissection can be difficult to diagnose because of the varying symptomatology. Clinical presentation depends on stenosis location, degree of luminal narrowing, and presence or absence of ischemic stroke. Neurologic symptoms may be delayed, and misdiagnosis of an isolated soft-tissue contusion, whiplash, can be made in the setting of indirect cervical trauma.
Although this entity is well described in the literature,2,3,5,8 there are few reported cases of injuries sustained during high-intensity athletic competition. In this case report, we describe the symptoms, physical examination findings, diagnostic imaging results, and treatment of a young male athlete who presented with delayed-onset symptoms of ICA dissection resulting from indirect cervical trauma sustained during an ice hockey game. We discuss the importance of a high level of clinical suspicion in the diagnosis of neck injuries sustained during athletic competition, as well as the need for early vascular imaging for diagnosis. The patient provided written informed consent for print and electronic publication of this case report.
Case Report
The patient was a right-handed 32-year-old professional hockey goaltender. Four days before diagnosis, his goaltending mask and attached neck-protector were inadvertently lifted by another player’s stick just as a puck traveling at high speed struck him in the neck, to the right of the larynx, causing acute neck hyperextension. He immediately experienced discomfort and fell to the ice, saying he was “dizzy and light-headed.” Play was stopped, and medical personnel attended to him. His symptoms resolved, and he resumed play without any notable deficits. The next day, he noted discomfort at the impact site, but no additional symptoms, and received a presumptive diagnosis of cervical soft-tissue contusion. Continuing to participate in hockey that day, he did not develop any symptoms other than superficial cervical discomfort. However, the next morning, he presented complaining of severe right frontotemporal headache, which had persisted overnight. Orthopedic examination revealed palpable tenderness over the anterior cervical musculature, including the sternocleidomastoid and strap muscles. There was no appreciable hematoma in the contused area. Cervical range of motion was otherwise preserved. Cervical spine examination, including dermatomal and myotomal examination, was normal, as was cranial nerve examination. However, given the headache intensity and the recency of the injury, the potential for vascular or neurologic injury was considered. A neurology consultation was obtained, and arrangements were made for advanced cross-sectional imaging.
On further evaluation, the patient denied loss of consciousness, seizure, vomiting, amnesia, visual disturbance, language or cognitive impairment, balance or coordination difficulties, or any appreciable face or limb weakness. Review of systems was otherwise negative. Detailed neurologic examination did not reveal any cranial nerve deficits, and pupils were 3 mm, equal, and normally responsive to light and accommodation. Muscular tone and strength were symmetric and full in the upper and lower extremities. Gait, coordination, and response to vibration and temperature sensation were all preserved.
Magnetic resonance imaging of the head and neck was normal, but magnetic resonance angiography (MRA) of the neck showed a 1-cm-long region of the ICA, before piercing the petrous bone, with evidence of dissection. 
Given the normal neurologic examination, and no evidence of brain infarction or other neurovascular complications, the acute ICA dissection was managed with antiplatelet therapy using aspirin (325 mg/d). In addition, the patient was advised to refrain from strenuous physical activity and to present to the hospital immediately if symptoms worsened or any neurologic impairment developed. Follow-up and repeat MRA were planned to monitor healing progression.
Two weeks after injury, the patient returned for follow-up. His headache and neck pain had resolved. Physical examination findings were unchanged, and there were no notable neurologic deficits. Repeat MRA findings were essentially unchanged, except for slightly increased luminal stenosis, exceeding 50% (Figure 2), attributable to intramural hematoma formation. 

At 6-week follow-up, the patient had no clinical symptoms and no recurrence of headaches. 

Discussion
In cases of direct (blunt) or indirect cervical trauma, CAD should be considered, as it carries a risk of potentially debilitating ischemic stroke in otherwise healthy young patients. Fortunately, CAD is rare; its annual incidence is 1 in 100,000, occurring in 0.08% to 1.2% of blunt trauma cases.9 
As symptoms of ICA dissection can vary depending on stenosis severity, diagnosis can be challenging. The classically associated triad of symptoms includes unilateral head, facial, or neck pain accompanied by partial Horner syndrome with progression to cerebral or retinal ischemia. However, these symptoms occur in less than a third of patients with ICA dissection.2 Neck pain may occur secondary to blunt cervical trauma, consistent with a cervical soft-tissue contusion; however, it may have more severe implications and should be carefully monitored, particularly if accompanied by additional symptoms, such as headache. Headaches, which are present in 44% to 69% of patients, are often unilateral and constant. Either headache or neck pain in isolation is relatively uncommon, occurring in <10% of cases,2 though retrospective reviews of delayed-onset ICA dissection found atypical headache or neck pain in 100% of patients,11 indicating that persistent symptoms should be further evaluated.
More commonly, patients present with neurologic symptoms, particularly Horner syndrome, which is caused by the disruption of the sympathetic nerve fibers adjacent to the ICA, resulting in ipsilateral ptosis and miosis. In addition, patients may present with cranial nerve palsies, most commonly involving cranial nerve XII (the hypoglossal nerve), resulting in tongue weakness and abnormal taste. These and other neurologic findings associated with retinal or cerebral ischemia should raise clinical suspicion for the injury and prompt computed tomography or MRA evaluation.
MRA has largely replaced conventional angiography for the diagnosis of CAD. As MRA is noninvasive, it allows for improved visualization of luminal narrowing and for evaluation of the arterial wall and intramural hematoma.2 Because of the potential for devastating sequelae with missed or delayed diagnosis, several authors have become proponents of early aggressive screening for detection of these injuries.9 Postdiagnostic treatment depends on the presence of neurologic symptoms. Management is directed toward limiting neurologic deficits; anticoagulant or antiplatelet agents are used to prevent thromboembolic events. A randomized controlled trial and other studies have failed to find any appreciable difference in subsequent rates of stroke or associated complications with use of either class of medication.8,12 Conventionally, treatment is continued for 3 to 6 months, depending on clinical resolution. Endovascular or surgical intervention typically is reserved for extreme luminal narrowing, conditions that are preventing anticoagulation, an expanding area of dissection with a persistent pseudoaneurysm, and cases of failed medical management with subsequent ischemic stroke.2The literature includes several case reports involving indirect trauma in recreational athletes. First, a 31-year-old woman sustained an ICA dissection secondary to a head injury that occurred during a soccer match; she presented with headache, altered sense of taste, and objective findings of ptosis and miosis consistent with Horner syndrome.13 Second, a 39-year-old man had an ICA dissection after a snowboarding fall that caused neck hyperextension; he presented with periocular headache, ptosis, and miosis.6 Third, 3 people who participated in CrossFit training sustained ICA dissection.7 They presented with varying degrees of neurologic symptoms: ptosis and miosis; right-side upper extremity ataxia; and visual distortion and receptive aphasia. Our patient’s ICA dissection resulted from indirect trauma that caused sudden hyperextension and lateral flexion in response to contact from a hockey puck. However, his case is unique in that symptoms onset was delayed, and there were no associated neurologic findings on clinical presentation. His case should raise awareness of this potential diagnosis, even in the absence of overt neurologic findings. In addition, the patient’s return to sport at 8 weeks was facilitated by full clinical resolution of symptoms and thorough radiographic documentation of improved intramural narrowing. Finally, to our knowledge this is the first report of this injury in a professional athlete.
Conclusion
We have reported the case of a 32-year-old professional hockey goaltender who presented with isolated, persistent, worsening headache of delayed onset after ICA dissection. The ICA dissection resulted from indirect trauma, with reaction to a puck causing acute hyperextension and rotational injury. To our knowledge, this is the first report of a case of ICA dissection in an athlete, lacking neurologic examination findings that could aid in the diagnosis. The index of suspicion for CAD should be high after direct or indirect cervical trauma when patients present with unilateral neck pain or headache, even in the absence of neurologic findings, as stroke is a catastrophic but preventable complication.
Am J Orthop. 2017;46(3):E139-E143. Copyright Frontline Medical Communications Inc. 2017. All rights reserved.
1. Mohan IV. Current optimal assessment and management of carotid and vertebral spontaneous and traumatic dissection. Angiology. 2014;65(4):274-283.
2. Patel RR, Adam R, Maldjian C, Lincoln CM, Yuen A, Arneja A. Cervical carotid artery dissection: current review of diagnosis and treatment. Cardiol Rev. 2012;20(3):145-152.
3. Biller J, Sacco RL, Albuquerque FC, et al; American Heart Association Stroke Council. Cervical arterial dissections and association with cervical manipulative therapy: a statement for healthcare professionals from the American Heart Association/American Stroke Association. Stroke. 2014;45(10):3155-3174.
4. Fukunaga N, Hanaoka M, Sato K. Asymptomatic common carotid artery dissection caused by blunt injury. Emerg Med J. 2011;28(1):50.
5. Chen J, Zhou X, Li C, Cheung BM. Risk of stroke due to spontaneous cervical artery dissection. Intern Med. 2013;52(19):2237-2240.
6. Kalantzis G, Georgalas I, Chang BY, Ong C, El-Hindy N. An unusual case of traumatic internal carotid artery dissection during snowboarding. J Sports Sci Med. 2014;13(2):451-453.
7. Lu A, Shen P, Lee P, et al. CrossFit-related cervical internal carotid artery dissection. Emerg Radiol. 2015;22(4):449-452.
8. CADISS Trial Investigators, Markus HS, Hayter E, Levi C, Feldman A, Venables G, Norris J. Antiplatelet treatment compared with anticoagulation treatment for cervical artery dissection (CADISS): a randomised trial. Lancet Neurol. 2015;14(4):361-367.
9. van Wessem KJ, Meijer JM, Leenen LP, van der Worp HB, Moll FL, de Borst GJ. Blunt traumatic carotid artery dissection still a pitfall? The rationale for aggressive screening. Eur J Trauma Emerg Surg. 2011;37(2):147-154.
10. Haneline M, Triano J. Cervical artery dissection. A comparison of highly dynamic mechanisms: manipulation versus motor vehicle collision. J Manipulative Physiol Ther. 2005;28(1):57-63.
11. Thomas LC, Rivett DA, Attia JR, Levi C. Risk factors and clinical presentation of cervical arterial dissection: preliminary results of a prospective case-control study. J Orthop Sports Phys Ther. 2015;45(7):503-511.
12. Lyrer P, Engelter S. Antithrombotic drugs for carotid artery dissection. Cochrane Database Syst Rev. 2010;(10):CD000255.
13. Creavin ST, Rice CM, Pollentine A, Cowburn P. Carotid artery dissection presenting with isolated headache and Horner syndrome after minor head injury. Am J Emerg Med. 2012;30(9):2103.e5-e7.
Take-Home Points
- ICA dissections may occur from direct or indirect trauma.
- Symptoms can be mild, including a persistent headache.
- High clinical suspicion is required for diagnosis when symptoms are mild.
- Neuroimaging is required for definitive diagnosis.
- Conservative management with serial imaging can yield successful outcomes.
Cervical artery dissection (CAD) is an uncommon but potentially life-threatening condition that accounts for a high proportion of ischemic strokes in patients under the age of 45 years.1-4 The extracranial internal carotid arteries (ICAs) and vertebral arteries are most commonly involved; dissections can occur after either direct trauma to the neck, or indirect trauma resulting in acute hyperextension or hyperflexion.4-7 ICA dissection can be difficult to diagnose because of the varying symptomatology. Clinical presentation depends on stenosis location, degree of luminal narrowing, and presence or absence of ischemic stroke. Neurologic symptoms may be delayed, and misdiagnosis of an isolated soft-tissue contusion, whiplash, can be made in the setting of indirect cervical trauma.
Although this entity is well described in the literature,2,3,5,8 there are few reported cases of injuries sustained during high-intensity athletic competition. In this case report, we describe the symptoms, physical examination findings, diagnostic imaging results, and treatment of a young male athlete who presented with delayed-onset symptoms of ICA dissection resulting from indirect cervical trauma sustained during an ice hockey game. We discuss the importance of a high level of clinical suspicion in the diagnosis of neck injuries sustained during athletic competition, as well as the need for early vascular imaging for diagnosis. The patient provided written informed consent for print and electronic publication of this case report.
Case Report
The patient was a right-handed 32-year-old professional hockey goaltender. Four days before diagnosis, his goaltending mask and attached neck-protector were inadvertently lifted by another player’s stick just as a puck traveling at high speed struck him in the neck, to the right of the larynx, causing acute neck hyperextension. He immediately experienced discomfort and fell to the ice, saying he was “dizzy and light-headed.” Play was stopped, and medical personnel attended to him. His symptoms resolved, and he resumed play without any notable deficits. The next day, he noted discomfort at the impact site, but no additional symptoms, and received a presumptive diagnosis of cervical soft-tissue contusion. Continuing to participate in hockey that day, he did not develop any symptoms other than superficial cervical discomfort. However, the next morning, he presented complaining of severe right frontotemporal headache, which had persisted overnight. Orthopedic examination revealed palpable tenderness over the anterior cervical musculature, including the sternocleidomastoid and strap muscles. There was no appreciable hematoma in the contused area. Cervical range of motion was otherwise preserved. Cervical spine examination, including dermatomal and myotomal examination, was normal, as was cranial nerve examination. However, given the headache intensity and the recency of the injury, the potential for vascular or neurologic injury was considered. A neurology consultation was obtained, and arrangements were made for advanced cross-sectional imaging.
On further evaluation, the patient denied loss of consciousness, seizure, vomiting, amnesia, visual disturbance, language or cognitive impairment, balance or coordination difficulties, or any appreciable face or limb weakness. Review of systems was otherwise negative. Detailed neurologic examination did not reveal any cranial nerve deficits, and pupils were 3 mm, equal, and normally responsive to light and accommodation. Muscular tone and strength were symmetric and full in the upper and lower extremities. Gait, coordination, and response to vibration and temperature sensation were all preserved.
Magnetic resonance imaging of the head and neck was normal, but magnetic resonance angiography (MRA) of the neck showed a 1-cm-long region of the ICA, before piercing the petrous bone, with evidence of dissection.
Given the normal neurologic examination, and no evidence of brain infarction or other neurovascular complications, the acute ICA dissection was managed with antiplatelet therapy using aspirin (325 mg/d). In addition, the patient was advised to refrain from strenuous physical activity and to present to the hospital immediately if symptoms worsened or any neurologic impairment developed. Follow-up and repeat MRA were planned to monitor healing progression.
Two weeks after injury, the patient returned for follow-up. His headache and neck pain had resolved. Physical examination findings were unchanged, and there were no notable neurologic deficits. Repeat MRA findings were essentially unchanged, except for slightly increased luminal stenosis, exceeding 50% (Figure 2), attributable to intramural hematoma formation.
At 6-week follow-up, the patient had no clinical symptoms and no recurrence of headaches.
Discussion
In cases of direct (blunt) or indirect cervical trauma, CAD should be considered, as it carries a risk of potentially debilitating ischemic stroke in otherwise healthy young patients. Fortunately, CAD is rare; its annual incidence is 1 in 100,000, occurring in 0.08% to 1.2% of blunt trauma cases.9
As symptoms of ICA dissection can vary depending on stenosis severity, diagnosis can be challenging. The classically associated triad of symptoms includes unilateral head, facial, or neck pain accompanied by partial Horner syndrome with progression to cerebral or retinal ischemia. However, these symptoms occur in less than a third of patients with ICA dissection.2 Neck pain may occur secondary to blunt cervical trauma, consistent with a cervical soft-tissue contusion; however, it may have more severe implications and should be carefully monitored, particularly if accompanied by additional symptoms, such as headache. Headaches, which are present in 44% to 69% of patients, are often unilateral and constant. Either headache or neck pain in isolation is relatively uncommon, occurring in <10% of cases,2 though retrospective reviews of delayed-onset ICA dissection found atypical headache or neck pain in 100% of patients,11 indicating that persistent symptoms should be further evaluated.
More commonly, patients present with neurologic symptoms, particularly Horner syndrome, which is caused by the disruption of the sympathetic nerve fibers adjacent to the ICA, resulting in ipsilateral ptosis and miosis. In addition, patients may present with cranial nerve palsies, most commonly involving cranial nerve XII (the hypoglossal nerve), resulting in tongue weakness and abnormal taste. These and other neurologic findings associated with retinal or cerebral ischemia should raise clinical suspicion for the injury and prompt computed tomography or MRA evaluation.
MRA has largely replaced conventional angiography for the diagnosis of CAD. As MRA is noninvasive, it allows for improved visualization of luminal narrowing and for evaluation of the arterial wall and intramural hematoma.2 Because of the potential for devastating sequelae with missed or delayed diagnosis, several authors have become proponents of early aggressive screening for detection of these injuries.9 Postdiagnostic treatment depends on the presence of neurologic symptoms. Management is directed toward limiting neurologic deficits; anticoagulant or antiplatelet agents are used to prevent thromboembolic events. A randomized controlled trial and other studies have failed to find any appreciable difference in subsequent rates of stroke or associated complications with use of either class of medication.8,12 Conventionally, treatment is continued for 3 to 6 months, depending on clinical resolution. Endovascular or surgical intervention typically is reserved for extreme luminal narrowing, conditions that are preventing anticoagulation, an expanding area of dissection with a persistent pseudoaneurysm, and cases of failed medical management with subsequent ischemic stroke.2The literature includes several case reports involving indirect trauma in recreational athletes. First, a 31-year-old woman sustained an ICA dissection secondary to a head injury that occurred during a soccer match; she presented with headache, altered sense of taste, and objective findings of ptosis and miosis consistent with Horner syndrome.13 Second, a 39-year-old man had an ICA dissection after a snowboarding fall that caused neck hyperextension; he presented with periocular headache, ptosis, and miosis.6 Third, 3 people who participated in CrossFit training sustained ICA dissection.7 They presented with varying degrees of neurologic symptoms: ptosis and miosis; right-side upper extremity ataxia; and visual distortion and receptive aphasia. Our patient’s ICA dissection resulted from indirect trauma that caused sudden hyperextension and lateral flexion in response to contact from a hockey puck. However, his case is unique in that symptoms onset was delayed, and there were no associated neurologic findings on clinical presentation. His case should raise awareness of this potential diagnosis, even in the absence of overt neurologic findings. In addition, the patient’s return to sport at 8 weeks was facilitated by full clinical resolution of symptoms and thorough radiographic documentation of improved intramural narrowing. Finally, to our knowledge this is the first report of this injury in a professional athlete.
Conclusion
We have reported the case of a 32-year-old professional hockey goaltender who presented with isolated, persistent, worsening headache of delayed onset after ICA dissection. The ICA dissection resulted from indirect trauma, with reaction to a puck causing acute hyperextension and rotational injury. To our knowledge, this is the first report of a case of ICA dissection in an athlete, lacking neurologic examination findings that could aid in the diagnosis. The index of suspicion for CAD should be high after direct or indirect cervical trauma when patients present with unilateral neck pain or headache, even in the absence of neurologic findings, as stroke is a catastrophic but preventable complication.
Am J Orthop. 2017;46(3):E139-E143. Copyright Frontline Medical Communications Inc. 2017. All rights reserved.
1. Mohan IV. Current optimal assessment and management of carotid and vertebral spontaneous and traumatic dissection. Angiology. 2014;65(4):274-283.
2. Patel RR, Adam R, Maldjian C, Lincoln CM, Yuen A, Arneja A. Cervical carotid artery dissection: current review of diagnosis and treatment. Cardiol Rev. 2012;20(3):145-152.
3. Biller J, Sacco RL, Albuquerque FC, et al; American Heart Association Stroke Council. Cervical arterial dissections and association with cervical manipulative therapy: a statement for healthcare professionals from the American Heart Association/American Stroke Association. Stroke. 2014;45(10):3155-3174.
4. Fukunaga N, Hanaoka M, Sato K. Asymptomatic common carotid artery dissection caused by blunt injury. Emerg Med J. 2011;28(1):50.
5. Chen J, Zhou X, Li C, Cheung BM. Risk of stroke due to spontaneous cervical artery dissection. Intern Med. 2013;52(19):2237-2240.
6. Kalantzis G, Georgalas I, Chang BY, Ong C, El-Hindy N. An unusual case of traumatic internal carotid artery dissection during snowboarding. J Sports Sci Med. 2014;13(2):451-453.
7. Lu A, Shen P, Lee P, et al. CrossFit-related cervical internal carotid artery dissection. Emerg Radiol. 2015;22(4):449-452.
8. CADISS Trial Investigators, Markus HS, Hayter E, Levi C, Feldman A, Venables G, Norris J. Antiplatelet treatment compared with anticoagulation treatment for cervical artery dissection (CADISS): a randomised trial. Lancet Neurol. 2015;14(4):361-367.
9. van Wessem KJ, Meijer JM, Leenen LP, van der Worp HB, Moll FL, de Borst GJ. Blunt traumatic carotid artery dissection still a pitfall? The rationale for aggressive screening. Eur J Trauma Emerg Surg. 2011;37(2):147-154.
10. Haneline M, Triano J. Cervical artery dissection. A comparison of highly dynamic mechanisms: manipulation versus motor vehicle collision. J Manipulative Physiol Ther. 2005;28(1):57-63.
11. Thomas LC, Rivett DA, Attia JR, Levi C. Risk factors and clinical presentation of cervical arterial dissection: preliminary results of a prospective case-control study. J Orthop Sports Phys Ther. 2015;45(7):503-511.
12. Lyrer P, Engelter S. Antithrombotic drugs for carotid artery dissection. Cochrane Database Syst Rev. 2010;(10):CD000255.
13. Creavin ST, Rice CM, Pollentine A, Cowburn P. Carotid artery dissection presenting with isolated headache and Horner syndrome after minor head injury. Am J Emerg Med. 2012;30(9):2103.e5-e7.
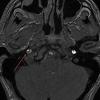
Encapsulated Fat Necrosis Lesion Caused by Morel-Lavallée Lesion in a Professional Ice Hockey Player
Take-Home Points
- ML lesions usually occur with high-energy injuries and have been reported in wrestlers, football players, and other athlete populations.
- Encapsulated fat necrosis lesions are usually attributable to trauma and disruption of the blood supply in the subcutaneous area, which occurs with ML lesions.
- Encapsulated fat necrosis lesions are rare; only 65 have been reported.
- Encapsulated fat necrosis lesions are characterized by massive fat necrosis encapsulated by fibrous tissue.
- Most are small and asymptomatic; however, in some cases, athletes can develop symptoms from frequent impacts to the region where the lesions are located.
What would become known as the Morel-Lavallée (ML) lesion was first reported in 1853 by French physician Maurice Morel-Lavallée. He described a proximal thigh soft-tissue injury that resulted in a hemolymphatic collection between superficial fascial planes. Deforming forces of pressure and shear result in an internal degloving injury in which subcutaneous tissue is stripped from the fascia and replaced with a hematoma or, less commonly, necrotic fat.1-4 The injury can take several weeks to heal. Up to one-third of such injuries are initially missed because of the initial ecchymosis covering the injured area.5
ML lesions usually occur with high-energy injuries and have been reported in wrestlers,6 football players,7-9 and other athlete populations. ML lesions usually occur about the knee, the site of the sheer mechanism in these athletes’ sports. Tejwani and colleagues9 reported on 24 National Football League (NFL) players (27 knees). These elite athletes typically were able to return to practice and game play long before complete resolution of their lesions.
Nodular cystic fat necrosis was first described by Przyjemski and Schuster10 in 1977. The terms encapsulated fat necrosis lesions and mobile encapsulated lipomas11 were introduced later. Clinically, these entities usually present as lesions on the lower limbs of young men and middle-aged women and can range in size from 1 mm to 35 mm. Most of these lesions are mobile.11 They are usually attributable to trauma and disruption of the blood supply in the subcutaneous area, which occurs with ML lesions. Trauma accounts for the usual occurrence in the lower extremities, though only 40% of patients recall a precipitating event.12 Histologically, these lesions are characterized by massive fat necrosis encapsulated by fibrous tissue.13In this article, we report the case of a professional ice hockey player who presented with an ML lesion of the hip and then developed a symptomatic encapsulated fat necrosis lesion that required surgical removal. To our knowledge, this is the first reported case of an encapsulated fat necrosis lesion caused by an ML lesion in an athlete. The patient provided written informed consent for print and electronic publication of this case report.
Case Report
A 21-year-old professional hockey player presented with a history of pain from a mass on his right hip. He first noticed the lesion, just lateral to the greater trochanter, about 3 years earlier. The mass appeared after he sustained a shearing-type injury to the lateral aspect of the hip. At the time, there was significant swelling along the lateral aspect, with ecchymosis that resolved over 2 months. The mass, diagnosed as an ML lesion, resolved with nonoperative treatment. However, in the area where the swelling had occurred, a hard mobile mass remained. At times, this mass became painful when direct pressure was applied, as when he hit the boards while playing hockey, or when he lay on his right side or used a roller in the training room. He rated the pain as a 4 on a 1-to-10 scale and said the mass was mobile and had not changed in size or consistency.
Physical examination revealed a palpable mass over the lateral aspect of the hip, over the greater trochanter. The mass, about 3 cm in diameter (Figure 1), was mobile in a subcutaneous pocket, consistent with an old ML lesion. 

Options discussed with the patient included use of ice, activity modification, and use of protective padded equipment. As the patient had tried these treatments before and was still intermittently having pain with direct pressure, he asked for surgical removal of the mass.
For the surgery, the patient was positioned in the lateral decubitus position with his right hip facing up. The right hip and thigh were prepared and draped in sterile fashion. An incision 4 cm in length was made directly over the mass, along the lateral aspect of the hip, over the greater trochanter. The incision was taken through skin and subcutaneous tissue down to the deep fascia. The fascia was incised longitudinally in line with the overlying skin incision. As soon as the incision was made through the fascia, the mass was easily seen. The 3-cm × 2-cm × 1-cm mass was free, not attached to any underlying soft tissue (Figure 3). 
Discussion
We have described a case of symptomatic encapsulated fat necrosis lesion caused by an ML lesion in a professional hockey player. The ML lesion had resolved with nonoperative treatment (compression), but a subcutaneous pocket remained at the lesion site. Given the patient’s lesion site and occupation as a hockey player, pain with direct pressure on this lesion was a concern.
Long-standing ML lesions have 3 common patterns on MRI.14 A central region, encapsulated partially or completely by a peripheral ring of fibrous tissue or hemosiderin, shows signal properties consistent with a seroma, a homogeneous hemorrhagic collection, or a heterogeneous hemorrhagic collection. In our patient’s case, MRI was used to characterize the mobile mass for operative planning. Although thin strands or lobules of fat have been found within ML lesions, this case was the first to demonstrate a sequestered mass of necrotic fat.
Most football players who develop ML lesions on their knees do not wear kneepads.7-9 Of the 24 NFL players in the study by Tejwani and colleagues,9 52% were successfully treated with compression wrap, cryotherapy, and motion exercises. The rest, however, were treated with aspiration, and 11% underwent doxycycline sclerodesis for recurrent fluid collection. After treatment, all of their players were able to return to football. Their outcomes are consistent with that of our patient, who was treated with compression wrap and returned to hockey without any other intervention.
After our patient’s ML lesion resolved, he developed an encapsulated fat necrosis lesion from the disruption of the blood supply in the subcutaneous pocket. Encapsulated fat necrosis lesions are rare; only 65 have been reported.13,15 Clinically, these lesions are single or multiple pale-yellow encapsulated nodes.13 Most are small and asymptomatic; however, in some cases, athletes can develop symptoms from frequent impacts to the region where the lesions are located.
The literature includes 1 report of an adolescent football player who developed multiple encapsulated fat necrosis lesions 4 months after landing on another player’s cleats.15 The patient, who was having pain with direct pressure during squatting and kneeling, elected to have the lesions surgically removed. These lesions are rare and usually asymptomatic,11 but our patient had his lesion surgically removed to address the pain induced by the direct impacts that came with playing professional hockey. Surgical removal is the treatment for symptomatic encapsulated fat necrosis lesions. Other than 1 case of recurrence after excision,16 these lesions have an excellent prognosis.
Conclusion
Our patient, a professional hockey player, underwent successful surgical removal of a symptomatic encapsulated fat necrosis lesion that had developed from an ML lesion.
Am J Orthop. 2017;46(3):E144-E147. Copyright Frontline Medical Communications Inc. 2017. All rights reserved.
1. Aguiar RO, Viegas FC, Fernandez RY, Trudell D, Haghighi P, Resnick D. The prepatellar bursa: cadaveric investigation of regional anatomy with MRI after sonographically guided bursography. AJR Am J Roentgenol. 2007;188(4):W355-W358.
2. Hak DJ, Olson SA, Matta JM. Diagnosis and management of closed internal degloving injuries associated with pelvic and acetabular fractures: the Morel-Lavallée lesion. J Trauma. 1997;42(6):1046-1051.
3. Hudson DA, Knottenbelt JD, Krige JE. Closed degloving injuries: results following conservative surgery. Plast Reconstr Surg. 1992;89(5):853-855.
4. Mellado JM, Bencardino JT. Morel-Lavallée lesion: review with emphasis on MR imaging. Magn Reson Imaging Clin North Am. 2005;13(4):775-782.
5. Dye SF, Campagna-Pinto D, Dye CC, Shifflett S, Eiman T. Soft-tissue anatomy anterior to the human patella. J Bone Joint Surg Am. 2003;85(6):1012-1017.
6. Northam MC, Gaskin CM. Presumed prepatellar fibrosis in collegiate wrestlers: imaging findings and clinical correlation. Skeletal Radiol. 2015;44(2):271-277.
7. Anakwenze OA, Trivedi V, Goodman AM, Ganley TJ. Concealed degloving injury (the Morel-Lavallée lesion) in childhood sports: a case report. J Bone Joint Surg Am. 2011;93(24):e148.
8. Matava MJ, Ellis E, Shah NR, Pogue D, Williams T. Morel-Lavallée lesion in a professional American football player. Am J Orthop. 2010;39(3):144-147.
9. Tejwani SG, Cohen SB, Bradley JP. Management of Morel-Lavallee lesion of the knee: twenty-seven cases in the National Football League. Am J Sports Med. 2007;35(7):1162-1167.
10. Przyjemski CJ, Schuster SR. Nodular-cystic fat necrosis. J Pediatr. 1977;91(4):605-607.
11. Kiryu H, Rikihisa W, Furue M. Encapsulated fat necrosis—a clinicopathological study of 8 cases and a literature review. J Cutan Pathol. 2000;27(1):19-23.
12. Santos-Juanes J, Coto P, Galache C, Sánchez del Rio J, Soto de Delás J. Encapsulated fat necrosis: a form of traumatic panniculitis. J Eur Acad Dermatol Venereol. 2007;21(3):405-406.
13. Sempau L, Sambucetty PS, Garcia JL, Sixto BG, Morán AG, Prieto MA. Mobile encapsulated lipoma. Int J Dermatol. 2012;51(4):448-450.
14. Mellado JM, Pérez del Palomar L, Díaz L, Ramos A, Saurí A. Long-standing Morel-Lavallée lesions of the trochanteric region and proximal thigh: MRI features in five patients. AJR Am J Roentgenol. 2004;182(5):1289-1294.
15. Sole JS, Wisniewski SJ, Dahm DL, Bond J, Smith J. Posttraumatic fat necrosis presenting as prepatellar loose bodies in an adolescent football player. PM R. 2014;6(8):749-752.
16. Felipo F, Vaquero M, del Agua C. Pseudotumoral encapsulated fat necrosis with diffuse pseudomembranous degeneration. J Cutan Pathol. 2004;31(8):565-567.
Take-Home Points
- ML lesions usually occur with high-energy injuries and have been reported in wrestlers, football players, and other athlete populations.
- Encapsulated fat necrosis lesions are usually attributable to trauma and disruption of the blood supply in the subcutaneous area, which occurs with ML lesions.
- Encapsulated fat necrosis lesions are rare; only 65 have been reported.
- Encapsulated fat necrosis lesions are characterized by massive fat necrosis encapsulated by fibrous tissue.
- Most are small and asymptomatic; however, in some cases, athletes can develop symptoms from frequent impacts to the region where the lesions are located.
What would become known as the Morel-Lavallée (ML) lesion was first reported in 1853 by French physician Maurice Morel-Lavallée. He described a proximal thigh soft-tissue injury that resulted in a hemolymphatic collection between superficial fascial planes. Deforming forces of pressure and shear result in an internal degloving injury in which subcutaneous tissue is stripped from the fascia and replaced with a hematoma or, less commonly, necrotic fat.1-4 The injury can take several weeks to heal. Up to one-third of such injuries are initially missed because of the initial ecchymosis covering the injured area.5
ML lesions usually occur with high-energy injuries and have been reported in wrestlers,6 football players,7-9 and other athlete populations. ML lesions usually occur about the knee, the site of the sheer mechanism in these athletes’ sports. Tejwani and colleagues9 reported on 24 National Football League (NFL) players (27 knees). These elite athletes typically were able to return to practice and game play long before complete resolution of their lesions.
Nodular cystic fat necrosis was first described by Przyjemski and Schuster10 in 1977. The terms encapsulated fat necrosis lesions and mobile encapsulated lipomas11 were introduced later. Clinically, these entities usually present as lesions on the lower limbs of young men and middle-aged women and can range in size from 1 mm to 35 mm. Most of these lesions are mobile.11 They are usually attributable to trauma and disruption of the blood supply in the subcutaneous area, which occurs with ML lesions. Trauma accounts for the usual occurrence in the lower extremities, though only 40% of patients recall a precipitating event.12 Histologically, these lesions are characterized by massive fat necrosis encapsulated by fibrous tissue.13In this article, we report the case of a professional ice hockey player who presented with an ML lesion of the hip and then developed a symptomatic encapsulated fat necrosis lesion that required surgical removal. To our knowledge, this is the first reported case of an encapsulated fat necrosis lesion caused by an ML lesion in an athlete. The patient provided written informed consent for print and electronic publication of this case report.
Case Report
A 21-year-old professional hockey player presented with a history of pain from a mass on his right hip. He first noticed the lesion, just lateral to the greater trochanter, about 3 years earlier. The mass appeared after he sustained a shearing-type injury to the lateral aspect of the hip. At the time, there was significant swelling along the lateral aspect, with ecchymosis that resolved over 2 months. The mass, diagnosed as an ML lesion, resolved with nonoperative treatment. However, in the area where the swelling had occurred, a hard mobile mass remained. At times, this mass became painful when direct pressure was applied, as when he hit the boards while playing hockey, or when he lay on his right side or used a roller in the training room. He rated the pain as a 4 on a 1-to-10 scale and said the mass was mobile and had not changed in size or consistency.
Physical examination revealed a palpable mass over the lateral aspect of the hip, over the greater trochanter. The mass, about 3 cm in diameter (Figure 1), was mobile in a subcutaneous pocket, consistent with an old ML lesion.
Options discussed with the patient included use of ice, activity modification, and use of protective padded equipment. As the patient had tried these treatments before and was still intermittently having pain with direct pressure, he asked for surgical removal of the mass.
For the surgery, the patient was positioned in the lateral decubitus position with his right hip facing up. The right hip and thigh were prepared and draped in sterile fashion. An incision 4 cm in length was made directly over the mass, along the lateral aspect of the hip, over the greater trochanter. The incision was taken through skin and subcutaneous tissue down to the deep fascia. The fascia was incised longitudinally in line with the overlying skin incision. As soon as the incision was made through the fascia, the mass was easily seen. The 3-cm × 2-cm × 1-cm mass was free, not attached to any underlying soft tissue (Figure 3).
Discussion
We have described a case of symptomatic encapsulated fat necrosis lesion caused by an ML lesion in a professional hockey player. The ML lesion had resolved with nonoperative treatment (compression), but a subcutaneous pocket remained at the lesion site. Given the patient’s lesion site and occupation as a hockey player, pain with direct pressure on this lesion was a concern.
Long-standing ML lesions have 3 common patterns on MRI.14 A central region, encapsulated partially or completely by a peripheral ring of fibrous tissue or hemosiderin, shows signal properties consistent with a seroma, a homogeneous hemorrhagic collection, or a heterogeneous hemorrhagic collection. In our patient’s case, MRI was used to characterize the mobile mass for operative planning. Although thin strands or lobules of fat have been found within ML lesions, this case was the first to demonstrate a sequestered mass of necrotic fat.
Most football players who develop ML lesions on their knees do not wear kneepads.7-9 Of the 24 NFL players in the study by Tejwani and colleagues,9 52% were successfully treated with compression wrap, cryotherapy, and motion exercises. The rest, however, were treated with aspiration, and 11% underwent doxycycline sclerodesis for recurrent fluid collection. After treatment, all of their players were able to return to football. Their outcomes are consistent with that of our patient, who was treated with compression wrap and returned to hockey without any other intervention.
After our patient’s ML lesion resolved, he developed an encapsulated fat necrosis lesion from the disruption of the blood supply in the subcutaneous pocket. Encapsulated fat necrosis lesions are rare; only 65 have been reported.13,15 Clinically, these lesions are single or multiple pale-yellow encapsulated nodes.13 Most are small and asymptomatic; however, in some cases, athletes can develop symptoms from frequent impacts to the region where the lesions are located.
The literature includes 1 report of an adolescent football player who developed multiple encapsulated fat necrosis lesions 4 months after landing on another player’s cleats.15 The patient, who was having pain with direct pressure during squatting and kneeling, elected to have the lesions surgically removed. These lesions are rare and usually asymptomatic,11 but our patient had his lesion surgically removed to address the pain induced by the direct impacts that came with playing professional hockey. Surgical removal is the treatment for symptomatic encapsulated fat necrosis lesions. Other than 1 case of recurrence after excision,16 these lesions have an excellent prognosis.
Conclusion
Our patient, a professional hockey player, underwent successful surgical removal of a symptomatic encapsulated fat necrosis lesion that had developed from an ML lesion.
Am J Orthop. 2017;46(3):E144-E147. Copyright Frontline Medical Communications Inc. 2017. All rights reserved.
1. Aguiar RO, Viegas FC, Fernandez RY, Trudell D, Haghighi P, Resnick D. The prepatellar bursa: cadaveric investigation of regional anatomy with MRI after sonographically guided bursography. AJR Am J Roentgenol. 2007;188(4):W355-W358.
2. Hak DJ, Olson SA, Matta JM. Diagnosis and management of closed internal degloving injuries associated with pelvic and acetabular fractures: the Morel-Lavallée lesion. J Trauma. 1997;42(6):1046-1051.
3. Hudson DA, Knottenbelt JD, Krige JE. Closed degloving injuries: results following conservative surgery. Plast Reconstr Surg. 1992;89(5):853-855.
4. Mellado JM, Bencardino JT. Morel-Lavallée lesion: review with emphasis on MR imaging. Magn Reson Imaging Clin North Am. 2005;13(4):775-782.
5. Dye SF, Campagna-Pinto D, Dye CC, Shifflett S, Eiman T. Soft-tissue anatomy anterior to the human patella. J Bone Joint Surg Am. 2003;85(6):1012-1017.
6. Northam MC, Gaskin CM. Presumed prepatellar fibrosis in collegiate wrestlers: imaging findings and clinical correlation. Skeletal Radiol. 2015;44(2):271-277.
7. Anakwenze OA, Trivedi V, Goodman AM, Ganley TJ. Concealed degloving injury (the Morel-Lavallée lesion) in childhood sports: a case report. J Bone Joint Surg Am. 2011;93(24):e148.
8. Matava MJ, Ellis E, Shah NR, Pogue D, Williams T. Morel-Lavallée lesion in a professional American football player. Am J Orthop. 2010;39(3):144-147.
9. Tejwani SG, Cohen SB, Bradley JP. Management of Morel-Lavallee lesion of the knee: twenty-seven cases in the National Football League. Am J Sports Med. 2007;35(7):1162-1167.
10. Przyjemski CJ, Schuster SR. Nodular-cystic fat necrosis. J Pediatr. 1977;91(4):605-607.
11. Kiryu H, Rikihisa W, Furue M. Encapsulated fat necrosis—a clinicopathological study of 8 cases and a literature review. J Cutan Pathol. 2000;27(1):19-23.
12. Santos-Juanes J, Coto P, Galache C, Sánchez del Rio J, Soto de Delás J. Encapsulated fat necrosis: a form of traumatic panniculitis. J Eur Acad Dermatol Venereol. 2007;21(3):405-406.
13. Sempau L, Sambucetty PS, Garcia JL, Sixto BG, Morán AG, Prieto MA. Mobile encapsulated lipoma. Int J Dermatol. 2012;51(4):448-450.
14. Mellado JM, Pérez del Palomar L, Díaz L, Ramos A, Saurí A. Long-standing Morel-Lavallée lesions of the trochanteric region and proximal thigh: MRI features in five patients. AJR Am J Roentgenol. 2004;182(5):1289-1294.
15. Sole JS, Wisniewski SJ, Dahm DL, Bond J, Smith J. Posttraumatic fat necrosis presenting as prepatellar loose bodies in an adolescent football player. PM R. 2014;6(8):749-752.
16. Felipo F, Vaquero M, del Agua C. Pseudotumoral encapsulated fat necrosis with diffuse pseudomembranous degeneration. J Cutan Pathol. 2004;31(8):565-567.
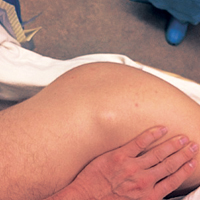
Joint-Preserving Osteotomies for Isolated Patellofemoral Osteoarthritis: Alternatives to Arthroplasty
Take-Home Points
- Patellofemoral osteotomies can provide excellent and reliable symptomatic relief for many patients with symptomatic isolated PFOA.
- PLPF of 1 cm to 1.5 cm of lateral bone can provide excellent pain relief in patients with isolated lateral facet arthritis and overhanging osteophytes without diffuse chondromalacia or hypermobility.
- At 5-year follow-up, >80% of partial lateral facetectomy patients have symptomatic relief.
- Tibial tubercle AMZ (Fulkerson procedure) can provide excellent results in patients with distal and lateral patella chondropathy.
- Avoidance of overmedialization, early range of motion, and limited weight-bearing can help avoid complications associated with tibial tubercle AMZ.
Isolated patellofemoral osteoarthritis (PFOA) is a relatively common disorder. Based on radiological evidence, its prevalence is 24% in women and 11% in men aged over 55 years.1 However, the presence of PFOA on radiographic images does not always correlate with clinical symptoms. PFOA is symptomatic in only 8% of women and 2% of men aged over 55 years,1 and a mismatch often occurs between the symptoms and radiological severity (Figures 1A-1E). 
PFOA surgery may be considered when nonsurgical treatment is ineffective and pain becomes disabling. However, which surgical treatment for isolated PFOA is optimal remains controversial. The largest setback in weighing nonarthroplasty surgical options for isolated PFOA is that few studies have been published. Furthermore, published studies offer little scientific evidence; they include case series with few patients and retrospective analyses with limited follow-up and no control group for comparison.
This article focuses on osteotomies, which are described in only 15 articles found through PubMed. The small number is logical given that the prevalence of symptomatic isolated PFOA is low1 and that the majority of patients do not need surgical treatment. A complicating factor is that osteotomy is often associated with other surgical procedures, such as lateral retinaculum release. In descriptions of these cases, it is not clear if the outcome for PFOA is attributable to the osteotomy, is secondary to the associated procedure, or both.
Several alternatives to patellofemoral arthroplasty—partial lateral patellar facetectomy (PLPF), patella-thinning osteotomy (PTO), anteromedialization (AMZ), and sulcus-deepening trochleoplasty (SDT)—are available for the management of isolated PFOA. In this article, we analyze the value of each of these techniques in preserving the patellofemoral joint in the presence of PFOA. These techniques combine the US and European perspectives. The ultimate objective with these surgical techniques is to delay arthroplasty as long as possible.
Partial Lateral Patellar Facetectomy
PLPF is a relatively simple and effective surgical treatment for isolated PFOA in active middle-aged to elderly patients who want to maintain their activity level.3-6 Using an oscillating saw to resect 1 cm to 1.5 cm of the lateral facet of the patella reduces lateral retinaculum tension and thereby decreases lateral patellofemoral contact pressures (Figures 2A, 2B). 
PLPF improves pain and function over the long-term and delays the need for major surgery. Wetzels and Bellemans5 evaluated 155 consecutive patients (168 knees) with mean post-PLPF follow-up of 10.9 years. By final follow-up, 62 knees (36.9%) had failed and been revised to total knee arthroplasty (TKA) (60 knees), patellofemoral arthroplasty (1 knee), or total patellectomy (1 knee). Mean time to reoperation was 8 years. Kaplan-Meier survival rates with reoperation as the endpoint were 85% at 5 years, 67.2% at 10 years, and 46.7% at 20 years. At final follow-up, 79 (74.5%) of the 106 knees that had not been revised were rated good or fair, which accounts for 47% of the original group of 168 knees. The key finding is that the effects of PLPF lasted through the 10-year follow-up in half of the patients.5 Paulos and colleagues4 found 5 years of symptomatic relief in more than 80% of carefully selected patients who did not have significant (grade IV) arthritis in the medial or lateral knee compartments.
PLPF is a safe, low-cost, and relatively minor surgery with a low morbidity rate and fast recovery. Also, it does not close the door on other surgery and can easily be converted to TKA. Wetzels and Bellemans5 found that 36.9% of reoperations were TKAs, and López-Franco and colleagues3 found that 30% of knees required secondary TKA.
Patella-Thinning Osteotomy
In patients who are under 65 years old and have disabling anterior knee pain recalcitrant to conservative treatment, PTO may be considered for isolated PFOA with any type of chondral lesion (including severe diffuse chondropathy with exposed bone) (Figures 3A-3C), patellofemoral joint space reduced by more than 50% on skyline view, patellar thickness of 20 mm or more, and normal TT-TG distance.7 
Vaquero and colleagues7 analyzed PTO outcomes in 31 patients (35 knees) with mean follow-up of 9 years and noted significant improvements in functional scores and radiologic parameters. All patients except 1 were satisfied with the operation. Radiologic progression of PFOA was slowed, but radiologic femorotibial osteoarthritis progressed in 23 cases (65%), and 4 required TKA. The authors found satisfactory clinical and radiologic outcomes—only 4 patients (12.5%) required TKA—and good functional outcomes.7
PTO, a low-morbidity surgery with good functional outcomes, does not close the door on other surgery, such as TKA.7
Tibial Tubercle Anteromedialization Osteotomy
Whereas PLPF and PTO are indicated in knees with normal TT-TG distance, Fulkerson AMZ osteotomy must be considered in isolated PFOA with articular cartilage lesions at the distal or lateral patellar facets resulting from long-standing malalignment with increased TT-TG distance (Figures 4A, 4B). 
AMZ unloads the distal and lateral facets of the patella while improving the extensor mechanism.11,12 A successful AMZ outcome requires preservation of some of the medial and proximal articular cartilage of the patella. In 1983, Fulkerson13 described use of tibial tubercle AMZ osteotomy to address patellofemoral pain associated with patellofemoral chondrosis in conjunction with patellofemoral tilt and/or chronic patellar subluxation. This technique is indicated when the patella needs to be realigned for relief of elevated contact stress and centralization. Currently the technique is used not only in patients with isolated PFOA but in patients with chronic lateral patellar instability. Fulkerson osteotomy combines the benefits of the Maquet technique (unloading) and the Elmslie-Trillat technique (tracking improvement) in a single osteotomy, with no distraction of the osteotomy site with bone graft and without the complication rate of Maquet tibial tubercle elevation. Before surgery, computed tomography (CT) or magnetic resonance imaging (MRI) is routinely used to measure TT-TG distance to determine the tibial tubercle medialization required in the Fulkerson osteotomy. However, TT-TG distance must be used with caution, as it cannot be determined in cases with trochlear dysplasia. Consequently, physical examination and arthroscopic examination for evaluation of patellofemoral tracking and location of chondral defects should be performed before the Fulkerson osteotomy.
Rationale; Indications and Contraindications; Preoperative Planning
As already noted, AMZ unloads the distal and lateral facets of the patella. Beck and colleagues14 suggested AMZ is appropriate for unloading the lateral trochlea. However, it is not useful for central chondral defects and may actually increase the load in patients with medial chondral defects. As AMZ shifts contact force to the medial trochlea, Fulkerson osteotomy is appropriate when distal and lateral chondral lesions must be unloaded. Because this procedure moves the tibial tubercle medially and anteriorly, loads are transferred to the proximal and medial facets of the patella. Therefore, the procedure is contraindicated when diffuse, proximal, or medial chondral lesions are present. Moreover, AMZ is contraindicated in patients with normal TT-TG distance because there is the risk that overmedialization will cause symptomatic medial subluxation. Grade III or IV central trochlear cartilage lesions are also less likely to have successful AMZ outcomes. Therefore, before Fulkerson osteotomy is performed, MRI should be obtained to evaluate the patellofemoral articular surface and TT-TG distance. MRI provides information that is useful for preoperative planning because it allows assessment of articular cartilage lesions, including their location and severity. Moreover, because the osseous and cartilaginous contours of the patella differ, MRI gives a more accurate picture of the patellofemoral congruence than CT does. Last, before the open surgery is performed, the patellofemoral joint should be arthroscopically examined to determine the location of chondral lesions. Cartilage lesion mapping is important because Fulkerson osteotomy outcomes depend on chondral lesion location. Pidoriano and colleagues15 correlated AMZ outcomes with articular lesion location and noted optimal outcomes in patients with distal and lateral patellar articular lesions and intact trochlear cartilage (87% good and excellent outcomes). Patients with medial lesions and proximal or diffuse lesions generally did poorly (55% good and excellent outcomes in medial lesions vs 20% good and excellent outcomes in proximal and diffuse lesions). Central trochlear lesions were associated with medial patellar lesions, and all patients with central trochlear lesions had poor outcomes. Interestingly, Outerbridge grading of patellar lesions was not significantly correlated with overall outcomes.15 Even in cases of severe chondropathy, including bone-on-bone arthritis, AMZ has had reliable outcomes and may be superior to arthroplasty because of joint preservation, duration up to 8 years, and restoration of patellofemoral tracking. It should be noted that a resurfacing technique such as patellofemoral arthroplasty is not a substitute for patella realignment. Any patellofemoral maltracking must be corrected before patellofemoral arthroplasty. Fulkerson osteotomy does not preclude subsequent surgery (eg, TKA). Furthermore, AMZ may prevent the natural progression of PFOA related to chronic lateral tracking.
AMZ osteotomy can be adjusted for the specific indication and for the location of chondral defects. If the primary goal is unloading a lateral lesion, or lateral maltracking, then a flatter osteotomy may be performed to increase the relative medialization of the tubercle; however, if the primary goal is unloading a distal lesion, then a relatively more oblique or vertical osteotomy may be performed to transfer the load more proximally. This is the technique preferred by authors in most cases in which more anteriorization is desired.
When TT-TG distance is used to guide surgical realignment, patellofemoral chondrosis associated with normal TT-TG distance can be addressed with directly anterior displacement of the tibial tubercle. Anteriorization of the tibial tubercle can be obtained by inserting a bone block between the tubercle and the tibial cut (Figure 5A).16 The medialization can be neutralized by making this block as thick as the measured medialization.16 
Surgical Outcomes of Anteromedialization in Patellofemoral Osteoarthritis
Fulkerson and colleagues10 followed 30 patients for more than 2 years after they underwent AMZ of the tibial tubercle for persistent patellofemoral pain associated with patellar articular degeneration. Of these 30 patients, 12 were followed for more than 5 years. The authors reported 93% good and excellent subjective outcomes and 89% good and excellent objective outcomes. Quality of improvement was sustained for all 12 patients reevaluated more than 5 years after surgery. When examined separately, 75% of patients with advanced PFOA had a good outcome, but none had an excellent outcome. Carofino and Fulkerson17 retrospectively evaluated tibial tubercle AMZ for isolated PFOA in 22 knees (17 active patients older than 50 years at time of surgery; mean age, 55 years) with minimum follow-up of 2 years (mean, 77 months). Mean postoperative Lysholm score was 83. According to Lysholm scores, outcomes were good to excellent in 12 cases, fair in 6, and poor in 1. The authors concluded that tibial tubercle AMZ is a definitive treatment option for isolated PFOA in active older patients. Morshuis and colleagues18 retrospectively evaluated 22 patients (25 knees) who underwent Fulkerson osteotomy for patellofemoral pain. Outcomes were evaluated a mean of 12 and 30 months after surgery. At the first evaluation, 84% of patients had satisfactory outcomes, and, at the second (≤38 months after surgery), 70%. Only in relatively young patients without signs of PFOA did outcomes remain satisfactory in all cases. At the later evaluation, 60% of patients with PFOA and/or lateralization had satisfactory outcomes.
Tips and Tricks to Avoid Complications
For some patients, AMZ performed technically correctly produced unhappiness—an outcome that may arise from incorrect patient selection or failure to meet patient expectations. It is important to discuss objectives and expectations with the patient before surgery. With correct patient selection and meticulous surgical technique (with customization of osteotomy angle and translation based on underlying lesion), surgeons have obtained excellent outcomes with infrequent complications (Table). 
Intraoperative complications may involve neurovascular structures. The anterior tibial artery and the peroneal nerve are at risk during Fulkerson osteotomy. Decreased anterior sensation related to the infrapatellar branch of the saphenous nerve is not uncommon. Reducing the risk of neurovascular injury requires use of retractors and keeping the saw blade visible at all times. Another potential devastating complication is injury of the posterior vascular structures during bicortical tibial drilling for screw placement. According to Kline and colleagues,19 bicortical drilling may occur precariously near the posterior vascular structures of the knee. They advised extreme caution in drilling the posterior cortex during this procedure. To avoid the risk of compartment syndrome, surgeons can leave the anterior compartment fascia open or pie crust it by making multiple small perforations to decrease tension. Tibial fracture is another potential complication with this osteotomy. Reducing the risk of fracture involves tapering the distal cut anteriorly and avoiding a “notched” osteotomy (Figures 6A-6C). 
Postoperative complications, which are similar to those associated with any knee surgery, include infection, arthrofibrosis, complex regional pain syndrome, thromboembolism, nonunion, fixation failure, and fracture. Arthrofibrosis has many causes, but the problem decreases with secure osteotomy fixation, early knee motion, and patellar mobilization. Overmedialization can result in medial patella instability, typically subluxation rather than complete dislocation. The instability can be relatively subtle or can cause pain and weakness. Lateralization of the tibial tubercle might be appropiate.23
Sulcus-Deepening Trochleoplasty
High-grade trochlear dysplasia with a prominence, frequently present in lateral patellar instability, is thought to correlate with PFOA because it produces an anti-Maquet effect.24 The dysplasia provokes an increment of the patellofemoral joint pressure that could explain patellofemoral chondropathy and ultimately PFOA. In fact, 33% of patients with isolated PFOA have a history of objective patellar dislocation.24 In these cases, SDT could be considered. Several studies have examined use of this technique in the treatment of instability, but not PFOA.25 After SDT, pain resolves despite the chondral lesions being left alone (Figures 7A, 7B). 
Conclusion
Patellofemoral joint replacement is an option for patellofemoral pain only in very select cases. Preserving the joint is always a primary goal. As not all PFOA cases are equal, joint-preserving surgery must be tailored to the patient. The keys to success are good indication, precise surgery, proper rehabilitation, and, above all, doing only what is needed.
Am J Orthop. 2017;46(3):139-145. Copyright Frontline Medical Communications Inc. 2017. All rights reserved.
1. McAlindon TE, Snow S, Cooper C, Dieppe PA. Radiographic patterns of osteoarthritis of the knee joint in the community: the importance of the patellofemoral joint. Ann Rheum Dis. 1992;51(7):844-849.
2. Iwano T, Kurosawa H, Tokuyama H, Hoshikawa Y. Roentgenographic and clinical findings of patellofemoral osteoarthrosis. With special reference to its relationship to femorotibial osteoarthrosis and etiologic factors. Clin Orthop Relat Res. 1990;(252):190-197.
3. López-Franco M, Murciano-Antón MA, Fernández-Aceñero MJ, De Lucas-Villarrubia JC, López-Martín N, Gómez-Barrena E. Evaluation of a minimally aggressive method of patellofemoral osteoarthritis treatment at 10 years minimum follow-up. Knee. 2013;20(6):476-481.
4. Paulos LE, O’Connor DL, Karistinos A. Partial lateral patellar facetectomy for treatment of arthritis due to lateral patellar compression syndrome. Arthroscopy. 2008;24(5):547-553.
5. Wetzels T, Bellemans J. Patellofemoral osteoarthritis treated by partial lateral facetectomy: results at long-term follow up. Knee. 2012;19(4):411-415.
6. Yercan HS, Ait Si Selmi T, Neyret P. The treatment of patellofemoral osteoarthritis with partial lateral facetectomy. Clin Orthop Relat Res. 2005;(436):14-19.
7. Vaquero J, Calvo JA, Chana F, Perez-Mañanes R. The patellar thinning osteotomy in patellofemoral arthritis: four to 18 years’ follow-up. J Bone Joint Surg Br. 2010;92(10):1385-1391.
8. Vaquero J, Arriaza R. The patella thinning osteotomy. An experimental study of a new technique for reducing patellofemoral pressure. Int Orthop. 1992;16(4):372-376.
9. Fulkerson JP. Disorders of the Patellofemoral Joint. 3rd ed. Baltimore, MD: Williams & Wilkins; 1997.
10. Fulkerson JP, Becker GJ, Meaney JA, Miranda M, Folcik MA. Anteromedial tibial tubercle transfer without bone graft. Am J Sports Med. 1990;18(5):490-496.
11. Fulkerson JP. Patellofemoral pain disorders: evaluation and management. J Am Acad Orthop Surg. 1994;2(2):124-132.
12. Fulkerson JP. Diagnosis and treatment of patients with patellofemoral pain. Am J Sports Med. 2002;30(3):447-456.
13. Fulkerson JP. Anteromedialization of the tibial tuberosity for patellofemoral malalignment. Clin Orthop Relat Res. 1983;(177):176-181.
14. Beck PR, Thomas AL, Farr J, Lewis PB, Cole BJ. Trochlear contact pressures after anteromedialization of the tibial tubercle. Am J Sports Med. 2005;33(11):1710-1715.
15. Pidoriano AJ, Weinstein RN, Buuck DA, Fulkerson JP. Correlation of patellar articular lesions with results from anteromedial tibial tubercle transfer. Am J Sports Med. 1997;25(4):533-537.
16. Farr J. Tibial tubercle osteotomy. Tech Knee Surg. 2003;2:28-42.
17. Carofino BC, Fulkerson JP. Anteromedialization of the tibial tubercle for patellofemoral arthritis in patients > 50 years. J Knee Surg. 2008;21(2):101-105.
18. Morshuis WJ, Pavlov PW, de Rooy KP. Anteromedialization of the tibial tuberosity in the treatment of patellofemoral pain and malalignment. Clin Orthop Relat Res. 1990;(255):242-250.
19. Kline AJ, Gonzales J, Beach WR, Miller MD. Vascular risk associated with bicortical tibial drilling during anteromedial tibial tubercle transfer. Am J Orthop. 2006;35(1):30-32.
20. Stetson WB, Friedman MJ, Fulkerson JP, Cheng M, Buuck D. Fracture of the proximal tibia with immediate weightbearing after a Fulkerson osteotomy. Am J Sports Med. 1997;25(4):570-574.
21. Fulkerson JP. Fracture of the proximal tibia after Fulkerson anteromedial tibial tubercle transfer. A report of four cases. Am J Sports Med. 1999;27(2):265.
22. Cosgarea AJ, Freedman JA, McFarland EG. Nonunion of the tibial tubercle shingle following Fulkerson osteotomy. Am J Knee Surg. 2001;14(1):51-54.
23. Fulkerson JP. Anterolateralization of the tibial tubercle. Tech Orthop. 1997;12:165-169.
24. Grelsamer RP, Dejour D, Gould J. The pathophysiology of patellofemoral arthritis. Orthop Clin North Am. 2008;39(3):269-274.
25. Ntagiopoulos PG, Byn P, Dejour D. Midterm results of comprehensive surgical reconstruction including sulcus-deepening trochleoplasty in recurrent patellar dislocations with high-grade trochlear dysplasia. Am J Sports Med. 2013;41(5):998-1004.
26. Oberlander MA, Baker CL, Morgan BE. Patellofemoral arthrosis: the treatment options. Am J Orthop. 1998;27(4):263-270.
27. Scuderi GR. The Patella. New York, NY: Springer-Verlag; 1995.
28. Buuck D, Fulkerson JP. Anteromedialization of the tibial tubercle: a 4 to 12 year follow up. Oper Tech Sports Med. 2000;8:131-137.
Take-Home Points
- Patellofemoral osteotomies can provide excellent and reliable symptomatic relief for many patients with symptomatic isolated PFOA.
- PLPF of 1 cm to 1.5 cm of lateral bone can provide excellent pain relief in patients with isolated lateral facet arthritis and overhanging osteophytes without diffuse chondromalacia or hypermobility.
- At 5-year follow-up, >80% of partial lateral facetectomy patients have symptomatic relief.
- Tibial tubercle AMZ (Fulkerson procedure) can provide excellent results in patients with distal and lateral patella chondropathy.
- Avoidance of overmedialization, early range of motion, and limited weight-bearing can help avoid complications associated with tibial tubercle AMZ.
Isolated patellofemoral osteoarthritis (PFOA) is a relatively common disorder. Based on radiological evidence, its prevalence is 24% in women and 11% in men aged over 55 years.1 However, the presence of PFOA on radiographic images does not always correlate with clinical symptoms. PFOA is symptomatic in only 8% of women and 2% of men aged over 55 years,1 and a mismatch often occurs between the symptoms and radiological severity (Figures 1A-1E).
PFOA surgery may be considered when nonsurgical treatment is ineffective and pain becomes disabling. However, which surgical treatment for isolated PFOA is optimal remains controversial. The largest setback in weighing nonarthroplasty surgical options for isolated PFOA is that few studies have been published. Furthermore, published studies offer little scientific evidence; they include case series with few patients and retrospective analyses with limited follow-up and no control group for comparison.
This article focuses on osteotomies, which are described in only 15 articles found through PubMed. The small number is logical given that the prevalence of symptomatic isolated PFOA is low1 and that the majority of patients do not need surgical treatment. A complicating factor is that osteotomy is often associated with other surgical procedures, such as lateral retinaculum release. In descriptions of these cases, it is not clear if the outcome for PFOA is attributable to the osteotomy, is secondary to the associated procedure, or both.
Several alternatives to patellofemoral arthroplasty—partial lateral patellar facetectomy (PLPF), patella-thinning osteotomy (PTO), anteromedialization (AMZ), and sulcus-deepening trochleoplasty (SDT)—are available for the management of isolated PFOA. In this article, we analyze the value of each of these techniques in preserving the patellofemoral joint in the presence of PFOA. These techniques combine the US and European perspectives. The ultimate objective with these surgical techniques is to delay arthroplasty as long as possible.
Partial Lateral Patellar Facetectomy
PLPF is a relatively simple and effective surgical treatment for isolated PFOA in active middle-aged to elderly patients who want to maintain their activity level.3-6 Using an oscillating saw to resect 1 cm to 1.5 cm of the lateral facet of the patella reduces lateral retinaculum tension and thereby decreases lateral patellofemoral contact pressures (Figures 2A, 2B).
PLPF improves pain and function over the long-term and delays the need for major surgery. Wetzels and Bellemans5 evaluated 155 consecutive patients (168 knees) with mean post-PLPF follow-up of 10.9 years. By final follow-up, 62 knees (36.9%) had failed and been revised to total knee arthroplasty (TKA) (60 knees), patellofemoral arthroplasty (1 knee), or total patellectomy (1 knee). Mean time to reoperation was 8 years. Kaplan-Meier survival rates with reoperation as the endpoint were 85% at 5 years, 67.2% at 10 years, and 46.7% at 20 years. At final follow-up, 79 (74.5%) of the 106 knees that had not been revised were rated good or fair, which accounts for 47% of the original group of 168 knees. The key finding is that the effects of PLPF lasted through the 10-year follow-up in half of the patients.5 Paulos and colleagues4 found 5 years of symptomatic relief in more than 80% of carefully selected patients who did not have significant (grade IV) arthritis in the medial or lateral knee compartments.
PLPF is a safe, low-cost, and relatively minor surgery with a low morbidity rate and fast recovery. Also, it does not close the door on other surgery and can easily be converted to TKA. Wetzels and Bellemans5 found that 36.9% of reoperations were TKAs, and López-Franco and colleagues3 found that 30% of knees required secondary TKA.
Patella-Thinning Osteotomy
In patients who are under 65 years old and have disabling anterior knee pain recalcitrant to conservative treatment, PTO may be considered for isolated PFOA with any type of chondral lesion (including severe diffuse chondropathy with exposed bone) (Figures 3A-3C), patellofemoral joint space reduced by more than 50% on skyline view, patellar thickness of 20 mm or more, and normal TT-TG distance.7
Vaquero and colleagues7 analyzed PTO outcomes in 31 patients (35 knees) with mean follow-up of 9 years and noted significant improvements in functional scores and radiologic parameters. All patients except 1 were satisfied with the operation. Radiologic progression of PFOA was slowed, but radiologic femorotibial osteoarthritis progressed in 23 cases (65%), and 4 required TKA. The authors found satisfactory clinical and radiologic outcomes—only 4 patients (12.5%) required TKA—and good functional outcomes.7
PTO, a low-morbidity surgery with good functional outcomes, does not close the door on other surgery, such as TKA.7
Tibial Tubercle Anteromedialization Osteotomy
Whereas PLPF and PTO are indicated in knees with normal TT-TG distance, Fulkerson AMZ osteotomy must be considered in isolated PFOA with articular cartilage lesions at the distal or lateral patellar facets resulting from long-standing malalignment with increased TT-TG distance (Figures 4A, 4B).
AMZ unloads the distal and lateral facets of the patella while improving the extensor mechanism.11,12 A successful AMZ outcome requires preservation of some of the medial and proximal articular cartilage of the patella. In 1983, Fulkerson13 described use of tibial tubercle AMZ osteotomy to address patellofemoral pain associated with patellofemoral chondrosis in conjunction with patellofemoral tilt and/or chronic patellar subluxation. This technique is indicated when the patella needs to be realigned for relief of elevated contact stress and centralization. Currently the technique is used not only in patients with isolated PFOA but in patients with chronic lateral patellar instability. Fulkerson osteotomy combines the benefits of the Maquet technique (unloading) and the Elmslie-Trillat technique (tracking improvement) in a single osteotomy, with no distraction of the osteotomy site with bone graft and without the complication rate of Maquet tibial tubercle elevation. Before surgery, computed tomography (CT) or magnetic resonance imaging (MRI) is routinely used to measure TT-TG distance to determine the tibial tubercle medialization required in the Fulkerson osteotomy. However, TT-TG distance must be used with caution, as it cannot be determined in cases with trochlear dysplasia. Consequently, physical examination and arthroscopic examination for evaluation of patellofemoral tracking and location of chondral defects should be performed before the Fulkerson osteotomy.
Rationale; Indications and Contraindications; Preoperative Planning
As already noted, AMZ unloads the distal and lateral facets of the patella. Beck and colleagues14 suggested AMZ is appropriate for unloading the lateral trochlea. However, it is not useful for central chondral defects and may actually increase the load in patients with medial chondral defects. As AMZ shifts contact force to the medial trochlea, Fulkerson osteotomy is appropriate when distal and lateral chondral lesions must be unloaded. Because this procedure moves the tibial tubercle medially and anteriorly, loads are transferred to the proximal and medial facets of the patella. Therefore, the procedure is contraindicated when diffuse, proximal, or medial chondral lesions are present. Moreover, AMZ is contraindicated in patients with normal TT-TG distance because there is the risk that overmedialization will cause symptomatic medial subluxation. Grade III or IV central trochlear cartilage lesions are also less likely to have successful AMZ outcomes. Therefore, before Fulkerson osteotomy is performed, MRI should be obtained to evaluate the patellofemoral articular surface and TT-TG distance. MRI provides information that is useful for preoperative planning because it allows assessment of articular cartilage lesions, including their location and severity. Moreover, because the osseous and cartilaginous contours of the patella differ, MRI gives a more accurate picture of the patellofemoral congruence than CT does. Last, before the open surgery is performed, the patellofemoral joint should be arthroscopically examined to determine the location of chondral lesions. Cartilage lesion mapping is important because Fulkerson osteotomy outcomes depend on chondral lesion location. Pidoriano and colleagues15 correlated AMZ outcomes with articular lesion location and noted optimal outcomes in patients with distal and lateral patellar articular lesions and intact trochlear cartilage (87% good and excellent outcomes). Patients with medial lesions and proximal or diffuse lesions generally did poorly (55% good and excellent outcomes in medial lesions vs 20% good and excellent outcomes in proximal and diffuse lesions). Central trochlear lesions were associated with medial patellar lesions, and all patients with central trochlear lesions had poor outcomes. Interestingly, Outerbridge grading of patellar lesions was not significantly correlated with overall outcomes.15 Even in cases of severe chondropathy, including bone-on-bone arthritis, AMZ has had reliable outcomes and may be superior to arthroplasty because of joint preservation, duration up to 8 years, and restoration of patellofemoral tracking. It should be noted that a resurfacing technique such as patellofemoral arthroplasty is not a substitute for patella realignment. Any patellofemoral maltracking must be corrected before patellofemoral arthroplasty. Fulkerson osteotomy does not preclude subsequent surgery (eg, TKA). Furthermore, AMZ may prevent the natural progression of PFOA related to chronic lateral tracking.
AMZ osteotomy can be adjusted for the specific indication and for the location of chondral defects. If the primary goal is unloading a lateral lesion, or lateral maltracking, then a flatter osteotomy may be performed to increase the relative medialization of the tubercle; however, if the primary goal is unloading a distal lesion, then a relatively more oblique or vertical osteotomy may be performed to transfer the load more proximally. This is the technique preferred by authors in most cases in which more anteriorization is desired.
When TT-TG distance is used to guide surgical realignment, patellofemoral chondrosis associated with normal TT-TG distance can be addressed with directly anterior displacement of the tibial tubercle. Anteriorization of the tibial tubercle can be obtained by inserting a bone block between the tubercle and the tibial cut (Figure 5A).16 The medialization can be neutralized by making this block as thick as the measured medialization.16
Surgical Outcomes of Anteromedialization in Patellofemoral Osteoarthritis
Fulkerson and colleagues10 followed 30 patients for more than 2 years after they underwent AMZ of the tibial tubercle for persistent patellofemoral pain associated with patellar articular degeneration. Of these 30 patients, 12 were followed for more than 5 years. The authors reported 93% good and excellent subjective outcomes and 89% good and excellent objective outcomes. Quality of improvement was sustained for all 12 patients reevaluated more than 5 years after surgery. When examined separately, 75% of patients with advanced PFOA had a good outcome, but none had an excellent outcome. Carofino and Fulkerson17 retrospectively evaluated tibial tubercle AMZ for isolated PFOA in 22 knees (17 active patients older than 50 years at time of surgery; mean age, 55 years) with minimum follow-up of 2 years (mean, 77 months). Mean postoperative Lysholm score was 83. According to Lysholm scores, outcomes were good to excellent in 12 cases, fair in 6, and poor in 1. The authors concluded that tibial tubercle AMZ is a definitive treatment option for isolated PFOA in active older patients. Morshuis and colleagues18 retrospectively evaluated 22 patients (25 knees) who underwent Fulkerson osteotomy for patellofemoral pain. Outcomes were evaluated a mean of 12 and 30 months after surgery. At the first evaluation, 84% of patients had satisfactory outcomes, and, at the second (≤38 months after surgery), 70%. Only in relatively young patients without signs of PFOA did outcomes remain satisfactory in all cases. At the later evaluation, 60% of patients with PFOA and/or lateralization had satisfactory outcomes.
Tips and Tricks to Avoid Complications
For some patients, AMZ performed technically correctly produced unhappiness—an outcome that may arise from incorrect patient selection or failure to meet patient expectations. It is important to discuss objectives and expectations with the patient before surgery. With correct patient selection and meticulous surgical technique (with customization of osteotomy angle and translation based on underlying lesion), surgeons have obtained excellent outcomes with infrequent complications (Table).
Intraoperative complications may involve neurovascular structures. The anterior tibial artery and the peroneal nerve are at risk during Fulkerson osteotomy. Decreased anterior sensation related to the infrapatellar branch of the saphenous nerve is not uncommon. Reducing the risk of neurovascular injury requires use of retractors and keeping the saw blade visible at all times. Another potential devastating complication is injury of the posterior vascular structures during bicortical tibial drilling for screw placement. According to Kline and colleagues,19 bicortical drilling may occur precariously near the posterior vascular structures of the knee. They advised extreme caution in drilling the posterior cortex during this procedure. To avoid the risk of compartment syndrome, surgeons can leave the anterior compartment fascia open or pie crust it by making multiple small perforations to decrease tension. Tibial fracture is another potential complication with this osteotomy. Reducing the risk of fracture involves tapering the distal cut anteriorly and avoiding a “notched” osteotomy (Figures 6A-6C).
Postoperative complications, which are similar to those associated with any knee surgery, include infection, arthrofibrosis, complex regional pain syndrome, thromboembolism, nonunion, fixation failure, and fracture. Arthrofibrosis has many causes, but the problem decreases with secure osteotomy fixation, early knee motion, and patellar mobilization. Overmedialization can result in medial patella instability, typically subluxation rather than complete dislocation. The instability can be relatively subtle or can cause pain and weakness. Lateralization of the tibial tubercle might be appropiate.23
Sulcus-Deepening Trochleoplasty
High-grade trochlear dysplasia with a prominence, frequently present in lateral patellar instability, is thought to correlate with PFOA because it produces an anti-Maquet effect.24 The dysplasia provokes an increment of the patellofemoral joint pressure that could explain patellofemoral chondropathy and ultimately PFOA. In fact, 33% of patients with isolated PFOA have a history of objective patellar dislocation.24 In these cases, SDT could be considered. Several studies have examined use of this technique in the treatment of instability, but not PFOA.25 After SDT, pain resolves despite the chondral lesions being left alone (Figures 7A, 7B).
Conclusion
Patellofemoral joint replacement is an option for patellofemoral pain only in very select cases. Preserving the joint is always a primary goal. As not all PFOA cases are equal, joint-preserving surgery must be tailored to the patient. The keys to success are good indication, precise surgery, proper rehabilitation, and, above all, doing only what is needed.
Am J Orthop. 2017;46(3):139-145. Copyright Frontline Medical Communications Inc. 2017. All rights reserved.
1. McAlindon TE, Snow S, Cooper C, Dieppe PA. Radiographic patterns of osteoarthritis of the knee joint in the community: the importance of the patellofemoral joint. Ann Rheum Dis. 1992;51(7):844-849.
2. Iwano T, Kurosawa H, Tokuyama H, Hoshikawa Y. Roentgenographic and clinical findings of patellofemoral osteoarthrosis. With special reference to its relationship to femorotibial osteoarthrosis and etiologic factors. Clin Orthop Relat Res. 1990;(252):190-197.
3. López-Franco M, Murciano-Antón MA, Fernández-Aceñero MJ, De Lucas-Villarrubia JC, López-Martín N, Gómez-Barrena E. Evaluation of a minimally aggressive method of patellofemoral osteoarthritis treatment at 10 years minimum follow-up. Knee. 2013;20(6):476-481.
4. Paulos LE, O’Connor DL, Karistinos A. Partial lateral patellar facetectomy for treatment of arthritis due to lateral patellar compression syndrome. Arthroscopy. 2008;24(5):547-553.
5. Wetzels T, Bellemans J. Patellofemoral osteoarthritis treated by partial lateral facetectomy: results at long-term follow up. Knee. 2012;19(4):411-415.
6. Yercan HS, Ait Si Selmi T, Neyret P. The treatment of patellofemoral osteoarthritis with partial lateral facetectomy. Clin Orthop Relat Res. 2005;(436):14-19.
7. Vaquero J, Calvo JA, Chana F, Perez-Mañanes R. The patellar thinning osteotomy in patellofemoral arthritis: four to 18 years’ follow-up. J Bone Joint Surg Br. 2010;92(10):1385-1391.
8. Vaquero J, Arriaza R. The patella thinning osteotomy. An experimental study of a new technique for reducing patellofemoral pressure. Int Orthop. 1992;16(4):372-376.
9. Fulkerson JP. Disorders of the Patellofemoral Joint. 3rd ed. Baltimore, MD: Williams & Wilkins; 1997.
10. Fulkerson JP, Becker GJ, Meaney JA, Miranda M, Folcik MA. Anteromedial tibial tubercle transfer without bone graft. Am J Sports Med. 1990;18(5):490-496.
11. Fulkerson JP. Patellofemoral pain disorders: evaluation and management. J Am Acad Orthop Surg. 1994;2(2):124-132.
12. Fulkerson JP. Diagnosis and treatment of patients with patellofemoral pain. Am J Sports Med. 2002;30(3):447-456.
13. Fulkerson JP. Anteromedialization of the tibial tuberosity for patellofemoral malalignment. Clin Orthop Relat Res. 1983;(177):176-181.
14. Beck PR, Thomas AL, Farr J, Lewis PB, Cole BJ. Trochlear contact pressures after anteromedialization of the tibial tubercle. Am J Sports Med. 2005;33(11):1710-1715.
15. Pidoriano AJ, Weinstein RN, Buuck DA, Fulkerson JP. Correlation of patellar articular lesions with results from anteromedial tibial tubercle transfer. Am J Sports Med. 1997;25(4):533-537.
16. Farr J. Tibial tubercle osteotomy. Tech Knee Surg. 2003;2:28-42.
17. Carofino BC, Fulkerson JP. Anteromedialization of the tibial tubercle for patellofemoral arthritis in patients > 50 years. J Knee Surg. 2008;21(2):101-105.
18. Morshuis WJ, Pavlov PW, de Rooy KP. Anteromedialization of the tibial tuberosity in the treatment of patellofemoral pain and malalignment. Clin Orthop Relat Res. 1990;(255):242-250.
19. Kline AJ, Gonzales J, Beach WR, Miller MD. Vascular risk associated with bicortical tibial drilling during anteromedial tibial tubercle transfer. Am J Orthop. 2006;35(1):30-32.
20. Stetson WB, Friedman MJ, Fulkerson JP, Cheng M, Buuck D. Fracture of the proximal tibia with immediate weightbearing after a Fulkerson osteotomy. Am J Sports Med. 1997;25(4):570-574.
21. Fulkerson JP. Fracture of the proximal tibia after Fulkerson anteromedial tibial tubercle transfer. A report of four cases. Am J Sports Med. 1999;27(2):265.
22. Cosgarea AJ, Freedman JA, McFarland EG. Nonunion of the tibial tubercle shingle following Fulkerson osteotomy. Am J Knee Surg. 2001;14(1):51-54.
23. Fulkerson JP. Anterolateralization of the tibial tubercle. Tech Orthop. 1997;12:165-169.
24. Grelsamer RP, Dejour D, Gould J. The pathophysiology of patellofemoral arthritis. Orthop Clin North Am. 2008;39(3):269-274.
25. Ntagiopoulos PG, Byn P, Dejour D. Midterm results of comprehensive surgical reconstruction including sulcus-deepening trochleoplasty in recurrent patellar dislocations with high-grade trochlear dysplasia. Am J Sports Med. 2013;41(5):998-1004.
26. Oberlander MA, Baker CL, Morgan BE. Patellofemoral arthrosis: the treatment options. Am J Orthop. 1998;27(4):263-270.
27. Scuderi GR. The Patella. New York, NY: Springer-Verlag; 1995.
28. Buuck D, Fulkerson JP. Anteromedialization of the tibial tubercle: a 4 to 12 year follow up. Oper Tech Sports Med. 2000;8:131-137.
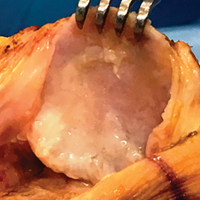
Measuring Malalignment on Imaging in the Treatment of Patellofemoral Instability
Take-Home Points
- Radiographic assessment of TT position is most commonly performed by measuring TT-TG distance, which is the distance between the extensor mechanism attachment at the TT and the center of the TG.
- TT-TG distances of more than 15 mm or 20 mm have been reported as indications for TT osteotomy.
- TT-TG distance criteria should serve as a guide, rather than a rigid threshold, in the context of imaging and patient factors when deciding whether to perform TT osteotomy for patellar instability.
- Factors such as knee flexion angle, imaging modality, and landmarks used for the measurements should be considered when using TT-TG distance as an indication for surgery.
- There has been significant variability in reported TT-TG measurements. A surgeon using this measurement should understand how it is obtained because many technical factors are involved.
Assessment of malalignment is an important factor in determining surgical treatment options for patellar instability. Although soft-tissue reconstruction of the medial soft-tissue stabilizers is often performed to address patellar instability, bony malalignment may increase stress on the medial soft tissues; therefore, it must be adequately identified and addressed.
Bony malalignment, which is often thought of as lateralization of the tibial tubercle (TT), can be influenced by tibiofemoral alignment, external tibial torsion, and femoral anteversion.
Clinically, coronal alignment can be assessed with a measurement such as quadriceps (Q) angle, but this has been reported to have low interrater reliability and high variability in the reported optimal conditions and positions in which the measurement should be made.1-3An anatomically lateralized TT pulls the extensor mechanism laterally with respect to the trochlear groove (TG), and this can accentuate problems related to patellofemoral instability. A recent biomechanical study found that increased TT lateralization significantly increased lateral patellar translation and tilt in the setting of medial patellofemoral ligament (MPFL) deficiency.4 Although MPFL reconstruction restored patellar kinematics and contact mechanics, this restoration did not occur when the TT was lateralized more than 10 mm relative to its normal position.
Realigning the extensor mechanism by moving the TT medially decreases the lateralizing forces on the patella and the stress on the soft-tissue restraints. This raises the issues of when to correct a lateralized TT and how to identify and measure malalignment.
Radiographic assessment of TT position is most commonly performed by measuring TT-TG distance, which is the distance between the extensor mechanism attachment at the TT and the center of the TG. Originally described on radiographs and subsequently on computed tomography (CT) and magnetic resonance imaging (MRI) scans, distances of more than 15 mm or 20 mm have been reported as indications for TT osteotomy.5,6However, there has been significant variability in reported TT-TG measurements. Studies have found that TT-TG distance is 3.8 mm larger on CT scans than on MRI scans.7 Furthermore, factors such as knee flexion angle at time of imaging have been found to reduce TT-TG distance.1 More recently, patient size and TT-TG ratios relative to patellar and trochlear width were identified as important factors in assessing TT-TG distance.8 Therefore, TT-TG distance measurements should serve as a guide rather than a rigid threshold in the context of imaging and patient factors when deciding whether to perform TT osteotomy for patellar instability.
What You Need to Know About Measuring Patellofemoral Malalignment
TT-TG distance can guide decisions about performing a medializing TT osteotomy for patellar instability because the measurement can aid in assessing bony malalignment caused by an anatomically lateralized tubercle. TT-TG distance can be used to determine when and how far to move the tubercle in TT osteotomy. 
Background
A normal TT-TG value is approximately 10 mm. The measurement originally used bony landmarks, including the deepest part of the bony TG and the anterior-most part of the TT, as described by Goutallier and colleagues.9 In their original study, Dejour and colleagues5 found that patients with recurrent symptoms of patellar instability had TT-TG distances >20 mm.
Increased TT-TG distance has been shown to correlate with patellar position, including increased lateral shift and lateral tilt of the patella. In a study using dynamic CT scans of patients with recurrent patellar instability, we found that TT-TG distance increased with knee extension, and that this increase correlated with the lateral shift and lateral tilt of the patella.10An excessively lateralized TT can be corrected with a medializing osteotomy that reduces TT-TG distance to within the normal range. TT surgery can be performed with flat osteotomy, as described by Elmslie and Trillat,11 or with oblique osteotomy, as described by Fulkerson,6 to obtain concomitant anteriorization. In a computational study, Elias and colleagues12 found that medializing TT osteotomy not only reduced TT-TG distance but led to correction of lateral patellar tilt and displacement. Patellofemoral contact forces have also shown to be reduced with anteromedialization.6Although reported outcomes of TT osteotomy have been excellent for patients with patellar instability, the procedure has higher risks and longer rehabilitation relative to a soft-tissue procedure alone. Reported risks associated with TT osteotomy include fracture, nonunion, delayed union, painful screws, and deep vein thrombosis.6,10,13,14Understanding the limitations of and variability in radiographic assessments of TT and TG positions can help when deciding whether to perform TT osteotomy for patellar instability.
Discussion
When considering TT osteotomy for patellar instability, some surgeons use a TT-TG distance of more than 15 mm or 20 mm as a threshold for performing medialization. The variability is based on the multiple patient and imaging factors that can influence TT-TG distance measurement.
Several TG and TT landmarks have been used to measure TT-TG distance. The deepest part of the TG, based on bony anatomy, was used originally, but the cartilaginous landmark at the deepest part of the cartilaginous TG has also been described.15 Similarly, on the TT, the original description of TT-TG distance, by Goutallier and colleagues,9 involved the anterior-most part of the TT on CT scan, though the central part of the TT has also been described.15 We found a 4.2-mm difference in TT-TG distance with use of different landmarks (central tubercle, anterior tubercle) within the same study population.16 Therefore, within a practice, the distance used as an indication for TT osteotomy should be measured consistently.
Knee flexion angle at the time of imaging can also affect measurement of TT-TG distance. Several authors have reported smaller TT-TG distance with increased knee flexion angle.10,16,17 In a study of patients with symptomatic patellar instability, we found that TT-TG distance decreases by an estimated 1 mm for every 4.4° of knee flexion >0°.10 In measurements of TT-TG distance, the sagittal view can be used to assess knee flexion angle because positioning protocols and patient comfort at the time of imaging may produce variable knee flexion angles.
Given the variability that occurs in TT-TG distance with knee flexion angles, some surgeons use TT–posterior cruciate ligament (PCL) distance as another measurement of TT lateralization.18 This measurement is made with both tibial landmarks, from the TT to the medial border of the PCL insertion on the tibia, and theoretically eliminates knee flexion angle as a measurement factor. Seitlinger and colleagues18 found that values >24 mm were associated with symptoms of patellar instability. More study is needed to determine the precise indications for TT osteotomy with use of this measurement.
In addition to patient positioning during knee imaging, patient size should be considered when TT-TG distance is used for malalignment measurement. Camp and colleagues8 discussed the importance of “individualizing” TT-TG distance on the basis of patient size and bony structure. They reported that the ratio of TT-TG distance to trochlear width or patellar width more effectively predicted recurrent patellar instability than TT-TG distance alone.
Measurement of TT-TG distance is valuable in planning surgical treatment for patellar instability because it quantifies a component of malalignment and aids in deciding whether to perform TT osteotomy. However, this distance should be understood in the context of many measurement factors to allow for an individualized procedure that addresses the specific contributors to patellar instability in each patient.
Am J Orthop. 2017;46(3):148-151. Copyright Frontline Medical Communications Inc. 2017. All rights reserved.
1. France L, Nester C. Effect of errors in the identification of anatomical landmarks on the accuracy of Q angle values. Clin Biomech (Bristol, Avon). 2001;16(8):710-713.
2. Greene CC, Edwards TB, Wade MR, Carson EW. Reliability of the quadriceps angle measurement. Am J Knee Surg. 2001;14(2):97-103.
3. Smith TO, Hunt NJ, Donell ST. The reliability and validity of the Q-angle: a systematic review. Knee Surg Sports Traumatol Arthrosc. 2008;16(12):1068-1079.
4. Stephen JM, Dodds AL, Lumpaopong P, Kader D, Williams A, Amis AA. The ability of medial patellofemoral ligament reconstruction to correct patellar kinematics and contact mechanics in the presence of a lateralized tibial tubercle. Am J Sports Med. 2015;43(9):2198-2207.
5. Dejour H, Walch G, Nove-Josserand L, Guier C. Factors of patellar instability: an anatomic radiographic study. Knee Surg Sports Traumatol Arthrosc. 1994;2(1):19-26.
6. Fulkerson JP. Anteromedialization of the tibial tuberosity for patellofemoral malalignment. Clin Orthop Relat Res. 1983;177:176-181.
7. Camp CL, Stuart MJ, Krych AJ, et al. CT and MRI measurements of tibial tubercle-trochlear groove distances are not equivalent in patients with patellar instability. Am J Sports Med. 2013;41(8):1835-1840.
8. Camp CL, Heidenreich MJ, Dahm DL, Stuart MJ, Levy BA, Krych AJ. Individualizing the tibial tubercle-trochlear groove distance: patellar instability ratios that predict recurrent instability. Am J Sports Med. 2016;44(2):393-399.
9. Goutallier D, Bernageau J, Lecudonnec B. [The measurement of the tibial tuberosity. Patella groove distanced technique and results (author’s transl)]. Rev Chir Orthop Reparatrice Appar Mot. 1978;64(5):423-428.
10. Tanaka MJ, Elias JJ, Williams AA, Carrino JA, Cosgarea AJ. Correlation between changes in tibial tuberosity-trochlear groove distance and patellar position during active knee extension on dynamic kinematic computed tomography imaging. Arthroscopy. 2015;31(9):1748-1755.
11. Trillat A, Dejour H, Couette A. [Diagnosis and treatment of recurrent dislocations of the patella]. Rev Chir Orthop Reparatrice Appar Motur. 1964;50(6):813-824.
12. Elias JJ, Carrino JA, Saranathan A, Guseila LM, Tanaka MJ, Cosgarea AJ. Variations in kinematics and function following patellar stabilization including tibial tuberosity realignment. Knee Surg Sports Traumatol Arthrosc. 2014;22(10):2350-2356.
13. Sherman SL, Erickson BJ, Cvetanovich GL, et al. Tibial tuberosity osteotomy: indications, techniques, and outcomes. Am J Sports Med. 2014;42(8):2006-2017.
14. Wilcox JJ, Snow BJ, Aoki SK, Hung M, Burks RT. Does landmark selection affect the reliability of tibial tubercle-trochlear groove measurements using MRI? Clin Orthop Relat Res. 2012;470(8):2253-2260.
15. Schoettle PB, Zanetti M, Seifert B, Pfirrmann CWA, Fucentese SF, Romero J. The tibial tuberosity-trochlear groove distance; a comparative study between CT and MRI scanning. Knee. 2006;13(1):26-31.
16. Williams AA, Tanaka MJ, Elias JJ, et al. Measuring tibial tuberosity-trochlear groove distance on CT: Where to begin? Presented at the American Academy of Orthopaedic Surgeons Annual Meeting, New Orleans, LA, March 11-15, 2014.
17. Dietrich TJ, Betz M, Pfirrmann CWA, Koch PP, Fucentese SF. End-stage extension of the knee and its influence on tibial tuberosity-trochlear groove distance (TTTG) in asymptomatic volunteers. Knee Surg Sports Traumatol Arthrosc. 2014;22(1):214-218.
18. Seitlinger G, Scheurecker G, Hogler R, Labey L, Innocenti B, Hofmann S. Tibial tubercle-posterior cruciate ligament distance: a new measurement to define the position of the tibial tubercle in patients with patellar dislocation. Am J Sports Med. 2012;40(5):1119-1125.
Take-Home Points
- Radiographic assessment of TT position is most commonly performed by measuring TT-TG distance, which is the distance between the extensor mechanism attachment at the TT and the center of the TG.
- TT-TG distances of more than 15 mm or 20 mm have been reported as indications for TT osteotomy.
- TT-TG distance criteria should serve as a guide, rather than a rigid threshold, in the context of imaging and patient factors when deciding whether to perform TT osteotomy for patellar instability.
- Factors such as knee flexion angle, imaging modality, and landmarks used for the measurements should be considered when using TT-TG distance as an indication for surgery.
- There has been significant variability in reported TT-TG measurements. A surgeon using this measurement should understand how it is obtained because many technical factors are involved.
Assessment of malalignment is an important factor in determining surgical treatment options for patellar instability. Although soft-tissue reconstruction of the medial soft-tissue stabilizers is often performed to address patellar instability, bony malalignment may increase stress on the medial soft tissues; therefore, it must be adequately identified and addressed.
Bony malalignment, which is often thought of as lateralization of the tibial tubercle (TT), can be influenced by tibiofemoral alignment, external tibial torsion, and femoral anteversion.
Clinically, coronal alignment can be assessed with a measurement such as quadriceps (Q) angle, but this has been reported to have low interrater reliability and high variability in the reported optimal conditions and positions in which the measurement should be made.1-3An anatomically lateralized TT pulls the extensor mechanism laterally with respect to the trochlear groove (TG), and this can accentuate problems related to patellofemoral instability. A recent biomechanical study found that increased TT lateralization significantly increased lateral patellar translation and tilt in the setting of medial patellofemoral ligament (MPFL) deficiency.4 Although MPFL reconstruction restored patellar kinematics and contact mechanics, this restoration did not occur when the TT was lateralized more than 10 mm relative to its normal position.
Realigning the extensor mechanism by moving the TT medially decreases the lateralizing forces on the patella and the stress on the soft-tissue restraints. This raises the issues of when to correct a lateralized TT and how to identify and measure malalignment.
Radiographic assessment of TT position is most commonly performed by measuring TT-TG distance, which is the distance between the extensor mechanism attachment at the TT and the center of the TG. Originally described on radiographs and subsequently on computed tomography (CT) and magnetic resonance imaging (MRI) scans, distances of more than 15 mm or 20 mm have been reported as indications for TT osteotomy.5,6However, there has been significant variability in reported TT-TG measurements. Studies have found that TT-TG distance is 3.8 mm larger on CT scans than on MRI scans.7 Furthermore, factors such as knee flexion angle at time of imaging have been found to reduce TT-TG distance.1 More recently, patient size and TT-TG ratios relative to patellar and trochlear width were identified as important factors in assessing TT-TG distance.8 Therefore, TT-TG distance measurements should serve as a guide rather than a rigid threshold in the context of imaging and patient factors when deciding whether to perform TT osteotomy for patellar instability.
What You Need to Know About Measuring Patellofemoral Malalignment
TT-TG distance can guide decisions about performing a medializing TT osteotomy for patellar instability because the measurement can aid in assessing bony malalignment caused by an anatomically lateralized tubercle. TT-TG distance can be used to determine when and how far to move the tubercle in TT osteotomy.
Background
A normal TT-TG value is approximately 10 mm. The measurement originally used bony landmarks, including the deepest part of the bony TG and the anterior-most part of the TT, as described by Goutallier and colleagues.9 In their original study, Dejour and colleagues5 found that patients with recurrent symptoms of patellar instability had TT-TG distances >20 mm.
Increased TT-TG distance has been shown to correlate with patellar position, including increased lateral shift and lateral tilt of the patella. In a study using dynamic CT scans of patients with recurrent patellar instability, we found that TT-TG distance increased with knee extension, and that this increase correlated with the lateral shift and lateral tilt of the patella.10An excessively lateralized TT can be corrected with a medializing osteotomy that reduces TT-TG distance to within the normal range. TT surgery can be performed with flat osteotomy, as described by Elmslie and Trillat,11 or with oblique osteotomy, as described by Fulkerson,6 to obtain concomitant anteriorization. In a computational study, Elias and colleagues12 found that medializing TT osteotomy not only reduced TT-TG distance but led to correction of lateral patellar tilt and displacement. Patellofemoral contact forces have also shown to be reduced with anteromedialization.6Although reported outcomes of TT osteotomy have been excellent for patients with patellar instability, the procedure has higher risks and longer rehabilitation relative to a soft-tissue procedure alone. Reported risks associated with TT osteotomy include fracture, nonunion, delayed union, painful screws, and deep vein thrombosis.6,10,13,14Understanding the limitations of and variability in radiographic assessments of TT and TG positions can help when deciding whether to perform TT osteotomy for patellar instability.
Discussion
When considering TT osteotomy for patellar instability, some surgeons use a TT-TG distance of more than 15 mm or 20 mm as a threshold for performing medialization. The variability is based on the multiple patient and imaging factors that can influence TT-TG distance measurement.
Several TG and TT landmarks have been used to measure TT-TG distance. The deepest part of the TG, based on bony anatomy, was used originally, but the cartilaginous landmark at the deepest part of the cartilaginous TG has also been described.15 Similarly, on the TT, the original description of TT-TG distance, by Goutallier and colleagues,9 involved the anterior-most part of the TT on CT scan, though the central part of the TT has also been described.15 We found a 4.2-mm difference in TT-TG distance with use of different landmarks (central tubercle, anterior tubercle) within the same study population.16 Therefore, within a practice, the distance used as an indication for TT osteotomy should be measured consistently.
Knee flexion angle at the time of imaging can also affect measurement of TT-TG distance. Several authors have reported smaller TT-TG distance with increased knee flexion angle.10,16,17 In a study of patients with symptomatic patellar instability, we found that TT-TG distance decreases by an estimated 1 mm for every 4.4° of knee flexion >0°.10 In measurements of TT-TG distance, the sagittal view can be used to assess knee flexion angle because positioning protocols and patient comfort at the time of imaging may produce variable knee flexion angles.
Given the variability that occurs in TT-TG distance with knee flexion angles, some surgeons use TT–posterior cruciate ligament (PCL) distance as another measurement of TT lateralization.18 This measurement is made with both tibial landmarks, from the TT to the medial border of the PCL insertion on the tibia, and theoretically eliminates knee flexion angle as a measurement factor. Seitlinger and colleagues18 found that values >24 mm were associated with symptoms of patellar instability. More study is needed to determine the precise indications for TT osteotomy with use of this measurement.
In addition to patient positioning during knee imaging, patient size should be considered when TT-TG distance is used for malalignment measurement. Camp and colleagues8 discussed the importance of “individualizing” TT-TG distance on the basis of patient size and bony structure. They reported that the ratio of TT-TG distance to trochlear width or patellar width more effectively predicted recurrent patellar instability than TT-TG distance alone.
Measurement of TT-TG distance is valuable in planning surgical treatment for patellar instability because it quantifies a component of malalignment and aids in deciding whether to perform TT osteotomy. However, this distance should be understood in the context of many measurement factors to allow for an individualized procedure that addresses the specific contributors to patellar instability in each patient.
Am J Orthop. 2017;46(3):148-151. Copyright Frontline Medical Communications Inc. 2017. All rights reserved.
1. France L, Nester C. Effect of errors in the identification of anatomical landmarks on the accuracy of Q angle values. Clin Biomech (Bristol, Avon). 2001;16(8):710-713.
2. Greene CC, Edwards TB, Wade MR, Carson EW. Reliability of the quadriceps angle measurement. Am J Knee Surg. 2001;14(2):97-103.
3. Smith TO, Hunt NJ, Donell ST. The reliability and validity of the Q-angle: a systematic review. Knee Surg Sports Traumatol Arthrosc. 2008;16(12):1068-1079.
4. Stephen JM, Dodds AL, Lumpaopong P, Kader D, Williams A, Amis AA. The ability of medial patellofemoral ligament reconstruction to correct patellar kinematics and contact mechanics in the presence of a lateralized tibial tubercle. Am J Sports Med. 2015;43(9):2198-2207.
5. Dejour H, Walch G, Nove-Josserand L, Guier C. Factors of patellar instability: an anatomic radiographic study. Knee Surg Sports Traumatol Arthrosc. 1994;2(1):19-26.
6. Fulkerson JP. Anteromedialization of the tibial tuberosity for patellofemoral malalignment. Clin Orthop Relat Res. 1983;177:176-181.
7. Camp CL, Stuart MJ, Krych AJ, et al. CT and MRI measurements of tibial tubercle-trochlear groove distances are not equivalent in patients with patellar instability. Am J Sports Med. 2013;41(8):1835-1840.
8. Camp CL, Heidenreich MJ, Dahm DL, Stuart MJ, Levy BA, Krych AJ. Individualizing the tibial tubercle-trochlear groove distance: patellar instability ratios that predict recurrent instability. Am J Sports Med. 2016;44(2):393-399.
9. Goutallier D, Bernageau J, Lecudonnec B. [The measurement of the tibial tuberosity. Patella groove distanced technique and results (author’s transl)]. Rev Chir Orthop Reparatrice Appar Mot. 1978;64(5):423-428.
10. Tanaka MJ, Elias JJ, Williams AA, Carrino JA, Cosgarea AJ. Correlation between changes in tibial tuberosity-trochlear groove distance and patellar position during active knee extension on dynamic kinematic computed tomography imaging. Arthroscopy. 2015;31(9):1748-1755.
11. Trillat A, Dejour H, Couette A. [Diagnosis and treatment of recurrent dislocations of the patella]. Rev Chir Orthop Reparatrice Appar Motur. 1964;50(6):813-824.
12. Elias JJ, Carrino JA, Saranathan A, Guseila LM, Tanaka MJ, Cosgarea AJ. Variations in kinematics and function following patellar stabilization including tibial tuberosity realignment. Knee Surg Sports Traumatol Arthrosc. 2014;22(10):2350-2356.
13. Sherman SL, Erickson BJ, Cvetanovich GL, et al. Tibial tuberosity osteotomy: indications, techniques, and outcomes. Am J Sports Med. 2014;42(8):2006-2017.
14. Wilcox JJ, Snow BJ, Aoki SK, Hung M, Burks RT. Does landmark selection affect the reliability of tibial tubercle-trochlear groove measurements using MRI? Clin Orthop Relat Res. 2012;470(8):2253-2260.
15. Schoettle PB, Zanetti M, Seifert B, Pfirrmann CWA, Fucentese SF, Romero J. The tibial tuberosity-trochlear groove distance; a comparative study between CT and MRI scanning. Knee. 2006;13(1):26-31.
16. Williams AA, Tanaka MJ, Elias JJ, et al. Measuring tibial tuberosity-trochlear groove distance on CT: Where to begin? Presented at the American Academy of Orthopaedic Surgeons Annual Meeting, New Orleans, LA, March 11-15, 2014.
17. Dietrich TJ, Betz M, Pfirrmann CWA, Koch PP, Fucentese SF. End-stage extension of the knee and its influence on tibial tuberosity-trochlear groove distance (TTTG) in asymptomatic volunteers. Knee Surg Sports Traumatol Arthrosc. 2014;22(1):214-218.
18. Seitlinger G, Scheurecker G, Hogler R, Labey L, Innocenti B, Hofmann S. Tibial tubercle-posterior cruciate ligament distance: a new measurement to define the position of the tibial tubercle in patients with patellar dislocation. Am J Sports Med. 2012;40(5):1119-1125.
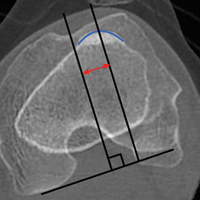
Ultrasound-Guided Percutaneous Repair of Medial Patellofemoral Ligament: Surgical Technique and Outcomes
Take-Home Points
- Use ultrasound to identify integrity and location of MPFL tear.
- Anatomic repair allows native tissue to reintegrate into bone.
- Repairs done early can prevent complications of recurrent instability.
- Repair maintains biological and proprioceptive qualities of tissue.
- 10Ultrasound-guided percutaneous repair is quick and effective.
The medial patellofemoral ligament (MPFL) is the primary passive restraint to lateral patellar excursion1-5 and helps control patellar tilt and rotation.6,7 More than 90% of lateral patellar dislocations cause the MPFL to rupture, and roughly 90% of these detachments involve the femoral insertion.4 Ensuing patellar instability often results from MPFL insufficiency. It has been suggested that re-creating the anatomy and functionality of this ligament is of utmost importance in restoring normal patellar biomechanics.1-5,7,8
Anatomical risk factors for recurrent patellar instability include patella alta, increased tibial tuberosity-trochlear groove (TT-TG) distance, trochlear dysplasia, and torsional abnormalities.1-4,6 A medial reefing technique with a lateral tissue release traditionally was used to restore proper kinematics, but was shown to have associated postoperative issues.9 


Methods
Patient Demographics
Dr. Hirahara developed this technique in 2013 and performed it 11 times between 2013 and 2016. Of the 11 patients, 1 was excluded from our retrospective analysis because of trochlear dysplasia, now considered a relative contraindication. Of the remaining 10 patients, 5 (50%) had the repair performed on the right knee. Eight patients (80%) were female. Mean (SD) age was 17.21 (3.53) years. One patient had concurrent femur- and patella-side detachments; otherwise, 6 (60%) of 10 repairs were performed exclusively at the patella. We grade patellar instability according to amount of glide based on patellar width and quadrants. Normal lateral displacement was usually 1 to 2 quadrants of lateral glide relative to the contralateral side. Before surgery, 6 (60%) of the 10 patients presented with lateral glide of 3 quadrants, and 3 (30%) presented with lateral glide of 4 quadrants. All had patellar instability apprehension on physical examination.
Surgical Indications
Before surgery, MPFL integrity is determined by ultrasound evaluation. Repair is considered if the MPFL has a femur- or patella-side tear and is of adequate quantity and quality, and if there are minimal or no arthritic changes (Table 2). 
Surgical Technique
The patient is brought to the operating room and placed supine. Patellar stability of the affected knee is assessed and compared with that of the contralateral side with patellar glide. The knee is prepared and draped in usual sterile fashion. With the knee flexed at 90º, a tourniquet is inflated. Diagnostic arthroscopy is performed with standard anteromedial and anterolateral portals, and, if necessary, arthroscopic procedures are performed.
Femoral Attachment Repair
With the leg in extension, ultrasound is used to identify the tear at the femoral attachment (watch part 1 of the video). A spinal needle is placed at the femoral insertion, typically just anterior and distal to the adductor tubercle (Figure 4).10 
Patellar Attachment Repair
With the leg in extension, ultrasound is used to identify where the MPFL is detached from the patella (watch part 2 of the video). A spinal needle is placed at the detachment site (Figure 5). A scalpel is used to make a 1-cm incision down to the patella. 
In this description, we showcase knotless and knotted techniques for each repair site. Either method is appropriate for the 2 repair sites. Owing to the superficial nature of the attachment sites—they may have very little fat, particularly at the patella—knot stacks are more prominent, can be felt after surgery, and have the potential to irritate surrounding tissues. Therefore, we prefer knotless fixation for both sites.
Rehabilitation
Rehabilitation after MPFL repair is much like rehabilitation after quadriceps tendon repair. The patient is locked in a brace in full extension when up and moving. Early weight-bearing and minimal use of assistive devices (crutches) are allowed because, when the leg is in full extension, there is no tension at the repair sites. Rehabilitation begins within 1 week, and normal daily function is quickly attained. The protocol emphasizes pain-free motion and suitable patellar mobility, and allows the immobilizing brace to be unlocked for exercise and sitting. During the first 4 weeks, quadriceps activation is limited; progression to full ROM occurs by 4 to 6 weeks. During the strengthening phase, loading the knee in early flexion should be avoided. Return to heavy lifting, physical activity, and sports is delayed until after 6 months in order to allow the construct to mature and integrate. Once the patient has satisfied all the strength, ROM, and functional outcome measurements, a brace is no longer required during sports and normal activity.
Results
Mean tourniquet time for each procedure, which includes diagnostic arthroscopy and ultrasound-guided percutaneous repair, was 26.9 minutes. 
Discussion
Conservative management typically is recommended for acute patellar dislocations. In the event of failed conservative management or chronic patellar instability, surgical intervention is indicated. Studies have found that conservative management has recurrent-dislocation rates of 35% at 3-year follow-up and 73% at 6-year follow-up, and recurrent dislocations significantly increase patients’ risk of developing chondral and bony damage.13 MPFL repair is designed to restore proper patellar tracking and kinematics while maintaining the anatomical tissue. Lateral patellar dislocations often cause the MPFL to rupture; tears are reported in more than 90% of incidents.4 The significant rate indicates that, even after a single patellar dislocation, the MPFL should be evaluated. The MPFL contributes 50% to 60% of the medial stabilizing force during patellar tracking1,7,14 and is the primary restraint to lateral patellar excursion and excessive patellar tilt and rotation.1-5 Its absence plays a key role in recurrent lateral patellar instability. With this structure being so important, proper identification and intervention are vital. Studies have established that redislocation rates are significantly higher for nonoperatively (vs operatively) treated primary patellar dislocations.13 Simple and accurate percutaneous repair of the MPFL should be performed early to avoid the long-term complications of recurrent instability that could damage the cartilage and bone of the patella and trochlea.
The primary advantage of this technique is its novel use of musculoskeletal ultrasound to accurately identify anatomy and pathology and the placement of anatomical repairs. Accurate preoperative and intraoperative assessment of MPFL anatomy is vital to the success of a procedure. Descriptions of MPFL anatomy suggest discrepancies in the exact locations of the femoral and patellar attachments.2,5,7,10,12,15,16 Tanaka5 noted that, even within paired knees, there was “marked variability” in the MPFL insertions. McCarthy and colleagues10 contended the femoral attachment of the MPFL is just anterior and distal to the adductor tubercle, the landmark addressed in this technique. Steensen and colleagues16 described this attachment site as being statistically the “single most important point affecting isometry” of the MPFL. Sallay and colleagues4 asserted that an overwhelming majority of MPFL tears (87%) occur at the adductor tubercle. The variable distribution of tear locations and the importance of re-creating patient anatomy further highlight the need for individualized treatment, which is afforded by ultrasound. Fluoroscopy has been inadequate in identifying MPFL anatomy; this modality is difficult, cumbersome, inaccurate, and inconsistent.11,12 Conversely, ultrasound provides real-time visualization of anatomy and allows for precise identification of MPFL attachments and accurate placement of suture anchors for repair during surgery (Figures 3, 4).
For femur-side and patella-side tears, repairs can and should be performed. For midsubstance tears, however, repair is not feasible, and reconstruction is appropriate. MPFL repair is superior to reconstruction in several ways. Repair is a simple percutaneous procedure that had a mean tourniquet time of 26.9 minutes in this study. For tissue that is quantitatively and qualitatively adequate, repair allows the structure to reintegrate into bone without total reconstruction. In the event of multiple tears, the percutaneous procedure allows for repair of each attachment. As the MPFL sits between the second and third tissue layers of the medial knee, reconstruction can be difficult and invasive and require establishment of a between-layers plane, which can disrupt adjacent tissue.4,7,17 Repair also maintains native tissue and its neurovascular and proprioceptive properties.
Reconstruction of the MPFL has become the gold-standard treatment for recurrent lateral patellar instability but has limitations and complications.3,7,12,17 Reconstruction techniques use either surface anatomy palpation (requiring large incisions) or fluoroscopy to identify tunnel placement locations, and accurate placement has often been difficult and inconsistent. Our repair technique has several advantages over reconstruction. It does not burn any bridges; it allows for subsequent reconstruction. It does not require a graft and, using small suture anchors instead of large sockets and anchors, involves less bone loss. It also allows for early repair of tears—patients can return to activities, sports, and work quicker—and avoids the risk of chondral and bony damage with recurrent dislocations. According to our review of the MPFL repairs performed by Dr. Hirahara starting in 2013, the procedure is quick and successful and has outstanding outcomes.
Another treatment option for recurrent lateral patellar instability combines reefing of the medial patellofemoral tissues with a lateral release. This combination has had several postoperative complications and is no longer indicated.9 TT transfer and trochleoplasty procedures have been developed to address different aspects of patellar instability, increased TT-TG distance, and dysplastic trochlea (Table 2). Both types of procedures are highly invasive and difficult to perform, requiring technical expertise. They are best used when warranted by the anatomy, but this is uncommon. The technique we have presented allows for easy and reliable repair of dislocations in the absence of associated pathology that would require larger, more complex surgery. The ease of use and accuracy of musculoskeletal ultrasound make this technique superior to others.
Conclusion
The MPFL is a vital static stabilizer of the patella and as such should be evaluated in the setting of patellar injury. The novel preoperative and intraoperative use of musculoskeletal ultrasound described in this article allows for easy real-time identification of the MPFL and simple and accurate percutaneous repair of torn structures. Nonoperative treatments of acute patellar dislocations have higher rates of recurrent dislocations, which put patella and trochlea at risk for bony and chondral damage. Given appropriate tear location and tissue quality, repairs should be considered early and before reconstruction. To our knowledge, a reliable, easily reproducible MPFL repair was not described until now. We have reported on use of such a technique and on its promising patient outcomes, which should be considered when addressing MPFL injuries.
Am J Orthop. 2017;46(3):152-157. Copyright Frontline Medical Communications Inc. 2017. All rights reserved.
1. Desio SM, Burks RT, Bachus KN. Soft tissue restraints to lateral patellar translation in the human knee. Am J Sports Med. 1998;26(1):59-65.
2. Nomura E, Inoue M, Osada N. Anatomical analysis of the medial patellofemoral ligament of the knee, especially the femoral attachment. Knee Surg Sports Traumatol Arthrosc. 2005;13(7):510-515.
3. Petri M, Ettinger M, Stuebig T, et al. Current concepts for patellar dislocation. Arch Trauma Res. 2015;4(3):e29301.
4. Sallay PI, Poggi J, Speer KP, Garrett WE. Acute dislocation of the patella. A correlative pathoanatomic study. Am J Sports Med. 1996;24(1):52-60.
5. Tanaka MJ. Variability in the patellar attachment of the medial patellofemoral ligament. Arthroscopy. 2016;32(8):1667-1670.
6. Philippot R, Boyer B, Testa R, Farizon F, Moyen B. The role of the medial ligamentous structures on patellar tracking during knee flexion. Knee Surg Sports Traumatol Arthrosc. 2012;20(2):331-336.
7. Philippot R, Chouteau J, Wegrzyn J, Testa R, Fessy MH, Moyen B. Medial patellofemoral ligament anatomy: implications for its surgical reconstruction. Knee Surg Sports Traumatol Arthrosc. 2009;17(5):475-479.
8. Ahmad CS, Stein BE, Matuz D, Henry JH. Immediate surgical repair of the medial patellar stabilizers for acute patellar dislocation. A review of eight cases. Am J Sports Med. 2000;28(6):804-810.
9. Song GY, Hong L, Zhang H, Zhang J, Li Y, Feng H. Iatrogenic medial patellar instability following lateral retinacular release of the knee joint. Knee Surg Sports Traumatol Arthrosc. 2016;24(9):2825-2830.
10. McCarthy M, Ridley TJ, Bollier M, Wolf B, Albright J, Amendola A. Femoral tunnel placement in medial patellofemoral ligament reconstruction. Iowa Orthop J. 2013;33:58-63.
11. Redfern J, Kamath G, Burks R. Anatomical confirmation of the use of radiographic landmarks in medial patellofemoral ligament reconstruction. Am J Sports Med. 2010;38(2):293-297.
12. Barnett AJ, Howells NR, Burston BJ, Ansari A, Clark D, Eldridge JD. Radiographic landmarks for tunnel placement in reconstruction of the medial patellofemoral ligament. Knee Surg Sports Traumatol Arthrosc. 2012;20(12):2380-2384.
13. Regalado G, Lintula H, Kokki H, Kröger H, Väätäinen U, Eskelinen M. Six-year outcome after non-surgical versus surgical treatment of acute primary patellar dislocation in adolescents: a prospective randomized trial. Knee Surg Sports Traumatol Arthrosc. 2016;24(1):6-11.
14. Sandmeier RH, Burks RT, Bachus KN, Billings A. The effect of reconstruction of the medial patellofemoral ligament on patellar tracking. Am J Sports Med. 2000;28(3):345-349.
15. Baldwin JL. The anatomy of the medial patellofemoral ligament. Am J Sports Med. 2009;37(12):2355-2361.
16. Steensen RN, Dopirak RM, McDonald WG 3rd. The anatomy and isometry of the medial patellofemoral ligament: implications for reconstruction. Am J Sports Med. 2004;32(6):1509-1513.
17. Godin JA, Karas V, Visgauss JD, Garrett WE. Medial patellofemoral ligament reconstruction using a femoral loop button fixation technique. Arthrosc Tech. 2015;4(5):e601-e607.
Take-Home Points
- Use ultrasound to identify integrity and location of MPFL tear.
- Anatomic repair allows native tissue to reintegrate into bone.
- Repairs done early can prevent complications of recurrent instability.
- Repair maintains biological and proprioceptive qualities of tissue.
- 10Ultrasound-guided percutaneous repair is quick and effective.
The medial patellofemoral ligament (MPFL) is the primary passive restraint to lateral patellar excursion1-5 and helps control patellar tilt and rotation.6,7 More than 90% of lateral patellar dislocations cause the MPFL to rupture, and roughly 90% of these detachments involve the femoral insertion.4 Ensuing patellar instability often results from MPFL insufficiency. It has been suggested that re-creating the anatomy and functionality of this ligament is of utmost importance in restoring normal patellar biomechanics.1-5,7,8
Anatomical risk factors for recurrent patellar instability include patella alta, increased tibial tuberosity-trochlear groove (TT-TG) distance, trochlear dysplasia, and torsional abnormalities.1-4,6 A medial reefing technique with a lateral tissue release traditionally was used to restore proper kinematics, but was shown to have associated postoperative issues.9
Methods
Patient Demographics
Dr. Hirahara developed this technique in 2013 and performed it 11 times between 2013 and 2016. Of the 11 patients, 1 was excluded from our retrospective analysis because of trochlear dysplasia, now considered a relative contraindication. Of the remaining 10 patients, 5 (50%) had the repair performed on the right knee. Eight patients (80%) were female. Mean (SD) age was 17.21 (3.53) years. One patient had concurrent femur- and patella-side detachments; otherwise, 6 (60%) of 10 repairs were performed exclusively at the patella. We grade patellar instability according to amount of glide based on patellar width and quadrants. Normal lateral displacement was usually 1 to 2 quadrants of lateral glide relative to the contralateral side. Before surgery, 6 (60%) of the 10 patients presented with lateral glide of 3 quadrants, and 3 (30%) presented with lateral glide of 4 quadrants. All had patellar instability apprehension on physical examination.
Surgical Indications
Before surgery, MPFL integrity is determined by ultrasound evaluation. Repair is considered if the MPFL has a femur- or patella-side tear and is of adequate quantity and quality, and if there are minimal or no arthritic changes (Table 2).
Surgical Technique
The patient is brought to the operating room and placed supine. Patellar stability of the affected knee is assessed and compared with that of the contralateral side with patellar glide. The knee is prepared and draped in usual sterile fashion. With the knee flexed at 90º, a tourniquet is inflated. Diagnostic arthroscopy is performed with standard anteromedial and anterolateral portals, and, if necessary, arthroscopic procedures are performed.
Femoral Attachment Repair
With the leg in extension, ultrasound is used to identify the tear at the femoral attachment (watch part 1 of the video). A spinal needle is placed at the femoral insertion, typically just anterior and distal to the adductor tubercle (Figure 4).10
Patellar Attachment Repair
With the leg in extension, ultrasound is used to identify where the MPFL is detached from the patella (watch part 2 of the video). A spinal needle is placed at the detachment site (Figure 5). A scalpel is used to make a 1-cm incision down to the patella.
In this description, we showcase knotless and knotted techniques for each repair site. Either method is appropriate for the 2 repair sites. Owing to the superficial nature of the attachment sites—they may have very little fat, particularly at the patella—knot stacks are more prominent, can be felt after surgery, and have the potential to irritate surrounding tissues. Therefore, we prefer knotless fixation for both sites.
Rehabilitation
Rehabilitation after MPFL repair is much like rehabilitation after quadriceps tendon repair. The patient is locked in a brace in full extension when up and moving. Early weight-bearing and minimal use of assistive devices (crutches) are allowed because, when the leg is in full extension, there is no tension at the repair sites. Rehabilitation begins within 1 week, and normal daily function is quickly attained. The protocol emphasizes pain-free motion and suitable patellar mobility, and allows the immobilizing brace to be unlocked for exercise and sitting. During the first 4 weeks, quadriceps activation is limited; progression to full ROM occurs by 4 to 6 weeks. During the strengthening phase, loading the knee in early flexion should be avoided. Return to heavy lifting, physical activity, and sports is delayed until after 6 months in order to allow the construct to mature and integrate. Once the patient has satisfied all the strength, ROM, and functional outcome measurements, a brace is no longer required during sports and normal activity.
Results
Mean tourniquet time for each procedure, which includes diagnostic arthroscopy and ultrasound-guided percutaneous repair, was 26.9 minutes.
Discussion
Conservative management typically is recommended for acute patellar dislocations. In the event of failed conservative management or chronic patellar instability, surgical intervention is indicated. Studies have found that conservative management has recurrent-dislocation rates of 35% at 3-year follow-up and 73% at 6-year follow-up, and recurrent dislocations significantly increase patients’ risk of developing chondral and bony damage.13 MPFL repair is designed to restore proper patellar tracking and kinematics while maintaining the anatomical tissue. Lateral patellar dislocations often cause the MPFL to rupture; tears are reported in more than 90% of incidents.4 The significant rate indicates that, even after a single patellar dislocation, the MPFL should be evaluated. The MPFL contributes 50% to 60% of the medial stabilizing force during patellar tracking1,7,14 and is the primary restraint to lateral patellar excursion and excessive patellar tilt and rotation.1-5 Its absence plays a key role in recurrent lateral patellar instability. With this structure being so important, proper identification and intervention are vital. Studies have established that redislocation rates are significantly higher for nonoperatively (vs operatively) treated primary patellar dislocations.13 Simple and accurate percutaneous repair of the MPFL should be performed early to avoid the long-term complications of recurrent instability that could damage the cartilage and bone of the patella and trochlea.
The primary advantage of this technique is its novel use of musculoskeletal ultrasound to accurately identify anatomy and pathology and the placement of anatomical repairs. Accurate preoperative and intraoperative assessment of MPFL anatomy is vital to the success of a procedure. Descriptions of MPFL anatomy suggest discrepancies in the exact locations of the femoral and patellar attachments.2,5,7,10,12,15,16 Tanaka5 noted that, even within paired knees, there was “marked variability” in the MPFL insertions. McCarthy and colleagues10 contended the femoral attachment of the MPFL is just anterior and distal to the adductor tubercle, the landmark addressed in this technique. Steensen and colleagues16 described this attachment site as being statistically the “single most important point affecting isometry” of the MPFL. Sallay and colleagues4 asserted that an overwhelming majority of MPFL tears (87%) occur at the adductor tubercle. The variable distribution of tear locations and the importance of re-creating patient anatomy further highlight the need for individualized treatment, which is afforded by ultrasound. Fluoroscopy has been inadequate in identifying MPFL anatomy; this modality is difficult, cumbersome, inaccurate, and inconsistent.11,12 Conversely, ultrasound provides real-time visualization of anatomy and allows for precise identification of MPFL attachments and accurate placement of suture anchors for repair during surgery (Figures 3, 4).
For femur-side and patella-side tears, repairs can and should be performed. For midsubstance tears, however, repair is not feasible, and reconstruction is appropriate. MPFL repair is superior to reconstruction in several ways. Repair is a simple percutaneous procedure that had a mean tourniquet time of 26.9 minutes in this study. For tissue that is quantitatively and qualitatively adequate, repair allows the structure to reintegrate into bone without total reconstruction. In the event of multiple tears, the percutaneous procedure allows for repair of each attachment. As the MPFL sits between the second and third tissue layers of the medial knee, reconstruction can be difficult and invasive and require establishment of a between-layers plane, which can disrupt adjacent tissue.4,7,17 Repair also maintains native tissue and its neurovascular and proprioceptive properties.
Reconstruction of the MPFL has become the gold-standard treatment for recurrent lateral patellar instability but has limitations and complications.3,7,12,17 Reconstruction techniques use either surface anatomy palpation (requiring large incisions) or fluoroscopy to identify tunnel placement locations, and accurate placement has often been difficult and inconsistent. Our repair technique has several advantages over reconstruction. It does not burn any bridges; it allows for subsequent reconstruction. It does not require a graft and, using small suture anchors instead of large sockets and anchors, involves less bone loss. It also allows for early repair of tears—patients can return to activities, sports, and work quicker—and avoids the risk of chondral and bony damage with recurrent dislocations. According to our review of the MPFL repairs performed by Dr. Hirahara starting in 2013, the procedure is quick and successful and has outstanding outcomes.
Another treatment option for recurrent lateral patellar instability combines reefing of the medial patellofemoral tissues with a lateral release. This combination has had several postoperative complications and is no longer indicated.9 TT transfer and trochleoplasty procedures have been developed to address different aspects of patellar instability, increased TT-TG distance, and dysplastic trochlea (Table 2). Both types of procedures are highly invasive and difficult to perform, requiring technical expertise. They are best used when warranted by the anatomy, but this is uncommon. The technique we have presented allows for easy and reliable repair of dislocations in the absence of associated pathology that would require larger, more complex surgery. The ease of use and accuracy of musculoskeletal ultrasound make this technique superior to others.
Conclusion
The MPFL is a vital static stabilizer of the patella and as such should be evaluated in the setting of patellar injury. The novel preoperative and intraoperative use of musculoskeletal ultrasound described in this article allows for easy real-time identification of the MPFL and simple and accurate percutaneous repair of torn structures. Nonoperative treatments of acute patellar dislocations have higher rates of recurrent dislocations, which put patella and trochlea at risk for bony and chondral damage. Given appropriate tear location and tissue quality, repairs should be considered early and before reconstruction. To our knowledge, a reliable, easily reproducible MPFL repair was not described until now. We have reported on use of such a technique and on its promising patient outcomes, which should be considered when addressing MPFL injuries.
Am J Orthop. 2017;46(3):152-157. Copyright Frontline Medical Communications Inc. 2017. All rights reserved.
1. Desio SM, Burks RT, Bachus KN. Soft tissue restraints to lateral patellar translation in the human knee. Am J Sports Med. 1998;26(1):59-65.
2. Nomura E, Inoue M, Osada N. Anatomical analysis of the medial patellofemoral ligament of the knee, especially the femoral attachment. Knee Surg Sports Traumatol Arthrosc. 2005;13(7):510-515.
3. Petri M, Ettinger M, Stuebig T, et al. Current concepts for patellar dislocation. Arch Trauma Res. 2015;4(3):e29301.
4. Sallay PI, Poggi J, Speer KP, Garrett WE. Acute dislocation of the patella. A correlative pathoanatomic study. Am J Sports Med. 1996;24(1):52-60.
5. Tanaka MJ. Variability in the patellar attachment of the medial patellofemoral ligament. Arthroscopy. 2016;32(8):1667-1670.
6. Philippot R, Boyer B, Testa R, Farizon F, Moyen B. The role of the medial ligamentous structures on patellar tracking during knee flexion. Knee Surg Sports Traumatol Arthrosc. 2012;20(2):331-336.
7. Philippot R, Chouteau J, Wegrzyn J, Testa R, Fessy MH, Moyen B. Medial patellofemoral ligament anatomy: implications for its surgical reconstruction. Knee Surg Sports Traumatol Arthrosc. 2009;17(5):475-479.
8. Ahmad CS, Stein BE, Matuz D, Henry JH. Immediate surgical repair of the medial patellar stabilizers for acute patellar dislocation. A review of eight cases. Am J Sports Med. 2000;28(6):804-810.
9. Song GY, Hong L, Zhang H, Zhang J, Li Y, Feng H. Iatrogenic medial patellar instability following lateral retinacular release of the knee joint. Knee Surg Sports Traumatol Arthrosc. 2016;24(9):2825-2830.
10. McCarthy M, Ridley TJ, Bollier M, Wolf B, Albright J, Amendola A. Femoral tunnel placement in medial patellofemoral ligament reconstruction. Iowa Orthop J. 2013;33:58-63.
11. Redfern J, Kamath G, Burks R. Anatomical confirmation of the use of radiographic landmarks in medial patellofemoral ligament reconstruction. Am J Sports Med. 2010;38(2):293-297.
12. Barnett AJ, Howells NR, Burston BJ, Ansari A, Clark D, Eldridge JD. Radiographic landmarks for tunnel placement in reconstruction of the medial patellofemoral ligament. Knee Surg Sports Traumatol Arthrosc. 2012;20(12):2380-2384.
13. Regalado G, Lintula H, Kokki H, Kröger H, Väätäinen U, Eskelinen M. Six-year outcome after non-surgical versus surgical treatment of acute primary patellar dislocation in adolescents: a prospective randomized trial. Knee Surg Sports Traumatol Arthrosc. 2016;24(1):6-11.
14. Sandmeier RH, Burks RT, Bachus KN, Billings A. The effect of reconstruction of the medial patellofemoral ligament on patellar tracking. Am J Sports Med. 2000;28(3):345-349.
15. Baldwin JL. The anatomy of the medial patellofemoral ligament. Am J Sports Med. 2009;37(12):2355-2361.
16. Steensen RN, Dopirak RM, McDonald WG 3rd. The anatomy and isometry of the medial patellofemoral ligament: implications for reconstruction. Am J Sports Med. 2004;32(6):1509-1513.
17. Godin JA, Karas V, Visgauss JD, Garrett WE. Medial patellofemoral ligament reconstruction using a femoral loop button fixation technique. Arthrosc Tech. 2015;4(5):e601-e607.
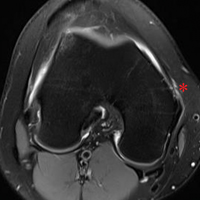
In-Office Diagnostic Needle Arthroscopy
mi-eye 2™ (https://tricemedical.com/mi-eye/)
Over the past decade, magnetic resonance imaging (MRI) has been the gold standard for identification of intra-articular soft tissue pathology of the knee. Limitations, however, do exist for the use of MRI in diagnosing injuries. Various studies have reported MRI sensitivity and specificity to be 86% and 91% in diagnosis of knee pathology.1 These numbers can be lower in the setting of previous surgery. Furthermore, some patients cannot have MRIs, while for others, MRIs would be inconclusive. This includes patients who are morbidly obese, claustrophobic, renally impaired, have implanted medical devices, have metal within their bodies, or have had previous surgical intervention to the affected joint.
As an alternative to MRI, in-office needle arthroscopy offers a cost-effective, minimally invasive tool that can provide similar or greater diagnostic accuracy.2,3 The ability to provide real-time dynamic visualization of the patient’s anatomy allows for more accurate decision making by the physician and can potentially reduce the time from injury to diagnosis to recovery.4 It can be performed in a variety of joints, including the knee, shoulder, elbow, and ankle. Indications for use include patients with suspected meniscal tears, anterior cruciate ligament (ACL) tears, loose bodies, rotator cuff tears, and labral tears, as well as pre-arthroplasty evaluations and second-look evaluations of cartilage procedures.
The mi-eye 2™ (Trice Medical) is an in-office diagnostic needle arthroscope that can provide immediate diagnostic capabilities (Figure 1). 

For billing purposes, the procedure is coded as a diagnostic arthroscopy of the affected joint. Should the diagnostic evaluation reveal pathology that requires surgical intervention, a modifier 58 code can be attached to allow for full reimbursement of both the in-office procedure and the surgical procedure.
Surgical pearl: It is important to properly position the patient in order to efficiently access the knee. For examination of the knee, we recommend positioning the patient’s knee flexed at either 45° with a bump beneath the knee, or at 90° with the knee off the end of the bed. I begin to anesthetize by placing 10 cc of 1% lidocaine into the joint. Additionally, I use 5 cc of 1% lidocaine to create a skin wheel around the anticipated portal of entry. I allow 5 to 7 minutes for anesthetization prior to performing the procedure. During this time I routinely move to another patient examination room to prevent a delay in patient flow.
When entering the knee joint I recommend placing the portal 1 cm above the joint line and 1 cm medial or lateral to the patellar tendon. This will aid in avoiding the fat pat upon entry. When entering the joint I aim toward the notch and use the ACL as my reference point before moving into the medial or lateral compartment. I typically enter through the side of suspected pathology, and then continue on with the remainder of the evaluation. For focused evaluation of the patellofemoral joint, a suprapatellar portal can be utilized. Dynamic evaluation can be performed by manipulating the leg. If a bloody field is encountered (acute ACL tears), the field of view can be cleared through irrigating the joint with 30 cc sterile saline flushes. I inject the fluid into the joint through the leer lock access and then withdraw it back into the same syringe. This fluid can be discarded and the steps repeated as necessary. At the conclusion of the procedure it is recommended to drain the joint of the injected saline. Through the leer lock, a steroid or platelet-rich plasma injection can be delivered if desired by the physician.
1. Crawford R, Walley G, Bridgman S, Maffulli N. Magnetic resonance imaging versus arthroscopy in the diagnosis of knee pathology, concentrating on meniscal lesions and ACL tears: a systematic review. Br Med Bull. 2007;84:5-23.
2. Voigt JD, Mosier M, Huber B. Diagnostic needle arthroscopy and the economics of improved diagnostic accuracy: a cost analysis. Appl Health Econ Health Policy. 2014;12(5):523-535.
3. Gramas DA, Antounian FS, Peterfy CG, Genant HK, Lane NE. Assessment of needle arthroscopy, standard arthroscopy, physical examination, and magnetic resonance imaging in knee pain: a pilot study. J Clin Rheumatol. 1995;1(1):26-34.
4. O’Donnell JF. Trice Medical Literature. #4-10-0032 Rev A.
mi-eye 2™ (https://tricemedical.com/mi-eye/)
Over the past decade, magnetic resonance imaging (MRI) has been the gold standard for identification of intra-articular soft tissue pathology of the knee. Limitations, however, do exist for the use of MRI in diagnosing injuries. Various studies have reported MRI sensitivity and specificity to be 86% and 91% in diagnosis of knee pathology.1 These numbers can be lower in the setting of previous surgery. Furthermore, some patients cannot have MRIs, while for others, MRIs would be inconclusive. This includes patients who are morbidly obese, claustrophobic, renally impaired, have implanted medical devices, have metal within their bodies, or have had previous surgical intervention to the affected joint.
As an alternative to MRI, in-office needle arthroscopy offers a cost-effective, minimally invasive tool that can provide similar or greater diagnostic accuracy.2,3 The ability to provide real-time dynamic visualization of the patient’s anatomy allows for more accurate decision making by the physician and can potentially reduce the time from injury to diagnosis to recovery.4 It can be performed in a variety of joints, including the knee, shoulder, elbow, and ankle. Indications for use include patients with suspected meniscal tears, anterior cruciate ligament (ACL) tears, loose bodies, rotator cuff tears, and labral tears, as well as pre-arthroplasty evaluations and second-look evaluations of cartilage procedures.
The mi-eye 2™ (Trice Medical) is an in-office diagnostic needle arthroscope that can provide immediate diagnostic capabilities (Figure 1).
For billing purposes, the procedure is coded as a diagnostic arthroscopy of the affected joint. Should the diagnostic evaluation reveal pathology that requires surgical intervention, a modifier 58 code can be attached to allow for full reimbursement of both the in-office procedure and the surgical procedure.
Surgical pearl: It is important to properly position the patient in order to efficiently access the knee. For examination of the knee, we recommend positioning the patient’s knee flexed at either 45° with a bump beneath the knee, or at 90° with the knee off the end of the bed. I begin to anesthetize by placing 10 cc of 1% lidocaine into the joint. Additionally, I use 5 cc of 1% lidocaine to create a skin wheel around the anticipated portal of entry. I allow 5 to 7 minutes for anesthetization prior to performing the procedure. During this time I routinely move to another patient examination room to prevent a delay in patient flow.
When entering the knee joint I recommend placing the portal 1 cm above the joint line and 1 cm medial or lateral to the patellar tendon. This will aid in avoiding the fat pat upon entry. When entering the joint I aim toward the notch and use the ACL as my reference point before moving into the medial or lateral compartment. I typically enter through the side of suspected pathology, and then continue on with the remainder of the evaluation. For focused evaluation of the patellofemoral joint, a suprapatellar portal can be utilized. Dynamic evaluation can be performed by manipulating the leg. If a bloody field is encountered (acute ACL tears), the field of view can be cleared through irrigating the joint with 30 cc sterile saline flushes. I inject the fluid into the joint through the leer lock access and then withdraw it back into the same syringe. This fluid can be discarded and the steps repeated as necessary. At the conclusion of the procedure it is recommended to drain the joint of the injected saline. Through the leer lock, a steroid or platelet-rich plasma injection can be delivered if desired by the physician.
1. Crawford R, Walley G, Bridgman S, Maffulli N. Magnetic resonance imaging versus arthroscopy in the diagnosis of knee pathology, concentrating on meniscal lesions and ACL tears: a systematic review. Br Med Bull. 2007;84:5-23.
2. Voigt JD, Mosier M, Huber B. Diagnostic needle arthroscopy and the economics of improved diagnostic accuracy: a cost analysis. Appl Health Econ Health Policy. 2014;12(5):523-535.
3. Gramas DA, Antounian FS, Peterfy CG, Genant HK, Lane NE. Assessment of needle arthroscopy, standard arthroscopy, physical examination, and magnetic resonance imaging in knee pain: a pilot study. J Clin Rheumatol. 1995;1(1):26-34.
4. O’Donnell JF. Trice Medical Literature. #4-10-0032 Rev A.
Inaugural Innovation Summit Addressed CTS Creativity and Development
The first AATS Innovation Summit was launched on Saturday morning. The Summit was designed to assist cardiothoracic surgeons in developing new clinically applicable technology by giving them information on how to protect intellectual property, obtain funding, and conduct clinical trials. Attendees also got the latest updates on regulatory pathways and advice on building industry relationships needed to forge a novel product.
Pedro J. del Nido, MD, who was instrumental in coming up with the original idea for the Summit, introduced former AATS President W. Randolph Chitwood Jr., MD, who served as Program Director.
“The most fun part of this meeting,” Dr. Chitwood promised, would be the Commercialization Workshop at the end of the day “where we develop a fictitious product and carry it all the way to commercialization.”
Michael J. Mack, MD, a famous innovator in his own right, opened the didactic portion of the program by outlining the Summit Challenges.
“The whole field of cardiac surgery is moving to a catheter-based approach,” he declared.
He pointed out the tremendous growth in the invention of catheter-based products in the mitral regurgitation space. “The field is fertile with innovators,” he added.
In order to be innovative, he said, quoting what he called the Bavaria Rules, after Joseph E. Bavaria, MD, “You’ve got to have a vision; you’ve got to have a strategy; you need the tactics to implement that strategy, and at the end of the day, you have to execute that strategy.”
He concluded his talk saying, “Our field has a legacy of innovation. Our challenge is to adopt the tools to move that innovation field forward that our specialty has always been known for.”
He listed some of the major innovations in the cardiac space over the past 60+ years, from the beginning of aortic surgery, to mitral valve surgery, the Maze procedure, and even TAVR, pointing out that historically at least 10-20 years has been the lag time between the development of the innovation and its more-or-less widespread adoption, following the so-called S-curve.
The next stage of innovation is not starting from scratch, he said, but rather the recognition that the previous innovation can be improved upon, and the beginning of a new innovation S-curve at the peak of the old, a process of continual development and refinement.
Dr. Cox stressed that for innovation to be adopted, it couldn’t be overly complex, citing the Maze procedure for atrial fibrillation, which was highly superior to the alternatives for treating AF, but has still lagged behind pulmonary vein isolation, a much less effective, but much easier technique used by interventional cardiologists.
He showed data demonstrating that when it came to innovative techniques, cure rate effectively did not matter to adoption, compared to the level of complexity of the new procedure.
He added that it was important for any new innovation to not “get too far away” from nature and its lessons, and that it should not be too complex to be routinely trained for and adopted.
Dr. Cox concluded with an admonition to new innovators to “listen to what your peers say. They have ideas, experiences, and imaginations of their own.”
He added that “they may or may not have anything to say that will change your course, but you have to listen to them.”