A healthy 16-year-old boy presented with muscle pain and weakness in the chest and both arms after performing 50 push-ups daily for 3 days, and the symptoms did not seem to improve after 3 days.
Figure 1. Initial visit: The patient showed swelling in the triceps brachii, deltoid, and pectoralis major muscles.
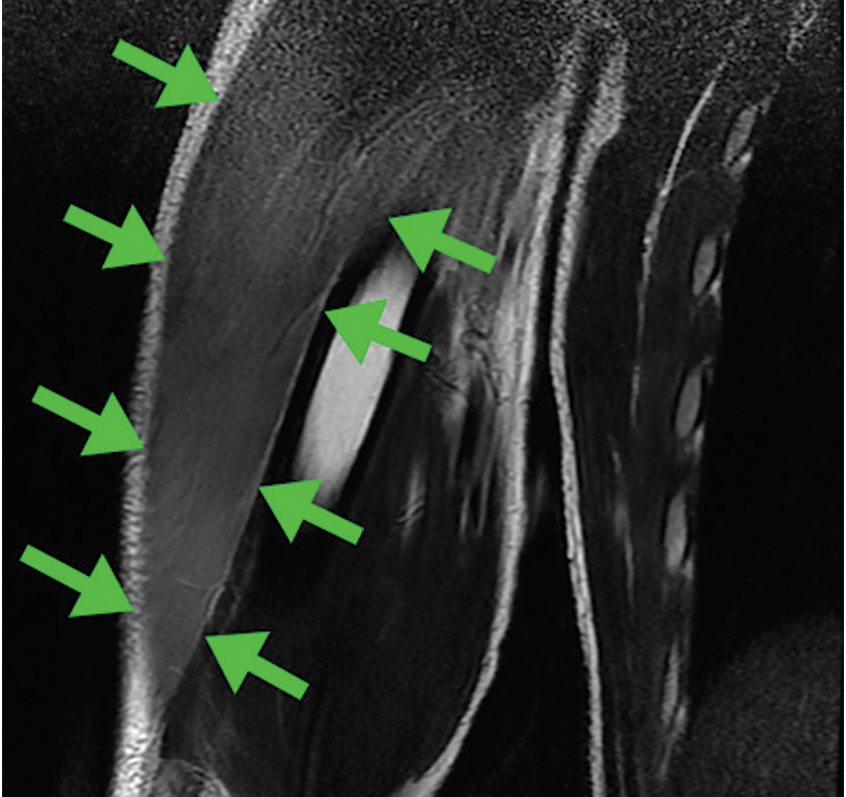
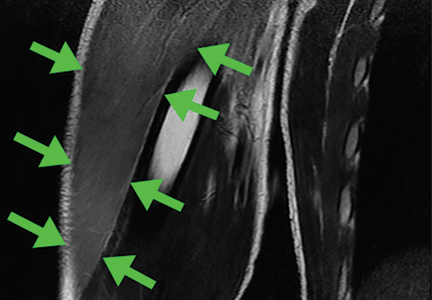
He denied dark urine or drug abuse. Physical examination revealed swelling of both arms and the chest, with tenderness and weakness in the triceps brachii, deltoid, and pectoralis major muscles (Figure 1). Laboratory testing showed a creatine kinase level of 59,380 U/L (reference range 30–220). T2-weighted magnetic resonance imaging (MRI) showed diffuse hyperintensity in all affected muscles (Figure 2) with hyperintensity on T1-weighted images, findings consistent with rhabdomyolysis. The rhabdomyolysis was deemed to have been induced by exercise, in our patient’s case by push-ups.
Figure 2. T2-weighted magnetic resonance imaging showed diffuse hyperintensity in both triceps brachii muscles (arrows).
Treatment with aggressive fluid transfusion was started, with strict monitoring of fluid input and urine output. There was no evidence of acute renal failure or hyperkalemia. The creatine kinase level improved progressively: to 28,734 U/L on day 2, 15,386 U/L on day 3, and 11,472 U/L on day 4. By 2 weeks after symptom onset, the level had normalized (164 U/L), and all symptoms had resolved. The patient was able to resume exercising.
EXERCISE-INDUCED RHABDOMYOLYSIS
Approximately 50% of patients with rhabdomyolysis present with the characteristic triad of myalgia (84%), muscle weakness (73%), and dark urine (80%), and 8.1% to 52% present with muscle swelling.1 Rhabdomyolysis may be caused by exercise,2 and risk factors include physical deconditioning, high ambient temperature, high humidity, impaired sweating (due to anticholinergic drugs), sickle cell trait, and hypokalemia from sweating.2 Pain and swelling of the affected focal muscles is the chief complaint.3
Although acute renal failure in exercise-induced rhabdomyolysis is rare, failure to recognize rhabdomyolysis can cause diagnostic delay and inappropriate treatment.4
In healthy people, exercise-induced muscle damage begins to resolve within 1 to 3 days.5,6 Physicians should suspect exercise-induced rhabdomyolysis in patients with prolonged muscle swelling and tenderness in affected muscles that lasts longer than expected.7
Have L, Drouet A. Isolated exercise-induced rhabdomyolysis of brachialis and brachioradialis muscles: an atypical clinical case. Ann Phys Rehabil Med 2011; 54:525–529.
Keah SH, Chng K. Exercise-induced rhabdomyolysis with acute renal failure after strenuous push-ups. Malays Fam Physician 2009; 4:37–39.
Nosaka K, Clarkson PM. Changes in indicators of inflammation after eccentric exercise of the elbow flexors. Med Sci Sports Exerc 1996; 28:953–961.
Peake J, Nosaka K, Suzuki K. Characterization of inflammatory responses to eccentric exercise in humans. Exerc Immunol Rev 2005; 11:64–85.
Lee G. Exercise-induced rhabdomyolysis. R I Med J (2013) 2014; 97:22–24.
Kiyoshi Shikino, MD, PhD Department of General Medicine, Chiba University Hospital, Chiba, Japan
Yusuke Hirota, MD Department of General Medicine, Chiba University Hospital, Chiba, Japan
Masatomi Ikusaka, MD, PhD Department of General Medicine, Chiba University Hospital, Chiba, Japan
Address: Kiyoshi Shikino, MD, PhD, Department of General Medicine, Chiba University Hospital, 1-8-1, Inohana, Chuo-ku, Chiba, 2608670 Japan; [email protected]
Author and Disclosure Information
Kiyoshi Shikino, MD, PhD Department of General Medicine, Chiba University Hospital, Chiba, Japan
Yusuke Hirota, MD Department of General Medicine, Chiba University Hospital, Chiba, Japan
Masatomi Ikusaka, MD, PhD Department of General Medicine, Chiba University Hospital, Chiba, Japan
Address: Kiyoshi Shikino, MD, PhD, Department of General Medicine, Chiba University Hospital, 1-8-1, Inohana, Chuo-ku, Chiba, 2608670 Japan; [email protected]
A healthy 16-year-old boy presented with muscle pain and weakness in the chest and both arms after performing 50 push-ups daily for 3 days, and the symptoms did not seem to improve after 3 days.
Figure 1. Initial visit: The patient showed swelling in the triceps brachii, deltoid, and pectoralis major muscles.
He denied dark urine or drug abuse. Physical examination revealed swelling of both arms and the chest, with tenderness and weakness in the triceps brachii, deltoid, and pectoralis major muscles (Figure 1). Laboratory testing showed a creatine kinase level of 59,380 U/L (reference range 30–220). T2-weighted magnetic resonance imaging (MRI) showed diffuse hyperintensity in all affected muscles (Figure 2) with hyperintensity on T1-weighted images, findings consistent with rhabdomyolysis. The rhabdomyolysis was deemed to have been induced by exercise, in our patient’s case by push-ups.
Figure 2. T2-weighted magnetic resonance imaging showed diffuse hyperintensity in both triceps brachii muscles (arrows).
Treatment with aggressive fluid transfusion was started, with strict monitoring of fluid input and urine output. There was no evidence of acute renal failure or hyperkalemia. The creatine kinase level improved progressively: to 28,734 U/L on day 2, 15,386 U/L on day 3, and 11,472 U/L on day 4. By 2 weeks after symptom onset, the level had normalized (164 U/L), and all symptoms had resolved. The patient was able to resume exercising.
EXERCISE-INDUCED RHABDOMYOLYSIS
Approximately 50% of patients with rhabdomyolysis present with the characteristic triad of myalgia (84%), muscle weakness (73%), and dark urine (80%), and 8.1% to 52% present with muscle swelling.1 Rhabdomyolysis may be caused by exercise,2 and risk factors include physical deconditioning, high ambient temperature, high humidity, impaired sweating (due to anticholinergic drugs), sickle cell trait, and hypokalemia from sweating.2 Pain and swelling of the affected focal muscles is the chief complaint.3
Although acute renal failure in exercise-induced rhabdomyolysis is rare, failure to recognize rhabdomyolysis can cause diagnostic delay and inappropriate treatment.4
In healthy people, exercise-induced muscle damage begins to resolve within 1 to 3 days.5,6 Physicians should suspect exercise-induced rhabdomyolysis in patients with prolonged muscle swelling and tenderness in affected muscles that lasts longer than expected.7
Have L, Drouet A. Isolated exercise-induced rhabdomyolysis of brachialis and brachioradialis muscles: an atypical clinical case. Ann Phys Rehabil Med 2011; 54:525–529.
Keah SH, Chng K. Exercise-induced rhabdomyolysis with acute renal failure after strenuous push-ups. Malays Fam Physician 2009; 4:37–39.
Nosaka K, Clarkson PM. Changes in indicators of inflammation after eccentric exercise of the elbow flexors. Med Sci Sports Exerc 1996; 28:953–961.
Peake J, Nosaka K, Suzuki K. Characterization of inflammatory responses to eccentric exercise in humans. Exerc Immunol Rev 2005; 11:64–85.
Lee G. Exercise-induced rhabdomyolysis. R I Med J (2013) 2014; 97:22–24.
Ticks are responsible for most vector-borne infections in the United States. Most infections occur between April and October, when tick populations peak.1 However, infections can occur year-round.2,3
Tick bites are often unnoticed because the ticks are small when they are at the infective stage of their life cycle, and their attachment is characteristically painless and often in intertriginous body sites.1 Therefore, absence of a known tick bite never precludes the diagnosis of a tickborne infection.1,4,5
Although rural outdoor activities are recognized risk factors, tickborne infections also occur in urban areas.6 Thus, the lack of classic epidemiologic clues does not rule out a diagnosis of tickborne infection.
In most cases, tickborne illnesses present with nonspecific symptoms such as fever, malaise, headache, nausea, and myalgia. Accurate diagnosis of tickborne diseases can be challenging due to the similar clinical manifestations and overlapping geographic distributions of potential tick vectors.1
This review summarizes the epidemiology, clinical features, treatment, and prevention of the most prevalent non-Lyme tickborne diseases of the United States: Rocky Mountain spotted fever (RMSF), other spotted fever group rickettsial (SFGR) infections, ehrlichiosis, babesiosis, tickborne relapsing fever, Borrelia miyamotoi infection, southern tick-associated rash illness (STARI), tularemia, and tickborne viral infections.
ROCKY MOUNTAIN SPOTTED FEVER
RMSF (Table 1)is caused by Rickettsia rickettsii, an obligate intracellular gram-negative coccobacillus.7,8
Dermacentor variabilis, the American dog tick, is the major vector in the southern and eastern United States, and D andersoni, the Rocky Mountain wood tick, is the most common vector in the western United States.4,7,8Rhipicephalus sanguineus, the brown dog tick, has also been found to transmit RMSF in Arizona.9,10
While most infections in humans are transmitted by tick bite, rare cases of RMSF are contracted through exposure to infective tick hemolymph during tick removal, parenteral inoculation or infectious aerosols in laboratory settings, and blood transfusion.7,8
Figure 1. Geographic distribution of nationally notifiable tickborne diseases, 2015.
The geographic distribution of RMSF is restricted to the Western Hemisphere. Within the United States, cases of RMSF have been reported in nearly every state.4 However, RMSF is most prevalent in North Carolina, Tennessee, Missouri, Arkansas, and Oklahoma (Figure 1).1
RMSF is both the most common and the most likely cause of death among rickettsial infections in the United States.4,7,8 Most cases occur in children ages 5 to 9.10,11 The case-fatality rate is over 20% without antimicrobial therapy but less than 1% with timely and appropriate antibiotic treatment.7,8
Clinical manifestations of Rocky Mountain spotted fever
RMSF is transmitted after only 2 to 20 hours of tick attachment, and symptoms begin 3 to 12 days after inoculation.1,7,8 Unlike many other species that cause SFGR infection, R rickettsii does not cause an eschar at the site of inoculation.7,12
The classic triad of RMSF is fever, headache, and a rash. This triad is present in only 3% of early infections, but the prevalence increases to 60% to 70% by 2 weeks after the tick bite.1,7 Other common initial symptoms include generalized malaise, weakness, and myalgia.7,8,12 Gastrointestinal symptoms are common, and RMSF can be misdiagnosed as gastroenteritis, particularly in children.8
A rash usually occurs. It is due to systemic vasculitis and endothelial injury and often presents 2 to 5 days after the onset of fever, which can delay diagnosis.7,12,13 It usually progresses from macular to petechial and begins on the ankles, forearms, and wrists, spreading centripetally to the trunk and face and often including the palms and soles.7 Large areas of ecchymosis, ulceration, and (uncommonly) gangrene may occur as lesions coalesce.7,8 The 10% of patients who do not develop a rash (“spotless” fever) tend to have a poorer prognosis due to delayed diagnosis.8
Risk factors for severe disease include delay or lack of appropriate treatment, extremes of age, Native American descent, glucose-6-phosphate dehydrogenase deficiency, and immunocompromised states.1,10,11,13 Complications from the widespread Rickettsia-induced vasculitis may include a septic or toxic shock-like syndrome and neurovascular, cardiac, respiratory, and renal damage.7,11 Without appropriate therapy, death occurs 7 to 15 days after symptom onset.8
Laboratory evaluation may reveal thrombocytopenia and anemia.7 Leukocytosis or leukopenia may be present.8 Hyponatremia, elevated aminotransferase levels, elevated creatine kinase levels, prolonged coagulation times, and decreased fibrinogen may also be present.7,8
Diagnosis of Rocky Mountain spotted fever
No diagnostic studies are available for the acute phase of RMSF. Therefore, a high suspicion of RMSF is essential, and treatment should be started as soon as RMSF is suspected. Confirmatory testing can retrospectively validate a clinical diagnosis.4,7,11
Serologic testing with an immunofluorescence antibody assay remains the principal diagnostic test for RMSF, and paired testing (during the acute and convalescent phases) has a sensitivity of 94%.4 A 4-fold or greater increase in antibody titer (with a minimum titer of 1:64) between acute and convalescent samples is considered diagnostic of acute infection.4,7,8 Serology is often negative early in the disease course.4,7,8 The assay cross-reacts with other SFGR species, however.4,8
Amplification of R rickettsii DNA by polymerase chain reaction (PCR) from blood or biopsy sites can be done in some research settings, but its utility is limited because of low sensitivity early in the course of the infection.4,7
Immunohistochemical staining of a skin biopsy or autopsy specimen is a highly specific diagnostic test performed at a limited number of laboratories, though it has a sensitivity of only 60% to 92%.4,7,8
Cell culture can also be performed, but only in biosafety level 3 (scale of 1 to 4) laboratories.1
Treatment of Rocky Mountain spotted fever
Prompt initiation of antibiotic therapy greatly improves prognosis.1,13,14
Doxycycline for 7 days is the treatment of choice for RMSF, including in pregnant patients with life-threatening disease and in children.4,7,8,15,16
Tetracycline can also be used.
Chloramphenicol is an alternative treatment for pregnant patients with mild to moderate disease or those patients with a severe hypersensitivity reaction to doxycycline.1,4,7,9,15,16 In the United States, chloramphenicol is currently available only in an intravenous formulation.
Fever typically subsides within 24 to 48 hours of starting treatment.4,8 Failure to clinically improve within 48 hours suggests an alternative diagnosis.1,4 Long-term complications of severe infection may include hearing loss, blindness, and amputation of digits or extremities due to gangrene.1,8 Persistence of disease beyond acute infection has not been observed.1
OTHER SPOTTED FEVER GROUP RICKETTSIAl INFECTIONS
Two other SFGR infections, uncommon in the United States, are caused by R parkeri (Table 2) and Rickettsia species 364D (Table 3).
Both infections are characterized by an inoculation eschar. Symptoms include fever, headache, myalgia, and regional lymphadenopathy.1 Rash (most often maculopapular or vesicopustular) is characteristic of R parkeri, but it is not common in Rickettsia species 364D rickettsiosis.17,18 Mild thrombocytopenia, leukopenia, and elevated aminotransferase levels are common in R parkeri infection.1 Both infections appear to be milder than RMSF.
Diagnosis of the specific infection is challenging due to the cross-reactivity of SFGR serologic tests. Additional testing with PCR, immunohistochemistry, and culture at specialized laboratories may aid in diagnosis. Because RMSF cannot be ruled out, all cases of SFGR should be treated the same as R rickettsii with a course of doxycycline.17
EHRLICHIOSES: EHRLICHIOSIS AND ANAPLASMOSIS
“Ehrlichiosis” is the generic name for infections caused by both the Ehrlichia and Anaplasma genera,19,20 which are small, gram-negative obligate intracellular bacterial pathogens.21 In the United States, infections are most commonly caused by A phagocytophilum, the causative organism of human granulocytic anaplasmosis (HGA) (Table 4), and E chaffeensis, the causative organism of human monocytic ehrlichiosis (HME) (Table 5). The incidence rates of these 2 infections have increased over the past decade, in part due to increased clinical awareness and improved diagnostic capabilities.3,22,23
E ewingii (Table 6)and E muris-like agent (Table 7) are lesser known causes of human ehrlichiosis in the United States.20,23–25 Initially, E ewingii was believed to primarily affect immunocompromised patients, but it was later recognized in immunocompetent hosts.23E muris-like agent was first discovered as a cause of infection in 2009, and cases have been limited to Wisconsin and Minnesota.24,25
Human granulocytic anaplasmosis. A phagocytophilum is transmitted by Ixodes scapularis (the deer tick or blacklegged tick) in the northeastern and upper-midwestern regions of the United States, and I pacificus (the western blacklegged tick) along the northern Pacific coast.1,19,20,26 The 6 states accounting for most cases are New York, Connecticut, Massachusetts, Rhode Island, Minnesota, and Wisconsin.27 The white-footed mouse serves as the primary reservoir for A phagocytophilum, and humans are an accidental, “dead-end” host.21 Cases have also been reported to be transmitted via blood transfusion and transplacentally.20,26,28,29
Human monocytic ehrlichiosis. E chaffeensis is transmitted by Amblyomma americanum (the Lone Star tick).20 It is most commonly found in the southeastern, south-central, and mid-Atlantic regions of the United States.19,20,30 The 5 states with the most cases are Missouri, Oklahoma, Tennessee, Arkansas, and Maryland.1,4,27 White-tail deer are the primary reservoir for E chaffeensis.
Clinical manifestations of ehrlichiosis
After an incubation time of 5 to 21 days, ehrlichiosis typically presents as a febrile viral-like illness with nonspecific symptoms that include fever, chills, sweats, myalgia, headache, malaise, and cough.1,26,27,31
Gastrointestinal symptoms, arthralgia, photophobia, and nervous system involvement may also occur.1,20,29,32 Gastrointestinal symptoms tend to be more common in HME than HGA.20
Rash occurs in up to one-third of patients with HME, but it is rare in HGA.4,19,20,27 HME presents with more central nervous system involvement (such as meningitis or seizures) than HGA, in which central nervous system involvement is rare.
Severe complications of HME and HGA occur in a minority of cases and may include acute respiratory distress syndrome, renal failure, disseminated intravascular coagulopathy, and spontaneous hemorrhage.19 In general, HME is more severe than HGA and is more likely to progress to fulminant toxic or septic shocklike syndrome in rare instances.19
Laboratory tests may reveal leukopenia, lymphopenia, thrombocytopenia, and elevated liver-associated enzyme levels.1,19,20,26 Anemia and hyponatremia may also be present.4,30
Diagnosis of ehrlichiosis
The most rapid diagnostic method is examination of Wright- or Giemsa-stained peripheral blood smears for morulae, which are cytoplasmic intravacuolar inclusions of bacteria within leukocytes.20 However, its sensitivity is as low as 20% and declines even further after the first week of infection.4,20
PCR testing is the most sensitive and rapid tool available during acute infection.1,20,26,30,31 However, due to waning of the bacteremic phase, its sensitivity decreases after the first week of infection and after treatment is started.19,20
Serologic detection of antibodies with an indirect immunofluorescence assay is the most frequently used test for diagnosis of ehrlichiosis, and paired serology demonstrating seroconversion (at least a 4-fold increase in titer, with a minimal titer of 1:64) is most sensitive (82% to 100%).4,19,20,26 Cross-reactivity can occur, so testing for antibodies to both A phagocytophilum and E chaffeensis might assist in a more accurate diagnosis in areas where tick vectors overlap.4,19,20,26
HGA and HME can be isolated through cell culture in blood or cerebrospinal fluid. However, this is labor-intensive and performed in only a few specialized laboratories.4,19,20,27,31
Treatment of ehrlichiosis
If ehrlichiosis is suspected, treatment should not be delayed; the disease can be life-threatening and the ability to diagnose acute infection is often limited.20,26,32
Doxycycline is the treatment of choice, even in pregnant patients with severe infection and in children.1,19,26,27 Antibiotics are given for 5 to 10 days and continued for at least 3 days after the fever subsides.19,20,26,27,30 In HGA, a 10-day course of doxycycline is recommended to also provide the appropriate length of treatment for Borrelia burgdorferi.1,31
Rifampin is an alternative for those with severe tetracycline allergy, as well as those with mild to moderate infection during pregnancy.1,20,26,29–32
Fever typically resolves within 24 to 48 hours of starting treatment, and persistence of fever over 48 hours after starting antibiotics suggests an alternative diagnosis or possible coinfection.1,4,19,20,26,27,30,32
Persistence of chronic A phagocytophilum or E chaffeensis infection in humans beyond 2 months has not been demonstrated.20,26,30,33 Therefore, antibiotic treatment beyond the acute stage of infection is not indicated.30 Long-term prognosis is favorable, and patients are expected to make a full recovery.26,30
BABESIOSIS
Babesiosis (Table 8) is a malaria-like illness caused by intraerythrocytic protozoan parasites of the genus Babesia. Most cases in the United States are caused by Babesia microti.
Babesiosis occurs in the northeastern and upper midwestern states, with most cases reported in Massachusetts, Connecticut, Rhode Island, New York, New Jersey, Minnesota, and Wisconsin.31,32,34–36 Outbreaks have also been documented in Washington, California, and Missouri.31,32,35 The spread mimics that of Lyme disease, though it can be slower.34,36–39
Most cases in the Northeast and upper Midwest are caused by Babesia microti, while Babesia duncani has sporadically caused disease along the Pacific coast and Babesia divergens has been found in the Midwest and Northwest.34,36,39
Though babesiosis is usually a tickborne illness, it can also be transmitted through blood transfusion and, rarely, transplacental spread.31,32,34,36,39–41 The I scapularis tick is the host vector for Babesia microti, and transmission of disease requires 24 to 72 hours of attachment to a host.34,35 The primary reservoir for Babesia microti is the white-footed mouse, and humans are accidental hosts.32,34–36,39
Clinical manifestations of babesiosis
Babesia species cause illness by lysing erythrocytes, with resultant cytokine release.34
Symptoms typically appear 1 to 4 weeks after inoculation, after which most cases present as a viral-like illness with gradual onset of fever, chills, sweats, fatigue, malaise, headache, arthralgia, myalgia, nausea, anorexia, and nonproductive cough.32,34–36,39
Physical findings may include splenomegaly, hepatomegaly, jaundice, petechiae, and ecchymosis.32,34–36,39 Rash is seldom present and is not a characteristic feature of babesiosis.35,36
Laboratory features may include thrombocytopenia, hemolytic anemia, and elevated liver enzyme levels.32,34,36,39
Severe disease can occur in elderly, immunocompromised, or splenectomized individuals and can be life-threatening.34,39 Complications of severe infection can include acute respiratory distress syndrome, diffuse intravascular coagulation, and liver or renal failure.31,32,34–36,39 Splenic infarction or rupture may occur at lower levels of parasitemia in those without other manifestations of severe disease.31 The course can be prolonged and relapsing despite standard antibiotic therapy, typically in the setting of severe immunocompromise.32,34,42,43 Death occurs in up to 10% of severe cases.34
Diagnosis of babesiosis
Babesiosis should be considered if a patient presents with a febrile illness and nonspecific symptoms and comes from an endemic area or has received a blood transfusion within 6 months.34,35
The diagnosis of babesiosis is most commonly made by finding the intraerythrocytic ring form of the organism (trophozoite) on Giemsa- or Wright-stained thin blood smears.34,36,39Babesia can be distinguished from Plasmodia (the agent of malaria) by the rare presence of tetrads of merozoites arranged in a cross-like pattern (the Maltese cross); the absence of hemozoin (brownish deposits) in the ring form; and the occasional presence of extracellular ring forms.34,36
The level of parasitemia (representing the number of parasites per microliter of blood) is generally between 1% and 10%, although it can be as high as 80%.36,39 Because parasitemia is often low early in disease (< 1%), multiple blood smears should be examined.34–36,39
Several real-time PCR assays are available to detect low-grade Babesia microti parasitemia in patients with negative blood smears during early infection.31 These assays have high diagnostic sensitivity and specificity and do not cross-react with other Babesia or Plasmodium species.34–36,39
Paired serology (immunoglobulin G) can confirm infection, although antibody may be absent early in the course of illness.31,34–36,39
Treatment of babesiosis
Current guidelines recommend antimicrobial therapy only for patients with symptoms and positive test results for Babesia.32 Treatment of asymptomatic patients should additionally be considered if parasitemia (not positive PCR or serology) persists for 3 months or longer.32,34–36,39
For mild to moderate babesiosis, the combination of oral atovaquone and azithromycin for 7 to 10 days has similar efficacy and a lower incidence of adverse effects than clindamycin plus quinine.31,32,34,44 For immunocompromised patients, higher doses of azithromycin can be used.31,32
For severe babesiosis or those with risk factors for severe disease, intravenous clindamycin and oral quinine are recommended for 7 to 10 days based on expert opinion.31,32,34–36,39,43 Adverse effects of this regimen include diarrhea, tinnitus, and hearing deficits.35,39 If necessary, intravenous quinidine can be used, but the patient should receive cardiac monitoring for possible prolongation of the QT interval.34,39 As quinine therapy is often interrupted due to the above side effects, alternative regimens such as intravenous azithromycin or clindamycin in combination with oral atovaquone should be considered for severe cases.31 However, these regimens are not well studied.31
Partial or complete exchange transfusion of whole blood or packed red blood cells should be considered in patients with a high level of parasitemia (≥ 10%), severe anemia (hemoglobin < 10 g/dL), or renal, hepatic, or pulmonary compromise.31,32,34–36,39 In critically ill patients, parasitemia should be monitored daily until it has decreased to less than 5%.32,34,39
Generally, symptoms improve within 48 hours of antimicrobial therapy initiation; however, parasitemia may take up to 3 months to resolve.32,34,39 In severely immunocompromised patients, babesiosis may persist or relapse despite appropriate therapy.34,39,42,43 In these cases, at least 6 weeks of antimicrobial therapy is recommended, including 2 weeks of therapy after Babesia organisms are no longer seen on blood smear.31,33,36,39,42
TICKBORNE RELAPSING FEVER
Relapsing fever, as the name implies, is characterized by recurring episodes of fever and nonspecific flulike symptoms (Table 9).
The illness is transmitted by either ticks or body lice. The tick-borne illness is caused by spirochetes of the genus Borrelia and transmitted to humans by the bite of an infected Ornithodoros soft tick.45 Approximately 70% of reported cases in the United States occur in California, Washington, and Colorado.46 Most cases are caused by Borrelia hermsii and are linked to sleeping in rodent-infested cabins in mountainous areas.46 Remarkably, tick-borne borreliae are transmitted within about 30 seconds of tick attachment.47,48
The hallmark of tickborne relapsing fever is febrile episodes lasting 3 to 5 days, with relapses after 5 to 7 days of apparent recovery.49 If untreated, several episodes of fever and nonspecific symptoms will occur before illness resolves spontaneously. Overall mortality rates are very low (< 5%).50
Laboratory confirmation of tickborne relapsing fever is made by detecting spirochetes in a blood smear during a febrile episode or serologic antibody confirmation. However, serologic testing is unhelpful in the acute setting and can yield false-positive results with prior exposure to other Borrelia species (eg, Lyme disease) or other spirochetes. Serologic antibody testing with a 4-fold increase between acute and convalescent samples or PCR can aid in diagnosis, though the latter is available only in research settings.47
The preferred treatment regimen for adults is an oral tetracycline for 10 days. Erythromycin is recommended when tetracyclines are contraindicated.51
When starting treatment, all patients should be monitored closely for the Jarisch-Herxheimer reaction (rigors, hypotension, and high fevers), which develops in over 50% of cases as a result of rapid spirochetal killing and massive cytokine release.52
BORRELIA MIYAMOTOI INFECTION
Borrelia miyamotoi (Table 10) is a spirochete closely related to those causing tickborne relapsing fever, recently identified as a human pathogen and transmitted by the same tick species that transmit Lyme disease—I pacificus ticks in the far western United States and I scapularis in northeastern and north-central United States. The reservoir hosts are poorly known, but the organism has been detected in small rodents as well as birds and larger animals.53,54
The most common clinical manifestations are similar to other tickborne relapsing fever infections, although a true “relapsing fever” itself is not usually present.53 The characteristic erythema migrans rash often found in Lyme disease is typically absent in B miyamotoi infection; however, when present, it should prompt investigation into coinfection.54 Cases of meningoencephalitis have been reported in immunosuppressed hosts.55
There is currently no validated test available for diagnosis of B miyamotoi; however, PCR and serology are available in a few specialized laboratories.31,53
The treatment of choice is doxycycline for 2 to 4 weeks. Amoxicillin and ceftriaxone also appear effective.53
SOUTHERN TICK-ASSOCIATED RASH ILLNESS
Southern tick-associated rash illness (STARI) (Table 11) is associated with the bite of the Lone Star tick, A americanum. Most cases are diagnosed in the southeastern and south-central United States where the tick is endemic; however, its range is expanding. It was originally speculated that Borrelia lonestari caused STARI, though more recent evidence has not supported this.56 At this time, the cause of STARI is unknown.
Infection can present similarly to Lyme disease with an erythema migrans-like rash and associated flulike symptoms, although systemic symptoms and multiple erythema migrans lesions are less likely with STARI. Also, the erythema migrans-like lesions tend to be smaller and more likely to have central clearing than those in Lyme disease.57 Nevertheless, it is difficult to distinguish the 2 illnesses, especially in mid-Atlantic states such as Maryland or Virginia, where both diseases coexist. The most reliable method of distinguishing STARI from Lyme disease is demonstrating that the patient was bitten by a Lone Star tick rather than an Ixodes tick. Numerous questions remain unanswered about the causative organism, pathophysiology, definitive diagnosis, geographic range of illness, and most effective treatment for STARI.
Most reported cases have responded promptly to doxycycline, though it is not known whether antibiotic treatment is necessary.58
TULAREMIA
Tularemia (Table 12) is a zoonotic infection caused by the gram-negative bacterium Francisella tularensis. The organism is one of the most virulent bacteria currently known; the high rate of infectivity has led to its classification as a category A biowarfare agent. F tularensis infects more than 200 species of animals and invertebrates.
Ticks are thought to be the most important vectors, and most cases occur in the south-central United States.59 The geographic distribution of disease is gradually shifting northward due to spread of the major tick vectors, A americanum, D variabilis, and D andersoni. Approximately 100 to 200 cases of tularemia are diagnosed each year in the United States, with most concentrated in Kansas, Oklahoma, Missouri, and Arkansas.60
Humans can acquire F tularensis by several routes, and the route of infection ultimately dictates the clinical syndrome. Ulceroglandular and glandular forms of the disease are the most common in the United States, and both frequently result from a tick bite. A few days after tick exposure, an erythematous, often painful papuloulcerative lesion with a central eschar manifests at the site of the tick bite. Additional symptoms may include fever, chills, headache, myalgia, malaise, and suppurative lymphadenitis.61
Diagnosis can be made by identifying F tularensis in blood, fluid, or tissue culture performed under biosafety level 3 conditions; however, serology is used in most cases.62
Streptomycin and gentamicin are considered drugs of choice and should be continued for at least 10 days. For relatively mild disease, oral doxycycline or ciprofloxacin can be considered for at least 14 days, although the latter is not approved for treatment.59,63
TICKBORNE VIRAL INFECTIONS
While most arboviruses are transmitted by mosquitoes, 2 tickborne viruses can cause infection in specific regions of the United States: Powassan virus (Table 13) and Heartland virus (Table 14).
Powassan virus, an uncommon flavivirus, is found in the Great Lakes region and northeast United States. In the Great Lakes region, I cookei ticks transmit the traditional lineage of this virus. However, more recent cases have been identified in the Northeast and Midwest, where Powassan virus lineage II (or deer tick virus) is transmitted by I scapularis.31,64
The classic presentation is a viral encephalitis. Rash (most often maculopapular) and gastrointestinal symptoms have been reported as well. A high index of suspicion is needed for diagnosis because clinical features and laboratory findings resemble those of other arboviral infections.
Treatment for Powassan viral encephalitis is supportive, although corticosteroids have been used with some success.64 While asymptomatic infection has been documented, the reported mortality rate of Powassan virus encephalitis is 10% to 15%, and focal neurologic deficits can persist among survivors.65
Heartland virus is a newly identified phlebovirus that has been reported only in rural Missouri and Tennessee to date. Infection is presumed to be transmitted by A americanum.66 An animal reservoir has not been established.
Clinical and laboratory features appear to be very similar to those of the ehrlichioses.1 A clinical diagnosis should be considered in patients with A americanum exposure, fever, and cytopenias who lack PCR or serologic evidence for ehrlichiosis infection or who fail to respond to doxycycline therapy.24
COINFECTION
Some tick vectors transmit more than 1 type of infection, and therefore, coinfection with multiple pathogens may occur. For example, I scapularis transmits Borrelia burgdorferi (Lyme disease), HGA, Babesia microti, B miyamotoi, E muris-like agent, and Powassan virus lineage II, while A americanum transmits HME and Heartland virus.24,26,31,34,36,67 Coinfection may increase the severity of disease, often due to a delay in diagnosis, though more research is needed to understand the clinical manifestations of coinfection.31,35,67
PREVENTION
Unfortunately, there are no available human vaccines for tickborne illnesses in the United States, and the effectiveness of single-dose prophylaxis with doxycycline for non-Lyme infections has not been evaluated.4,7,26
Illness is best prevented by minimizing skin exposure to ticks, use of tick repellents containing DEET, use of long-legged and long-sleeved clothing impregnated with an acaricide such as permethrin, and conducting timely body checks for ticks after potential exposure.1,31,32 Light-colored clothing is suggested, since it allows for better visibility of crawling ticks.4,32 Bathing or showering within 2 hours of tick exposure helps prevent attachment of ticks.4,31,68 If camping outside, use of a bed net is recommended.68
Ticks are most easily removed by grasping the head of the tick as close to the skin surface as possible with fine-tipped tweezers.32,68 Removing or crushing ticks with bare hands should be avoided to prevent potential contamination, and hands should be washed thoroughly after tick removal.1,4
Blood donors are screened for a history of symptomatic tickborne disease; however, asymptomatic donors who are not identified at screening pose the greatest risk to the blood supply. Babesia microti is the most common reported transfusion-transmitted parasite in the United States, and transmission of R rickettsii, A phagocytophilum, and E ewingii have also been reported infrequently.28,40,69 Currently, no test is approved to screen blood for tickborne illnesses, though such a test would help prevent transmission of tickborne illnesses by blood transfusion in areas where these diseases are endemic.40,41
TAKE-HOME POINTS
Tickborne illnesses are increasing throughout the United States as a result of vector expansion and changes in human ecology.
It is essential that primary care clinicians consider tickborne illnesses in the differential diagnosis for any patient presenting with a fever and constitutional symptoms when the cause of symptoms is unclear and tick exposure is possible or known.
All the diseases discussed are nationally notifiable conditions, and confirmed cases should be reported.
Knowledge of the geographic locations of potential exposure is paramount to determining which tickborne infections to consider, and the absence of a tick bite history should not exclude the diagnosis in the correct clinical presentation.
In addition, it is important to recognize the limitations of diagnostic testing for many tickborne infections; empiric treatment is most often warranted before confirming the diagnosis.
Tick avoidance is the most effective way to prevent these often severe infections.
References
Biggs HM, Behravesh CB, Bradley KK, et al. Diagnosis and management of tickborne rickettsial diseases: Rocky Mountain spotted fever and other spotted fever group rickettsioses, ehrlichioses, and anaplasmosis—United States. MMWR Recomm Rep 2016; 65:1–44.
Openshaw JJ, Swerdlow DL, Krebs JW, et al. Rocky Mountain spotted fever in the United States, 2000–2007: interpreting contemporary increases in incidence. Am J Trop Med Hyg 2010; 83:174–182.
Dahlgren FS, Mandel EJ, Krebs JW, Massung RF, McQuiston JH. Increasing incidence of Ehrlichia chaffeensis and Anaplasma phagocytophilum in the United States, 2000-2007. Am J Trop Med Hyg 2011; 85:124–131.
Chapman AS, Bakken JS, Folk SM, et al; Tickborne Rickettsial Diseases Working Group; CDC. Diagnosis and management of tickborne rickettsial diseases: Rocky Mountain spotted fever, ehrlichioses, and anaplasmosis—United States: a practical guide for physicians and other health-care and public health professionals. MMWR Recomm Rep 2006; 55:1–27.
Mukkada S, Buckingham SC. Recognition of and prompt treatment for tick-borne infections in children. Infect Dis Clin North Am 2015; 29:539–555.
Schutze GE, Buckingham SC, Marshall GS, et al; Tick-borne Infections in Children Study (TICS) Group. Human monocytic ehrlichiosis in children. Pediatr Infect Dis J 2007; 26:475–479.
Lin L, Decker C. Rocky Mountain spotted fever. Dis Mon 2012; 58:361–369.
Demma LJ, Traeger MS, Nicholson WL, et al. Rocky mountain spotted fever from an unexpected tick vector in Arizona. N Engl J Med 2005; 353:587–594.
Traeger MS, Regan JJ, Humpherys D, et al. Rocky mountain spotted fever characterization and comparison to similar illnesses in a highly endemic area—Arizona, 2002-2011. Clin Infect Dis 2015; 60:1650–1658.
Dahlgren FS, Holman RC, Paddock CD, Callinan LS, McQuiston JH. Fatal Rocky Mountain spotted fever in the United States, 1999–2007. Am J Trop Med Hyg 2012; 86:713–719.
Parola P, Paddock CD, Socolovschi C, et al. Update on tick-borne rickettsioses around the world: a geographic approach. Clin Microbiol Rev 2013; 26:657–702.
Regan JJ, Traeger MS, Humpherys D, et al. Risk factors for fatal outcome from rocky mountain spotted fever in a highly endemic area—Arizona, 2002-2011. Clin Infect Dis 2015; 60:1659–1666.
Nelson R. Rocky Mountain spotted fever in Native Americans. Lancet Infect Dis 2015; 15:1013–1014.
Botelho-Nevers E, Socolovschi C, Raoult D, Parola P. Treatment of Rickettsia spp. infections: a review. Expert Rev Anti Infect Ther 2012; 10:1425–1437.
Paddock CD, Finley RW, Wright CS, et al. Rickettsia parkeri rickettsiosis and its clinical distinction from Rocky Mountain spotted fever. Clin Infect Dis 2008; 47:1188–1196.
Shapiro MR, Fritz CL, Tait K, et al. Rickettsia 364D: a newly recognized cause of eschar-associated illness in California. Clin Infect Dis 2010; 50:541–548.
Dumler JS, Madigan JE, Pusterla N, Bakken JS. Ehrlichioses in humans: epidemiology, clinical presentation, diagnosis, and treatment. Clin Infect Dis 2007; 45(suppl 1):S45–S51.
Thomas RJ, Dumler JS, Carlyon JA. Current management of human granulocytic anaplasmosis, human monocytic ehrlichiosis and Ehrlichia ewingii ehrlichiosis. Expert Rev Anti Infect Ther 2009; 7:709–722.
Severo MS, Stephens KD, Kotsyfakis M, Pedra JH. Anaplasma phagocytophilum: deceptively simple or simply deceptive? Future Microbiol 2012; 7:719–731.
Dahlgren FS, Heitman KN, Drexler NA, Massung RF, Behravesh CB. Human granulocytic anaplasmosis in the United States from 2008 to 2012: a summary of national surveillance data. Am J Trop Med Hyg 2015; 93:66–72.
Nichols Heitman K, Dahlgren FS, Drexler NA, Massung RF, Behravesh CB. Increasing Incidence of ehrlichiosis in the United States: a summary of national surveillance of Ehrlichia chaffeensis and Ehrlichia ewingii infections in the United States, 2008–2012. Am J Trop Med 2016; 94:52–60.
Wormser GP, Pritt B. Update and commentary on four emerging tick-borne infections: Ehrlichia muris-like agent, Borrelia miyamotoi, deer tick virus, heartland virus, and whether ticks play a role in transmission of Bartonella henselae. Infect Dis Clin North Am 2015; 29:371–381.
Pritt BS, Sloan LM, Johnson DK, et al. Emergence of a new pathogenic Ehrlichia species, Wisconsin and Minnesota, 2009. N Engl J Med 2011; 365:422–429.
Bakken JS, Dumler JS. Human granulocytic anaplasmosis. Infect Dis Clin North Am 2015; 29:341–355.
St Clair K, Decker CF. Ehrlichioses: anaplasmosis and human ehrlichiosis. Dis Mon 2012; 58:346–354.
Centers for Disease Control and Prevention (CDC). Anaplasma phagocytophilum transmitted through blood transfusion—Minnesota, 2007. MMWR Morb Mortal Wkly Rep 2008; 57:1145–1148.
Dhand A, Nadelman RB, Aguero-Rosenfeld M, Haddad FA, Stokes DP, Horowitz HW. Human granulocytic anaplasmosis during pregnancy: case series and literature review. Clin Infect Dis 2007; 45:589–593.
Stone JH, Dierberg K, Aram G, Dumler JS. Human monocytic ehrlichiosis. JAMA 2004; 292:2263–2270.
Sanchez E, Vannier E, Wormser GP, Hu LT. Diagnosis, treatment, and prevention of Lyme disease, human granulocytic anaplasmosis, and babesiosis. JAMA 2016; 315:1767–1777.
Wormser GP, Dattwyler RJ, Shapiro ED, et al. The clinical assessment, treatment, and prevention of Lyme disease, human granulocytic anaplasmosis, and babesiosis: clinical practice guidelines by the Infectious Diseases Society of America. Clin Infect Dis 2006; 43:1089–1134.
Dumler JS, Choi KS, Garcia-Garcia JC, et al. Human granulocytic anaplasmosis and Anaplasma phagocytophilum. Emerg Infect Dis 2005; 11:1828–1834.
Vannier EG, Diuk-Wasser MA, Ben Mamoun C, Krause PJ. Babesiosis. Infect Dis Clin North Am 2015; 29:357–370.
Vannier E, Gewurz BE, Krause PJ. Human babesiosis. Infect Dis Clin North Am 2008; 22:469–488.
Diuk-Wasser MA, Liu Y, Steeves TK, et al. Monitoring human babesiosis emergence through vector surveillance New England USA. Emerg Infect Dis 2014; 20:225–231.
Dunn JM, Krause PJ, Davis S, et al. Borrelia burgdorferi promotes the establishment of Babesia microti in the northeastern United States. PLoS One 2014; 9:e115494.
Vannier E, Krause PJ. Human babesiosis. N Engl J Med 2012; 366:2397–2407.
Herwaldt BL, Linden JV, Bosserman E, Young C, Olkowska D, Wilson M. Transfusion-associated babesiosis in the United States: a description of cases. Ann Intern Med 2011; 155:509–519.
Wudhikarn K, Perry EH, Kemperman M, Jensen KA, Kline SE. Transfusion-transmitted babesiosis in an immunocompromised patient: a case report and review. Am J Med 2011; 124:800–805.
Krause PJ, Gewurz BE, Hill D, et al. Persistent and relapsing babesiosis in immunocompromised patients. Clin Infect Dis 2008; 46:370–376.
Wormser GP, Prasad A, Neuhaus E, et al. Emergence of resistance to azithromycin-atovaquone in immunocompromised patients with Babesia microti infection. Clin Infect Dis 2010; 50:381–386.
Krause PJ, Lepore T, Sikand VK, et al. Atovaquone and azithromycin for the treatment of babesiosis. N Engl J Med 2000; 343:1454–1458.
Dworkin MS, Anderson DE Jr, Schwan TG, et al. Tick-borne relapsing fever in the northwestern United States and southwestern Canada. Clin Infect Dis 1998; 26:122–131.
Wagemakers A, Staarink PJ, Sprong H, Hovius JW. Borrelia miyamotoi: a widespread tick-borne relapsing fever spirochete. Trends Parasitol 2015; 31:260–269.
Krause PJ, Narasimhan S, Wormser GP, et al; Tick Borne Diseases Group. Borrelia miyamotoi sensu lato seroreactivity and seroprevalence in the northeastern United States. Emerg Infect Dis 2014; 20:1183–1190.
Gugliotta JL, Goethert HK, Berardi VP, Telford SR 3rd. Meningoencephalitis from Borrelia miyamotoi in an immunocompromised patient. N Engl J Med 2013; 368:240–245.
Masters EJ, Grigery CN, Masters RW. STARI, or Masters disease: Lone Star tick-vectored Lyme-like illness. Infect Dis Clin North Am 2008; 22:361–376.
Wormser GP, Masters E, Nowakowski J, et al. Prospective clinical evaluation of patients from Missouri and New York with erythema migrans-like skin lesions. Clin Infect Dis 2005; 41:958–965.
Feder HM Jr, Hoss DM, Zemel L, Telford SR 3rd, Dias F, Wormser GP. Southern tick-associated rash illness (STARI) in the north: STARI following a tick bite in Long Island, New York. Clin Infect Dis 2011; 53:e142–e146.
Carvalho CL, Lopes de Carvalho I, Ze-Ze L, Nuncio MS, Duarte EL. Tularaemia: a challenging zoonosis. Comp Immunol Microbiol Infect Dis 2014; 37):85–96.
Weber IB, Turabelidze G, Patrick S, Griffith KS, Kugeler KJ, Mead PS. Clinical recognition and management of tularemia in Missouri: a retrospective records review of 121 cases. Clin Infect Dis 2012; 55:1283–1290.
Nigrovic LE, Wingerter SL. Tularemia. Infect Dis Clin North Am 2008; 22:489–504.
Johansson A, Berglund L, Sjostedt A, Tarnvik A. Ciprofloxacin for treatment of tularemia. Clin Infect Dis 2001; 33:267–268.
Piantadosi A, Rubin DB, McQuillen DP, et al. Emerging cases of Powassan virus encephalitis in New England: clinical presentation, imaging, and review of the literature. Clin Infect Dis 2016; 62:707–713.
Ebel GD. Update on Powassan virus: emergence of a North American tick-borne flavivirus. Annu Rev Entomol 2010; 55:95–110.
Pastula DM, Turabelidze G, Yates KF, et al; Centers for Disease Control and Prevention (CDC). Notes from the field: heartland virus disease—United States, 2012-–2013. MMWR Morb Mortal Wkly Rep 2014; 63:270–271.
Knapp KL, Rice NA. Human coinfection with Borrelia burgdorferi and Babesia microti in the United States. J Parasitol Res 2015; 2015:587131.
Pujalte GG, Chua JV. Tick-borne infections in the United States. Prim Care 2013; 40:619–635.
Regan J, Matthias J, Green-Murphy A, et al. A confirmed Ehrlichia ewingii infection likely acquired through platelet transfusion. Clin Infect Dis 2013; 56:e105–e107.
Christa Eickhoff, MD Infectious Diseases Fellow, National Capitol Consortium; Assistant Professor of Medicine, Uniformed Services University of the Health Sciences, Department of Infectious Diseases, Walter Reed National Military Medical Center, Bethesda, MD
Jason Blaylock, MD, FACP Associate Program Director, National Capitol Consortium Infectious Diseases Fellowship; Associate Professor of Medicine, Uniformed Services University of the Health Sciences, Department of Infectious Diseases, Walter Reed National Military Medical Center, Bethesda, MD
Address: Christa Eickhoff, MD, Department of Infectious Diseases, Walter Reed National Military Medical Center, 8960 Brown Drive, Bethesda, MD 20889; [email protected]
Author and Disclosure Information
Christa Eickhoff, MD Infectious Diseases Fellow, National Capitol Consortium; Assistant Professor of Medicine, Uniformed Services University of the Health Sciences, Department of Infectious Diseases, Walter Reed National Military Medical Center, Bethesda, MD
Jason Blaylock, MD, FACP Associate Program Director, National Capitol Consortium Infectious Diseases Fellowship; Associate Professor of Medicine, Uniformed Services University of the Health Sciences, Department of Infectious Diseases, Walter Reed National Military Medical Center, Bethesda, MD
Address: Christa Eickhoff, MD, Department of Infectious Diseases, Walter Reed National Military Medical Center, 8960 Brown Drive, Bethesda, MD 20889; [email protected]
Ticks are responsible for most vector-borne infections in the United States. Most infections occur between April and October, when tick populations peak.1 However, infections can occur year-round.2,3
Tick bites are often unnoticed because the ticks are small when they are at the infective stage of their life cycle, and their attachment is characteristically painless and often in intertriginous body sites.1 Therefore, absence of a known tick bite never precludes the diagnosis of a tickborne infection.1,4,5
Although rural outdoor activities are recognized risk factors, tickborne infections also occur in urban areas.6 Thus, the lack of classic epidemiologic clues does not rule out a diagnosis of tickborne infection.
In most cases, tickborne illnesses present with nonspecific symptoms such as fever, malaise, headache, nausea, and myalgia. Accurate diagnosis of tickborne diseases can be challenging due to the similar clinical manifestations and overlapping geographic distributions of potential tick vectors.1
This review summarizes the epidemiology, clinical features, treatment, and prevention of the most prevalent non-Lyme tickborne diseases of the United States: Rocky Mountain spotted fever (RMSF), other spotted fever group rickettsial (SFGR) infections, ehrlichiosis, babesiosis, tickborne relapsing fever, Borrelia miyamotoi infection, southern tick-associated rash illness (STARI), tularemia, and tickborne viral infections.
ROCKY MOUNTAIN SPOTTED FEVER
RMSF (Table 1)is caused by Rickettsia rickettsii, an obligate intracellular gram-negative coccobacillus.7,8
Dermacentor variabilis, the American dog tick, is the major vector in the southern and eastern United States, and D andersoni, the Rocky Mountain wood tick, is the most common vector in the western United States.4,7,8Rhipicephalus sanguineus, the brown dog tick, has also been found to transmit RMSF in Arizona.9,10
While most infections in humans are transmitted by tick bite, rare cases of RMSF are contracted through exposure to infective tick hemolymph during tick removal, parenteral inoculation or infectious aerosols in laboratory settings, and blood transfusion.7,8
Figure 1. Geographic distribution of nationally notifiable tickborne diseases, 2015.
The geographic distribution of RMSF is restricted to the Western Hemisphere. Within the United States, cases of RMSF have been reported in nearly every state.4 However, RMSF is most prevalent in North Carolina, Tennessee, Missouri, Arkansas, and Oklahoma (Figure 1).1
RMSF is both the most common and the most likely cause of death among rickettsial infections in the United States.4,7,8 Most cases occur in children ages 5 to 9.10,11 The case-fatality rate is over 20% without antimicrobial therapy but less than 1% with timely and appropriate antibiotic treatment.7,8
Clinical manifestations of Rocky Mountain spotted fever
RMSF is transmitted after only 2 to 20 hours of tick attachment, and symptoms begin 3 to 12 days after inoculation.1,7,8 Unlike many other species that cause SFGR infection, R rickettsii does not cause an eschar at the site of inoculation.7,12
The classic triad of RMSF is fever, headache, and a rash. This triad is present in only 3% of early infections, but the prevalence increases to 60% to 70% by 2 weeks after the tick bite.1,7 Other common initial symptoms include generalized malaise, weakness, and myalgia.7,8,12 Gastrointestinal symptoms are common, and RMSF can be misdiagnosed as gastroenteritis, particularly in children.8
A rash usually occurs. It is due to systemic vasculitis and endothelial injury and often presents 2 to 5 days after the onset of fever, which can delay diagnosis.7,12,13 It usually progresses from macular to petechial and begins on the ankles, forearms, and wrists, spreading centripetally to the trunk and face and often including the palms and soles.7 Large areas of ecchymosis, ulceration, and (uncommonly) gangrene may occur as lesions coalesce.7,8 The 10% of patients who do not develop a rash (“spotless” fever) tend to have a poorer prognosis due to delayed diagnosis.8
Risk factors for severe disease include delay or lack of appropriate treatment, extremes of age, Native American descent, glucose-6-phosphate dehydrogenase deficiency, and immunocompromised states.1,10,11,13 Complications from the widespread Rickettsia-induced vasculitis may include a septic or toxic shock-like syndrome and neurovascular, cardiac, respiratory, and renal damage.7,11 Without appropriate therapy, death occurs 7 to 15 days after symptom onset.8
Laboratory evaluation may reveal thrombocytopenia and anemia.7 Leukocytosis or leukopenia may be present.8 Hyponatremia, elevated aminotransferase levels, elevated creatine kinase levels, prolonged coagulation times, and decreased fibrinogen may also be present.7,8
Diagnosis of Rocky Mountain spotted fever
No diagnostic studies are available for the acute phase of RMSF. Therefore, a high suspicion of RMSF is essential, and treatment should be started as soon as RMSF is suspected. Confirmatory testing can retrospectively validate a clinical diagnosis.4,7,11
Serologic testing with an immunofluorescence antibody assay remains the principal diagnostic test for RMSF, and paired testing (during the acute and convalescent phases) has a sensitivity of 94%.4 A 4-fold or greater increase in antibody titer (with a minimum titer of 1:64) between acute and convalescent samples is considered diagnostic of acute infection.4,7,8 Serology is often negative early in the disease course.4,7,8 The assay cross-reacts with other SFGR species, however.4,8
Amplification of R rickettsii DNA by polymerase chain reaction (PCR) from blood or biopsy sites can be done in some research settings, but its utility is limited because of low sensitivity early in the course of the infection.4,7
Immunohistochemical staining of a skin biopsy or autopsy specimen is a highly specific diagnostic test performed at a limited number of laboratories, though it has a sensitivity of only 60% to 92%.4,7,8
Cell culture can also be performed, but only in biosafety level 3 (scale of 1 to 4) laboratories.1
Treatment of Rocky Mountain spotted fever
Prompt initiation of antibiotic therapy greatly improves prognosis.1,13,14
Doxycycline for 7 days is the treatment of choice for RMSF, including in pregnant patients with life-threatening disease and in children.4,7,8,15,16
Tetracycline can also be used.
Chloramphenicol is an alternative treatment for pregnant patients with mild to moderate disease or those patients with a severe hypersensitivity reaction to doxycycline.1,4,7,9,15,16 In the United States, chloramphenicol is currently available only in an intravenous formulation.
Fever typically subsides within 24 to 48 hours of starting treatment.4,8 Failure to clinically improve within 48 hours suggests an alternative diagnosis.1,4 Long-term complications of severe infection may include hearing loss, blindness, and amputation of digits or extremities due to gangrene.1,8 Persistence of disease beyond acute infection has not been observed.1
OTHER SPOTTED FEVER GROUP RICKETTSIAl INFECTIONS
Two other SFGR infections, uncommon in the United States, are caused by R parkeri (Table 2) and Rickettsia species 364D (Table 3).
Both infections are characterized by an inoculation eschar. Symptoms include fever, headache, myalgia, and regional lymphadenopathy.1 Rash (most often maculopapular or vesicopustular) is characteristic of R parkeri, but it is not common in Rickettsia species 364D rickettsiosis.17,18 Mild thrombocytopenia, leukopenia, and elevated aminotransferase levels are common in R parkeri infection.1 Both infections appear to be milder than RMSF.
Diagnosis of the specific infection is challenging due to the cross-reactivity of SFGR serologic tests. Additional testing with PCR, immunohistochemistry, and culture at specialized laboratories may aid in diagnosis. Because RMSF cannot be ruled out, all cases of SFGR should be treated the same as R rickettsii with a course of doxycycline.17
EHRLICHIOSES: EHRLICHIOSIS AND ANAPLASMOSIS
“Ehrlichiosis” is the generic name for infections caused by both the Ehrlichia and Anaplasma genera,19,20 which are small, gram-negative obligate intracellular bacterial pathogens.21 In the United States, infections are most commonly caused by A phagocytophilum, the causative organism of human granulocytic anaplasmosis (HGA) (Table 4), and E chaffeensis, the causative organism of human monocytic ehrlichiosis (HME) (Table 5). The incidence rates of these 2 infections have increased over the past decade, in part due to increased clinical awareness and improved diagnostic capabilities.3,22,23
E ewingii (Table 6)and E muris-like agent (Table 7) are lesser known causes of human ehrlichiosis in the United States.20,23–25 Initially, E ewingii was believed to primarily affect immunocompromised patients, but it was later recognized in immunocompetent hosts.23E muris-like agent was first discovered as a cause of infection in 2009, and cases have been limited to Wisconsin and Minnesota.24,25
Human granulocytic anaplasmosis. A phagocytophilum is transmitted by Ixodes scapularis (the deer tick or blacklegged tick) in the northeastern and upper-midwestern regions of the United States, and I pacificus (the western blacklegged tick) along the northern Pacific coast.1,19,20,26 The 6 states accounting for most cases are New York, Connecticut, Massachusetts, Rhode Island, Minnesota, and Wisconsin.27 The white-footed mouse serves as the primary reservoir for A phagocytophilum, and humans are an accidental, “dead-end” host.21 Cases have also been reported to be transmitted via blood transfusion and transplacentally.20,26,28,29
Human monocytic ehrlichiosis. E chaffeensis is transmitted by Amblyomma americanum (the Lone Star tick).20 It is most commonly found in the southeastern, south-central, and mid-Atlantic regions of the United States.19,20,30 The 5 states with the most cases are Missouri, Oklahoma, Tennessee, Arkansas, and Maryland.1,4,27 White-tail deer are the primary reservoir for E chaffeensis.
Clinical manifestations of ehrlichiosis
After an incubation time of 5 to 21 days, ehrlichiosis typically presents as a febrile viral-like illness with nonspecific symptoms that include fever, chills, sweats, myalgia, headache, malaise, and cough.1,26,27,31
Gastrointestinal symptoms, arthralgia, photophobia, and nervous system involvement may also occur.1,20,29,32 Gastrointestinal symptoms tend to be more common in HME than HGA.20
Rash occurs in up to one-third of patients with HME, but it is rare in HGA.4,19,20,27 HME presents with more central nervous system involvement (such as meningitis or seizures) than HGA, in which central nervous system involvement is rare.
Severe complications of HME and HGA occur in a minority of cases and may include acute respiratory distress syndrome, renal failure, disseminated intravascular coagulopathy, and spontaneous hemorrhage.19 In general, HME is more severe than HGA and is more likely to progress to fulminant toxic or septic shocklike syndrome in rare instances.19
Laboratory tests may reveal leukopenia, lymphopenia, thrombocytopenia, and elevated liver-associated enzyme levels.1,19,20,26 Anemia and hyponatremia may also be present.4,30
Diagnosis of ehrlichiosis
The most rapid diagnostic method is examination of Wright- or Giemsa-stained peripheral blood smears for morulae, which are cytoplasmic intravacuolar inclusions of bacteria within leukocytes.20 However, its sensitivity is as low as 20% and declines even further after the first week of infection.4,20
PCR testing is the most sensitive and rapid tool available during acute infection.1,20,26,30,31 However, due to waning of the bacteremic phase, its sensitivity decreases after the first week of infection and after treatment is started.19,20
Serologic detection of antibodies with an indirect immunofluorescence assay is the most frequently used test for diagnosis of ehrlichiosis, and paired serology demonstrating seroconversion (at least a 4-fold increase in titer, with a minimal titer of 1:64) is most sensitive (82% to 100%).4,19,20,26 Cross-reactivity can occur, so testing for antibodies to both A phagocytophilum and E chaffeensis might assist in a more accurate diagnosis in areas where tick vectors overlap.4,19,20,26
HGA and HME can be isolated through cell culture in blood or cerebrospinal fluid. However, this is labor-intensive and performed in only a few specialized laboratories.4,19,20,27,31
Treatment of ehrlichiosis
If ehrlichiosis is suspected, treatment should not be delayed; the disease can be life-threatening and the ability to diagnose acute infection is often limited.20,26,32
Doxycycline is the treatment of choice, even in pregnant patients with severe infection and in children.1,19,26,27 Antibiotics are given for 5 to 10 days and continued for at least 3 days after the fever subsides.19,20,26,27,30 In HGA, a 10-day course of doxycycline is recommended to also provide the appropriate length of treatment for Borrelia burgdorferi.1,31
Rifampin is an alternative for those with severe tetracycline allergy, as well as those with mild to moderate infection during pregnancy.1,20,26,29–32
Fever typically resolves within 24 to 48 hours of starting treatment, and persistence of fever over 48 hours after starting antibiotics suggests an alternative diagnosis or possible coinfection.1,4,19,20,26,27,30,32
Persistence of chronic A phagocytophilum or E chaffeensis infection in humans beyond 2 months has not been demonstrated.20,26,30,33 Therefore, antibiotic treatment beyond the acute stage of infection is not indicated.30 Long-term prognosis is favorable, and patients are expected to make a full recovery.26,30
BABESIOSIS
Babesiosis (Table 8) is a malaria-like illness caused by intraerythrocytic protozoan parasites of the genus Babesia. Most cases in the United States are caused by Babesia microti.
Babesiosis occurs in the northeastern and upper midwestern states, with most cases reported in Massachusetts, Connecticut, Rhode Island, New York, New Jersey, Minnesota, and Wisconsin.31,32,34–36 Outbreaks have also been documented in Washington, California, and Missouri.31,32,35 The spread mimics that of Lyme disease, though it can be slower.34,36–39
Most cases in the Northeast and upper Midwest are caused by Babesia microti, while Babesia duncani has sporadically caused disease along the Pacific coast and Babesia divergens has been found in the Midwest and Northwest.34,36,39
Though babesiosis is usually a tickborne illness, it can also be transmitted through blood transfusion and, rarely, transplacental spread.31,32,34,36,39–41 The I scapularis tick is the host vector for Babesia microti, and transmission of disease requires 24 to 72 hours of attachment to a host.34,35 The primary reservoir for Babesia microti is the white-footed mouse, and humans are accidental hosts.32,34–36,39
Clinical manifestations of babesiosis
Babesia species cause illness by lysing erythrocytes, with resultant cytokine release.34
Symptoms typically appear 1 to 4 weeks after inoculation, after which most cases present as a viral-like illness with gradual onset of fever, chills, sweats, fatigue, malaise, headache, arthralgia, myalgia, nausea, anorexia, and nonproductive cough.32,34–36,39
Physical findings may include splenomegaly, hepatomegaly, jaundice, petechiae, and ecchymosis.32,34–36,39 Rash is seldom present and is not a characteristic feature of babesiosis.35,36
Laboratory features may include thrombocytopenia, hemolytic anemia, and elevated liver enzyme levels.32,34,36,39
Severe disease can occur in elderly, immunocompromised, or splenectomized individuals and can be life-threatening.34,39 Complications of severe infection can include acute respiratory distress syndrome, diffuse intravascular coagulation, and liver or renal failure.31,32,34–36,39 Splenic infarction or rupture may occur at lower levels of parasitemia in those without other manifestations of severe disease.31 The course can be prolonged and relapsing despite standard antibiotic therapy, typically in the setting of severe immunocompromise.32,34,42,43 Death occurs in up to 10% of severe cases.34
Diagnosis of babesiosis
Babesiosis should be considered if a patient presents with a febrile illness and nonspecific symptoms and comes from an endemic area or has received a blood transfusion within 6 months.34,35
The diagnosis of babesiosis is most commonly made by finding the intraerythrocytic ring form of the organism (trophozoite) on Giemsa- or Wright-stained thin blood smears.34,36,39Babesia can be distinguished from Plasmodia (the agent of malaria) by the rare presence of tetrads of merozoites arranged in a cross-like pattern (the Maltese cross); the absence of hemozoin (brownish deposits) in the ring form; and the occasional presence of extracellular ring forms.34,36
The level of parasitemia (representing the number of parasites per microliter of blood) is generally between 1% and 10%, although it can be as high as 80%.36,39 Because parasitemia is often low early in disease (< 1%), multiple blood smears should be examined.34–36,39
Several real-time PCR assays are available to detect low-grade Babesia microti parasitemia in patients with negative blood smears during early infection.31 These assays have high diagnostic sensitivity and specificity and do not cross-react with other Babesia or Plasmodium species.34–36,39
Paired serology (immunoglobulin G) can confirm infection, although antibody may be absent early in the course of illness.31,34–36,39
Treatment of babesiosis
Current guidelines recommend antimicrobial therapy only for patients with symptoms and positive test results for Babesia.32 Treatment of asymptomatic patients should additionally be considered if parasitemia (not positive PCR or serology) persists for 3 months or longer.32,34–36,39
For mild to moderate babesiosis, the combination of oral atovaquone and azithromycin for 7 to 10 days has similar efficacy and a lower incidence of adverse effects than clindamycin plus quinine.31,32,34,44 For immunocompromised patients, higher doses of azithromycin can be used.31,32
For severe babesiosis or those with risk factors for severe disease, intravenous clindamycin and oral quinine are recommended for 7 to 10 days based on expert opinion.31,32,34–36,39,43 Adverse effects of this regimen include diarrhea, tinnitus, and hearing deficits.35,39 If necessary, intravenous quinidine can be used, but the patient should receive cardiac monitoring for possible prolongation of the QT interval.34,39 As quinine therapy is often interrupted due to the above side effects, alternative regimens such as intravenous azithromycin or clindamycin in combination with oral atovaquone should be considered for severe cases.31 However, these regimens are not well studied.31
Partial or complete exchange transfusion of whole blood or packed red blood cells should be considered in patients with a high level of parasitemia (≥ 10%), severe anemia (hemoglobin < 10 g/dL), or renal, hepatic, or pulmonary compromise.31,32,34–36,39 In critically ill patients, parasitemia should be monitored daily until it has decreased to less than 5%.32,34,39
Generally, symptoms improve within 48 hours of antimicrobial therapy initiation; however, parasitemia may take up to 3 months to resolve.32,34,39 In severely immunocompromised patients, babesiosis may persist or relapse despite appropriate therapy.34,39,42,43 In these cases, at least 6 weeks of antimicrobial therapy is recommended, including 2 weeks of therapy after Babesia organisms are no longer seen on blood smear.31,33,36,39,42
TICKBORNE RELAPSING FEVER
Relapsing fever, as the name implies, is characterized by recurring episodes of fever and nonspecific flulike symptoms (Table 9).
The illness is transmitted by either ticks or body lice. The tick-borne illness is caused by spirochetes of the genus Borrelia and transmitted to humans by the bite of an infected Ornithodoros soft tick.45 Approximately 70% of reported cases in the United States occur in California, Washington, and Colorado.46 Most cases are caused by Borrelia hermsii and are linked to sleeping in rodent-infested cabins in mountainous areas.46 Remarkably, tick-borne borreliae are transmitted within about 30 seconds of tick attachment.47,48
The hallmark of tickborne relapsing fever is febrile episodes lasting 3 to 5 days, with relapses after 5 to 7 days of apparent recovery.49 If untreated, several episodes of fever and nonspecific symptoms will occur before illness resolves spontaneously. Overall mortality rates are very low (< 5%).50
Laboratory confirmation of tickborne relapsing fever is made by detecting spirochetes in a blood smear during a febrile episode or serologic antibody confirmation. However, serologic testing is unhelpful in the acute setting and can yield false-positive results with prior exposure to other Borrelia species (eg, Lyme disease) or other spirochetes. Serologic antibody testing with a 4-fold increase between acute and convalescent samples or PCR can aid in diagnosis, though the latter is available only in research settings.47
The preferred treatment regimen for adults is an oral tetracycline for 10 days. Erythromycin is recommended when tetracyclines are contraindicated.51
When starting treatment, all patients should be monitored closely for the Jarisch-Herxheimer reaction (rigors, hypotension, and high fevers), which develops in over 50% of cases as a result of rapid spirochetal killing and massive cytokine release.52
BORRELIA MIYAMOTOI INFECTION
Borrelia miyamotoi (Table 10) is a spirochete closely related to those causing tickborne relapsing fever, recently identified as a human pathogen and transmitted by the same tick species that transmit Lyme disease—I pacificus ticks in the far western United States and I scapularis in northeastern and north-central United States. The reservoir hosts are poorly known, but the organism has been detected in small rodents as well as birds and larger animals.53,54
The most common clinical manifestations are similar to other tickborne relapsing fever infections, although a true “relapsing fever” itself is not usually present.53 The characteristic erythema migrans rash often found in Lyme disease is typically absent in B miyamotoi infection; however, when present, it should prompt investigation into coinfection.54 Cases of meningoencephalitis have been reported in immunosuppressed hosts.55
There is currently no validated test available for diagnosis of B miyamotoi; however, PCR and serology are available in a few specialized laboratories.31,53
The treatment of choice is doxycycline for 2 to 4 weeks. Amoxicillin and ceftriaxone also appear effective.53
SOUTHERN TICK-ASSOCIATED RASH ILLNESS
Southern tick-associated rash illness (STARI) (Table 11) is associated with the bite of the Lone Star tick, A americanum. Most cases are diagnosed in the southeastern and south-central United States where the tick is endemic; however, its range is expanding. It was originally speculated that Borrelia lonestari caused STARI, though more recent evidence has not supported this.56 At this time, the cause of STARI is unknown.
Infection can present similarly to Lyme disease with an erythema migrans-like rash and associated flulike symptoms, although systemic symptoms and multiple erythema migrans lesions are less likely with STARI. Also, the erythema migrans-like lesions tend to be smaller and more likely to have central clearing than those in Lyme disease.57 Nevertheless, it is difficult to distinguish the 2 illnesses, especially in mid-Atlantic states such as Maryland or Virginia, where both diseases coexist. The most reliable method of distinguishing STARI from Lyme disease is demonstrating that the patient was bitten by a Lone Star tick rather than an Ixodes tick. Numerous questions remain unanswered about the causative organism, pathophysiology, definitive diagnosis, geographic range of illness, and most effective treatment for STARI.
Most reported cases have responded promptly to doxycycline, though it is not known whether antibiotic treatment is necessary.58
TULAREMIA
Tularemia (Table 12) is a zoonotic infection caused by the gram-negative bacterium Francisella tularensis. The organism is one of the most virulent bacteria currently known; the high rate of infectivity has led to its classification as a category A biowarfare agent. F tularensis infects more than 200 species of animals and invertebrates.
Ticks are thought to be the most important vectors, and most cases occur in the south-central United States.59 The geographic distribution of disease is gradually shifting northward due to spread of the major tick vectors, A americanum, D variabilis, and D andersoni. Approximately 100 to 200 cases of tularemia are diagnosed each year in the United States, with most concentrated in Kansas, Oklahoma, Missouri, and Arkansas.60
Humans can acquire F tularensis by several routes, and the route of infection ultimately dictates the clinical syndrome. Ulceroglandular and glandular forms of the disease are the most common in the United States, and both frequently result from a tick bite. A few days after tick exposure, an erythematous, often painful papuloulcerative lesion with a central eschar manifests at the site of the tick bite. Additional symptoms may include fever, chills, headache, myalgia, malaise, and suppurative lymphadenitis.61
Diagnosis can be made by identifying F tularensis in blood, fluid, or tissue culture performed under biosafety level 3 conditions; however, serology is used in most cases.62
Streptomycin and gentamicin are considered drugs of choice and should be continued for at least 10 days. For relatively mild disease, oral doxycycline or ciprofloxacin can be considered for at least 14 days, although the latter is not approved for treatment.59,63
TICKBORNE VIRAL INFECTIONS
While most arboviruses are transmitted by mosquitoes, 2 tickborne viruses can cause infection in specific regions of the United States: Powassan virus (Table 13) and Heartland virus (Table 14).
Powassan virus, an uncommon flavivirus, is found in the Great Lakes region and northeast United States. In the Great Lakes region, I cookei ticks transmit the traditional lineage of this virus. However, more recent cases have been identified in the Northeast and Midwest, where Powassan virus lineage II (or deer tick virus) is transmitted by I scapularis.31,64
The classic presentation is a viral encephalitis. Rash (most often maculopapular) and gastrointestinal symptoms have been reported as well. A high index of suspicion is needed for diagnosis because clinical features and laboratory findings resemble those of other arboviral infections.
Treatment for Powassan viral encephalitis is supportive, although corticosteroids have been used with some success.64 While asymptomatic infection has been documented, the reported mortality rate of Powassan virus encephalitis is 10% to 15%, and focal neurologic deficits can persist among survivors.65
Heartland virus is a newly identified phlebovirus that has been reported only in rural Missouri and Tennessee to date. Infection is presumed to be transmitted by A americanum.66 An animal reservoir has not been established.
Clinical and laboratory features appear to be very similar to those of the ehrlichioses.1 A clinical diagnosis should be considered in patients with A americanum exposure, fever, and cytopenias who lack PCR or serologic evidence for ehrlichiosis infection or who fail to respond to doxycycline therapy.24
COINFECTION
Some tick vectors transmit more than 1 type of infection, and therefore, coinfection with multiple pathogens may occur. For example, I scapularis transmits Borrelia burgdorferi (Lyme disease), HGA, Babesia microti, B miyamotoi, E muris-like agent, and Powassan virus lineage II, while A americanum transmits HME and Heartland virus.24,26,31,34,36,67 Coinfection may increase the severity of disease, often due to a delay in diagnosis, though more research is needed to understand the clinical manifestations of coinfection.31,35,67
PREVENTION
Unfortunately, there are no available human vaccines for tickborne illnesses in the United States, and the effectiveness of single-dose prophylaxis with doxycycline for non-Lyme infections has not been evaluated.4,7,26
Illness is best prevented by minimizing skin exposure to ticks, use of tick repellents containing DEET, use of long-legged and long-sleeved clothing impregnated with an acaricide such as permethrin, and conducting timely body checks for ticks after potential exposure.1,31,32 Light-colored clothing is suggested, since it allows for better visibility of crawling ticks.4,32 Bathing or showering within 2 hours of tick exposure helps prevent attachment of ticks.4,31,68 If camping outside, use of a bed net is recommended.68
Ticks are most easily removed by grasping the head of the tick as close to the skin surface as possible with fine-tipped tweezers.32,68 Removing or crushing ticks with bare hands should be avoided to prevent potential contamination, and hands should be washed thoroughly after tick removal.1,4
Blood donors are screened for a history of symptomatic tickborne disease; however, asymptomatic donors who are not identified at screening pose the greatest risk to the blood supply. Babesia microti is the most common reported transfusion-transmitted parasite in the United States, and transmission of R rickettsii, A phagocytophilum, and E ewingii have also been reported infrequently.28,40,69 Currently, no test is approved to screen blood for tickborne illnesses, though such a test would help prevent transmission of tickborne illnesses by blood transfusion in areas where these diseases are endemic.40,41
TAKE-HOME POINTS
Tickborne illnesses are increasing throughout the United States as a result of vector expansion and changes in human ecology.
It is essential that primary care clinicians consider tickborne illnesses in the differential diagnosis for any patient presenting with a fever and constitutional symptoms when the cause of symptoms is unclear and tick exposure is possible or known.
All the diseases discussed are nationally notifiable conditions, and confirmed cases should be reported.
Knowledge of the geographic locations of potential exposure is paramount to determining which tickborne infections to consider, and the absence of a tick bite history should not exclude the diagnosis in the correct clinical presentation.
In addition, it is important to recognize the limitations of diagnostic testing for many tickborne infections; empiric treatment is most often warranted before confirming the diagnosis.
Tick avoidance is the most effective way to prevent these often severe infections.
References
Biggs HM, Behravesh CB, Bradley KK, et al. Diagnosis and management of tickborne rickettsial diseases: Rocky Mountain spotted fever and other spotted fever group rickettsioses, ehrlichioses, and anaplasmosis—United States. MMWR Recomm Rep 2016; 65:1–44.
Openshaw JJ, Swerdlow DL, Krebs JW, et al. Rocky Mountain spotted fever in the United States, 2000–2007: interpreting contemporary increases in incidence. Am J Trop Med Hyg 2010; 83:174–182.
Dahlgren FS, Mandel EJ, Krebs JW, Massung RF, McQuiston JH. Increasing incidence of Ehrlichia chaffeensis and Anaplasma phagocytophilum in the United States, 2000-2007. Am J Trop Med Hyg 2011; 85:124–131.
Chapman AS, Bakken JS, Folk SM, et al; Tickborne Rickettsial Diseases Working Group; CDC. Diagnosis and management of tickborne rickettsial diseases: Rocky Mountain spotted fever, ehrlichioses, and anaplasmosis—United States: a practical guide for physicians and other health-care and public health professionals. MMWR Recomm Rep 2006; 55:1–27.
Mukkada S, Buckingham SC. Recognition of and prompt treatment for tick-borne infections in children. Infect Dis Clin North Am 2015; 29:539–555.
Schutze GE, Buckingham SC, Marshall GS, et al; Tick-borne Infections in Children Study (TICS) Group. Human monocytic ehrlichiosis in children. Pediatr Infect Dis J 2007; 26:475–479.
Lin L, Decker C. Rocky Mountain spotted fever. Dis Mon 2012; 58:361–369.
Demma LJ, Traeger MS, Nicholson WL, et al. Rocky mountain spotted fever from an unexpected tick vector in Arizona. N Engl J Med 2005; 353:587–594.
Traeger MS, Regan JJ, Humpherys D, et al. Rocky mountain spotted fever characterization and comparison to similar illnesses in a highly endemic area—Arizona, 2002-2011. Clin Infect Dis 2015; 60:1650–1658.
Dahlgren FS, Holman RC, Paddock CD, Callinan LS, McQuiston JH. Fatal Rocky Mountain spotted fever in the United States, 1999–2007. Am J Trop Med Hyg 2012; 86:713–719.
Parola P, Paddock CD, Socolovschi C, et al. Update on tick-borne rickettsioses around the world: a geographic approach. Clin Microbiol Rev 2013; 26:657–702.
Regan JJ, Traeger MS, Humpherys D, et al. Risk factors for fatal outcome from rocky mountain spotted fever in a highly endemic area—Arizona, 2002-2011. Clin Infect Dis 2015; 60:1659–1666.
Nelson R. Rocky Mountain spotted fever in Native Americans. Lancet Infect Dis 2015; 15:1013–1014.
Botelho-Nevers E, Socolovschi C, Raoult D, Parola P. Treatment of Rickettsia spp. infections: a review. Expert Rev Anti Infect Ther 2012; 10:1425–1437.
Paddock CD, Finley RW, Wright CS, et al. Rickettsia parkeri rickettsiosis and its clinical distinction from Rocky Mountain spotted fever. Clin Infect Dis 2008; 47:1188–1196.
Shapiro MR, Fritz CL, Tait K, et al. Rickettsia 364D: a newly recognized cause of eschar-associated illness in California. Clin Infect Dis 2010; 50:541–548.
Dumler JS, Madigan JE, Pusterla N, Bakken JS. Ehrlichioses in humans: epidemiology, clinical presentation, diagnosis, and treatment. Clin Infect Dis 2007; 45(suppl 1):S45–S51.
Thomas RJ, Dumler JS, Carlyon JA. Current management of human granulocytic anaplasmosis, human monocytic ehrlichiosis and Ehrlichia ewingii ehrlichiosis. Expert Rev Anti Infect Ther 2009; 7:709–722.
Severo MS, Stephens KD, Kotsyfakis M, Pedra JH. Anaplasma phagocytophilum: deceptively simple or simply deceptive? Future Microbiol 2012; 7:719–731.
Dahlgren FS, Heitman KN, Drexler NA, Massung RF, Behravesh CB. Human granulocytic anaplasmosis in the United States from 2008 to 2012: a summary of national surveillance data. Am J Trop Med Hyg 2015; 93:66–72.
Nichols Heitman K, Dahlgren FS, Drexler NA, Massung RF, Behravesh CB. Increasing Incidence of ehrlichiosis in the United States: a summary of national surveillance of Ehrlichia chaffeensis and Ehrlichia ewingii infections in the United States, 2008–2012. Am J Trop Med 2016; 94:52–60.
Wormser GP, Pritt B. Update and commentary on four emerging tick-borne infections: Ehrlichia muris-like agent, Borrelia miyamotoi, deer tick virus, heartland virus, and whether ticks play a role in transmission of Bartonella henselae. Infect Dis Clin North Am 2015; 29:371–381.
Pritt BS, Sloan LM, Johnson DK, et al. Emergence of a new pathogenic Ehrlichia species, Wisconsin and Minnesota, 2009. N Engl J Med 2011; 365:422–429.
Bakken JS, Dumler JS. Human granulocytic anaplasmosis. Infect Dis Clin North Am 2015; 29:341–355.
St Clair K, Decker CF. Ehrlichioses: anaplasmosis and human ehrlichiosis. Dis Mon 2012; 58:346–354.
Centers for Disease Control and Prevention (CDC). Anaplasma phagocytophilum transmitted through blood transfusion—Minnesota, 2007. MMWR Morb Mortal Wkly Rep 2008; 57:1145–1148.
Dhand A, Nadelman RB, Aguero-Rosenfeld M, Haddad FA, Stokes DP, Horowitz HW. Human granulocytic anaplasmosis during pregnancy: case series and literature review. Clin Infect Dis 2007; 45:589–593.
Stone JH, Dierberg K, Aram G, Dumler JS. Human monocytic ehrlichiosis. JAMA 2004; 292:2263–2270.
Sanchez E, Vannier E, Wormser GP, Hu LT. Diagnosis, treatment, and prevention of Lyme disease, human granulocytic anaplasmosis, and babesiosis. JAMA 2016; 315:1767–1777.
Wormser GP, Dattwyler RJ, Shapiro ED, et al. The clinical assessment, treatment, and prevention of Lyme disease, human granulocytic anaplasmosis, and babesiosis: clinical practice guidelines by the Infectious Diseases Society of America. Clin Infect Dis 2006; 43:1089–1134.
Dumler JS, Choi KS, Garcia-Garcia JC, et al. Human granulocytic anaplasmosis and Anaplasma phagocytophilum. Emerg Infect Dis 2005; 11:1828–1834.
Vannier EG, Diuk-Wasser MA, Ben Mamoun C, Krause PJ. Babesiosis. Infect Dis Clin North Am 2015; 29:357–370.
Vannier E, Gewurz BE, Krause PJ. Human babesiosis. Infect Dis Clin North Am 2008; 22:469–488.
Diuk-Wasser MA, Liu Y, Steeves TK, et al. Monitoring human babesiosis emergence through vector surveillance New England USA. Emerg Infect Dis 2014; 20:225–231.
Dunn JM, Krause PJ, Davis S, et al. Borrelia burgdorferi promotes the establishment of Babesia microti in the northeastern United States. PLoS One 2014; 9:e115494.
Vannier E, Krause PJ. Human babesiosis. N Engl J Med 2012; 366:2397–2407.
Herwaldt BL, Linden JV, Bosserman E, Young C, Olkowska D, Wilson M. Transfusion-associated babesiosis in the United States: a description of cases. Ann Intern Med 2011; 155:509–519.
Wudhikarn K, Perry EH, Kemperman M, Jensen KA, Kline SE. Transfusion-transmitted babesiosis in an immunocompromised patient: a case report and review. Am J Med 2011; 124:800–805.
Krause PJ, Gewurz BE, Hill D, et al. Persistent and relapsing babesiosis in immunocompromised patients. Clin Infect Dis 2008; 46:370–376.
Wormser GP, Prasad A, Neuhaus E, et al. Emergence of resistance to azithromycin-atovaquone in immunocompromised patients with Babesia microti infection. Clin Infect Dis 2010; 50:381–386.
Krause PJ, Lepore T, Sikand VK, et al. Atovaquone and azithromycin for the treatment of babesiosis. N Engl J Med 2000; 343:1454–1458.
Dworkin MS, Anderson DE Jr, Schwan TG, et al. Tick-borne relapsing fever in the northwestern United States and southwestern Canada. Clin Infect Dis 1998; 26:122–131.
Wagemakers A, Staarink PJ, Sprong H, Hovius JW. Borrelia miyamotoi: a widespread tick-borne relapsing fever spirochete. Trends Parasitol 2015; 31:260–269.
Krause PJ, Narasimhan S, Wormser GP, et al; Tick Borne Diseases Group. Borrelia miyamotoi sensu lato seroreactivity and seroprevalence in the northeastern United States. Emerg Infect Dis 2014; 20:1183–1190.
Gugliotta JL, Goethert HK, Berardi VP, Telford SR 3rd. Meningoencephalitis from Borrelia miyamotoi in an immunocompromised patient. N Engl J Med 2013; 368:240–245.
Masters EJ, Grigery CN, Masters RW. STARI, or Masters disease: Lone Star tick-vectored Lyme-like illness. Infect Dis Clin North Am 2008; 22:361–376.
Wormser GP, Masters E, Nowakowski J, et al. Prospective clinical evaluation of patients from Missouri and New York with erythema migrans-like skin lesions. Clin Infect Dis 2005; 41:958–965.
Feder HM Jr, Hoss DM, Zemel L, Telford SR 3rd, Dias F, Wormser GP. Southern tick-associated rash illness (STARI) in the north: STARI following a tick bite in Long Island, New York. Clin Infect Dis 2011; 53:e142–e146.
Carvalho CL, Lopes de Carvalho I, Ze-Ze L, Nuncio MS, Duarte EL. Tularaemia: a challenging zoonosis. Comp Immunol Microbiol Infect Dis 2014; 37):85–96.
Weber IB, Turabelidze G, Patrick S, Griffith KS, Kugeler KJ, Mead PS. Clinical recognition and management of tularemia in Missouri: a retrospective records review of 121 cases. Clin Infect Dis 2012; 55:1283–1290.
Nigrovic LE, Wingerter SL. Tularemia. Infect Dis Clin North Am 2008; 22:489–504.
Johansson A, Berglund L, Sjostedt A, Tarnvik A. Ciprofloxacin for treatment of tularemia. Clin Infect Dis 2001; 33:267–268.
Piantadosi A, Rubin DB, McQuillen DP, et al. Emerging cases of Powassan virus encephalitis in New England: clinical presentation, imaging, and review of the literature. Clin Infect Dis 2016; 62:707–713.
Ebel GD. Update on Powassan virus: emergence of a North American tick-borne flavivirus. Annu Rev Entomol 2010; 55:95–110.
Pastula DM, Turabelidze G, Yates KF, et al; Centers for Disease Control and Prevention (CDC). Notes from the field: heartland virus disease—United States, 2012-–2013. MMWR Morb Mortal Wkly Rep 2014; 63:270–271.
Knapp KL, Rice NA. Human coinfection with Borrelia burgdorferi and Babesia microti in the United States. J Parasitol Res 2015; 2015:587131.
Pujalte GG, Chua JV. Tick-borne infections in the United States. Prim Care 2013; 40:619–635.
Regan J, Matthias J, Green-Murphy A, et al. A confirmed Ehrlichia ewingii infection likely acquired through platelet transfusion. Clin Infect Dis 2013; 56:e105–e107.
Tickborne illnesses should be considered in patients with known or potential tick exposure presenting with fever or vague constitutional symptoms in tick-endemic regions.
Given that tick-bite history is commonly unknown, absence of a known tick bite does not exclude the diagnosis of a tick-borne illness.
Starting empiric treatment is usually warranted before the diagnosis of tickborne illness is confirmed.
Tick avoidance is the most effective measure for preventing tickborne infections.
Disallow All Ads
Content Gating
No Gating (article Unlocked/Free)
Alternative CME
Consolidated Pubs: Do Not Show Source Publication Logo
As summer is upon us, we enter the peak of tick season. Most reported cases of tickborne disease occur from April to October, and in this issue, Eickhoff and Blaylock offer a timely review of less common (non-Lyme disease) but significant tickborne infections.
In areas endemic for infection with Rickettsia rickettsii, the organism responsible for Rocky Mountain spotted fever (RMSF), physicians and many patients are keenly aware of the signs and symptoms of the disease and are quick to offer and accept empiric antibiotic (doxycycline) therapy. Empiric therapy at the first suspicion of RMSF is appropriate, as untreated infection carries a 20% death rate. Vigilance for early Lyme disease (caused by Borrelia burgdorferi) is also high in true endemic areas, likely because of public awareness and concern for various documented—and some touted but unproven—associated morbidities.
Other tickborne infections are likely underrecognized by physicians who are not experts in infectious disease, and thus are not treated early. There are many reasons for this, including the relative infrequency of severe disease, the nonspecific clinical signs of early infection, and the spreading of infections to geographic areas where they are traditionally not considered endemic.
Additional features likely contribute to delayed diagnosis. Surveys of patients with documented RMSF or Lyme disease show that a large proportion of infections occur in patients who have no history of camping or hiking. Most people are not even aware that they have been harboring a feeding tick, as many ticks are quite small and attachment is painless. Because some ticks survive more than a year, they may stay alive in clothes and closets throughout the winter months and occasionally cause nonseasonal infections.
Geography and entomology matter; the matching of a specific tick vector to a specific disease is tight. With the slow migration of some tick species along with their nonhuman animal hosts into new territories due to temperature changes and urbanization, some diseases are appearing in areas of the country where they had not been previously diagnosed. We must be aware of these changes, and the US Centers for Disease Control and Prevention (CDC) offers useful updated infection maps on their website.
The diagnosis of acute infection is often delayed because of late consideration of the possibility of the disease. In addition, some tests are serologic and require the passage of time before a diagnostic result is obtained. But an increasing and distinct problem is the overdiagnosis and long-term treatment of some patients whose infection is undocumented, perpetuating concern over the unproven entity of chronic infection, the most prevalent being the diagnosis and treatment of “chronic Lyme disease.” Close attention must be paid to the manner of diagnosis and the specific tests used to purportedly confirm the diagnosis of infection. This has been an ongoing challenge in managing patients with chronic fatigue and malaise, a vexing and significant clinical problem without a ready solution in patients who have undergone an extensive evaluation. It is obviously tempting for patients to grasp at any “diagnostic” answer. But chronic and repeated therapy for nonexistent infection is not benign. The CDC has published lists of tests for Lyme disease in particular that are considered to have inadequately established accuracy and clinical utility; these include lymphocyte transformation tests, quantitative CD57 lymphocyte assays, and urinary antigen “capture assays.”
Recognizing and treating acute tickborne infections is crucial, as in distinguishing them from their mimics, which include some systemic autoimmune diseases. But we should not allow the fear of undertreatment of early infection to morph into unwarranted overtreatment of nonexistent chronic infection, just as we should not prematurely assume that ongoing symptoms of fatigue and malaise after a presumed tickborne infection are from the psychologically crippling fear of ongoing morbidity. Periodic reappraisal of the patient and his or her symptoms is warranted.
The transition from hospital to home can be overwhelming for caregivers.1 Stress of hospitalization coupled with the expectation of families to execute postdischarge care plans make understandable discharge communication critical. Communication failures, inadequate education, absence of caregiver confidence, and lack of clarity regarding care plans may prohibit smooth transitions and lead to adverse postdischarge outcomes.2-4
Health literacy plays a pivotal role in caregivers’ capacity to navigate the healthcare system, comprehend, and execute care plans. An estimated 90 million Americans have limited health literacy that may negatively impact the provision of safe and quality care5,6 and be a risk factor for poor outcomes, including increased emergency department (ED) utilization and readmission rates.7-9 Readability strongly influences the effectiveness of written materials.10 However, written medical information for patients and families are frequently between the 10th and 12th grade reading levels; more than 75% of all pediatric health information is written at or above 10th grade reading level.11 Government agencies recommend between a 6th and 8th grade reading level, for written material;5,12,13 written discharge instructions have been identified as an important quality metric for hospital-to-home transitions.14-16
At our center, we found that discharge instructions were commonly written at high reading levels and often incomplete.17 Poor discharge instructions may contribute to increased readmission rates and unnecessary ED visits.9,18 Our global aim targeted improved health-literate written information, including understandability and completeness.
Our specific aim was to increase the percentage of discharge instructions written at or below the 7th grade level for hospital medicine (HM) patients on a community hospital pediatric unit from 13% to 80% in 6 months.
METHODS
Context
The improvement work took place at a 42-bed inpatient pediatric unit at a community satellite of our large, urban, academic hospital. The unit is staffed by medical providers including attendings, fellows, nurse practitioners (NPs), and senior pediatric residents, and had more than 1000 HM discharges in fiscal year 2016. Children with common general pediatric diagnoses are admitted to this service; postsurgical patients are not admitted primarily to the HM service. In Cincinnati, the neighborhood-level high school drop-out rates are as high as 64%.19 Discharge instructions are written by medical providers in the electronic health record (EHR). A printed copy is given to families and verbally reviewed by a bedside nurse prior to discharge. Quality improvement (QI) efforts focused on discharge instructions were ignited by a prior review of 200 discharge instructions that showed they were difficult to read (median reading level of 10th grade), poorly understandable (36% of instructions met the threshold of understandability as measured by the Patient Education Materials Assessment Tool20) and were missing key elements of information.17
Improvement Team
The improvement team consisted of 4 pediatric hospitalists, 2 NPs, 1 nurse educator with health literacy expertise, 1 pediatric resident, 1 fourth-year medical student, 1 QI consultant, and 2 parents who had first-hand experience on the HM service. The improvement team observed the discharge process, including roles of the provider, nurse and family, outlined a process map, and created a modified failure mode and effect analysis.21 Prior to our work, discharge instructions written by providers often occurred as a last step, and the content was created as free text or from nonstandardized templates. Key drivers that informed interventions were determined and revised over time (Figure 1). The study was reviewed by our institutional review board and deemed not human subjects research.
Figure 1
Improvement Activities
Key drivers were identified, and interventions were executed using Plan-Do Study-Act cycles.22 The key drivers thought to be critical for the success of the QI efforts were family engagement; standardization of discharge instructions; medical staff engagement; and audit and feedback of data. The corresponding interventions were as follows:
Family Engagement
Understanding the discharge information families desired. Prior to testing, 10 families admitted to the HM service were asked about the discharge experience. We asked families about information they wanted in written discharge instructions: 1) reasons to call your primary doctor or return to the hospital; 2) when to see your primary doctor for a follow-up visit; 3) the phone number to reach your child’s doctor; 4) more information about why your child was admitted; 5) information about new medications; and 6) what to do to help your child continue to recover at home.
Development of templates. We engaged families throughout the process of creating general and disease-specific discharge templates. After a specific template was created and reviewed by the parents on our team, it was sent to members of the institutional Patient Education Committee, which includes parents and local health literacy experts, to review and critique. Feedback from the reviewers was incorporated into the templates prior to use in the EHR.
Postdischarge phone calls.A convenience sample of families discharged from the satellite campus was called 24 to 48 hours after discharge over a 2-week period in January, 2016. A member of our improvement team solicited feedback from families about the quality of the discharge instructions. Families were asked if discharge instructions were reviewed with them prior to going home, if they were given a copy of the instructions, how they would rate the ability to read and use the information, and if there were additional pieces of information that would have improved the instructions.
Standardization of Instructions
Education. A presentation was created and shared with medical providers; it was re-disseminated monthly to new residents rotating onto the service and to the attendings, fellows, and NPs scheduled for shifts during the month. This education continued for the duration of the study. The presentation included the definition of health literacy, scope of the problem, examples of poorly written discharge instructions, and tips on how to write readable and understandable instructions. Laminated cards that included tips on how to write instructions were also placed on work stations.
Figure 2Creation of discharge instruction templates in the EHR.A general discharge instruction template that was initially created and tested in the EHR (Figure 2) included text written below the 7th grade and employed 14 point font, bolded words for emphasis, and lists with bullet points. Asterisks were used to indicate where providers needed to include patient-specific information. The sections included in the general template were informed by feedback from providers and parents prior to testing, parents on the improvement team, and parents of patients admitted to our satellite campus. The sections reflect components critical to successful postdischarge care: discharge diagnosis and its brief description, postdischarge care information, new medications, signs and symptoms that would warrant escalation of care to the patient’s primary care provider or the ED, and follow-up instructions and contact information for the patent’s primary care doctor.
While the general template was an important first step, the content relied heavily on free text by providers, which could still lead to instructions written at a high reading level. Thus, disease-specific discharge instruction templates were created with prepopulated information that was written at a reading level at or below 7th grade level (Figure 2). The diseases were prioritized based on the most common diagnoses on our HM service. Each template included information under each of the subheadings noted in the general template. Twelve disease-specific templates were tested and ultimately embedded in the EHR; the general template remained for use when the discharge diagnosis was not covered by a disease-specific template.
Medical Staff Engagement
Previously described tests of change also aimed to enhance staff engagement. These included frequent e-mails, discussion of the QI efforts at specific team meetings, and the creation of visual cues posted at computer work stations, which prompted staff to begin to work on discharge instructions soon after admission.
Audit and Feedback of Data
Weekly phone calls. One team updated clinicians through a regularly scheduled bi-weekly phone conference. The phone conference was established prior to our work and was designed to relay pertinent information to attendings and NPs who work at the satellite hospital. During the phone conferences, clinicians were notified of current performance on discharge instruction readability and specific tests of change for the week. Additionally, providers gave feedback about the improvement efforts. These updates continued for the first 6 months of the project until sustained improvements were observed.
E-mails. Weekly e-mails were sent to all providers scheduled for clinical time at the satellite campus. The e-mail contained information on current tests of change, a list of discharge instruction templates that were available in the EHR, and the annotated run chart illustrating readability levels over time.
Additionally, individual e-mails were sent to each provider after review of the written discharge instructions for the week. Providers were given information on the number of discharge instructions they personally composed, the percentage of those instructions that were written at or below 7th grade level, and specific feedback on how their written instructions could be improved. We also encouraged feedback from each provider to better identify barriers to achieving our goal.
Study of the Interventions
Baseline data included a review of all instructions for patients discharged from the satellite campus from the end of April 2015 through mid-September 2015. The time period for testing of interventions during the fall and winter months allowed for rapid cycle learning due to higher patient census and predictability of admissions for specific diagnosis (ie, asthma and bronchiolitis). An automated report was generated from the EHR weekly with specific demographics and identifiers for patient discharged over the past 7 days, including patient age, gender, length of stay, discharge diagnosis, and insurance classification. Data was collected during the intervention period via structured review of the discharge instructions in the EHR by the principal investigator or a trained research coordinator. Discharge instructions for medically cleared mental health patients admitted to hospital medicine while awaiting psychiatric bed availability and patients and parents who were non-English speaking were excluded from review. All other instructions for patients discharged from the HM service at our Liberty Campus were included for review.
Measures
Readability, our primary measure of interest, was calculated using the mean score from the following formulas: Flesch Kincaid Grade Level,23 Simple Measure of Gobbledygook Index,24 Coleman-Liau Index,25 Gunning-Fog Index,26 and Automated Readability Index27 by means of an online platform (https://readability-score.com).28 This platform was chosen because it incorporated a variety of formulas, was user-friendly, and required minimal data cleaning. Each of the readability formulas have been used to assesses readability of health information given to patients and families.29,30 The threshold of 7th grade is in alignment with our institutional policy for educational materials and with recommendations from several government agencies.5,12
Analysis
A statistical process control p-chart was used to analyze our primary measure of readability, dichotomized as percent discharge instructions written at or below 7th grade level. Run charts were used to follow mean reading level of discharge instructions and our process measure of percent of discharge instruction written with a general or disease-specific standardized template. Run chart and control chart rules for identifying special cause were used for midline shifts.31
Table
RESULTS
The Table includes the demographic and clinical information of patients included in our analyses. Through sequential interventions, the percentage of discharge instructions written at or below 7th grade readability level increased from a mean of 13% to more than 80% in 3 months (Figure 3). Furthermore, the mean was sustained above 90% for 10 months and at 98% for the last 4 months. The use of 1 of the 13 EHR templates increased from 0% to 96% and was associated with the largest impact on the overall improvements (Supplemental Figure 1). Additionally, the average reading level of the discharge instructions decreased from 10th grade to 6th grade level (Supplemental Figure 2).
Figure 3
Qualitative comments from providers about the discharge instructions included:
“Are these [discharge instructions] available at base?? Great resource for interns.” “These [discharge] instructions make the [discharge] process so easy!!! Love these...” “Also feel like they have helped my discharge teaching in the room!”
Qualitative comments from families postdischarge included: “I thought the instructions were very clear and easy to read. I especially thought that highlighting the important areas really helped.” “I think this form looks great, and I really like the idea of having your child’s name on it.”
DISCUSSION
Through sequential Plan-Do Study-Act cycles, we increased the percentage of discharge instructions written at or below 7th grade reading level from 13% to 98%. Our most impactful intervention was the creation and dissemination of standardized disease-specific discharge instruction templates. Our findings complement evidence in the adult and pediatric literature that the use of standardized, disease-specific discharge instruction templates may improve readability of instructions.32,33 And, while quality improvement efforts have been employed to improve the discharge process for patients,34-36 this is the first study in the inpatient setting that, to our knowledge, specifically addresses discharge instructions using quality improvement methods.
Our work targeted the critical intersection between individual health literacy, an individual’s capacity to acquire, interpret, and use health information, and the necessary changes needed within our healthcare system to ensure that appropriately written instructions are given to patients and families.17,37 Our efforts focused on improving discharge instructions answer the call to consider health literacy a modifiable clinical risk factor.37 Furthermore, we address the 6 aims for quality healthcare delivery: 1) safe, timely, efficient and equitable delivery of care through the creation and dissemination of standardized instructions that are written at the appropriate reading level for families to ease hospital-to-home transitions and streamline the workflow of medical providers; 2) effective education of medical providers on health literacy concepts; and 3) family-centeredness through the involvement of families in our QI efforts. While previous QI efforts to improve hospital-to-home transitions have focused on medication reconciliation, communication with primary care physicians, follow-up appointments, and timely discharges of patients, none have specifically focused on the quality of discharge instructions.34-36
Most physicians do not receive education about how to write information that is readable and understandable; more than half of providers desired more education in this area.38 Furthermore, pediatric providers may overestimate parental health literacy levels,39 which may contribute to variability in the readability of written health materials. While education alone can contribute to a provider’s ability to create readable instructions, we note the improvement after the introduction of disease templates to demonstrate the importance of workflow-integrated higher reliability interventions to sustain improvements.
Our baseline poor readability rates were due to limited knowledge by frontline providers composing the instructions and a system in which an important element for successful hospital-to-home transitions was not tackled until patients were ready for discharge. Streamlining of the discharge process, including the creation of discharge instructions, may lead to improved efficiency, fewer discrepancies, more effective communication, and an enhanced family experience. Moreover, the success of our improvement work was due to key stakeholders, including parents, being a part of the team and the notable buy-in from providers.
Our work was not without limitations. We excluded non-English speaking families from the study. We were unable to measure reading level of our population directly and instead based our goals on national estimates. Our primary measure was readability, which is only 1 piece contributing to quality discharge instructions. Understandability and actionability are also important considerations; 17,20,29,40 however, improvements in these areas were limited by our design options within the EHR. Our efforts focused on children with common general pediatric diagnoses, and it is unclear how our interventions would generalize to medically complex patients with more volume of information to communicate at discharge and with uncommon diagnoses that are less readily incorporated into standardized templates. Relatedly, our work occurred at the satellite campus of our tertiary care center and may not represent generalizable material or methods to implement templates at our main campus location or at other hospitals. To begin to better understand this, we have spread to HM patients at our main campus, including medically complex patients with technology dependence and/or neurological impairments. Standardized, disease-specific templates most relevant to this population as well as several patient specific templates, for those with frequent readmissions due to medical complexity, have been created and are actively being tested.
CONCLUSION
In conclusion, in using interventions targeted at standardization of discharge instructions and timely feedback to staff, we saw rapid, dramatic, and sustained improvement in the readability of discharge instructions. Next steps include adaptation and spread to other patient populations and care teams, collaborations with other centers, and assessing the impact of effectively written discharge instructions on patient outcomes, such as adverse drug events, readmission rates, and family experience.
Disclosure
No external funding was secured for this study. Dr. Brady is supported by a Patient-Centered Outcomes Research Mentored Clinical Investigator Award from the Agency for Healthcare Research and Quality, Award Number K08HS023827. The content is solely the responsibility of the authors and does not necessarily represent the official views of the funding organizations. The funding organization had no role in the design, preparation, review, or approval of this paper; nor the decision to submit the manuscript for publication. The authors have no financial relationships relevant to this article to disclose.
1. Solan LG, Beck AF, Brunswick SA, et al. The family perspective on hospital to home transitions: a qualitative study. Pediatrics. 2015;136:e1539-e1549. PubMed 2. Engel KG, Buckley BA, Forth VE, et al. Patient understanding of emergency department discharge instructions: where are knowledge deficits greatest? Acad Emerg Med. 2012;19:E1035-E1044. PubMed 3. Ashbrook L, Mourad M, Sehgal N. Communicating discharge instructions to patients: a survey of nurse, intern, and hospitalist practices. J Hosp Med. 2013;8: 36-41. PubMed 4. Kripalani S, Jacobson TA, Mugalla IC, Cawthon CR, Niesner KJ, Vaccarino V. Health literacy and the quality of physician-patient communication during hospitalization. J Hosp Med. 2010;5:269-275. PubMed 5. Institute of Medicine Committee on Health Literacy. Kindig D, Alfonso D, Chudler E, et al, eds. Health Literacy: A Prescription to End Confusion. Washington, DC: National Academies Press; 2004. 6. Yin HS, Johnson M, Mendelsohn AL, Abrams MA, Sanders LM, Dreyer BP. The health literacy of parents in the United States: a nationally representative study. Pediatrics. 2009;124(suppl 3):S289-S298. PubMed 7. Rak EC, Hooper SR, Belsante MJ, et al. Caregiver word reading literacy and health outcomes among children treated in a pediatric nephrology practice. Clin Kid J. 2016;9:510-515. PubMed 8. Morrison AK, Schapira MM, Gorelick MH, Hoffmann RG, Brousseau DC. Low caregiver health literacy is associated with higher pediatric emergency department use and nonurgent visits. Acad Pediatr. 2014;14:309-314. PubMed 9. Howard-Anderson J, Busuttil A, Lonowski S, Vangala S, Afsar-Manesh N. From discharge to readmission: Understanding the process from the patient perspective. J Hosp Med. 2016;11:407-412. PubMed 10. Doak CC, Doak LG, Root JH. Teaching Patients with Low Literacy Skills. 2nd ed. Philadelphia PA: J.B. Lippincott; 1996. PubMed 11. Berkman ND, Sheridan SL, Donahue KE, et al. Health literacy interventions and outcomes: an updated systematic review. Evid Rep/Technol Assess. 2011;199:1-941. PubMed 12. Prevention CfDCa. Health Literacy for Public Health Professionals. In: Prevention CfDCa, ed. Atlanta, GA2009. 13. “What Did the Doctor Say?” Improving Health Literacy to Protect Patient Safety. Oakbrook Terrace, IL: The Joint Commission, 2007. 14. Desai AD, Burkhart Q, Parast L, et al. Development and pilot testing of caregiver- reported pediatric quality measures for transitions between sites of care. Acad Pediatr. 2016;16:760-769. PubMed 15. Leyenaar JK, Desai AD, Burkhart Q, et al. Quality measures to assess care transitions for hospitalized children. Pediatrics. 2016;138(2). PubMed 16. Akinsola B, Cheng J, Zmitrovich A, Khan N, Jain S. Improving discharge instructions in a pediatric emergency department: impact of a quality initiative. Pediatr Emerg Care. 2017;33:10-13. PubMed 17. Unaka NI, Statile AM, Haney J, Beck AF, Brady PW, Jerardi K. Assessment of the readability, understandability and completeness of pediatric hospital medicine discharge instructions J Hosp Med. In press. PubMed 18. Stella SA, Allyn R, Keniston A, et al. Postdischarge problems identified by telephone calls to an advice line. J Hosp Med. 2014;9:695-699. PubMed 19. Maloney M, Auffrey C. The social areas of Cincinnati. 20. The Patient Education Materials Assessment Tool (PEMAT) and User’s Guide: An Instrument To Assess the Understandability and Actionability of Print and Audiovisual Patient Education Materials. Available at: http://www.ahrq.gov/ professionals/prevention-chronic-care/improve/self-mgmt/pemat/index.html. Accessed November 27, 2013. 21. Cohen MR, Senders J, Davis NM. Failure mode and effects analysis: a novel approach to avoiding dangerous medication errors and accidents. Hosp Pharm. 1994;29:319-30. PubMed 22. Langley GJ, Moen R, Nolan KM, Nolan TW, Norman CL, Provost LP. The Improvement Guide: A Practical Approach to Enhancing Organizational Performance. San Franciso, CA: John Wiley & Sons; 2009. 23. Flesch R. A new readability yardstick. J Appl Psychol. 1948;32:221-233. PubMed 24. McLaughlin GH. SMOG grading-a new readability formula. J Reading. 1969;12:639-646. 25. Coleman M, Liau TL. A computer readability formula designed for machine scoring. J Appl Psych. 1975;60:283. 26. Gunning R. {The Technique of Clear Writing}. 1952. 27. Smith EA, Senter R. Automated readability index. AMRL-TR Aerospace Medical Research Laboratories (6570th) 1967:1. PubMed 28. How readable is your writing. 2011. https://readability-score.com. Accessed September 23, 2016. An Official Publication of the Society of Hospital Medicine Journal of Hospital Medicine Vol 12 | No 7 | July 2017 557 Improving Readability of Discharge Instructions | Unaka et al 29. Yin HS, Gupta RS, Tomopoulos S, et al. Readability, suitability, and characteristics of asthma action plans: examination of factors that may impair understanding. Pediatrics. 2013;131:e116-E126. PubMed 30. Brigo F, Otte WM, Igwe SC, Tezzon F, Nardone R. Clearly written, easily comprehended? The readability of websites providing information on epilepsy. Epilepsy Behav. 2015;44:35-39. PubMed 31. Benneyan JC. Use and interpretation of statistical quality control charts. Int J Qual Health Care. 1998;10:69-73. PubMed 32. Mueller SK, Giannelli K, Boxer R, Schnipper JL. Readability of patient discharge instructions with and without the use of electronically available disease-specific templates. J Am Med Inform Assoc. 2015;22:857-863. PubMed 33. Lauster CD, Gibson JM, DiNella JV, DiNardo M, Korytkowski MT, Donihi AC. Implementation of standardized instructions for insulin at hospital discharge. J Hosp Med. 2009;4:E41-E42. PubMed 34. Tuso P, Huynh DN, Garofalo L, et al. The readmission reduction program of Kaiser Permanente Southern California-knowledge transfer and performance improvement. Perm J. 2013;17:58-63. PubMed 35. White CM, Statile AM, White DL, et al. Using quality improvement to optimise paediatric discharge efficiency. BMJ Qual Saf. 2014;23:428-436. PubMed 36. Mussman GM, Vossmeyer MT, Brady PW, Warrick DM, Simmons JM, White CM. Improving the reliability of verbal communication between primary care physicians and pediatric hospitalists at hospital discharge. J Hosp Med. 2015;10:574- 580. PubMed 37. Rothman RL, Yin HS, Mulvaney S, Co JP, Homer C, Lannon C. Health literacy and quality: focus on chronic illness care and patient safety. Pediatrics 2009;124(suppl 3):S315-S326. PubMed 38. Turner T, Cull WL, Bayldon B, et al. Pediatricians and health literacy: descriptive results from a national survey. Pediatrics. 2009;124(suppl 3):S299-S305. PubMed 39. Harrington KF, Haven KM, Bailey WC, Gerald LB. Provider perceptions of parent health literacy and effect on asthma treatment: recommendations and instructions. Pediatr Allergy immunol Pulmonol. 2013;26:69-75. PubMed 40. Yin HS, Parker RM, Wolf MS, et al. Health literacy assessment of labeling of pediatric nonprescription medications: examination of characteristics that may impair parent understanding. Acad Pediatr. 2012;12:288-296. PubMed
The transition from hospital to home can be overwhelming for caregivers.1 Stress of hospitalization coupled with the expectation of families to execute postdischarge care plans make understandable discharge communication critical. Communication failures, inadequate education, absence of caregiver confidence, and lack of clarity regarding care plans may prohibit smooth transitions and lead to adverse postdischarge outcomes.2-4
Health literacy plays a pivotal role in caregivers’ capacity to navigate the healthcare system, comprehend, and execute care plans. An estimated 90 million Americans have limited health literacy that may negatively impact the provision of safe and quality care5,6 and be a risk factor for poor outcomes, including increased emergency department (ED) utilization and readmission rates.7-9 Readability strongly influences the effectiveness of written materials.10 However, written medical information for patients and families are frequently between the 10th and 12th grade reading levels; more than 75% of all pediatric health information is written at or above 10th grade reading level.11 Government agencies recommend between a 6th and 8th grade reading level, for written material;5,12,13 written discharge instructions have been identified as an important quality metric for hospital-to-home transitions.14-16
At our center, we found that discharge instructions were commonly written at high reading levels and often incomplete.17 Poor discharge instructions may contribute to increased readmission rates and unnecessary ED visits.9,18 Our global aim targeted improved health-literate written information, including understandability and completeness.
Our specific aim was to increase the percentage of discharge instructions written at or below the 7th grade level for hospital medicine (HM) patients on a community hospital pediatric unit from 13% to 80% in 6 months.
METHODS
Context
The improvement work took place at a 42-bed inpatient pediatric unit at a community satellite of our large, urban, academic hospital. The unit is staffed by medical providers including attendings, fellows, nurse practitioners (NPs), and senior pediatric residents, and had more than 1000 HM discharges in fiscal year 2016. Children with common general pediatric diagnoses are admitted to this service; postsurgical patients are not admitted primarily to the HM service. In Cincinnati, the neighborhood-level high school drop-out rates are as high as 64%.19 Discharge instructions are written by medical providers in the electronic health record (EHR). A printed copy is given to families and verbally reviewed by a bedside nurse prior to discharge. Quality improvement (QI) efforts focused on discharge instructions were ignited by a prior review of 200 discharge instructions that showed they were difficult to read (median reading level of 10th grade), poorly understandable (36% of instructions met the threshold of understandability as measured by the Patient Education Materials Assessment Tool20) and were missing key elements of information.17
Improvement Team
The improvement team consisted of 4 pediatric hospitalists, 2 NPs, 1 nurse educator with health literacy expertise, 1 pediatric resident, 1 fourth-year medical student, 1 QI consultant, and 2 parents who had first-hand experience on the HM service. The improvement team observed the discharge process, including roles of the provider, nurse and family, outlined a process map, and created a modified failure mode and effect analysis.21 Prior to our work, discharge instructions written by providers often occurred as a last step, and the content was created as free text or from nonstandardized templates. Key drivers that informed interventions were determined and revised over time (Figure 1). The study was reviewed by our institutional review board and deemed not human subjects research.
Figure 1
Improvement Activities
Key drivers were identified, and interventions were executed using Plan-Do Study-Act cycles.22 The key drivers thought to be critical for the success of the QI efforts were family engagement; standardization of discharge instructions; medical staff engagement; and audit and feedback of data. The corresponding interventions were as follows:
Family Engagement
Understanding the discharge information families desired. Prior to testing, 10 families admitted to the HM service were asked about the discharge experience. We asked families about information they wanted in written discharge instructions: 1) reasons to call your primary doctor or return to the hospital; 2) when to see your primary doctor for a follow-up visit; 3) the phone number to reach your child’s doctor; 4) more information about why your child was admitted; 5) information about new medications; and 6) what to do to help your child continue to recover at home.
Development of templates. We engaged families throughout the process of creating general and disease-specific discharge templates. After a specific template was created and reviewed by the parents on our team, it was sent to members of the institutional Patient Education Committee, which includes parents and local health literacy experts, to review and critique. Feedback from the reviewers was incorporated into the templates prior to use in the EHR.
Postdischarge phone calls.A convenience sample of families discharged from the satellite campus was called 24 to 48 hours after discharge over a 2-week period in January, 2016. A member of our improvement team solicited feedback from families about the quality of the discharge instructions. Families were asked if discharge instructions were reviewed with them prior to going home, if they were given a copy of the instructions, how they would rate the ability to read and use the information, and if there were additional pieces of information that would have improved the instructions.
Standardization of Instructions
Education. A presentation was created and shared with medical providers; it was re-disseminated monthly to new residents rotating onto the service and to the attendings, fellows, and NPs scheduled for shifts during the month. This education continued for the duration of the study. The presentation included the definition of health literacy, scope of the problem, examples of poorly written discharge instructions, and tips on how to write readable and understandable instructions. Laminated cards that included tips on how to write instructions were also placed on work stations.
Figure 2Creation of discharge instruction templates in the EHR.A general discharge instruction template that was initially created and tested in the EHR (Figure 2) included text written below the 7th grade and employed 14 point font, bolded words for emphasis, and lists with bullet points. Asterisks were used to indicate where providers needed to include patient-specific information. The sections included in the general template were informed by feedback from providers and parents prior to testing, parents on the improvement team, and parents of patients admitted to our satellite campus. The sections reflect components critical to successful postdischarge care: discharge diagnosis and its brief description, postdischarge care information, new medications, signs and symptoms that would warrant escalation of care to the patient’s primary care provider or the ED, and follow-up instructions and contact information for the patent’s primary care doctor.
While the general template was an important first step, the content relied heavily on free text by providers, which could still lead to instructions written at a high reading level. Thus, disease-specific discharge instruction templates were created with prepopulated information that was written at a reading level at or below 7th grade level (Figure 2). The diseases were prioritized based on the most common diagnoses on our HM service. Each template included information under each of the subheadings noted in the general template. Twelve disease-specific templates were tested and ultimately embedded in the EHR; the general template remained for use when the discharge diagnosis was not covered by a disease-specific template.
Medical Staff Engagement
Previously described tests of change also aimed to enhance staff engagement. These included frequent e-mails, discussion of the QI efforts at specific team meetings, and the creation of visual cues posted at computer work stations, which prompted staff to begin to work on discharge instructions soon after admission.
Audit and Feedback of Data
Weekly phone calls. One team updated clinicians through a regularly scheduled bi-weekly phone conference. The phone conference was established prior to our work and was designed to relay pertinent information to attendings and NPs who work at the satellite hospital. During the phone conferences, clinicians were notified of current performance on discharge instruction readability and specific tests of change for the week. Additionally, providers gave feedback about the improvement efforts. These updates continued for the first 6 months of the project until sustained improvements were observed.
E-mails. Weekly e-mails were sent to all providers scheduled for clinical time at the satellite campus. The e-mail contained information on current tests of change, a list of discharge instruction templates that were available in the EHR, and the annotated run chart illustrating readability levels over time.
Additionally, individual e-mails were sent to each provider after review of the written discharge instructions for the week. Providers were given information on the number of discharge instructions they personally composed, the percentage of those instructions that were written at or below 7th grade level, and specific feedback on how their written instructions could be improved. We also encouraged feedback from each provider to better identify barriers to achieving our goal.
Study of the Interventions
Baseline data included a review of all instructions for patients discharged from the satellite campus from the end of April 2015 through mid-September 2015. The time period for testing of interventions during the fall and winter months allowed for rapid cycle learning due to higher patient census and predictability of admissions for specific diagnosis (ie, asthma and bronchiolitis). An automated report was generated from the EHR weekly with specific demographics and identifiers for patient discharged over the past 7 days, including patient age, gender, length of stay, discharge diagnosis, and insurance classification. Data was collected during the intervention period via structured review of the discharge instructions in the EHR by the principal investigator or a trained research coordinator. Discharge instructions for medically cleared mental health patients admitted to hospital medicine while awaiting psychiatric bed availability and patients and parents who were non-English speaking were excluded from review. All other instructions for patients discharged from the HM service at our Liberty Campus were included for review.
Measures
Readability, our primary measure of interest, was calculated using the mean score from the following formulas: Flesch Kincaid Grade Level,23 Simple Measure of Gobbledygook Index,24 Coleman-Liau Index,25 Gunning-Fog Index,26 and Automated Readability Index27 by means of an online platform (https://readability-score.com).28 This platform was chosen because it incorporated a variety of formulas, was user-friendly, and required minimal data cleaning. Each of the readability formulas have been used to assesses readability of health information given to patients and families.29,30 The threshold of 7th grade is in alignment with our institutional policy for educational materials and with recommendations from several government agencies.5,12
Analysis
A statistical process control p-chart was used to analyze our primary measure of readability, dichotomized as percent discharge instructions written at or below 7th grade level. Run charts were used to follow mean reading level of discharge instructions and our process measure of percent of discharge instruction written with a general or disease-specific standardized template. Run chart and control chart rules for identifying special cause were used for midline shifts.31
Table
RESULTS
The Table includes the demographic and clinical information of patients included in our analyses. Through sequential interventions, the percentage of discharge instructions written at or below 7th grade readability level increased from a mean of 13% to more than 80% in 3 months (Figure 3). Furthermore, the mean was sustained above 90% for 10 months and at 98% for the last 4 months. The use of 1 of the 13 EHR templates increased from 0% to 96% and was associated with the largest impact on the overall improvements (Supplemental Figure 1). Additionally, the average reading level of the discharge instructions decreased from 10th grade to 6th grade level (Supplemental Figure 2).
Figure 3
Qualitative comments from providers about the discharge instructions included:
“Are these [discharge instructions] available at base?? Great resource for interns.” “These [discharge] instructions make the [discharge] process so easy!!! Love these...” “Also feel like they have helped my discharge teaching in the room!”
Qualitative comments from families postdischarge included: “I thought the instructions were very clear and easy to read. I especially thought that highlighting the important areas really helped.” “I think this form looks great, and I really like the idea of having your child’s name on it.”
DISCUSSION
Through sequential Plan-Do Study-Act cycles, we increased the percentage of discharge instructions written at or below 7th grade reading level from 13% to 98%. Our most impactful intervention was the creation and dissemination of standardized disease-specific discharge instruction templates. Our findings complement evidence in the adult and pediatric literature that the use of standardized, disease-specific discharge instruction templates may improve readability of instructions.32,33 And, while quality improvement efforts have been employed to improve the discharge process for patients,34-36 this is the first study in the inpatient setting that, to our knowledge, specifically addresses discharge instructions using quality improvement methods.
Our work targeted the critical intersection between individual health literacy, an individual’s capacity to acquire, interpret, and use health information, and the necessary changes needed within our healthcare system to ensure that appropriately written instructions are given to patients and families.17,37 Our efforts focused on improving discharge instructions answer the call to consider health literacy a modifiable clinical risk factor.37 Furthermore, we address the 6 aims for quality healthcare delivery: 1) safe, timely, efficient and equitable delivery of care through the creation and dissemination of standardized instructions that are written at the appropriate reading level for families to ease hospital-to-home transitions and streamline the workflow of medical providers; 2) effective education of medical providers on health literacy concepts; and 3) family-centeredness through the involvement of families in our QI efforts. While previous QI efforts to improve hospital-to-home transitions have focused on medication reconciliation, communication with primary care physicians, follow-up appointments, and timely discharges of patients, none have specifically focused on the quality of discharge instructions.34-36
Most physicians do not receive education about how to write information that is readable and understandable; more than half of providers desired more education in this area.38 Furthermore, pediatric providers may overestimate parental health literacy levels,39 which may contribute to variability in the readability of written health materials. While education alone can contribute to a provider’s ability to create readable instructions, we note the improvement after the introduction of disease templates to demonstrate the importance of workflow-integrated higher reliability interventions to sustain improvements.
Our baseline poor readability rates were due to limited knowledge by frontline providers composing the instructions and a system in which an important element for successful hospital-to-home transitions was not tackled until patients were ready for discharge. Streamlining of the discharge process, including the creation of discharge instructions, may lead to improved efficiency, fewer discrepancies, more effective communication, and an enhanced family experience. Moreover, the success of our improvement work was due to key stakeholders, including parents, being a part of the team and the notable buy-in from providers.
Our work was not without limitations. We excluded non-English speaking families from the study. We were unable to measure reading level of our population directly and instead based our goals on national estimates. Our primary measure was readability, which is only 1 piece contributing to quality discharge instructions. Understandability and actionability are also important considerations; 17,20,29,40 however, improvements in these areas were limited by our design options within the EHR. Our efforts focused on children with common general pediatric diagnoses, and it is unclear how our interventions would generalize to medically complex patients with more volume of information to communicate at discharge and with uncommon diagnoses that are less readily incorporated into standardized templates. Relatedly, our work occurred at the satellite campus of our tertiary care center and may not represent generalizable material or methods to implement templates at our main campus location or at other hospitals. To begin to better understand this, we have spread to HM patients at our main campus, including medically complex patients with technology dependence and/or neurological impairments. Standardized, disease-specific templates most relevant to this population as well as several patient specific templates, for those with frequent readmissions due to medical complexity, have been created and are actively being tested.
CONCLUSION
In conclusion, in using interventions targeted at standardization of discharge instructions and timely feedback to staff, we saw rapid, dramatic, and sustained improvement in the readability of discharge instructions. Next steps include adaptation and spread to other patient populations and care teams, collaborations with other centers, and assessing the impact of effectively written discharge instructions on patient outcomes, such as adverse drug events, readmission rates, and family experience.
Disclosure
No external funding was secured for this study. Dr. Brady is supported by a Patient-Centered Outcomes Research Mentored Clinical Investigator Award from the Agency for Healthcare Research and Quality, Award Number K08HS023827. The content is solely the responsibility of the authors and does not necessarily represent the official views of the funding organizations. The funding organization had no role in the design, preparation, review, or approval of this paper; nor the decision to submit the manuscript for publication. The authors have no financial relationships relevant to this article to disclose.
References
1. Solan LG, Beck AF, Brunswick SA, et al. The family perspective on hospital to home transitions: a qualitative study. Pediatrics. 2015;136:e1539-e1549. PubMed 2. Engel KG, Buckley BA, Forth VE, et al. Patient understanding of emergency department discharge instructions: where are knowledge deficits greatest? Acad Emerg Med. 2012;19:E1035-E1044. PubMed 3. Ashbrook L, Mourad M, Sehgal N. Communicating discharge instructions to patients: a survey of nurse, intern, and hospitalist practices. J Hosp Med. 2013;8: 36-41. PubMed 4. Kripalani S, Jacobson TA, Mugalla IC, Cawthon CR, Niesner KJ, Vaccarino V. Health literacy and the quality of physician-patient communication during hospitalization. J Hosp Med. 2010;5:269-275. PubMed 5. Institute of Medicine Committee on Health Literacy. Kindig D, Alfonso D, Chudler E, et al, eds. Health Literacy: A Prescription to End Confusion. Washington, DC: National Academies Press; 2004. 6. Yin HS, Johnson M, Mendelsohn AL, Abrams MA, Sanders LM, Dreyer BP. The health literacy of parents in the United States: a nationally representative study. Pediatrics. 2009;124(suppl 3):S289-S298. PubMed 7. Rak EC, Hooper SR, Belsante MJ, et al. Caregiver word reading literacy and health outcomes among children treated in a pediatric nephrology practice. Clin Kid J. 2016;9:510-515. PubMed 8. Morrison AK, Schapira MM, Gorelick MH, Hoffmann RG, Brousseau DC. Low caregiver health literacy is associated with higher pediatric emergency department use and nonurgent visits. Acad Pediatr. 2014;14:309-314. PubMed 9. Howard-Anderson J, Busuttil A, Lonowski S, Vangala S, Afsar-Manesh N. From discharge to readmission: Understanding the process from the patient perspective. J Hosp Med. 2016;11:407-412. PubMed 10. Doak CC, Doak LG, Root JH. Teaching Patients with Low Literacy Skills. 2nd ed. Philadelphia PA: J.B. Lippincott; 1996. PubMed 11. Berkman ND, Sheridan SL, Donahue KE, et al. Health literacy interventions and outcomes: an updated systematic review. Evid Rep/Technol Assess. 2011;199:1-941. PubMed 12. Prevention CfDCa. Health Literacy for Public Health Professionals. In: Prevention CfDCa, ed. Atlanta, GA2009. 13. “What Did the Doctor Say?” Improving Health Literacy to Protect Patient Safety. Oakbrook Terrace, IL: The Joint Commission, 2007. 14. Desai AD, Burkhart Q, Parast L, et al. Development and pilot testing of caregiver- reported pediatric quality measures for transitions between sites of care. Acad Pediatr. 2016;16:760-769. PubMed 15. Leyenaar JK, Desai AD, Burkhart Q, et al. Quality measures to assess care transitions for hospitalized children. Pediatrics. 2016;138(2). PubMed 16. Akinsola B, Cheng J, Zmitrovich A, Khan N, Jain S. Improving discharge instructions in a pediatric emergency department: impact of a quality initiative. Pediatr Emerg Care. 2017;33:10-13. PubMed 17. Unaka NI, Statile AM, Haney J, Beck AF, Brady PW, Jerardi K. Assessment of the readability, understandability and completeness of pediatric hospital medicine discharge instructions J Hosp Med. In press. PubMed 18. Stella SA, Allyn R, Keniston A, et al. Postdischarge problems identified by telephone calls to an advice line. J Hosp Med. 2014;9:695-699. PubMed 19. Maloney M, Auffrey C. The social areas of Cincinnati. 20. The Patient Education Materials Assessment Tool (PEMAT) and User’s Guide: An Instrument To Assess the Understandability and Actionability of Print and Audiovisual Patient Education Materials. Available at: http://www.ahrq.gov/ professionals/prevention-chronic-care/improve/self-mgmt/pemat/index.html. Accessed November 27, 2013. 21. Cohen MR, Senders J, Davis NM. Failure mode and effects analysis: a novel approach to avoiding dangerous medication errors and accidents. Hosp Pharm. 1994;29:319-30. PubMed 22. Langley GJ, Moen R, Nolan KM, Nolan TW, Norman CL, Provost LP. The Improvement Guide: A Practical Approach to Enhancing Organizational Performance. San Franciso, CA: John Wiley & Sons; 2009. 23. Flesch R. A new readability yardstick. J Appl Psychol. 1948;32:221-233. PubMed 24. McLaughlin GH. SMOG grading-a new readability formula. J Reading. 1969;12:639-646. 25. Coleman M, Liau TL. A computer readability formula designed for machine scoring. J Appl Psych. 1975;60:283. 26. Gunning R. {The Technique of Clear Writing}. 1952. 27. Smith EA, Senter R. Automated readability index. AMRL-TR Aerospace Medical Research Laboratories (6570th) 1967:1. PubMed 28. How readable is your writing. 2011. https://readability-score.com. Accessed September 23, 2016. An Official Publication of the Society of Hospital Medicine Journal of Hospital Medicine Vol 12 | No 7 | July 2017 557 Improving Readability of Discharge Instructions | Unaka et al 29. Yin HS, Gupta RS, Tomopoulos S, et al. Readability, suitability, and characteristics of asthma action plans: examination of factors that may impair understanding. Pediatrics. 2013;131:e116-E126. PubMed 30. Brigo F, Otte WM, Igwe SC, Tezzon F, Nardone R. Clearly written, easily comprehended? The readability of websites providing information on epilepsy. Epilepsy Behav. 2015;44:35-39. PubMed 31. Benneyan JC. Use and interpretation of statistical quality control charts. Int J Qual Health Care. 1998;10:69-73. PubMed 32. Mueller SK, Giannelli K, Boxer R, Schnipper JL. Readability of patient discharge instructions with and without the use of electronically available disease-specific templates. J Am Med Inform Assoc. 2015;22:857-863. PubMed 33. Lauster CD, Gibson JM, DiNella JV, DiNardo M, Korytkowski MT, Donihi AC. Implementation of standardized instructions for insulin at hospital discharge. J Hosp Med. 2009;4:E41-E42. PubMed 34. Tuso P, Huynh DN, Garofalo L, et al. The readmission reduction program of Kaiser Permanente Southern California-knowledge transfer and performance improvement. Perm J. 2013;17:58-63. PubMed 35. White CM, Statile AM, White DL, et al. Using quality improvement to optimise paediatric discharge efficiency. BMJ Qual Saf. 2014;23:428-436. PubMed 36. Mussman GM, Vossmeyer MT, Brady PW, Warrick DM, Simmons JM, White CM. Improving the reliability of verbal communication between primary care physicians and pediatric hospitalists at hospital discharge. J Hosp Med. 2015;10:574- 580. PubMed 37. Rothman RL, Yin HS, Mulvaney S, Co JP, Homer C, Lannon C. Health literacy and quality: focus on chronic illness care and patient safety. Pediatrics 2009;124(suppl 3):S315-S326. PubMed 38. Turner T, Cull WL, Bayldon B, et al. Pediatricians and health literacy: descriptive results from a national survey. Pediatrics. 2009;124(suppl 3):S299-S305. PubMed 39. Harrington KF, Haven KM, Bailey WC, Gerald LB. Provider perceptions of parent health literacy and effect on asthma treatment: recommendations and instructions. Pediatr Allergy immunol Pulmonol. 2013;26:69-75. PubMed 40. Yin HS, Parker RM, Wolf MS, et al. Health literacy assessment of labeling of pediatric nonprescription medications: examination of characteristics that may impair parent understanding. Acad Pediatr. 2012;12:288-296. PubMed
*Address for correspondence and reprint requests: Ndidi I. Unaka, Division of Hospital Medicine, Cincinnati Children’s Hospital Medical Center, 3333 Burnet Ave., ML 5018, Cincinnati, OH 45229; Telephone: 513-636-8354; Fax: 513-636-7905; E-mail: [email protected]
Content Gating
Open Access (article Unlocked/Open Access)
Alternative CME
Disqus Comments
Default
Consolidated Pubs: Do Not Show Source Publication Logo
The odds are high that practitioners who manage patients with diabetes are also managing patients who are overweight or obese. The numbers are staggering: more than two-thirds of American adults with type 2 diabetes are obese, and the need to address these dual epidemics is clear. Many strategies exist, but how does a practitioner select the best option for an individual patient? This Cleveland Clinic Journal of Medicine supplement on diabetes and obesity includes articles by experts who review the evidence on the impact of different diets and exercise and the use of “weight-friendly” diabetes medications, drug therapy, and metabolic surgery in managing obesity in patients with diabetes.
For some patients with type 2 diabetes, changes in diet and exercise are beneficial in managing the disease and can lead to weight loss. Diets abound, but what diets are best, particularly for patients with obesity? Zahrae Sandouk, MD, and I review several popular diets and what is known about their effects on weight loss, glycemic control, and cardiovascular risk.
As for exercise, both aerobic and resistance training are essential to improve glucose regulation and cardiovascular health. John P. Kirwan, PhD, Jessica Sacks, and Stephan Nieuwoudt review exercise recommendations, modalities, and the metabolic benefits of exercise for this patient population.
Drug therapy typically focuses on the diabetes side of the coin and not necessarily the obesity side; however, practitioners are increasingly helping patients establish goals on both fronts. To that end, Mary Angelynne Esquivel, MD, and I discuss medications for treatment of type 2 diabetes that also have weight loss as a side effect, including glucagon-like peptide-1 receptor agonists, sodium-glucose cotransporter-2 inhibitors, neuroendocrine peptide hormones, alpha-glucosidase inhibitors, and metformin.
The heightened focus on addressing obesity warrants consideration of medications for weight loss. Bartolome Burguera, MD, PhD, Khawla F. Ali, MD, and Juan P. Brito, MD, discuss a potential shift in thinking: using antiobesity drugs to manage type 2 diabetes. The authors review pharmacologic therapies approved for managing obesity in the context of diabetes.
While initially used for patients with severe obesity, bariatric surgery is now called metabolic surgery when used for type 2 diabetes because of its dramatic impact in reversing type 2 diabetes. Philip R. Schauer, MD, Zubaidah Nor Hanipah, MD, and Francesco Rubino, MD, describe the benefits of metabolic surgery and review the evidence that led diabetes organizations to set new guidelines with a lower body mass index threshold than previously recommended.
The dual epidemics of diabetes and obesity present physicians with a complex set of considerations to help patients achieve their treatment goals on both fronts in the battle. I hope you find this supplement on diabetes and obesity informative and useful to you to enhance patient care.
According to National Health and Nutrition Examination Survey data, more than one-third of adults in the United States are obese and more than two-thirds of adults with type 2 diabetes mellitus (DM) are obese.1 In light of overall increased life expectancy, the Centers for Disease Control and Prevention estimates that adults in the United States have a 40% lifetime risk of developing diabetes, as diabetes and obesity remain at epidemic levels.2
Weight loss in individuals who are overweight or obese is effective in preventing type 2 DM and improving management of the disease.3,4 Dietary changes play a central role in achieving weight loss, as do other important lifestyle interventions such as exercise, behavior modification, and pharmacotherapy. Achieving glycemic goals with diet alone is difficult, and for patients with DM who are also obese, it may be even more challenging.
Medical nutrition therapy, a term coined by the American Dietetic Association, describes an approach to treating medical conditions using specific diets. As developed and monitored by a physician and registered dietitian, diet can result in beneficial outcomes and is a front-line approach for patients with noninsulin-dependent diabetes.5 Medical nutrition therapy for patients with type 2 DM is most effective when used within 1 year of diagnosis and is associated with a 0.5% to 2% decrease in hemoglobin A1c (HbA1c) levels.6 This article reviews the role of diet in managing patients with both type 2 DM and obesity. Several diets are presented including what is known about their effect on weight loss, glycemic control, and cardiovascular risk prevention in patients with diabetes and obesity.
WEIGHT LOSS AND DIET FOR PATIENTS WITH OBESITY AND DIABETES
A person is overweight or obese if he or she weighs more than the ideal weight for their height as calculated by the body mass index (BMI; weight in kg/height in meters squared). A BMI of 25 to 30 is overweight and a BMI of 30 or greater is obese.7 The recommended daily caloric intake for adults is based on sex, age, and daily activity level and ranges from 1,600 to 2,000 calories per day for women and 2,000 to 2,600 calories per day for men. The lower end of the range is for sedentary adults, and the higher end is for active adults (walking 1.5 to 3 miles per day at 3 to 4 miles per hour, in addition to independent living).8
According to the American Diabetes Association (ADA), weight loss requires reducing dietary intake by 500 to 750 calories per day, or roughly 1,200 to 1,500 kcal/day for women and 1,500 to 1,800 kcal/day for men.3 For patients with obesity and type 2 DM, sustained, modest weight loss of 5% of initial body weight improves glycemic control and reduces the need for diabetes medications.9 Weight loss of greater than 5% body weight also improves lipid and blood pressure status in patients with obesity and diabetes, though ideally, patients are encouraged to achieve weight reduction of 7% or greater.10
Evidence of benefits from lifestyle and dietary modifications
The fact that patients with obesity and type 2 DM have increased risk of cardiovascular morbidity and mortality is well established.11 Multiple studies considered the effects of weight loss on cardiovascular morbidity and mortality. Our article focuses on dietary modifications, though most large, multicenter trials used both diet and increased physical activity to achieve weight loss. It is difficult to determine if diet or physical activity had the most effect on outcomes; however, results show that weight loss from dietary and other lifestyle interventions leads to change in outcomes.
Look AHEAD (Action for Health in Diabetes) trial. This large, multicenter, randomized controlled trial evaluated the effect of weight loss on cardiovascular morbidity and mortality in overweight or obese adults with type 2 DM. The 5,145 participants were assigned either to a long-term weight reduction intensive lifestyle intervention of diet, physical activity, and behavior modification or to usual care of support and education. At 1 year, the lifestyle intervention group had greater weight loss, improved fitness, decreased number of diabetes medications, decreased blood pressure, and improved biomarkers of glucose and lipid control compared with the usual care group.12 No significant reductions in cardiovascular morbidity and mortality were found, though an observational post hoc analysis of the Look AHEAD data suggested an association between the magnitude of weight loss and the incidence of cardiovascular disease.13
The diet portion of the intensive lifestyle intervention consisted of self-selected, conventional foods while recording dietary intake during week 1. In week 2, patients weighing less than 114 kg (250 lbs) restricted their intake to 1,200 to 1,500 kcal/day, and patients weighing 114 kg or more restricted their intake to 1,500 to 1,800 kcal/day. Fewer than 30% of calories were from fat, with less than 10% from saturated fat. During week 3 through week 9, meal replacement options and conventional foods were used to reach caloric goals. Participants then decreased the use of meal replacement and increased the use of conventional foods during week 20 through week 22.14
The mean weight loss for participants in the intensive lifestyle intervention group was 8.6% compared with 0.7% in the support and education group (P < .001). HbA1c decreased by 0.7% in the intervention group compared with 0.1% the support and education group (P < .001).12
Finnish Diabetes Prevention Study. This study evaluated lifestyle changes in diet and physical activity in the prevention of type 2 DM in participants with impaired glucose intolerance. Participants (N = 552) were randomly assigned to the control group or the intervention group where detailed instruction was provided to achieve weight loss of greater than 5%.15 The dietary goals included fewer than 30% of total calories from fat, with fewer than 10% from saturated fat, increased fiber consumption (15 g per 1,000 kcal), and physical activity of 30 minutes daily.15 During the trial (mean duration of follow-up 3.2 years), the risk of type 2 DM was reduced by 58% in the intervention group compared with the control group.15
Diabetes Prevention Program Research Group. A landmark study by the Diabetes Prevention Program Research Group randomized 3,234 participates with elevated plasma glucose levels to placebo, metformin, and lifestyle intervention arms.4 Those in the lifestyle intervention arm were educated about ways to achieve and maintain a 7% or greater reduction in body weight using a low-calorie, low-fat diet and moderate physical activity. Results based on a mean follow-up of 2.8 years found a 58% reduction in the incidence of diabetes for those in the lifestyle intervention arm.4
DIETS AND THEIR EFFECTS ON OBESITY, DIABETES, AND CARDIOVASCULAR RISK
When patients seek consultation about diet, they frequently ask about specific types of popular diets, not the very controlled diets employed in research studies. Dietary preferences are personal, so patients may have researched a particular diet or feel that they will be more adherent if only 1 or 2 components of their meals are changed. There is no single optimal dietary strategy for patients with both obesity and type 2 DM. In general, diets are categorized based on the 3 basic macronutrients: carbohydrate, fat, and protein. We will review several popular diets, delineating content, effects on weight loss, glycemic control, and cardiovascular factors.
LOW-CARBOHYDRATE DIET
Carbohydrates are organic compounds in food that include sugars and starches and are a source of energy for cells in the body and the brain in particular. The US Department of Agriculture Recommended Dietary Allowance of carbohydrate is 130 g per day minimum or 45% to 65% of total daily caloric intake.16 For a 1,700-calorie diet, 130 g of carbohydrate is 30% of the total caloric intake; in a 1,200-calorie diet, it is 43%.17
In practice, the median intake of carbohydrates for US adults is much higher, at 220 to 330 g per day for men and 180 to 230 g per day for women.16 The ADA recommends that all Americans consume fewer refined carbohydrates and added sugars in favor of whole grains, legumes, vegetables, and fruit.18
Low-carbohydrate diets focus on reducing carbohydrate intake with the thought that fewer carbohydrates are better. However, the definition of a low-carbohydrate diet varies. In most studies, carbohydrate intake was limited to less than 20 g to 120 g daily or fewer than 4% to 45% of the total calories consumed.17,19 Intake of fat and total calories is unlimited, though unsaturated fats are preferred over saturated or trans fats.
Limiting the intake of disaccharide sugar in the form of sucrose and high-fructose corn syrup is endorsed because of concerns that these sugars are rapidly digested, absorbed, and fully metabolized. However, several randomized trials showed that substituting sucrose for equal amounts of other types of carbohydrates in individuals with type 2 DM showed no difference in glycemic response.20 The resulting conclusion is that the postprandial glycemic response is mainly driven by the amount rather than the type of carbohydrates. The consumption of sugar-sweetened beverages is associated with obesity and an increased risk of diabetes, attributed to the high caloric intake and decreased insulin sensitivity associated with these beverages.21
Of the 2 monosaccharides, glucose and fructose, that make up sucrose, fructose is metabolized in the liver. The rapid metabolism of fructose may lead to alterations in lipid metabolism and affect insulin sensitivity.22 While the ADA does not advise against consuming fructose, it does advise limiting its use due to the caloric density of many foods containing fructose.
Multiple studies have investigated the effect of a low-carbohydrate diet on weight loss, glucose control, and cardiovascular risk, but comparing the results is difficult due to the varying definitions of a low-carbohydrate diet.
Low-carbohydrate diets are associated with rapid weight loss. A 6-month study of 31 patients with obesity and type 2 DM found a mean weight change of −11.4 kg (± 4 kg) in the low-carbohydrate group compared with −1.8 kg (± 3.8 kg) in the high-carbohydrate control group, a loss maintained up to 1 year.23 Another study of 88 patients with type 2 DM who consumed less than 40 g/day of carbohydrate had a weight loss of 7.2 kg over 12 months.24 Samaha et al25 compared a low-carbohydrate diet with a low-fat diet in 132 participants with obesity (mean BMI 43), of which 39% had diabetes and 43% had metabolic syndrome. Those in the low-carbohydrate diet group had significantly more weight loss over a period of 6 months (−5.8 kg mean, ± 8.6 kg standard deviation [SD] vs −1.9 kg mean ± 4.2 kg SD, P = .002). However, at 1 year, there was no significant difference in weight loss between groups. At 36 months, weight regain was 2.2 kg (SD 12.3 kg) less than baseline in the low-carbohydrate group compared with 4.3 kg (SD 12.2 kg) less than baseline in the low-fat group (P = .071).25,26 On the other hand, a meta-analysis of 23 randomized trials involving 2,788 participants found no difference in weight loss at 6 months between those on a low-carbohydrate diet and those on a low-fat diet.19
With respect to glucose control, low-carbohydrate diets have been associated with a 1.4% (SD ± 1.1%)decrease in HbA1c during a 6-month period in 31 patients with obesity and type 2 DM.23 Another 6-month study of 206 patients with obesity and diabetes comparing a low-carbohydrate diet with a low-calorie diet found no significant difference in HbA1c (−0.48% vs −0.24%, respectively) and a weight loss of 1.34 kg vs 3.77 kg, respectively (P < .001).27 The change in glycemic control did not persist over time, perhaps due to the weight regain associated with this diet. A meta-analysis concluded that HbA1c was reduced more in patients with type 2 DM randomized to a lower-carbohydrate diet compared with a higher-carbohydrate diet (mean change from baseline 0% to −2.2%).17
No studies of the effects of a low-carbohydrate diet on overall cardiovascular morbidity or mortality exist. However, Kirk et al17 reported results of a low-carbohydrate diet on cardiovascular risk factors such as lipid profiles and showed a significant reduction in triglyceride levels but no effect on total cholesterol, high-density lipoprotein cholesterol (HDL-C), or low-density lipoprotein cholesterol (LDL-C) levels.
The ADA has reported that low-carbohydrate diets may be effective in the management of type 2 DM in the short term. Caution is warranted because they could eliminate important sources of energy, fiber, vitamins, and minerals. It is also important to monitor lipid profile, renal function, and protein intake in certain patients, especially those with renal dysfunction.6
LOW-GLYCEMIC DIET
The glycemic index (GI) is a measure of the rise in plasma glucose 2 hours after ingesting carbohydrate in food compared with a reference food such as glucose that contains an equivalent amount of carbohydrate. The GI measures the postprandial response of different carbohydrates: high-GI foods raise blood glucose more than medium- or low-GI foods.
Various factors affect the GI including the type of carbohydrate, fat content, protein content, and acidity of the food consumed, as well as the rate of intestinal reaction to the food. The faster the digestion of a food, the higher the GI. High-GI foods (> 70), such as those highly processed and with high starch content, produce higher peak glucose levels when compared with low-GI foods (< 55). Low-GI foods include lentils, beans, oats, and nonstarchy vegetables.
Low-GI foods curb the large and rapid rise of blood glucose, insulin response, and glucagon inhibition that occur with high-GI foods. Many low-GI foods have high amounts of fiber, which prolongs distention of the gastrointestinal tract, increases secretion of cholecystokinin and incretins, and extends statiety.28
In a meta-analysis of 19 randomized trials of overweight or obese patients (BMI > 25), a low-glycemic diet did not show weight loss when compared with an isocaloric control diet (mean difference −0.32 kg; 95% confidence interval [CI] −0.86 kg, 0.23 kg).29 On the other hand, the effect on glycemic control is more pronounced. Another meta-analysis that included 11 studies of patients with DM who followed a low-glycemic diet for less than 3 months to over 6 months showed that those who followed a low-glycemic diet had a significant reduction of HbA1c (6 studies had HbA1c as the primary outcome, HbA1c weighted mean difference −0.5%; 95% CI, −0.8 to −0.2; P = .001). Five studies reported on parameters related to insulin action, and 1 showed increased sensitivity measured by euglycemic-hyperinsulinemic clamp in a low-glycemic diet (glucose disposal 7.0 ± 1.3 mg glucose/kg/min) vs a high-glycemic diet (4.8 mg glucose/kg/min ± 0.9, P < .001).28
There are no large trials of cardiovascular mortality or morbidity of low-glycemic diets, but some studies have included cardiovascular parameters. A randomized study of 210 patients with type 2 DM evaluated cardiovascular risk factors after 6 months of a low-glycemic diet and high-glycemic diet. The low-glycemic diet group had an increase in HDL-C compared with the high-glycemic diet group (1.7 mg/dL; 95% CI, 0.8 to 2.6 mg/dL vs −0.2 mg/dL; 95% CI, −0.9 to –0.5 mg/dL, P = .005).30 Another crossover study of 20 patients with type 2 DM on a low-glycemic diet over 2 consecutive 24-day periods revealed a 53% reduction of the activity of plasminogen activator inhibitor-1, a thrombolytic factor that increases plaque formation.31 Most studies were of short duration; thus, weight regain was not clearly established.
The GI of low-GI foods differs based on the cooking method, presence of other macronutrients, and metabolic variations among individuals. Low-glycemic diets can reduce the intake of important dietary nutrients. The ADA notes that low-glycemic diets may provide only modest benefit in controlling postprandial hyperglycemia.32
LOW-FAT DIET
Low-fat diets have 30% or fewer calories from fat, approximately 50 g of fat for a 1,500 kcal/day. The intake of dietary fat and free fatty acids reduces insulin sensitivity and enhances hepatic glucose production contributing to hyperglycemia.33 The mechanisms by which dietary fat and fatty acids reduce insulin sensitivity include modifications of the cell membrane composition, gene expression, and enzyme activity. Fatty acids also promote inflammatory cytokines and induce endothelial dysfunction. The type of fat rather than its total amount plays a role in glycemic control and cardiovascular disease risk.32
Different types of fats have different effects on metabolism. LDL-C is mostly derived from saturated fats.34 Consuming 2% of energy intake from trans fat substantially increases the risk of coronary heart disease.35 Though the ideal total amount of fat for people with diabetes is unknown, the amount consumed still has important consequences, especially since patients with type 2 DM are at risk for coronary artery disease. The Institute of Medicine states that fat intake of 20% to 35% of energy is acceptable for all adults.16
Low-fat diets along with reduced caloric intake induce weight loss, but this cannot compete with the rapid weight loss that patients experience with the low-carbohydrate diet. This was shown in multiple studies including a meta-analysis of 5 randomized clinical trials of 447 patients with obesity who lost less weight in the low-fat diet group compared with low-carbohydrate diet group (weighted mean difference −3.3 kg; 95% CI, −5.3 to −1.4 kg) at 6 months.36 Interestingly, the difference between diets was nonexistent after 12 months (weighted mean difference −1.0 kg; 95% CI, −3.5 to 1.5 kg), which may be due to weight regain in the low-carbohydrate diet group.36
Foster et al37 studied 307 participants with obesity assigned to a low-fat or low-carbohydrate diet. Both groups lost 11% in 1 year, and with regain, lost 7% from baseline at 2 years. There was no statistically significant difference between groups during the 2 years, but there was a trend for more weight loss in the low-carbohydrate group in the first 3 months (P = .019).37
The low-fat diet has no to minimal improvement in glycemic control in patients with diabetes and obesity, regardless of the weight loss achieved. However, a low-fat diet is associated with some beneficial effects on cardiovascular risks. Nordmann et al36 found no difference in blood pressure between low-carbohydrate and low-fat diets. The low-fat diet was associated with lower total cholesterol and LDL-C levels (weighted mean difference 5.4 mg/dL [0.14 mmol/L]; 95% CI, 1.2 mg/dL to 10.1 mg/dL [0.03–0.26 mmol/L]).36 Triglyceride and HDL-C levels were more favorably changed in the low-carbohydrate diet (for triglycerides, weighted mean difference −22.1 mg/dL [−0.25 mmol/L]; 95% CI, −38.1 to −5.3 mg/dL [−0.43 to −0.06 mmol/L]; and for HDL-C, weighted mean difference 4.6 mg/dL [0.12 mmol/L]; 95% CI, 1.5 mg/dL to 8.1 mg/dL [0.04–0.21 mmol/L]).36
VERY-LOW-CALORIE DIET
Very-low-calorie diets provide 400 to 800 calories per day of high-quality protein and carbohydrate fortified with vitamins, minerals, and trace elements.38 Very-low-calorie diets promote quick weight loss and use commercial formulas, liquid shakes, and soups to replace all regular meals. This type of diet results in rapid weight loss without leading to electrolyte imbalances associated with starvation. It was widely promoted in the 1970s, but then lost some of its popularity due to concerns for patients’ safety and even death.39 For these reasons, individuals on very-low-calorie diets should be closely monitored by a team of health professionals.
Saris et al38 reported results from 8 randomized clinical trials ranging from 10 to 32 patients with obesity comparing very-low-calorie diets with a low-calorie diet of 800 to 1,200 calories a day. Over the first 4 to 6 weeks, weight loss was between 1.4 kg and 2.5 kg per week and was higher with the very-low-calorie diet when compared with the low-calorie diet though not statistically significant. Interestingly, when followed for 16 to 26 weeks, the difference in weight loss was again not statistically significant with no trend for more weight loss in the very-low-calorie diet group. Another meta-analysis looking at 6 randomized clinical trials in patients with obesity showed that weight loss with very-low-calorie diets was statistically significant when compared with low-calorie diets (16.1% ± 1.6% vs 9.7% ± 2.4% weight loss over a period of 12.7 ± 6.4 weeks).39
In general, it is believed that when individuals lose a large amount of weight in a short period, a larger weight regain will occur, resulting in a higher weight than before the initial loss. This was refuted by Tsai et al,39 who found that long-term data (1 to 5 years) showed the percentage of weight regained is higher with a very-low-calorie diet (62%) vs a low-calorie diet (41%) but the overall weight lost remains superior with the very-low-calorie diet, though not statistically significant (6.3% ± 3.2% and 5.0% ± 4.0% loss of initial weight, respectively).
Toubro et al40 looked at 43 obese individuals who followed the very-low-calorie diet for 8 weeks compared with 17 weeks of a conventional diet (1,200 kcal/day) followed by a year of unrestricted calories, low-fat, high-carbohydrate diet or fixed calorie group (1,800 kcal/day). The very-low-calorie diet group lost weight at a more rapid rate, but the rate had no effect on weight maintenance after 6 or 12 months. Interestingly, the group that followed the “unrestricted calories, low-fat, high-carbohydrate diet” for a year maintained 13.2 kg (8.1 kg to 18.3 kg) of the initial 13.8 kg (11.8 kg to 15.7 kg) weight loss, while the fixed-calorie group maintained less weight loss (9.7 kg [6.1 kg to 13.3 kg]). Saris38 concluded that the rapid weight loss by very-low-calorie diet has better long-term results when followed up with a program that includes nutritional education, behavioral therapy, and increased physical activity.
Very-low-calorie diets achieve glycemic control by reducing hepatic glucose output, increasing insulin action in the liver and peripheral tissues, and enhancing insulin secretion. These benefits occur soon after starting the diet, which suggests that caloric restriction plays a critical role. A study at the University of Michigan showed that the use of very-low-calorie diets in addition to moderate-intensity exercise resulted in a reduction of HbA1c from 7.4% (± 1.3%) to 6.5% (± 1.2%) in 66 patients with established type 2 DM.41 HbA1c of less than 7% occurred in 76% of patients with established diabetes and 100% of patients with newly diagnosed diabetes.41 Improvement in HbA1c over 12 weeks was associated with higher baseline HbA1c and greater reduction in BMI.41
Long-term cardiovascular risk reduction of very-low-calorie diets is small. One study showed that serum total cholesterol decreased at 2 weeks but did not differ at 3 months from baseline.42 A large reduction was observed in serum triglycerides at 3 months (4.57 mmol/L ± 1.0 mmol/L vs 2.18 mmol/L ± .26 mmol/L, P = .012) while HDL-C increased (0.96 mmol/L ± .06 mmol/L vs 1.11 mmol/L ± .05 mmol/L, P = .009).42 Blood pressure was also reduced in both systolic pressure (152 mm Hg ± 6 mm Hg vs 133 mm Hg ± 3 mm Hg, P = .004) and diastolic pressure (92 mm Hg ± 3 mm Hg vs 81 mm Hg ± 3 mm Hg, P = .007).42
Challenges with this diet include significant weight regain and safety concerns for patients with obesity and type 2 DM, especially those who are taking insulin, since this diet will lead to significant rapid lowering of insulin levels.38 Finally, very-low-calorie diets require a multidisciplinary approach with frequent health professional visits.
MEDITERRANEAN DIET
The Mediterranean diet focuses on the moderate ingestion of monounsaturated fats such as olive oil (30% to 40% of daily energy intake), legumes, fruits, vegetables, nuts, whole grains, fish, and moderate ingestion of wine. A study of 259 overweight (mean BMI 31.4) patients with diabetes found a mean weight loss of as much as 7.4 kg at a steady state after 12 months.43 A systematic review of 5 randomized clinical trials of obese adults (N = 998) showed that sustained weight loss (up to 12 months) was greater in the Mediterranean diet compared with a low-fat diet (range of mean values: −4.1 to −10.1 kg vs 2.9 to −5.0 kg), but similar to a low-carbohydrate diet (4.1 to −10.1 kg vs −4.7 to −7.7 kg).44
This diet also has a positive impact on glycemic control and has been shown to reduce the incidence of diabetes. Estruch et al45 conducted a randomized controlled trial on 772 adults at high risk for cardiovascular disease, of which 421 had type 2 DM, assigned to Mediterranean diet supplemented either with extra-virgin olive oil or mixed nuts compared with a control group receiving advice on a low-fat diet. Their primary prevention trial, PREDIMED, looked mainly at the rate of total cardiovascular events (stroke, myocardial infarction, cardiovascular death); however, a subgroup analysis showed that the incidence of new-onset diabetes was reduced by 52% with the Mediterranean diet compared with the control group after 4 years of follow-up. Multivariate-adjusted hazard ratios of diabetes were 0.49 (0.25–0.97) and 0.48 (0.24–0.96) in the Mediterranean diet supplemented with olive oil and nuts groups, respectively, compared with the control group. Intuitively, they also showed that the higher the adherence, the lower the incidence rate.46 This occurred despite no difference in weight loss between the groups and may indicate that the components of the diet itself could have anti-inflammatory and antioxidative effects. Esposito et al47 showed that after 1 year of intervention in 215 patients with type 2 DM, HbA1c was lower in those assigned to the Mediterranean diet vs those assigned to a low-fat diet (difference: −0.6%; 95% CI, −0.9 to −0.3). Similarly, in a 12-month trial, Elhayany et al43 found a significant difference in the reduction in HbA1c in those on the Mediterranean diet compared with a low-fat diet (0.4%, P = .02).
Many studies have shown a beneficial effect of the Mediterranean diet on cardiovascular health. Estruch et al45 showed that 772 patients (143 with type 2 DM) at high risk of cardiovascular disease who followed a Mediterranean diet with nuts for 3 months had a reduced systolic blood pressure of −7.1 mm Hg (CI, −10.0 mm Hg to −4.1 mm Hg) and reduced HDL-C ratio of −0.26 (CI, −0.42 to −0.10) compared with a low-fat diet. There was also a reduction in fasting plasma glucose of −0.30 mmol/L (CI, −0.58 mmol/L to −0.01 mmol/L).45
PROTEIN-SPARING MODIFIED FAST
The protein-sparing modified fast combines a very-low-carbohydrate ketogenic diet and a very-low-calorie diet. The initial 6-month phase consists of fewer than 800 calories a day followed by a gradual increase in calories over 6 months. Carbohydrate is restricted to 20 to 50 g/day during the initial phase, with protein intake of 1.2 to 1.5 g/kg of ideal body weight per day.48
One of the earlier studies on protein-sparing modified fast showed that weight loss was as high as 21 kg ± 13 kg during the initial phase and 19 kg ± 13 kg during the refeeding phase.49 Weight regain is high: in the protein-sparing modified fast, most patients return to their baseline weight in 5 years.50
A study comparing 6 patients who were put on a protein-sparing modified fast diet with 6 patients who underwent gastric bypass surgery showed that the mean steady-state plasma glucose fell from 377 mg/dL to 208 mg/dL (P < .008) and mean fasting insulin values fell from 31.0 to 17.0 µU/mL (P < .004).51 There were also changes in cardiovascular risk factors: mean HDL-C values increased from 33.8 mg/dL to 40.5 mg/dL (P < .008), and factor VIII coagulant activity decreased from 194% to 140% (P < .005).51 Total cholesterol and LDL-C levels were also improved, but these changes were not always maintained at follow-up visits.52
VEGETARIAN AND VEGAN DIETS
A vegetarian diet consists primarily of cereals, fruits, vegetables, legumes, and nuts and generally excludes animal foods and dairy products. Less restrictive vegetarian diets may include eggs and dairy products. A vegan diet is one of the most restrictive diets and excludes all types of animal products, including honey and processed foods.
In 2013, Mishra et al53 conducted a randomized clinical trial of employees with obesity and type 2 DM (N = 291) assigned to a low-fat vegan diet or no intervention for 18 weeks. Weight decreased in the low-fat vegan diet group compared with the control group (2.9 kg vs 0.06 kg, respectively, P < .001). Statistically significant reductions in total cholesterol (8 mg/dL vs 0.01 mg/dL, P < .01), LDL-C (8.1 mg/dL vs 0.9 mg/dL, P < .01), and HbA1c (0.6% vs 0.08%, P < .01) occurred in the intervention group compared with the control group.53
Many studies of vegetarian and vegan diets have been of short duration and used a combination of low-fat and vegetarian or vegan diets on people that were not all considered obese. Research is limited for vegan and vegetarian diets, and not enough information exists about the effects on glycemic control and cardiovascular risk. Vegan and vegetarian diets may reduce the intake of many essential nutrients. Vegans who exclude dairy products, for example, have low bone mineral density and higher risk of fractures due to inadequate intake of calcium.
HIGH-PROTEIN DIET
Amino acids contribute to glucose synthesis through gluconeogenesis and play a role in recycling of glucose carbon via the glucose-alanine cycle. High-protein diets include more than 30% of total energy intake from protein (112 g/day assuming 1,500 kcal/day).
Parker et al54 reported a weight loss of 5.2 kg ± 1.8 kg in 12 weeks in 54 patients with obesity and type 2 DM irrespective of a diet with high or low protein content. Women on a high-protein diet lost more total fat and abdominal fat compared with women on a low-protein diet. Total lean mass decreased in all patients irrespective of diet.
Studies have shown that high-protein diets can improve glucose control. Ajala et al55 reviewed 20 clinical trials of patients with type 2 DM randomized to various diets for more than 6 months. In the trials that used a high-protein diet as an intervention, HbA1c levels decreased as much as 0.28% compared with the control diets (P < .001). A small study of 8 men with untreated type 2 DM compared a high-protein low-carbohydrate diet (nonketogenic, protein 30%, carbohydrate content 20%, fat 50%) with a control diet (protein 15%, carbohydrate 55%, fat 30%).56 The high-protein low-carbohydrate diet group had lower HbA1c levels (7.6 mg/dL ± 0.3 mg/dL vs 9.8 mg/dL ± 0.5 mg/dL) and mean 24-hour integrated serum glucose (126 mg/dL vs 198 mg/dL) compared with the control diet. Most of the studies of high-protein diets have been small and of short duration, and have used a combination of macronutrients (high protein and low carbohydrate), limiting the ability to identify the dietary component that had the most effect.
There are no studies evaluating cardiovascular outcomes, but some studies have included cardiovascular risk factors such as LDL-C levels and body fat composition. Parker et al54 showed that women on a high-protein diet lost more total fat (5.3 kg vs 2.8 kg, P = .009) and abdominal fat (1.3 kg vs 0.7 kg, P = .006) compared with a low-protein diet. Interestingly, no difference in total fat and abdominal fat was found in men. LDL-C reduction was greater in a high-protein diet compared with a low-protein diet (5.7% vs 2.7%, P < .01).54 In a review by Ajala et al,55 the high-protein diet was the only diet that did not show a rise in HDL-C levels after interventions of more than 6 months.
The ADA does not recommend high-protein diets as a method for weight loss because the long-term effects are unknown. ADA recommendations include an individualized approach based on a patient’s cardiometabolic risk and renal profiles. Protein content should be 0.8 g/kg to 1.0 g/kg of weight per day in patients with early chronic kidney disease, and 0.8 g/kg of weight per day in patients with advanced kidney disease.6
COMPARISONS AMONG DIETS
Studies comparing diets have reached varying conclusions and have been limited by inconsistent diet definitions, small sample sizes, and high participant dropout rates. A meta-analysis conducted by Ajala et al55 included 20 randomized controlled trials that lasted 6 months or more with 3,073 individuals in the analysis. Low-carbohydrate, vegetarian, vegan, low-glycemic, high-fiber, Mediterranean, and high-protein diets were compared with low-fat, high-glycemic, ADA, European Association for the Study of Diabetes, and low-protein diets as controls. The greatest weight loss occurred with the low-carbohydrate (−0.69 kg, P = .21) and Mediterranean diets (−1.84 kg, P < .001). Compared with the control diets, the greatest reductions in HbA1c were with the low-carbohydrate (−0.12%, P = .04), low-glycemic (−0.14%, P = .008), Mediterranean (−0.47%, P < .001), and high-protein diets (−0.28%, P < .001). HDL-C levels increased in all the diets except the high-protein diet.55
CONCLUSION
The optimal macronutrient intake for patients with obesity and type 2 DM is unknown. Diets with equivalent caloric intakes result in similar weight loss and glucose control regardless of the macronutrient contents. It is important that total caloric intake be appropriate for weight management and glucose control goals. The metabolic status of the patient as determined by lipid profiles, and renal and liver function is the main driver for the macronutrient composition of the diet.
Current trends favor the low-carbohydrate, low-glycemic, Mediterranean, and low-caloric intake diets, though there is no evidence that one is best for weight loss and optimal glycemic control in patients with obesity and type 2 DM. Studies are limited by varying definitions, high dropout rates, and poor adherence. In addition, for many patients, weight regain often follows successful short-term weight loss, indicative of a low durability of results with many diet interventions. Medical nutrition therapy and a multidisciplinary lifestyle approach remain essential components in managing weight and type 2 DM. The ideal diet is one that achieves the best adherence when tailored to a patient’s preferences, energy needs, and health status.
References
Kramer H, Cao G, Dugas L, Luke A, Cooper R, Durazo-Arvizu R. Increasing BMI and waist circumference and prevalence of obesity among adults with type 2 diabetes: The National Health and Nutrition Examination Surveys. J Diabetes Complications 2010; 24:368–374.
Centers for Disease Control and Prevention. Diabetes Report Card 2014. Atlanta, GA: Centers for Disease Control and Prevention, US Dept of Health and Human Services; 2015.
American Diabetes Association. Obesity management for the treatment of type 2 diabetes. Sec. 6. In: Standards of Medical Care in Diabetes—2016. Diabetes Care 2016; 39(suppl 1):S47–S51.
Knowler WC, Barrett-Connor E, Fowler SE; Diabetes Prevention Program Research Group. Reduction in the incidence of type 2 diabetes with lifestyle intervention or metformin. N Engl J Med 2002; 346:393–403.
Franz MJ, Powers MA, Leontos C, et al. The evidence for medical nutrition therapy for type 1 and type 2 diabetes in adults. J Am Diet Assoc 2010; 110:1852–1889.
American Diabetes Association. Introduction. In: Standards of Medical Care in Diabetes—2017. Diabetes Care 2017; 40(suppl 1):S1–S2.
Institute of Medicine. Dietary Reference Intakes for Energy, Carbohydrate, Fiber, Fat, Fatty acids, Cholesterol, Protein, and Amino Acids. Washington, DC: National Academy Press; 2002.
American Diabetes Association. Lifestyle management. Sec. 4. In: Standards of Medical Care in Diabetes—2017. Diabetes Care 2017; 40(suppl 1):S33–S43.
American Diabetes Association. Obesity management for treatment of type 2 diabetes. Sec. 7. In: Standards of Medical Care in Diabetes—2017. Diabetes Care 2017; 40(suppl 1):S57–S63.
National Institutes of Health. Clinical guidelines on the identification, evaluation, and treatment of overweight and obesity in adults—the evidence report. Obes Res 1998; 6(suppl 2):51S–209S.
Look AHEAD Research Group; Pi-Sunyer X, Blackburn G, Brancati FL, et al. Reduction in weight and cardiovascular disease risk factors in individuals with type 2 diabetes: one-year results of the look AHEAD trial. Diabetes Care 2007; 30:1374–1383.
Look AHEAD Research Group; Gregg EW, Jakicic JM, Blackburn G, et al. Association of the magnitude of weight loss and changes in physical fitness with long-term cardiovascular disease outcomes in overweight or obese people with type 2 diabetes: a post-hoc analysis of the look AHEAD randomised clinical trial. Lancet Diabetes Endocrinol 2016; 4:913–921.
Look AHEAD Research Group; Wadden TA, West DS, Delahanty L, et al. The Look AHEAD Study: a description of the lifestyle intervention and the evidence supporting it. Obesity (Silver Spring) 2006; 14:737–752.
Tuomilehto J, Lindstrom J, Eriksson JG, et al; Finnish Diabetes Prevention Study Group. Prevention of type 2 diabetes mellitus by changes in lifestyle among subjects with impaired glucose tolerance. N Engl J Med 2001; 344:1343–1350.
Institute of Medicine. Dietary Reference Intakes for Energy, Carbohydrate, Fiber, Fat, Fatty Acids, Cholesterol, Protein, and Amino Acids (Macronutrients). Washington, DC: The National Academies Press; 2005. doi:https://doi.org/10.17226/10490.
Kirk JK, Graves DE, Craven TE, Lipkin EW, Austin M, Margolis KL. Restricted-carbohydrate diets in patients with type 2 diabetes: a meta-analysis. J Am Diet Assoc 2008; 108:91–100.
Franz MJ, Monk A, Barry B, et al. Effectiveness of medical nutrition therapy provided by dietitians in the management of non-insulin-dependent diabetes mellitus: a randomized, controlled clinical trial. J Am Diet Assoc 1995; 95:1009–1017.
Hu T, Mills KT, Yao L, et al. Effects of low-carbohydrate diets versus low-fat diets on metabolic risk factors: a meta-analysis of randomized controlled clinical trials. Am J Epidemiol 2012; 176(suppl 7):S44–S54.
Bantle JP, Swanson JE, Thomas W, Laine DC. Metabolic effects of dietary sucrose in type II diabetic subjects. Diabetes Care 1993; 16:1301–1305.
Malik VS, Popkin BM, Bray GA, Despres JP, Willett WC, Hu FB. Sugar-sweetened beverages and risk of metabolic syndrome and type 2 diabetes: a meta-analysis. Diabetes Care 2010; 33:2477–2483.
Stanhope KL, Schwarz JM, Havel PJ. Adverse metabolic effects of dietary fructose: results from the recent epidemiological, clinical, and mechanistic studies. Curr Opin Lipidol 2013; 24:198–206.
Nielsen JV, Jonsson E, Nilsson AK. Lasting improvement of hyperglycaemia and bodyweight: low-carbohydrate diet in type 2 diabetes. A brief report. Ups J Med Sci 2005; 110:69–73; 179–183.
Robertson AM, Broom J, McRobbie LJ, MacLennan GS. Low carbohydrate diets in the treatment of resistant overweight patients with type 2 diabetes. Diabet Med 2002; 19(suppl 2):24 [Abstract 94].
Samaha FF, Iqbal N, Seshadri P, et al. A low-carbohydrate as compared with a low-fat diet in severe obesity. N Engl J Med 2003; 348:2074–2081.
Vetter ML, Iqbal N, Dalton-Bakes C, Volger S, Wadden TA. Long-term effects of low-carbohydrate versus low-fat diets in obese persons. Ann Intern Med 2010; 152:334–335.
Daly ME, Piper J, Paisey R, et al. Efficacy of carbohydrate restriction in obese type 2 diabetes patients. Diabet Med 2006; 23(suppl 2):26–27 [Abstract 98].
Thomas D, Elliott EJ. Low glycaemic index, or low glycaemic load, diets for diabetes mellitus. Cochrane Database Syst Rev 2009; (1):CD006296.
Braunstein CR, Mejia SB, Stoiko E, et al. Effect of low-glycemic index/load diets on body weight: a systematic review and meta-analysis. FASEB 2016; 30:906.9.
Jenkins DJ, Kendall CW, McKeown-Eyssen G, et al. Effect of a low-glycemic index or a high-cereal fiber diet on type 2 diabetes: a randomized trial. JAMA 2008; 300:2742–2753.
Järvi AE, Karlstrom BE, Granfeldt YE, Bjorck IE, Asp NG, Vessby BO. Improved glycaemic control and lipid profile and normalized fibrinolytic activity on a low-glycaemic index diet in type 2 diabetes patients. Diabetes Care 1999; 22:10–18.
Evert AB, Boucher JL, Cypress M, et al. Nutrition therapy recommendations for the management of adults with diabetes. Diabetes Care 2014; 37(suppl 1):S120–S143.
Savage DB, Petersen KF, Shulman GI. Disordered lipid metabolism and the pathogenesis of insulin resistance. Physiol Rev 2007; 87:507–520.
Risérus U. Fatty acids and insulin sensitivity. Curr Opin Clin Nutr Metab Care 2008; 11:100–105.
Oomen CM, Ocke MC, Feskens EJ, van Erp-Baart MA, Kok FJ, Kromhout D. Association between trans fatty acid intake and 10-year risk of coronary heart disease in the Zutphen Elderly Study: a prospective population-based study. Lancet 2001; 357:746–751.
Nordmann AJ, Nordmann A, Briel M, et al. Effects of low-carbohydrate vs low-fat diets on weight loss and cardiovascular risk factors: a meta-analysis of randomized controlled trials. Arch Intern Med 2006; 166:285–293.
Foster GD, Wyatt HR, Hill JO, et al. Weight and metabolic outcomes after 2 years on a low-carbohydrate versus low-fat diet: a randomized trial. Ann Intern Med 2010; 153:147–157.
Saris WH. Very-low-calorie diets and sustained weight loss. Obes Res 2001; 9(suppl 4):295S–301S.
Tsai A, Wadden TA. The evolution of very-low-calorie diets: an update and meta-analysis. Obesity 2006; 14:1283–1293.
Toubro S, Astrup A. Randomised comparison of diets for maintaining obese subjects’ weight after major weight loss: ad lib, low fat, high carbohydrate diet v fixed energy intake. BMJ 1997; 314:29–34.
Rothberg AE, McEwen LN, Kraftson AT, Fowler CE, Herman WH. Very-low-energy diet for type 2 diabetes: an underutilized therapy? J Diabetes Complications 2014; 28:506–510.
Uusitupa MI, Laakso M, Sarlund H, Majander H, Takala J, Penttilä I. Effects of a very-low-calorie diet on metabolic control and cardiovascular risk factors in the treatment of obese non-insulin-dependent diabetics. Am J Clin Nutr 1990; 51:768–773.
Elhayany A, Lustman A, Abel R, Attal-Singer J, Vinker S. A low carbohydrate Mediterranean diet improves cardiovascular risk factors and diabetes control among overweight patients with type 2 diabetes mellitus: a 1-year prospective randomized intervention study. Diabetes Obes Metab 2010; 12:204–209.
Mancini JG, Filion KB, Atallah R, Eisenberg MJ. Systematic review of the Mediterranean diet for long-term weight loss. Am J Med 2016; 129:407–415.e4.
Estruch R, Martinez-González MA, Corella D, et al; PREDIMED Study Investigators. Effects of a Mediterranean-style diet on cardiovascular risk factors: a randomized trial. Ann Intern Med 2006; 145:1–11.
Salas-Salvadó J, Bulló M, Babio N, et al; PREDIMED Study Investigators. Reduction in the incidence of type 2 diabetes with the Mediterranean diet: results of the PREDIMED-Reus nutrition intervention randomized trial. Diabetes Care 2011; 34:14–19.
Esposito K, Maiorino MI, Ciotola M, et al. Effects of a Mediterranean-style diet on the need for antihyperglycemic drug therapy in patients with newly diagnosed type 2 diabetes: a randomized trial. Ann Intern Med 2009; 151:306–314.
Chang J, Kashyap SR. The protein-sparing modified fast for obese patients with type 2 diabetes: what to expect. Cleve Clin J Med 2014; 81:557–565.
Palgi A, Read JL, Greenberg I, Hoefer MA, Bistrian BR, Blackburn GL. Multidisciplinary treatment of obesity with a protein-sparing modified fast: results in 668 outpatients. Am J Public Health 1985; 75:1190–1194.
Paisey RB, Frost J, Harvey P, et al. Five year results of a prospective very low calorie diet or conventional weight loss programme in type 2 diabetes. J Hum Nutr Diet 2002; 15:121–127.
Hughes TA, Gwynne JT, Switzer BR, Herbst C, White G. Effects of caloric restriction and weight loss on glycemic control, insulin release and resistance, and atherosclerotic risk in obese patients with type II diabetes mellitus. Am J Med 1984; 77:7–17.
Li Z, Tseng CH, Li Q, Deng ML, Wang M, Heber D. Clinical efficacy of a medically supervised outpatient high-protein, low-calorie diet program is equivalent in prediabetic, diabetic and normoglycemic obese patients. Nutr Diabetes 2014; 4:e105.
Mishra S, Xu J, Agarwal U, Gonzales J, Levin S, Barnard ND. A multicenter randomized controlled trial of a plant-based nutrition program to reduce body weight and cardiovascular risk in the corporate setting: the GEICO study. Eur J Clin Nutr 2013; 67:718–724.
Parker B, Noakes M, Luscombe N, Clifton P. Effect of a high-protein, high-monounsaturated fat weight loss diet on glycemic control and lipid levels in type 2 diabetes. Diabetes Care 2002; 25:425–430.
Ajala O, English P, Pinkney J. Systematic review and meta-analysis of different dietary approaches to the management of type 2 diabetes. Am J Clin Nutr 2013; 97:505–516.
Gannon MC, Nuttall FQ. Effect of a high-protein, low-carbohydrate diet on blood glucose control in people with type 2 diabetes. Diabetes 2004; 53:2375–2382.
Zahrae Sandouk, MD Clinical Assistant Professor, Division of Metabolism, Endocrinology & Diabetes, Department of Internal Medicine, University of Michigan, Ann Arbor
M. Cecilia Lansang, MD, MPH Associate Professor of Medicine, Cleveland Clinic Lerner College of Medicine of Case Western Reserve University, Cleveland, OH; Director, Inpatient Diabetes Services, Department of Endocrinology, Diabetes, and Metabolism, Cleveland Clinic
Correspondence: M. Cecilia Lansang, MD, MPH, Department of Endocrinology, Diabetes, and Metabolism, F20, Cleveland Clinic, 9500 Euclid Avenue, Cleveland, OH 44195; [email protected]
Both authors reported no financial interests or relationships that pose a potential conflict of interest with this article.
Author and Disclosure Information
Zahrae Sandouk, MD Clinical Assistant Professor, Division of Metabolism, Endocrinology & Diabetes, Department of Internal Medicine, University of Michigan, Ann Arbor
M. Cecilia Lansang, MD, MPH Associate Professor of Medicine, Cleveland Clinic Lerner College of Medicine of Case Western Reserve University, Cleveland, OH; Director, Inpatient Diabetes Services, Department of Endocrinology, Diabetes, and Metabolism, Cleveland Clinic
Correspondence: M. Cecilia Lansang, MD, MPH, Department of Endocrinology, Diabetes, and Metabolism, F20, Cleveland Clinic, 9500 Euclid Avenue, Cleveland, OH 44195; [email protected]
Both authors reported no financial interests or relationships that pose a potential conflict of interest with this article.
According to National Health and Nutrition Examination Survey data, more than one-third of adults in the United States are obese and more than two-thirds of adults with type 2 diabetes mellitus (DM) are obese.1 In light of overall increased life expectancy, the Centers for Disease Control and Prevention estimates that adults in the United States have a 40% lifetime risk of developing diabetes, as diabetes and obesity remain at epidemic levels.2
Weight loss in individuals who are overweight or obese is effective in preventing type 2 DM and improving management of the disease.3,4 Dietary changes play a central role in achieving weight loss, as do other important lifestyle interventions such as exercise, behavior modification, and pharmacotherapy. Achieving glycemic goals with diet alone is difficult, and for patients with DM who are also obese, it may be even more challenging.
Medical nutrition therapy, a term coined by the American Dietetic Association, describes an approach to treating medical conditions using specific diets. As developed and monitored by a physician and registered dietitian, diet can result in beneficial outcomes and is a front-line approach for patients with noninsulin-dependent diabetes.5 Medical nutrition therapy for patients with type 2 DM is most effective when used within 1 year of diagnosis and is associated with a 0.5% to 2% decrease in hemoglobin A1c (HbA1c) levels.6 This article reviews the role of diet in managing patients with both type 2 DM and obesity. Several diets are presented including what is known about their effect on weight loss, glycemic control, and cardiovascular risk prevention in patients with diabetes and obesity.
WEIGHT LOSS AND DIET FOR PATIENTS WITH OBESITY AND DIABETES
A person is overweight or obese if he or she weighs more than the ideal weight for their height as calculated by the body mass index (BMI; weight in kg/height in meters squared). A BMI of 25 to 30 is overweight and a BMI of 30 or greater is obese.7 The recommended daily caloric intake for adults is based on sex, age, and daily activity level and ranges from 1,600 to 2,000 calories per day for women and 2,000 to 2,600 calories per day for men. The lower end of the range is for sedentary adults, and the higher end is for active adults (walking 1.5 to 3 miles per day at 3 to 4 miles per hour, in addition to independent living).8
According to the American Diabetes Association (ADA), weight loss requires reducing dietary intake by 500 to 750 calories per day, or roughly 1,200 to 1,500 kcal/day for women and 1,500 to 1,800 kcal/day for men.3 For patients with obesity and type 2 DM, sustained, modest weight loss of 5% of initial body weight improves glycemic control and reduces the need for diabetes medications.9 Weight loss of greater than 5% body weight also improves lipid and blood pressure status in patients with obesity and diabetes, though ideally, patients are encouraged to achieve weight reduction of 7% or greater.10
Evidence of benefits from lifestyle and dietary modifications
The fact that patients with obesity and type 2 DM have increased risk of cardiovascular morbidity and mortality is well established.11 Multiple studies considered the effects of weight loss on cardiovascular morbidity and mortality. Our article focuses on dietary modifications, though most large, multicenter trials used both diet and increased physical activity to achieve weight loss. It is difficult to determine if diet or physical activity had the most effect on outcomes; however, results show that weight loss from dietary and other lifestyle interventions leads to change in outcomes.
Look AHEAD (Action for Health in Diabetes) trial. This large, multicenter, randomized controlled trial evaluated the effect of weight loss on cardiovascular morbidity and mortality in overweight or obese adults with type 2 DM. The 5,145 participants were assigned either to a long-term weight reduction intensive lifestyle intervention of diet, physical activity, and behavior modification or to usual care of support and education. At 1 year, the lifestyle intervention group had greater weight loss, improved fitness, decreased number of diabetes medications, decreased blood pressure, and improved biomarkers of glucose and lipid control compared with the usual care group.12 No significant reductions in cardiovascular morbidity and mortality were found, though an observational post hoc analysis of the Look AHEAD data suggested an association between the magnitude of weight loss and the incidence of cardiovascular disease.13
The diet portion of the intensive lifestyle intervention consisted of self-selected, conventional foods while recording dietary intake during week 1. In week 2, patients weighing less than 114 kg (250 lbs) restricted their intake to 1,200 to 1,500 kcal/day, and patients weighing 114 kg or more restricted their intake to 1,500 to 1,800 kcal/day. Fewer than 30% of calories were from fat, with less than 10% from saturated fat. During week 3 through week 9, meal replacement options and conventional foods were used to reach caloric goals. Participants then decreased the use of meal replacement and increased the use of conventional foods during week 20 through week 22.14
The mean weight loss for participants in the intensive lifestyle intervention group was 8.6% compared with 0.7% in the support and education group (P < .001). HbA1c decreased by 0.7% in the intervention group compared with 0.1% the support and education group (P < .001).12
Finnish Diabetes Prevention Study. This study evaluated lifestyle changes in diet and physical activity in the prevention of type 2 DM in participants with impaired glucose intolerance. Participants (N = 552) were randomly assigned to the control group or the intervention group where detailed instruction was provided to achieve weight loss of greater than 5%.15 The dietary goals included fewer than 30% of total calories from fat, with fewer than 10% from saturated fat, increased fiber consumption (15 g per 1,000 kcal), and physical activity of 30 minutes daily.15 During the trial (mean duration of follow-up 3.2 years), the risk of type 2 DM was reduced by 58% in the intervention group compared with the control group.15
Diabetes Prevention Program Research Group. A landmark study by the Diabetes Prevention Program Research Group randomized 3,234 participates with elevated plasma glucose levels to placebo, metformin, and lifestyle intervention arms.4 Those in the lifestyle intervention arm were educated about ways to achieve and maintain a 7% or greater reduction in body weight using a low-calorie, low-fat diet and moderate physical activity. Results based on a mean follow-up of 2.8 years found a 58% reduction in the incidence of diabetes for those in the lifestyle intervention arm.4
DIETS AND THEIR EFFECTS ON OBESITY, DIABETES, AND CARDIOVASCULAR RISK
When patients seek consultation about diet, they frequently ask about specific types of popular diets, not the very controlled diets employed in research studies. Dietary preferences are personal, so patients may have researched a particular diet or feel that they will be more adherent if only 1 or 2 components of their meals are changed. There is no single optimal dietary strategy for patients with both obesity and type 2 DM. In general, diets are categorized based on the 3 basic macronutrients: carbohydrate, fat, and protein. We will review several popular diets, delineating content, effects on weight loss, glycemic control, and cardiovascular factors.
LOW-CARBOHYDRATE DIET
Carbohydrates are organic compounds in food that include sugars and starches and are a source of energy for cells in the body and the brain in particular. The US Department of Agriculture Recommended Dietary Allowance of carbohydrate is 130 g per day minimum or 45% to 65% of total daily caloric intake.16 For a 1,700-calorie diet, 130 g of carbohydrate is 30% of the total caloric intake; in a 1,200-calorie diet, it is 43%.17
In practice, the median intake of carbohydrates for US adults is much higher, at 220 to 330 g per day for men and 180 to 230 g per day for women.16 The ADA recommends that all Americans consume fewer refined carbohydrates and added sugars in favor of whole grains, legumes, vegetables, and fruit.18
Low-carbohydrate diets focus on reducing carbohydrate intake with the thought that fewer carbohydrates are better. However, the definition of a low-carbohydrate diet varies. In most studies, carbohydrate intake was limited to less than 20 g to 120 g daily or fewer than 4% to 45% of the total calories consumed.17,19 Intake of fat and total calories is unlimited, though unsaturated fats are preferred over saturated or trans fats.
Limiting the intake of disaccharide sugar in the form of sucrose and high-fructose corn syrup is endorsed because of concerns that these sugars are rapidly digested, absorbed, and fully metabolized. However, several randomized trials showed that substituting sucrose for equal amounts of other types of carbohydrates in individuals with type 2 DM showed no difference in glycemic response.20 The resulting conclusion is that the postprandial glycemic response is mainly driven by the amount rather than the type of carbohydrates. The consumption of sugar-sweetened beverages is associated with obesity and an increased risk of diabetes, attributed to the high caloric intake and decreased insulin sensitivity associated with these beverages.21
Of the 2 monosaccharides, glucose and fructose, that make up sucrose, fructose is metabolized in the liver. The rapid metabolism of fructose may lead to alterations in lipid metabolism and affect insulin sensitivity.22 While the ADA does not advise against consuming fructose, it does advise limiting its use due to the caloric density of many foods containing fructose.
Multiple studies have investigated the effect of a low-carbohydrate diet on weight loss, glucose control, and cardiovascular risk, but comparing the results is difficult due to the varying definitions of a low-carbohydrate diet.
Low-carbohydrate diets are associated with rapid weight loss. A 6-month study of 31 patients with obesity and type 2 DM found a mean weight change of −11.4 kg (± 4 kg) in the low-carbohydrate group compared with −1.8 kg (± 3.8 kg) in the high-carbohydrate control group, a loss maintained up to 1 year.23 Another study of 88 patients with type 2 DM who consumed less than 40 g/day of carbohydrate had a weight loss of 7.2 kg over 12 months.24 Samaha et al25 compared a low-carbohydrate diet with a low-fat diet in 132 participants with obesity (mean BMI 43), of which 39% had diabetes and 43% had metabolic syndrome. Those in the low-carbohydrate diet group had significantly more weight loss over a period of 6 months (−5.8 kg mean, ± 8.6 kg standard deviation [SD] vs −1.9 kg mean ± 4.2 kg SD, P = .002). However, at 1 year, there was no significant difference in weight loss between groups. At 36 months, weight regain was 2.2 kg (SD 12.3 kg) less than baseline in the low-carbohydrate group compared with 4.3 kg (SD 12.2 kg) less than baseline in the low-fat group (P = .071).25,26 On the other hand, a meta-analysis of 23 randomized trials involving 2,788 participants found no difference in weight loss at 6 months between those on a low-carbohydrate diet and those on a low-fat diet.19
With respect to glucose control, low-carbohydrate diets have been associated with a 1.4% (SD ± 1.1%)decrease in HbA1c during a 6-month period in 31 patients with obesity and type 2 DM.23 Another 6-month study of 206 patients with obesity and diabetes comparing a low-carbohydrate diet with a low-calorie diet found no significant difference in HbA1c (−0.48% vs −0.24%, respectively) and a weight loss of 1.34 kg vs 3.77 kg, respectively (P < .001).27 The change in glycemic control did not persist over time, perhaps due to the weight regain associated with this diet. A meta-analysis concluded that HbA1c was reduced more in patients with type 2 DM randomized to a lower-carbohydrate diet compared with a higher-carbohydrate diet (mean change from baseline 0% to −2.2%).17
No studies of the effects of a low-carbohydrate diet on overall cardiovascular morbidity or mortality exist. However, Kirk et al17 reported results of a low-carbohydrate diet on cardiovascular risk factors such as lipid profiles and showed a significant reduction in triglyceride levels but no effect on total cholesterol, high-density lipoprotein cholesterol (HDL-C), or low-density lipoprotein cholesterol (LDL-C) levels.
The ADA has reported that low-carbohydrate diets may be effective in the management of type 2 DM in the short term. Caution is warranted because they could eliminate important sources of energy, fiber, vitamins, and minerals. It is also important to monitor lipid profile, renal function, and protein intake in certain patients, especially those with renal dysfunction.6
LOW-GLYCEMIC DIET
The glycemic index (GI) is a measure of the rise in plasma glucose 2 hours after ingesting carbohydrate in food compared with a reference food such as glucose that contains an equivalent amount of carbohydrate. The GI measures the postprandial response of different carbohydrates: high-GI foods raise blood glucose more than medium- or low-GI foods.
Various factors affect the GI including the type of carbohydrate, fat content, protein content, and acidity of the food consumed, as well as the rate of intestinal reaction to the food. The faster the digestion of a food, the higher the GI. High-GI foods (> 70), such as those highly processed and with high starch content, produce higher peak glucose levels when compared with low-GI foods (< 55). Low-GI foods include lentils, beans, oats, and nonstarchy vegetables.
Low-GI foods curb the large and rapid rise of blood glucose, insulin response, and glucagon inhibition that occur with high-GI foods. Many low-GI foods have high amounts of fiber, which prolongs distention of the gastrointestinal tract, increases secretion of cholecystokinin and incretins, and extends statiety.28
In a meta-analysis of 19 randomized trials of overweight or obese patients (BMI > 25), a low-glycemic diet did not show weight loss when compared with an isocaloric control diet (mean difference −0.32 kg; 95% confidence interval [CI] −0.86 kg, 0.23 kg).29 On the other hand, the effect on glycemic control is more pronounced. Another meta-analysis that included 11 studies of patients with DM who followed a low-glycemic diet for less than 3 months to over 6 months showed that those who followed a low-glycemic diet had a significant reduction of HbA1c (6 studies had HbA1c as the primary outcome, HbA1c weighted mean difference −0.5%; 95% CI, −0.8 to −0.2; P = .001). Five studies reported on parameters related to insulin action, and 1 showed increased sensitivity measured by euglycemic-hyperinsulinemic clamp in a low-glycemic diet (glucose disposal 7.0 ± 1.3 mg glucose/kg/min) vs a high-glycemic diet (4.8 mg glucose/kg/min ± 0.9, P < .001).28
There are no large trials of cardiovascular mortality or morbidity of low-glycemic diets, but some studies have included cardiovascular parameters. A randomized study of 210 patients with type 2 DM evaluated cardiovascular risk factors after 6 months of a low-glycemic diet and high-glycemic diet. The low-glycemic diet group had an increase in HDL-C compared with the high-glycemic diet group (1.7 mg/dL; 95% CI, 0.8 to 2.6 mg/dL vs −0.2 mg/dL; 95% CI, −0.9 to –0.5 mg/dL, P = .005).30 Another crossover study of 20 patients with type 2 DM on a low-glycemic diet over 2 consecutive 24-day periods revealed a 53% reduction of the activity of plasminogen activator inhibitor-1, a thrombolytic factor that increases plaque formation.31 Most studies were of short duration; thus, weight regain was not clearly established.
The GI of low-GI foods differs based on the cooking method, presence of other macronutrients, and metabolic variations among individuals. Low-glycemic diets can reduce the intake of important dietary nutrients. The ADA notes that low-glycemic diets may provide only modest benefit in controlling postprandial hyperglycemia.32
LOW-FAT DIET
Low-fat diets have 30% or fewer calories from fat, approximately 50 g of fat for a 1,500 kcal/day. The intake of dietary fat and free fatty acids reduces insulin sensitivity and enhances hepatic glucose production contributing to hyperglycemia.33 The mechanisms by which dietary fat and fatty acids reduce insulin sensitivity include modifications of the cell membrane composition, gene expression, and enzyme activity. Fatty acids also promote inflammatory cytokines and induce endothelial dysfunction. The type of fat rather than its total amount plays a role in glycemic control and cardiovascular disease risk.32
Different types of fats have different effects on metabolism. LDL-C is mostly derived from saturated fats.34 Consuming 2% of energy intake from trans fat substantially increases the risk of coronary heart disease.35 Though the ideal total amount of fat for people with diabetes is unknown, the amount consumed still has important consequences, especially since patients with type 2 DM are at risk for coronary artery disease. The Institute of Medicine states that fat intake of 20% to 35% of energy is acceptable for all adults.16
Low-fat diets along with reduced caloric intake induce weight loss, but this cannot compete with the rapid weight loss that patients experience with the low-carbohydrate diet. This was shown in multiple studies including a meta-analysis of 5 randomized clinical trials of 447 patients with obesity who lost less weight in the low-fat diet group compared with low-carbohydrate diet group (weighted mean difference −3.3 kg; 95% CI, −5.3 to −1.4 kg) at 6 months.36 Interestingly, the difference between diets was nonexistent after 12 months (weighted mean difference −1.0 kg; 95% CI, −3.5 to 1.5 kg), which may be due to weight regain in the low-carbohydrate diet group.36
Foster et al37 studied 307 participants with obesity assigned to a low-fat or low-carbohydrate diet. Both groups lost 11% in 1 year, and with regain, lost 7% from baseline at 2 years. There was no statistically significant difference between groups during the 2 years, but there was a trend for more weight loss in the low-carbohydrate group in the first 3 months (P = .019).37
The low-fat diet has no to minimal improvement in glycemic control in patients with diabetes and obesity, regardless of the weight loss achieved. However, a low-fat diet is associated with some beneficial effects on cardiovascular risks. Nordmann et al36 found no difference in blood pressure between low-carbohydrate and low-fat diets. The low-fat diet was associated with lower total cholesterol and LDL-C levels (weighted mean difference 5.4 mg/dL [0.14 mmol/L]; 95% CI, 1.2 mg/dL to 10.1 mg/dL [0.03–0.26 mmol/L]).36 Triglyceride and HDL-C levels were more favorably changed in the low-carbohydrate diet (for triglycerides, weighted mean difference −22.1 mg/dL [−0.25 mmol/L]; 95% CI, −38.1 to −5.3 mg/dL [−0.43 to −0.06 mmol/L]; and for HDL-C, weighted mean difference 4.6 mg/dL [0.12 mmol/L]; 95% CI, 1.5 mg/dL to 8.1 mg/dL [0.04–0.21 mmol/L]).36
VERY-LOW-CALORIE DIET
Very-low-calorie diets provide 400 to 800 calories per day of high-quality protein and carbohydrate fortified with vitamins, minerals, and trace elements.38 Very-low-calorie diets promote quick weight loss and use commercial formulas, liquid shakes, and soups to replace all regular meals. This type of diet results in rapid weight loss without leading to electrolyte imbalances associated with starvation. It was widely promoted in the 1970s, but then lost some of its popularity due to concerns for patients’ safety and even death.39 For these reasons, individuals on very-low-calorie diets should be closely monitored by a team of health professionals.
Saris et al38 reported results from 8 randomized clinical trials ranging from 10 to 32 patients with obesity comparing very-low-calorie diets with a low-calorie diet of 800 to 1,200 calories a day. Over the first 4 to 6 weeks, weight loss was between 1.4 kg and 2.5 kg per week and was higher with the very-low-calorie diet when compared with the low-calorie diet though not statistically significant. Interestingly, when followed for 16 to 26 weeks, the difference in weight loss was again not statistically significant with no trend for more weight loss in the very-low-calorie diet group. Another meta-analysis looking at 6 randomized clinical trials in patients with obesity showed that weight loss with very-low-calorie diets was statistically significant when compared with low-calorie diets (16.1% ± 1.6% vs 9.7% ± 2.4% weight loss over a period of 12.7 ± 6.4 weeks).39
In general, it is believed that when individuals lose a large amount of weight in a short period, a larger weight regain will occur, resulting in a higher weight than before the initial loss. This was refuted by Tsai et al,39 who found that long-term data (1 to 5 years) showed the percentage of weight regained is higher with a very-low-calorie diet (62%) vs a low-calorie diet (41%) but the overall weight lost remains superior with the very-low-calorie diet, though not statistically significant (6.3% ± 3.2% and 5.0% ± 4.0% loss of initial weight, respectively).
Toubro et al40 looked at 43 obese individuals who followed the very-low-calorie diet for 8 weeks compared with 17 weeks of a conventional diet (1,200 kcal/day) followed by a year of unrestricted calories, low-fat, high-carbohydrate diet or fixed calorie group (1,800 kcal/day). The very-low-calorie diet group lost weight at a more rapid rate, but the rate had no effect on weight maintenance after 6 or 12 months. Interestingly, the group that followed the “unrestricted calories, low-fat, high-carbohydrate diet” for a year maintained 13.2 kg (8.1 kg to 18.3 kg) of the initial 13.8 kg (11.8 kg to 15.7 kg) weight loss, while the fixed-calorie group maintained less weight loss (9.7 kg [6.1 kg to 13.3 kg]). Saris38 concluded that the rapid weight loss by very-low-calorie diet has better long-term results when followed up with a program that includes nutritional education, behavioral therapy, and increased physical activity.
Very-low-calorie diets achieve glycemic control by reducing hepatic glucose output, increasing insulin action in the liver and peripheral tissues, and enhancing insulin secretion. These benefits occur soon after starting the diet, which suggests that caloric restriction plays a critical role. A study at the University of Michigan showed that the use of very-low-calorie diets in addition to moderate-intensity exercise resulted in a reduction of HbA1c from 7.4% (± 1.3%) to 6.5% (± 1.2%) in 66 patients with established type 2 DM.41 HbA1c of less than 7% occurred in 76% of patients with established diabetes and 100% of patients with newly diagnosed diabetes.41 Improvement in HbA1c over 12 weeks was associated with higher baseline HbA1c and greater reduction in BMI.41
Long-term cardiovascular risk reduction of very-low-calorie diets is small. One study showed that serum total cholesterol decreased at 2 weeks but did not differ at 3 months from baseline.42 A large reduction was observed in serum triglycerides at 3 months (4.57 mmol/L ± 1.0 mmol/L vs 2.18 mmol/L ± .26 mmol/L, P = .012) while HDL-C increased (0.96 mmol/L ± .06 mmol/L vs 1.11 mmol/L ± .05 mmol/L, P = .009).42 Blood pressure was also reduced in both systolic pressure (152 mm Hg ± 6 mm Hg vs 133 mm Hg ± 3 mm Hg, P = .004) and diastolic pressure (92 mm Hg ± 3 mm Hg vs 81 mm Hg ± 3 mm Hg, P = .007).42
Challenges with this diet include significant weight regain and safety concerns for patients with obesity and type 2 DM, especially those who are taking insulin, since this diet will lead to significant rapid lowering of insulin levels.38 Finally, very-low-calorie diets require a multidisciplinary approach with frequent health professional visits.
MEDITERRANEAN DIET
The Mediterranean diet focuses on the moderate ingestion of monounsaturated fats such as olive oil (30% to 40% of daily energy intake), legumes, fruits, vegetables, nuts, whole grains, fish, and moderate ingestion of wine. A study of 259 overweight (mean BMI 31.4) patients with diabetes found a mean weight loss of as much as 7.4 kg at a steady state after 12 months.43 A systematic review of 5 randomized clinical trials of obese adults (N = 998) showed that sustained weight loss (up to 12 months) was greater in the Mediterranean diet compared with a low-fat diet (range of mean values: −4.1 to −10.1 kg vs 2.9 to −5.0 kg), but similar to a low-carbohydrate diet (4.1 to −10.1 kg vs −4.7 to −7.7 kg).44
This diet also has a positive impact on glycemic control and has been shown to reduce the incidence of diabetes. Estruch et al45 conducted a randomized controlled trial on 772 adults at high risk for cardiovascular disease, of which 421 had type 2 DM, assigned to Mediterranean diet supplemented either with extra-virgin olive oil or mixed nuts compared with a control group receiving advice on a low-fat diet. Their primary prevention trial, PREDIMED, looked mainly at the rate of total cardiovascular events (stroke, myocardial infarction, cardiovascular death); however, a subgroup analysis showed that the incidence of new-onset diabetes was reduced by 52% with the Mediterranean diet compared with the control group after 4 years of follow-up. Multivariate-adjusted hazard ratios of diabetes were 0.49 (0.25–0.97) and 0.48 (0.24–0.96) in the Mediterranean diet supplemented with olive oil and nuts groups, respectively, compared with the control group. Intuitively, they also showed that the higher the adherence, the lower the incidence rate.46 This occurred despite no difference in weight loss between the groups and may indicate that the components of the diet itself could have anti-inflammatory and antioxidative effects. Esposito et al47 showed that after 1 year of intervention in 215 patients with type 2 DM, HbA1c was lower in those assigned to the Mediterranean diet vs those assigned to a low-fat diet (difference: −0.6%; 95% CI, −0.9 to −0.3). Similarly, in a 12-month trial, Elhayany et al43 found a significant difference in the reduction in HbA1c in those on the Mediterranean diet compared with a low-fat diet (0.4%, P = .02).
Many studies have shown a beneficial effect of the Mediterranean diet on cardiovascular health. Estruch et al45 showed that 772 patients (143 with type 2 DM) at high risk of cardiovascular disease who followed a Mediterranean diet with nuts for 3 months had a reduced systolic blood pressure of −7.1 mm Hg (CI, −10.0 mm Hg to −4.1 mm Hg) and reduced HDL-C ratio of −0.26 (CI, −0.42 to −0.10) compared with a low-fat diet. There was also a reduction in fasting plasma glucose of −0.30 mmol/L (CI, −0.58 mmol/L to −0.01 mmol/L).45
PROTEIN-SPARING MODIFIED FAST
The protein-sparing modified fast combines a very-low-carbohydrate ketogenic diet and a very-low-calorie diet. The initial 6-month phase consists of fewer than 800 calories a day followed by a gradual increase in calories over 6 months. Carbohydrate is restricted to 20 to 50 g/day during the initial phase, with protein intake of 1.2 to 1.5 g/kg of ideal body weight per day.48
One of the earlier studies on protein-sparing modified fast showed that weight loss was as high as 21 kg ± 13 kg during the initial phase and 19 kg ± 13 kg during the refeeding phase.49 Weight regain is high: in the protein-sparing modified fast, most patients return to their baseline weight in 5 years.50
A study comparing 6 patients who were put on a protein-sparing modified fast diet with 6 patients who underwent gastric bypass surgery showed that the mean steady-state plasma glucose fell from 377 mg/dL to 208 mg/dL (P < .008) and mean fasting insulin values fell from 31.0 to 17.0 µU/mL (P < .004).51 There were also changes in cardiovascular risk factors: mean HDL-C values increased from 33.8 mg/dL to 40.5 mg/dL (P < .008), and factor VIII coagulant activity decreased from 194% to 140% (P < .005).51 Total cholesterol and LDL-C levels were also improved, but these changes were not always maintained at follow-up visits.52
VEGETARIAN AND VEGAN DIETS
A vegetarian diet consists primarily of cereals, fruits, vegetables, legumes, and nuts and generally excludes animal foods and dairy products. Less restrictive vegetarian diets may include eggs and dairy products. A vegan diet is one of the most restrictive diets and excludes all types of animal products, including honey and processed foods.
In 2013, Mishra et al53 conducted a randomized clinical trial of employees with obesity and type 2 DM (N = 291) assigned to a low-fat vegan diet or no intervention for 18 weeks. Weight decreased in the low-fat vegan diet group compared with the control group (2.9 kg vs 0.06 kg, respectively, P < .001). Statistically significant reductions in total cholesterol (8 mg/dL vs 0.01 mg/dL, P < .01), LDL-C (8.1 mg/dL vs 0.9 mg/dL, P < .01), and HbA1c (0.6% vs 0.08%, P < .01) occurred in the intervention group compared with the control group.53
Many studies of vegetarian and vegan diets have been of short duration and used a combination of low-fat and vegetarian or vegan diets on people that were not all considered obese. Research is limited for vegan and vegetarian diets, and not enough information exists about the effects on glycemic control and cardiovascular risk. Vegan and vegetarian diets may reduce the intake of many essential nutrients. Vegans who exclude dairy products, for example, have low bone mineral density and higher risk of fractures due to inadequate intake of calcium.
HIGH-PROTEIN DIET
Amino acids contribute to glucose synthesis through gluconeogenesis and play a role in recycling of glucose carbon via the glucose-alanine cycle. High-protein diets include more than 30% of total energy intake from protein (112 g/day assuming 1,500 kcal/day).
Parker et al54 reported a weight loss of 5.2 kg ± 1.8 kg in 12 weeks in 54 patients with obesity and type 2 DM irrespective of a diet with high or low protein content. Women on a high-protein diet lost more total fat and abdominal fat compared with women on a low-protein diet. Total lean mass decreased in all patients irrespective of diet.
Studies have shown that high-protein diets can improve glucose control. Ajala et al55 reviewed 20 clinical trials of patients with type 2 DM randomized to various diets for more than 6 months. In the trials that used a high-protein diet as an intervention, HbA1c levels decreased as much as 0.28% compared with the control diets (P < .001). A small study of 8 men with untreated type 2 DM compared a high-protein low-carbohydrate diet (nonketogenic, protein 30%, carbohydrate content 20%, fat 50%) with a control diet (protein 15%, carbohydrate 55%, fat 30%).56 The high-protein low-carbohydrate diet group had lower HbA1c levels (7.6 mg/dL ± 0.3 mg/dL vs 9.8 mg/dL ± 0.5 mg/dL) and mean 24-hour integrated serum glucose (126 mg/dL vs 198 mg/dL) compared with the control diet. Most of the studies of high-protein diets have been small and of short duration, and have used a combination of macronutrients (high protein and low carbohydrate), limiting the ability to identify the dietary component that had the most effect.
There are no studies evaluating cardiovascular outcomes, but some studies have included cardiovascular risk factors such as LDL-C levels and body fat composition. Parker et al54 showed that women on a high-protein diet lost more total fat (5.3 kg vs 2.8 kg, P = .009) and abdominal fat (1.3 kg vs 0.7 kg, P = .006) compared with a low-protein diet. Interestingly, no difference in total fat and abdominal fat was found in men. LDL-C reduction was greater in a high-protein diet compared with a low-protein diet (5.7% vs 2.7%, P < .01).54 In a review by Ajala et al,55 the high-protein diet was the only diet that did not show a rise in HDL-C levels after interventions of more than 6 months.
The ADA does not recommend high-protein diets as a method for weight loss because the long-term effects are unknown. ADA recommendations include an individualized approach based on a patient’s cardiometabolic risk and renal profiles. Protein content should be 0.8 g/kg to 1.0 g/kg of weight per day in patients with early chronic kidney disease, and 0.8 g/kg of weight per day in patients with advanced kidney disease.6
COMPARISONS AMONG DIETS
Studies comparing diets have reached varying conclusions and have been limited by inconsistent diet definitions, small sample sizes, and high participant dropout rates. A meta-analysis conducted by Ajala et al55 included 20 randomized controlled trials that lasted 6 months or more with 3,073 individuals in the analysis. Low-carbohydrate, vegetarian, vegan, low-glycemic, high-fiber, Mediterranean, and high-protein diets were compared with low-fat, high-glycemic, ADA, European Association for the Study of Diabetes, and low-protein diets as controls. The greatest weight loss occurred with the low-carbohydrate (−0.69 kg, P = .21) and Mediterranean diets (−1.84 kg, P < .001). Compared with the control diets, the greatest reductions in HbA1c were with the low-carbohydrate (−0.12%, P = .04), low-glycemic (−0.14%, P = .008), Mediterranean (−0.47%, P < .001), and high-protein diets (−0.28%, P < .001). HDL-C levels increased in all the diets except the high-protein diet.55
CONCLUSION
The optimal macronutrient intake for patients with obesity and type 2 DM is unknown. Diets with equivalent caloric intakes result in similar weight loss and glucose control regardless of the macronutrient contents. It is important that total caloric intake be appropriate for weight management and glucose control goals. The metabolic status of the patient as determined by lipid profiles, and renal and liver function is the main driver for the macronutrient composition of the diet.
Current trends favor the low-carbohydrate, low-glycemic, Mediterranean, and low-caloric intake diets, though there is no evidence that one is best for weight loss and optimal glycemic control in patients with obesity and type 2 DM. Studies are limited by varying definitions, high dropout rates, and poor adherence. In addition, for many patients, weight regain often follows successful short-term weight loss, indicative of a low durability of results with many diet interventions. Medical nutrition therapy and a multidisciplinary lifestyle approach remain essential components in managing weight and type 2 DM. The ideal diet is one that achieves the best adherence when tailored to a patient’s preferences, energy needs, and health status.
References
Kramer H, Cao G, Dugas L, Luke A, Cooper R, Durazo-Arvizu R. Increasing BMI and waist circumference and prevalence of obesity among adults with type 2 diabetes: The National Health and Nutrition Examination Surveys. J Diabetes Complications 2010; 24:368–374.
Centers for Disease Control and Prevention. Diabetes Report Card 2014. Atlanta, GA: Centers for Disease Control and Prevention, US Dept of Health and Human Services; 2015.
American Diabetes Association. Obesity management for the treatment of type 2 diabetes. Sec. 6. In: Standards of Medical Care in Diabetes—2016. Diabetes Care 2016; 39(suppl 1):S47–S51.
Knowler WC, Barrett-Connor E, Fowler SE; Diabetes Prevention Program Research Group. Reduction in the incidence of type 2 diabetes with lifestyle intervention or metformin. N Engl J Med 2002; 346:393–403.
Franz MJ, Powers MA, Leontos C, et al. The evidence for medical nutrition therapy for type 1 and type 2 diabetes in adults. J Am Diet Assoc 2010; 110:1852–1889.
American Diabetes Association. Introduction. In: Standards of Medical Care in Diabetes—2017. Diabetes Care 2017; 40(suppl 1):S1–S2.
Institute of Medicine. Dietary Reference Intakes for Energy, Carbohydrate, Fiber, Fat, Fatty acids, Cholesterol, Protein, and Amino Acids. Washington, DC: National Academy Press; 2002.
American Diabetes Association. Lifestyle management. Sec. 4. In: Standards of Medical Care in Diabetes—2017. Diabetes Care 2017; 40(suppl 1):S33–S43.
American Diabetes Association. Obesity management for treatment of type 2 diabetes. Sec. 7. In: Standards of Medical Care in Diabetes—2017. Diabetes Care 2017; 40(suppl 1):S57–S63.
National Institutes of Health. Clinical guidelines on the identification, evaluation, and treatment of overweight and obesity in adults—the evidence report. Obes Res 1998; 6(suppl 2):51S–209S.
Look AHEAD Research Group; Pi-Sunyer X, Blackburn G, Brancati FL, et al. Reduction in weight and cardiovascular disease risk factors in individuals with type 2 diabetes: one-year results of the look AHEAD trial. Diabetes Care 2007; 30:1374–1383.
Look AHEAD Research Group; Gregg EW, Jakicic JM, Blackburn G, et al. Association of the magnitude of weight loss and changes in physical fitness with long-term cardiovascular disease outcomes in overweight or obese people with type 2 diabetes: a post-hoc analysis of the look AHEAD randomised clinical trial. Lancet Diabetes Endocrinol 2016; 4:913–921.
Look AHEAD Research Group; Wadden TA, West DS, Delahanty L, et al. The Look AHEAD Study: a description of the lifestyle intervention and the evidence supporting it. Obesity (Silver Spring) 2006; 14:737–752.
Tuomilehto J, Lindstrom J, Eriksson JG, et al; Finnish Diabetes Prevention Study Group. Prevention of type 2 diabetes mellitus by changes in lifestyle among subjects with impaired glucose tolerance. N Engl J Med 2001; 344:1343–1350.
Institute of Medicine. Dietary Reference Intakes for Energy, Carbohydrate, Fiber, Fat, Fatty Acids, Cholesterol, Protein, and Amino Acids (Macronutrients). Washington, DC: The National Academies Press; 2005. doi:https://doi.org/10.17226/10490.
Kirk JK, Graves DE, Craven TE, Lipkin EW, Austin M, Margolis KL. Restricted-carbohydrate diets in patients with type 2 diabetes: a meta-analysis. J Am Diet Assoc 2008; 108:91–100.
Franz MJ, Monk A, Barry B, et al. Effectiveness of medical nutrition therapy provided by dietitians in the management of non-insulin-dependent diabetes mellitus: a randomized, controlled clinical trial. J Am Diet Assoc 1995; 95:1009–1017.
Hu T, Mills KT, Yao L, et al. Effects of low-carbohydrate diets versus low-fat diets on metabolic risk factors: a meta-analysis of randomized controlled clinical trials. Am J Epidemiol 2012; 176(suppl 7):S44–S54.
Bantle JP, Swanson JE, Thomas W, Laine DC. Metabolic effects of dietary sucrose in type II diabetic subjects. Diabetes Care 1993; 16:1301–1305.
Malik VS, Popkin BM, Bray GA, Despres JP, Willett WC, Hu FB. Sugar-sweetened beverages and risk of metabolic syndrome and type 2 diabetes: a meta-analysis. Diabetes Care 2010; 33:2477–2483.
Stanhope KL, Schwarz JM, Havel PJ. Adverse metabolic effects of dietary fructose: results from the recent epidemiological, clinical, and mechanistic studies. Curr Opin Lipidol 2013; 24:198–206.
Nielsen JV, Jonsson E, Nilsson AK. Lasting improvement of hyperglycaemia and bodyweight: low-carbohydrate diet in type 2 diabetes. A brief report. Ups J Med Sci 2005; 110:69–73; 179–183.
Robertson AM, Broom J, McRobbie LJ, MacLennan GS. Low carbohydrate diets in the treatment of resistant overweight patients with type 2 diabetes. Diabet Med 2002; 19(suppl 2):24 [Abstract 94].
Samaha FF, Iqbal N, Seshadri P, et al. A low-carbohydrate as compared with a low-fat diet in severe obesity. N Engl J Med 2003; 348:2074–2081.
Vetter ML, Iqbal N, Dalton-Bakes C, Volger S, Wadden TA. Long-term effects of low-carbohydrate versus low-fat diets in obese persons. Ann Intern Med 2010; 152:334–335.
Daly ME, Piper J, Paisey R, et al. Efficacy of carbohydrate restriction in obese type 2 diabetes patients. Diabet Med 2006; 23(suppl 2):26–27 [Abstract 98].
Thomas D, Elliott EJ. Low glycaemic index, or low glycaemic load, diets for diabetes mellitus. Cochrane Database Syst Rev 2009; (1):CD006296.
Braunstein CR, Mejia SB, Stoiko E, et al. Effect of low-glycemic index/load diets on body weight: a systematic review and meta-analysis. FASEB 2016; 30:906.9.
Jenkins DJ, Kendall CW, McKeown-Eyssen G, et al. Effect of a low-glycemic index or a high-cereal fiber diet on type 2 diabetes: a randomized trial. JAMA 2008; 300:2742–2753.
Järvi AE, Karlstrom BE, Granfeldt YE, Bjorck IE, Asp NG, Vessby BO. Improved glycaemic control and lipid profile and normalized fibrinolytic activity on a low-glycaemic index diet in type 2 diabetes patients. Diabetes Care 1999; 22:10–18.
Evert AB, Boucher JL, Cypress M, et al. Nutrition therapy recommendations for the management of adults with diabetes. Diabetes Care 2014; 37(suppl 1):S120–S143.
Savage DB, Petersen KF, Shulman GI. Disordered lipid metabolism and the pathogenesis of insulin resistance. Physiol Rev 2007; 87:507–520.
Risérus U. Fatty acids and insulin sensitivity. Curr Opin Clin Nutr Metab Care 2008; 11:100–105.
Oomen CM, Ocke MC, Feskens EJ, van Erp-Baart MA, Kok FJ, Kromhout D. Association between trans fatty acid intake and 10-year risk of coronary heart disease in the Zutphen Elderly Study: a prospective population-based study. Lancet 2001; 357:746–751.
Nordmann AJ, Nordmann A, Briel M, et al. Effects of low-carbohydrate vs low-fat diets on weight loss and cardiovascular risk factors: a meta-analysis of randomized controlled trials. Arch Intern Med 2006; 166:285–293.
Foster GD, Wyatt HR, Hill JO, et al. Weight and metabolic outcomes after 2 years on a low-carbohydrate versus low-fat diet: a randomized trial. Ann Intern Med 2010; 153:147–157.
Saris WH. Very-low-calorie diets and sustained weight loss. Obes Res 2001; 9(suppl 4):295S–301S.
Tsai A, Wadden TA. The evolution of very-low-calorie diets: an update and meta-analysis. Obesity 2006; 14:1283–1293.
Toubro S, Astrup A. Randomised comparison of diets for maintaining obese subjects’ weight after major weight loss: ad lib, low fat, high carbohydrate diet v fixed energy intake. BMJ 1997; 314:29–34.
Rothberg AE, McEwen LN, Kraftson AT, Fowler CE, Herman WH. Very-low-energy diet for type 2 diabetes: an underutilized therapy? J Diabetes Complications 2014; 28:506–510.
Uusitupa MI, Laakso M, Sarlund H, Majander H, Takala J, Penttilä I. Effects of a very-low-calorie diet on metabolic control and cardiovascular risk factors in the treatment of obese non-insulin-dependent diabetics. Am J Clin Nutr 1990; 51:768–773.
Elhayany A, Lustman A, Abel R, Attal-Singer J, Vinker S. A low carbohydrate Mediterranean diet improves cardiovascular risk factors and diabetes control among overweight patients with type 2 diabetes mellitus: a 1-year prospective randomized intervention study. Diabetes Obes Metab 2010; 12:204–209.
Mancini JG, Filion KB, Atallah R, Eisenberg MJ. Systematic review of the Mediterranean diet for long-term weight loss. Am J Med 2016; 129:407–415.e4.
Estruch R, Martinez-González MA, Corella D, et al; PREDIMED Study Investigators. Effects of a Mediterranean-style diet on cardiovascular risk factors: a randomized trial. Ann Intern Med 2006; 145:1–11.
Salas-Salvadó J, Bulló M, Babio N, et al; PREDIMED Study Investigators. Reduction in the incidence of type 2 diabetes with the Mediterranean diet: results of the PREDIMED-Reus nutrition intervention randomized trial. Diabetes Care 2011; 34:14–19.
Esposito K, Maiorino MI, Ciotola M, et al. Effects of a Mediterranean-style diet on the need for antihyperglycemic drug therapy in patients with newly diagnosed type 2 diabetes: a randomized trial. Ann Intern Med 2009; 151:306–314.
Chang J, Kashyap SR. The protein-sparing modified fast for obese patients with type 2 diabetes: what to expect. Cleve Clin J Med 2014; 81:557–565.
Palgi A, Read JL, Greenberg I, Hoefer MA, Bistrian BR, Blackburn GL. Multidisciplinary treatment of obesity with a protein-sparing modified fast: results in 668 outpatients. Am J Public Health 1985; 75:1190–1194.
Paisey RB, Frost J, Harvey P, et al. Five year results of a prospective very low calorie diet or conventional weight loss programme in type 2 diabetes. J Hum Nutr Diet 2002; 15:121–127.
Hughes TA, Gwynne JT, Switzer BR, Herbst C, White G. Effects of caloric restriction and weight loss on glycemic control, insulin release and resistance, and atherosclerotic risk in obese patients with type II diabetes mellitus. Am J Med 1984; 77:7–17.
Li Z, Tseng CH, Li Q, Deng ML, Wang M, Heber D. Clinical efficacy of a medically supervised outpatient high-protein, low-calorie diet program is equivalent in prediabetic, diabetic and normoglycemic obese patients. Nutr Diabetes 2014; 4:e105.
Mishra S, Xu J, Agarwal U, Gonzales J, Levin S, Barnard ND. A multicenter randomized controlled trial of a plant-based nutrition program to reduce body weight and cardiovascular risk in the corporate setting: the GEICO study. Eur J Clin Nutr 2013; 67:718–724.
Parker B, Noakes M, Luscombe N, Clifton P. Effect of a high-protein, high-monounsaturated fat weight loss diet on glycemic control and lipid levels in type 2 diabetes. Diabetes Care 2002; 25:425–430.
Ajala O, English P, Pinkney J. Systematic review and meta-analysis of different dietary approaches to the management of type 2 diabetes. Am J Clin Nutr 2013; 97:505–516.
Gannon MC, Nuttall FQ. Effect of a high-protein, low-carbohydrate diet on blood glucose control in people with type 2 diabetes. Diabetes 2004; 53:2375–2382.
Diabetes, type 2 diabetes, T2DM, type 2 diabetes mellitus, type 2 DM, obesity, overweight, weight-loss, diet, vegetarian, vegan, low-carbohydrate diet, low-glycemic diet, low-fat diet, very low-calorie diet, high-protein diet, protein-sparing modified fast, Mediterranean diet, Zahrae Sandouk, Cecilia Lansang
Legacy Keywords
Diabetes, type 2 diabetes, T2DM, type 2 diabetes mellitus, type 2 DM, obesity, overweight, weight-loss, diet, vegetarian, vegan, low-carbohydrate diet, low-glycemic diet, low-fat diet, very low-calorie diet, high-protein diet, protein-sparing modified fast, Mediterranean diet, Zahrae Sandouk, Cecilia Lansang
Citation Override
Cleveland Clinic Journal of Medicine 2017 July;84(suppl 1):S4-S14
Inside the Article
KEY POINTS
Weight loss in individuals who are obese has been shown to be effective in the prevention and management of type 2 diabetes.
Diets vary based on the type and amount of carbohydrate, fat, and protein consumed to meet daily caloric intake goals.
Diets of equal caloric intake result in similar weight loss and glucose control regardless of the macronutrient content.
The metabolic status of the patient based on lipid profiles and renal and liver function is the main determinant for the macronutient composition of the diet.
Disallow All Ads
Content Gating
No Gating (article Unlocked/Free)
Alternative CME
Disqus Comments
Default
Consolidated Pubs: Do Not Show Source Publication Logo
Type 2 diabetes has emerged as a major public health and economic burden of the 21st century. Recent statistics from the Centers for Disease Control and Prevention suggest that diabetes affects 29.1 million people in the United States,1 and the International Diabetes Federation estimates diabetes effects 366 million people worldwide.2
As these shocking numbers continue to increase, the cost of caring for patients with diabetes is placing enormous strain on the economies of the US and other countries. In order to manage and treat a disease on the scale of diabetes, the approaches need to be efficacious, sustainable, scalable, and affordable.
Of all the treatment options available, including multiple new medications and bariatric surgery (for patients who meet the criteria, discussed elsewhere in this supplement),3–5 exercise as part of a lifestyle approach6 is a strategy that meets the majority of these criteria.
The health benefits of exercise have a long and storied history. Hippocrates, the father of scientific medicine, was the first physician on record to recognize the value of exercise for a patient with “consumption.”7 Today, exercise is recommended as one of the first management strategies for patients newly diagnosed with type 2 diabetes and, together with diet and behavior modification, is a central component of all type 2 diabetes and obesity prevention programs.
The evidence base for the efficacy, scalability, and affordability of exercise includes multiple large randomized controlled trials; and these data were used to create the recently updated exercise guidelines for the prevention and treatment of type 2 diabetes, published by the American Diabetes Association (ADA), American College of Sports Medicine (ACSM), and other national organizations.8–10
Herein, we highlight the literature surrounding the metabolic effects and clinical outcomes in patients with type 2 diabetes following exercise intervention, and point to future directions for translational research in the field of exercise and diabetes.
It is known that adults who maintain a physically active lifestyle can reduce their risk of developing impaired glucose tolerance, insulin resistance, and type 2 diabetes.8 It has also been established that low cardiovascular fitness is a strong and independent predictor of all-cause mortality in patients with type 2 diabetes.11,12 Indeed, patients with diabetes are 2 to 4 times more likely than healthy individuals to suffer from cardiovascular disease, due to the metabolic complexity and underlying comorbidities of type 2 diabetes including obesity, insulin resistance, dyslipidemia, hyperglycemia, and hypertension.13,14
Additionally, elevated hemoglobin A1c (HbA1c) levels are predictive of vascular complications in patients with diabetes, and regular exercise has been shown to reduce HbA1c levels, both alone and in conjunction with dietary intervention. In a meta-analysis of 9 randomized trials comprising 266 adults with type 2 diabetes, patients randomized to 20 weeks of regular exercise at 50% to 75% of their maximal aerobic capacity (VO2max) demonstrated marked improvements in HbA1c and cardiorespiratory fitness.11 Importantly, larger reductions in HbA1c were observed with more intense exercise, reflecting greater improvements in blood glucose control with increasing exercise intensity.
In addition to greater energy expenditure, which aids in reversing obesity-associated type 2 diabetes, exercise also boosts insulin action through short-term effects, mainly via insulin-independent glucose transport. For example, our laboratory and others have shown that as little as 7 days of vigorous aerobic exercise training in adults with type 2 diabetes results in improved glycemic control, without any effect on body weight.15,16 Specifically, we observed decreased fasting plasma insulin, a 45% increase in insulin-stimulated glucose disposal, and suppressed hepatic glucose production (HGP) during carefully controlled euglycemic hyperinsulinemic clamps.15
Although the metabolic benefits of exercise are striking, the effects are short-lived and begin to fade within 48 to 96 hours.17 Therefore, an ongoing exercise program is required to maintain the favorable metabolic milieu that can be derived through exercise.
EXERCISE MODALITIES
Aerobic exercise
The vast majority of the literature about the effects of exercise on glycemic parameters in type 2 diabetes has been centered on interventions involving aerobic exercise. Aerobic exercise consists of continuous, rhythmic movement of large muscle groups, such as in walking, jogging, and cycling. The most recent ADA guidelines state that individual sessions of aerobic activity should ideally last at least 30 minutes per day and be performed 3 to 7 days of the week (Table 1).18 Moderate to vigorous (65%–90% of maximum heart rate) aerobic exercise training improves VO2max and cardiac output, which are associated with substantially reduced cardiovascular and overall mortality risk in patients with type 2 diabetes.19
Notably, aerobic exercise is a well-established way to improve HbA1c, and strong evidence exists with regard to the effects of aerobic activity on weight loss and the enhanced regulation of lipid and lipoprotein metabolism.8 For example, in a 2007 report, 6 months of aerobic exercise training in 60 adults with type 2 diabetes led to reductions in HbA1c (−0.63% ± 0.41 vs 0.31% ± 0.10, P < .001), fasting plasma glucose (−18.6 mg/dL ± 4.4 vs 4.28 mg/dL ± 2.57, P < .001), insulin resistance (−1.52 ± 0.6 vs 0.56 ± 0.44, P = .023; as measured by homeostatic model assessment), fasting insulin (−2.91 mU/L ± 0.4 vs 0.94 mU/L ± 0.21, P = .031), and systolic blood pressure (−6.9 mm Hg ± 5.19 vs 1.22 mm Hg ± 1.09, P = .010) compared with the control group.14
Furthermore, meta-analyses reviewing the benefits of aerobic activity for patients with type 2 diabetes have repeatedly confirmed that compared with patients in sedentary control groups, aerobic exercise improves glycemic control, insulin sensitivity, oxidative capacity, and important related metabolic parameters.11 Taken together, there is ample evidence that aerobic exercise is a tried-and-true exercise modality for managing and preventing type 2 diabetes.
Resistance training
During the last 2 decades, resistance training has gained considerable recognition as a viable exercise training option for patients with type 2 diabetes. Synonymous with strength training, resistance exercise involves movements utilizing free weights, weight machines, body weight exercises, or elastic resistance bands.
Primary outcomes in studies evaluating the effects of resistance training in type 2 diabetes have found improvements that range from 10% to 15% in strength, bone mineral density, blood pressure, lipid profiles, cardiovascular health, insulin sensitivity, and muscle mass.18,20 Furthermore, because of the increased prevalence of type 2 diabetes with aging, coupled with age-related decline in muscle mass, known as sarcopenia,21 resistance training can provide additional health benefits in older adults.
Dunstan et al21 reported a threefold greater reduction in HbA1c in patients with type 2 diabetes ages 60 to 80 compared with nonexercising patients in a control group. They also noted an increase in lean body mass in the resistance-training group, while those in the nonexercising control group lost lean mass after 6 months. In a shorter, 8-week circuit weight training study performed by the same research group, patients with type 2 diabetes had improved glucose and insulin responses during an oral glucose tolerance test.22
These findings support the use of resistance training as part of a diabetes management plan. In addition, key opinion leaders advocate that the resistance-training-induced increase in skeletal muscle mass and the associated reductions in HbA1c may indicate that skeletal muscle is a “sink” for glucose; thus, the improved glycemic control in response to resistance training may be at least in part the result of enhanced muscle glycogen storage.21,23
Based on increasing evidence supporting the role of resistance training in glycemic control, the ADA and ACSM recently updated their exercise guidelines for treatment and prevention of type 2 diabetes to include resistance training.9
Combining aerobic and resistance training
The combination of aerobic and resistance training, as recommended by current ADA guidelines, may be the most effective exercise modality for controlling glucose and lipids in type 2 diabetes.
Cuff et al24 evaluated whether a combined training program could improve insulin sensitivity beyond that of aerobic exercise alone in 28 postmenopausal women with type 2 diabetes. Indeed, 16 weeks of combined training led to significantly increased insulin-mediated glucose uptake compared with a group performing only aerobic exercise, reflecting greater insulin sensitivity.
Balducci et al25 demonstrated that combined aerobic and resistance training markedly improved HbA1c (from 8.31% ± 1.73 to 7.1% ± 1.16, P < .001) compared with the control group and globally improved risk factors for cardiovascular disease, supporting the notion that combined training for patients with type 2 diabetes may have additive benefits.
Of note, Snowling and Hopkins26 performed a head-to-head meta-analysis of 27 controlled trials on the metabolic effects of aerobic, resistance, and combination training in a total of 1,003 patients with diabetes. All 3 exercise modes provided favorable effects on HbA1c, fasting and postprandial glucose levels, insulin sensitivity, and fasting insulin levels, and the differences between exercise modalities were trivial.
In contrast, Schwingshackl and colleagues27 performed a systematic review of 14 randomized controlled trials for the same 3 exercise modalities in 915 adults with diabetes and reported that combined training produced a significantly greater reduction in HbA1c than aerobic or resistance training alone.
Future research is necessary to quantify the additive and synergistic clinical benefits of combined exercise compared with aerobic or resistance training regimens alone; however, evidence suggests that combination exercise may be the optimal strategy for managing diabetes.
High-intensity interval training
High-intensity interval training (HIIT) has emerged as one of the fastest growing exercise programs in recent years. HIIT consists of 4 to 6 repeated, short (30-second) bouts of maximal effort interspersed with brief periods (30 to 60 seconds) of rest or active recovery. Exercise is typically performed on a stationary bike, and a single session lasts about 10 minutes.
HIIT increases skeletal muscle oxidative capacity, glycemic control, and insulin sensitivity in adults with type 2 diabetes.28,29 A recent meta-analysis that quantified the effects of HIIT programs on glucose regulation and insulin resistance reported superior effects for HIIT compared with aerobic training or no exercise as a control.28 Specifically, in 50 trials with interventions lasting at least 2 weeks, participants in HIIT groups had a 0.19% decrease in HbA1c and a 1.3-kg decrease in body weight compared with control groups.
Alternative high-intensity exercise programs have also emerged in recent years such as CrossFit, which we evaluated in a group of 12 patients with type 2 diabetes. Our proof-of-concept study found that a 6-week CrossFit program reduced body fat, diastolic blood pressure, lipids, and metabolic syndrome Z-score, and increased insulin sensitivity to glucose, basal fat oxidation, VO2max, and high-molecular-weight adiponectin.30 HIIT appears to be another effective way to improve metabolic health; and for patients with type 2 diabetes who can tolerate HIIT, it may be a time-efficient, alternative approach to continuous aerobic exercise.
BENEFITS OF EXERCISE FOR SPECIFIC METABOLIC TISSUES
Within 5 years of the discovery of insulin by Banting and Best in 1921, the first report of exercise-induced improvements in insulin action was published, though the specific cellular and molecular mechanisms that underpin these effects remain unknown.31
Figure 1. Tissue-specific metabolic effects of exercise in patients with type 2 diabetes.
There is general agreement that the acute or short-term exercise effects are the result of insulin-dependent and insulin-independent mechanisms, while longer-term effects also involve “organ crosstalk,” such as from skeletal muscle to adipose tissue, the liver, and the pancreas, all of which mediate favorable systemic effects on HbA1c, blood glucose levels, blood pressure, and serum lipid profiles (Figure 1).
Skeletal muscle
Following a meal, skeletal muscle is the primary site for glucose disposal and uptake. Peripheral insulin resistance originating in skeletal muscle is a major driver for the development and progression of type 2 diabetes.
Exercise enhances skeletal muscle glucose uptake using both insulin-dependent and insulin-independent mechanisms, and regular exercise results in sustained improvements in insulin sensitivity and glucose disposal.32
Of note, acute bouts of exercise can also temporarily enhance glucose uptake by the skeletal muscle up to fivefold via increased (insulin-independent) glucose transport.33 As this transient effect fades, it is replaced by increased insulin sensitivity, and over time, these 2 adaptations to exercise result in improvements in both the insulin responsiveness and insulin sensitivity of skeletal muscle.34
The fuel-sensing enzyme adenosine monophosphate-activated protein kinase (AMPK) is the major insulin-independent regulator of glucose uptake, and its activation in skeletal muscle by exercise induces glucose transport, lipid and protein synthesis, and nutrient metabolism.35 AMPK remains transiently activated after exercise and regulates several downstream targets involved in mitochondrial biogenesis and function and oxidative capacity.36
In this regard, aerobic training has been shown to increase skeletal muscle mitochondrial content and oxidative enzymes, resulting in dramatic improvements in glucose and fatty acid oxidation10 and increased expression of proteins involved in insulin signaling.37
Adipose tissue
Exercise confers numerous positive effects in adipose tissue, namely, reduced fat mass, enhanced insulin sensitivity, and decreased inflammation. Chronic low-grade inflammation has been integrally linked to type 2 diabetes and increases the risk of cardiovascular disease.38
Several inflammatory adipokines have emerged as novel predictors for the development of atherosclerosis,39 and fat-cell enlargement from excessive caloric intake leads to increased production of pro-inflammatory cytokines, altered adipokine secretion, increased circulating fatty acids, and lipotoxicity concomitant with insulin resistance.40
It has been suggested that exercise may suppress cytokine production through reduced inflammatory cell infiltration and improved adipocyte function.41 Levels of the key pro-inflammatory marker C-reactive protein is markedly reduced by exercise,14,42 and normalization of adipokine signaling and related cytokine secretion has been validated for multiple exercise modalities.42
Moreover, Ibañez et al43 demonstrated that in addition to significant improvements in insulin sensitivity, resistance exercise training reduced visceral and subcutaneous fat mass in patients with type 2 diabetes.
Liver
The liver regulates fasting glucose through gluconeogenesis and glycogen storage. The liver is also the primary site of action for pancreatic hormones during the transition from pre- to postprandial states.
As with skeletal muscle and adipose tissue, insulin resistance is also present within the liver in patients with type 2 diabetes. Specifically, impaired suppression of HGP by insulin is a hallmark of type 2 diabetes, leading to sustained hyperglycemia.44
Approaches using fasting measures of glucose and insulin do not distinguish between peripheral and hepatic insulin resistance.45 Instead, hepatic insulin sensitivity and HGP are best assessed by the hyperinsulinemic-euglycemic clamp technique, along with isotopic glucose tracers.15
Although more elaborate, magnetic resonance spectroscopy may also be used to assess intrahepatic lipid content, as its accumulation has been shown to drive hepatic insulin resistance.46 Indirect measures of hepatic dysfunction may be made from increased levels of the circulating hepatic enzymes alkaline phosphatase, alanine transaminase, and aspartate transaminase.16
From an exercise perspective, we have shown that 7 days of aerobic training, in the absence of weight loss, improves hepatic insulin sensitivity.15 It has also been shown that hepatic AMPK is stimulated during exercise, suggesting that an AMPK-induced adaptive response to exercise may facilitate improved suppression of HGP.47 We have also shown that a longer 12-week aerobic exercise intervention reduces hepatic insulin resistance, with and without restricted caloric intake.48 Further, HGP correlated with reduced visceral fat, suggesting that this fat depot may play an important mechanistic role in improved hepatic function.
Pancreas
Insulin resistance in adipose tissue, muscle, or the liver places greater demand on insulin secretion from pancreatic beta cells. For many, this hypersecretory state is unsustainable, and the subsequent loss of beta-cell function marks the onset of type 2 diabetes.49 Fasting plasma glucose, insulin, and glucagon levels are generally poor indicators of beta-cell function.
Clinical research studies typically use the oral glucose tolerance test and hyperglycemic clamp technique to more accurately measure the dynamic regulation of glucose homeostasis by the pancreas.50 However, few studies have examined the effects of exercise on beta-cell function in type 2 diabetes.
Dela and colleagues51 showed that 3 months of aerobic training improved beta-cell function in type 2 diabetes, but only in those who had some residual function and were less severely diabetic. We have shown that a 12-week aerobic exercise intervention improves beta-cell function in older obese adults and in patients with type 2 diabetes.52,53 We have also found that improvements in glycemic control that occur with exercise are better predicted by changes in insulin secretion as opposed to peripheral insulin sensitivity.54 It has also been shown that a relatively short (8-week) HIIT program improved beta-cell function in patients with type 2 diabetes.55 And we recently found that a 6-week CrossFit training program improved beta-cell function in adults with type 2 diabetes.30
SUMMARY, CONCLUSIONS, AND FUTURE DIRECTIONS
Regular exercise produces health benefits beyond improvements in cardiovascular fitness. These include enhanced glycemic control, insulin signaling, and blood lipids, as well as reduced low-grade inflammation, improved vascular function, and weight loss.
Both aerobic and resistance training programs promote healthier skeletal muscle, adipose tissue, liver, and pancreatic function.18 Greater whole-body insulin sensitivity is seen immediately after exercise and persists for up to 96 hours. While a discrete bout of exercise provides substantial metabolic benefits in diabetic cohorts, maintenance of glucose control and insulin sensitivity are maximized by physiologic adaptations that only occur with weeks, months, and years of exercise training.15,33
Exercise intensity,11 volume, and frequency56 are associated with reductions in HbA1c; however, a consensus has not been reached on whether one is a better determinant than the other.
The most important consideration when recommending exercise to patients with type 2 diabetes is that the intensity and volume be optimized for the greatest metabolic benefit while avoiding injury or cardiovascular risk. In general, the risk of exercise-induced adverse events is low, even in adults with type 2 diabetes, and there is no current evidence that screening procedures beyond usual diabetes care are needed to safely prescribe exercise in asymptomatic patients in this population.18
Future clinical research in this area will provide a broader appreciation for the interactions (positive and negative) between exercise and diabetes medications, the synergy between exercise and bariatric surgery, and the potential to use exercise to reduce the health burden of diabetes complications, including nephropathy, retinopathy, neuropathy, and peripheral arterial disease.
Moreover, basic research will likely identify the detailed molecular defects that contribute to diabetes in insulin-targeted tissues. The emerging science surrounding cytokines, adipokines, myokines, and, most recently, exerkines is likely to deepen our understanding of the mechanistic links between exercise and diabetes management.
Finally, although we have ample evidence that exercise is an effective, scalable, and affordable approach to prevent and manage type 2 diabetes, we still need to overcome the challenge of discovering how to make exercise sustainable for patients.
References
Centers for Disease Control and Prevention. National Diabetes Statistics Report: Estimates of Diabetes and Its Burden in the United States, 2014. US Department of Health and Human Services; 2014.
Whiting DR, Guariguata L, Weil C, Shaw J. IDF diabetes atlas: global estimates of the prevalence of diabetes for 2011 and 2030. Diabetes Res Clin Pract 2011; 94:311–321.
Korner J, Bessler M, Cirilo LJ, et al. Effects of Roux-en-Y gastric bypass surgery on fasting and postprandial concentrations of plasma ghrelin, peptide YY, and insulin. J Clin Endocrinol Metab 2005; 90:359–365.
Schauer PR, Bhatt DL, Kirwan JP, et al; for the STAMPEDE Investigators. Bariatric surgery versus intensive medical therapy for diabetes—3-year outcomes. N Engl J Med 2014; 370:2002–2013.
Schauer PR, Kashyap SR, Wolski K, et al. Bariatric surgery versus intensive medical therapy in obese patients with diabetes. N Engl J Med 2012; 366:1567–1576.
Wing RR, Bolin P, Brancati FL, et al; for the Look AHEAD Research Group. Cardiovascular effects of intensive lifestyle intervention in type 2 diabetes. N Engl J Med 2013; 369:145–154.
Tipton CM. The history of “Exercise Is Medicine” in ancient civilizations. Adv Physiol Educ 2014; 38:109–117.
Zanuso S, Jimenez A, Pugliese G, Corigliano G, Balducci S. Exercise for the management of type 2 diabetes: a review of the evidence. Acta Diabetol 2010; 47:15–22.
Sigal RJ, Kenny GP, Wasserman DH, Castaneda-Sceppa C, White RD. Physical activity/exercise and type 2 diabetes: a consensus statement from the American Diabetes Association. Diabetes Care 2006; 29:1433–1438.
Garber CE, Blissmer B, Deschenes MR, et al; for the American College of Sports Medicine. Quantity and quality of exercise for developing and maintaining cardiorespiratory, musculoskeletal, and neuromotor fitness in apparently healthy adults: guidance for prescribing exercise. Med Sci Sports Exerc 2011; 43:1334–1359.
Boulé NG, Kenny GP, Haddad E, Wells GA, Sigal RJ. Meta-analysis of the effect of structured exercise training on cardiorespiratory fitness in type 2 diabetes mellitus. Diabetologia 2003; 46:1071–1081.
Wei M, Gibbons LW, Kampert JB, Nichaman MZ, Blair SN. Low cardiorespiratory fitness and physical inactivity as predictors of mortality in men with type 2 diabetes. Ann Intern Med 2000; 132:605–611.
Haffner SM, Lehto S, Rönnemaa T, Pyörälä K, Laakso M. Mortality from coronary heart disease in subjects with type 2 diabetes and in nondiabetic subjects with and without prior myocardial infarction. N Engl J Med 1998; 339:229–234.
Kadoglou NPE, Iliadis F, Angelopoulou N, et al. The anti-inflammatory effects of exercise training in patients with type 2 diabetes mellitus. Eur J Cardiovasc Prev Rehabil 2007; 14:837–843.
Kirwan JP, Solomon TPJ, Wojta DM, Staten MA, Holloszy JO. Effects of 7 days of exercise training on insulin sensitivity and responsiveness in type 2 diabetes mellitus. Am J Physiol Endocrinol Metab 2009; 297:E151–E156.
Winnick JJ, Sherman WM, Habash DL, et al. Short-term aerobic exercise training in obese humans with type 2 diabetes mellitus improves whole-body insulin sensitivity through gains in peripheral, not hepatic insulin sensitivity. J Clin Endocrinol Metab 2008; 93:771–778.
King DS, Baldus PJ, Sharp RL, Kesl LD, Feltmeyer TL, Riddle MS. Time course for exercise-induced alterations in insulin action and glucose tolerance in middle-aged people. J Appl Physiol (1985) 1995; 78:17–22.
Colberg SR, Sigal RJ, Yardley JE, et al. Physical activity/exercise and diabetes: a position statement of the American Diabetes Association. Diabetes Care 2016; 39:2065–2079.
Sluik D, Buijsse B, Muckelbauer R, et al. Physical activity and mortality in individuals with diabetes mellitus: a prospective study and meta-analysis. Arch Intern Med 2012; 172:1285–1295.
Gordon BA, Benson AC, Bird SR, Fraser SF. Resistance training improves metabolic health in type 2 diabetes: a systematic review. Diabetes Res Clin Pract 2009; 83:157–175.
Dunstan DW, Daly RM, Owen N, et al. High-intensity resistance training improves glycemic control in older patients with type 2 diabetes. Diabetes Care 2002; 25:1729–1736.
Dunstan DW, Puddey IB, Beilin LJ, Burke V, Morton AR, Stanton KG. Effects of a short-term circuit weight training program on glycaemic control in NIDDM. Diabetes Res Clin Pract 1998; 40:53–61.
Castaneda C, Layne JE, Munoz-Orians L, et al. A randomized controlled trial of resistance exercise training to improve glycemic control in older adults with type 2 diabetes. Diabetes Care 2002; 25:2335–2341.
Cuff DJ, Meneilly GS, Martin A, Ignaszewski A, Tildesley HD, Frohlich JJ. Effective exercise modality to reduce insulin resistance in women with type 2 diabetes. Diabetes Care 2003; 26:2977–2982.
Balducci S, Leonetti F, Di Mario U, Fallucca F. Is a long-term aerobic plus resistance training program feasible for and effective on metabolic profiles in type 2 diabetic patients [letter]? Diabetes Care 2004; 27:841–842.
Snowling NJ, Hopkins WG. Effects of different modes of exercise training on glucose control and risk factors for complications in type 2 diabetic patients: a meta-analysis. Diabetes Care 2006; 29:2518–2527.
Schwingshackl L, Missbach B, Dias S, König J, Hoffmann G. Impact of different training modalities on glycaemic control and blood lipids in patients with type 2 diabetes: a systematic review and network meta-analysis. Diabetologia 2014; 57:1789–1797.
Jelleyman C, Yates T, O’Donovan G, et al. The effects of high-intensity interval training on glucose regulation and insulin resistance: a meta-analysis. Obes Rev 2015; 16:942–961.
Gibala MJ, Little JP, Macdonald MJ, Hawley JA. Physiological adaptations to low-volume, high-intensity interval training in health and disease. J Physiol 2012; 590:1077–1084.
Nieuwoudt S, Fealy CE, Foucher JA, et al. Functional high intensity training improves pancreatic beta-cell function in adults with type 2 diabetes. Am J Physiol Endocrinol Metab 2017. doi 10.1152/ajpendo.00407.2016 [Epub ahead of print]
Lawrence RD. The effect of exercise on insulin action in diabetes. Br Med J 1926; 1:648–650.
Magkos F, Tsekouras Y, Kavouras SA, Mittendorfer B, Sidossis LS. Improved insulin sensitivity after a single bout of exercise is curvilinearly related to exercise energy expenditure. Clin Sci (Lond) 2008; 114:59–64.
Hawley JA, Hargreaves M, Zierath JR. Signalling mechanisms in skeletal muscle: role in substrate selection and muscle adaptation. Essays Biochem 2006; 42:1–12.
Ruderman NB, Carling D, Prentki M, Cacicedo JM. AMPK, insulin resistance, and the metabolic syndrome. J Clin Invest 2013; 123:2764–2772.
Mulya A, Haus JM, Solomon TPJ, et al. Exercise training-induced improvement in skeletal muscle PGC-1alpha-mediated fat metabolism is independent of dietary glycemic index. Obesity (Silver Spring) 2017; 25:721–729.
Dandona P, Aljada A, Chaudhuri A, Bandyopadhyay A. The potential influence of inflammation and insulin resistance on the pathogenesis and treatment of atherosclerosis-related complications in type 2 diabetes. J Clin Endocrinol Metab 2003; 88:2422–2429.
Kritchevsky SB, Cesari M, Pahor M. Inflammatory markers and cardiovascular health in older adults. Cardiovasc Res 2005; 66:265–275.
Cusi K. The role of adipose tissue and lipotoxicity in the pathogenesis of type 2 diabetes. Curr Diab Rep 2010; 10:306–315.
Balducci S, Zanuso S, Nicolucci A, et al. Anti-inflammatory effect of exercise training in subjects with type 2 diabetes and the metabolic syndrome is dependent on exercise modalities and independent of weight loss. Nutr Metab Cardiovasc Dis 2010; 20:608–617.
Jorge MLMP, de Oliveira VN, Resende NM, et al. The effects of aerobic, resistance, and combined exercise on metabolic control, inflammatory markers, adipocytokines, and muscle insulin signaling in patients with type 2 diabetes mellitus. Metabolism 2011; 60:1244–1252.
Ibañez J, Izquierdo M, Argüelles I, et al. Twice-weekly progressive resistance training decreases abdominal fat and improves insulin sensitivity in older men with type 2 diabetes. Diabetes Care 2005; 28:662–667.
Basu R, Chandramouli V, Dicke B, Landau B, Rizza R. Obesity and type 2 diabetes impair insulin-induced suppression of glycogenolysis as well as gluconeogenesis. Diabetes 2005; 54:1942–1948.
Wallace TM, Levy JC, Matthews DR. Use and abuse of HOMA modeling. Diabetes Care 2004; 27:1487–1495.
Petersen KF, Dufour S, Befroy D, Lehrke M, Hendler RE, Shulman GI. Reversal of nonalcoholic hepatic steatosis, hepatic insulin resistance, and hyperglycemia by moderate weight reduction in patients with type 2 diabetes. Diabetes 2005; 54:603–608.
Carlson CL, Winder WW. Liver AMP-activated protein kinase and acetyl-CoA carboxylase during and after exercise. J Appl Physiol (1985) 1999; 86:669–674.
Haus JM, Solomon TPJ, Marchetti CM, et al. Decreased visfatin after exercise training correlates with improved glucose tolerance. Med Sci Sports Exerc 2009; 41:1255–1260.
DeFronzo RA. Pathogenesis of type 2 (non-insulin dependent) diabetes mellitus: a balanced overview. Diabetologia 1992; 35:389–397.
Cersosimo E, Solis-Herrera C, Trautmann ME, Malloy J, Triplitt CL. Assessment of pancreatic beta-cell function: review of methods and clinical applications. Curr Diabetes Rev 2014; 10:2–42.
Dela F, von Linstow ME, Mikines KJ, Galbo H. Physical training may enhance beta-cell function in type 2 diabetes. Am J Physiol Endocrinol Metab 2004; 287:E1024–E1031.
Solomon TPJ, Haus JM, Kelly KR, Rocco M, Kashyap SR, Kirwan JP. Improved pancreatic beta-cell function in type 2 diabetic patients after lifestyle-induced weight loss is related to glucose-dependent insulinotropic polypeptide. Diabetes Care 2010; 33:1561–1566.
Kirwan JP, Kohrt WM, Wojta DM, Bourey RE, Holloszy JO. Endurance exercise training reduces glucose-stimulated insulin levels in 60- to 70-year-old men and women. J Gerontol 1993; 48:M84–M90.
Solomon TPJ, Malin SK, Karstoft K, Kashyap SR, Haus JM, Kirwan JP. Pancreatic beta-cell function is a stronger predictor of changes in glycemic control after an aerobic exercise intervention than insulin sensitivity. J Clin Endocrinol Metab 2013; 98:4176–4186.
Madsen SM, Thorup AC, Overgaard K, Jeppesen PB. High intensity interval training improves glycaemic control and pancreatic beta cell function of type 2 diabetes patients. PloS One 2015; 10:e0133286.
Umpierre D, Ribeiro PAB, Schaan BD, Ribeiro JP. Volume of supervised exercise training impacts glycaemic control in patients with type 2 diabetes: a systematic review with meta-regression analysis. Diabetologia 2013; 56:242–251.
John P. Kirwan, PhD Department of Pathobiology, Lerner Research Institute, Cleveland Clinic; Department of Physiology and Biophysics, Case Western Reserve University; Metabolic Translational Research Center, Endocrinology & Metabolism Institute, Cleveland Clinic, Cleveland, OH
Jessica Sacks Department of Pathobiology, Lerner Research Institute, Cleveland Clinic, Department of Physiology and Biophysics, Case Western Reserve University, Cleveland, OH
Stephan Nieuwoudt Department of Pathobiology, Lerner Research Institute, Cleveland Clinic; Department of Physiology and Biophysics, Case Western Reserve University, Cleveland, OH
Correspondence: John P. Kirwan, PhD, Department of Pathobiology, Lerner Research Institute, NE40, Cleveland Clinic, 9500 Euclid Avenue, Cleveland, OH 44195; [email protected]
Dr. Kirwan reported research grant support from NIH R01DK108089, NIH R01HD088061, NIH U34DK107917, NIH R21AR067477, and Metagenics Inc. Jessica Sacks and Stephan Nieuwoudt reported no financial interests or relationships that pose a potential conflict of interest with this article.
Author and Disclosure Information
John P. Kirwan, PhD Department of Pathobiology, Lerner Research Institute, Cleveland Clinic; Department of Physiology and Biophysics, Case Western Reserve University; Metabolic Translational Research Center, Endocrinology & Metabolism Institute, Cleveland Clinic, Cleveland, OH
Jessica Sacks Department of Pathobiology, Lerner Research Institute, Cleveland Clinic, Department of Physiology and Biophysics, Case Western Reserve University, Cleveland, OH
Stephan Nieuwoudt Department of Pathobiology, Lerner Research Institute, Cleveland Clinic; Department of Physiology and Biophysics, Case Western Reserve University, Cleveland, OH
Correspondence: John P. Kirwan, PhD, Department of Pathobiology, Lerner Research Institute, NE40, Cleveland Clinic, 9500 Euclid Avenue, Cleveland, OH 44195; [email protected]
Dr. Kirwan reported research grant support from NIH R01DK108089, NIH R01HD088061, NIH U34DK107917, NIH R21AR067477, and Metagenics Inc. Jessica Sacks and Stephan Nieuwoudt reported no financial interests or relationships that pose a potential conflict of interest with this article.
Type 2 diabetes has emerged as a major public health and economic burden of the 21st century. Recent statistics from the Centers for Disease Control and Prevention suggest that diabetes affects 29.1 million people in the United States,1 and the International Diabetes Federation estimates diabetes effects 366 million people worldwide.2
As these shocking numbers continue to increase, the cost of caring for patients with diabetes is placing enormous strain on the economies of the US and other countries. In order to manage and treat a disease on the scale of diabetes, the approaches need to be efficacious, sustainable, scalable, and affordable.
Of all the treatment options available, including multiple new medications and bariatric surgery (for patients who meet the criteria, discussed elsewhere in this supplement),3–5 exercise as part of a lifestyle approach6 is a strategy that meets the majority of these criteria.
The health benefits of exercise have a long and storied history. Hippocrates, the father of scientific medicine, was the first physician on record to recognize the value of exercise for a patient with “consumption.”7 Today, exercise is recommended as one of the first management strategies for patients newly diagnosed with type 2 diabetes and, together with diet and behavior modification, is a central component of all type 2 diabetes and obesity prevention programs.
The evidence base for the efficacy, scalability, and affordability of exercise includes multiple large randomized controlled trials; and these data were used to create the recently updated exercise guidelines for the prevention and treatment of type 2 diabetes, published by the American Diabetes Association (ADA), American College of Sports Medicine (ACSM), and other national organizations.8–10
Herein, we highlight the literature surrounding the metabolic effects and clinical outcomes in patients with type 2 diabetes following exercise intervention, and point to future directions for translational research in the field of exercise and diabetes.
It is known that adults who maintain a physically active lifestyle can reduce their risk of developing impaired glucose tolerance, insulin resistance, and type 2 diabetes.8 It has also been established that low cardiovascular fitness is a strong and independent predictor of all-cause mortality in patients with type 2 diabetes.11,12 Indeed, patients with diabetes are 2 to 4 times more likely than healthy individuals to suffer from cardiovascular disease, due to the metabolic complexity and underlying comorbidities of type 2 diabetes including obesity, insulin resistance, dyslipidemia, hyperglycemia, and hypertension.13,14
Additionally, elevated hemoglobin A1c (HbA1c) levels are predictive of vascular complications in patients with diabetes, and regular exercise has been shown to reduce HbA1c levels, both alone and in conjunction with dietary intervention. In a meta-analysis of 9 randomized trials comprising 266 adults with type 2 diabetes, patients randomized to 20 weeks of regular exercise at 50% to 75% of their maximal aerobic capacity (VO2max) demonstrated marked improvements in HbA1c and cardiorespiratory fitness.11 Importantly, larger reductions in HbA1c were observed with more intense exercise, reflecting greater improvements in blood glucose control with increasing exercise intensity.
In addition to greater energy expenditure, which aids in reversing obesity-associated type 2 diabetes, exercise also boosts insulin action through short-term effects, mainly via insulin-independent glucose transport. For example, our laboratory and others have shown that as little as 7 days of vigorous aerobic exercise training in adults with type 2 diabetes results in improved glycemic control, without any effect on body weight.15,16 Specifically, we observed decreased fasting plasma insulin, a 45% increase in insulin-stimulated glucose disposal, and suppressed hepatic glucose production (HGP) during carefully controlled euglycemic hyperinsulinemic clamps.15
Although the metabolic benefits of exercise are striking, the effects are short-lived and begin to fade within 48 to 96 hours.17 Therefore, an ongoing exercise program is required to maintain the favorable metabolic milieu that can be derived through exercise.
EXERCISE MODALITIES
Aerobic exercise
The vast majority of the literature about the effects of exercise on glycemic parameters in type 2 diabetes has been centered on interventions involving aerobic exercise. Aerobic exercise consists of continuous, rhythmic movement of large muscle groups, such as in walking, jogging, and cycling. The most recent ADA guidelines state that individual sessions of aerobic activity should ideally last at least 30 minutes per day and be performed 3 to 7 days of the week (Table 1).18 Moderate to vigorous (65%–90% of maximum heart rate) aerobic exercise training improves VO2max and cardiac output, which are associated with substantially reduced cardiovascular and overall mortality risk in patients with type 2 diabetes.19
Notably, aerobic exercise is a well-established way to improve HbA1c, and strong evidence exists with regard to the effects of aerobic activity on weight loss and the enhanced regulation of lipid and lipoprotein metabolism.8 For example, in a 2007 report, 6 months of aerobic exercise training in 60 adults with type 2 diabetes led to reductions in HbA1c (−0.63% ± 0.41 vs 0.31% ± 0.10, P < .001), fasting plasma glucose (−18.6 mg/dL ± 4.4 vs 4.28 mg/dL ± 2.57, P < .001), insulin resistance (−1.52 ± 0.6 vs 0.56 ± 0.44, P = .023; as measured by homeostatic model assessment), fasting insulin (−2.91 mU/L ± 0.4 vs 0.94 mU/L ± 0.21, P = .031), and systolic blood pressure (−6.9 mm Hg ± 5.19 vs 1.22 mm Hg ± 1.09, P = .010) compared with the control group.14
Furthermore, meta-analyses reviewing the benefits of aerobic activity for patients with type 2 diabetes have repeatedly confirmed that compared with patients in sedentary control groups, aerobic exercise improves glycemic control, insulin sensitivity, oxidative capacity, and important related metabolic parameters.11 Taken together, there is ample evidence that aerobic exercise is a tried-and-true exercise modality for managing and preventing type 2 diabetes.
Resistance training
During the last 2 decades, resistance training has gained considerable recognition as a viable exercise training option for patients with type 2 diabetes. Synonymous with strength training, resistance exercise involves movements utilizing free weights, weight machines, body weight exercises, or elastic resistance bands.
Primary outcomes in studies evaluating the effects of resistance training in type 2 diabetes have found improvements that range from 10% to 15% in strength, bone mineral density, blood pressure, lipid profiles, cardiovascular health, insulin sensitivity, and muscle mass.18,20 Furthermore, because of the increased prevalence of type 2 diabetes with aging, coupled with age-related decline in muscle mass, known as sarcopenia,21 resistance training can provide additional health benefits in older adults.
Dunstan et al21 reported a threefold greater reduction in HbA1c in patients with type 2 diabetes ages 60 to 80 compared with nonexercising patients in a control group. They also noted an increase in lean body mass in the resistance-training group, while those in the nonexercising control group lost lean mass after 6 months. In a shorter, 8-week circuit weight training study performed by the same research group, patients with type 2 diabetes had improved glucose and insulin responses during an oral glucose tolerance test.22
These findings support the use of resistance training as part of a diabetes management plan. In addition, key opinion leaders advocate that the resistance-training-induced increase in skeletal muscle mass and the associated reductions in HbA1c may indicate that skeletal muscle is a “sink” for glucose; thus, the improved glycemic control in response to resistance training may be at least in part the result of enhanced muscle glycogen storage.21,23
Based on increasing evidence supporting the role of resistance training in glycemic control, the ADA and ACSM recently updated their exercise guidelines for treatment and prevention of type 2 diabetes to include resistance training.9
Combining aerobic and resistance training
The combination of aerobic and resistance training, as recommended by current ADA guidelines, may be the most effective exercise modality for controlling glucose and lipids in type 2 diabetes.
Cuff et al24 evaluated whether a combined training program could improve insulin sensitivity beyond that of aerobic exercise alone in 28 postmenopausal women with type 2 diabetes. Indeed, 16 weeks of combined training led to significantly increased insulin-mediated glucose uptake compared with a group performing only aerobic exercise, reflecting greater insulin sensitivity.
Balducci et al25 demonstrated that combined aerobic and resistance training markedly improved HbA1c (from 8.31% ± 1.73 to 7.1% ± 1.16, P < .001) compared with the control group and globally improved risk factors for cardiovascular disease, supporting the notion that combined training for patients with type 2 diabetes may have additive benefits.
Of note, Snowling and Hopkins26 performed a head-to-head meta-analysis of 27 controlled trials on the metabolic effects of aerobic, resistance, and combination training in a total of 1,003 patients with diabetes. All 3 exercise modes provided favorable effects on HbA1c, fasting and postprandial glucose levels, insulin sensitivity, and fasting insulin levels, and the differences between exercise modalities were trivial.
In contrast, Schwingshackl and colleagues27 performed a systematic review of 14 randomized controlled trials for the same 3 exercise modalities in 915 adults with diabetes and reported that combined training produced a significantly greater reduction in HbA1c than aerobic or resistance training alone.
Future research is necessary to quantify the additive and synergistic clinical benefits of combined exercise compared with aerobic or resistance training regimens alone; however, evidence suggests that combination exercise may be the optimal strategy for managing diabetes.
High-intensity interval training
High-intensity interval training (HIIT) has emerged as one of the fastest growing exercise programs in recent years. HIIT consists of 4 to 6 repeated, short (30-second) bouts of maximal effort interspersed with brief periods (30 to 60 seconds) of rest or active recovery. Exercise is typically performed on a stationary bike, and a single session lasts about 10 minutes.
HIIT increases skeletal muscle oxidative capacity, glycemic control, and insulin sensitivity in adults with type 2 diabetes.28,29 A recent meta-analysis that quantified the effects of HIIT programs on glucose regulation and insulin resistance reported superior effects for HIIT compared with aerobic training or no exercise as a control.28 Specifically, in 50 trials with interventions lasting at least 2 weeks, participants in HIIT groups had a 0.19% decrease in HbA1c and a 1.3-kg decrease in body weight compared with control groups.
Alternative high-intensity exercise programs have also emerged in recent years such as CrossFit, which we evaluated in a group of 12 patients with type 2 diabetes. Our proof-of-concept study found that a 6-week CrossFit program reduced body fat, diastolic blood pressure, lipids, and metabolic syndrome Z-score, and increased insulin sensitivity to glucose, basal fat oxidation, VO2max, and high-molecular-weight adiponectin.30 HIIT appears to be another effective way to improve metabolic health; and for patients with type 2 diabetes who can tolerate HIIT, it may be a time-efficient, alternative approach to continuous aerobic exercise.
BENEFITS OF EXERCISE FOR SPECIFIC METABOLIC TISSUES
Within 5 years of the discovery of insulin by Banting and Best in 1921, the first report of exercise-induced improvements in insulin action was published, though the specific cellular and molecular mechanisms that underpin these effects remain unknown.31
Figure 1. Tissue-specific metabolic effects of exercise in patients with type 2 diabetes.
There is general agreement that the acute or short-term exercise effects are the result of insulin-dependent and insulin-independent mechanisms, while longer-term effects also involve “organ crosstalk,” such as from skeletal muscle to adipose tissue, the liver, and the pancreas, all of which mediate favorable systemic effects on HbA1c, blood glucose levels, blood pressure, and serum lipid profiles (Figure 1).
Skeletal muscle
Following a meal, skeletal muscle is the primary site for glucose disposal and uptake. Peripheral insulin resistance originating in skeletal muscle is a major driver for the development and progression of type 2 diabetes.
Exercise enhances skeletal muscle glucose uptake using both insulin-dependent and insulin-independent mechanisms, and regular exercise results in sustained improvements in insulin sensitivity and glucose disposal.32
Of note, acute bouts of exercise can also temporarily enhance glucose uptake by the skeletal muscle up to fivefold via increased (insulin-independent) glucose transport.33 As this transient effect fades, it is replaced by increased insulin sensitivity, and over time, these 2 adaptations to exercise result in improvements in both the insulin responsiveness and insulin sensitivity of skeletal muscle.34
The fuel-sensing enzyme adenosine monophosphate-activated protein kinase (AMPK) is the major insulin-independent regulator of glucose uptake, and its activation in skeletal muscle by exercise induces glucose transport, lipid and protein synthesis, and nutrient metabolism.35 AMPK remains transiently activated after exercise and regulates several downstream targets involved in mitochondrial biogenesis and function and oxidative capacity.36
In this regard, aerobic training has been shown to increase skeletal muscle mitochondrial content and oxidative enzymes, resulting in dramatic improvements in glucose and fatty acid oxidation10 and increased expression of proteins involved in insulin signaling.37
Adipose tissue
Exercise confers numerous positive effects in adipose tissue, namely, reduced fat mass, enhanced insulin sensitivity, and decreased inflammation. Chronic low-grade inflammation has been integrally linked to type 2 diabetes and increases the risk of cardiovascular disease.38
Several inflammatory adipokines have emerged as novel predictors for the development of atherosclerosis,39 and fat-cell enlargement from excessive caloric intake leads to increased production of pro-inflammatory cytokines, altered adipokine secretion, increased circulating fatty acids, and lipotoxicity concomitant with insulin resistance.40
It has been suggested that exercise may suppress cytokine production through reduced inflammatory cell infiltration and improved adipocyte function.41 Levels of the key pro-inflammatory marker C-reactive protein is markedly reduced by exercise,14,42 and normalization of adipokine signaling and related cytokine secretion has been validated for multiple exercise modalities.42
Moreover, Ibañez et al43 demonstrated that in addition to significant improvements in insulin sensitivity, resistance exercise training reduced visceral and subcutaneous fat mass in patients with type 2 diabetes.
Liver
The liver regulates fasting glucose through gluconeogenesis and glycogen storage. The liver is also the primary site of action for pancreatic hormones during the transition from pre- to postprandial states.
As with skeletal muscle and adipose tissue, insulin resistance is also present within the liver in patients with type 2 diabetes. Specifically, impaired suppression of HGP by insulin is a hallmark of type 2 diabetes, leading to sustained hyperglycemia.44
Approaches using fasting measures of glucose and insulin do not distinguish between peripheral and hepatic insulin resistance.45 Instead, hepatic insulin sensitivity and HGP are best assessed by the hyperinsulinemic-euglycemic clamp technique, along with isotopic glucose tracers.15
Although more elaborate, magnetic resonance spectroscopy may also be used to assess intrahepatic lipid content, as its accumulation has been shown to drive hepatic insulin resistance.46 Indirect measures of hepatic dysfunction may be made from increased levels of the circulating hepatic enzymes alkaline phosphatase, alanine transaminase, and aspartate transaminase.16
From an exercise perspective, we have shown that 7 days of aerobic training, in the absence of weight loss, improves hepatic insulin sensitivity.15 It has also been shown that hepatic AMPK is stimulated during exercise, suggesting that an AMPK-induced adaptive response to exercise may facilitate improved suppression of HGP.47 We have also shown that a longer 12-week aerobic exercise intervention reduces hepatic insulin resistance, with and without restricted caloric intake.48 Further, HGP correlated with reduced visceral fat, suggesting that this fat depot may play an important mechanistic role in improved hepatic function.
Pancreas
Insulin resistance in adipose tissue, muscle, or the liver places greater demand on insulin secretion from pancreatic beta cells. For many, this hypersecretory state is unsustainable, and the subsequent loss of beta-cell function marks the onset of type 2 diabetes.49 Fasting plasma glucose, insulin, and glucagon levels are generally poor indicators of beta-cell function.
Clinical research studies typically use the oral glucose tolerance test and hyperglycemic clamp technique to more accurately measure the dynamic regulation of glucose homeostasis by the pancreas.50 However, few studies have examined the effects of exercise on beta-cell function in type 2 diabetes.
Dela and colleagues51 showed that 3 months of aerobic training improved beta-cell function in type 2 diabetes, but only in those who had some residual function and were less severely diabetic. We have shown that a 12-week aerobic exercise intervention improves beta-cell function in older obese adults and in patients with type 2 diabetes.52,53 We have also found that improvements in glycemic control that occur with exercise are better predicted by changes in insulin secretion as opposed to peripheral insulin sensitivity.54 It has also been shown that a relatively short (8-week) HIIT program improved beta-cell function in patients with type 2 diabetes.55 And we recently found that a 6-week CrossFit training program improved beta-cell function in adults with type 2 diabetes.30
SUMMARY, CONCLUSIONS, AND FUTURE DIRECTIONS
Regular exercise produces health benefits beyond improvements in cardiovascular fitness. These include enhanced glycemic control, insulin signaling, and blood lipids, as well as reduced low-grade inflammation, improved vascular function, and weight loss.
Both aerobic and resistance training programs promote healthier skeletal muscle, adipose tissue, liver, and pancreatic function.18 Greater whole-body insulin sensitivity is seen immediately after exercise and persists for up to 96 hours. While a discrete bout of exercise provides substantial metabolic benefits in diabetic cohorts, maintenance of glucose control and insulin sensitivity are maximized by physiologic adaptations that only occur with weeks, months, and years of exercise training.15,33
Exercise intensity,11 volume, and frequency56 are associated with reductions in HbA1c; however, a consensus has not been reached on whether one is a better determinant than the other.
The most important consideration when recommending exercise to patients with type 2 diabetes is that the intensity and volume be optimized for the greatest metabolic benefit while avoiding injury or cardiovascular risk. In general, the risk of exercise-induced adverse events is low, even in adults with type 2 diabetes, and there is no current evidence that screening procedures beyond usual diabetes care are needed to safely prescribe exercise in asymptomatic patients in this population.18
Future clinical research in this area will provide a broader appreciation for the interactions (positive and negative) between exercise and diabetes medications, the synergy between exercise and bariatric surgery, and the potential to use exercise to reduce the health burden of diabetes complications, including nephropathy, retinopathy, neuropathy, and peripheral arterial disease.
Moreover, basic research will likely identify the detailed molecular defects that contribute to diabetes in insulin-targeted tissues. The emerging science surrounding cytokines, adipokines, myokines, and, most recently, exerkines is likely to deepen our understanding of the mechanistic links between exercise and diabetes management.
Finally, although we have ample evidence that exercise is an effective, scalable, and affordable approach to prevent and manage type 2 diabetes, we still need to overcome the challenge of discovering how to make exercise sustainable for patients.
References
Centers for Disease Control and Prevention. National Diabetes Statistics Report: Estimates of Diabetes and Its Burden in the United States, 2014. US Department of Health and Human Services; 2014.
Whiting DR, Guariguata L, Weil C, Shaw J. IDF diabetes atlas: global estimates of the prevalence of diabetes for 2011 and 2030. Diabetes Res Clin Pract 2011; 94:311–321.
Korner J, Bessler M, Cirilo LJ, et al. Effects of Roux-en-Y gastric bypass surgery on fasting and postprandial concentrations of plasma ghrelin, peptide YY, and insulin. J Clin Endocrinol Metab 2005; 90:359–365.
Schauer PR, Bhatt DL, Kirwan JP, et al; for the STAMPEDE Investigators. Bariatric surgery versus intensive medical therapy for diabetes—3-year outcomes. N Engl J Med 2014; 370:2002–2013.
Schauer PR, Kashyap SR, Wolski K, et al. Bariatric surgery versus intensive medical therapy in obese patients with diabetes. N Engl J Med 2012; 366:1567–1576.
Wing RR, Bolin P, Brancati FL, et al; for the Look AHEAD Research Group. Cardiovascular effects of intensive lifestyle intervention in type 2 diabetes. N Engl J Med 2013; 369:145–154.
Tipton CM. The history of “Exercise Is Medicine” in ancient civilizations. Adv Physiol Educ 2014; 38:109–117.
Zanuso S, Jimenez A, Pugliese G, Corigliano G, Balducci S. Exercise for the management of type 2 diabetes: a review of the evidence. Acta Diabetol 2010; 47:15–22.
Sigal RJ, Kenny GP, Wasserman DH, Castaneda-Sceppa C, White RD. Physical activity/exercise and type 2 diabetes: a consensus statement from the American Diabetes Association. Diabetes Care 2006; 29:1433–1438.
Garber CE, Blissmer B, Deschenes MR, et al; for the American College of Sports Medicine. Quantity and quality of exercise for developing and maintaining cardiorespiratory, musculoskeletal, and neuromotor fitness in apparently healthy adults: guidance for prescribing exercise. Med Sci Sports Exerc 2011; 43:1334–1359.
Boulé NG, Kenny GP, Haddad E, Wells GA, Sigal RJ. Meta-analysis of the effect of structured exercise training on cardiorespiratory fitness in type 2 diabetes mellitus. Diabetologia 2003; 46:1071–1081.
Wei M, Gibbons LW, Kampert JB, Nichaman MZ, Blair SN. Low cardiorespiratory fitness and physical inactivity as predictors of mortality in men with type 2 diabetes. Ann Intern Med 2000; 132:605–611.
Haffner SM, Lehto S, Rönnemaa T, Pyörälä K, Laakso M. Mortality from coronary heart disease in subjects with type 2 diabetes and in nondiabetic subjects with and without prior myocardial infarction. N Engl J Med 1998; 339:229–234.
Kadoglou NPE, Iliadis F, Angelopoulou N, et al. The anti-inflammatory effects of exercise training in patients with type 2 diabetes mellitus. Eur J Cardiovasc Prev Rehabil 2007; 14:837–843.
Kirwan JP, Solomon TPJ, Wojta DM, Staten MA, Holloszy JO. Effects of 7 days of exercise training on insulin sensitivity and responsiveness in type 2 diabetes mellitus. Am J Physiol Endocrinol Metab 2009; 297:E151–E156.
Winnick JJ, Sherman WM, Habash DL, et al. Short-term aerobic exercise training in obese humans with type 2 diabetes mellitus improves whole-body insulin sensitivity through gains in peripheral, not hepatic insulin sensitivity. J Clin Endocrinol Metab 2008; 93:771–778.
King DS, Baldus PJ, Sharp RL, Kesl LD, Feltmeyer TL, Riddle MS. Time course for exercise-induced alterations in insulin action and glucose tolerance in middle-aged people. J Appl Physiol (1985) 1995; 78:17–22.
Colberg SR, Sigal RJ, Yardley JE, et al. Physical activity/exercise and diabetes: a position statement of the American Diabetes Association. Diabetes Care 2016; 39:2065–2079.
Sluik D, Buijsse B, Muckelbauer R, et al. Physical activity and mortality in individuals with diabetes mellitus: a prospective study and meta-analysis. Arch Intern Med 2012; 172:1285–1295.
Gordon BA, Benson AC, Bird SR, Fraser SF. Resistance training improves metabolic health in type 2 diabetes: a systematic review. Diabetes Res Clin Pract 2009; 83:157–175.
Dunstan DW, Daly RM, Owen N, et al. High-intensity resistance training improves glycemic control in older patients with type 2 diabetes. Diabetes Care 2002; 25:1729–1736.
Dunstan DW, Puddey IB, Beilin LJ, Burke V, Morton AR, Stanton KG. Effects of a short-term circuit weight training program on glycaemic control in NIDDM. Diabetes Res Clin Pract 1998; 40:53–61.
Castaneda C, Layne JE, Munoz-Orians L, et al. A randomized controlled trial of resistance exercise training to improve glycemic control in older adults with type 2 diabetes. Diabetes Care 2002; 25:2335–2341.
Cuff DJ, Meneilly GS, Martin A, Ignaszewski A, Tildesley HD, Frohlich JJ. Effective exercise modality to reduce insulin resistance in women with type 2 diabetes. Diabetes Care 2003; 26:2977–2982.
Balducci S, Leonetti F, Di Mario U, Fallucca F. Is a long-term aerobic plus resistance training program feasible for and effective on metabolic profiles in type 2 diabetic patients [letter]? Diabetes Care 2004; 27:841–842.
Snowling NJ, Hopkins WG. Effects of different modes of exercise training on glucose control and risk factors for complications in type 2 diabetic patients: a meta-analysis. Diabetes Care 2006; 29:2518–2527.
Schwingshackl L, Missbach B, Dias S, König J, Hoffmann G. Impact of different training modalities on glycaemic control and blood lipids in patients with type 2 diabetes: a systematic review and network meta-analysis. Diabetologia 2014; 57:1789–1797.
Jelleyman C, Yates T, O’Donovan G, et al. The effects of high-intensity interval training on glucose regulation and insulin resistance: a meta-analysis. Obes Rev 2015; 16:942–961.
Gibala MJ, Little JP, Macdonald MJ, Hawley JA. Physiological adaptations to low-volume, high-intensity interval training in health and disease. J Physiol 2012; 590:1077–1084.
Nieuwoudt S, Fealy CE, Foucher JA, et al. Functional high intensity training improves pancreatic beta-cell function in adults with type 2 diabetes. Am J Physiol Endocrinol Metab 2017. doi 10.1152/ajpendo.00407.2016 [Epub ahead of print]
Lawrence RD. The effect of exercise on insulin action in diabetes. Br Med J 1926; 1:648–650.
Magkos F, Tsekouras Y, Kavouras SA, Mittendorfer B, Sidossis LS. Improved insulin sensitivity after a single bout of exercise is curvilinearly related to exercise energy expenditure. Clin Sci (Lond) 2008; 114:59–64.
Hawley JA, Hargreaves M, Zierath JR. Signalling mechanisms in skeletal muscle: role in substrate selection and muscle adaptation. Essays Biochem 2006; 42:1–12.
Ruderman NB, Carling D, Prentki M, Cacicedo JM. AMPK, insulin resistance, and the metabolic syndrome. J Clin Invest 2013; 123:2764–2772.
Mulya A, Haus JM, Solomon TPJ, et al. Exercise training-induced improvement in skeletal muscle PGC-1alpha-mediated fat metabolism is independent of dietary glycemic index. Obesity (Silver Spring) 2017; 25:721–729.
Dandona P, Aljada A, Chaudhuri A, Bandyopadhyay A. The potential influence of inflammation and insulin resistance on the pathogenesis and treatment of atherosclerosis-related complications in type 2 diabetes. J Clin Endocrinol Metab 2003; 88:2422–2429.
Kritchevsky SB, Cesari M, Pahor M. Inflammatory markers and cardiovascular health in older adults. Cardiovasc Res 2005; 66:265–275.
Cusi K. The role of adipose tissue and lipotoxicity in the pathogenesis of type 2 diabetes. Curr Diab Rep 2010; 10:306–315.
Balducci S, Zanuso S, Nicolucci A, et al. Anti-inflammatory effect of exercise training in subjects with type 2 diabetes and the metabolic syndrome is dependent on exercise modalities and independent of weight loss. Nutr Metab Cardiovasc Dis 2010; 20:608–617.
Jorge MLMP, de Oliveira VN, Resende NM, et al. The effects of aerobic, resistance, and combined exercise on metabolic control, inflammatory markers, adipocytokines, and muscle insulin signaling in patients with type 2 diabetes mellitus. Metabolism 2011; 60:1244–1252.
Ibañez J, Izquierdo M, Argüelles I, et al. Twice-weekly progressive resistance training decreases abdominal fat and improves insulin sensitivity in older men with type 2 diabetes. Diabetes Care 2005; 28:662–667.
Basu R, Chandramouli V, Dicke B, Landau B, Rizza R. Obesity and type 2 diabetes impair insulin-induced suppression of glycogenolysis as well as gluconeogenesis. Diabetes 2005; 54:1942–1948.
Wallace TM, Levy JC, Matthews DR. Use and abuse of HOMA modeling. Diabetes Care 2004; 27:1487–1495.
Petersen KF, Dufour S, Befroy D, Lehrke M, Hendler RE, Shulman GI. Reversal of nonalcoholic hepatic steatosis, hepatic insulin resistance, and hyperglycemia by moderate weight reduction in patients with type 2 diabetes. Diabetes 2005; 54:603–608.
Carlson CL, Winder WW. Liver AMP-activated protein kinase and acetyl-CoA carboxylase during and after exercise. J Appl Physiol (1985) 1999; 86:669–674.
Haus JM, Solomon TPJ, Marchetti CM, et al. Decreased visfatin after exercise training correlates with improved glucose tolerance. Med Sci Sports Exerc 2009; 41:1255–1260.
DeFronzo RA. Pathogenesis of type 2 (non-insulin dependent) diabetes mellitus: a balanced overview. Diabetologia 1992; 35:389–397.
Cersosimo E, Solis-Herrera C, Trautmann ME, Malloy J, Triplitt CL. Assessment of pancreatic beta-cell function: review of methods and clinical applications. Curr Diabetes Rev 2014; 10:2–42.
Dela F, von Linstow ME, Mikines KJ, Galbo H. Physical training may enhance beta-cell function in type 2 diabetes. Am J Physiol Endocrinol Metab 2004; 287:E1024–E1031.
Solomon TPJ, Haus JM, Kelly KR, Rocco M, Kashyap SR, Kirwan JP. Improved pancreatic beta-cell function in type 2 diabetic patients after lifestyle-induced weight loss is related to glucose-dependent insulinotropic polypeptide. Diabetes Care 2010; 33:1561–1566.
Kirwan JP, Kohrt WM, Wojta DM, Bourey RE, Holloszy JO. Endurance exercise training reduces glucose-stimulated insulin levels in 60- to 70-year-old men and women. J Gerontol 1993; 48:M84–M90.
Solomon TPJ, Malin SK, Karstoft K, Kashyap SR, Haus JM, Kirwan JP. Pancreatic beta-cell function is a stronger predictor of changes in glycemic control after an aerobic exercise intervention than insulin sensitivity. J Clin Endocrinol Metab 2013; 98:4176–4186.
Madsen SM, Thorup AC, Overgaard K, Jeppesen PB. High intensity interval training improves glycaemic control and pancreatic beta cell function of type 2 diabetes patients. PloS One 2015; 10:e0133286.
Umpierre D, Ribeiro PAB, Schaan BD, Ribeiro JP. Volume of supervised exercise training impacts glycaemic control in patients with type 2 diabetes: a systematic review with meta-regression analysis. Diabetologia 2013; 56:242–251.
The essential role of exercise in the management of type 2 diabetes
Display Headline
The essential role of exercise in the management of type 2 diabetes
Legacy Keywords
Diabetes, type 2 diabetes, T2DM, type 2 diabetes mellitus, type 2 DM, obesity, overweight, exercise, aerobic, resistance training, interval training, John Kirwan, Jessica Sacks, Stephan Nieuwoudt
Legacy Keywords
Diabetes, type 2 diabetes, T2DM, type 2 diabetes mellitus, type 2 DM, obesity, overweight, exercise, aerobic, resistance training, interval training, John Kirwan, Jessica Sacks, Stephan Nieuwoudt
Citation Override
Cleveland Clinic Journal of Medicine 2017 July;84(suppl 1):S15-S21
Inside the Article
KEY POINTS
Exercise is often the first lifestyle recommendation made to patients newly diagnosed with type 2 diabetes.
Together with diet and behavior modification, exercise is central to effective lifestyle prevention and management of type 2 diabetes.
All exercise, whether aerobic or resistance training or a combination, facilitates improved glucose regulation.
In addition to the cardiovascular benefits, long-term exercise promotes healthier skeletal muscle, adipose tissue, and liver and pancreas function.
Exercise programs for patients with type 2 diabetes should be of sufficient intensity and volume to maximize the metabolic benefit while avoiding injury and cardiovascular risk.
Disallow All Ads
Content Gating
No Gating (article Unlocked/Free)
Alternative CME
Disqus Comments
Default
Consolidated Pubs: Do Not Show Source Publication Logo
Diabesity was a term coined by Sims et al1 in the 1970s to describe diabetes occurring in the setting of obesity. Today, the link between type 2 diabetes mellitus (DM), obesity, and insulin resistance is well recognized, and 80% of people with type 2 DM are overweight or obese.2,3 Unfortunately, weight gain is a known side effect of most agents used to treat type 2 DM (eg, insulin, sulfonylureas, thiazolidinediones), and this often leads to nonadherence, poor glycemic control, and further weight gain.
During the past several years, evidence has emerged of a neurophysiologic mechanism that involves hormones from adipocytes, pancreatic islet cells, and the gastrointestinal tract implicated in both obesity and diabetes.2 This has led to research for drugs that not only either target obesity and diabetes or reduce hemoglobin A1c (HbA1c), but also have weight loss as a potential side effect.
In this paper, we review medications approved for the treatment of type 2 DM (including pramlintide, also approved for type 1 DM) that also have weight loss as a side effect. Drugs we will discuss include glucagon-like peptide-1 (GLP-1) receptor agonists, sodium-glucose cotransporter-2 (SGLT-2) inhibitors, neuroendocrine peptide hormones, alpha-glucosidase inhibitors, and metformin. Where appropriate, we also comment on the effects of the drugs on cardiovascular outcomes.
GLP-1 RECEPTOR AGONISTS
Mechanism of action
GLP-1 is a hormone produced from the proglucagon gene in the alpha cells of the pancreas, in the L cells of intestinal mucosa (predominantly in the ileum and distal colon), and in structures of the nervous system including the brainstem, hypothalamus, and vagal afferent nerves.4 Food in the gastrointestinal tract, especially if high in fats and carbohydrates, stimulates secretion of GLP-1 in the L cells, which in turn amplifies insulin secretion in a glucose-dependent manner (the incretin effect).4 Glucagon secretion is inhibited by GLP-1 during times of hyperglycemia but not hypoglycemia, thereby preventing inappropriately high levels of the hormone.5 Peripheral GLP-1 activates a cascade of centrally mediated signals that ultimately result in secretion of insulin by the pancreas and slowing of gastrointestinal motility.5 Lastly, GLP-1 exerts an anorexic effect by acting on central pathways that mediate satiation.6
Recent studies suggest that GLP-1 receptor agonist drugs have proliferative, anti-apoptotic, and differentiation effects on pancreatic beta cells, thereby leading to improved glycemic control.7Table 1 summarizes the sites of action and physiologic effects of GLP-1.7
Bioactive forms of GLP-1 are rapidly degraded in the circulation by the dipeptidyl peptidase-4 enzyme. GLP-1 receptor agonists have slightly altered molecular structure and longer duration of action than native GLP-1. Short-acting GLP-1 agonists (eg, exenatide, lixisenatide) have more effect on gastric emptying and lower postprandial blood glucose levels, whereas long-acting GLP-1 agonists (eg, liraglutide, albiglutide, dulaglutide, semaglutide, exenatide) have a greater effect on fasting glucose levels.4
Effects on HbA1c and weight loss
As a class, GLP-1 receptor agonists have been proven to cause significant reduction in HbA1c levels. In a meta-analysis of 17 randomized controlled trials involving patients with type 2 DM with suboptimal control on 1 or 2 oral agents, GLP-1 agonists decreased HbA1c levels by 1% (treatment difference 0.5% to 1.6%) compared with placebo.8 HbA1c reductions from each GLP-1 agonist along with dosing, administration, and weight loss benefit are shown in Table 2.9–14
Of the current GLP-1 agonists, exenatide and liraglutide have been on the market the longest, thus studied more in terms of weight reduction.
Exenatide. Exenatide BID was the first GLP-1 agonist, approved by the US Food and Drug Administration (FDA) in 2005 for the treatment of type 2 DM. In a 30-week triple-blind, placebo-controlled study of 336 patients already on background therapy with metformin, progressive weight loss was noted with exenatide 5 μg (−1.6 ± 0.4 kg) and exenatide 10 μg (−2.8 ± 0.5 kg) compared with placebo (−0.3 ± 0.3 kg; P < .001).15 A meta-analysis of 14 trials with 2,583 patients showed significant weight reduction with both exenatide 5 μg twice daily (a difference of −0.56 kg, 95% confidence interval [CI] −1.07 to −0.06, P = .0002) in 8 trials and exenatide 10 μg twice daily (a difference of −1.24 kg, 95% CI −1.69 to −0.78, P < .001) in 12 trials, after treatment for more than 16 weeks.16
Liraglutide. Liraglutide has a longer half-life than exenatide and is administered once daily. It is not a first-line therapy for type 2 DM and is recommended as an add-on. Approved daily doses for type 2 DM are 1.2 mg and 1.8 mg.
Multiple studies of glycemic control and weight loss with liraglutide have been conducted since its introduction to the US market in 2010. In the Liraglutide Effect and Action in Diabetes (LEAD) series of trials, liraglutide use as monotherapy or in combination with oral agents was associated with significant dose-dependent weight loss.17 Liraglutide monotherapy (at 1.2 mg and 1.8 mg) compared with glimepiride in the LEAD-3 trial led to significant weight reduction (2.1 kg and 2.5 kg, respectively, P < .001) after 16 weeks, and was sustained up to 52 weeks.18 Addition of liraglutide (at 1.2 mg and 1.8 mg) to metformin plus rosiglitazone resulted in significant weight loss (1.02 kg and 2.02 kg, respectively) whereas the addition of placebo caused a 0.6-kg weight gain (P < .001).19 The SCALE study randomized 846 adults with type 2 DM who were overweight to obese (body mass index [BMI] ≥ 27 kg/m2), were taking 0 to 3 oral antihyperglycemic agents (metformin, thiazolidinedione, and a sulfonylurea), and had stable body weight and an HbA1c of 7% to 10% to liraglutide 1.8 mg, liraglutide 3.0 mg, or placebo. Mean weight loss after 56 weeks was 6.0% (6.4 kg) with liraglutide 1.8 mg, 4.7% (5.0 kg) with liraglutide 3.0 mg, and 2.0% (2.2 kg) with placebo.20
In 2016, high-dose once-daily liraglutide 3.0 mg (Saxenda) was approved by the FDA for weight loss. In a double-blind randomized trial of liraglutide 3.0 mg vs placebo in patients who had a BMI of at least 30 or who had a BMI of at least 27 plus treated or untreated dyslipidemia or hypertension, Pi-Sunyer et al21 reported a mean weight reduction of 8.4 ± 7.3 kg with liraglutide vs 2.8 ± 6.5 kg with placebo (a difference of −5.6 kg, 95% CI −6.0 to −5.1, P < .001) after 56 weeks. Furthermore, 63.2% of patients in the liraglutide group lost at least 5% of body weight vs 27.1% with placebo, and 33.1% in the liraglutide group lost 10% or more of body weight vs 10.6% in the placebo group (P < .001).21 Of note, liraglutide 3.0 mg is not indicated for type 2 DM per se.
In a 2012 meta-analysis of randomized controlled trials of adults with and without type 2 DM, with a BMI of 25 or greater, and who received GLP-1 receptor agonists at clinically relevant doses (exenatide ≥ 10 μg/day, exenatide ≥ 2 mg/week, or liraglutide ≥ 1.2 mg/day), those taking GLP-1 receptor agonists had more weight loss than those on a control intervention (oral antihyperglycemic, insulin, or placebo) at a minimum of 20 weeks, with a weighted mean difference −2.9 kg (95% CI −3.6 to −2.2) in 21 trials and 6,411 participants.22
GLP-1 agonists currently being investigated for obesity treatment are lixisenatide, albiglutide, taspoglutide, and oxyntomodulin.23
Cardiovascular outcomes
The presence of GLP-1 receptors in blood vessels and myocardium has led to the hypothesis that GLP-1 receptor agonists can improve cardiovascular disease outcomes.24 In the pivotal Liraglutide Effect and Action in Diabetes: Evaluation of Cardiovascular Outcome Results (LEADER) trial, 9,340 patients with type 2 DM and increased cardiovascular disease risk were randomized to liraglutide vs placebo.25 The hazard ratio (HR) for time to the primary end point of cardiovascular death, nonfatal myocardial infarction, or nonfatal stroke was 0.87 (P = .01 for superiority, P < .001 for noninferiority) for liraglutide compared with placebo after 3.8 years. The incidence of death from any cause or cardiovascular cause was also lower with liraglutide.25
Adverse effects
Tolerable transient nausea and vomiting are reported adverse effects; these symptoms occur early in therapy, usually resolve in 4 to 8 weeks, and appear to be associated with greater weight loss.26 Although no causal relationship between GLP-1 receptor agonist use and pancreatitis or pancreatic cancer has been established to date, several cases of acute pancreatitis have been reported.25 Alternative therapies should be considered in patients with a history of or risk factors for pancreatitis.
Combined with insulin
A product that combines insulin glargine and lixisenatide (Soliqua) is FDA-approved for patients with type 2 DM. In a 30-week randomized controlled trial of the combination product vs insulin glargine alone in patients with type 2 DM not controlled on basal insulin with or without up to 2 oral agents, the combination product resulted in an HbA1c reduction from baseline of 1.1% vs 0.6% for insulin glargine alone (P < .001).27 Mean body weight decreased by 0.7 kg with the combination product and increased by 0.7 kg with insulin glargine (P < .001).27 In a 24-week study of a lixisenatide-insulin glargine combination vs insulin glargine in insulin-naïve patients taking metformin, there was a reduction in HbA1c of about −1.7% from baseline in both groups, while the combination group had a 1-kg weight reduction compared with a 0.5-kg weight increase in the insulin glargine group (P < .001).28
SGLT-2 INHIBITORS
Mechanism of action
In a healthy normoglycemic person, about 180 g of glucose per day is filtered into the glomerular filtrate and reabsorbed into the circulation.29 SGLT-2 facilitates the reabsorption of glucose in the proximal convoluted tubule of the kidneys. Approximately 90% of glucose reabsorption is mediated by SGLT-2 found in the S1 and S2 segments of the proximal convoluted tubule, and the remaining 10% by SGLT-1 in the S3 segment. At serum glucose levels above 180 g, the reabsorptive capacity of the nephron is overwhelmed, resulting in glycosuria.30 SGLT-2 expression is also increased in patients with diabetes, thus leading to increased glucose reabsorption into the circulation, further contributing to hyperglycemia.30 Inhibition of SGLT-2 alleviates hyperglycemia by decreasing glucose reabsorption (30% to 50% of filtered glucose) in the kidneys and by increasing excretion (50 mg to 80 mg of glucose) in the urine.31 SGLT-2 inhibitors currently FDA-approved are canagliflozin (Invokana), dapagliflozin (Farxiga), and empagliflozin (Jardiance).
HbA1c
SGLT-2 inhibitors have relatively weak glycemic efficacy. A meta-analysis of SGLT-2 inhibitors vs other antidiabetic medications or placebo found that SGLT-2 inhibitors appeared to have a “favorable effect” on HbA1c, with a mean difference vs placebo of −0.66% (95% CI −0.73% to −0.58%) and a mean difference vs other antihyperglycemic medications of −0.06% (95% CI 0.18% to 0.05%).32
Weight loss
The same meta-analysis found that SGLT-2 inhibitors reduced body weight (mean difference −1.8 kg, 95% CI −3.50 kg to −0.11 kg).32 And in a randomized controlled trial, monotherapy with canagliflozin 100 mg/day and 300 mg/day resulted in body weight reduction of 2.2% (1.9 kg) and 3.3% (−2.9 kg), respectively, after 26 weeks.33 A Japanese study showed a dose-related total body weight loss with empagliflozin vs placebo ranging from 2.5 ± 0.2 kg (5-mg dose) to 3.1 ± 0.2 kg (50-mg dose) after 12 weeks.34 Bolinder et al35 reported that adding dapagliflozin 10 mg to metformin in patients with type 2 DM reduced total body weight by −2.96 kg (95% CI −3.51 to −2.41, P < .001) at week 24. Whole-body dual-energy x-ray absorptiometry and magnetic resonance imaging findings in this study revealed a decrease in fat mass and visceral and subcutaneous adipose tissue after treatment with dapagliflozin, thus suggesting urinary loss of glucose (and hence caloric loss) contributing to weight reduction in addition to initial weight loss from fluid loss due to osmotic diuresis.35 A continuous decline in total body weight was observed in a 78-week extension study resulting in −4.54 kg (95% CI −5.43 to −3.66 kg) at week 102, along with further reduction in total body fat mass as measured by dual-energy x-ray absorptiometry.36
Cardiovascular outcomes
The landmark study Empagliflozin, Cardiovascular Outcomes and Mortality in Type 2 Diabetes (EMPA-REG) involving 7,020 patients was the first large cardiovascular outcomes trial in patients with type 2 DM and overt cardiovascular disease. A relative risk reduction of 14% (12.1% to 10.5%, HR 0.86, 95% CI 0.74 to 0.99) in major adverse cardiovascular events (cardiovascular death, nonfatal myocardial infarction, and nonfatal stroke) was observed with empagliflozin.37 Rates of all-cause mortality and hospitalization for heart failure relative risk reductions were 32% (8.3% to 5.7%; HR 0.68 [0.57, 0.8]) and 35% (4.1% to 2.7%; HR 0.65 [0.50, 0.85]), respectively, with empagliflozin. The mechanism behind this cardiovascular benefit is unknown but is currently being explored.37
Adverse effects
Increased risk of urinary tract and genital infections are known adverse effects of SGLT-2s. Other effects noted include postural hypotension from volume depletion and a transient increase in serum creatinine and decrease in glomerular filtration.29
NEUROENDOCRINE PEPTIDE HORMONE: AMYLIN ANALOGUES
Mechanism of action
Amylin is a 37-amino-acid neuroendocrine peptide hormone secreted primarily by pancreatic beta cells. It promotes early satiety, and its anorexigenic effects are mediated by its action on the neurons of the area postrema in the brain.38 After a meal, amylin decreases gastric acid secretion and slows gastric emptying. It is co-secreted with insulin in a 1:20 amylin-to-insulin ratio and inhibits glucagon secretion via a centrally mediated mechanism.39
Pramlintide (Symlin) is an amylin analogue administered subcutaneously immediately before major meals. It decreases postprandial glucose levels and has been approved by the FDA as an adjunct to prandial insulin in patients with type 1 and type 2 DM.40
HbA1c
Amylin secretion is impaired in type 1 and type 2 DM, and small but significant reductions in HbA1c have been observed with addition of pramlintide to usual insulin regimens. In patients with type 1 DM, HbA1c levels were reduced by 0.4% to 0.6% after 26 weeks on 30 μg 3 times daily to 60 μg 4 times daily of pramlintide added to insulin.41,42 And pramlintide 120 μg added to usual antihyperglycemic therapy in patients with type 2 DM has been reported to decrease HbA1c by 0.7% at week 16 or 26.43,44
Weight loss
A meta-analysis of 8 randomized controlled trials assessed the effects of pramlintide on glycemic control and weight in patients with type 2 DM treated with insulin and in obese patients without diabetes.45 In these trials, patients took at least 120 μg of pramlintide before 2 to 3 meals for at least 12 weeks; a total of 1,616 participants were included. In the type 2 DM group, pramlintide reduced body weight by 2.57 kg (95% CI −3.44 to −1.70 kg, P < .001) vs control, over 16 to 52 weeks.45 The nondiabetic obese group had a weight loss of −2.27 kg (95%CI −2.88 to −1.66 kg, P < .001) vs control.45
Pramlintide and a pramlintide-phentermine combination are currently under investigation for treatment of obesity.23
Cardiovascular outcomes
Cardiovascular outcomes in patients treated with pramlintide have not been studied to date, but reductions have been observed in markers of cardiovascular risk including high-sensitivity C-reactive protein and triglycerides.46
Adverse effects
Transient mild-to-moderate nausea is the most common adverse effect of pramlintide. Hypoglycemia has also been reported, more frequently in patients with type 1 DM, which is possibly associated with inadequate reduction in insulin.
ALPHA-GLUCOSIDASE INHIBITORS
Mechanism of action
Alpha-glucosidase inhibitors competitively inhibit the alpha-glucosidase enzymes at the brush border of the small intestine. Taken orally before meals, these drugs mitigate postprandial hyperglycemia by preventing the breakdown of complex carbohydrates into simpler monosaccharides, thus delaying their absorption.47 These agents may be used as monotherapy or in combination with other antihyperglycemic agents. They work independently from insulin, although they have been shown to potentiate GLP-1 secretion.48 Acarbose and miglitol are currently approved in the United States. Acarbose has been more extensively studied worldwide.
HbA1c
Alpha-glucosidase inhibitors have been reported to reduce mean HbA1c by 0.8% (95% CI −0.9% to −0.7%), as well as fasting and postprandial glucose, and postprandial insulin levels.49
Weight loss
There is conflicting evidence on whether alpha-glucosidase inhibitor therapy has a neutral or beneficial effect on body weight. A Cochrane meta-analysis observed significant BMI reduction with acarbose, although no effect on body weight was noted,49 whereas in another meta-analysis, body weight was significantly reduced by 0.96 kg (95% CI −1.80 to −0.12 kg) when acarbose was added to metformin.50 A review of pooled data from worldwide post-marketing studies for acarbose reported a weight reduction after 3 months of 0.98 ± 2.11 kg in overweight patients and 1.67 ± 3.02 kg in obese patients.51
Cardiovascular outcomes
In the Study to Prevent Non-Insulin-Dependent Diabetes Mellitus (STOP-NIDDM), when compared with placebo, treatment of patients with impaired glucose tolerance with acarbose significantly reduced the incidence of cardiovascular events (HR 0.51, 95% CI 0.28 to 0.95, P = .03), myocardial infarction (HR 0.09, 95% CI 0.01 to 0.72, P = .02), and newly diagnosed hypertension (HR 0.66, 95% CI 0.49 to 0.89, P = .006).52
Adverse effects
Although mild, gastrointestinal effects of flatulence and diarrhea can be bothersome and result in discontinuation of the drug in most patients.
METFORMIN
Mechanism of action
Metformin is the first-line antihyperglycemic agent for type 2 DM recommended by the American Diabetes Association and European Association for the Study of Diabetes.53,54 The main action of metformin is to decrease glucose production in the liver. In the small intestine, metformin stimulates the L cells to produce GLP-1, and in skeletal muscle, it increases glucose uptake and disposal.55
HbA1c
As monotherapy, metformin has resulted in HbA1c reductions of 0.88% to 1.2%.55
Weight loss
Reduced food intake56,57 and gastrointestinal intolerance58 occurring early in therapy have been noted to account for weight loss in short-term studies of non-diabetic obese patients treated with metformin.59 Long-term trials of patients with and without diabetes have yielded mixed results on weight reduction from metformin as monotherapy or adjunct therapy. In the United Kingdom Prospective Diabetes Study (UKPDS), metformin had resulted in approximately 1.5 kg of weight gain (slightly less than the 4-kg weight gain in the glibenclamide group).60 Improved antihyperglycemic efficacy of other antihyperglycemic agents (insulin, sulfonylureas, and thiazolidinediones) with addition of metformin led to dose-lowering of the antihyperglycemic agents, ultimately resulting in amelioration of weight gain; this has also led to small weight reductions in some studies.59 In the Diabetes Prevention Program study of patients with impaired glucose tolerance, metformin treatment resulted in an average weight loss of 2.1 kg compared with placebo (−0.1 kg) and lifestyle intervention (−5.6 kg; P <.001).61
Cardiovascular outcomes
Metformin has been observed to decrease micro- and macrovascular complications. Compared with diet alone, metformin was associated with a 39% reduction in the risk of myocardial infarction, and a 30% lower risk of a composite of macrovascular diseases (myocardial infarction, sudden death, angina, stroke, and peripheral disease).60
Adverse effects
The most common adverse effect of metformin is gastrointestinal intolerance from abdominal pain, flatulence, and diarrhea.62 Metformin-associated lactic acidosis is a serious and potentially life-threatening effect; and vitamin B12 deficiency may occur with long-term treatment.62
TAKE-HOME POINTS
As more medications and interventions are being developed to counter obesity, it also makes sense to select diabetes medications that do not contribute to weight gain in patients who are already overweight or obese. The effects of available medications can be maximized and treatment regimens individualized (based on patients’ needs and preferences, within the limitations of drug costs and side effects), along with lifestyle modification, to target diabesity.
References
Sims EAH, Danforth E Jr, Horton ES, Bray GA, Glennon JA, Salans LB. Endocrine and metabolic effects of experimental obesity in man. Recent Prog Horm Res 1973; 29:457–496.
Scheen AJ, Van Gaal LF. Combating the dual burden: therapeutic targeting of common pathways in obesity and type 2 diabetes. Lancet Diabetes Endocrinol 2014; 2:911–922.
Kahn SE, Hull RL, Utzschneider KM. Mechanisms linking obesity to insulin resistance and type 2 diabetes. Nature 2006; 444:840–846.
Iepsen EW, Torekov SS, Holst JJ. Therapies for inter-relating diabetes and obesity—GLP-1 and obesity. Expert Opin Pharmacother 2014; 15:2487–2500.
Meier JJ, Nauck MA. Glucagon-like peptide 1(GLP-1) in biology and pathology. Diabetes Metab Res Rev 2005; 21:91–117.
Turton MD, O’Shea D, Gunn I, et al. A role for glucagon-like peptide-1 in the central regulation of feeding. Nature 1996; 379:69–72.
Drucker DJ. Glucagon-like peptides: regulators of cell proliferation, differentiation, and apoptosis. Mol Endocrinol 2003; 17:161–171.
Shyangdan DS, Royle P, Clar C, Sharma P, Waugh N, Snaith A. Glucagon-like peptide analogues for type 2 diabetes mellitus. Cochrane Database Syst Rev 2011; 10:CD006423. doi:10.1002/14651858.CD006423.pub2.
DeFronzo RA, Ratner RE, Han J, Kim DD, Fineman MS, Baron AD. Effects of exenatide (exendin-4) on glycemic control and weight over 30 weeks in metformin-treated patients with type 2 diabetes. Diabetes Care 2005; 28:1092–1100.
Nikfar S, Abdollahi M, Salari P. The efficacy and tolerability of exenatide in comparison to placebo; a systematic review and meta-analysis of randomized clinical trials. J Pharm Pharm Sci 2012; 15:1–30.
Blonde L, Russell-Jones D. The safety and efficacy of liraglutide with or without oral antidiabetic drug therapy in type 2 diabetes: an overview of the LEAD 1-5 studies. Diabetes Obes Metab 2009; 11(suppl 3):26–34.
Garber A, Henry R, Ratner R, et al; LEAD-3 (Mono) Study Group. Liraglutide versus glimepiride monotherapy for type 2 diabetes (LEAD-3 Mono): a randomised, 52-week, phase III, double-blind, parallel-treatment trial. Lancet 2009; 373:473–481.
Zinman B, Gerich J, Buse JB, et al; LEAD-4 Study Investigators. Efficacy and safety of the human glucagon-like peptide-1 analog liraglutide in combination with metformin and thiazolidinedione in patients with type 2 diabetes (LEAD-4 Met+TZD). Diabetes Care 2009; 32:1224–1230.
Davies MJ, Bergenstal R, Bode B, et al. Efficacy of liraglutide for weight loss among patients with type 2 diabetes: the SCALE Diabetes Randomized Clinical Trial. JAMA 2015; 314:687–699.
Pi-Sunyer X, Astrup A, Fujioka K, et al; SCALE Obesity and Prediabetes NN8022-1839 Study Group. A randomized, controlled trial of 3.0 mg of liraglutide in weight management. N Engl J Med 2015; 373:11–22.
Vilsboll T, Christensen M, Junker AE, Knop FK, Gluud LL. Effects of glucagon-like peptide-1 receptor agonists on weight loss: systematic review and meta-analyses of randomised controlled trials. BMJ 2012; 344:d7771.
Valsamakis G, Konstantakou P, Mastorakos G. New targets for drug treatment of obesity. Annu Rev Pharmacol Toxicol 2017; 57:585–605.
Sivertsen J, Rosenmeier J, Holst JJ, Vilsboll T. The effect of glucagon-like peptide 1 on cardiovascular risk. Nat Rev Cardiol 2012; 9:209–222.
Marso SP, Daniels GH, Brown-Frandsen K, et al; LEADER Steering Committee; LEADER Trial Investigators. Liraglutide and cardiovascular outcomes in type 2 diabetes. N Engl J Med 2016; 375:311–322.
Lean ME, Carraro R, Finer N, et al; NN8022-1807 Investigators. Tolerability of nausea and vomiting and associations with weight loss in a randomized trial of liraglutide in obese, non-diabetic adults. Int J Obes (Lond) 2014; 38:689–697.
Aroda VR, Rosenstock J, Wysham C, et al; LixiLan-L Trial Investigators. Efficacy and safety of lixilan, a titratable fixed-ratio combination of insulin glargine plus lixisenatide in type 2 diabetes inadequately controlled on basal insulin and metformin: the LixiLan-L Randomized Trial. Diabetes Care 2016; 39:1972–1980.
Rosenstock J, Diamant M, Aroda VR, et al; LixiLan PoC Study Group. Efficacy and safety of LixiLan, a titratable fixed-ratio combination of lixisenatide and insulin glargine, versus insulin glargine in type 2 diabetes inadequately controlled on metformin monotherapy: the LixiLan Proof-of-Concept Randomized Trial. Diabetes Care 2016; 39:1579–1586.
Monica Reddy RP, Inzucchi SE. SGLT2 inhibitors in the management of type 2 diabetes. Endocrine 2016; 53:364–372.
DeFronzo RA, Davidson JA, Del Prato S. The role of the kidneys in glucose homeostasis: a new path towards normalizing glycaemia. Diabetes Obes Metab 2012; 14:5–14.
Liu JJ, Lee T, DeFronzo RA. Why do SGLT2 inhibitors inhibit only 30-50% of renal glucose reabsorption in humans? Diabetes 2012; 61:2199–2204.
Vasilakou D, Karagiannis T, Athanasiadou E, et al. Sodium-glucose cotransporter 2 inhibitors for type 2 diabetes: a systematic review and meta-analysis. Ann Intern Med 2013; 159:262–274.
Stenlof K, Cefalu WT, Kim KA, et al. Efficacy and safety of canagliflozin monotherapy in subjects with type 2 diabetes mellitus inadequately controlled with diet and exercise. Diabetes Obes Metab 2013; 15:372–382.
Kadowaki T, Haneda M, Inagaki N, et al. Empagliflozin monotherapy in Japanese patients with type 2 diabetes mellitus: a randomized, 12-week, double-blind, placebo-controlled, phase II trial. Adv Ther 2014; 31:621–638.
Bolinder J, Ljunggren O, Kullberg J, et al. Effects of dapagliflozin on body weight, total fat mass, and regional adipose tissue distribution in patients with type 2 diabetes mellitus with inadequate glycemic control on metformin. J Clin Endocrinol Metab 2012; 97:1020–1031.
Bolinder J, Ljunggren O, Johansson L, et al. Dapagliflozin maintains glycaemic control while reducing weight and body fat mass over 2 years in patients with type 2 diabetes mellitus inadequately controlled on metformin. Diabetes Obes Metab 2014; 16:159–169.
Zinman B, Wanner C, Lachin JM, et al; EMPA-REG OUTCOME Investigators. Empagliflozin, cardiovascular outcomes, and mortality in type 2 diabetes. N Engl J Med 2015; 373:2117–2128.
Lutz TA. Effects of amylin on eating and adiposity. Handb Exp Pharmacol 2012; (209):231–250.
Hieronymus L, Griffin S. Role of amylin in type 1 and type 2 diabetes. Diabetes Educ 2015; 41(suppl 1):47S–56S.
Aronoff SL. Rationale for treatment options for mealtime glucose control in patients with type 2 diabetes. Postgrad Med 2017; 129:231–241.
Ratner RE, Dickey R, Fineman M, et al. Amylin replacement with pramlintide as an adjunct to insulin therapy improves long-term glycaemic and weight control in type 1 diabetes mellitus: a 1-year, randomized controlled trial. Diabet Med 2004; 21:1204–1212.
Edelman S, Garg S, Frias J, et al. A double-blind, placebo-controlled trial assessing pramlintide treatment in the setting of intensive insulin therapy in type 1 diabetes. Diabetes Care 2006; 29:2189–2195.
Riddle M, Frias J, Zhang B, et al. Pramlintide improved glycemic control and reduced weight in patients with type 2 diabetes using basal insulin. Diabetes Care 2007; 30:2794–2799.
Hollander PA, Levy P, Fineman MS, et al. Pramlintide as an adjunct to insulin therapy improves long-term glycemic and weight control in patients with type 2 diabetes: a 1-year randomized controlled trial. Diabetes Care 2003; 26:784–790.
Singh-Franco D, Perez A, Harrington C. The effect of pramlintide acetate on glycemic control and weight in patients with type 2 diabetes mellitus and in obese patients without diabetes: a systematic review and meta-analysis. Diabetes Obes Metab 2011; 13:169–180.
Wysham C, Lush C, Zhang B, Maier H, Wilhelm K. Effect of pramlintide as an adjunct to basal insulin on markers of cardiovascular risk in patients with type 2 diabetes. Curr Med Res Opin 2008; 24:79–85.
Bischoff H. Pharmacology of alpha-glucosidase inhibition. Eur J Clin Invest 1994; 24(suppl 3):3–10.
Lee A, Patrick P, Wishart J, Horowitz M, Morley JE. The effects of miglitol on glucagon-like peptide-1 secretion and appetite sensations in obese type 2 diabetics. Diabetes Obes Metab 2002; 4:329–335.
van de Laar FA, Lucassen PL, Akkermans RP, van de Lisdonk EH, Rutten GE, van Weel C. Alpha-glucosidase inhibitors for patients with type 2 diabetes: results from a Cochrane systematic review and meta-analysis. Diabetes Care 2005; 28:154–163.
Gross JL, Kramer CK, Leitao CB, et al; Diabetes and Endocrinology Meta-analysis Group (DEMA). Effect of antihyperglycemic agents added to metformin and a sulfonylurea on glycemic control and weight gain in type 2 diabetes: a network meta-analysis. Ann Intern Med 2011; 154:672–679.
Schnell O, Weng J, Sheu WH, et al. Acarbose reduces body weight irrespective of glycemic control in patients with diabetes: results of a worldwide, non-interventional, observational study data pool. J Diabetes Complications 2016; 30:628–637.
Chiasson JL, Josse RG, Gomis R, Hanefeld M, Karasik A, Laakso M; STOP-NIDDM Trial Research Group. Acarbose treatment and the risk of cardiovascular disease and hypertension in patients with impaired glucose tolerance: the STOP-NIDDM trial. JAMA 2003; 290:486–494.
Inzucchi SE, Bergenstal RM, Buse JB, et al. Management of hyperglycemia in type 2 diabetes, 2015: a patient-centered approach: update to a position statement of the American Diabetes Association and the European Association for the Study of Diabetes. Diabetes Care 2015; 38:140–149.
American Diabetes Association. Pharmacologic approaches to glycemic treatment. Diabetes Care 2017; 40:S64–S74.
Tan MH, Alquraini H, Mizokami-Stout K, MacEachern M. Metformin: From research to clinical practice. Endocrinol Metab Clin North Am 2016; 45:819–843.
Paolisso G, Amato L, Eccellente R, et al. Effect of metformin on food intake in obese subjects. Eur J Clin Invest 1998; 28: 441–446.
Lee A, Morley JE. Metformin decreases food consumption and induces weight loss in subjects with obesity with type II noninsulin-dependent diabetes. Obes Res 1998; 6: 47–53.
Scarpello JH. Optimal dosing strategies for maximising the clinical response to metformin in type 2 diabetes. Br J Diabetes Vasc Dis 2001; 1: 28–36.
Golay A. Metformin and body weight. Int J Obes (Lond) 2008; 32:61–72.
UK Prospective Diabetes Study (UKPDS) Group. Effect of intensive blood-glucose control with metformin on complications in overweight patients with type 2 diabetes (UKPDS 34). Lancet 1998; 352:854–865.
Knowler WC, Barrett-Connor E, Fowler SE, et al; Diabetes Prevention Program Research Group. Reduction in the incidence of type 2 diabetes with lifestyle intervention or metformin. N Engl J Med 2002; 346:393–403.
Fujita Y, Inagaki N. Metformin: new preparations and nonglycemic benefits. Curr Diab Rep 2017; 17:5.
Mary Angelynne Esquivel, MD Clinical Fellow in Endocrinology, Division of Endocrinology, Diabetes and Metabolism, Warren Alpert Medical School of Brown University, Providence, RI
M. Cecilia Lansang, MD, MPH Associate Professor of Medicine, Cleveland Clinic Lerner College of Medicine of Case Western Reserve University, Cleveland, OH; Director, Inpatient Diabetes Services, Department of Endocrinology, Diabetes, and Metabolism, Cleveland Clinic
Correspondence: M. Cecilia Lansang, MD, MPH, Department of Endocrinology, Diabetes, and Metabolism, F20, Cleveland Clinic, 9500 Euclid Avenue, Cleveland, OH 44195; [email protected]
Both authors reported no financial interests or relationships that pose a potential conflict of interest with this article.
Author and Disclosure Information
Mary Angelynne Esquivel, MD Clinical Fellow in Endocrinology, Division of Endocrinology, Diabetes and Metabolism, Warren Alpert Medical School of Brown University, Providence, RI
M. Cecilia Lansang, MD, MPH Associate Professor of Medicine, Cleveland Clinic Lerner College of Medicine of Case Western Reserve University, Cleveland, OH; Director, Inpatient Diabetes Services, Department of Endocrinology, Diabetes, and Metabolism, Cleveland Clinic
Correspondence: M. Cecilia Lansang, MD, MPH, Department of Endocrinology, Diabetes, and Metabolism, F20, Cleveland Clinic, 9500 Euclid Avenue, Cleveland, OH 44195; [email protected]
Both authors reported no financial interests or relationships that pose a potential conflict of interest with this article.
Diabesity was a term coined by Sims et al1 in the 1970s to describe diabetes occurring in the setting of obesity. Today, the link between type 2 diabetes mellitus (DM), obesity, and insulin resistance is well recognized, and 80% of people with type 2 DM are overweight or obese.2,3 Unfortunately, weight gain is a known side effect of most agents used to treat type 2 DM (eg, insulin, sulfonylureas, thiazolidinediones), and this often leads to nonadherence, poor glycemic control, and further weight gain.
During the past several years, evidence has emerged of a neurophysiologic mechanism that involves hormones from adipocytes, pancreatic islet cells, and the gastrointestinal tract implicated in both obesity and diabetes.2 This has led to research for drugs that not only either target obesity and diabetes or reduce hemoglobin A1c (HbA1c), but also have weight loss as a potential side effect.
In this paper, we review medications approved for the treatment of type 2 DM (including pramlintide, also approved for type 1 DM) that also have weight loss as a side effect. Drugs we will discuss include glucagon-like peptide-1 (GLP-1) receptor agonists, sodium-glucose cotransporter-2 (SGLT-2) inhibitors, neuroendocrine peptide hormones, alpha-glucosidase inhibitors, and metformin. Where appropriate, we also comment on the effects of the drugs on cardiovascular outcomes.
GLP-1 RECEPTOR AGONISTS
Mechanism of action
GLP-1 is a hormone produced from the proglucagon gene in the alpha cells of the pancreas, in the L cells of intestinal mucosa (predominantly in the ileum and distal colon), and in structures of the nervous system including the brainstem, hypothalamus, and vagal afferent nerves.4 Food in the gastrointestinal tract, especially if high in fats and carbohydrates, stimulates secretion of GLP-1 in the L cells, which in turn amplifies insulin secretion in a glucose-dependent manner (the incretin effect).4 Glucagon secretion is inhibited by GLP-1 during times of hyperglycemia but not hypoglycemia, thereby preventing inappropriately high levels of the hormone.5 Peripheral GLP-1 activates a cascade of centrally mediated signals that ultimately result in secretion of insulin by the pancreas and slowing of gastrointestinal motility.5 Lastly, GLP-1 exerts an anorexic effect by acting on central pathways that mediate satiation.6
Recent studies suggest that GLP-1 receptor agonist drugs have proliferative, anti-apoptotic, and differentiation effects on pancreatic beta cells, thereby leading to improved glycemic control.7Table 1 summarizes the sites of action and physiologic effects of GLP-1.7
Bioactive forms of GLP-1 are rapidly degraded in the circulation by the dipeptidyl peptidase-4 enzyme. GLP-1 receptor agonists have slightly altered molecular structure and longer duration of action than native GLP-1. Short-acting GLP-1 agonists (eg, exenatide, lixisenatide) have more effect on gastric emptying and lower postprandial blood glucose levels, whereas long-acting GLP-1 agonists (eg, liraglutide, albiglutide, dulaglutide, semaglutide, exenatide) have a greater effect on fasting glucose levels.4
Effects on HbA1c and weight loss
As a class, GLP-1 receptor agonists have been proven to cause significant reduction in HbA1c levels. In a meta-analysis of 17 randomized controlled trials involving patients with type 2 DM with suboptimal control on 1 or 2 oral agents, GLP-1 agonists decreased HbA1c levels by 1% (treatment difference 0.5% to 1.6%) compared with placebo.8 HbA1c reductions from each GLP-1 agonist along with dosing, administration, and weight loss benefit are shown in Table 2.9–14
Of the current GLP-1 agonists, exenatide and liraglutide have been on the market the longest, thus studied more in terms of weight reduction.
Exenatide. Exenatide BID was the first GLP-1 agonist, approved by the US Food and Drug Administration (FDA) in 2005 for the treatment of type 2 DM. In a 30-week triple-blind, placebo-controlled study of 336 patients already on background therapy with metformin, progressive weight loss was noted with exenatide 5 μg (−1.6 ± 0.4 kg) and exenatide 10 μg (−2.8 ± 0.5 kg) compared with placebo (−0.3 ± 0.3 kg; P < .001).15 A meta-analysis of 14 trials with 2,583 patients showed significant weight reduction with both exenatide 5 μg twice daily (a difference of −0.56 kg, 95% confidence interval [CI] −1.07 to −0.06, P = .0002) in 8 trials and exenatide 10 μg twice daily (a difference of −1.24 kg, 95% CI −1.69 to −0.78, P < .001) in 12 trials, after treatment for more than 16 weeks.16
Liraglutide. Liraglutide has a longer half-life than exenatide and is administered once daily. It is not a first-line therapy for type 2 DM and is recommended as an add-on. Approved daily doses for type 2 DM are 1.2 mg and 1.8 mg.
Multiple studies of glycemic control and weight loss with liraglutide have been conducted since its introduction to the US market in 2010. In the Liraglutide Effect and Action in Diabetes (LEAD) series of trials, liraglutide use as monotherapy or in combination with oral agents was associated with significant dose-dependent weight loss.17 Liraglutide monotherapy (at 1.2 mg and 1.8 mg) compared with glimepiride in the LEAD-3 trial led to significant weight reduction (2.1 kg and 2.5 kg, respectively, P < .001) after 16 weeks, and was sustained up to 52 weeks.18 Addition of liraglutide (at 1.2 mg and 1.8 mg) to metformin plus rosiglitazone resulted in significant weight loss (1.02 kg and 2.02 kg, respectively) whereas the addition of placebo caused a 0.6-kg weight gain (P < .001).19 The SCALE study randomized 846 adults with type 2 DM who were overweight to obese (body mass index [BMI] ≥ 27 kg/m2), were taking 0 to 3 oral antihyperglycemic agents (metformin, thiazolidinedione, and a sulfonylurea), and had stable body weight and an HbA1c of 7% to 10% to liraglutide 1.8 mg, liraglutide 3.0 mg, or placebo. Mean weight loss after 56 weeks was 6.0% (6.4 kg) with liraglutide 1.8 mg, 4.7% (5.0 kg) with liraglutide 3.0 mg, and 2.0% (2.2 kg) with placebo.20
In 2016, high-dose once-daily liraglutide 3.0 mg (Saxenda) was approved by the FDA for weight loss. In a double-blind randomized trial of liraglutide 3.0 mg vs placebo in patients who had a BMI of at least 30 or who had a BMI of at least 27 plus treated or untreated dyslipidemia or hypertension, Pi-Sunyer et al21 reported a mean weight reduction of 8.4 ± 7.3 kg with liraglutide vs 2.8 ± 6.5 kg with placebo (a difference of −5.6 kg, 95% CI −6.0 to −5.1, P < .001) after 56 weeks. Furthermore, 63.2% of patients in the liraglutide group lost at least 5% of body weight vs 27.1% with placebo, and 33.1% in the liraglutide group lost 10% or more of body weight vs 10.6% in the placebo group (P < .001).21 Of note, liraglutide 3.0 mg is not indicated for type 2 DM per se.
In a 2012 meta-analysis of randomized controlled trials of adults with and without type 2 DM, with a BMI of 25 or greater, and who received GLP-1 receptor agonists at clinically relevant doses (exenatide ≥ 10 μg/day, exenatide ≥ 2 mg/week, or liraglutide ≥ 1.2 mg/day), those taking GLP-1 receptor agonists had more weight loss than those on a control intervention (oral antihyperglycemic, insulin, or placebo) at a minimum of 20 weeks, with a weighted mean difference −2.9 kg (95% CI −3.6 to −2.2) in 21 trials and 6,411 participants.22
GLP-1 agonists currently being investigated for obesity treatment are lixisenatide, albiglutide, taspoglutide, and oxyntomodulin.23
Cardiovascular outcomes
The presence of GLP-1 receptors in blood vessels and myocardium has led to the hypothesis that GLP-1 receptor agonists can improve cardiovascular disease outcomes.24 In the pivotal Liraglutide Effect and Action in Diabetes: Evaluation of Cardiovascular Outcome Results (LEADER) trial, 9,340 patients with type 2 DM and increased cardiovascular disease risk were randomized to liraglutide vs placebo.25 The hazard ratio (HR) for time to the primary end point of cardiovascular death, nonfatal myocardial infarction, or nonfatal stroke was 0.87 (P = .01 for superiority, P < .001 for noninferiority) for liraglutide compared with placebo after 3.8 years. The incidence of death from any cause or cardiovascular cause was also lower with liraglutide.25
Adverse effects
Tolerable transient nausea and vomiting are reported adverse effects; these symptoms occur early in therapy, usually resolve in 4 to 8 weeks, and appear to be associated with greater weight loss.26 Although no causal relationship between GLP-1 receptor agonist use and pancreatitis or pancreatic cancer has been established to date, several cases of acute pancreatitis have been reported.25 Alternative therapies should be considered in patients with a history of or risk factors for pancreatitis.
Combined with insulin
A product that combines insulin glargine and lixisenatide (Soliqua) is FDA-approved for patients with type 2 DM. In a 30-week randomized controlled trial of the combination product vs insulin glargine alone in patients with type 2 DM not controlled on basal insulin with or without up to 2 oral agents, the combination product resulted in an HbA1c reduction from baseline of 1.1% vs 0.6% for insulin glargine alone (P < .001).27 Mean body weight decreased by 0.7 kg with the combination product and increased by 0.7 kg with insulin glargine (P < .001).27 In a 24-week study of a lixisenatide-insulin glargine combination vs insulin glargine in insulin-naïve patients taking metformin, there was a reduction in HbA1c of about −1.7% from baseline in both groups, while the combination group had a 1-kg weight reduction compared with a 0.5-kg weight increase in the insulin glargine group (P < .001).28
SGLT-2 INHIBITORS
Mechanism of action
In a healthy normoglycemic person, about 180 g of glucose per day is filtered into the glomerular filtrate and reabsorbed into the circulation.29 SGLT-2 facilitates the reabsorption of glucose in the proximal convoluted tubule of the kidneys. Approximately 90% of glucose reabsorption is mediated by SGLT-2 found in the S1 and S2 segments of the proximal convoluted tubule, and the remaining 10% by SGLT-1 in the S3 segment. At serum glucose levels above 180 g, the reabsorptive capacity of the nephron is overwhelmed, resulting in glycosuria.30 SGLT-2 expression is also increased in patients with diabetes, thus leading to increased glucose reabsorption into the circulation, further contributing to hyperglycemia.30 Inhibition of SGLT-2 alleviates hyperglycemia by decreasing glucose reabsorption (30% to 50% of filtered glucose) in the kidneys and by increasing excretion (50 mg to 80 mg of glucose) in the urine.31 SGLT-2 inhibitors currently FDA-approved are canagliflozin (Invokana), dapagliflozin (Farxiga), and empagliflozin (Jardiance).
HbA1c
SGLT-2 inhibitors have relatively weak glycemic efficacy. A meta-analysis of SGLT-2 inhibitors vs other antidiabetic medications or placebo found that SGLT-2 inhibitors appeared to have a “favorable effect” on HbA1c, with a mean difference vs placebo of −0.66% (95% CI −0.73% to −0.58%) and a mean difference vs other antihyperglycemic medications of −0.06% (95% CI 0.18% to 0.05%).32
Weight loss
The same meta-analysis found that SGLT-2 inhibitors reduced body weight (mean difference −1.8 kg, 95% CI −3.50 kg to −0.11 kg).32 And in a randomized controlled trial, monotherapy with canagliflozin 100 mg/day and 300 mg/day resulted in body weight reduction of 2.2% (1.9 kg) and 3.3% (−2.9 kg), respectively, after 26 weeks.33 A Japanese study showed a dose-related total body weight loss with empagliflozin vs placebo ranging from 2.5 ± 0.2 kg (5-mg dose) to 3.1 ± 0.2 kg (50-mg dose) after 12 weeks.34 Bolinder et al35 reported that adding dapagliflozin 10 mg to metformin in patients with type 2 DM reduced total body weight by −2.96 kg (95% CI −3.51 to −2.41, P < .001) at week 24. Whole-body dual-energy x-ray absorptiometry and magnetic resonance imaging findings in this study revealed a decrease in fat mass and visceral and subcutaneous adipose tissue after treatment with dapagliflozin, thus suggesting urinary loss of glucose (and hence caloric loss) contributing to weight reduction in addition to initial weight loss from fluid loss due to osmotic diuresis.35 A continuous decline in total body weight was observed in a 78-week extension study resulting in −4.54 kg (95% CI −5.43 to −3.66 kg) at week 102, along with further reduction in total body fat mass as measured by dual-energy x-ray absorptiometry.36
Cardiovascular outcomes
The landmark study Empagliflozin, Cardiovascular Outcomes and Mortality in Type 2 Diabetes (EMPA-REG) involving 7,020 patients was the first large cardiovascular outcomes trial in patients with type 2 DM and overt cardiovascular disease. A relative risk reduction of 14% (12.1% to 10.5%, HR 0.86, 95% CI 0.74 to 0.99) in major adverse cardiovascular events (cardiovascular death, nonfatal myocardial infarction, and nonfatal stroke) was observed with empagliflozin.37 Rates of all-cause mortality and hospitalization for heart failure relative risk reductions were 32% (8.3% to 5.7%; HR 0.68 [0.57, 0.8]) and 35% (4.1% to 2.7%; HR 0.65 [0.50, 0.85]), respectively, with empagliflozin. The mechanism behind this cardiovascular benefit is unknown but is currently being explored.37
Adverse effects
Increased risk of urinary tract and genital infections are known adverse effects of SGLT-2s. Other effects noted include postural hypotension from volume depletion and a transient increase in serum creatinine and decrease in glomerular filtration.29
NEUROENDOCRINE PEPTIDE HORMONE: AMYLIN ANALOGUES
Mechanism of action
Amylin is a 37-amino-acid neuroendocrine peptide hormone secreted primarily by pancreatic beta cells. It promotes early satiety, and its anorexigenic effects are mediated by its action on the neurons of the area postrema in the brain.38 After a meal, amylin decreases gastric acid secretion and slows gastric emptying. It is co-secreted with insulin in a 1:20 amylin-to-insulin ratio and inhibits glucagon secretion via a centrally mediated mechanism.39
Pramlintide (Symlin) is an amylin analogue administered subcutaneously immediately before major meals. It decreases postprandial glucose levels and has been approved by the FDA as an adjunct to prandial insulin in patients with type 1 and type 2 DM.40
HbA1c
Amylin secretion is impaired in type 1 and type 2 DM, and small but significant reductions in HbA1c have been observed with addition of pramlintide to usual insulin regimens. In patients with type 1 DM, HbA1c levels were reduced by 0.4% to 0.6% after 26 weeks on 30 μg 3 times daily to 60 μg 4 times daily of pramlintide added to insulin.41,42 And pramlintide 120 μg added to usual antihyperglycemic therapy in patients with type 2 DM has been reported to decrease HbA1c by 0.7% at week 16 or 26.43,44
Weight loss
A meta-analysis of 8 randomized controlled trials assessed the effects of pramlintide on glycemic control and weight in patients with type 2 DM treated with insulin and in obese patients without diabetes.45 In these trials, patients took at least 120 μg of pramlintide before 2 to 3 meals for at least 12 weeks; a total of 1,616 participants were included. In the type 2 DM group, pramlintide reduced body weight by 2.57 kg (95% CI −3.44 to −1.70 kg, P < .001) vs control, over 16 to 52 weeks.45 The nondiabetic obese group had a weight loss of −2.27 kg (95%CI −2.88 to −1.66 kg, P < .001) vs control.45
Pramlintide and a pramlintide-phentermine combination are currently under investigation for treatment of obesity.23
Cardiovascular outcomes
Cardiovascular outcomes in patients treated with pramlintide have not been studied to date, but reductions have been observed in markers of cardiovascular risk including high-sensitivity C-reactive protein and triglycerides.46
Adverse effects
Transient mild-to-moderate nausea is the most common adverse effect of pramlintide. Hypoglycemia has also been reported, more frequently in patients with type 1 DM, which is possibly associated with inadequate reduction in insulin.
ALPHA-GLUCOSIDASE INHIBITORS
Mechanism of action
Alpha-glucosidase inhibitors competitively inhibit the alpha-glucosidase enzymes at the brush border of the small intestine. Taken orally before meals, these drugs mitigate postprandial hyperglycemia by preventing the breakdown of complex carbohydrates into simpler monosaccharides, thus delaying their absorption.47 These agents may be used as monotherapy or in combination with other antihyperglycemic agents. They work independently from insulin, although they have been shown to potentiate GLP-1 secretion.48 Acarbose and miglitol are currently approved in the United States. Acarbose has been more extensively studied worldwide.
HbA1c
Alpha-glucosidase inhibitors have been reported to reduce mean HbA1c by 0.8% (95% CI −0.9% to −0.7%), as well as fasting and postprandial glucose, and postprandial insulin levels.49
Weight loss
There is conflicting evidence on whether alpha-glucosidase inhibitor therapy has a neutral or beneficial effect on body weight. A Cochrane meta-analysis observed significant BMI reduction with acarbose, although no effect on body weight was noted,49 whereas in another meta-analysis, body weight was significantly reduced by 0.96 kg (95% CI −1.80 to −0.12 kg) when acarbose was added to metformin.50 A review of pooled data from worldwide post-marketing studies for acarbose reported a weight reduction after 3 months of 0.98 ± 2.11 kg in overweight patients and 1.67 ± 3.02 kg in obese patients.51
Cardiovascular outcomes
In the Study to Prevent Non-Insulin-Dependent Diabetes Mellitus (STOP-NIDDM), when compared with placebo, treatment of patients with impaired glucose tolerance with acarbose significantly reduced the incidence of cardiovascular events (HR 0.51, 95% CI 0.28 to 0.95, P = .03), myocardial infarction (HR 0.09, 95% CI 0.01 to 0.72, P = .02), and newly diagnosed hypertension (HR 0.66, 95% CI 0.49 to 0.89, P = .006).52
Adverse effects
Although mild, gastrointestinal effects of flatulence and diarrhea can be bothersome and result in discontinuation of the drug in most patients.
METFORMIN
Mechanism of action
Metformin is the first-line antihyperglycemic agent for type 2 DM recommended by the American Diabetes Association and European Association for the Study of Diabetes.53,54 The main action of metformin is to decrease glucose production in the liver. In the small intestine, metformin stimulates the L cells to produce GLP-1, and in skeletal muscle, it increases glucose uptake and disposal.55
HbA1c
As monotherapy, metformin has resulted in HbA1c reductions of 0.88% to 1.2%.55
Weight loss
Reduced food intake56,57 and gastrointestinal intolerance58 occurring early in therapy have been noted to account for weight loss in short-term studies of non-diabetic obese patients treated with metformin.59 Long-term trials of patients with and without diabetes have yielded mixed results on weight reduction from metformin as monotherapy or adjunct therapy. In the United Kingdom Prospective Diabetes Study (UKPDS), metformin had resulted in approximately 1.5 kg of weight gain (slightly less than the 4-kg weight gain in the glibenclamide group).60 Improved antihyperglycemic efficacy of other antihyperglycemic agents (insulin, sulfonylureas, and thiazolidinediones) with addition of metformin led to dose-lowering of the antihyperglycemic agents, ultimately resulting in amelioration of weight gain; this has also led to small weight reductions in some studies.59 In the Diabetes Prevention Program study of patients with impaired glucose tolerance, metformin treatment resulted in an average weight loss of 2.1 kg compared with placebo (−0.1 kg) and lifestyle intervention (−5.6 kg; P <.001).61
Cardiovascular outcomes
Metformin has been observed to decrease micro- and macrovascular complications. Compared with diet alone, metformin was associated with a 39% reduction in the risk of myocardial infarction, and a 30% lower risk of a composite of macrovascular diseases (myocardial infarction, sudden death, angina, stroke, and peripheral disease).60
Adverse effects
The most common adverse effect of metformin is gastrointestinal intolerance from abdominal pain, flatulence, and diarrhea.62 Metformin-associated lactic acidosis is a serious and potentially life-threatening effect; and vitamin B12 deficiency may occur with long-term treatment.62
TAKE-HOME POINTS
As more medications and interventions are being developed to counter obesity, it also makes sense to select diabetes medications that do not contribute to weight gain in patients who are already overweight or obese. The effects of available medications can be maximized and treatment regimens individualized (based on patients’ needs and preferences, within the limitations of drug costs and side effects), along with lifestyle modification, to target diabesity.
References
Sims EAH, Danforth E Jr, Horton ES, Bray GA, Glennon JA, Salans LB. Endocrine and metabolic effects of experimental obesity in man. Recent Prog Horm Res 1973; 29:457–496.
Scheen AJ, Van Gaal LF. Combating the dual burden: therapeutic targeting of common pathways in obesity and type 2 diabetes. Lancet Diabetes Endocrinol 2014; 2:911–922.
Kahn SE, Hull RL, Utzschneider KM. Mechanisms linking obesity to insulin resistance and type 2 diabetes. Nature 2006; 444:840–846.
Iepsen EW, Torekov SS, Holst JJ. Therapies for inter-relating diabetes and obesity—GLP-1 and obesity. Expert Opin Pharmacother 2014; 15:2487–2500.
Meier JJ, Nauck MA. Glucagon-like peptide 1(GLP-1) in biology and pathology. Diabetes Metab Res Rev 2005; 21:91–117.
Turton MD, O’Shea D, Gunn I, et al. A role for glucagon-like peptide-1 in the central regulation of feeding. Nature 1996; 379:69–72.
Drucker DJ. Glucagon-like peptides: regulators of cell proliferation, differentiation, and apoptosis. Mol Endocrinol 2003; 17:161–171.
Shyangdan DS, Royle P, Clar C, Sharma P, Waugh N, Snaith A. Glucagon-like peptide analogues for type 2 diabetes mellitus. Cochrane Database Syst Rev 2011; 10:CD006423. doi:10.1002/14651858.CD006423.pub2.
DeFronzo RA, Ratner RE, Han J, Kim DD, Fineman MS, Baron AD. Effects of exenatide (exendin-4) on glycemic control and weight over 30 weeks in metformin-treated patients with type 2 diabetes. Diabetes Care 2005; 28:1092–1100.
Nikfar S, Abdollahi M, Salari P. The efficacy and tolerability of exenatide in comparison to placebo; a systematic review and meta-analysis of randomized clinical trials. J Pharm Pharm Sci 2012; 15:1–30.
Blonde L, Russell-Jones D. The safety and efficacy of liraglutide with or without oral antidiabetic drug therapy in type 2 diabetes: an overview of the LEAD 1-5 studies. Diabetes Obes Metab 2009; 11(suppl 3):26–34.
Garber A, Henry R, Ratner R, et al; LEAD-3 (Mono) Study Group. Liraglutide versus glimepiride monotherapy for type 2 diabetes (LEAD-3 Mono): a randomised, 52-week, phase III, double-blind, parallel-treatment trial. Lancet 2009; 373:473–481.
Zinman B, Gerich J, Buse JB, et al; LEAD-4 Study Investigators. Efficacy and safety of the human glucagon-like peptide-1 analog liraglutide in combination with metformin and thiazolidinedione in patients with type 2 diabetes (LEAD-4 Met+TZD). Diabetes Care 2009; 32:1224–1230.
Davies MJ, Bergenstal R, Bode B, et al. Efficacy of liraglutide for weight loss among patients with type 2 diabetes: the SCALE Diabetes Randomized Clinical Trial. JAMA 2015; 314:687–699.
Pi-Sunyer X, Astrup A, Fujioka K, et al; SCALE Obesity and Prediabetes NN8022-1839 Study Group. A randomized, controlled trial of 3.0 mg of liraglutide in weight management. N Engl J Med 2015; 373:11–22.
Vilsboll T, Christensen M, Junker AE, Knop FK, Gluud LL. Effects of glucagon-like peptide-1 receptor agonists on weight loss: systematic review and meta-analyses of randomised controlled trials. BMJ 2012; 344:d7771.
Valsamakis G, Konstantakou P, Mastorakos G. New targets for drug treatment of obesity. Annu Rev Pharmacol Toxicol 2017; 57:585–605.
Sivertsen J, Rosenmeier J, Holst JJ, Vilsboll T. The effect of glucagon-like peptide 1 on cardiovascular risk. Nat Rev Cardiol 2012; 9:209–222.
Marso SP, Daniels GH, Brown-Frandsen K, et al; LEADER Steering Committee; LEADER Trial Investigators. Liraglutide and cardiovascular outcomes in type 2 diabetes. N Engl J Med 2016; 375:311–322.
Lean ME, Carraro R, Finer N, et al; NN8022-1807 Investigators. Tolerability of nausea and vomiting and associations with weight loss in a randomized trial of liraglutide in obese, non-diabetic adults. Int J Obes (Lond) 2014; 38:689–697.
Aroda VR, Rosenstock J, Wysham C, et al; LixiLan-L Trial Investigators. Efficacy and safety of lixilan, a titratable fixed-ratio combination of insulin glargine plus lixisenatide in type 2 diabetes inadequately controlled on basal insulin and metformin: the LixiLan-L Randomized Trial. Diabetes Care 2016; 39:1972–1980.
Rosenstock J, Diamant M, Aroda VR, et al; LixiLan PoC Study Group. Efficacy and safety of LixiLan, a titratable fixed-ratio combination of lixisenatide and insulin glargine, versus insulin glargine in type 2 diabetes inadequately controlled on metformin monotherapy: the LixiLan Proof-of-Concept Randomized Trial. Diabetes Care 2016; 39:1579–1586.
Monica Reddy RP, Inzucchi SE. SGLT2 inhibitors in the management of type 2 diabetes. Endocrine 2016; 53:364–372.
DeFronzo RA, Davidson JA, Del Prato S. The role of the kidneys in glucose homeostasis: a new path towards normalizing glycaemia. Diabetes Obes Metab 2012; 14:5–14.
Liu JJ, Lee T, DeFronzo RA. Why do SGLT2 inhibitors inhibit only 30-50% of renal glucose reabsorption in humans? Diabetes 2012; 61:2199–2204.
Vasilakou D, Karagiannis T, Athanasiadou E, et al. Sodium-glucose cotransporter 2 inhibitors for type 2 diabetes: a systematic review and meta-analysis. Ann Intern Med 2013; 159:262–274.
Stenlof K, Cefalu WT, Kim KA, et al. Efficacy and safety of canagliflozin monotherapy in subjects with type 2 diabetes mellitus inadequately controlled with diet and exercise. Diabetes Obes Metab 2013; 15:372–382.
Kadowaki T, Haneda M, Inagaki N, et al. Empagliflozin monotherapy in Japanese patients with type 2 diabetes mellitus: a randomized, 12-week, double-blind, placebo-controlled, phase II trial. Adv Ther 2014; 31:621–638.
Bolinder J, Ljunggren O, Kullberg J, et al. Effects of dapagliflozin on body weight, total fat mass, and regional adipose tissue distribution in patients with type 2 diabetes mellitus with inadequate glycemic control on metformin. J Clin Endocrinol Metab 2012; 97:1020–1031.
Bolinder J, Ljunggren O, Johansson L, et al. Dapagliflozin maintains glycaemic control while reducing weight and body fat mass over 2 years in patients with type 2 diabetes mellitus inadequately controlled on metformin. Diabetes Obes Metab 2014; 16:159–169.
Zinman B, Wanner C, Lachin JM, et al; EMPA-REG OUTCOME Investigators. Empagliflozin, cardiovascular outcomes, and mortality in type 2 diabetes. N Engl J Med 2015; 373:2117–2128.
Lutz TA. Effects of amylin on eating and adiposity. Handb Exp Pharmacol 2012; (209):231–250.
Hieronymus L, Griffin S. Role of amylin in type 1 and type 2 diabetes. Diabetes Educ 2015; 41(suppl 1):47S–56S.
Aronoff SL. Rationale for treatment options for mealtime glucose control in patients with type 2 diabetes. Postgrad Med 2017; 129:231–241.
Ratner RE, Dickey R, Fineman M, et al. Amylin replacement with pramlintide as an adjunct to insulin therapy improves long-term glycaemic and weight control in type 1 diabetes mellitus: a 1-year, randomized controlled trial. Diabet Med 2004; 21:1204–1212.
Edelman S, Garg S, Frias J, et al. A double-blind, placebo-controlled trial assessing pramlintide treatment in the setting of intensive insulin therapy in type 1 diabetes. Diabetes Care 2006; 29:2189–2195.
Riddle M, Frias J, Zhang B, et al. Pramlintide improved glycemic control and reduced weight in patients with type 2 diabetes using basal insulin. Diabetes Care 2007; 30:2794–2799.
Hollander PA, Levy P, Fineman MS, et al. Pramlintide as an adjunct to insulin therapy improves long-term glycemic and weight control in patients with type 2 diabetes: a 1-year randomized controlled trial. Diabetes Care 2003; 26:784–790.
Singh-Franco D, Perez A, Harrington C. The effect of pramlintide acetate on glycemic control and weight in patients with type 2 diabetes mellitus and in obese patients without diabetes: a systematic review and meta-analysis. Diabetes Obes Metab 2011; 13:169–180.
Wysham C, Lush C, Zhang B, Maier H, Wilhelm K. Effect of pramlintide as an adjunct to basal insulin on markers of cardiovascular risk in patients with type 2 diabetes. Curr Med Res Opin 2008; 24:79–85.
Bischoff H. Pharmacology of alpha-glucosidase inhibition. Eur J Clin Invest 1994; 24(suppl 3):3–10.
Lee A, Patrick P, Wishart J, Horowitz M, Morley JE. The effects of miglitol on glucagon-like peptide-1 secretion and appetite sensations in obese type 2 diabetics. Diabetes Obes Metab 2002; 4:329–335.
van de Laar FA, Lucassen PL, Akkermans RP, van de Lisdonk EH, Rutten GE, van Weel C. Alpha-glucosidase inhibitors for patients with type 2 diabetes: results from a Cochrane systematic review and meta-analysis. Diabetes Care 2005; 28:154–163.
Gross JL, Kramer CK, Leitao CB, et al; Diabetes and Endocrinology Meta-analysis Group (DEMA). Effect of antihyperglycemic agents added to metformin and a sulfonylurea on glycemic control and weight gain in type 2 diabetes: a network meta-analysis. Ann Intern Med 2011; 154:672–679.
Schnell O, Weng J, Sheu WH, et al. Acarbose reduces body weight irrespective of glycemic control in patients with diabetes: results of a worldwide, non-interventional, observational study data pool. J Diabetes Complications 2016; 30:628–637.
Chiasson JL, Josse RG, Gomis R, Hanefeld M, Karasik A, Laakso M; STOP-NIDDM Trial Research Group. Acarbose treatment and the risk of cardiovascular disease and hypertension in patients with impaired glucose tolerance: the STOP-NIDDM trial. JAMA 2003; 290:486–494.
Inzucchi SE, Bergenstal RM, Buse JB, et al. Management of hyperglycemia in type 2 diabetes, 2015: a patient-centered approach: update to a position statement of the American Diabetes Association and the European Association for the Study of Diabetes. Diabetes Care 2015; 38:140–149.
American Diabetes Association. Pharmacologic approaches to glycemic treatment. Diabetes Care 2017; 40:S64–S74.
Tan MH, Alquraini H, Mizokami-Stout K, MacEachern M. Metformin: From research to clinical practice. Endocrinol Metab Clin North Am 2016; 45:819–843.
Paolisso G, Amato L, Eccellente R, et al. Effect of metformin on food intake in obese subjects. Eur J Clin Invest 1998; 28: 441–446.
Lee A, Morley JE. Metformin decreases food consumption and induces weight loss in subjects with obesity with type II noninsulin-dependent diabetes. Obes Res 1998; 6: 47–53.
Scarpello JH. Optimal dosing strategies for maximising the clinical response to metformin in type 2 diabetes. Br J Diabetes Vasc Dis 2001; 1: 28–36.
Golay A. Metformin and body weight. Int J Obes (Lond) 2008; 32:61–72.
UK Prospective Diabetes Study (UKPDS) Group. Effect of intensive blood-glucose control with metformin on complications in overweight patients with type 2 diabetes (UKPDS 34). Lancet 1998; 352:854–865.
Knowler WC, Barrett-Connor E, Fowler SE, et al; Diabetes Prevention Program Research Group. Reduction in the incidence of type 2 diabetes with lifestyle intervention or metformin. N Engl J Med 2002; 346:393–403.
Fujita Y, Inagaki N. Metformin: new preparations and nonglycemic benefits. Curr Diab Rep 2017; 17:5.
Cleveland Clinic Journal of Medicine 2017 July;84(suppl 1):S22-S29
Inside the Article
KEY POINTS
The rationale for GLP-1 receptor agonists is that peripheral GLP-1 activates a cascade of centrally mediated signals that ultimately result in secretion of insulin by the pancreas and slowing of gastrointestinal motility. It also exerts an anorexic effect by acting on central pathways that mediate satiation.
SGLT-2 inhibitors have relatively weak glycemic efficacy. Inhibition of SGLT-2 alleviates hyperglycemia by decreasing glucose reabsorption in the kidneys and by increasing excretion in the urine, suggesting urinary loss of glucose (and hence caloric loss). This is thought to contribute to weight reduction in addition to initial weight loss from fluid loss due to osmotic diuresis.
Meta-analyses so far have shown that alpha-glucosidase inhibitors have either a neutral or a beneficial effect on body weight.
Disallow All Ads
Content Gating
No Gating (article Unlocked/Free)
Alternative CME
Disqus Comments
Default
Consolidated Pubs: Do Not Show Source Publication Logo
Obesity is a leading public health concern, affecting nearly 60 million adult Americans.1 It is a major risk factor for the development of insulin resistance and type 2 diabetes mellitus (DM).2 More than 90% of patients with type 2 DM have obesity, and obesity is a major obstacle to achieving long-term glycemic control.3
Clinical studies have demonstrated that a 6- to 7-kg increase in body weight increases the risk of developing type 2 DM by 50%, while a 5-kg loss reduces the risk by a similar amount.4 As a result, most patients who have a body mass index greater than 40 kg/m2 suffer from type 2 DM.5 Strong evidence exists that bariatric surgery and its resulting weight loss has positive effects on fasting blood sugar, hemoglobin A1c (HbA1c), lipid profiles, and other metabolic variables.6
When combined, obesity and type 2 DM carry a significant burden of micro- and macrovascular complications such as retinopathy, nephropathy, neuropathy, and cardiovascular disease. As a result, a high prevalence of morbidity and mortality is seen among patients with obesity and type 2 DM; those between the ages of 51 and 61 have a 7-times higher mortality rate compared with nonobese normoglycemic people, and patients with diabetes alone have a 2.6-times higher mortality rate.7
A DILEMMA IN THE CLINIC: FOCUS ON THE SUGAR OR THE WEIGHT?
Although type 2 DM and obesity go hand in hand, clinicians tend to focus on the sugar and neglect the weight, concentrating their efforts on improving blood glucose indices, and prescribing in many instances medications that cause weight gain. As a result, we are faced with a rising epidemic of obesity, perpetuating a preexisting epidemic of diabetes.
An optimal, comprehensive approach to managing patients with type 2 DM should encompass both the control of dysglycemia and its associated comorbidities, obesity being the key player.8 However, clinical practice is often misaligned with the evidence. For instance, many of our first-line oral treatments for type 2 DM (except for metformin) are associated with weight gain.9 With time, control of glycemia becomes more and more ineffective, at which point therapy is intensified with insulin, further exacerbating the weight gain.10
Therefore, it seems counterintuitive to treat a disease for which obesity is one of the main risk factors with medications that promote weight gain. Yet healthcare providers are faced with a therapeutic dilemma: should they focus their efforts on improving patients’ glycemic control, or should they invest in helping these patients lose weight? Although an ideal approach would incorporate both aspects, the reality is that it is far from practical.
A few issues impinge on integrating weight loss in the care of type 2 DM. Although the American Medical Association recognized obesity as a disease in 2013,11 some providers still perceive obesity as a self-inflicted condition that is due to bad lifestyle and behavior.11 Many clinicians may also have low expectations for patients’ success, and often lack the time and knowledge to intervene regarding nutrition, physical activity, and psychological issues pertinent to the management of obesity in type 2 DM. Therefore, in many cases, it seems less complicated and more rewarding for both patients and physicians to concentrate on improving the HbA1c value rather than investing efforts in weight loss. For diabetic patients with obesity, this could mean that clinicians may prescribe glucose-lowering therapies, such as insulin and sulfonylureas, at the expense of weight gain. Additionally, clinicians often experience the need to provide recommendations more aligned with metrics that dictate reimbursement (eg, HbA1c targets) within healthcare systems that still raise concerns regarding obesity visit reimbursements.
Lastly, the lack of trustworthy or pertinent evidence (lack of comparative effectiveness research) for antiobesity medications may limit their use in daily practice. Physicians have had little confidence in the efficacy of antiobesity drugs, and often raise significant safety concerns, especially after witnessing important fiascos in this field, eg, dexfenfluramine, rimonabant, and sibutramine.2,12,13
As a result, many of our patients with obesity and type 2 DM may not consider the need for weight loss, and may not even be aware that type 2 DM is caused by obesity and physical inactivity in the first place. Others have accumulated a significant degree of frustration, and have “thrown in the towel” already after unsuccessful weight-loss efforts, many of which were not medically supervised.
For all of the above reasons, both clinicians and patients often concentrate their efforts on treating blood glucose numbers rather than the “obesity-diabetes” as a whole.14 And as a result, our practices are slowly filling up with patients with obesity and type 2 DM who are treated primarily with insulin, resulting in a progressive (and untreated) obesity and diabetes epidemic.
DRUGS FOR TREATING OBESITY AND TYPE 2 DM
Because the body strongly defends its fat cells, the common advice to simply “eat less, move more” cannot be expected to bring about meaningful and lasting weight reduction or control of HbA1c. However, weight-loss drugs (Table 1),15 used in conjunction with an interdisciplinary lifestyle intervention program, may provide more success regarding both issues. Here we discuss a few pharmacologic therapies approved for the management of obesity in the context of type 2 DM, and vice versa. Taking into account that dosages of these medications should be individualized to achieve a weight-loss goal with the lowest effective dose possible.
Orlistat
Orlistat (Xenical) is the only weight-loss drug approved by the US Food and Drug Administration (FDA) that acts outside the brain. It inhibits pancreatic lipases, resulting in up to 30% less fat absorption in the gut. Orlistat has been approved for long-term use by the FDA.
Benefits. In the XENical in the Prevention of Diabetes in Obese Subjects study, treatment with orlistat resulted in a significant reduction in the cumulative incidence of type 2 DM after 4 years of treatment (9.0% with placebo vs 6.2% with orlistat), corresponding to a risk reduction of 37.3%.16 Mean weight loss after 4 years was significantly greater in the orlistat group (5.8 vs 3.0 kg with placebo; P < .001).16 Other benefits of orlistat included a reduction in low-density lipoprotein cholesterol independent of that expected from change in body weight.16
Adverse effects include flatulence with discharge and fecal urgency after high-fat dietary indiscretions. Serum levels of fat-soluble vitamins (A, D, E, and K) were lower with orlistat than with placebo,16 and a fat-soluble vitamin supplement should be taken 2 hours before or after taking orlistat. Serious but very uncommon adverse events such as kidney damage have been reported.17 Kidney and liver function should be monitored while taking orlistat.
Phentermine
Phentermine (Adipex-P, Lomaira), a sympathomimetic amine, is the most commonly prescribed antiobesity drug in the United States. A schedule IV controlled substance, it is FDA-approved for short-term use (up to 12 weeks). Its primary mechanism of action is mediated by reduction in hunger perception. It was first developed in the 1970s and is available in doses ranging from 8 mg to 37.5 mg daily.18
Benefits. In a randomized trial, at 28 weeks, weight loss was 1.5 kg with placebo and 5.3 kg with phentermine.19 No long-term (> 1 year) randomized controlled trials of the effectiveness of phentermine monotherapy in weight loss have been conducted.
Adverse effects. Dizziness, dry mouth, insomnia, constipation, and increase in heart rate were most common.19
Phentermine is contraindicated in patients with coronary artery disease, congestive heart failure, stroke, and uncontrolled hypertension. Currently, no data exist on the long-term cardiovascular effects of phentermine. We believe phentermine, used in patients at low to intermediate cardiovascular risk, is a useful “jumpstart” tool, in combination with lifestyle changes, to achieve weight loss and improve metabolic values for those with type 2 DM and obesity.
Phentermine is a controlled substance per Ohio law. Patients must be seen once a month by the prescribing provider and prescriptions are limited to a 30-day supply, which must be filled within 7 days of the date of the prescription. Phentermine can only be prescribed for a maximum of 3 months and must be discontinued for 6 months before patients are eligible for a new prescription.
Phentermine and topiramate extended-release
Obesity is a product of complex interactions between several neurohormonal pathways. Approaches simultaneously targeting more than one regulatory pathway have become popular and quite efficient strategies in treating patients with obesity.20 Stemming from such approaches, antiobesity drug combinations such as phentermine and topiramate extended-release (Qsymia) have become increasingly recognized and used in clinical practice. The combination of these 2 medications has been approved for long-term use by the FDA.
Phentermine and topiramate extended-release is a fixed-dose combination that was approved for weight loss in 2012. Topiramate, an anticonvulsant, and phentermine exert their anorexigenic effects through regulating various brain neurotransmitters and result in more weight loss when used together than when either is used alone. Several clinical trials evaluated the efficacy of low doses of this combination in weight loss.
Benefits. In a randomized trial in patients with obesity and cardiometabolic diseases, at 56 weeks, the mean weight loss was:
1.2% in the placebo group
7.8% in the group receiving phentermine 7.5 mg and topiramate 46 mg
9.8% in the group receiving phentermine 15 mg and topiramate 92 mg.21
Patients in the active treatment groups also had significant improvements in cardiovascular and metabolic risk factors such as waist circumference, systolic blood pressure, and total cholesterol/high-density lipoprotein cholesterol ratio. At 56 weeks, patients with diabetes and prediabetes taking this preparation had greater reductions in HbA1c values, and fewer prediabetes patients progressed to type 2 DM.21
Adverse effects most commonly seen were dry mouth, paresthesia, and constipation.21
This combination is contraindicated in pregnancy, patients with recent stroke, uncontrolled hypertension, coronary artery disease, glaucoma, hyperthyroidism, or in patients taking monoamine oxidase inhibitors. Women of childbearing age should be tested for pregnancy before starting therapy, and monthly thereafter, and also be advised to use effective methods of contraception while taking the medication. Topiramate has been associated with the development of renal stones and thus should be used with caution in patients with a history of kidney stones.
Bupropion and naltrexone sustained-release
Bupropion and naltrexone sustained-release (Contrave) is another FDA-approved combination drug for chronic weight management. Bupropion is a dopamine and norepinephrine reuptake inhibitor approved for depression and smoking cessation, and naltrexone is an opioid receptor antagonist approved for treating alcohol and opioid dependence. The combination of these 2 medications has been approved for long-term use by the FDA.
Benefits. In a randomized trial in patients with obesity and type 2 DM, weight loss at 56 weeks was:
1.8% with placebo
5.0% with naltrexone 32 mg and bupropion 360 mg daily.
Absolute reductions in HbA1c were:
0.1% with placebo
0.6% with naltrexone-bupropion.
Improvements were also seen in other cardiometabolic risk factors such as triglyceride and high-density lipoprotein cholesterol levels.22
Adverse effects. The most common adverse effect leading to drug discontinuation was nausea. Other adverse effects reported were constipation, headache, vomiting, and dizziness.22
Naltrexone-bupropion is contraindicated in patients with a history of seizure disorder or a diagnosis of anorexia nervosa or bulimia, or who are on chronic opioid therapy.
Diethylpropion
Diethylpropion (Tenuate, Tenuate Dospan) is a central nervous system stimulant similar to bupropion in its structure. It was approved by the FDA for treating obesity in 1959. It should be used as part of a short-term weight-loss plan, along with a low-calorie diet. Diethylpropion is also a controlled substance and, as with phentermine therapy, patients are required to be seen once a month by their prescriber. Diethylpropion cannot be prescribed for more than 3 months.
Benefits. Weight loss in a randomized trial at 6 months:
3.2% with placebo
9.8% with diethylpropion 50 mg twice a day.23
After 6 months, all participants received diethylpropion in an open-label extension for an additional 6 months. At 12 months, the mean weight loss produced by diethylpropion was 10.6%.23 No differences in heart rate, blood pressure, electrocardiographic results, or psychiatric evaluations were observed.
Adverse effects. As with phentermine, common side effects of diethylpropion include insomnia, dry mouth, dizziness, headache, mild increases in blood pressure, and palpitations.23
Lorcaserin
Lorcaserin (Belviq) was approved by the FDA for chronic weight management in June 2012. It exerts its effects through binding selectively to central 5-HT2C serotonin receptors, with poor affinity for 5-HT2A and 5-HT2B receptors. Nonselective serotoninergic agents, including fenfluramine and dexfenfluramine, were withdrawn from the market in 1997 after being reported to be associated with valvular heart abnormalities.24 Lorcaserin has been approved for long-term use by the FDA.
Benefits. Mean weight loss at 1 year in the Behavioral Modification and Lorcaserin for Overweight and Obesity Management in Diabetes Mellitus trial25 was:
1.5% with placebo
5.0% with lorcaserin 10 mg once daily
4.5% with lorcaserin 10 mg twice daily.
Absolute reductions in HbA1c values were:
0.4% with placebo
0.9% with lorcaserin 10 mg once daily
1.0% with lorcaserin 10 mg twice daily.
Absolute reductions in fasting plasma glucose values were:
11.9 mg/dL with placebo
27.4 mg/dL with lorcaserin 10 mg once daily
28.4 mg/dL with lorcaserin 10 mg twice daily.25
Adverse effects. The most common adverse effects were headache, dizziness, and fatigue. There was no significant increase in valvulopathy on echocardiography of participants receiving lorcaserin compared with placebo.25
Liraglutide
Liraglutide (Saxenda, Victoza) is a glucagon-like peptide-1 (GLP-1) receptor agonist. Native GLP-1 is a hormone secreted by intestinal L cells in response to consumption of fat and carbohydrate-rich foods. It stimulates the release of insulin and suppresses any inappropriately elevated postprandial glucagon levels. In addition to its effect on glucose metabolism, GLP-1 also reduces appetite and delays gastric emptying in humans.26 Unlike the extremely short half-life of native GLP-1 (estimated at 1 to 2 minutes), liraglutide has a half-life of 13 hours, allowing it to be given once daily.26 Liraglutide medication has been approved for long-term use by the FDA.
Benefits. The Liraglutide Effect and Action in Diabetes 1–5 studies compared the effects of liraglutide monotherapy with antidiabetic oral medications or insulin, as well as in combination with antidiabetic oral agents. Liraglutide (Victoza) at doses approved for type 2 DM of 1.2 mg and 1.8 mg daily had significant effects in reducing HbA1c by 0.48% to 1.84% and weight by 2.5 kg to 4 kg.27,28 At a dose of 3.0 mg, liraglutide (Saxenda) is approved for chronic weight management. This dose of liraglutide has been shown to be effective and safe in patients with type 2 DM and obesity.
In the 56-week SCALE Diabetes trial,29 liraglutide at a dose of 3.0 mg resulted in 6.0% weight reduction, compared with 2.0% in the placebo group. Of participants receiving 3.0 mg of liraglutide, 54.3% achieved more than 5% weight loss at 56 weeks compared with 21.4% with placebo. Liraglutide also resulted in significant improvements in HbA1c (mean change −1.3% vs −0.3% with placebo), fasting and postprandial glucose levels, and fasting glucagon levels.29
The Liraglutide Effect and Action in Diabetes: Evaluation of Cardiovascular Outcome Results trial has shown liraglutide to significantly reduce rates of major cardiovascular events (first occurrence of cardiovascular death, nonfatal myocardial infarction, or nonfatal stroke) in patients with elevated cardiovascular risk factors.30 These findings make liraglutide a favorable choice for high-risk patients with type 2 DM, obesity, and cardiovascular disease.
It is important to indicate that if a 5% weight loss is not achieved by 3 months with any of these weight-loss medications, it would be reasonable to stop the medication and consider switching to a different medication. These medications work best when combined with diet and increased physical activity. Weight-loss medications should never be used during pregnancy.
Women of childbearing age should be advised to use effective contraception methods while taking any of the above antiobesity medications.
Diabetes medications associated with weight loss: Metformin and SGLT-2 inhibitors
Although not FDA-approved for weight management, metformin has anorexigenic effects that aid in weight loss. It also inhibits hepatic glucose production and improves peripheral insulin sensitivity, making it a useful agent in patients with type 2 DM and obesity.
A meta-analysis of 31 trials showed that metformin reduced body mass index by 5.3% compared with placebo.31 Metformin should be considered as a first-line agent in obese patients with type 2 DM.
In healthy people, nearly all glucose is filtered in the glomerulus, but then 98% of it is reabsorbed in the proximal tubule by sodium-glucose cotransporter-2 (SGLT-2). Drugs that inhibit SGLT-2 increase urinary glucose excretion and, as a result, help control hyperglycemia. Another, off-label effect of excreting more glucose is weight loss: a sustained weight loss of about 3 kg to 5 kg in clinical studies.32 Although they can be used as monotherapies, SGLT-2 inhibitors are usually used as add-on therapies in patients with type 2 DM.
AN ALGORITHM FOR TREATMENT
Figure 1. Therapeutic algorithm for patients with obesity and type 2 diabetes mellitus.
In an ever-changing field of antiobesity medicines, practitioners are challenged daily with the “when’s and how’s” of prescribing antiobesity drugs. The addition of type 2 DM to the picture makes the choice of drug therapy even more challenging. Here, we propose a practical therapeutic algorithm (Figure 1) that incorporates antiobesity drugs in the management of patients with type 2 DM and obesity.
First, we believe that lifestyle interventions by optimization of nutrition and physical activity should be the cornerstone therapy in the management plan of any patient with type 2 DM and obesity. These interventions are best implemented through a comprehensive, multidisciplinary approach that integrates the care of dietitians, physical therapists, exercise physiologists, psychologists, and social workers.33 Patients need also to be seen frequently, ie, at least once every 3 months. The possibility of seeing patients in group-shared medical appointments on a monthly basis could also be considered.
We also believe that metformin should be added early in the course of treatment for its known benefits of improving insulin sensitivity and suppressing appetite. Target HbA1c goals and body weight in patients with type 2 diabetes and obesity should be tailored to the individual based on age, general health status, risk of hypoglycemia, capacity to do physical activity, and associated comorbidities. If no improvements are seen (HbA1c > 7% and < 3 % weight loss) despite lifestyle changes and the addition of metformin, the possibility of adding a GLP-1 receptor agonist or an SGLT-2 inhibitor as a second-line therapy should be considered. Both classes of medications aid in lowering HbA1c and promote further weight loss.
If no clinical progress is achieved at 3 months, the possibility of adding an FDA-approved weight-loss medication, as discussed above, should be strongly considered. Of note, this algorithm targets different endogenous pathways for weight loss and thus minimizes weight regain through compensatory mechanisms.
THE NEED FOR PATIENT-CENTERED WEIGHT-LOSS CONVERSATIONS
Patient-centered care has become a core quality measure in our healthcare systems and a key to our patients’ success. The decision to start an antiobesity drug should therefore reflect careful consideration of medical and personal patient issues, all of which are valued differently by patients.34
Individualized therapy is even more relevant among patients suffering from a significant burden of disease. About 80% of patients with diabetes live with at least 1 other medical condition,35 and each of these patients spends over 2 hours a day, on average, following doctors’ recommendations.36 If antiobesity medications are prescribed without careful consideration of the patient’s preexisting workload, they will be destined to fail. Therefore, it becomes crucial to first account for the patient’s ability to cope with therapy intensification. This requires careful deliberation between healthcare providers and patients, in aims of targeting a weight-loss plan that fits patients’ goals and is aligned with providers’ expectations.
Healthcare systems also play a key role in supporting better conversations about obesity in type 2 DM patients. They could implement multifaceted initiatives to promote shared decision-making and the use of decision aids to advance patient-centered obesity practices.37 Policymakers could redesign quality measures aimed at capturing the quality of obesity conversations, and develop policies that support better education for clinicians regarding the importance of addressing obesity with adequate communication and patient-centered skills. Guidelines are often too disease-specific and do not consider comorbidities in their context when providing recommendations.38 Thus, diabetes societies should respond to the need to guide care for patients with diabetes and its comorbidities, particularly obesity.
CONCLUSIONS
Obesity is a serious global health issue and a leading risk factor for type 2 DM. Lifestyle measures are the cornerstone of preventing and treating obesity and type 2 DM. Emerging data support the effectiveness of intensive, interdisciplinary weight-loss programs in patients with diabetes. The use of antiobesity drugs should be considered in patients who have not achieved adequate responses to lifestyle interventions. Medications should be tailored to the individual’s health risks and metabolic and psychobehavioral characteristics. In many cases, the addition of weight-loss drugs will help accomplish and maintain the recommended 10% weight reduction, resulting in improvement in glycemic control and significant reduction in cardiovascular risk factors. New studies combining antiobesity and antidiabetes medications in the context of lifestyle interventions will help define the optimal therapeutic approach for patients with type 2 DM and obesity.
References
Ogden CL, Carroll MD, Fryar CD, Flegal KM. Prevalence of obesity among adults and youth: United States, 2011–2014. NCHS Data Brief 2015; (219):1–8.
Lyznicki JM, Young DC, Riggs JA, Davis RM; for the Council on Scientific Affairs, American Medical Association. Obesity: assessment and management in primary care. Am Fam Physician 2001; 63:2185–2196.
Daniels J. Obesity: America’s epidemic. Am J Nurs 2006; 106:40–49.
Colditz GA, Willett WC, Rotnitzky A, Manson JE. Weight gain as a risk factor for clinical diabetes mellitus in women. Ann Intern Med 1995; 122:481–486.
Schauer PR, Bhatt DL, Kirwan JP, et al; STAMPEDE Investigators. Bariatric surgery versus intensive medical therapy for diabetes-5-year outcomes. N Engl J Med 2017; 376:641–651.
Oldridge NB, Stump TE, Nothwehr FK, Clark DO. Prevalence and outcomes of comorbid metabolic and cardiovascular conditions in middle- and older-age adults. J Clin Epidemiol 2001; 54:928–934.
Garber AJ, Abrahamson MJ, Barzilay JI, et al. Consensus statement by the American Association of Clinical Endocrinologists and American College of Endocrinology on the comprehensive type 2 diabetes management algorithm—2016 executive summary. Endocr Pract 2016; 22:84–113.
McFarlane SI. Antidiabetic medications and weight gain: implications for the practicing physician. Curr Diab Rep 2009; 9:249–254.
UK Prospective Diabetes Study (UKPDS) Group. Effect of intensive blood-glucose control with metformin on complications in overweight patients with type 2 diabetes (UKPDS 34). Lancet 1998; 352:854–865.
Beal E. The pros and cons of designating obesity a disease: the new AMA designation stirs debate. Am J Nurs 2013; 113:18–19.
Kraschnewski JL, Sciamanna CN, Stuckey HL, et al. A silent response to the obesity epidemic: decline in US physician weight counseling. Med Care 2013; 51:186–192.
Potter MB, Vu JD, Croughan-Minihane M. Weight management: what patients want from their primary care physicians. J Fam Pract 2001; 50:513–518.
Pappachan JM, Viswanath AK. Medical management of diabesity: do we have realistic targets? Curr Diab Rep 2017; 17:4.
Torgerson JS, Hauptman J, Boldrin MN, Sjöström L. XENical in the prevention of diabetes in obese subjects (XENDOS) study: a randomized study of orlistat as an adjunct to lifestyle changes for the prevention of type 2 diabetes in obese patients. Diabetes Care 2004; 27:155–161.
Buysschaert B, Aydin S, Morelle J, Hermans MP, Jadoul M, Demoulin N. Weight loss at a high cost: orlistat-induced late-onset severe kidney disease. Diabetes Metab 2016; 42:62–64.
Colman E. Anorectics on trial: a half century of federal regulation of prescription appetite suppressants. Ann Intern Med 2005; 143:380–385.
Aronne LJ, Wadden TA, Peterson C, Winslow D, Odeh S, Gadde KM. Evaluation of phentermine and topiramate versus phentermine/topiramate extended-release in obese adults. Obesity (Silver Spring) 2013; 21:2163–2171.
Solas M, Milagro FI, Martínez-Urbistondo D, Ramirez MJ, Martínez JA. Precision obesity treatments including pharmacogenetic and nutrigenetic approaches. Trends Pharmacol Sci 2016; 37:575–593.
Gadde KM, Allison DB, Ryan DH, et al. Effects of low-dose, controlled-release, phentermine plus topiramate combination on weight and associated comorbidities in overweight and obese adults (CONQUER): a randomised, placebo-controlled, phase 3 trial. Lancet 2011; 377:1341–1352.
Hollander P, Gupta AK, Plodkowski R, et al; for the COR-Diabetes Study Group. Effects of naltrexone sustained-release/bupropion sustained-release combination therapy on body weight and glycemic parameters in overweight and obese patients with type 2 diabetes. Diabetes Care 2013; 36:4022–4029.
Cercato C, Roizenblatt VA, Leança CC, et al. A randomized double-blind placebo-controlled study of the long-term efficacy and safety of diethylpropion in the treatment of obese subjects. Int J Obes (Lond) 2009; 33:857–865.
Gardin JM, Schumacher D, Constantine G, Davis KD, Leung C, Reid CL. Valvular abnormalities and cardiovascular status following exposure to dexfenfluramine or phentermine/fenfluramine. JAMA 2000; 283:1703–1709.
O’Neil PM, Smith SR, Weissman NJ, et al. Randomized placebo-controlled clinical trial of lorcaserin for weight loss in type 2 diabetes mellitus: the BLOOM-DM study. Obesity (Silver Spring) 2012; 20:1426–1436.
Amori RE, Lau J, Pittas AG. Efficacy and safety of incretin therapy in type 2 diabetes: systematic review and meta-analysis. JAMA 2007; 298:194–206.
Blonde L, Russell-Jones D. The safety and efficacy of liraglutide with or without oral antidiabetic drug therapy in type 2 diabetes: an overview of the LEAD 1–5 studies. Diabetes Obes Metab 2009; 11(suppl 3):26–34.
Buse JB, Rosenstock J, Sesti G, et al; for the LEAD-6 Study Group. Liraglutide once a day versus exenatide twice a day for type 2 diabetes: a 26-week randomised, parallel-group, multinational, open-label trial (LEAD-6). Lancet 2009; 374:39–47.
Davies MJ, Bergenstal R, Bode B, et al; for the NN8022-1922 Study Group. Efficacy of liraglutide for weight loss among patients with type 2 diabetes: the SCALE diabetes randomized clinical trial. JAMA 2015; 314:687–699.
Marso SP, Daniels GH, Brown-Frandsen K, et al; for the LEADER Steering Committee on behalf of the LEADER Trial Investigators. Liraglutide and cardiovascular outcomes in type 2 diabetes. N Engl J Med 2016; 375:311–322.
Salpeter SR, Buckley NS, Kahn JA, Salpeter EE. Meta-analysis: metformin treatment in persons at risk for diabetes mellitus. Am J Med 2008; 121:149–157.
Vasilakou D, Karagiannis T, Athanasiadou E, et al. Sodium-glucose cotransporter 2 inhibitors for type 2 diabetes: a systematic review and meta-analysis. Ann Intern Med 2013; 159:262–274.
Burguera B, Jesus Tur J; Escudero AJ, et al. An intensive lifestyle intervention is an effective treatment of morbid obesity: the TRAMOMTANA study—a two-year randomized controlled clinical trial. Int J Endocrinol 2015; 2015:194696.
Hargraves I, LeBlanc A, Shah ND, Montori VM. Shared decision making: the need for patient-clinician conversation, not just information. Health Aff (Millwood) 2016; 35:627–629.
Lin P-J, Kent DM, Winn AN, Cohen JT, Neumann PJ. Multiple chronic conditions in type 2 diabetes mellitus: prevalence and consequences. Am J Manag Care 2015; 21:e23–e34.
Russell LB, Suh D-C, Safford MA. Time requirements for diabetes self-management: too much for many? J Fam Pract 2005; 54:52–56.
Serrano V, Rodriguez-Gutierrez R, Hargraves I, Gionfriddo MR, Tamhane S, Montori VM. Shared decision-making in the care of individuals with diabetes. Diabet Med 2016; 33:742–751.
Wyatt KD, Stuart LM, Brito JP, et al. Out of context: clinical practice guidelines and patients with multiple chronic conditions: a systematic review. Med Care 2014; 52(suppl 3):S92–S100.
Bartolome Burguera, MD, PhD Director of Obesity Programs, Endocrinology & Metabolism Institute, Cleveland Clinic; Professor, Cleveland Clinic Lerner College of Medicine of Case Western Reserve University, Cleveland, OH; Medical Director, National Diabetes and Obesity Research Institute, Tradition, MS
Khawla F. Ali, MD Endocrinology & Metabolism Institute, Cleveland Clinic
Juan P. Brito, MD Division of Endocrinology, Assistant Professor of Medicine, Medical Director of the Shared Decision Making National Resource Center Investigator, Knowledge and Evaluation Research Unit, Mayo Clinc; Department of Medicine, Mayo Clinic, Rochester, MN
Correspondence: Bartolome Burguera, MD, PhD, Endocrinology and Metabolism Institute, F-20, Cleveland Clinic, 9500 Euclid Avenue, Cleveland, OH 44195; [email protected]
All authors reported no financial interests or relationships that pose a potential conflict of interest with this article.
Author and Disclosure Information
Bartolome Burguera, MD, PhD Director of Obesity Programs, Endocrinology & Metabolism Institute, Cleveland Clinic; Professor, Cleveland Clinic Lerner College of Medicine of Case Western Reserve University, Cleveland, OH; Medical Director, National Diabetes and Obesity Research Institute, Tradition, MS
Khawla F. Ali, MD Endocrinology & Metabolism Institute, Cleveland Clinic
Juan P. Brito, MD Division of Endocrinology, Assistant Professor of Medicine, Medical Director of the Shared Decision Making National Resource Center Investigator, Knowledge and Evaluation Research Unit, Mayo Clinc; Department of Medicine, Mayo Clinic, Rochester, MN
Correspondence: Bartolome Burguera, MD, PhD, Endocrinology and Metabolism Institute, F-20, Cleveland Clinic, 9500 Euclid Avenue, Cleveland, OH 44195; [email protected]
All authors reported no financial interests or relationships that pose a potential conflict of interest with this article.
Obesity is a leading public health concern, affecting nearly 60 million adult Americans.1 It is a major risk factor for the development of insulin resistance and type 2 diabetes mellitus (DM).2 More than 90% of patients with type 2 DM have obesity, and obesity is a major obstacle to achieving long-term glycemic control.3
Clinical studies have demonstrated that a 6- to 7-kg increase in body weight increases the risk of developing type 2 DM by 50%, while a 5-kg loss reduces the risk by a similar amount.4 As a result, most patients who have a body mass index greater than 40 kg/m2 suffer from type 2 DM.5 Strong evidence exists that bariatric surgery and its resulting weight loss has positive effects on fasting blood sugar, hemoglobin A1c (HbA1c), lipid profiles, and other metabolic variables.6
When combined, obesity and type 2 DM carry a significant burden of micro- and macrovascular complications such as retinopathy, nephropathy, neuropathy, and cardiovascular disease. As a result, a high prevalence of morbidity and mortality is seen among patients with obesity and type 2 DM; those between the ages of 51 and 61 have a 7-times higher mortality rate compared with nonobese normoglycemic people, and patients with diabetes alone have a 2.6-times higher mortality rate.7
A DILEMMA IN THE CLINIC: FOCUS ON THE SUGAR OR THE WEIGHT?
Although type 2 DM and obesity go hand in hand, clinicians tend to focus on the sugar and neglect the weight, concentrating their efforts on improving blood glucose indices, and prescribing in many instances medications that cause weight gain. As a result, we are faced with a rising epidemic of obesity, perpetuating a preexisting epidemic of diabetes.
An optimal, comprehensive approach to managing patients with type 2 DM should encompass both the control of dysglycemia and its associated comorbidities, obesity being the key player.8 However, clinical practice is often misaligned with the evidence. For instance, many of our first-line oral treatments for type 2 DM (except for metformin) are associated with weight gain.9 With time, control of glycemia becomes more and more ineffective, at which point therapy is intensified with insulin, further exacerbating the weight gain.10
Therefore, it seems counterintuitive to treat a disease for which obesity is one of the main risk factors with medications that promote weight gain. Yet healthcare providers are faced with a therapeutic dilemma: should they focus their efforts on improving patients’ glycemic control, or should they invest in helping these patients lose weight? Although an ideal approach would incorporate both aspects, the reality is that it is far from practical.
A few issues impinge on integrating weight loss in the care of type 2 DM. Although the American Medical Association recognized obesity as a disease in 2013,11 some providers still perceive obesity as a self-inflicted condition that is due to bad lifestyle and behavior.11 Many clinicians may also have low expectations for patients’ success, and often lack the time and knowledge to intervene regarding nutrition, physical activity, and psychological issues pertinent to the management of obesity in type 2 DM. Therefore, in many cases, it seems less complicated and more rewarding for both patients and physicians to concentrate on improving the HbA1c value rather than investing efforts in weight loss. For diabetic patients with obesity, this could mean that clinicians may prescribe glucose-lowering therapies, such as insulin and sulfonylureas, at the expense of weight gain. Additionally, clinicians often experience the need to provide recommendations more aligned with metrics that dictate reimbursement (eg, HbA1c targets) within healthcare systems that still raise concerns regarding obesity visit reimbursements.
Lastly, the lack of trustworthy or pertinent evidence (lack of comparative effectiveness research) for antiobesity medications may limit their use in daily practice. Physicians have had little confidence in the efficacy of antiobesity drugs, and often raise significant safety concerns, especially after witnessing important fiascos in this field, eg, dexfenfluramine, rimonabant, and sibutramine.2,12,13
As a result, many of our patients with obesity and type 2 DM may not consider the need for weight loss, and may not even be aware that type 2 DM is caused by obesity and physical inactivity in the first place. Others have accumulated a significant degree of frustration, and have “thrown in the towel” already after unsuccessful weight-loss efforts, many of which were not medically supervised.
For all of the above reasons, both clinicians and patients often concentrate their efforts on treating blood glucose numbers rather than the “obesity-diabetes” as a whole.14 And as a result, our practices are slowly filling up with patients with obesity and type 2 DM who are treated primarily with insulin, resulting in a progressive (and untreated) obesity and diabetes epidemic.
DRUGS FOR TREATING OBESITY AND TYPE 2 DM
Because the body strongly defends its fat cells, the common advice to simply “eat less, move more” cannot be expected to bring about meaningful and lasting weight reduction or control of HbA1c. However, weight-loss drugs (Table 1),15 used in conjunction with an interdisciplinary lifestyle intervention program, may provide more success regarding both issues. Here we discuss a few pharmacologic therapies approved for the management of obesity in the context of type 2 DM, and vice versa. Taking into account that dosages of these medications should be individualized to achieve a weight-loss goal with the lowest effective dose possible.
Orlistat
Orlistat (Xenical) is the only weight-loss drug approved by the US Food and Drug Administration (FDA) that acts outside the brain. It inhibits pancreatic lipases, resulting in up to 30% less fat absorption in the gut. Orlistat has been approved for long-term use by the FDA.
Benefits. In the XENical in the Prevention of Diabetes in Obese Subjects study, treatment with orlistat resulted in a significant reduction in the cumulative incidence of type 2 DM after 4 years of treatment (9.0% with placebo vs 6.2% with orlistat), corresponding to a risk reduction of 37.3%.16 Mean weight loss after 4 years was significantly greater in the orlistat group (5.8 vs 3.0 kg with placebo; P < .001).16 Other benefits of orlistat included a reduction in low-density lipoprotein cholesterol independent of that expected from change in body weight.16
Adverse effects include flatulence with discharge and fecal urgency after high-fat dietary indiscretions. Serum levels of fat-soluble vitamins (A, D, E, and K) were lower with orlistat than with placebo,16 and a fat-soluble vitamin supplement should be taken 2 hours before or after taking orlistat. Serious but very uncommon adverse events such as kidney damage have been reported.17 Kidney and liver function should be monitored while taking orlistat.
Phentermine
Phentermine (Adipex-P, Lomaira), a sympathomimetic amine, is the most commonly prescribed antiobesity drug in the United States. A schedule IV controlled substance, it is FDA-approved for short-term use (up to 12 weeks). Its primary mechanism of action is mediated by reduction in hunger perception. It was first developed in the 1970s and is available in doses ranging from 8 mg to 37.5 mg daily.18
Benefits. In a randomized trial, at 28 weeks, weight loss was 1.5 kg with placebo and 5.3 kg with phentermine.19 No long-term (> 1 year) randomized controlled trials of the effectiveness of phentermine monotherapy in weight loss have been conducted.
Adverse effects. Dizziness, dry mouth, insomnia, constipation, and increase in heart rate were most common.19
Phentermine is contraindicated in patients with coronary artery disease, congestive heart failure, stroke, and uncontrolled hypertension. Currently, no data exist on the long-term cardiovascular effects of phentermine. We believe phentermine, used in patients at low to intermediate cardiovascular risk, is a useful “jumpstart” tool, in combination with lifestyle changes, to achieve weight loss and improve metabolic values for those with type 2 DM and obesity.
Phentermine is a controlled substance per Ohio law. Patients must be seen once a month by the prescribing provider and prescriptions are limited to a 30-day supply, which must be filled within 7 days of the date of the prescription. Phentermine can only be prescribed for a maximum of 3 months and must be discontinued for 6 months before patients are eligible for a new prescription.
Phentermine and topiramate extended-release
Obesity is a product of complex interactions between several neurohormonal pathways. Approaches simultaneously targeting more than one regulatory pathway have become popular and quite efficient strategies in treating patients with obesity.20 Stemming from such approaches, antiobesity drug combinations such as phentermine and topiramate extended-release (Qsymia) have become increasingly recognized and used in clinical practice. The combination of these 2 medications has been approved for long-term use by the FDA.
Phentermine and topiramate extended-release is a fixed-dose combination that was approved for weight loss in 2012. Topiramate, an anticonvulsant, and phentermine exert their anorexigenic effects through regulating various brain neurotransmitters and result in more weight loss when used together than when either is used alone. Several clinical trials evaluated the efficacy of low doses of this combination in weight loss.
Benefits. In a randomized trial in patients with obesity and cardiometabolic diseases, at 56 weeks, the mean weight loss was:
1.2% in the placebo group
7.8% in the group receiving phentermine 7.5 mg and topiramate 46 mg
9.8% in the group receiving phentermine 15 mg and topiramate 92 mg.21
Patients in the active treatment groups also had significant improvements in cardiovascular and metabolic risk factors such as waist circumference, systolic blood pressure, and total cholesterol/high-density lipoprotein cholesterol ratio. At 56 weeks, patients with diabetes and prediabetes taking this preparation had greater reductions in HbA1c values, and fewer prediabetes patients progressed to type 2 DM.21
Adverse effects most commonly seen were dry mouth, paresthesia, and constipation.21
This combination is contraindicated in pregnancy, patients with recent stroke, uncontrolled hypertension, coronary artery disease, glaucoma, hyperthyroidism, or in patients taking monoamine oxidase inhibitors. Women of childbearing age should be tested for pregnancy before starting therapy, and monthly thereafter, and also be advised to use effective methods of contraception while taking the medication. Topiramate has been associated with the development of renal stones and thus should be used with caution in patients with a history of kidney stones.
Bupropion and naltrexone sustained-release
Bupropion and naltrexone sustained-release (Contrave) is another FDA-approved combination drug for chronic weight management. Bupropion is a dopamine and norepinephrine reuptake inhibitor approved for depression and smoking cessation, and naltrexone is an opioid receptor antagonist approved for treating alcohol and opioid dependence. The combination of these 2 medications has been approved for long-term use by the FDA.
Benefits. In a randomized trial in patients with obesity and type 2 DM, weight loss at 56 weeks was:
1.8% with placebo
5.0% with naltrexone 32 mg and bupropion 360 mg daily.
Absolute reductions in HbA1c were:
0.1% with placebo
0.6% with naltrexone-bupropion.
Improvements were also seen in other cardiometabolic risk factors such as triglyceride and high-density lipoprotein cholesterol levels.22
Adverse effects. The most common adverse effect leading to drug discontinuation was nausea. Other adverse effects reported were constipation, headache, vomiting, and dizziness.22
Naltrexone-bupropion is contraindicated in patients with a history of seizure disorder or a diagnosis of anorexia nervosa or bulimia, or who are on chronic opioid therapy.
Diethylpropion
Diethylpropion (Tenuate, Tenuate Dospan) is a central nervous system stimulant similar to bupropion in its structure. It was approved by the FDA for treating obesity in 1959. It should be used as part of a short-term weight-loss plan, along with a low-calorie diet. Diethylpropion is also a controlled substance and, as with phentermine therapy, patients are required to be seen once a month by their prescriber. Diethylpropion cannot be prescribed for more than 3 months.
Benefits. Weight loss in a randomized trial at 6 months:
3.2% with placebo
9.8% with diethylpropion 50 mg twice a day.23
After 6 months, all participants received diethylpropion in an open-label extension for an additional 6 months. At 12 months, the mean weight loss produced by diethylpropion was 10.6%.23 No differences in heart rate, blood pressure, electrocardiographic results, or psychiatric evaluations were observed.
Adverse effects. As with phentermine, common side effects of diethylpropion include insomnia, dry mouth, dizziness, headache, mild increases in blood pressure, and palpitations.23
Lorcaserin
Lorcaserin (Belviq) was approved by the FDA for chronic weight management in June 2012. It exerts its effects through binding selectively to central 5-HT2C serotonin receptors, with poor affinity for 5-HT2A and 5-HT2B receptors. Nonselective serotoninergic agents, including fenfluramine and dexfenfluramine, were withdrawn from the market in 1997 after being reported to be associated with valvular heart abnormalities.24 Lorcaserin has been approved for long-term use by the FDA.
Benefits. Mean weight loss at 1 year in the Behavioral Modification and Lorcaserin for Overweight and Obesity Management in Diabetes Mellitus trial25 was:
1.5% with placebo
5.0% with lorcaserin 10 mg once daily
4.5% with lorcaserin 10 mg twice daily.
Absolute reductions in HbA1c values were:
0.4% with placebo
0.9% with lorcaserin 10 mg once daily
1.0% with lorcaserin 10 mg twice daily.
Absolute reductions in fasting plasma glucose values were:
11.9 mg/dL with placebo
27.4 mg/dL with lorcaserin 10 mg once daily
28.4 mg/dL with lorcaserin 10 mg twice daily.25
Adverse effects. The most common adverse effects were headache, dizziness, and fatigue. There was no significant increase in valvulopathy on echocardiography of participants receiving lorcaserin compared with placebo.25
Liraglutide
Liraglutide (Saxenda, Victoza) is a glucagon-like peptide-1 (GLP-1) receptor agonist. Native GLP-1 is a hormone secreted by intestinal L cells in response to consumption of fat and carbohydrate-rich foods. It stimulates the release of insulin and suppresses any inappropriately elevated postprandial glucagon levels. In addition to its effect on glucose metabolism, GLP-1 also reduces appetite and delays gastric emptying in humans.26 Unlike the extremely short half-life of native GLP-1 (estimated at 1 to 2 minutes), liraglutide has a half-life of 13 hours, allowing it to be given once daily.26 Liraglutide medication has been approved for long-term use by the FDA.
Benefits. The Liraglutide Effect and Action in Diabetes 1–5 studies compared the effects of liraglutide monotherapy with antidiabetic oral medications or insulin, as well as in combination with antidiabetic oral agents. Liraglutide (Victoza) at doses approved for type 2 DM of 1.2 mg and 1.8 mg daily had significant effects in reducing HbA1c by 0.48% to 1.84% and weight by 2.5 kg to 4 kg.27,28 At a dose of 3.0 mg, liraglutide (Saxenda) is approved for chronic weight management. This dose of liraglutide has been shown to be effective and safe in patients with type 2 DM and obesity.
In the 56-week SCALE Diabetes trial,29 liraglutide at a dose of 3.0 mg resulted in 6.0% weight reduction, compared with 2.0% in the placebo group. Of participants receiving 3.0 mg of liraglutide, 54.3% achieved more than 5% weight loss at 56 weeks compared with 21.4% with placebo. Liraglutide also resulted in significant improvements in HbA1c (mean change −1.3% vs −0.3% with placebo), fasting and postprandial glucose levels, and fasting glucagon levels.29
The Liraglutide Effect and Action in Diabetes: Evaluation of Cardiovascular Outcome Results trial has shown liraglutide to significantly reduce rates of major cardiovascular events (first occurrence of cardiovascular death, nonfatal myocardial infarction, or nonfatal stroke) in patients with elevated cardiovascular risk factors.30 These findings make liraglutide a favorable choice for high-risk patients with type 2 DM, obesity, and cardiovascular disease.
It is important to indicate that if a 5% weight loss is not achieved by 3 months with any of these weight-loss medications, it would be reasonable to stop the medication and consider switching to a different medication. These medications work best when combined with diet and increased physical activity. Weight-loss medications should never be used during pregnancy.
Women of childbearing age should be advised to use effective contraception methods while taking any of the above antiobesity medications.
Diabetes medications associated with weight loss: Metformin and SGLT-2 inhibitors
Although not FDA-approved for weight management, metformin has anorexigenic effects that aid in weight loss. It also inhibits hepatic glucose production and improves peripheral insulin sensitivity, making it a useful agent in patients with type 2 DM and obesity.
A meta-analysis of 31 trials showed that metformin reduced body mass index by 5.3% compared with placebo.31 Metformin should be considered as a first-line agent in obese patients with type 2 DM.
In healthy people, nearly all glucose is filtered in the glomerulus, but then 98% of it is reabsorbed in the proximal tubule by sodium-glucose cotransporter-2 (SGLT-2). Drugs that inhibit SGLT-2 increase urinary glucose excretion and, as a result, help control hyperglycemia. Another, off-label effect of excreting more glucose is weight loss: a sustained weight loss of about 3 kg to 5 kg in clinical studies.32 Although they can be used as monotherapies, SGLT-2 inhibitors are usually used as add-on therapies in patients with type 2 DM.
AN ALGORITHM FOR TREATMENT
Figure 1. Therapeutic algorithm for patients with obesity and type 2 diabetes mellitus.
In an ever-changing field of antiobesity medicines, practitioners are challenged daily with the “when’s and how’s” of prescribing antiobesity drugs. The addition of type 2 DM to the picture makes the choice of drug therapy even more challenging. Here, we propose a practical therapeutic algorithm (Figure 1) that incorporates antiobesity drugs in the management of patients with type 2 DM and obesity.
First, we believe that lifestyle interventions by optimization of nutrition and physical activity should be the cornerstone therapy in the management plan of any patient with type 2 DM and obesity. These interventions are best implemented through a comprehensive, multidisciplinary approach that integrates the care of dietitians, physical therapists, exercise physiologists, psychologists, and social workers.33 Patients need also to be seen frequently, ie, at least once every 3 months. The possibility of seeing patients in group-shared medical appointments on a monthly basis could also be considered.
We also believe that metformin should be added early in the course of treatment for its known benefits of improving insulin sensitivity and suppressing appetite. Target HbA1c goals and body weight in patients with type 2 diabetes and obesity should be tailored to the individual based on age, general health status, risk of hypoglycemia, capacity to do physical activity, and associated comorbidities. If no improvements are seen (HbA1c > 7% and < 3 % weight loss) despite lifestyle changes and the addition of metformin, the possibility of adding a GLP-1 receptor agonist or an SGLT-2 inhibitor as a second-line therapy should be considered. Both classes of medications aid in lowering HbA1c and promote further weight loss.
If no clinical progress is achieved at 3 months, the possibility of adding an FDA-approved weight-loss medication, as discussed above, should be strongly considered. Of note, this algorithm targets different endogenous pathways for weight loss and thus minimizes weight regain through compensatory mechanisms.
THE NEED FOR PATIENT-CENTERED WEIGHT-LOSS CONVERSATIONS
Patient-centered care has become a core quality measure in our healthcare systems and a key to our patients’ success. The decision to start an antiobesity drug should therefore reflect careful consideration of medical and personal patient issues, all of which are valued differently by patients.34
Individualized therapy is even more relevant among patients suffering from a significant burden of disease. About 80% of patients with diabetes live with at least 1 other medical condition,35 and each of these patients spends over 2 hours a day, on average, following doctors’ recommendations.36 If antiobesity medications are prescribed without careful consideration of the patient’s preexisting workload, they will be destined to fail. Therefore, it becomes crucial to first account for the patient’s ability to cope with therapy intensification. This requires careful deliberation between healthcare providers and patients, in aims of targeting a weight-loss plan that fits patients’ goals and is aligned with providers’ expectations.
Healthcare systems also play a key role in supporting better conversations about obesity in type 2 DM patients. They could implement multifaceted initiatives to promote shared decision-making and the use of decision aids to advance patient-centered obesity practices.37 Policymakers could redesign quality measures aimed at capturing the quality of obesity conversations, and develop policies that support better education for clinicians regarding the importance of addressing obesity with adequate communication and patient-centered skills. Guidelines are often too disease-specific and do not consider comorbidities in their context when providing recommendations.38 Thus, diabetes societies should respond to the need to guide care for patients with diabetes and its comorbidities, particularly obesity.
CONCLUSIONS
Obesity is a serious global health issue and a leading risk factor for type 2 DM. Lifestyle measures are the cornerstone of preventing and treating obesity and type 2 DM. Emerging data support the effectiveness of intensive, interdisciplinary weight-loss programs in patients with diabetes. The use of antiobesity drugs should be considered in patients who have not achieved adequate responses to lifestyle interventions. Medications should be tailored to the individual’s health risks and metabolic and psychobehavioral characteristics. In many cases, the addition of weight-loss drugs will help accomplish and maintain the recommended 10% weight reduction, resulting in improvement in glycemic control and significant reduction in cardiovascular risk factors. New studies combining antiobesity and antidiabetes medications in the context of lifestyle interventions will help define the optimal therapeutic approach for patients with type 2 DM and obesity.
References
Ogden CL, Carroll MD, Fryar CD, Flegal KM. Prevalence of obesity among adults and youth: United States, 2011–2014. NCHS Data Brief 2015; (219):1–8.
Lyznicki JM, Young DC, Riggs JA, Davis RM; for the Council on Scientific Affairs, American Medical Association. Obesity: assessment and management in primary care. Am Fam Physician 2001; 63:2185–2196.
Daniels J. Obesity: America’s epidemic. Am J Nurs 2006; 106:40–49.
Colditz GA, Willett WC, Rotnitzky A, Manson JE. Weight gain as a risk factor for clinical diabetes mellitus in women. Ann Intern Med 1995; 122:481–486.
Schauer PR, Bhatt DL, Kirwan JP, et al; STAMPEDE Investigators. Bariatric surgery versus intensive medical therapy for diabetes-5-year outcomes. N Engl J Med 2017; 376:641–651.
Oldridge NB, Stump TE, Nothwehr FK, Clark DO. Prevalence and outcomes of comorbid metabolic and cardiovascular conditions in middle- and older-age adults. J Clin Epidemiol 2001; 54:928–934.
Garber AJ, Abrahamson MJ, Barzilay JI, et al. Consensus statement by the American Association of Clinical Endocrinologists and American College of Endocrinology on the comprehensive type 2 diabetes management algorithm—2016 executive summary. Endocr Pract 2016; 22:84–113.
McFarlane SI. Antidiabetic medications and weight gain: implications for the practicing physician. Curr Diab Rep 2009; 9:249–254.
UK Prospective Diabetes Study (UKPDS) Group. Effect of intensive blood-glucose control with metformin on complications in overweight patients with type 2 diabetes (UKPDS 34). Lancet 1998; 352:854–865.
Beal E. The pros and cons of designating obesity a disease: the new AMA designation stirs debate. Am J Nurs 2013; 113:18–19.
Kraschnewski JL, Sciamanna CN, Stuckey HL, et al. A silent response to the obesity epidemic: decline in US physician weight counseling. Med Care 2013; 51:186–192.
Potter MB, Vu JD, Croughan-Minihane M. Weight management: what patients want from their primary care physicians. J Fam Pract 2001; 50:513–518.
Pappachan JM, Viswanath AK. Medical management of diabesity: do we have realistic targets? Curr Diab Rep 2017; 17:4.
Torgerson JS, Hauptman J, Boldrin MN, Sjöström L. XENical in the prevention of diabetes in obese subjects (XENDOS) study: a randomized study of orlistat as an adjunct to lifestyle changes for the prevention of type 2 diabetes in obese patients. Diabetes Care 2004; 27:155–161.
Buysschaert B, Aydin S, Morelle J, Hermans MP, Jadoul M, Demoulin N. Weight loss at a high cost: orlistat-induced late-onset severe kidney disease. Diabetes Metab 2016; 42:62–64.
Colman E. Anorectics on trial: a half century of federal regulation of prescription appetite suppressants. Ann Intern Med 2005; 143:380–385.
Aronne LJ, Wadden TA, Peterson C, Winslow D, Odeh S, Gadde KM. Evaluation of phentermine and topiramate versus phentermine/topiramate extended-release in obese adults. Obesity (Silver Spring) 2013; 21:2163–2171.
Solas M, Milagro FI, Martínez-Urbistondo D, Ramirez MJ, Martínez JA. Precision obesity treatments including pharmacogenetic and nutrigenetic approaches. Trends Pharmacol Sci 2016; 37:575–593.
Gadde KM, Allison DB, Ryan DH, et al. Effects of low-dose, controlled-release, phentermine plus topiramate combination on weight and associated comorbidities in overweight and obese adults (CONQUER): a randomised, placebo-controlled, phase 3 trial. Lancet 2011; 377:1341–1352.
Hollander P, Gupta AK, Plodkowski R, et al; for the COR-Diabetes Study Group. Effects of naltrexone sustained-release/bupropion sustained-release combination therapy on body weight and glycemic parameters in overweight and obese patients with type 2 diabetes. Diabetes Care 2013; 36:4022–4029.
Cercato C, Roizenblatt VA, Leança CC, et al. A randomized double-blind placebo-controlled study of the long-term efficacy and safety of diethylpropion in the treatment of obese subjects. Int J Obes (Lond) 2009; 33:857–865.
Gardin JM, Schumacher D, Constantine G, Davis KD, Leung C, Reid CL. Valvular abnormalities and cardiovascular status following exposure to dexfenfluramine or phentermine/fenfluramine. JAMA 2000; 283:1703–1709.
O’Neil PM, Smith SR, Weissman NJ, et al. Randomized placebo-controlled clinical trial of lorcaserin for weight loss in type 2 diabetes mellitus: the BLOOM-DM study. Obesity (Silver Spring) 2012; 20:1426–1436.
Amori RE, Lau J, Pittas AG. Efficacy and safety of incretin therapy in type 2 diabetes: systematic review and meta-analysis. JAMA 2007; 298:194–206.
Blonde L, Russell-Jones D. The safety and efficacy of liraglutide with or without oral antidiabetic drug therapy in type 2 diabetes: an overview of the LEAD 1–5 studies. Diabetes Obes Metab 2009; 11(suppl 3):26–34.
Buse JB, Rosenstock J, Sesti G, et al; for the LEAD-6 Study Group. Liraglutide once a day versus exenatide twice a day for type 2 diabetes: a 26-week randomised, parallel-group, multinational, open-label trial (LEAD-6). Lancet 2009; 374:39–47.
Davies MJ, Bergenstal R, Bode B, et al; for the NN8022-1922 Study Group. Efficacy of liraglutide for weight loss among patients with type 2 diabetes: the SCALE diabetes randomized clinical trial. JAMA 2015; 314:687–699.
Marso SP, Daniels GH, Brown-Frandsen K, et al; for the LEADER Steering Committee on behalf of the LEADER Trial Investigators. Liraglutide and cardiovascular outcomes in type 2 diabetes. N Engl J Med 2016; 375:311–322.
Salpeter SR, Buckley NS, Kahn JA, Salpeter EE. Meta-analysis: metformin treatment in persons at risk for diabetes mellitus. Am J Med 2008; 121:149–157.
Vasilakou D, Karagiannis T, Athanasiadou E, et al. Sodium-glucose cotransporter 2 inhibitors for type 2 diabetes: a systematic review and meta-analysis. Ann Intern Med 2013; 159:262–274.
Burguera B, Jesus Tur J; Escudero AJ, et al. An intensive lifestyle intervention is an effective treatment of morbid obesity: the TRAMOMTANA study—a two-year randomized controlled clinical trial. Int J Endocrinol 2015; 2015:194696.
Hargraves I, LeBlanc A, Shah ND, Montori VM. Shared decision making: the need for patient-clinician conversation, not just information. Health Aff (Millwood) 2016; 35:627–629.
Lin P-J, Kent DM, Winn AN, Cohen JT, Neumann PJ. Multiple chronic conditions in type 2 diabetes mellitus: prevalence and consequences. Am J Manag Care 2015; 21:e23–e34.
Russell LB, Suh D-C, Safford MA. Time requirements for diabetes self-management: too much for many? J Fam Pract 2005; 54:52–56.
Serrano V, Rodriguez-Gutierrez R, Hargraves I, Gionfriddo MR, Tamhane S, Montori VM. Shared decision-making in the care of individuals with diabetes. Diabet Med 2016; 33:742–751.
Wyatt KD, Stuart LM, Brito JP, et al. Out of context: clinical practice guidelines and patients with multiple chronic conditions: a systematic review. Med Care 2014; 52(suppl 3):S92–S100.
Cleveland Clinic Journal of Medicine 2017 July;84(suppl 1):S39-S46
Inside the Article
KEY POINTS
Obesity contributes to type 2 DM and worsens its control. Yet insulin therapy and most first-line diabetes drugs cause weight gain as a side effect.
We believe that physicians should include body weight along with blood glucose levels as targets of therapy in patients with type 2 DM.
Several drugs are approved for weight loss, and although their effect on weight tends to be moderate, some have been shown to reduce the incidence of type 2 DM and improve diabetic control.
A stepwise approach to managing type 2 DM and obesity starts with lifestyle interventions and advances to adding (1) metformin, (2) a glucagon-like peptide-1 receptor agonist or a sodium-glucose cotransporter-2 inhibitor, and (3) one of the approved weight-loss drugs.
Disallow All Ads
Content Gating
No Gating (article Unlocked/Free)
Alternative CME
Disqus Comments
Default
Consolidated Pubs: Do Not Show Source Publication Logo