User login
Targeting heme synthesis to treat AML

Researchers have found evidence to suggest that a type of acute myeloid leukemia (AML) depends on the production of heme.
The group’s work has revealed 2 ways to target heme synthesis that might be used to treat this type of AML, which is driven by the oncogene MYCN.
John Schuetz, PhD, of St. Jude Children’s Research Hospital in Memphis, Tennessee, and his colleague described this research in JCI Insight.
Previous research had suggested that heme production was affected in leukemia.
However, Dr Schuetz said, “Absolutely nothing was known about the role of heme biosynthesis [in AML] before our work.”
The researchers’ first clue regarding heme’s role in AML arose from a computer search. The team searched a genomic database for other genes that were abnormally switched on in MYCN-driven AML.
They found that UROD was highly activated and noted that UROD is part of the molecular machinery that synthesizes heme.
Especially significant, Dr Schuetz said, was the finding that MYCN-driven AML with the most over-activated UROD was far more lethal than other AMLs.
The researchers found that cells with over-activated MYCN consumed more oxygen and depended on the production of heme for self-renewal and oncogenic transformation. But the team was able to block cancer cell self-renewal in the MYCN cells by blocking heme synthesis.
The researchers also found they could suppress self-renewal by blocking ABCG2, a “relief-valve” molecule that rids the cells of porphyrin, a building-block molecule of heme.
Blocking ABCG2 caused the buildup of porphyrin, which is toxic to the leukemia cells. However, blocking ABCG2 in normal cells produced no ill effects.
In mouse models of MYCN leukemia, the researchers tested a strategy of knocking out ABCG2. These knockout mice had significantly slower disease progression and longer survival.
What’s more, the team found they could cure leukemia in these mice by inhibiting ABCG2 and ramping up the heme machinery.
“Our findings suggest 2 drug strategies to treat AML,” Dr Schuetz said. “One would be to target UROD, which would reduce heme biosynthesis. Such drugs would selectively affect leukemia cells because they are so dependent on heme.”
“The other strategy would be to use drugs to inhibit the relief-valve protein and, at the same time, administer a chemical that is a precursor of heme. This would cause a buildup of toxic molecules that are part of the heme synthesis pathway.”
Dr Schuetz said other cancers with an over-activated heme pathway might also be vulnerable to such a treatment strategy.
He and his colleagues plan to extend their understanding of the heme machinery in AML with further studies. For example, they don’t know whether heme’s role in cell respiration is the only important one in supporting AML progression, since heme plays a wide range of roles in cells.
The researchers are also planning to test whether drugs that suppress UROD function in the heme-production machinery can effectively battle AML. ![]()
Advanced cancer patients have lower survival after cardiac arrest
A new study suggests patients with advanced cancer who suffer cardiac arrest in the hospital have a survival rate of less than 10%, which is about half the rate of patients without cancer who suffer cardiac arrest.
This finding helps to clear up some myths about cardiac arrest survival and can be used as a guidepost when hospitalized cancer patients and their families consider do-not-resuscitate (DNR) orders, said Jeffrey T. Bruckel, MD, of the University of Rochester Medical Center in New York.
“We’re hopeful that our study, in some way, will help doctors and cancer patients make more informed decisions about the end of life,” Dr Bruckel said. “It’s very important to have early, frank discussions around the goals of care.”
Dr Bruckel and his colleagues published their study in the Journal of Oncology Practice.
The researchers used a US-wide resuscitation registry to evaluate survival after cardiac arrest in patients treated at 369 hospitals.
The study excluded patients with implantable defibrillators and those who were admitted for surgery, emergency room treatment, rehabilitation, or treatment from cardiac catheterization labs or interventional radiology.
Of the 47,157 eligible patients who experienced cardiac arrest, 14% (n=6585) had advanced cancer, including hematologic malignancies.
After cardiac arrest, 57.5% of the advanced cancer patients were resuscitated successfully, as were 63% of non-cancer patients (P<0.001).
After resuscitation, 9.6% of the cancer patients survived to be discharged, compared to 19.2% of non-cancer patients (P<0.001).
When the researchers adjusted their analysis for potential confounders, results were similar. The rate of successful resuscitation was 52.3% in advanced cancer patients and 56.6% in non-cancer patients (P<0.001). The rate of survival to discharge was 7.4% and 13.4%, respectively (P<0.001).
Dr Bruckel said there was no evidence to suggest that patients with advanced cancer received less aggressive resuscitation care.
However, there was a significant difference in the mean duration of resuscitation time among non-survivors with cancer—22.5 minutes—and non-survivors without cancer—24.2 minutes (P<0.001). After adjustment, the mean duration of resuscitation was 22.5 minutes and 24.1 minutes, respectively (P<0.001).
Cancer patients were more likely than those without cancer to sign DNR orders after resuscitation—55.6% and 43%, respectively (P<0.001). Results were similar after adjustment—50.4% and 41.6%, respectively (P<0.001).
Dr Bruckel and his colleagues said there were several limitations to this study, including a lack of detailed data on the types of advanced cancer and cancer treatments being given at the time of cardiac arrest.
Therefore, the next step in advancing this work is to gather data on the types of cancer diagnosis and treatment plans of patients who undergo in-hospital cardiac arrest.
Dr Bruckel also believes it is important to know how patients feel about this data and how both patients and physicians are using this data in decision-making.
“A large component of end-of-life care involves patient and family care decision-making, and a lot of that is driven by the routine discussions that we have,” Dr Bruckel said. “Not every patient is going to want detailed information, but for those that do, it’s important to have it. It’s important to tell them what we know.” ![]()
Database may provide insight into childhood cancers

A database containing information on more than 11,000 tumors is now available to researchers studying pediatric cancers.
The database was created as part of UC Santa Cruz Genomics Institute’s Treehouse Childhood Cancer Initiative.
The goal of this initiative is to allow researchers to analyze their patients’ data alongside data from thousands of patients with pediatric and adult cancers, including leukemias and lymphomas.
The intention is to help researchers find hidden causes of cancer that may be missed when they analyze a patient’s data in isolation.
The database, which is available at https://treehouse.xenahubs.net, contains RNA-sequencing gene expression data, as well as information on patients’ age, sex, and disease. ![]()
Recurrent UTIs in Women: How to Refine Your Care

For the third time in nine months, Joan, 28, presents with complaints of painful, frequent, and urgent urination. Joan is sexually active; her medical history is otherwise unremarkable. In each of the previous two episodes, her urine culture grew Escherichia coli, and she was treated with a five-day course of nitrofurantoin. Now, she asks about the need for additional workup and treatment, as well as whether there is a way to prevent further infections.
Urinary tract infections (UTIs) are the most common bacterial infection in women and account for an estimated 5.4 million primary care office visits and 2.3 million emergency department visits annually.1,2 For women, the lifetime risk for a UTI is greater than 50%.3 In one study of UTI in a primary care setting, 36% of women younger than 55 and 53% of women older than 55 had a recurrent infection within a year.4 Most women with UTI are treated as outpatients, but 16.7% require hospitalization.5 In the United States, direct costs for evaluation and treatment of UTI total $1.6 billion each year.5
Accurately characterizing recurrent UTI
Bacteriuria is defined as the presence of 100,000 colony-forming units (ie, viable bacteria) per milliliter of urine collected midstream on two consecutive urinations.6 UTIs are symptomatic infections of the urinary tract and may involve the urethra, bladder, ureters, or kidneys.7 Infections of the lower tract (bladder and urethra) are commonly referred to as cystitis; infections of the upper tract (kidney and ureters) are referred to as pyelonephritis.
Most UTIs are uncomplicated and do not progress to more serious infections. However, patients who are pregnant or who have chronic medical conditions (eg, renal insufficiency or use of immunosuppressant medications), urinary obstruction, or calculi may develop complicated UTIs.8
Recurrent UTI is an infection that follows resolution of bacteriuria and symptoms of a prior UTI; the term applies when such an infection occurs within six months of the previous UTI or when three or more UTIs occur within a year.7 Recurrent infection can be further characterized as relapse or reinfection. Relapse occurs when the patient has a second UTI caused by the same pathogen within two weeks of the original treatment.9 Reinfection is a UTI that occurs more than two weeks after completion of treatment for the original UTI. The pathogen in a reinfection may be the same one that caused the original UTI or it may be a different agent.9
It’s also important to differentiate between recurrent and resistant UTI. In resistant UTI, bacteriuria fails to resolve following seven to 14 days of appropriate antibiotic treatment.9

FACTORS THAT INCREASE RISK FOR RECURRENT UTI
Premenopausal women
Both modifiable and nonmodifiable factors (see Table 1) have been associated with increased risk for recurrent UTI in premenopausal women.10-21 Among those with specific blood group phenotypes (Lewis non-secretor, in particular), rates of UTI rise secondary to increased adherence of bacteria to epithelial cells in the urinary tract.10 Other nonmodifiable risk factors include congenital urinary tract anomalies, obstruction of the urinary tract, and a history of UTI.11,12 Women whose mothers had UTIs are at higher risk for recurrent UTI than are those whose mothers had no such history.13
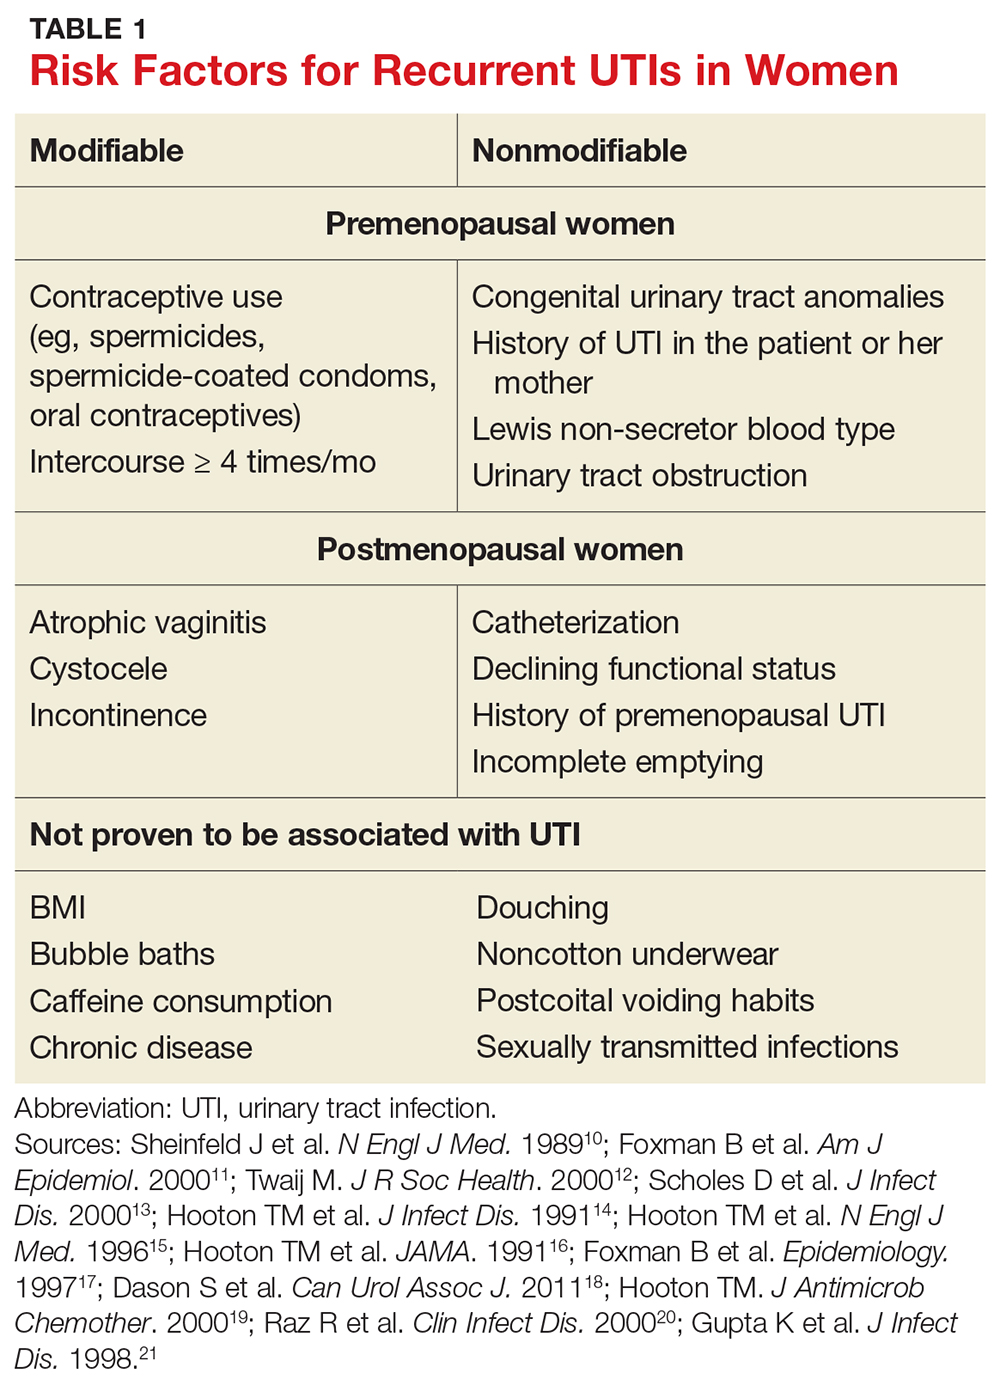
Modifiable risk factors for recurrent UTI include contraceptive use (spermicides, spermicide-coated condoms, and oral contraceptives) and frequency of intercourse (≥ 4 times/month).13 Spermicides alter the normal vaginal flora and lead to increased colonization of E coli, which increases the risk for UTI.14 Women with recurrent UTIs were 1.27 to 1.45 times more likely to use oral contraceptives than those without recurrent UTIs.13 Compared with college women who had not had intercourse, sexually active college women who had engaged in intercourse three times in a week had a 2.6-fold increase in relative risk for UTI.15 Those who had daily intercourse had a 9-fold increase in relative risk for UTI.15This elevated risk is due to trauma to the lower urogenital tract (urethra) and introduction of bacteria into the urethra via mechanical factors.16,17
Postmenopausal women
Atrophic vaginitis, catheterization, declining functional status, cystocele, incomplete emptying, incontinence, and history of premenopausal UTIs are all risk factors for recurrent UTI in postmenopausal women.19,20 Decreased estrogen and resulting vaginal atrophy appear to be associated with increased rates of UTI in these women. Additionally, postmenopausal women’s vaginas are more likely to be colonized with E coli and have fewer lactobacilli than those of premenopausal women, which is thought to predispose them to UTI.21 These risk factors are summarized in Table 1.10-21
INITIAL EVALUATION OF RECURRENT UTI
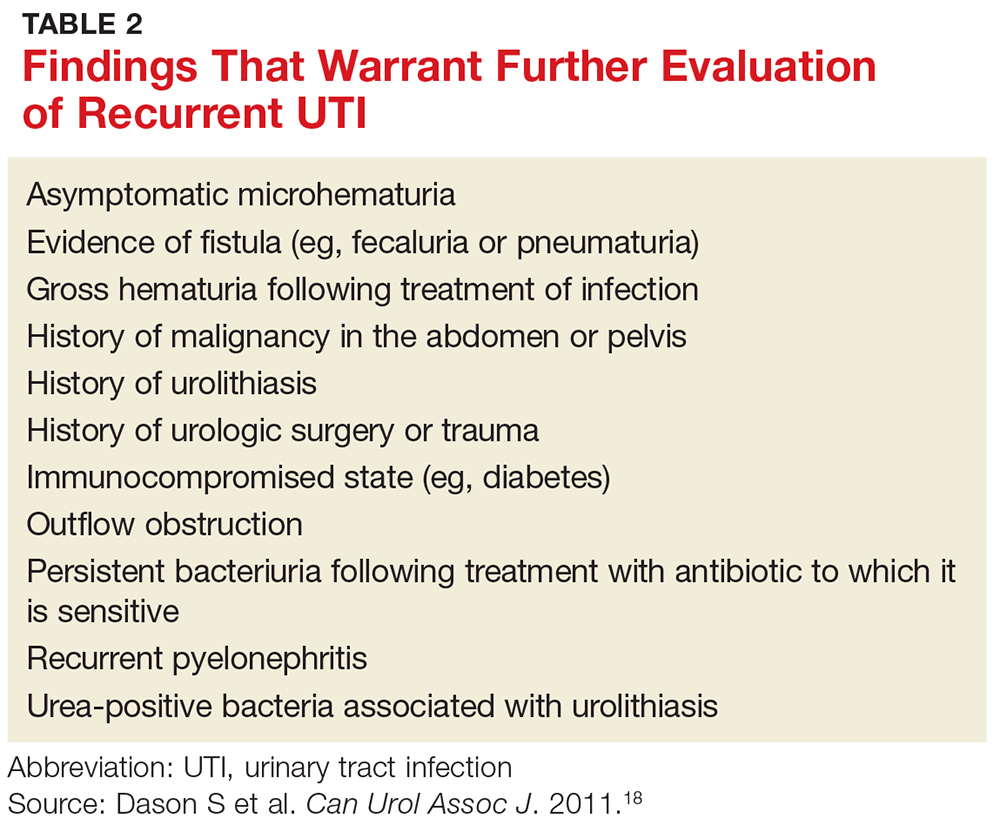
Patients with recurrent UTI experience signs and symptoms similar to those with isolated uncomplicated UTI: dysuria, frequency, urgency, and hematuria. Focus your history interview on potential causes of complicated UTI (see Table 2).18 Likewise, perform a pelvic exam to evaluate for predisposing anatomic abnormalities.22 Finally, obtain a urine culture with antibiotic sensitivities to ensure that previous treatment was appropriate and to rule out microbes associated with infected uroliths.18 Given the low probability of finding abnormalities on cystoscopy or imaging, neither one is routinely recommended for the evaluation of recurrent UTI.18
TREATMENT OPTIONS AND PRECAUTIONS
As with isolated UTI, E coli is the most common pathogen in recurrent UTI. However, recurrent UTI is more likely than isolated UTI to result from other pathogens (odds ratio [OR], 1.5), such as Klebsiella, Enterococcus, Proteus, and Citrobacter.23 Since a patient’s recurrent UTI most likely arises from the same pathogen that caused the prior infection, start an antibiotic you know is effective against it.8 Additionally, take into account local resistance rates; antibiotic availability, cost, and adverse effects; and a patient’s drug allergies.
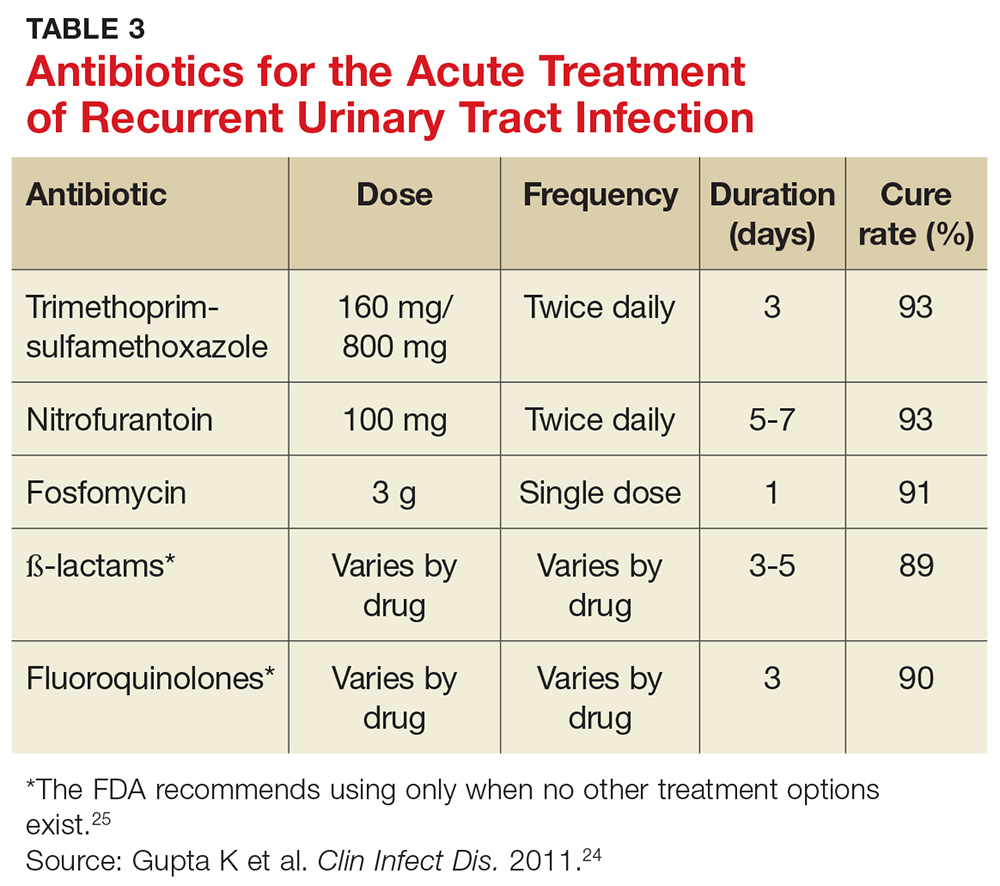
Preferred antibiotics. Trimethoprim-sulfamethoxazole (TMP-SMX; 160 mg/800 mg bid for 3 d) has long been the mainstay of treatment for uncomplicated UTI. In recent years, however, resistance to TMP-SMX has increased. While it is still appropriate for many situations as firstline treatment, it is not recommended for empiric treatment if local resistance rates are higher than 20%.24 Nitrofurantoin (100 mg bid for 5 d) has efficacy similar to that of TMP-SMX but without significant bacterial resistance. While fosfomycin (3 g as a single dose) is still recommended as firstline treatment, it is less effective than either TMP-SMX or nitrofurantoin. Table 3 summarizes these antibiotic choices and their efficacies.24
Agents to avoid or use only as a last resort. For patients who are unable to take any of the mentioned drugs, consider ß-lactam antibiotics—although they are typically less effective for this indication. While fluoroquinolones are very effective and have low (but rising) resistance rates, they are also associated with serious and potentially permanent adverse effects. As a result, on May 12, 2016, the FDA issued a Drug Safety Communication recommending that fluoroquinolones be used only in patients without other treatment options.24,25 Do not use ampicillin or amoxicillin, which lack effectiveness for this indication and are compromised by high levels of bacterial resistance.
Shorter course of treatment? When deciding on the length of treatment for recurrent UTI, remember that shorter antibiotic courses (3-5 d) are associated with similar rates of cure and progression to systemic infections as longer courses (7-10 d). Also, patients adhere better to the shorter treatment regimen and experience fewer adverse effects.26,27
Standing prescription? Studies have shown that women know when they have a UTI. Therefore, for those who experience recurrent UTI, consider giving them a standing prescription for antibiotics that they can initiate when symptoms arise (see Table 3).24 Patient-initiated treatment yields similar rates of efficacy as clinician-initiated treatment, while avoiding the adverse effects and costs associated with preventive strategies (see text).28
TIME FOR IMAGING AND REFERRAL?
For patients with a high risk for complicated UTI or a surgically amenable condition, either ultrasound or CT of the abdomen and pelvis with and without contrast is appropriate to evaluate for anatomic anomalies. While CT is the more sensitive imaging study to identify anomalies, ultrasound is less expensive and minimizes radiation exposure and is therefore also appropriate.18
Consider referring patients to a urologist if they have an underlying condition that may be amenable to surgery, such as bladder outlet obstruction, cystoceles, urinary tract diverticula, fistulae, pelvic floor dysfunction, ureteral stricture, urolithiasis, or vesicoureteral reflux.18 Additional risk factors for complicated UTI, which warrant referral as outlined by the Canadian Urologic Association, are summarized in Table 2.18
Two weeks later … and it’s back? Finally, for women who experience recurrent symptoms within two weeks of completing treatment, obtain a urine culture with antibiotic sensitivities to ensure that the infecting organism is not one typically associated with urolithiasis (Proteus and Yersinia) and that it is susceptible to planned antibiotic therapy.18Proteus and Yersinia are urease-positive bacteria that may cause stone formation in the urinary tract system. Evaluate any patient who has a UTI from either organism for urinary tract stones.
PREVENTION DOS AND DON’TS
Popular myth suggests that recurrent UTIs are more common in patients who do not void after intercourse or those who douche, consume caffeinated beverages, or wear noncotton underwear. Research, however, has failed to show a relationship between any of these factors and recurrent UTIs.13,18 Clinicians should therefore stop recommending that patients modify these behaviors to decrease recurrent infections.
Antibiotic prophylaxis decreases the rate of recurrent UTI by 95%.29 It has been recommended for women who have had two or more UTIs in the past six months or three or more UTIs in the past year. 29,30 Effective strategies to prevent recurrent UTI are low-dose continuous antibiotic prophylaxis or postcoital antibiotic prophylaxis.
While a test-of-cure culture is not typically recommended following treatment for uncomplicated UTI, you will want to obtain a confirmatory urine culture one to two weeks before starting low-dose antibiotic prophylaxis. Base your choice of antibiotic on known patient allergies and previous culture results. Agents typically used are trimethoprim, TMP-SMX, or nitrofurantoin (see Table 4), none of which demonstrated superiority in a Cochrane review.31-33 Although the same review showed no optimal duration of treatment, six to 24 months of treatment is usually recommended.29,33
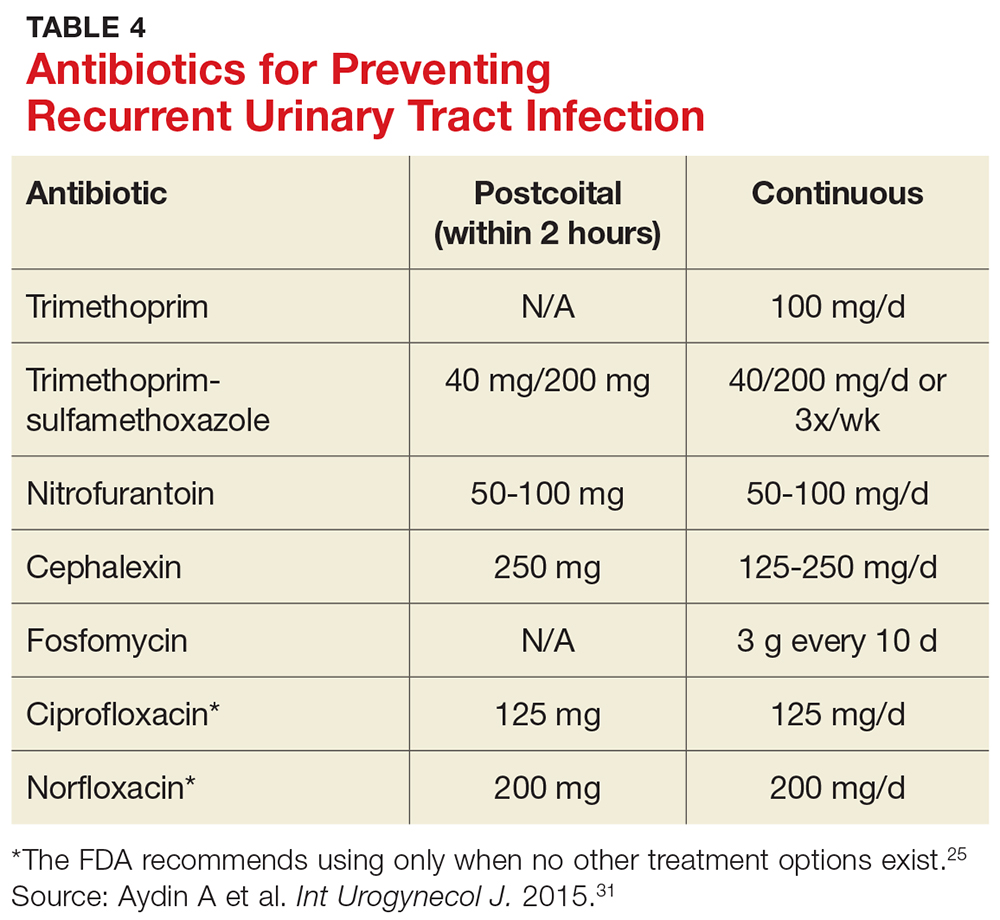
A single dose of antibiotic following intercourse may be as effective as daily low-dose prophylaxis for women whose UTIs are related to sexual activity.34 Studies have shown that single doses of TMP-SMX, nitrofurantoin, cephalexin, or a fluoroquinolone (see earlier notes about the FDA warning on fluoroquinolone use) are similarly effective in decreasing the rate of recurrence (see Table 4).31,35,36
Several nonpharmacologic strategies have been suggested for prevention of recurrent UTI. Among them are use of cranberry products, lactobacillus, vaginal estrogen in postmenopausal women, methenamine salts, and
A 2012 Cochrane review of 24 studies found that cranberry products were less effective in preventing recurrent UTIs than previously thought, with no statistically significant difference between women who took them and those who did not.37
Results have been mixed in using lactobacilli or probiotics to prevent recurrent UTIs. One study examining the use of lactobacilli to colonize the vaginal flora found a reduction in the number of recurrent infections in premenopausal women taking intravaginal lactobacillus over 12 months.38 A second study, involving postmenopausal women, found that those who were randomized to take lactobacillus tablets for 12 months had more frequent recurrences of UTIs than women randomized to take daily TMP-SMX.39 However, this last study was designed as a noninferiority trial, and its results do not negate the prior study’s findings. Additionally, vaginal estrogen, which is thought to work through colonization of the vagina with lactobacilli, has prevented recurrent UTIs in postmenopausal women.40
Ascorbic acid (which is bacteriostatic), methenamine salts (which are hydrolyzed to bactericidal ammonia and formaldehyde), and
As noted, the only behavioral modifications that have been shown to decrease the risk for recurrent UTI are discontinuing the use of spermicides/spermicide-coated condoms or oral contraceptives, and decreasing the frequency of intercourse.13
Joan is started on a three-day course of TMP-SMX. Further questioning reveals that each of her three UTIs followed sexual intercourse. Her clinician discusses the options of self-directed therapy using continuous prophylaxis or postcoital prophylaxis, either of which would be an appropriate evidence-based intervention for her. After engaging in shared decision-making, she is prescribed TMP-SMX to be taken as a single dose following intercourse in the future.
1. Nicolle LE. Epidemiology of urinary tract infections. Infect Med. 2001;18:153-162.
2. CDC. Annual number and percent distribution of ambulatory care visits by setting type according to diagnosis group: United States, 2009-2010. www.cdc.gov/nchs/data/ahcd/combined_tables/2009-2010_combined_web_table01.pdf. Accessed June 8, 2017.
3. Griebling TL. Urologic Diseases in America project: trends in resource use for urinary tract infections in women. J Urol. 2005;173:1281-1287.
4. Ikaheimo R, Siitonen A, Heiskanen T, et al. Recurrence of urinary tract infection in a primary care setting: analysis of a 1-year follow-up of 179 women. Clin Infect Dis. 1996;222:91-99.
5. Sammon JD, Sharma P, Rahbar H, et al. Predictors of admission in patients presenting to the emergency department with urinary tract infection. World J Urol. 2014;32:813-819.
6. Nicolle LE, Bradley S, Colgan R, et al. Infectious Diseases Society of America guidelines for the diagnosis and treatment of asymptomatic bacteriuria in adults. Clin Infect Dis. 2005;40:643-654.
7. Barber AE, Norton JP, Spivak AM, et al. Urinary tract infections: current and emerging management strategies. Clin Infect Dis. 2013;57:719-724.
8. Hooton TM. Clinical practice. Uncomplicated urinary tract infection. N Engl J Med. 2012;366:1028-1037.
9. American College of Obstetricians and Gynecologists. ACOG Practice Bulletin No. 91: treatment of urinary tract infections in nonpregnant women. Obstet Gynecol. 2008;111:785-794.
10. Sheinfeld J, Schaeffer AJ, Cordon-Cardo C, et al. Association of the Lewis blood group phenotype with recurrent urinary tract infections in women. N Engl J Med. 1989;320:773-777.
11. Foxman B, Gillespie B, Koopman J, et al. Risk factors for second urinary tract infection among college women. Am J Epidemiol. 2000;151:1194-1205.
12. Twaij M. Urinary tract infection in children: a review of its pathogenesis and risk factors. J R Soc Health. 2000;120:220-226.
13. Scholes D, Hooton TM, Roberts DL, et al. Risk factors for recurrent urinary tract infection in young women. J Infect Dis. 2000;182:1177-1182.
14. Hooton TM, Fennell CL, Clark AM, et al. Nonoxynol-9: differential antibacterial activity and enhancement of bacterial adherence to vaginal epithelial cells. J Infect Dis. 1991; 164: 1216-1219.
15. Hooton TM, Scholes D, Hughes JP, et al. A prospective study of risk factors for symptomatic urinary tract infection in young women. N Engl J Med. 1996;335:468-474.
16. Hooton TM, Hillier S, Johnson C, et al. Escherichia coli bacteriuria and contraceptive method. JAMA. 1991;265:64-69.
17. Foxman B, Marsh J, Gillespie B, et al. Condom use and first-time urinary tract infection. Epidemiology. 1997;8:637-641.
18. Dason S, Dason JT, Kapoor A. Guidelines for the diagnosis and management of recurrent urinary tract infection in women. Can Urol Assoc J. 2011;5:316-322.
19. Hooton TM. Pathogenesis of urinary tract infections: an update. J Antimicrob Chemother. 2000;46(suppl 1):1-7.
20. Raz R, Gennesin Y, Wasser J, et al. Recurrent urinary tract infections in postmenopausal women. Clin Infect Dis. 2000; 30:152-156.
21. Gupta K, Stapleton AE, Hooton TM, et al. Inverse association of H2O2-producing lactobacilli and vaginal Escherichia coli in women with recurrent urinary tract infections. J Infect Dis. 1998;178:446-450.
22. Neal DE. Complicated urinary tract infections. Urol Clin North Am. 2008;35:13-22.
23. Amna MA, Chazan B, Raz R, et al. Risk factors for non-Escherichia coli community-acquired bacteriuria. Infection. 2013;41:473-477.
24. Gupta K, Hooton TM, Naber KG, et al. International clinical practice guidelines for the treatment of acute uncomplicated cystitis and pyelonephritis in women: a 2010 update by the Infectious Diseases Society of America and the European Society for Microbiology and Infectious Diseases. Clin Infect Dis. 2011;52:e103-e120.
25. FDA. FDA drug safety communication. www.fda.gov/downloads/Drugs/DrugSafety/UCM500591.pdf. Accessed June 8, 2017.
26. Katchman EA, Milo G, Paul M, et al. Three-day vs longer duration of antibiotic treatment for cystitis in women: systematic review and meta-analysis. Am J Med. 2005;118:1196-1207.
27. Milo G, Katchman EA, Paul M, et al. Duration of antibacterial treatment for uncomplicated urinary tract infection in women. Cochrane Database Syst Rev. 2005;(2):CD004682.
28. Gupta K, Hooton TM, Roberts PL, et al. Patient-initiated treatment of uncomplicated recurrent urinary tract infections in young women. Ann Intern Med. 2001;135:9-16.
29. Nicolle LE, Ronald AR. Recurrent urinary tract infection in adult women: diagnosis and treatment. Infect Dis Clin North Am. 1987;1:793-806.
30. Ronald AR, Conway B. An approach to urinary tract infections in ambulatory women. Curr Clin Top Infect Dis. 1988; 9:76-125.
31. Aydin A, Ahmed K, Zaman I, et al. Recurrent urinary tract infections in women. Int Urogynecol J. 2015;26:795-804.
32. McLaughlin SP, Carson CC. Urinary tract infections in women. Med Clin North Am. 2004;88:417-429.
33. Albert X, Huertas I, Pereiro II, et al. Antibiotics for preventing recurrent urinary tract infection in non-pregnant women. Cochrane Database Syst Rev. 2004;(3):CD001209.
34. Melekos MD, Asbach HW, Gerharz E, et al. Post-intercourse versus daily ciprofloxacin prophylaxis for recurrent urinary tract infections in premenopausal women. J Urol. 1997;157: 935-939.
35. Chew LD, Fihn SD. Recurrent cystitis in nonpregnant women. West J Med. 1999;170:274-277.
36. Stapleton A, Latham RH, Johnson C, et al. Postcoital antimicrobial prophylaxis for recurrent urinary tract infection: A randomized, double-blind, placebo-controlled trial. JAMA. 1990;264:703-706.
37. Jepson RG, Williams G, Craig JC. Cranberries for preventing urinary tract infections. Cochrane Database Syst Rev. 2012; (10):CD001321.
38. Stapleton AE, Au-Yeung M, Hooton TM, et al. Randomized, placebo-controlled phase 2 trial of a Lactobacillus crispatus probiotic given intravaginally for prevention of recurrent urinary tract infection. Clin Infect Dis. 2011;52:1212-1217.
39. Beerepoot MA, ter Riet G, Nys S, et al. Lactobacilli vs antibiotics to prevent urinary tract infections: a randomized, double-blind, noninferiority trial in postmenopausal women. Arch Intern Med. 2012;172:704-712.
40. Perrotta C, Aznar M, Mejia R, et al. Oestrogens for preventing recurrent urinary tract infection in postmenopausal women. Cochrane Database Syst Rev. 2008;(2):CD005131.
41. Foxman B, Chi JW. Health behavior and urinary tract infection in college-aged women. J Clin Epidemiol. 1990;43:329-337.
42. Lee BB, Simpson JM, Craig JC, et al. Methenamine hippurate for preventing urinary tract infections. Cochrane Database Syst Rev. 2007;(4):CD003265.
43. Krancˇec B, Papeš D, Altarac S. D-mannose powder for prophylaxis of recurrent urinary tract infections in women: a randomized clinical trial. World J Urol. 2014;32:79-84.
For the third time in nine months, Joan, 28, presents with complaints of painful, frequent, and urgent urination. Joan is sexually active; her medical history is otherwise unremarkable. In each of the previous two episodes, her urine culture grew Escherichia coli, and she was treated with a five-day course of nitrofurantoin. Now, she asks about the need for additional workup and treatment, as well as whether there is a way to prevent further infections.
Urinary tract infections (UTIs) are the most common bacterial infection in women and account for an estimated 5.4 million primary care office visits and 2.3 million emergency department visits annually.1,2 For women, the lifetime risk for a UTI is greater than 50%.3 In one study of UTI in a primary care setting, 36% of women younger than 55 and 53% of women older than 55 had a recurrent infection within a year.4 Most women with UTI are treated as outpatients, but 16.7% require hospitalization.5 In the United States, direct costs for evaluation and treatment of UTI total $1.6 billion each year.5
Accurately characterizing recurrent UTI
Bacteriuria is defined as the presence of 100,000 colony-forming units (ie, viable bacteria) per milliliter of urine collected midstream on two consecutive urinations.6 UTIs are symptomatic infections of the urinary tract and may involve the urethra, bladder, ureters, or kidneys.7 Infections of the lower tract (bladder and urethra) are commonly referred to as cystitis; infections of the upper tract (kidney and ureters) are referred to as pyelonephritis.
Most UTIs are uncomplicated and do not progress to more serious infections. However, patients who are pregnant or who have chronic medical conditions (eg, renal insufficiency or use of immunosuppressant medications), urinary obstruction, or calculi may develop complicated UTIs.8
Recurrent UTI is an infection that follows resolution of bacteriuria and symptoms of a prior UTI; the term applies when such an infection occurs within six months of the previous UTI or when three or more UTIs occur within a year.7 Recurrent infection can be further characterized as relapse or reinfection. Relapse occurs when the patient has a second UTI caused by the same pathogen within two weeks of the original treatment.9 Reinfection is a UTI that occurs more than two weeks after completion of treatment for the original UTI. The pathogen in a reinfection may be the same one that caused the original UTI or it may be a different agent.9
It’s also important to differentiate between recurrent and resistant UTI. In resistant UTI, bacteriuria fails to resolve following seven to 14 days of appropriate antibiotic treatment.9
FACTORS THAT INCREASE RISK FOR RECURRENT UTI
Premenopausal women
Both modifiable and nonmodifiable factors (see Table 1) have been associated with increased risk for recurrent UTI in premenopausal women.10-21 Among those with specific blood group phenotypes (Lewis non-secretor, in particular), rates of UTI rise secondary to increased adherence of bacteria to epithelial cells in the urinary tract.10 Other nonmodifiable risk factors include congenital urinary tract anomalies, obstruction of the urinary tract, and a history of UTI.11,12 Women whose mothers had UTIs are at higher risk for recurrent UTI than are those whose mothers had no such history.13
Modifiable risk factors for recurrent UTI include contraceptive use (spermicides, spermicide-coated condoms, and oral contraceptives) and frequency of intercourse (≥ 4 times/month).13 Spermicides alter the normal vaginal flora and lead to increased colonization of E coli, which increases the risk for UTI.14 Women with recurrent UTIs were 1.27 to 1.45 times more likely to use oral contraceptives than those without recurrent UTIs.13 Compared with college women who had not had intercourse, sexually active college women who had engaged in intercourse three times in a week had a 2.6-fold increase in relative risk for UTI.15 Those who had daily intercourse had a 9-fold increase in relative risk for UTI.15This elevated risk is due to trauma to the lower urogenital tract (urethra) and introduction of bacteria into the urethra via mechanical factors.16,17
Postmenopausal women
Atrophic vaginitis, catheterization, declining functional status, cystocele, incomplete emptying, incontinence, and history of premenopausal UTIs are all risk factors for recurrent UTI in postmenopausal women.19,20 Decreased estrogen and resulting vaginal atrophy appear to be associated with increased rates of UTI in these women. Additionally, postmenopausal women’s vaginas are more likely to be colonized with E coli and have fewer lactobacilli than those of premenopausal women, which is thought to predispose them to UTI.21 These risk factors are summarized in Table 1.10-21
INITIAL EVALUATION OF RECURRENT UTI
Patients with recurrent UTI experience signs and symptoms similar to those with isolated uncomplicated UTI: dysuria, frequency, urgency, and hematuria. Focus your history interview on potential causes of complicated UTI (see Table 2).18 Likewise, perform a pelvic exam to evaluate for predisposing anatomic abnormalities.22 Finally, obtain a urine culture with antibiotic sensitivities to ensure that previous treatment was appropriate and to rule out microbes associated with infected uroliths.18 Given the low probability of finding abnormalities on cystoscopy or imaging, neither one is routinely recommended for the evaluation of recurrent UTI.18
TREATMENT OPTIONS AND PRECAUTIONS
As with isolated UTI, E coli is the most common pathogen in recurrent UTI. However, recurrent UTI is more likely than isolated UTI to result from other pathogens (odds ratio [OR], 1.5), such as Klebsiella, Enterococcus, Proteus, and Citrobacter.23 Since a patient’s recurrent UTI most likely arises from the same pathogen that caused the prior infection, start an antibiotic you know is effective against it.8 Additionally, take into account local resistance rates; antibiotic availability, cost, and adverse effects; and a patient’s drug allergies.
Preferred antibiotics. Trimethoprim-sulfamethoxazole (TMP-SMX; 160 mg/800 mg bid for 3 d) has long been the mainstay of treatment for uncomplicated UTI. In recent years, however, resistance to TMP-SMX has increased. While it is still appropriate for many situations as firstline treatment, it is not recommended for empiric treatment if local resistance rates are higher than 20%.24 Nitrofurantoin (100 mg bid for 5 d) has efficacy similar to that of TMP-SMX but without significant bacterial resistance. While fosfomycin (3 g as a single dose) is still recommended as firstline treatment, it is less effective than either TMP-SMX or nitrofurantoin. Table 3 summarizes these antibiotic choices and their efficacies.24
Agents to avoid or use only as a last resort. For patients who are unable to take any of the mentioned drugs, consider ß-lactam antibiotics—although they are typically less effective for this indication. While fluoroquinolones are very effective and have low (but rising) resistance rates, they are also associated with serious and potentially permanent adverse effects. As a result, on May 12, 2016, the FDA issued a Drug Safety Communication recommending that fluoroquinolones be used only in patients without other treatment options.24,25 Do not use ampicillin or amoxicillin, which lack effectiveness for this indication and are compromised by high levels of bacterial resistance.
Shorter course of treatment? When deciding on the length of treatment for recurrent UTI, remember that shorter antibiotic courses (3-5 d) are associated with similar rates of cure and progression to systemic infections as longer courses (7-10 d). Also, patients adhere better to the shorter treatment regimen and experience fewer adverse effects.26,27
Standing prescription? Studies have shown that women know when they have a UTI. Therefore, for those who experience recurrent UTI, consider giving them a standing prescription for antibiotics that they can initiate when symptoms arise (see Table 3).24 Patient-initiated treatment yields similar rates of efficacy as clinician-initiated treatment, while avoiding the adverse effects and costs associated with preventive strategies (see text).28
TIME FOR IMAGING AND REFERRAL?
For patients with a high risk for complicated UTI or a surgically amenable condition, either ultrasound or CT of the abdomen and pelvis with and without contrast is appropriate to evaluate for anatomic anomalies. While CT is the more sensitive imaging study to identify anomalies, ultrasound is less expensive and minimizes radiation exposure and is therefore also appropriate.18
Consider referring patients to a urologist if they have an underlying condition that may be amenable to surgery, such as bladder outlet obstruction, cystoceles, urinary tract diverticula, fistulae, pelvic floor dysfunction, ureteral stricture, urolithiasis, or vesicoureteral reflux.18 Additional risk factors for complicated UTI, which warrant referral as outlined by the Canadian Urologic Association, are summarized in Table 2.18
Two weeks later … and it’s back? Finally, for women who experience recurrent symptoms within two weeks of completing treatment, obtain a urine culture with antibiotic sensitivities to ensure that the infecting organism is not one typically associated with urolithiasis (Proteus and Yersinia) and that it is susceptible to planned antibiotic therapy.18Proteus and Yersinia are urease-positive bacteria that may cause stone formation in the urinary tract system. Evaluate any patient who has a UTI from either organism for urinary tract stones.
PREVENTION DOS AND DON’TS
Popular myth suggests that recurrent UTIs are more common in patients who do not void after intercourse or those who douche, consume caffeinated beverages, or wear noncotton underwear. Research, however, has failed to show a relationship between any of these factors and recurrent UTIs.13,18 Clinicians should therefore stop recommending that patients modify these behaviors to decrease recurrent infections.
Antibiotic prophylaxis decreases the rate of recurrent UTI by 95%.29 It has been recommended for women who have had two or more UTIs in the past six months or three or more UTIs in the past year. 29,30 Effective strategies to prevent recurrent UTI are low-dose continuous antibiotic prophylaxis or postcoital antibiotic prophylaxis.
While a test-of-cure culture is not typically recommended following treatment for uncomplicated UTI, you will want to obtain a confirmatory urine culture one to two weeks before starting low-dose antibiotic prophylaxis. Base your choice of antibiotic on known patient allergies and previous culture results. Agents typically used are trimethoprim, TMP-SMX, or nitrofurantoin (see Table 4), none of which demonstrated superiority in a Cochrane review.31-33 Although the same review showed no optimal duration of treatment, six to 24 months of treatment is usually recommended.29,33
A single dose of antibiotic following intercourse may be as effective as daily low-dose prophylaxis for women whose UTIs are related to sexual activity.34 Studies have shown that single doses of TMP-SMX, nitrofurantoin, cephalexin, or a fluoroquinolone (see earlier notes about the FDA warning on fluoroquinolone use) are similarly effective in decreasing the rate of recurrence (see Table 4).31,35,36
Several nonpharmacologic strategies have been suggested for prevention of recurrent UTI. Among them are use of cranberry products, lactobacillus, vaginal estrogen in postmenopausal women, methenamine salts, and
A 2012 Cochrane review of 24 studies found that cranberry products were less effective in preventing recurrent UTIs than previously thought, with no statistically significant difference between women who took them and those who did not.37
Results have been mixed in using lactobacilli or probiotics to prevent recurrent UTIs. One study examining the use of lactobacilli to colonize the vaginal flora found a reduction in the number of recurrent infections in premenopausal women taking intravaginal lactobacillus over 12 months.38 A second study, involving postmenopausal women, found that those who were randomized to take lactobacillus tablets for 12 months had more frequent recurrences of UTIs than women randomized to take daily TMP-SMX.39 However, this last study was designed as a noninferiority trial, and its results do not negate the prior study’s findings. Additionally, vaginal estrogen, which is thought to work through colonization of the vagina with lactobacilli, has prevented recurrent UTIs in postmenopausal women.40
Ascorbic acid (which is bacteriostatic), methenamine salts (which are hydrolyzed to bactericidal ammonia and formaldehyde), and
As noted, the only behavioral modifications that have been shown to decrease the risk for recurrent UTI are discontinuing the use of spermicides/spermicide-coated condoms or oral contraceptives, and decreasing the frequency of intercourse.13
Joan is started on a three-day course of TMP-SMX. Further questioning reveals that each of her three UTIs followed sexual intercourse. Her clinician discusses the options of self-directed therapy using continuous prophylaxis or postcoital prophylaxis, either of which would be an appropriate evidence-based intervention for her. After engaging in shared decision-making, she is prescribed TMP-SMX to be taken as a single dose following intercourse in the future.
1. Nicolle LE. Epidemiology of urinary tract infections. Infect Med. 2001;18:153-162.
2. CDC. Annual number and percent distribution of ambulatory care visits by setting type according to diagnosis group: United States, 2009-2010. www.cdc.gov/nchs/data/ahcd/combined_tables/2009-2010_combined_web_table01.pdf. Accessed June 8, 2017.
3. Griebling TL. Urologic Diseases in America project: trends in resource use for urinary tract infections in women. J Urol. 2005;173:1281-1287.
4. Ikaheimo R, Siitonen A, Heiskanen T, et al. Recurrence of urinary tract infection in a primary care setting: analysis of a 1-year follow-up of 179 women. Clin Infect Dis. 1996;222:91-99.
5. Sammon JD, Sharma P, Rahbar H, et al. Predictors of admission in patients presenting to the emergency department with urinary tract infection. World J Urol. 2014;32:813-819.
6. Nicolle LE, Bradley S, Colgan R, et al. Infectious Diseases Society of America guidelines for the diagnosis and treatment of asymptomatic bacteriuria in adults. Clin Infect Dis. 2005;40:643-654.
7. Barber AE, Norton JP, Spivak AM, et al. Urinary tract infections: current and emerging management strategies. Clin Infect Dis. 2013;57:719-724.
8. Hooton TM. Clinical practice. Uncomplicated urinary tract infection. N Engl J Med. 2012;366:1028-1037.
9. American College of Obstetricians and Gynecologists. ACOG Practice Bulletin No. 91: treatment of urinary tract infections in nonpregnant women. Obstet Gynecol. 2008;111:785-794.
10. Sheinfeld J, Schaeffer AJ, Cordon-Cardo C, et al. Association of the Lewis blood group phenotype with recurrent urinary tract infections in women. N Engl J Med. 1989;320:773-777.
11. Foxman B, Gillespie B, Koopman J, et al. Risk factors for second urinary tract infection among college women. Am J Epidemiol. 2000;151:1194-1205.
12. Twaij M. Urinary tract infection in children: a review of its pathogenesis and risk factors. J R Soc Health. 2000;120:220-226.
13. Scholes D, Hooton TM, Roberts DL, et al. Risk factors for recurrent urinary tract infection in young women. J Infect Dis. 2000;182:1177-1182.
14. Hooton TM, Fennell CL, Clark AM, et al. Nonoxynol-9: differential antibacterial activity and enhancement of bacterial adherence to vaginal epithelial cells. J Infect Dis. 1991; 164: 1216-1219.
15. Hooton TM, Scholes D, Hughes JP, et al. A prospective study of risk factors for symptomatic urinary tract infection in young women. N Engl J Med. 1996;335:468-474.
16. Hooton TM, Hillier S, Johnson C, et al. Escherichia coli bacteriuria and contraceptive method. JAMA. 1991;265:64-69.
17. Foxman B, Marsh J, Gillespie B, et al. Condom use and first-time urinary tract infection. Epidemiology. 1997;8:637-641.
18. Dason S, Dason JT, Kapoor A. Guidelines for the diagnosis and management of recurrent urinary tract infection in women. Can Urol Assoc J. 2011;5:316-322.
19. Hooton TM. Pathogenesis of urinary tract infections: an update. J Antimicrob Chemother. 2000;46(suppl 1):1-7.
20. Raz R, Gennesin Y, Wasser J, et al. Recurrent urinary tract infections in postmenopausal women. Clin Infect Dis. 2000; 30:152-156.
21. Gupta K, Stapleton AE, Hooton TM, et al. Inverse association of H2O2-producing lactobacilli and vaginal Escherichia coli in women with recurrent urinary tract infections. J Infect Dis. 1998;178:446-450.
22. Neal DE. Complicated urinary tract infections. Urol Clin North Am. 2008;35:13-22.
23. Amna MA, Chazan B, Raz R, et al. Risk factors for non-Escherichia coli community-acquired bacteriuria. Infection. 2013;41:473-477.
24. Gupta K, Hooton TM, Naber KG, et al. International clinical practice guidelines for the treatment of acute uncomplicated cystitis and pyelonephritis in women: a 2010 update by the Infectious Diseases Society of America and the European Society for Microbiology and Infectious Diseases. Clin Infect Dis. 2011;52:e103-e120.
25. FDA. FDA drug safety communication. www.fda.gov/downloads/Drugs/DrugSafety/UCM500591.pdf. Accessed June 8, 2017.
26. Katchman EA, Milo G, Paul M, et al. Three-day vs longer duration of antibiotic treatment for cystitis in women: systematic review and meta-analysis. Am J Med. 2005;118:1196-1207.
27. Milo G, Katchman EA, Paul M, et al. Duration of antibacterial treatment for uncomplicated urinary tract infection in women. Cochrane Database Syst Rev. 2005;(2):CD004682.
28. Gupta K, Hooton TM, Roberts PL, et al. Patient-initiated treatment of uncomplicated recurrent urinary tract infections in young women. Ann Intern Med. 2001;135:9-16.
29. Nicolle LE, Ronald AR. Recurrent urinary tract infection in adult women: diagnosis and treatment. Infect Dis Clin North Am. 1987;1:793-806.
30. Ronald AR, Conway B. An approach to urinary tract infections in ambulatory women. Curr Clin Top Infect Dis. 1988; 9:76-125.
31. Aydin A, Ahmed K, Zaman I, et al. Recurrent urinary tract infections in women. Int Urogynecol J. 2015;26:795-804.
32. McLaughlin SP, Carson CC. Urinary tract infections in women. Med Clin North Am. 2004;88:417-429.
33. Albert X, Huertas I, Pereiro II, et al. Antibiotics for preventing recurrent urinary tract infection in non-pregnant women. Cochrane Database Syst Rev. 2004;(3):CD001209.
34. Melekos MD, Asbach HW, Gerharz E, et al. Post-intercourse versus daily ciprofloxacin prophylaxis for recurrent urinary tract infections in premenopausal women. J Urol. 1997;157: 935-939.
35. Chew LD, Fihn SD. Recurrent cystitis in nonpregnant women. West J Med. 1999;170:274-277.
36. Stapleton A, Latham RH, Johnson C, et al. Postcoital antimicrobial prophylaxis for recurrent urinary tract infection: A randomized, double-blind, placebo-controlled trial. JAMA. 1990;264:703-706.
37. Jepson RG, Williams G, Craig JC. Cranberries for preventing urinary tract infections. Cochrane Database Syst Rev. 2012; (10):CD001321.
38. Stapleton AE, Au-Yeung M, Hooton TM, et al. Randomized, placebo-controlled phase 2 trial of a Lactobacillus crispatus probiotic given intravaginally for prevention of recurrent urinary tract infection. Clin Infect Dis. 2011;52:1212-1217.
39. Beerepoot MA, ter Riet G, Nys S, et al. Lactobacilli vs antibiotics to prevent urinary tract infections: a randomized, double-blind, noninferiority trial in postmenopausal women. Arch Intern Med. 2012;172:704-712.
40. Perrotta C, Aznar M, Mejia R, et al. Oestrogens for preventing recurrent urinary tract infection in postmenopausal women. Cochrane Database Syst Rev. 2008;(2):CD005131.
41. Foxman B, Chi JW. Health behavior and urinary tract infection in college-aged women. J Clin Epidemiol. 1990;43:329-337.
42. Lee BB, Simpson JM, Craig JC, et al. Methenamine hippurate for preventing urinary tract infections. Cochrane Database Syst Rev. 2007;(4):CD003265.
43. Krancˇec B, Papeš D, Altarac S. D-mannose powder for prophylaxis of recurrent urinary tract infections in women: a randomized clinical trial. World J Urol. 2014;32:79-84.
E-cigarettes: A health threat or cessation tool?
DENVER –
“So far, the evidence regarding e-cigarettes’ effectiveness for smoking cessation is equivocal at best,” Alison Breland, PhD, said at the annual meeting of the Teratology Society.
But Dr. Breland noted that there is significant controversy around this topic. “I can tell you that, at the conferences I go to, where there are lots of people studying nicotine and tobacco, scientists are fighting with each other over this question,” said Dr. Breland, a psychologist and project director at the Center for the Study of Tobacco Products at Virginia Commonwealth University in Richmond.
That being said, she noted that this meta-analysis has generated unusually harsh printed comments from its critics.
“We could argue about the methodology of the studies all day. If you think all the studies are garbage then you won’t believe the odds ratio, either. But I think right now the evidence shows that e-cigarettes don’t seem to help people quit,” she said. “That may change in the future with testing of different kinds of devices.”
To be useful for smoking cessation, she explained, a device would need to consistently deliver enough nicotine to enable the smoker to fend off withdrawal symptoms but not so much that the wish to quit evaporates. It’s a matter of finding the sweet spot in what is technically termed device nicotine flux.
There is a great deal of misconception about e-cigarettes, Dr. Breland said, some of it promoted through misleading product advertising. She sought to set the record straight.
How e-cigarettes work
What are e-cigarettes? They are basically nicotine delivery devices. They use electricity to power a heating element that aerosolizes a liquid containing varying concentrations of nicotine; solvents, such as propylene glycol and vegetable glycerins; and flavorants. As a class, e-cigarettes are rapidly evolving. A vast array of devices are marketed with wide differences in design, materials, construction, amount of nicotine delivered, and electrical power – which, along with puff duration, is a key factor in how much nicotine gets into a user’s blood.
“Most of the devices have a battery, but it’s important to know that some of them can be plugged directly into a USB port on a computer,” Dr. Breland said.
E-cigarettes don’t generate a vapor, as is widely believed. It’s an aerosol, and it contains toxic byproducts. On the plus side, unlike combustible cigarettes, e-cigarettes don’t deliver carbon monoxide.
A vast array of flavorant mixtures are sold, including some that are clearly designed to be attractive to children, with names like “blue cotton candy” and “Apple Jacks.”
User demographics
Who is using e-cigarettes? Primarily adolescents and young adults in prime reproductive age. National surveys indicate e-cigarettes are now the most widely used tobacco product among U.S. high school students, well ahead of combustible cigarettes.
Of particular concern, data from the Centers for Disease Control and Prevention’s National Health Interview Survey indicate that, among 18- to 24-year-olds who use e-cigarettes, about 40% also currently use conventional cigarettes, about 20% are former cigarette smokers, and about 40% are never smokers – that is, have never smoked combustible cigarettes (MMWR Morb Mortal Wkly Rep. 2016;65:1177. doi: 10.15585/mmwr.mm6542a7).
“We don’t know what’s going to happen to these never smokers who are currently using e-cigarettes. Are they starting on a lifetime of nicotine dependence via e-cigarettes, or perhaps even worse, are they going to transition to combustible cigarettes? There’s more and more evidence showing that’s happening,” Dr. Breland said.
The CDC survey also showed that 59% of adult users of e-cigarettes are what Dr. Breland called “dualies,” individuals who also smoke conventional cigarettes.
“That really diminishes any potential benefit of e-cigarettes,” she said.
Impact on pregnancy
What is known about the impact of e-cigarettes on pregnancy and birth outcomes? Almost nothing at this point. E-cigarettes deliver nicotine to the bloodstream, and nicotine is known to cause unwelcome, long-term changes in fetal brain development and in that of adolescents as well. The other aerosolized toxicants have not been well studied. A few small surveys conducted in obstetric practices indicate some pregnant women perceive e-cigarettes as posing only minor health risks and safer than combustible cigarettes. And some pregnant women are using e-cigarettes.

“I think it’s notable that we’re not finding exclusive e-cigarette users. It’s early in the study, but so far the dual users are smoking the same number of cigarettes per day as cigarette-only users, and they have the same expired carbon monoxide levels. It makes me feel concerned in particular about dual use in pregnancy,” she said.
Regulation
One audience member asked what the point of allowing e-cigarettes is since, under a best-case scenario, their effectiveness as a smoking cessation tool is similar to a nicotine patch, and smokers already have access to the patch as well as nicotine gum.
Dr. Breland replied that the patch and gum deliver nicotine very slowly, so they are not as satisfying as smoking.
“The hope with e-cigarettes is that, since they get nicotine into your blood pretty fast – similar to a cigarette – they can more effectively suppress your withdrawal,” she said. “Whether or not that’s true isn’t known yet.”
The Food and Drug Administration has the authority to regulate e-cigarettes through several different mechanisms but, in late July 2017, announced a delay in issuing new regulations that would likely have removed many of the devices and flavorings from the marketplace.
Dr. Breland’s research is supported by the National Institute on Drug Abuse and the Food and Drug Administration. She reported having no financial conflicts of interest.
DENVER –
“So far, the evidence regarding e-cigarettes’ effectiveness for smoking cessation is equivocal at best,” Alison Breland, PhD, said at the annual meeting of the Teratology Society.
But Dr. Breland noted that there is significant controversy around this topic. “I can tell you that, at the conferences I go to, where there are lots of people studying nicotine and tobacco, scientists are fighting with each other over this question,” said Dr. Breland, a psychologist and project director at the Center for the Study of Tobacco Products at Virginia Commonwealth University in Richmond.
That being said, she noted that this meta-analysis has generated unusually harsh printed comments from its critics.
“We could argue about the methodology of the studies all day. If you think all the studies are garbage then you won’t believe the odds ratio, either. But I think right now the evidence shows that e-cigarettes don’t seem to help people quit,” she said. “That may change in the future with testing of different kinds of devices.”
To be useful for smoking cessation, she explained, a device would need to consistently deliver enough nicotine to enable the smoker to fend off withdrawal symptoms but not so much that the wish to quit evaporates. It’s a matter of finding the sweet spot in what is technically termed device nicotine flux.
There is a great deal of misconception about e-cigarettes, Dr. Breland said, some of it promoted through misleading product advertising. She sought to set the record straight.
How e-cigarettes work
What are e-cigarettes? They are basically nicotine delivery devices. They use electricity to power a heating element that aerosolizes a liquid containing varying concentrations of nicotine; solvents, such as propylene glycol and vegetable glycerins; and flavorants. As a class, e-cigarettes are rapidly evolving. A vast array of devices are marketed with wide differences in design, materials, construction, amount of nicotine delivered, and electrical power – which, along with puff duration, is a key factor in how much nicotine gets into a user’s blood.
“Most of the devices have a battery, but it’s important to know that some of them can be plugged directly into a USB port on a computer,” Dr. Breland said.
E-cigarettes don’t generate a vapor, as is widely believed. It’s an aerosol, and it contains toxic byproducts. On the plus side, unlike combustible cigarettes, e-cigarettes don’t deliver carbon monoxide.
A vast array of flavorant mixtures are sold, including some that are clearly designed to be attractive to children, with names like “blue cotton candy” and “Apple Jacks.”
User demographics
Who is using e-cigarettes? Primarily adolescents and young adults in prime reproductive age. National surveys indicate e-cigarettes are now the most widely used tobacco product among U.S. high school students, well ahead of combustible cigarettes.
Of particular concern, data from the Centers for Disease Control and Prevention’s National Health Interview Survey indicate that, among 18- to 24-year-olds who use e-cigarettes, about 40% also currently use conventional cigarettes, about 20% are former cigarette smokers, and about 40% are never smokers – that is, have never smoked combustible cigarettes (MMWR Morb Mortal Wkly Rep. 2016;65:1177. doi: 10.15585/mmwr.mm6542a7).
“We don’t know what’s going to happen to these never smokers who are currently using e-cigarettes. Are they starting on a lifetime of nicotine dependence via e-cigarettes, or perhaps even worse, are they going to transition to combustible cigarettes? There’s more and more evidence showing that’s happening,” Dr. Breland said.
The CDC survey also showed that 59% of adult users of e-cigarettes are what Dr. Breland called “dualies,” individuals who also smoke conventional cigarettes.
“That really diminishes any potential benefit of e-cigarettes,” she said.
Impact on pregnancy
What is known about the impact of e-cigarettes on pregnancy and birth outcomes? Almost nothing at this point. E-cigarettes deliver nicotine to the bloodstream, and nicotine is known to cause unwelcome, long-term changes in fetal brain development and in that of adolescents as well. The other aerosolized toxicants have not been well studied. A few small surveys conducted in obstetric practices indicate some pregnant women perceive e-cigarettes as posing only minor health risks and safer than combustible cigarettes. And some pregnant women are using e-cigarettes.
“I think it’s notable that we’re not finding exclusive e-cigarette users. It’s early in the study, but so far the dual users are smoking the same number of cigarettes per day as cigarette-only users, and they have the same expired carbon monoxide levels. It makes me feel concerned in particular about dual use in pregnancy,” she said.
Regulation
One audience member asked what the point of allowing e-cigarettes is since, under a best-case scenario, their effectiveness as a smoking cessation tool is similar to a nicotine patch, and smokers already have access to the patch as well as nicotine gum.
Dr. Breland replied that the patch and gum deliver nicotine very slowly, so they are not as satisfying as smoking.
“The hope with e-cigarettes is that, since they get nicotine into your blood pretty fast – similar to a cigarette – they can more effectively suppress your withdrawal,” she said. “Whether or not that’s true isn’t known yet.”
The Food and Drug Administration has the authority to regulate e-cigarettes through several different mechanisms but, in late July 2017, announced a delay in issuing new regulations that would likely have removed many of the devices and flavorings from the marketplace.
Dr. Breland’s research is supported by the National Institute on Drug Abuse and the Food and Drug Administration. She reported having no financial conflicts of interest.
EXPERT ANALYSIS FROM TERATOLOGY SOCIETY 2017
FDA extends Liletta IUD duration of use to 4 years
The Food and Drug Administration has approved a supplemental New Drug Application to extend the duration of use for Liletta (levonorgestrel-releasing intrauterine system) 52 mg, for up to 4 years.
The approval, issued Aug. 3, adds 1 year to the duration of use on the drug label. It is based on additional efficacy and safety data from ACCESS IUS (A Comprehensive Contraceptive Efficacy & Safety Study of an Intrauterine System), an ongoing phase 3 trial with 1,751 U.S. women.

There are three other levonorgestrel-releasing IUDs currently on the market: Mirena and Kyleena, which are both approved for up to 5 years of use; and Skyla, which is approved for up to 3 years of use.
[email protected]
On Twitter @maryellenny
The Food and Drug Administration has approved a supplemental New Drug Application to extend the duration of use for Liletta (levonorgestrel-releasing intrauterine system) 52 mg, for up to 4 years.
The approval, issued Aug. 3, adds 1 year to the duration of use on the drug label. It is based on additional efficacy and safety data from ACCESS IUS (A Comprehensive Contraceptive Efficacy & Safety Study of an Intrauterine System), an ongoing phase 3 trial with 1,751 U.S. women.
There are three other levonorgestrel-releasing IUDs currently on the market: Mirena and Kyleena, which are both approved for up to 5 years of use; and Skyla, which is approved for up to 3 years of use.
[email protected]
On Twitter @maryellenny
Botox smooths prep for hernia surgery
Injections of onabotulinumtoxinA prior to hernia surgery relaxed the abdominal muscles and increased abdominal wall length by an average of 8 cm, based on data from an observational study of 56 patients. The findings were published online in Surgical Endoscopy.
Although laparoscopic ventral hernia repair has a lower recurrence rate than open repair, expanding the abdominal wall remains a challenge, wrote Omar Rodriguez-Acevedo, MD, of the Hernia Institute Australia, Edgecliff, New South Wales, Australia, and colleagues (Surg Endosc. 2017 Jul 21. doi: 10.1007/s00464-017-5750-3).

Nearly three-fourths of the patients (73%) had at least one previous repair. The patients underwent injections of either 200 units or 300 units of BTA between 7 and 14 days before surgery. The average age of the patients was 60 years, and the average body mass index was 40 kg/m2. A subset of 18 patients with larger defects underwent preoperative progressive pneumoperitoneum (PPP) in addition to receiving BTA injections.
Overall, BTA injections significantly increased lateral abdominal length in all subgroups. On average, the length increase per side was 4.4 cm in the 300-unit group, 3.6 cm in the 200-unit group, 4.2 cm in the BtA-only group, and 3.7 cm in the BTA-plus-PPP group. In a pooled analysis, the average gain in length was 4.0 per side.
No significant difference in abdominal wall lengthening was observed between the 200-unit and 300-unit patients or between the BTA-plus-PPP and BTA-only patients.
Overall, the injections were well tolerated, and no complications required intervention, the researchers said. The most common side effects included superficial bruising at the injection site, bloating sensations, weak coughing, and back pain.
The findings were limited by the small study population and by the short follow-up period, and additional long-term follow-up is needed to identify delayed hernia recurrence, the researchers noted. However, the results suggest that “the flaccid paralysis delivered by BTA resulted in the relaxation, elongation, and thinning of the chronically contracted abdominal lateral wall musculature,” which “consequently facilitates laparoscopic repair and primary closure of large defects under minimal tension,” they said.
The researchers had no financial conflicts to disclose.
Injections of onabotulinumtoxinA prior to hernia surgery relaxed the abdominal muscles and increased abdominal wall length by an average of 8 cm, based on data from an observational study of 56 patients. The findings were published online in Surgical Endoscopy.
Although laparoscopic ventral hernia repair has a lower recurrence rate than open repair, expanding the abdominal wall remains a challenge, wrote Omar Rodriguez-Acevedo, MD, of the Hernia Institute Australia, Edgecliff, New South Wales, Australia, and colleagues (Surg Endosc. 2017 Jul 21. doi: 10.1007/s00464-017-5750-3).
Nearly three-fourths of the patients (73%) had at least one previous repair. The patients underwent injections of either 200 units or 300 units of BTA between 7 and 14 days before surgery. The average age of the patients was 60 years, and the average body mass index was 40 kg/m2. A subset of 18 patients with larger defects underwent preoperative progressive pneumoperitoneum (PPP) in addition to receiving BTA injections.
Overall, BTA injections significantly increased lateral abdominal length in all subgroups. On average, the length increase per side was 4.4 cm in the 300-unit group, 3.6 cm in the 200-unit group, 4.2 cm in the BtA-only group, and 3.7 cm in the BTA-plus-PPP group. In a pooled analysis, the average gain in length was 4.0 per side.
No significant difference in abdominal wall lengthening was observed between the 200-unit and 300-unit patients or between the BTA-plus-PPP and BTA-only patients.
Overall, the injections were well tolerated, and no complications required intervention, the researchers said. The most common side effects included superficial bruising at the injection site, bloating sensations, weak coughing, and back pain.
The findings were limited by the small study population and by the short follow-up period, and additional long-term follow-up is needed to identify delayed hernia recurrence, the researchers noted. However, the results suggest that “the flaccid paralysis delivered by BTA resulted in the relaxation, elongation, and thinning of the chronically contracted abdominal lateral wall musculature,” which “consequently facilitates laparoscopic repair and primary closure of large defects under minimal tension,” they said.
The researchers had no financial conflicts to disclose.
FROM SURGICAL ENDOSCOPY
Key clinical point: Injection with botulinum toxin A prior to hernia repair serves as an effective surgical preparation by temporarily paralyzing the lateral abdominal wall muscles.
Major finding: A comparison of pre- and post-onabotulinumtoxinA images of the abdominal wall showed an unstretched average increase in length of 8.0 cm.
Data source: A prospective, observational study of 56 adults who underwent elective ventral hernia repairs at a single center.
Disclosures: The researchers had no financial conflicts to disclose.
Paraneoplastic Acrokeratosis Bazex Syndrome: Unusual Association With In Situ Follicular Lymphoma and Response to Acitretin
To the Editor:
Paraneoplastic acrokeratosis (PA), also known as Bazex syndrome, is a rare paraneoplastic dermatosis first described in 1965 by Bazex et al.1 This entity is clinically characterized by dusky erythematous to violaceous keratoderma of the acral sites and commonly affects men older than 40 years. In most reported cases, there has been an underlying primary malignant neoplasm of the upper aerodigestive tract2; however, some other associated malignancies also have been reported. Skin changes tend to occur before the diagnosis of the associated tumor in 67% of cases. The cutaneous lesions usually resolve after successful treatment of the tumor and relapse in case of recurrence of the malignancy.3
A 53-year-old woman who was a smoker with no relevant medical background was referred to the dermatology department with an itching psoriasiform dermatitis on the palms and soles of 2 months' duration. There were no signs of systemic disease. Physical examination revealed well-demarcated, dusky red, thick, scaly plaques on the soles with sparing of the insteps (Figure, A). Scattered symmetric hyperkeratotic plaques were present on the palms (Figure, B). We also detected onychodystrophy on the hands. Other dermatologic findings were normal. Histologic examination of a biopsy specimen of the left sole showed hyperkeratosis, focal parakeratosis, acanthosis, hypergranulosis, and a predominantly perivascular dermal lymphocytic infiltrate.

With the diagnostic suspicion of PA, blood tests, chest radiograph, and colonoscopy were performed without revealing abnormalities. Positron emission tomography and computed tomography also was performed, showing cervical, mesenteric, retroperitoneal, and inguinal adenopathies. Histologic examination of both inguinal adenectomy and cervical lymph node biopsy revealed Bcl-2-positive in situ follicular lymphoma (ISFL). Examination of an iliac crest marrow aspirate showed minimal involvement of lymphoma (10%). Follow-up imaging performed 4 months after diagnosis showed no changes. The patient was diagnosed with a low-grade chronic lymphoproliferative disorder with histologic findings consistent with ISFL presenting with small disperse adenopathies and minimal bone marrow involvement. The hematology department opted for a wait-and-see approach with 6-month follow-up imaging.
The skin lesions were first treated with salicylic acid cream 10%, psoralen plus UVA therapy, and methotrexate 20 mg weekly for 2 months without remission. Replacing the other therapies, we initiated acitretin 25 mg daily, achieving sustained remission after 6 months of treatment, and then continued with a scaled dose reduction. The patient remained lesion free 1 year after starting the treatment, with a daily dose of 10 mg of acitretin.
Paraneoplastic acrokeratosis has been traditionally described as a paraneoplastic entity mainly associated with primary squamous cell carcinoma (SCC) of the upper aerodigestive tract or a metastatic SCC of the cervical lymph nodes with an unknown origin.4,5 However, uncommon associations such as adenocarcinoma of the prostate, lung, esophagus, stomach, and colon; transitional cell carcinoma of the bladder; small cell carcinoma of the lung; cutaneous SCC; breast cancer; metastatic thymic carcinoma; metastatic neuroendocrine tumor; bronchial carcinoid tumor; SCC of the vulvar region; simultaneous multiple genitourinary tumors; and liposarcoma also have been described.6 Regarding the association with lymphoma, PA has been reported with peripheral T-cell lymphoma7 and Hodgkin disease8; however, ISFL underlying PA is rare.
Follicular lymphoma is the second most common non-Hodgkin lymphoma in Western countries and comprises approximately 20% of all lymphomas.9 It is slightly more prevalent in females, and the majority of patients present with advanced-stage disease. Generally considered to be an incurable disease, a watchful-waiting approach of conservative management has been advocated in most cases, deferring treatment until symptoms appear.9
Histology of PA is nonspecific, as in our case. However, it facilitates a differential diagnosis of major dermatoses including psoriasis vulgaris, pityriasis rubra pilaris, and lupus erythematosus.
Paraneoplastic palmoplantar keratoderma also is characteristic of Howel-Evans syndrome, which is a rare inherited condition associated with esophageal cancer. In contrast to our case, palmoplantar keratoderma in these patients usually begins around 10 years of age, is caused by a mutation in the RHBDF2 gene, and is inherited in an autosomal pattern.10
The diagnosis in our case was supported by a typical clinical picture, nonspecific histology, and the concurrent finding of the underlying lymphoma. Treatment of PA must focus on the removal of the underlying malignancy, which implies the remission of the cutaneous lesions. Taking into account that a recurrence of the primary tumor leads to a relapse of skin manifestations while distant metastases do not cause a reappearance of PA, it could be suggested that pathogenetically relevant factors are produced by the primary tumor and by lymph node metastases but not by metastases elsewhere.
In this case, due to the wait-and-see approach, a specific treatment for the skin lesions was established. Although management of the skin itself generally is ineffective, there are isolated reports of response after corticosteroids, antibiotics, antimycotics, keratolytic measures, or psoralen plus UVA therapy.6 Wishart11 used etretinate to achieve an improvement of PA. We also achieved good response with acitretin. Retinoids are known to have antineoplastic activity, which may have been helpful in both the patient we presented and the one reported by Wishart.11 In summary, we propose adding ISFL to the expanding list of malignant neoplasms associated with PA, noting the response of skin lesions after acitretin.
- Bazex A, Salvador R, Dupré A, et al. Syndrome paranéoplasique à type d'hyperkératose des extremités. Guérison après le traitement de l'épithelioma laryngé. Bull Soc Fr Dermatol Syphiligr. 1965;72:182.
- Bazex A, Griffiths A. Acrokeratosis paraneoplasticae--a new cutaneous marker of malignancy. Br J Dermatol. 1980;103:301-306.
- Bolognia JL. Bazex syndrome: acrokeratosis paraneoplastica. Semin Dermatol. 1995;14:84-89.
- Witkowski JA, Parish LC. Bazex's syndrome. Paraneoplastic acrokeratosis. JAMA. 1982;248:2883-2884.
- Bolognia JL. Bazex's syndrome. Clin Dermatol. 1993;11:37-42.
- Sator PG, Breier F, Gschnait F. Acrokeratosis paraneoplastica (Bazex's syndrome): association with liposarcoma [published online August 28, 2006]. J Am Acad Dermatol. 2006;55:1103-1105.
- Lin YC, Chu CY, Chiu HC. Acrokeratosis paraneoplastica Bazex's syndrome: unusual association with a peripheral T-cell lymphoma. Acta Derm Venereol. 2001;81:440-441.
- Lucker GP, Steijlen PM. Acrokeratosis paraneoplastica (Bazex syndrome) occurring with acquired ichthyosis in Hodgkin's disease. Br J Dermatol. 1995;133:322-325.
- Jegalian AG, Eberle FC, Pack SD, et al. Follicular lymphoma in situ: clinical implications and comparisons with partial involvement by follicular lymphoma. Blood. 2011;118:2976-2984.
- Sroa N, Witman P. Howel-Evans syndrome: a variant of ectodermal dysplasia. Cutis. 2010;85:183-185.
- Wishart JM. Bazex paraneoplastic acrokeratosis: a case report and response to Tigason. Br J Dermatol. 1986;115:595-599.
To the Editor:
Paraneoplastic acrokeratosis (PA), also known as Bazex syndrome, is a rare paraneoplastic dermatosis first described in 1965 by Bazex et al.1 This entity is clinically characterized by dusky erythematous to violaceous keratoderma of the acral sites and commonly affects men older than 40 years. In most reported cases, there has been an underlying primary malignant neoplasm of the upper aerodigestive tract2; however, some other associated malignancies also have been reported. Skin changes tend to occur before the diagnosis of the associated tumor in 67% of cases. The cutaneous lesions usually resolve after successful treatment of the tumor and relapse in case of recurrence of the malignancy.3
A 53-year-old woman who was a smoker with no relevant medical background was referred to the dermatology department with an itching psoriasiform dermatitis on the palms and soles of 2 months' duration. There were no signs of systemic disease. Physical examination revealed well-demarcated, dusky red, thick, scaly plaques on the soles with sparing of the insteps (Figure, A). Scattered symmetric hyperkeratotic plaques were present on the palms (Figure, B). We also detected onychodystrophy on the hands. Other dermatologic findings were normal. Histologic examination of a biopsy specimen of the left sole showed hyperkeratosis, focal parakeratosis, acanthosis, hypergranulosis, and a predominantly perivascular dermal lymphocytic infiltrate.
With the diagnostic suspicion of PA, blood tests, chest radiograph, and colonoscopy were performed without revealing abnormalities. Positron emission tomography and computed tomography also was performed, showing cervical, mesenteric, retroperitoneal, and inguinal adenopathies. Histologic examination of both inguinal adenectomy and cervical lymph node biopsy revealed Bcl-2-positive in situ follicular lymphoma (ISFL). Examination of an iliac crest marrow aspirate showed minimal involvement of lymphoma (10%). Follow-up imaging performed 4 months after diagnosis showed no changes. The patient was diagnosed with a low-grade chronic lymphoproliferative disorder with histologic findings consistent with ISFL presenting with small disperse adenopathies and minimal bone marrow involvement. The hematology department opted for a wait-and-see approach with 6-month follow-up imaging.
The skin lesions were first treated with salicylic acid cream 10%, psoralen plus UVA therapy, and methotrexate 20 mg weekly for 2 months without remission. Replacing the other therapies, we initiated acitretin 25 mg daily, achieving sustained remission after 6 months of treatment, and then continued with a scaled dose reduction. The patient remained lesion free 1 year after starting the treatment, with a daily dose of 10 mg of acitretin.
Paraneoplastic acrokeratosis has been traditionally described as a paraneoplastic entity mainly associated with primary squamous cell carcinoma (SCC) of the upper aerodigestive tract or a metastatic SCC of the cervical lymph nodes with an unknown origin.4,5 However, uncommon associations such as adenocarcinoma of the prostate, lung, esophagus, stomach, and colon; transitional cell carcinoma of the bladder; small cell carcinoma of the lung; cutaneous SCC; breast cancer; metastatic thymic carcinoma; metastatic neuroendocrine tumor; bronchial carcinoid tumor; SCC of the vulvar region; simultaneous multiple genitourinary tumors; and liposarcoma also have been described.6 Regarding the association with lymphoma, PA has been reported with peripheral T-cell lymphoma7 and Hodgkin disease8; however, ISFL underlying PA is rare.
Follicular lymphoma is the second most common non-Hodgkin lymphoma in Western countries and comprises approximately 20% of all lymphomas.9 It is slightly more prevalent in females, and the majority of patients present with advanced-stage disease. Generally considered to be an incurable disease, a watchful-waiting approach of conservative management has been advocated in most cases, deferring treatment until symptoms appear.9
Histology of PA is nonspecific, as in our case. However, it facilitates a differential diagnosis of major dermatoses including psoriasis vulgaris, pityriasis rubra pilaris, and lupus erythematosus.
Paraneoplastic palmoplantar keratoderma also is characteristic of Howel-Evans syndrome, which is a rare inherited condition associated with esophageal cancer. In contrast to our case, palmoplantar keratoderma in these patients usually begins around 10 years of age, is caused by a mutation in the RHBDF2 gene, and is inherited in an autosomal pattern.10
The diagnosis in our case was supported by a typical clinical picture, nonspecific histology, and the concurrent finding of the underlying lymphoma. Treatment of PA must focus on the removal of the underlying malignancy, which implies the remission of the cutaneous lesions. Taking into account that a recurrence of the primary tumor leads to a relapse of skin manifestations while distant metastases do not cause a reappearance of PA, it could be suggested that pathogenetically relevant factors are produced by the primary tumor and by lymph node metastases but not by metastases elsewhere.
In this case, due to the wait-and-see approach, a specific treatment for the skin lesions was established. Although management of the skin itself generally is ineffective, there are isolated reports of response after corticosteroids, antibiotics, antimycotics, keratolytic measures, or psoralen plus UVA therapy.6 Wishart11 used etretinate to achieve an improvement of PA. We also achieved good response with acitretin. Retinoids are known to have antineoplastic activity, which may have been helpful in both the patient we presented and the one reported by Wishart.11 In summary, we propose adding ISFL to the expanding list of malignant neoplasms associated with PA, noting the response of skin lesions after acitretin.
- Bazex A, Salvador R, Dupré A, et al. Syndrome paranéoplasique à type d'hyperkératose des extremités. Guérison après le traitement de l'épithelioma laryngé. Bull Soc Fr Dermatol Syphiligr. 1965;72:182.
- Bazex A, Griffiths A. Acrokeratosis paraneoplasticae--a new cutaneous marker of malignancy. Br J Dermatol. 1980;103:301-306.
- Bolognia JL. Bazex syndrome: acrokeratosis paraneoplastica. Semin Dermatol. 1995;14:84-89.
- Witkowski JA, Parish LC. Bazex's syndrome. Paraneoplastic acrokeratosis. JAMA. 1982;248:2883-2884.
- Bolognia JL. Bazex's syndrome. Clin Dermatol. 1993;11:37-42.
- Sator PG, Breier F, Gschnait F. Acrokeratosis paraneoplastica (Bazex's syndrome): association with liposarcoma [published online August 28, 2006]. J Am Acad Dermatol. 2006;55:1103-1105.
- Lin YC, Chu CY, Chiu HC. Acrokeratosis paraneoplastica Bazex's syndrome: unusual association with a peripheral T-cell lymphoma. Acta Derm Venereol. 2001;81:440-441.
- Lucker GP, Steijlen PM. Acrokeratosis paraneoplastica (Bazex syndrome) occurring with acquired ichthyosis in Hodgkin's disease. Br J Dermatol. 1995;133:322-325.
- Jegalian AG, Eberle FC, Pack SD, et al. Follicular lymphoma in situ: clinical implications and comparisons with partial involvement by follicular lymphoma. Blood. 2011;118:2976-2984.
- Sroa N, Witman P. Howel-Evans syndrome: a variant of ectodermal dysplasia. Cutis. 2010;85:183-185.
- Wishart JM. Bazex paraneoplastic acrokeratosis: a case report and response to Tigason. Br J Dermatol. 1986;115:595-599.
Practice Points
- Paraneoplastic acrokeratosis may mimic palmo-plantar acrokeratosis in both clinical presentation and treatment.
- Uncommon associations of paraneoplastic acrokeratosis with different types of lymphoma have been described.

AGA Guideline: Therapeutic drug monitoring in IBD
Physicians should perform reactive therapeutic drug monitoring to guide changes in anti–tumor necrosis factor (TNF) therapy in patients with active inflammatory bowel disease and should consider target trough concentrations of at least 5 mcg/mL for infliximab, at least 7.5 mcg/mL for adalimumab, and at least 20 mcg/mL for certolizumab pegol, according to a guideline from the AGA Institute, published in the September 2017 issue of Gastroenterology (Gastroenterology. doi: 10.1053/j.gastro.2017.07.032).

Therapeutic drug monitoring can help guide whether to ramp up a dose (if the trough level is below the threshold) or switch therapy (if the trough level is above the threshold) when patients are not responding adequately to maintenance treatment. A nonresponder with optimal trough concentrations might need to switch drug classes, the guideline noted. A patient with low trough levels and no antidrug antibodies is probably experiencing rapid drug clearance in the setting of high inflammation. A patient with low or undetectable trough levels and high antidrug antibody titers has developed neutralizing antidrug antibodies. However, trough concentrations can vary for many other reasons, ranging from disease severity and inflammation to body mass index and sex. Therefore, target levels also vary and can be challenging to set.
The AGA makes no recommendation about routine, proactive TDM in patients with quiescent IBD who are on anti-TNF agents. While proactive TDM can shed light on endoscopic response and drug clearance, it might also trigger a premature switch of therapies; this is particularly likely because physicians have sparse data on either target trough levels for asymptomatic patients or the clinical significance of “low-titer” antidrug antibodies. The optimal frequency of proactive TDM also remains unclear.
Pending better data, the AGA recommended checking infliximab or adalimumab trough levels as close to the next dose as possible – that is, within 24 hours. Drug trough levels are consistent across commercial assays, but antidrug antibody titers are not, and there are no uniform thresholds for clinically relevant antidrug antibody titers. “Therefore, it may be beneficial to utilize the same assay when checking for trough concentration and antidrug antibodies,” the guideline stated.
For patients on a thiopurine, routine testing of thiopurine methyltransferase (TPMT) enzyme or genotype is recommended to guide dosing. In three pooled studies comprising 1,145 patients, only two patients were homozygous; further, rates of hematologic adverse events, clinical remission, and treatment discontinuation did not differ based on TPMT testing itself. However, using TPMT testing to guide dosing was associated with an 89% decrease in the risk of hematologic adverse events among patients who had a homozygous genotype or had low or absent TPMT enzymatic activity. “While this risk may be mitigated by routine laboratory CBC checking, adherence to regular monitoring in clinical practice is suboptimal,” the guideline stated. “It is important to continue to perform routine lab monitoring [of] CBC and liver enzymes after starting a thiopurine, regardless of the TPMT testing results.”
The AGA also conditionally supported reactive monitoring of thiopurine metabolites to guide treatment changes if patients develop breakthrough symptoms or treatment-related adverse effects. For active IBD symptoms in spite of thiopurine monotherapy, a target 6-thioguanine (6-TGN) cutoff between 230 and 450 pmol per 8 x 10⁸ RBC is recommended. Again, supporting evidence is of “very low quality” – in a retrospective, observational study, patients who received treatment according to a TDM algorithm were five times more likely to respond to a change in therapy (relative risk, 5.2). The guideline recommended against monitoring thiopurine metabolites in quiescent IBD. Studies did not support this practice, compared with standard dosing, although no study of thiopurine metabolites included patients on thiopurine/anti-TNF combination therapy, the guideline’s authors noted.
The guideline includes clinical-decision support tools on when to perform TDM and how to interpret results when patients are taking an anti-TNF agent or a thiopurine. The guideline does not cover vedolizumab or ustekinumab because data are sparse. Other knowledge gaps include when best to measure trough concentrations; whether empiric dose escalation or TDM is preferred if response to induction is suboptimal; how target trough concentrations vary based on disease phenotype, disease state, or treatment goals; which levels and durations of antidrug antibody titers are clinically significant; and whether to suppress antidrug antibodies before changing therapy. Future studies should compare routine proactive and reactive TDM, investigate how often to perform proactive TDM, and characterize TDM of newly approved biologic agents, the guideline concluded.
The authors of the guideline document disclosed no conflicts related to the guideline topic.
Physicians should perform reactive therapeutic drug monitoring to guide changes in anti–tumor necrosis factor (TNF) therapy in patients with active inflammatory bowel disease and should consider target trough concentrations of at least 5 mcg/mL for infliximab, at least 7.5 mcg/mL for adalimumab, and at least 20 mcg/mL for certolizumab pegol, according to a guideline from the AGA Institute, published in the September 2017 issue of Gastroenterology (Gastroenterology. doi: 10.1053/j.gastro.2017.07.032).
Therapeutic drug monitoring can help guide whether to ramp up a dose (if the trough level is below the threshold) or switch therapy (if the trough level is above the threshold) when patients are not responding adequately to maintenance treatment. A nonresponder with optimal trough concentrations might need to switch drug classes, the guideline noted. A patient with low trough levels and no antidrug antibodies is probably experiencing rapid drug clearance in the setting of high inflammation. A patient with low or undetectable trough levels and high antidrug antibody titers has developed neutralizing antidrug antibodies. However, trough concentrations can vary for many other reasons, ranging from disease severity and inflammation to body mass index and sex. Therefore, target levels also vary and can be challenging to set.
The AGA makes no recommendation about routine, proactive TDM in patients with quiescent IBD who are on anti-TNF agents. While proactive TDM can shed light on endoscopic response and drug clearance, it might also trigger a premature switch of therapies; this is particularly likely because physicians have sparse data on either target trough levels for asymptomatic patients or the clinical significance of “low-titer” antidrug antibodies. The optimal frequency of proactive TDM also remains unclear.
Pending better data, the AGA recommended checking infliximab or adalimumab trough levels as close to the next dose as possible – that is, within 24 hours. Drug trough levels are consistent across commercial assays, but antidrug antibody titers are not, and there are no uniform thresholds for clinically relevant antidrug antibody titers. “Therefore, it may be beneficial to utilize the same assay when checking for trough concentration and antidrug antibodies,” the guideline stated.
For patients on a thiopurine, routine testing of thiopurine methyltransferase (TPMT) enzyme or genotype is recommended to guide dosing. In three pooled studies comprising 1,145 patients, only two patients were homozygous; further, rates of hematologic adverse events, clinical remission, and treatment discontinuation did not differ based on TPMT testing itself. However, using TPMT testing to guide dosing was associated with an 89% decrease in the risk of hematologic adverse events among patients who had a homozygous genotype or had low or absent TPMT enzymatic activity. “While this risk may be mitigated by routine laboratory CBC checking, adherence to regular monitoring in clinical practice is suboptimal,” the guideline stated. “It is important to continue to perform routine lab monitoring [of] CBC and liver enzymes after starting a thiopurine, regardless of the TPMT testing results.”
The AGA also conditionally supported reactive monitoring of thiopurine metabolites to guide treatment changes if patients develop breakthrough symptoms or treatment-related adverse effects. For active IBD symptoms in spite of thiopurine monotherapy, a target 6-thioguanine (6-TGN) cutoff between 230 and 450 pmol per 8 x 10⁸ RBC is recommended. Again, supporting evidence is of “very low quality” – in a retrospective, observational study, patients who received treatment according to a TDM algorithm were five times more likely to respond to a change in therapy (relative risk, 5.2). The guideline recommended against monitoring thiopurine metabolites in quiescent IBD. Studies did not support this practice, compared with standard dosing, although no study of thiopurine metabolites included patients on thiopurine/anti-TNF combination therapy, the guideline’s authors noted.
The guideline includes clinical-decision support tools on when to perform TDM and how to interpret results when patients are taking an anti-TNF agent or a thiopurine. The guideline does not cover vedolizumab or ustekinumab because data are sparse. Other knowledge gaps include when best to measure trough concentrations; whether empiric dose escalation or TDM is preferred if response to induction is suboptimal; how target trough concentrations vary based on disease phenotype, disease state, or treatment goals; which levels and durations of antidrug antibody titers are clinically significant; and whether to suppress antidrug antibodies before changing therapy. Future studies should compare routine proactive and reactive TDM, investigate how often to perform proactive TDM, and characterize TDM of newly approved biologic agents, the guideline concluded.
The authors of the guideline document disclosed no conflicts related to the guideline topic.
FROM GASTROENTEROLOGY
Continuous glucose monitors aren’t just for abdomens anymore
Close to two-thirds of people with diabetes who wear a continuous glucose monitor position it on an area of the body other than the abdomen, the only site sanctioned by the device’s manufacturer and federal authorities. And that lack of compliance has resulted in no apparent ill effects, according to a new study of related social media.
Michelle L. Litchman, PhD, of the University of Utah in Salt Lake City, and her colleagues, examined nearly 3,000 online postings of photos of continuous glucose monitors (CGM) manufactured by Dexcom, currently the most popular brand of CGMs in the United States. The results of their study, presented at this year’s annual meeting of the American Association of Diabetes Educators, showed that about 74% of device-wearing patients place it on the upper arm, thigh, buttocks, or back, rather than the abdomen, as indicated by the Food and Drug Administration. The device is indicated for use on the abdomen in adults because that was the only location used for the clinical studies of the device, Dr. Litchman explained in an interview.

Overall, out of 2,923 Instagram posts concerning the Dexcom CGM device, Dr. Litchman and her fellow investigators culled 353 photos of the device being worn on the body. Of these, 26.1% indicated the device was placed according to FDA guidance, while 63.7% of the remaining photos depicted the device placed on the inner arm, the forearm, thigh, calf, buttock, or back. In just over 10% of the photos, the device’s location on the body was unclear. Dr. Litchman and her colleagues concluded that when the device was worn according to directions, the failure rate was 6.2%. When placed on the outer arm it had a 2.2% failure rate, and there was a 3.3% failure rate when the device was worn on the thigh.
Since the combined nonabdomen and abdomen failure rates were similar, Dr. Litchman suggested any noncompliance was simply pragmatism. Although the CGM is meant to be relocated weekly around the abdomen, that is also the area of the body typically used for insulin injections several times a day, often resulting in scar tissue build-up that lessens insulin absorption. “It boils down to how much real estate someone has for effective insulin administration,” Dr. Litchman noted. “Individuals with diabetes need to protect the sites where they will inject insulin for the rest of their lives.”
For tips on how to do this effectively, Dr. Litchman said people with diabetes increasingly turn to online communities.
“There are differences in the FDA-approved, by the book, information patients are given and what they do in real life. While some may view this as a threat, I like to see this as opportunity to learn from patients. Patients are finding successes outside of [official instructions], therefore, we should be seeking out this experiential evidence. This research is a start to better understanding the safety related to CGM use in sites other than the abdomen,” she said in the interview.
Dr. Litchman reported that she had no conflict of interest to disclose.
[email protected]
On Twitter @whitneymcknight
Close to two-thirds of people with diabetes who wear a continuous glucose monitor position it on an area of the body other than the abdomen, the only site sanctioned by the device’s manufacturer and federal authorities. And that lack of compliance has resulted in no apparent ill effects, according to a new study of related social media.
Michelle L. Litchman, PhD, of the University of Utah in Salt Lake City, and her colleagues, examined nearly 3,000 online postings of photos of continuous glucose monitors (CGM) manufactured by Dexcom, currently the most popular brand of CGMs in the United States. The results of their study, presented at this year’s annual meeting of the American Association of Diabetes Educators, showed that about 74% of device-wearing patients place it on the upper arm, thigh, buttocks, or back, rather than the abdomen, as indicated by the Food and Drug Administration. The device is indicated for use on the abdomen in adults because that was the only location used for the clinical studies of the device, Dr. Litchman explained in an interview.
Overall, out of 2,923 Instagram posts concerning the Dexcom CGM device, Dr. Litchman and her fellow investigators culled 353 photos of the device being worn on the body. Of these, 26.1% indicated the device was placed according to FDA guidance, while 63.7% of the remaining photos depicted the device placed on the inner arm, the forearm, thigh, calf, buttock, or back. In just over 10% of the photos, the device’s location on the body was unclear. Dr. Litchman and her colleagues concluded that when the device was worn according to directions, the failure rate was 6.2%. When placed on the outer arm it had a 2.2% failure rate, and there was a 3.3% failure rate when the device was worn on the thigh.
Since the combined nonabdomen and abdomen failure rates were similar, Dr. Litchman suggested any noncompliance was simply pragmatism. Although the CGM is meant to be relocated weekly around the abdomen, that is also the area of the body typically used for insulin injections several times a day, often resulting in scar tissue build-up that lessens insulin absorption. “It boils down to how much real estate someone has for effective insulin administration,” Dr. Litchman noted. “Individuals with diabetes need to protect the sites where they will inject insulin for the rest of their lives.”
For tips on how to do this effectively, Dr. Litchman said people with diabetes increasingly turn to online communities.
“There are differences in the FDA-approved, by the book, information patients are given and what they do in real life. While some may view this as a threat, I like to see this as opportunity to learn from patients. Patients are finding successes outside of [official instructions], therefore, we should be seeking out this experiential evidence. This research is a start to better understanding the safety related to CGM use in sites other than the abdomen,” she said in the interview.
Dr. Litchman reported that she had no conflict of interest to disclose.
[email protected]
On Twitter @whitneymcknight
FROM AADE 2017
Key clinical point:
Major finding: Over one quarter of continuous glucose monitors are worn successfully in a non-FDA-approved location on the body.
Data source: Review of 353 photos posted online by persons with diabetes depicting them with the device worn elsewhere than the abdomen.
Disclosures: Dr. Litchman reported she had no relevant disclosures.