User login
Abstract: Please don't give hormone therapy a D recommendation or state that "harms far outweigh benefits for prevention of chronic disease"
The video associated with this article is no longer available on this site. Please view all of our videos on the MDedge YouTube channel
Pinkerton, J. V., et al, Menopause 24(10):1099, October 2017
The authors, writing for the North American Menopause Society (NAMS), protest the recent guideline recommendations regarding postmenopausal hormone therapy (HT) from the US Preventive Services Task Force (USPSTF). The USPSTF draft guidance gives HT (both combined regimens and estrogen alone) a D recommendation for preventing chronic disease because of harms outweighing benefits. The NAMS panel contends that the USPSTF opinion does not distinguish between approved and unapproved indications for HT. They note that the conclusions are based on the Women’s Health Initiative (WHI) trial, from which certain patient populations who may benefit (bothersome hot flashes, high osteoporosis risk, genitourinary symptoms) were omitted. The WHI tested a single dose of a single formulation in women having an average age of 63 who were 13 years past menopause. According to NAMS, the USPSTF should acknowledge that HT relieves vasomotor symptoms, helps prevent bone loss and fracture, and may improve quality of life in women younger than 60 years who take HT within ten years of menopause. Women younger than 60 years who have had a hysterectomy benefit from early estrogen monotherapy, having a lower incidence of breast cancer, cardiovascular disease and mortality. Further, the panel feels that the USPSTF should state that the findings of harm were based on higher-dose formulations, and that the results may not apply to lower doses, different and newer formulations (e.g., natural progesterone, bazedoxifene), and different dosing routes (e.g., transdermal administration). NAMS agrees that HT does not prevent heart disease, but indicates that its use (and insurance coverage) should not be precluded for women with early menopause, bothersome hot flashes, genitourinary symptoms and/or a high risk of fracture. 12 references
Learn more about the Primary Care Medical Abstracts and podcasts, for which you can earn up to 9 CME credits per month.
Copyright © The Center for Medical Education

Woman, 57, With Painful, Swollen Ankle
IN THIS ARTICLE
- Diagnosis
- Treatment
- Care outcome
A 57-year-old horticulturist is working on a ladder leaned up against a tree trunk when the ladder slips, causing her to fall six feet onto concrete. Her right foot and ankle sustain the force of the fall; she is in excruciating pain and unable to bear weight on the foot. She is immediately transported to a local emergency department for evaluation.
Physical exam reveals a tearful middle-aged female in moderate distress and acute pain. There is moderate swelling of the right medial and lateral malleolus, as well as the midfoot, with blue and purple discoloration on the medial and lateral malleolus. Radiographs of the right ankle identify nondisplaced fractures of the distal fibula and tibia. Foot x-rays are unremarkable. A splint is ordered. The patient is given crutches (non-weight-bearing status), pain medication, and a referral to orthopedics.
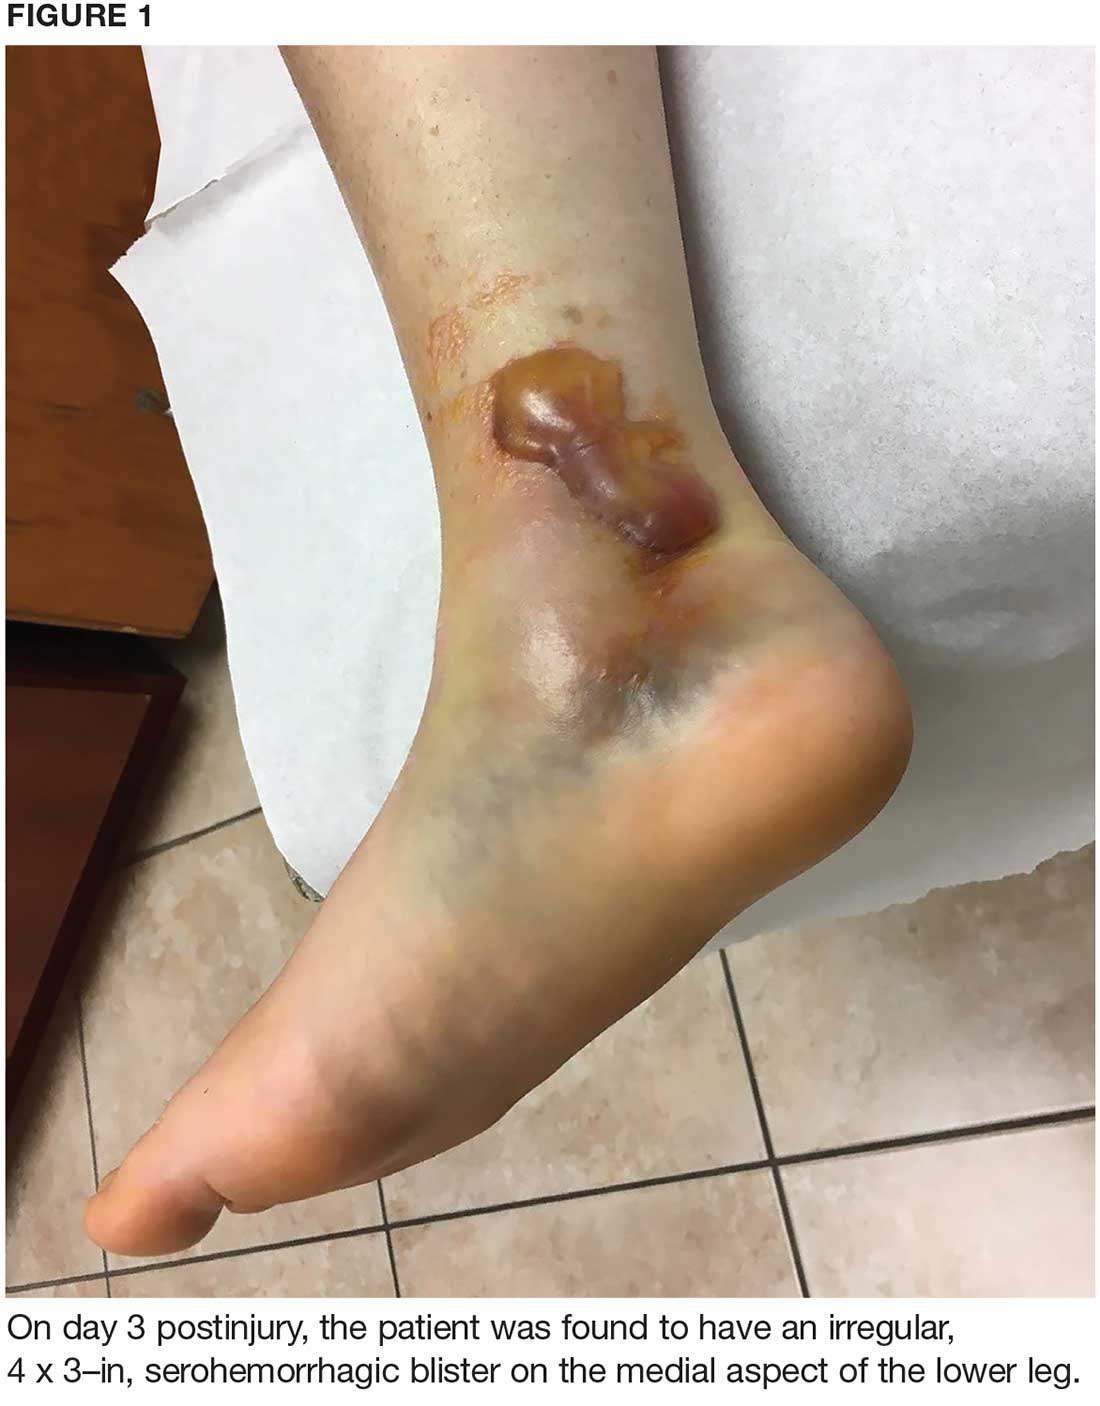
On day 3, the patient presents to orthopedics, where the splint is removed. An irregular, 4 × 3–in (at largest diameter), serohemorrhagic blister is discovered on the medial aspect of the lower leg, above the right malleolus (see Figure 1). Multiple 1- to 3-mm vesicles surround much of the anterior border. Moderate edema is noted from the top of the lesion to the midfoot, concentrated around the lateral and medial malleolus. Extensive blue, purple, and black discoloration is seen below the malleolus. The patient is diagnosed with a fracture blister.
DISCUSSION
Fracture blisters are taut, bullous, subepidermal vesicles that can accompany fractures or severe twisting injuries. They overlie markedly edematous soft tissue and histologically resemble a second-degree burn.1,2
Physiologically, blisters are caused by increased interstitial pressure due to swelling, with subsequent increased filtration pressure and colloid osmotic pressure in the epidermal gap.3 This causes a disruption that allows fluid to move into the weakened area.3 Areas most at risk for fracture blister formation are those with tight, closely adhered skin without muscle or enveloping fascia, where there is less soft tissue between the skin and bone prominences (eg, ankle, elbow, foot, distal tibia).2-4
Approximately 3% of all patients with acute fractures requiring hospitalization develop a fracture blister.4 Any condition that predisposes a patient to poor wound healing (eg, peripheral vascular disease, diabetes, hypertension) increases risk for a fracture blister.2 Recognizing which patients are at greatest risk is vital, as implementing prevention strategies and intervening when fracture blisters do form can help decrease complications—including infection and delayed surgery—and improve fracture resolution. In this patient’s case, the extent of the injury and force of the fall caused the fracture blister to form.
Diagnosis
Diagnosis of a fracture blister is based on clinical presentation. There are two types: hemorrhagic blisters and clear fluid-filled blisters. Hemorrhagic blisters indicate more severe injury and longer healing time (approximately 16 d), while clear fluid-filled blisters demonstrate minimal injury and therefore are quicker to heal.2,4
The differential diagnosis for fracture blisters includes friction blisters and disorders such as epidermolysis bullosa and bullous pemphigoid. Friction blisters form when the epidermis is subjected to repeated friction or shear forces (eg, from a cast or splint).5,6 These forces mechanically separate epidermal cells at the stratum spinosum layer.7 The pressure that moves across the skin forces fluid into the deeper open spaces, filling them but leaving the surface layer intact.1
Epidermolysis bullosa (EB) is a group of rare inherited cutaneous and mucus membrane disorders. EB involves fragility and detachment of subepithelial tissues, which results in blistering and erosions.8,9 The blisters tend to develop in areas subject to minor trauma, such as the extensor aspects of the elbows and the dorsal aspects of the hands and feet.9 They can also be triggered by exposure to heat, friction, scratching, and adhesive tape.10
Bullous pemphigoid, a chronic autoimmune skin disorder, is characterized by pruritic, bullous lesions. When IgG autoantibodies bind to certain hemidesmosomal antigens, complement activation causes a subepidermal blister.11 While bullous pemphigoid most commonly affects those older than 60, it can also occur in children. Diagnosis is confirmed by skin biopsy and immunofluorescence testing.11
Treatment and management
Although several recommendations have been published, there is no gold standard and treatment of fracture blisters remains controversial. Early surgical intervention for fractures could decrease the incidence of fracture blisters.1,3
The goal of treatment is to achieve re-epithelialization of the dermis.3,12,13 Once a blister forms, management techniques vary. Some recommend keeping closed blisters covered with a dry dressing to protect them from damage.3 Strauss et al recommend unroofing to avoid traumatic rupture; however, this does increase risk for infection.12 Recommendations differ depending on provider preference and each patient’s individual situation.
Elective unroofing of a blister is typically followed with one of several treatment options. These include covering the open blister with a topical antibiotic cream (eg, silver sulfadiazine 2%); applying a nonadherent, occlusive bismuth-tribromophenate-petroleum gauze dressing; or elevating and immobilizing the affected extremity.12,13
Treatment of spontaneously ruptured fracture blisters entails
- Unroofing the blister completely and applying a topical antimicrobial (eg, silver sulfadiazine, polymyxin B, neomycin, bacitracin).
- Applying a hydrocolloid dressing to keep the environment moist.
- Using a first-aid gel containing melaleuca (tea tree) oil.
- Initiating prophylactic oral antibiotics.
- Using whirlpool treatments.
- Elevating and immobilizing the affected extremity.3,12,14
OUTCOME FOR THE CASE PATIENT
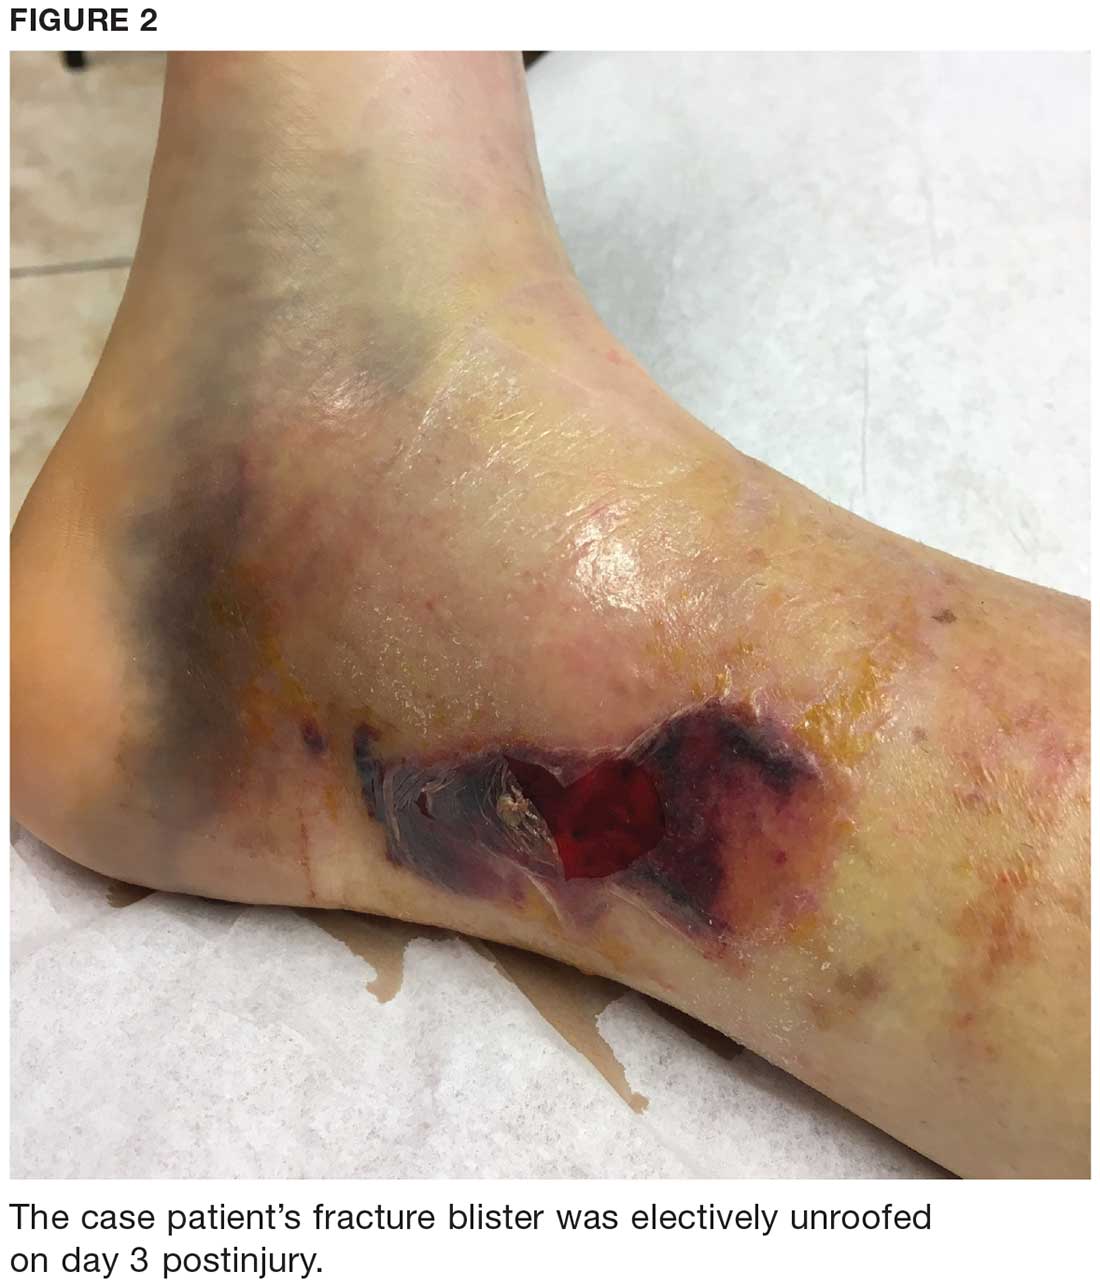
The fracture blister was electively unroofed (see Figure 2) based on provider preference. The patient was instructed to clean the wound daily and apply topical cream (silver sulfadiazine 2% bid) to the wound and cover it with gauze. The patient was made non-weight-bearing to the right lower extremity. Continuous elevation was highly encouraged except for bathing and restroom use, and an NSAID was recommended as needed for pain. She was reassessed the following day and, due to partial refilling, the blister required additional unroofing. The patient was instructed to resume previous wound care orders.
No surgical intervention was required. CT of the right foot and ankle without contrast (performed on day 4 postinjury) confirmed a nondisplaced transverse fracture of the medial malleolus and a sagittal avulsion fracture of the anterior-inferior lateral malleolus. Multiple smaller fracture fragments were noted posterior and medial to the medial malleolus as well as inferiorly along the course of the deltoid ligament. There was a small, nondisplaced avulsion fracture of the medial malleolus at the anterolateral and posterolateral tibial plafond.
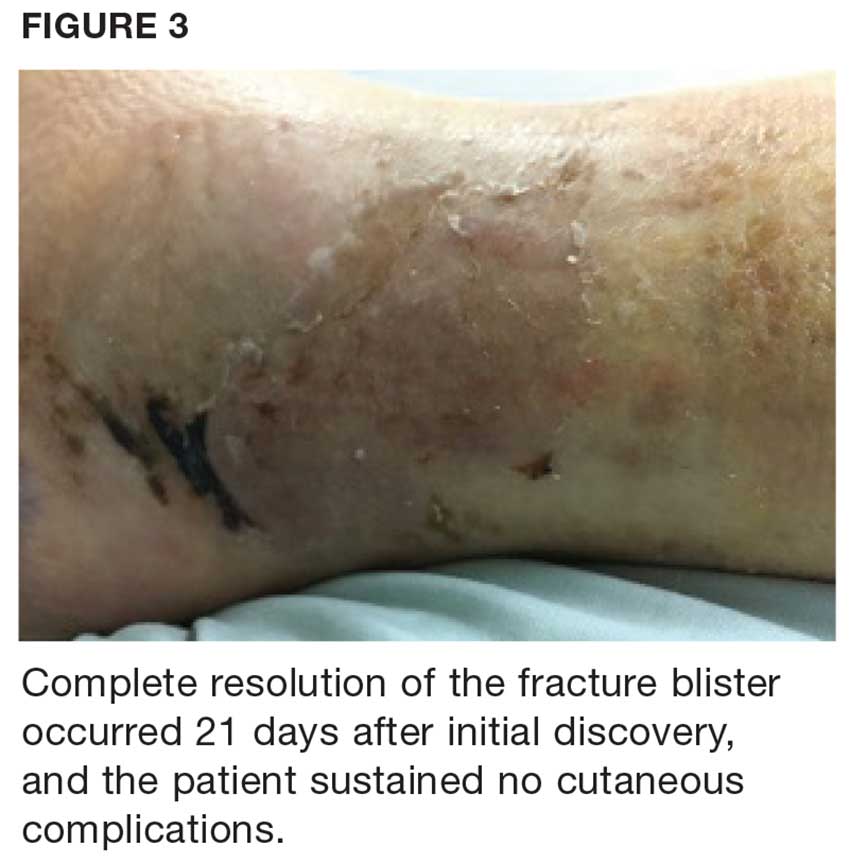
Due to the extent of the swelling, multiple fractures, and blister formation, the patient was essentially bed bound for the first three weeks; complete resolution of the fracture blister occurred 21 days after initial discovery (see Figure 3). The patient did not experience cutaneous complications. Her lower extremity was then casted in a short-leg removable cast for 10 weeks. She underwent physical therapy, and after 12 weeks, the patient was weight-bearing and was discharged from orthopedics. The patient reported refractory pain and swelling for an additional eight weeks following injury, warranting daily ibuprofen.
CONCLUSION
Fracture blisters are rare, and experience and knowledge about them in primary care is lacking. But clinicians need to be able to identify, diagnose, and refer at-risk patients to orthopedics in a timely manner.
Current management and treatment recommendations are inconsistent. Treatment varies depending on the site, severity, type, and status of the blister and the overall health of the patient. Fracture blisters may be left intact, electively unroofed, or treated after spontaneous rupture. More research is needed to clarify management recommendations, specifically regarding the decision to unroof a blister or leave it intact. Early surgical intervention may prevent the development of a fracture blister.
1. Wallace GF, Sullivan J. Fracture blisters. Clin Podiatr Med Surg. 1995;12(4):801-811.
2. Halawi MJ. Fracture blisters after primary total knee arthroplasty. Am J Orthop. 2015; 44(8):E291-E293.
3. McCann S, Gruen G. Fracture blisters: a review of the literature. Orthop Nurs. 1997; 16(2):17-24.
4. Uebbing CM, Walsh M, Miller JB, et al. Fracture blister. West J Emerg Med. 2011; 12(1):131-133.
5. Kirkham S, Lam S, Nester C, Hashmi F. The effect of hydration on the risk of friction blister formation on the heel of the foot. Skin Res Tech. 2014;20:246-253.
6. Boyd A, Benjamin H, Asplund C. Principles of casting and splinting. Am Fam Physician. 2009;79(1):16-24.
7. Knapik J, Reynolds K, Duplantis K, Jones B. Friction blisters. Pathophysiology, prevention and treatment. Sports Med. 1995; 20(3):136-147.
8. Iranzo P, Herrero-González JE, Mascaró-Galy JM, et al. Epidermolysis bullosa acquisita: a retrospective analysis of 12 patients evaluated in four tertiary hospitals in Spain. Br J Dermatol. 2014;171(5):1022-1030.
9. Peraza DM. Epidermolysis bullosa acquisita. Merck Manual Professional Version. August 2016. www.merckmanuals.com/professional/dermatologic-disorders/bullous-diseases/epidermolysis-bullosa-acquisita. Accessed January 26, 2018.
10. Lyons F, Ousley L. Dermatology for the Advanced Practice Nurse. New York, NY: Springer; 2015.
11. Peraza D. Bullous pemphigoid. Merck Manual Professional Version. August 2016. www.merckmanuals.com/professional/dermatologic-disorders/bullous-diseases/bullous-pemphigoid. Accessed January 26, 2018.
12. Strauss EJ, Petrucelli G, Bong M, et al. Blisters associated with lower-extremity fracture: Results of a prospective treatment protocol. J Orthop Trauma. 2006;20(9): 618-622.
13. Tolpinrud WL, Rebolledo BJ, Lorich DG, Grossman ME. A case of extensive fracture bullae: a multidisciplinary approach for acute management. JAAD Case Rep. 2015;1(3):132-135.
14. Cox H, Nealon L. Case report: the use of Burnaid Gel on fracture blisters. Wound Practice and Research. 2008;16(1):32-36.
IN THIS ARTICLE
- Diagnosis
- Treatment
- Care outcome
A 57-year-old horticulturist is working on a ladder leaned up against a tree trunk when the ladder slips, causing her to fall six feet onto concrete. Her right foot and ankle sustain the force of the fall; she is in excruciating pain and unable to bear weight on the foot. She is immediately transported to a local emergency department for evaluation.
Physical exam reveals a tearful middle-aged female in moderate distress and acute pain. There is moderate swelling of the right medial and lateral malleolus, as well as the midfoot, with blue and purple discoloration on the medial and lateral malleolus. Radiographs of the right ankle identify nondisplaced fractures of the distal fibula and tibia. Foot x-rays are unremarkable. A splint is ordered. The patient is given crutches (non-weight-bearing status), pain medication, and a referral to orthopedics.
On day 3, the patient presents to orthopedics, where the splint is removed. An irregular, 4 × 3–in (at largest diameter), serohemorrhagic blister is discovered on the medial aspect of the lower leg, above the right malleolus (see Figure 1). Multiple 1- to 3-mm vesicles surround much of the anterior border. Moderate edema is noted from the top of the lesion to the midfoot, concentrated around the lateral and medial malleolus. Extensive blue, purple, and black discoloration is seen below the malleolus. The patient is diagnosed with a fracture blister.
DISCUSSION
Fracture blisters are taut, bullous, subepidermal vesicles that can accompany fractures or severe twisting injuries. They overlie markedly edematous soft tissue and histologically resemble a second-degree burn.1,2
Physiologically, blisters are caused by increased interstitial pressure due to swelling, with subsequent increased filtration pressure and colloid osmotic pressure in the epidermal gap.3 This causes a disruption that allows fluid to move into the weakened area.3 Areas most at risk for fracture blister formation are those with tight, closely adhered skin without muscle or enveloping fascia, where there is less soft tissue between the skin and bone prominences (eg, ankle, elbow, foot, distal tibia).2-4
Approximately 3% of all patients with acute fractures requiring hospitalization develop a fracture blister.4 Any condition that predisposes a patient to poor wound healing (eg, peripheral vascular disease, diabetes, hypertension) increases risk for a fracture blister.2 Recognizing which patients are at greatest risk is vital, as implementing prevention strategies and intervening when fracture blisters do form can help decrease complications—including infection and delayed surgery—and improve fracture resolution. In this patient’s case, the extent of the injury and force of the fall caused the fracture blister to form.
Diagnosis
Diagnosis of a fracture blister is based on clinical presentation. There are two types: hemorrhagic blisters and clear fluid-filled blisters. Hemorrhagic blisters indicate more severe injury and longer healing time (approximately 16 d), while clear fluid-filled blisters demonstrate minimal injury and therefore are quicker to heal.2,4
The differential diagnosis for fracture blisters includes friction blisters and disorders such as epidermolysis bullosa and bullous pemphigoid. Friction blisters form when the epidermis is subjected to repeated friction or shear forces (eg, from a cast or splint).5,6 These forces mechanically separate epidermal cells at the stratum spinosum layer.7 The pressure that moves across the skin forces fluid into the deeper open spaces, filling them but leaving the surface layer intact.1
Epidermolysis bullosa (EB) is a group of rare inherited cutaneous and mucus membrane disorders. EB involves fragility and detachment of subepithelial tissues, which results in blistering and erosions.8,9 The blisters tend to develop in areas subject to minor trauma, such as the extensor aspects of the elbows and the dorsal aspects of the hands and feet.9 They can also be triggered by exposure to heat, friction, scratching, and adhesive tape.10
Bullous pemphigoid, a chronic autoimmune skin disorder, is characterized by pruritic, bullous lesions. When IgG autoantibodies bind to certain hemidesmosomal antigens, complement activation causes a subepidermal blister.11 While bullous pemphigoid most commonly affects those older than 60, it can also occur in children. Diagnosis is confirmed by skin biopsy and immunofluorescence testing.11
Treatment and management
Although several recommendations have been published, there is no gold standard and treatment of fracture blisters remains controversial. Early surgical intervention for fractures could decrease the incidence of fracture blisters.1,3
The goal of treatment is to achieve re-epithelialization of the dermis.3,12,13 Once a blister forms, management techniques vary. Some recommend keeping closed blisters covered with a dry dressing to protect them from damage.3 Strauss et al recommend unroofing to avoid traumatic rupture; however, this does increase risk for infection.12 Recommendations differ depending on provider preference and each patient’s individual situation.
Elective unroofing of a blister is typically followed with one of several treatment options. These include covering the open blister with a topical antibiotic cream (eg, silver sulfadiazine 2%); applying a nonadherent, occlusive bismuth-tribromophenate-petroleum gauze dressing; or elevating and immobilizing the affected extremity.12,13
Treatment of spontaneously ruptured fracture blisters entails
- Unroofing the blister completely and applying a topical antimicrobial (eg, silver sulfadiazine, polymyxin B, neomycin, bacitracin).
- Applying a hydrocolloid dressing to keep the environment moist.
- Using a first-aid gel containing melaleuca (tea tree) oil.
- Initiating prophylactic oral antibiotics.
- Using whirlpool treatments.
- Elevating and immobilizing the affected extremity.3,12,14
OUTCOME FOR THE CASE PATIENT
The fracture blister was electively unroofed (see Figure 2) based on provider preference. The patient was instructed to clean the wound daily and apply topical cream (silver sulfadiazine 2% bid) to the wound and cover it with gauze. The patient was made non-weight-bearing to the right lower extremity. Continuous elevation was highly encouraged except for bathing and restroom use, and an NSAID was recommended as needed for pain. She was reassessed the following day and, due to partial refilling, the blister required additional unroofing. The patient was instructed to resume previous wound care orders.
No surgical intervention was required. CT of the right foot and ankle without contrast (performed on day 4 postinjury) confirmed a nondisplaced transverse fracture of the medial malleolus and a sagittal avulsion fracture of the anterior-inferior lateral malleolus. Multiple smaller fracture fragments were noted posterior and medial to the medial malleolus as well as inferiorly along the course of the deltoid ligament. There was a small, nondisplaced avulsion fracture of the medial malleolus at the anterolateral and posterolateral tibial plafond.
Due to the extent of the swelling, multiple fractures, and blister formation, the patient was essentially bed bound for the first three weeks; complete resolution of the fracture blister occurred 21 days after initial discovery (see Figure 3). The patient did not experience cutaneous complications. Her lower extremity was then casted in a short-leg removable cast for 10 weeks. She underwent physical therapy, and after 12 weeks, the patient was weight-bearing and was discharged from orthopedics. The patient reported refractory pain and swelling for an additional eight weeks following injury, warranting daily ibuprofen.
CONCLUSION
Fracture blisters are rare, and experience and knowledge about them in primary care is lacking. But clinicians need to be able to identify, diagnose, and refer at-risk patients to orthopedics in a timely manner.
Current management and treatment recommendations are inconsistent. Treatment varies depending on the site, severity, type, and status of the blister and the overall health of the patient. Fracture blisters may be left intact, electively unroofed, or treated after spontaneous rupture. More research is needed to clarify management recommendations, specifically regarding the decision to unroof a blister or leave it intact. Early surgical intervention may prevent the development of a fracture blister.
1. Wallace GF, Sullivan J. Fracture blisters. Clin Podiatr Med Surg. 1995;12(4):801-811.
2. Halawi MJ. Fracture blisters after primary total knee arthroplasty. Am J Orthop. 2015; 44(8):E291-E293.
3. McCann S, Gruen G. Fracture blisters: a review of the literature. Orthop Nurs. 1997; 16(2):17-24.
4. Uebbing CM, Walsh M, Miller JB, et al. Fracture blister. West J Emerg Med. 2011; 12(1):131-133.
5. Kirkham S, Lam S, Nester C, Hashmi F. The effect of hydration on the risk of friction blister formation on the heel of the foot. Skin Res Tech. 2014;20:246-253.
6. Boyd A, Benjamin H, Asplund C. Principles of casting and splinting. Am Fam Physician. 2009;79(1):16-24.
7. Knapik J, Reynolds K, Duplantis K, Jones B. Friction blisters. Pathophysiology, prevention and treatment. Sports Med. 1995; 20(3):136-147.
8. Iranzo P, Herrero-González JE, Mascaró-Galy JM, et al. Epidermolysis bullosa acquisita: a retrospective analysis of 12 patients evaluated in four tertiary hospitals in Spain. Br J Dermatol. 2014;171(5):1022-1030.
9. Peraza DM. Epidermolysis bullosa acquisita. Merck Manual Professional Version. August 2016. www.merckmanuals.com/professional/dermatologic-disorders/bullous-diseases/epidermolysis-bullosa-acquisita. Accessed January 26, 2018.
10. Lyons F, Ousley L. Dermatology for the Advanced Practice Nurse. New York, NY: Springer; 2015.
11. Peraza D. Bullous pemphigoid. Merck Manual Professional Version. August 2016. www.merckmanuals.com/professional/dermatologic-disorders/bullous-diseases/bullous-pemphigoid. Accessed January 26, 2018.
12. Strauss EJ, Petrucelli G, Bong M, et al. Blisters associated with lower-extremity fracture: Results of a prospective treatment protocol. J Orthop Trauma. 2006;20(9): 618-622.
13. Tolpinrud WL, Rebolledo BJ, Lorich DG, Grossman ME. A case of extensive fracture bullae: a multidisciplinary approach for acute management. JAAD Case Rep. 2015;1(3):132-135.
14. Cox H, Nealon L. Case report: the use of Burnaid Gel on fracture blisters. Wound Practice and Research. 2008;16(1):32-36.
Consider drug holidays for BCC patients on hedgehog inhibitors
KAUAI, HAWAII – according to Kishwer Nehal, MD, director of Mohs micrographic and dermatologic surgery at Memorial Sloan Kettering Cancer Center, New York.
That’s important because, although some patients have a good response to vismodegib, more – about 80% – have side effects that make it necessary to stop treatment, including muscle spasms and weight loss, among other problems. Side effects often come on quickly and can become intolerable after a few months of treatment, so physicians have looked for alternative dosing regimens to hold them off, with some success.

Compared with those on continuous dosing, fewer patients on intermittent dosing discontinued treatment for adverse events (23% versus 31%). Patients on intermittent dosing also experienced fewer grade 3 adverse events (31% versus 44%) and were on treatment for a longer period of time (a median of 71.4 weeks versus 37.6 weeks).
Meanwhile, among those on intermittent dosing, the number of BCCs was reduced in more than half of the patients in both interrupted treatment groups, but more so in the 12-weeks-on/8-weeks-off group (Lancet Oncol. 2017 Mar; 18[3]:404-12).
Other treatment options are being explored for vismodegib, as well as for sonidegib (Odomzo), another hedgehog signaling pathway inhibitor approved for advanced BCC. Ongoing trials are looking at the use of hedgehog inhibitors with radiation, and for shrinking tumors before surgery, Dr. Nehal said
For now, however, surgery remains the mainstay of treatment for BCC; both biologics are indicated for when other treatments fail or are not feasible. For high-risk BCC (meaning high risk for recurrence, based on infiltrative or poorly defined histology, perineural or bony involvement, or location on the face, for instance), “surgery with clear margins remains the goal and is the most effective treatment. For a high-risk [BCC], you pretty much need surgery,” she said.
Recurrence is less likely with Mohs surgery than with standard excision. When Mohs isn’t available, “you should wait for the pathology report before reconstruction,” she said.
“Radiation for high-risk [BCC] is really reserved for nonsurgical candidates,” Dr. Nehal commented. There are only two scenarios to consider radiation in high-risk BCC, “and they really have no proven benefit in any sort of prospective trial. One is if you cannot, after exhaustive surgery, clear your very high risk [BCC].” The other is if there is “really large nerve involvement, greater than 0.1 mm, or such extensive perineural involvement that surgery is unlikely to be successful,” she said.
Dr. Nehal had no relevant disclosures. SDEF/Global Academy for Medical Education and this news organization are owned by the same parent company.
KAUAI, HAWAII – according to Kishwer Nehal, MD, director of Mohs micrographic and dermatologic surgery at Memorial Sloan Kettering Cancer Center, New York.
That’s important because, although some patients have a good response to vismodegib, more – about 80% – have side effects that make it necessary to stop treatment, including muscle spasms and weight loss, among other problems. Side effects often come on quickly and can become intolerable after a few months of treatment, so physicians have looked for alternative dosing regimens to hold them off, with some success.
Compared with those on continuous dosing, fewer patients on intermittent dosing discontinued treatment for adverse events (23% versus 31%). Patients on intermittent dosing also experienced fewer grade 3 adverse events (31% versus 44%) and were on treatment for a longer period of time (a median of 71.4 weeks versus 37.6 weeks).
Meanwhile, among those on intermittent dosing, the number of BCCs was reduced in more than half of the patients in both interrupted treatment groups, but more so in the 12-weeks-on/8-weeks-off group (Lancet Oncol. 2017 Mar; 18[3]:404-12).
Other treatment options are being explored for vismodegib, as well as for sonidegib (Odomzo), another hedgehog signaling pathway inhibitor approved for advanced BCC. Ongoing trials are looking at the use of hedgehog inhibitors with radiation, and for shrinking tumors before surgery, Dr. Nehal said
For now, however, surgery remains the mainstay of treatment for BCC; both biologics are indicated for when other treatments fail or are not feasible. For high-risk BCC (meaning high risk for recurrence, based on infiltrative or poorly defined histology, perineural or bony involvement, or location on the face, for instance), “surgery with clear margins remains the goal and is the most effective treatment. For a high-risk [BCC], you pretty much need surgery,” she said.
Recurrence is less likely with Mohs surgery than with standard excision. When Mohs isn’t available, “you should wait for the pathology report before reconstruction,” she said.
“Radiation for high-risk [BCC] is really reserved for nonsurgical candidates,” Dr. Nehal commented. There are only two scenarios to consider radiation in high-risk BCC, “and they really have no proven benefit in any sort of prospective trial. One is if you cannot, after exhaustive surgery, clear your very high risk [BCC].” The other is if there is “really large nerve involvement, greater than 0.1 mm, or such extensive perineural involvement that surgery is unlikely to be successful,” she said.
Dr. Nehal had no relevant disclosures. SDEF/Global Academy for Medical Education and this news organization are owned by the same parent company.
EXPERT ANALYSIS FROM SDEF HAWAII DERMATOLOGY SEMINAR
Pain, opioids and addiction
In the year 2017, a plethora of articles and commentaries on the “opioid crisis” have appeared in major medical journals, alongside the ongoing hyperbole seen daily in the lay media. But the pressing concern remains: How best to manage patients who are 1.) already taking opioids and 2.) those newly requesting relief of serious and chronic pain.
Opioid for Pain and Its Misuse
In this article by Volkow and Collins, both of whom are titans in neuroscience, we are reminded that despite all the warnings, opioids are being widely prescribed in the U.S. In a weighted national sample of over 50,000 adults, the investigators concluded that more than one-third of the adult population has taken an opioid at some point during 2015. Among these, 12.5% confirmed that they misused the drug, e.g., used them without a prescription or in any way contrary to the prescribed directions. Of these, 16.7% developed an opioid-use disorder, as defined in the DSM-IV.
In response, Volkow and Collins note that an increasing number of clinicians are attempting to control chronic or intractable pain with new anticonvulsants such as Pregabalin (Lyrica) and Gabapentin. Yet, these drugs have only been shown to be effective only for fibromyalgia and certain forms of neurogenic pain. In addition, the authors note that a multidisciplinary workgroup convened by the NIH Office of Disease Prevention (2014) found that there had been no randomized trials to evaluate the efficacy of long-term (>1 year) opioid treatment. Accordingly, the authors recommend short-term strategy to develop abuse-deterrent formulations that can minimize diversion and misuse.
What About Cannabis?
In a 2017 report from the National Academies of Sciences, Engineering, and Medicine, substantial evidence supports the effectiveness of cannabinoids in treating some types of pain. However, again there is scant research on phytocannabinoids as medicine. In addition, there are abundant research and legitimate concerns related to cognitive, motor and motivational impairment and the effects on brain development. However, the therapeutic potential of cannabinoids and mediators of the abundant endocannabinoid system warrants further exploration for alternatives to opioids.
Lastly, non-pharmacologic interventions, including behavioral, self-management interventions, may play an important role in pain management. The initiative described by the authors supports partnerships between the NIH and pharmaceutical and biotechnology companies to hasten medication and device development.
Why Does This Matter?
If these data are true, and one-third of the U.S. adult population suffers from chronic pain, we are duty bound to find therapeutic options with less risk, addictive potential and mortality. As I have argued for nearly 40 years, basic and translational research is desperately needed, as clinicians are in a conundrum between the worthy goals of alleviating pain and suffering and decreasing the risk for addiction and mortality. We can, and must do better.
Volkow ND, Collins FS. The Role of Science in Addressing the Opioid Crisis. N Engl J Med. 2017;377(4):391-394.
In the year 2017, a plethora of articles and commentaries on the “opioid crisis” have appeared in major medical journals, alongside the ongoing hyperbole seen daily in the lay media. But the pressing concern remains: How best to manage patients who are 1.) already taking opioids and 2.) those newly requesting relief of serious and chronic pain.
Opioid for Pain and Its Misuse
In this article by Volkow and Collins, both of whom are titans in neuroscience, we are reminded that despite all the warnings, opioids are being widely prescribed in the U.S. In a weighted national sample of over 50,000 adults, the investigators concluded that more than one-third of the adult population has taken an opioid at some point during 2015. Among these, 12.5% confirmed that they misused the drug, e.g., used them without a prescription or in any way contrary to the prescribed directions. Of these, 16.7% developed an opioid-use disorder, as defined in the DSM-IV.
In response, Volkow and Collins note that an increasing number of clinicians are attempting to control chronic or intractable pain with new anticonvulsants such as Pregabalin (Lyrica) and Gabapentin. Yet, these drugs have only been shown to be effective only for fibromyalgia and certain forms of neurogenic pain. In addition, the authors note that a multidisciplinary workgroup convened by the NIH Office of Disease Prevention (2014) found that there had been no randomized trials to evaluate the efficacy of long-term (>1 year) opioid treatment. Accordingly, the authors recommend short-term strategy to develop abuse-deterrent formulations that can minimize diversion and misuse.
What About Cannabis?
In a 2017 report from the National Academies of Sciences, Engineering, and Medicine, substantial evidence supports the effectiveness of cannabinoids in treating some types of pain. However, again there is scant research on phytocannabinoids as medicine. In addition, there are abundant research and legitimate concerns related to cognitive, motor and motivational impairment and the effects on brain development. However, the therapeutic potential of cannabinoids and mediators of the abundant endocannabinoid system warrants further exploration for alternatives to opioids.
Lastly, non-pharmacologic interventions, including behavioral, self-management interventions, may play an important role in pain management. The initiative described by the authors supports partnerships between the NIH and pharmaceutical and biotechnology companies to hasten medication and device development.
Why Does This Matter?
If these data are true, and one-third of the U.S. adult population suffers from chronic pain, we are duty bound to find therapeutic options with less risk, addictive potential and mortality. As I have argued for nearly 40 years, basic and translational research is desperately needed, as clinicians are in a conundrum between the worthy goals of alleviating pain and suffering and decreasing the risk for addiction and mortality. We can, and must do better.
Volkow ND, Collins FS. The Role of Science in Addressing the Opioid Crisis. N Engl J Med. 2017;377(4):391-394.
Volkow ND, Collins FS. The Role of Science in Addressing the Opioid Crisis. N Engl J Med. 2017;377(4):391-394.

Anti-PD-1 therapy with nivolumab in the treatment of metastatic malignant PEComa
Perivascular epithelioid cell neoplasms (PEComas) are an uncommon class of tumors consisting on histology of perivascular epithelioid cells occurring in both localized and metastatic forms at various body sites. The approach to treatment of these tumors generally involves a combination of surgical resection, chemotherapy, and/or radiation therapy.1
Case presentation and summary
A 46-year-old man presented to our institution with a non-tender, slowly enlarging, 8.3 cm mass in his right popliteal fossa. Upon biopsy, the pathologic findings were consistent with an epithelioid malignancy with melanocytic differentiation most consistent with a PEComa. Discussion of the pathologic diagnosis of our patient has been reported by the pathology group at our institution in a separate case report.2
Our patient was initially offered and refused amputation. He was started on therapy with the mechanistic Target of Rapamycin (mTOR) inhibitor everolimus, but was unable to tolerate the side effects after the first week of treatment. He then elected to monitor his symptoms clinically.
Approximately one year after his initial diagnosis, he presented to our facility with sepsis and bleeding from a now fungating tumor on his right knee. At this time, emergent above-knee amputation was performed. Re-staging images now showed the presence of multiple pulmonary nodules in his right lung as well as a lytic rib lesion, a concerning finding for metastatic disease. Video-Assisted Thorascopic Surgery (VATS) and right lower lobe wedge resection were performed and findings confirmed metastatic PEComa.
Given the patient’s intolerance to everolimus, he was started on the growth factor inhibitor, pazopanib. His disease did not progress on pazopanib, and improvement was noted in the dominant pulmonary nodule. Subsequently, however, he developed significant skin irritation and discontinued pazopanib. Repeat imaging approximately 2 months after stopping pazopanib showed significant disease progression.
We elected to start the patient on a non-standard approach to therapy with nivolumab infusions once every 2 weeks and concurrent radiation therapy to the rib lesion. At 2 and 5 months after initiating this treatment approach, CT imaging showed improvement in disease. At 12 months, significant disease response was noted (Figure 1).
The patient is now at 12 months of nivolumab therapy with progression free survival and no new identifiable metastatic lesions. He has been tolerating the medication with minimal side effects and has had an overall improvement in his pain and functional status. He continues to work full time.
Discussion
Our patient’s response presents a unique opportunity to talk about the role of immunotherapy as a treatment modality in patients with PEComa. The efficacy of check-point blockade in soft tissue sarcoma is still unclear predominantly because it is difficult to assess the degree of expression of immunogenic cell surface markers such as programmed cell death protein 1 (PD-1).1,3 Nivolumab has been tried in small cohorts for treatment of soft tissue sarcomas that express PD-1 and results showed some clinical benefit in about half of patients.4 Further, the expression of PD-1 has been assessed in soft tissue sarcomas and has been reported to suggest a negative prognostic role.5
To our knowledge, there has not yet been another reported case of PEComa that has been treated with immunotherapy and achieved a sustained response. Further clinical studies need to be done to assess response to agents such as nivolumab in the treatment of PEComa to bolster our observation that nivolumab is a viable treatment option that may lead to lasting remission. Our patient’s case also brings to light the need for further inquiry into assessing the immune tumor microenvironments, particularly looking at the expression of cell surface proteins such as PD-1, as it ultimately affects treatment options. TSJ
Correspondence
REFERENCES
1. Burgess, Melissa, et al. “Immunotherapy in Sarcoma: Future Horizons.” Current Oncology Reports, vol. 17, no. 11, 2015, doi:10.1007/s11912-015-0476-7.
2. Alnajar, Hussein, et al. “Metastatic Malignant PEComa of the Leg with Identification of ATRX Mutation by next-Generation Sequencing.” Virchows Archiv (2017). https://doi:10.1007/s004280172208-x.
3. Ghosn, Marwan, et al. “Immunotherapies in Sarcoma: Updates and Future Perspectives.” World Journal of Clinical Oncology, vol. 8, no. 2, 2017, p. 145., doi:10.5306/wjco.v8.i2.145.
4. Paoluzzi, L., et al. “Response to Anti-PD1 Therapy with Nivolumab in Metastatic Sarcomas.” Clinical Sarcoma Research, vol. 6, no. 1, 2016, doi:10.1186/s13569-016 0064-0.
5. Kim, Chan, et al. “Prognostic Implications of PD-L1 Expression in Patients with Soft Tissue Sarcoma.” BMC Cancer, BioMed Central 8 July 2016.
Tumor lysis syndrome in an adolescent with recurrence of abdominal rhabdomyosarcoma: A case report and literature review
Introduction
Tumor lysis syndrome (TLS) is a life-threatening oncologic emergency that results when massive cell breakdown occurs either spontaneously or in response to cytotoxic chemotherapy. TLS is characterized by metabolic derangements, including hyperkalemia and hyperphosphatemia, secondary to the release of intracellular components into the systemic circulatory system. In addition, purine degradation can lead to hyperuricemia, and precipitation of calcium phosphate can result in hypocalcemia. Lactate dehydrogenase (LDH) levels are often elevated, especially in higher risk patients; however, this finding is not a specific marker for TLS.
TLS more commonly occurs in patients with rapidly proliferating hematological malignancies, such as acute leukemias with a high white blood cell count and Burkitt’s lymphoma, and is a relatively rare event in patients with solid malignancies.1-3 It is even more rare in patients with tumor recurrence.
There are few reported cases of TLS in children with solid malignancies. To our knowledge, only one case of TLS has previously been reported in a pediatric patient with abdominal rhabdomyosarcoma. We report the second such case, and what we believe to be the only reported case of TLS occurring in a pediatric patient with recurrence of a solid tumor.
Case Description
A 15-year-old male from Saudi Arabia presented to our hospital with confirmed stage IV abdominal rhabdomyosarcoma and lung metastases diagnosed in 2012. His initial treatment consisted of complete surgical resection, lung irradiation, and chemotherapy with intercalating cycles of ifosfamide/etoposide and vincristine/doxorubicin/cyclophosphamide, as per the COG-ARST0431 high-risk sarcoma protocol (NCT00354744). He completed treatment without any reported TLS in Saudi Arabia in June 2014. He had no residual tumor at the end of therapy, but six months later he was found to have an abdominal recurrence and started treatment with single-agent topotecan chemotherapy. He experienced worsening abdominal distention, pain, and difficulty voiding, prompting his family to seek further treatment options abroad.
The patient was admitted to our hospital in March 2015. Despite being severely malnourished, he was in stable condition. He was noted to have a markedly enlarged, firm, distended abdomen with dilated veins, abdominal and lower back pain, lower extremity pitting edema, and difficulty urinating.
Initial laboratory findings were unremarkable except for elevated levels of BUN (29 mg/dL), creatinine (1.69 mg/dL), and phosphorus (5.6 mg/dL). MRI revealed a large pelvic mass measuring 15.3 x 15.2 x 21.3 centimeters in transverse, anterior-posterior, and craniocaudal dimensions, respectively; with concomitant severe bilateral hydroureternephrosis (FIGURE 1).

FIGURE 1. Sagittal (A) and Axial (B) T2-weighted MR images of the pelvis (prior to initiating therapy) demonstrating a large heterogeneous mass occupying the entire pelvis. There is evidence of edema involving the soft tissues of the perineum (long arrow) and a large associated hydrocele (short arrow).
Three days following admission, the patient’s urine output decreased and his creatinine level rose rapidly. His worsening abdominal distention was attributed to growing tumor bulk and obstructive nephropathy. He required emergency placement of bilateral nephrostomy tubes. Urine output subsequently improved; although, serum creatinine remained persistently elevated.
Given his worsening condition, chemotherapy was begun three days after nephrostomy tube placement with vinorelbine, cyclophosphamide, and temsirolimus, as per COG-ARST0921 (NCT01222715), at renal-adjusted doses. Laboratory studies approximately 24 hours after chemotherapy initiation demonstrated the presence of TLS (TABLE 1). Potassium level was at the upper end of normal at 4.9 mmol/L, calcium level was decreased to 7.1 mg/dL, phosphorus level elevated to 12 mg/dL, uric acid level was markedly elevated to 19.5 mg/dL, and LDH elevated to 662 unit/L. A dose of 0.15 mg/kg of rasburicase was immediately given with a second dose repeated 14 hours later, after which the uric acid level decreased to less than 0.5 mg/dL. Sevelamer, sodium polystyrene, calcium carbonate, and magnesium gluconate were also administered to treat other electrolyte imbalances. The patient remained at clinical baseline throughout, and the TLS laboratory derangements normalized by three days after the TLS diagnosis; LDH level normalized after one week. The patient continued with chemotherapy, per protocol, with no further TLS-related complications. Over subsequent weeks, his tumor continued to shrink dramatically. Pain related to intra-abdominal compression, lower extremity edema, and difficulty voiding resolved.
Discussion
A literature search was performed using Pubmed/Medline and Scopus from 1950 to July 2016 using key words “TLS,” “tumor lysis syndrome,” “pediatric tumor lysis syndrome,” “tumor lysis syndrome in solid malignancies,” “recurrence,” “solid tumor,” “sarcoma,” “rhabdomyosarcoma,” and their combinations. The references of relevant articles were reviewed. Baeksgaard and Sorensen,3 and Vodopivec, et al4 provide an organized review of reported cases of TLS in solid tumors until 2002 and 2011 respectively; their articles are supported by the 2014 literature review by Mirrakhimov, et al.1 Excluding our case, 13 cases of TLS have been described in pediatric patients with solid tumors, with only one occurring in patient with abdominal rhabdomyosarcoma5. Patients’ ages ranged from 2 days to 23 years; the cases are summarized in the following table (TABLE 2). To our knowledge, ours is the first case of TLS reported in association with a pediatric solid tumor recurrence.
It is important to note that the three reported cases of disseminated rhabdomyosarcoma6,7 were initially believed to be hematologic malignancies because of their presentation with lymphadenopathy, metastases to the bone marrow, and spontaneous onset of TLS. Rhabdomyosarcoma with bone marrow involvement without an obvious primary tumor is easily confused with acute leukemia, particularly of the lymphoblastic type.12 However, this disseminated-hematologic presentation of rhabdomyosarcoma differs from the solid abdominal-pelvic tumor, which we describe.
Cairo and Bishop13 categorize patients as either laboratory TLS, depicted by metabolic abnormalities alone, or clinical TLS, occurring when laboratory imbalances lead to significant, life-threatening clinical manifestations. Hyperkalemia may lead to cardiac arrhythmias such as torsades de pointes and cardiac arrest. Obstructive nephropathy can occur from the precipitation of calcium phosphate or uric acid crystals in the renal tubules. Hypocalcemia may cause neuromuscular irritability including tetany, convulsions, and altered mental status.13, 14The 2015 “Guidelines for the management of tumour lysis syndrome in adults and children with haematological malignancies on behalf of the British Committee for Standards in Haematology”4 state there are well-recognized risk factors for the development of TLS including, but not limited to, high tumor burden, tumors with rapid cell turnover, and pre-existing renal impairment. Cairo and Bishop, on behalf of the TLS expert panel consensus of 20102, classify patients as having low-risk disease (LRD), intermediate-risk disease (IRD), or high-risk disease (HRD) based on the risk factors and type of malignancy. All patients with solid tumors are classified into LRD, unless the tumors are bulky or sensitive to chemotherapy, mentioning specifically that neuroblastomas, germ-cell tumors and small cell lung cancers are classified as IRD. Cairo and Bishop take into account the risk factor of renal dysfunction/ involvement, which if present, increases the risk by one level. For example, if the patient has IRD and has renal dysfunction, risk increases to HRD2. However, these guidelines do not mention or address the significance of recurrence in any kind of malignancy with regards to assessing risk for TLS.
The British Committee’s 2015 Guidelines for management of TLS in hematologic malignancies14 provide recommendations for treatment based on the patient’s risk classification (TABLE 3). Children with HRD are recommended to be treated prophylactically with a single dose of 0.2 mg/kg of rasburicase. Patients with IRD are recommended to be offered up to 7 days of allopurinol prophylaxis with increased hydration post initiation of treatment or until risk of TLS has resolved. Patients with LRD are recommended to be managed essentially with close observation. Patients with established TLS should receive rasburicase 0.2 mg/kg/day - duration to depend on clinical response. If the patient is receiving rasburicase, the addition of allopurinol is not recommended, as it has the potential to reduce the effectiveness of rasburicase. Further, rasburicase is to be avoided in patients with glucose-6-phosphate dehydrogenase (G6PD) deficiency14.
Our patient likely developed TLS because of a fast growing tumor that caused significant tumor burden and renal involvement, indicated by an elevated phosphorus level. Despite these risk factors, TLS was not anticipated in the case presented; therefore, a uric acid level was not collected at the time of admission. Review of the literature indicates that the incidence of TLS in a solid tumor recurrence is either unheard of, or is likely under-reported and truly unknown. Further, the TLS expert panel consensus of 20102, which provides guidelines on risk assessment for TLS, does not address the risk of TLS in a malignancy recurrence. The British Committee’s 2015 guidelines14 also do not address hyperuricemia prophylaxis in a solid tumor recurrence.
Our case presents a question regarding the degree of risk for the development of TLS in a solid tumor recurrence. If the guidelines had existed at the time of the case presentation and had been applied, our patient would likely be classified as having IRD because of his renal involvement. This classification would have lead to a different course of management when initiating chemotherapy, likely prevented laboratory TLS, and provided more cost effective treatment, as rasburicase is known to be expensive.
On the other hand, it can also be argued that our patient classifies as LRD, considering the rarity of TLS in a solid tumor recurrence, that the patient had no TLS complication with his initial course of therapy, and also had a normal LDH on admission. LDH is sometimes used to assess risk in hematological malignancies, although it is not used to make the diagnosis of TLS2. However, with such an argument, it is assumed that the risk of TLS in a solid tumor malignancy recurrence, with no previous TLS complication, is less than the risk associated with a new-onset solid tumor malignancy when, truly, the actual risk is not known. Again, the question is raised of the degree of risk for the development of TLS in a case of a malignancy recurrence, and also in a pediatric patient with risk factors.
In our patient’s case, close observation allowed for prompt diagnosis, appropriate treatment of laboratory TLS, and prevented clinical symptoms from developing. However, a screening or baseline uric acid level may have lead to a more conservative approach towards hyperuricemia prophylaxis, similar to treating the patient as IRD. Therefore, we recommend that a screening or baseline uric acid level and LDH level be obtained when initiating chemotherapy, even in patients with LRD.
Our patient was never hyperkalemic, likely because of concomitant administration of furosemide in an attempt to improve his decreased urine output. Hyperuricemia dropped from 19.5 mg/dL to less than 0.5 mg/dL within 24 hours, following two doses of 0.15 mg/kg of rasburicase, confirming the efficacy of this therapy in cases of established TLS, as is recommended by the British Committee’s 2015 guidelines.14
Conclusion
TLS is a relatively rare event in patients with solid malignancies and even more rare in a tumor recurrence. While there is only one previously reported case of TLS occurring in a pediatric patient with abdominal rhabdomyosarcoma, there are not any reported cases to date of TLS occurring in pediatric solid tumor recurrence. This may be because the incidence is truly rare or because cases may be under-reported. Thus, a question is raised regarding the risk for TLS in a solid tumor recurrence, and moreover in a pediatric patient with pre-existing risk factors, such as renal involvement.
TLS remains a life-threatening emergency that can be prevented and reversed if a high index of suspicion is maintained. We recommend all patients with malignancies receiving chemotherapy, especially those with risk factors, have a baseline or screening uric acid and LDH level drawn, as part of the assessment and risk-stratification for TLS which should always be performed. TSJ
Correspondence
References
1. Mirrakhimov AE, Ali AM, Khan M, et al. Tumor lysis syndrome in solid tumors: an up to date review of the literature. Rare Tumors. 2014;6:68-74.
2. Cairo MS, Bertrand C, Reiter A, et al. Recommendation for the evaluation of risk and prophylaxis of tumour lysis syndrome (TLS) in adults and children with malignant diseases: an expert TLS panel consensus. Br J Haematol. 2010;149:578-586.
3. Baeksgaard L, Sorensen JB. Acute tumor lysis syndrome in solid tumors – a case report and review of the literature. Cancer Chemother Pharmacol. 2003;51:187-192.
4. Vodopivec D, Rubio J, Fornoni A, et al. An unusual presentation of tumor lysis syndrome in a patient with advanced gastric adenocarcinoma: case report and literature review. Case Rep Med. 2012;2012:1-12.
5. Khan J, Broadbent VA. Tumor lysis syndrome complicating treatment of widespread metastatic abdominal rhabdomyosarcoma. Pediatr Hematol Oncol. 1993;10:151-155.
6. Bien E, Maciejka-Kapuscinka L, Niedzwiecki M, et al. Childhood rhabdomyosarcoma metastatic to bone marrow presenting with disseminated intravascular coagulation and acute tumour lysis syndrome: review of the literature apropos of two cases. Clin Exp Metastasis. 2010;27:399-407.
7. Patiroglu T, Isik B, Unal E, et al. Cranial metastatic alveolar rhabdomyosarcoma mimicking hematological malignancy in an adolescent boy. Childs Nerv Syst. 2014;30:1737-1741.
8. Hain RD, Rayner L, Weitzman S, et al. Acute tumour lysis syndrome complicating treatment of stage IVS neuroblastoma in infants under six months old. Med Pediatr Oncol. 1994;23:136-139.
9. Kushner BH, LaQuaglia MP, Modak S, et al. Tumor lysis syndrome, neuroblastoma, and correlation between serum lactate dehydrogenase levels and MYCN-amplification. Med Pediatr Oncol. 2003;41:80-82.
10. Bercovitz RS, Greffe BS, Hunger SP. Acute tumor lysis syndrome in a 7-month-old with hepatoblastoma. Curr Opin Pediatr. 2010;22:113-116.
11. Lobe TE, Karkera MS, Custer MD, et al. Fatal refractory hyperkalemia due to tumor lysis during primary resection for hepatoblastoma. J Pediatr Surg. 1990;25:249-250.
12. Sandberg A, Stone J, Czarnecki L, et al. Hematologic Masquerade of Rhabdomyosarcoma. Am J Hematol. 2001;68:51-57
13. Cairo M, Bishop M. Tumour lysis syndrome: new therapeutic strategies and classification. Br J Haematol. 2004;127:3-11.
14. Jones G, Will A, Jackson GH, et al. Guidelines for the management of tumour lysis syndrome in adults and children with haematological malignancies on behalf of the British Committee for Standards in Haematology. Br J Haematol. 2015;169:661-671.
Introduction
Tumor lysis syndrome (TLS) is a life-threatening oncologic emergency that results when massive cell breakdown occurs either spontaneously or in response to cytotoxic chemotherapy. TLS is characterized by metabolic derangements, including hyperkalemia and hyperphosphatemia, secondary to the release of intracellular components into the systemic circulatory system. In addition, purine degradation can lead to hyperuricemia, and precipitation of calcium phosphate can result in hypocalcemia. Lactate dehydrogenase (LDH) levels are often elevated, especially in higher risk patients; however, this finding is not a specific marker for TLS.
TLS more commonly occurs in patients with rapidly proliferating hematological malignancies, such as acute leukemias with a high white blood cell count and Burkitt’s lymphoma, and is a relatively rare event in patients with solid malignancies.1-3 It is even more rare in patients with tumor recurrence.
There are few reported cases of TLS in children with solid malignancies. To our knowledge, only one case of TLS has previously been reported in a pediatric patient with abdominal rhabdomyosarcoma. We report the second such case, and what we believe to be the only reported case of TLS occurring in a pediatric patient with recurrence of a solid tumor.
Case Description
A 15-year-old male from Saudi Arabia presented to our hospital with confirmed stage IV abdominal rhabdomyosarcoma and lung metastases diagnosed in 2012. His initial treatment consisted of complete surgical resection, lung irradiation, and chemotherapy with intercalating cycles of ifosfamide/etoposide and vincristine/doxorubicin/cyclophosphamide, as per the COG-ARST0431 high-risk sarcoma protocol (NCT00354744). He completed treatment without any reported TLS in Saudi Arabia in June 2014. He had no residual tumor at the end of therapy, but six months later he was found to have an abdominal recurrence and started treatment with single-agent topotecan chemotherapy. He experienced worsening abdominal distention, pain, and difficulty voiding, prompting his family to seek further treatment options abroad.
The patient was admitted to our hospital in March 2015. Despite being severely malnourished, he was in stable condition. He was noted to have a markedly enlarged, firm, distended abdomen with dilated veins, abdominal and lower back pain, lower extremity pitting edema, and difficulty urinating.
Initial laboratory findings were unremarkable except for elevated levels of BUN (29 mg/dL), creatinine (1.69 mg/dL), and phosphorus (5.6 mg/dL). MRI revealed a large pelvic mass measuring 15.3 x 15.2 x 21.3 centimeters in transverse, anterior-posterior, and craniocaudal dimensions, respectively; with concomitant severe bilateral hydroureternephrosis (FIGURE 1).
FIGURE 1. Sagittal (A) and Axial (B) T2-weighted MR images of the pelvis (prior to initiating therapy) demonstrating a large heterogeneous mass occupying the entire pelvis. There is evidence of edema involving the soft tissues of the perineum (long arrow) and a large associated hydrocele (short arrow).
Three days following admission, the patient’s urine output decreased and his creatinine level rose rapidly. His worsening abdominal distention was attributed to growing tumor bulk and obstructive nephropathy. He required emergency placement of bilateral nephrostomy tubes. Urine output subsequently improved; although, serum creatinine remained persistently elevated.
Given his worsening condition, chemotherapy was begun three days after nephrostomy tube placement with vinorelbine, cyclophosphamide, and temsirolimus, as per COG-ARST0921 (NCT01222715), at renal-adjusted doses. Laboratory studies approximately 24 hours after chemotherapy initiation demonstrated the presence of TLS (TABLE 1). Potassium level was at the upper end of normal at 4.9 mmol/L, calcium level was decreased to 7.1 mg/dL, phosphorus level elevated to 12 mg/dL, uric acid level was markedly elevated to 19.5 mg/dL, and LDH elevated to 662 unit/L. A dose of 0.15 mg/kg of rasburicase was immediately given with a second dose repeated 14 hours later, after which the uric acid level decreased to less than 0.5 mg/dL. Sevelamer, sodium polystyrene, calcium carbonate, and magnesium gluconate were also administered to treat other electrolyte imbalances. The patient remained at clinical baseline throughout, and the TLS laboratory derangements normalized by three days after the TLS diagnosis; LDH level normalized after one week. The patient continued with chemotherapy, per protocol, with no further TLS-related complications. Over subsequent weeks, his tumor continued to shrink dramatically. Pain related to intra-abdominal compression, lower extremity edema, and difficulty voiding resolved.
Discussion
A literature search was performed using Pubmed/Medline and Scopus from 1950 to July 2016 using key words “TLS,” “tumor lysis syndrome,” “pediatric tumor lysis syndrome,” “tumor lysis syndrome in solid malignancies,” “recurrence,” “solid tumor,” “sarcoma,” “rhabdomyosarcoma,” and their combinations. The references of relevant articles were reviewed. Baeksgaard and Sorensen,3 and Vodopivec, et al4 provide an organized review of reported cases of TLS in solid tumors until 2002 and 2011 respectively; their articles are supported by the 2014 literature review by Mirrakhimov, et al.1 Excluding our case, 13 cases of TLS have been described in pediatric patients with solid tumors, with only one occurring in patient with abdominal rhabdomyosarcoma5. Patients’ ages ranged from 2 days to 23 years; the cases are summarized in the following table (TABLE 2). To our knowledge, ours is the first case of TLS reported in association with a pediatric solid tumor recurrence.
It is important to note that the three reported cases of disseminated rhabdomyosarcoma6,7 were initially believed to be hematologic malignancies because of their presentation with lymphadenopathy, metastases to the bone marrow, and spontaneous onset of TLS. Rhabdomyosarcoma with bone marrow involvement without an obvious primary tumor is easily confused with acute leukemia, particularly of the lymphoblastic type.12 However, this disseminated-hematologic presentation of rhabdomyosarcoma differs from the solid abdominal-pelvic tumor, which we describe.
Cairo and Bishop13 categorize patients as either laboratory TLS, depicted by metabolic abnormalities alone, or clinical TLS, occurring when laboratory imbalances lead to significant, life-threatening clinical manifestations. Hyperkalemia may lead to cardiac arrhythmias such as torsades de pointes and cardiac arrest. Obstructive nephropathy can occur from the precipitation of calcium phosphate or uric acid crystals in the renal tubules. Hypocalcemia may cause neuromuscular irritability including tetany, convulsions, and altered mental status.13, 14The 2015 “Guidelines for the management of tumour lysis syndrome in adults and children with haematological malignancies on behalf of the British Committee for Standards in Haematology”4 state there are well-recognized risk factors for the development of TLS including, but not limited to, high tumor burden, tumors with rapid cell turnover, and pre-existing renal impairment. Cairo and Bishop, on behalf of the TLS expert panel consensus of 20102, classify patients as having low-risk disease (LRD), intermediate-risk disease (IRD), or high-risk disease (HRD) based on the risk factors and type of malignancy. All patients with solid tumors are classified into LRD, unless the tumors are bulky or sensitive to chemotherapy, mentioning specifically that neuroblastomas, germ-cell tumors and small cell lung cancers are classified as IRD. Cairo and Bishop take into account the risk factor of renal dysfunction/ involvement, which if present, increases the risk by one level. For example, if the patient has IRD and has renal dysfunction, risk increases to HRD2. However, these guidelines do not mention or address the significance of recurrence in any kind of malignancy with regards to assessing risk for TLS.
The British Committee’s 2015 Guidelines for management of TLS in hematologic malignancies14 provide recommendations for treatment based on the patient’s risk classification (TABLE 3). Children with HRD are recommended to be treated prophylactically with a single dose of 0.2 mg/kg of rasburicase. Patients with IRD are recommended to be offered up to 7 days of allopurinol prophylaxis with increased hydration post initiation of treatment or until risk of TLS has resolved. Patients with LRD are recommended to be managed essentially with close observation. Patients with established TLS should receive rasburicase 0.2 mg/kg/day - duration to depend on clinical response. If the patient is receiving rasburicase, the addition of allopurinol is not recommended, as it has the potential to reduce the effectiveness of rasburicase. Further, rasburicase is to be avoided in patients with glucose-6-phosphate dehydrogenase (G6PD) deficiency14.
Our patient likely developed TLS because of a fast growing tumor that caused significant tumor burden and renal involvement, indicated by an elevated phosphorus level. Despite these risk factors, TLS was not anticipated in the case presented; therefore, a uric acid level was not collected at the time of admission. Review of the literature indicates that the incidence of TLS in a solid tumor recurrence is either unheard of, or is likely under-reported and truly unknown. Further, the TLS expert panel consensus of 20102, which provides guidelines on risk assessment for TLS, does not address the risk of TLS in a malignancy recurrence. The British Committee’s 2015 guidelines14 also do not address hyperuricemia prophylaxis in a solid tumor recurrence.
Our case presents a question regarding the degree of risk for the development of TLS in a solid tumor recurrence. If the guidelines had existed at the time of the case presentation and had been applied, our patient would likely be classified as having IRD because of his renal involvement. This classification would have lead to a different course of management when initiating chemotherapy, likely prevented laboratory TLS, and provided more cost effective treatment, as rasburicase is known to be expensive.
On the other hand, it can also be argued that our patient classifies as LRD, considering the rarity of TLS in a solid tumor recurrence, that the patient had no TLS complication with his initial course of therapy, and also had a normal LDH on admission. LDH is sometimes used to assess risk in hematological malignancies, although it is not used to make the diagnosis of TLS2. However, with such an argument, it is assumed that the risk of TLS in a solid tumor malignancy recurrence, with no previous TLS complication, is less than the risk associated with a new-onset solid tumor malignancy when, truly, the actual risk is not known. Again, the question is raised of the degree of risk for the development of TLS in a case of a malignancy recurrence, and also in a pediatric patient with risk factors.
In our patient’s case, close observation allowed for prompt diagnosis, appropriate treatment of laboratory TLS, and prevented clinical symptoms from developing. However, a screening or baseline uric acid level may have lead to a more conservative approach towards hyperuricemia prophylaxis, similar to treating the patient as IRD. Therefore, we recommend that a screening or baseline uric acid level and LDH level be obtained when initiating chemotherapy, even in patients with LRD.
Our patient was never hyperkalemic, likely because of concomitant administration of furosemide in an attempt to improve his decreased urine output. Hyperuricemia dropped from 19.5 mg/dL to less than 0.5 mg/dL within 24 hours, following two doses of 0.15 mg/kg of rasburicase, confirming the efficacy of this therapy in cases of established TLS, as is recommended by the British Committee’s 2015 guidelines.14
Conclusion
TLS is a relatively rare event in patients with solid malignancies and even more rare in a tumor recurrence. While there is only one previously reported case of TLS occurring in a pediatric patient with abdominal rhabdomyosarcoma, there are not any reported cases to date of TLS occurring in pediatric solid tumor recurrence. This may be because the incidence is truly rare or because cases may be under-reported. Thus, a question is raised regarding the risk for TLS in a solid tumor recurrence, and moreover in a pediatric patient with pre-existing risk factors, such as renal involvement.
TLS remains a life-threatening emergency that can be prevented and reversed if a high index of suspicion is maintained. We recommend all patients with malignancies receiving chemotherapy, especially those with risk factors, have a baseline or screening uric acid and LDH level drawn, as part of the assessment and risk-stratification for TLS which should always be performed. TSJ
Correspondence
References
1. Mirrakhimov AE, Ali AM, Khan M, et al. Tumor lysis syndrome in solid tumors: an up to date review of the literature. Rare Tumors. 2014;6:68-74.
2. Cairo MS, Bertrand C, Reiter A, et al. Recommendation for the evaluation of risk and prophylaxis of tumour lysis syndrome (TLS) in adults and children with malignant diseases: an expert TLS panel consensus. Br J Haematol. 2010;149:578-586.
3. Baeksgaard L, Sorensen JB. Acute tumor lysis syndrome in solid tumors – a case report and review of the literature. Cancer Chemother Pharmacol. 2003;51:187-192.
4. Vodopivec D, Rubio J, Fornoni A, et al. An unusual presentation of tumor lysis syndrome in a patient with advanced gastric adenocarcinoma: case report and literature review. Case Rep Med. 2012;2012:1-12.
5. Khan J, Broadbent VA. Tumor lysis syndrome complicating treatment of widespread metastatic abdominal rhabdomyosarcoma. Pediatr Hematol Oncol. 1993;10:151-155.
6. Bien E, Maciejka-Kapuscinka L, Niedzwiecki M, et al. Childhood rhabdomyosarcoma metastatic to bone marrow presenting with disseminated intravascular coagulation and acute tumour lysis syndrome: review of the literature apropos of two cases. Clin Exp Metastasis. 2010;27:399-407.
7. Patiroglu T, Isik B, Unal E, et al. Cranial metastatic alveolar rhabdomyosarcoma mimicking hematological malignancy in an adolescent boy. Childs Nerv Syst. 2014;30:1737-1741.
8. Hain RD, Rayner L, Weitzman S, et al. Acute tumour lysis syndrome complicating treatment of stage IVS neuroblastoma in infants under six months old. Med Pediatr Oncol. 1994;23:136-139.
9. Kushner BH, LaQuaglia MP, Modak S, et al. Tumor lysis syndrome, neuroblastoma, and correlation between serum lactate dehydrogenase levels and MYCN-amplification. Med Pediatr Oncol. 2003;41:80-82.
10. Bercovitz RS, Greffe BS, Hunger SP. Acute tumor lysis syndrome in a 7-month-old with hepatoblastoma. Curr Opin Pediatr. 2010;22:113-116.
11. Lobe TE, Karkera MS, Custer MD, et al. Fatal refractory hyperkalemia due to tumor lysis during primary resection for hepatoblastoma. J Pediatr Surg. 1990;25:249-250.
12. Sandberg A, Stone J, Czarnecki L, et al. Hematologic Masquerade of Rhabdomyosarcoma. Am J Hematol. 2001;68:51-57
13. Cairo M, Bishop M. Tumour lysis syndrome: new therapeutic strategies and classification. Br J Haematol. 2004;127:3-11.
14. Jones G, Will A, Jackson GH, et al. Guidelines for the management of tumour lysis syndrome in adults and children with haematological malignancies on behalf of the British Committee for Standards in Haematology. Br J Haematol. 2015;169:661-671.
Onodera’s Prognostic Nutritional Index in soft tissue sarcoma patients as a predictor of wound complications
Background The ability to predict a wound complication after radiation therapy and surgery for soft tissue sarcomas remains difficult. Preoperative nutritional status, as determined by Onodera’s Prognostic Nutritional Index (OPNI), has been a predictor of complications in patients undergoing gastrointestinal surgery. However, the role OPNI has in predicting wound complications for soft tissue sarcoma remains unknown.
Objective To evaluate the role OPNI has in predicting wound complication in patients treated with radiation and surgery for soft tissue sarcomas.
Methods OPNI was calculated based on the published formula OPNI = (10*albumin level [g/dL]) + (0.005*total lymphocyte count). The albumin level and total lymphocyte counts closest to the index operation were chosen. Major and minor wound complications were identified. A receiver operating curve was calculated to identify a cut-off point value for OPNI and for age based on the best combination of sensitivity and specificity.
Results 44 patients were included in the study. Patients with an OPNI of <45.4 had a 7.5-times increased risk of a wound complication (P = .005; 95% confidence interval [CI], 1.8-31.0). An OPNI of <45.4 had a sensitivity of 62% and specificity of 82% of predicting a wound complication. Being older than 73 years was associated with a 6.8-times increased risk of wound complications (P = .01; 95% CI, 1.6-28.7).
Limitations Small sample size for patients with a rare condition
Conclusion An OPNI of <45.4 and being older than 73 years are strong predictors of which patients will have a wound complication after radiation therapy for soft tissue sarcomas. Preoperative nutritional status could be an important modifiable factor to help decrease wound complications.
Wound complications after pre- or post-operative radiation for soft tissue sarcomas are well established.1 The ability to predict who will have a wound complication remains difficult. Some studies have looked at risk factors such as smoking, and the preoperative nutritional status of patients has been identified as a risk factor for wound complication in patients with elective orthopedic surgical procedures.2 One validated method of measuring preoperative nutritional status in patients with gastrointestinal malignant tumors has been with Onodera’s Prognostic Nutritional Index (OPNI). It uses the patient’s preoperative albumin (g/dL) and absolute lymphocyte values (per mm3). The prognostic value of the OPNI has been demonstrated in patients with colorectal, esophageal, and gastric cancers, and has been shown to be prognostic for postoperative wound healing and overall prognosis.3-5 In this study, we investigate the significance of preoperative nutritional status, measured by OPNI, as a predictor of wound complications in patients treated with pre- or postoperative radiation for soft tissue sarcoma.
Methods
After receiving Institutional Review Board approval for the study, we conducted a retrospective review of consecutive patients treated during July 2012-April 2016 for a soft tissue sarcoma by the orthopedic oncology division at Cooper University Hospital in Camden, New Jersey. Inclusion criteria were patients with biopsy-proven soft tissue sarcoma, who were older than 18 years, had received pre- or postoperative radiation, and who had a recorded preoperative albumin and total lymphocyte count. A minimum follow-up of 3 months was required to assess for postoperative wound complications. Exclusion criteria included patients who had a bone sarcoma, had not received radiation therapy, or had a missing preoperative albumin or total lymphocyte count.
All of the surgeries were performed by 2 fellowshiptrained orthopedic oncologists. Patients received either pre- or postoperative radiation therapy by multiple radiation oncologists.
The OPNI was calculated based on the published formula OPNI = (10*albumin level [g/dL]) + (0.005*total lymphocyte count [per mm3]). The albumin level and total lymphocyte counts closest to the index operation were chosen.
Demographic information including gender, age at diagnosis, height, and weight were recorded. Data related to the patients’ pathologic diagnosis, stage at presentation, radiation therapy, and surgical resection were collected. A minor wound complication was defined as a wound problem that did not require operative intervention. Major wound complication was defined as a complication requiring operative intervention with or without flap reconstruction. Wound complications occurring within the 3-month postoperative period were considered.
Univariate and multiple variable analysis was performed. A P value <.05 was considered significant. A receiver operating curve as well as recursive partitioning was performed for OPNI and age to determine the best cut-off point to use in the analysis. The Sobel test was used to evaluate mediation. All statistical analysis was performed using SAS v9.4 and JMP10. (SAS Institute, Cary, NC).
Results
In all, 44 patients (28 men, 16 women) were included in the study. Their mean age was 61.2 years (range, 19-94). The average size of the tumors was 8.5 cm in greatest dimension (range, 1.2-27.4 cm), and all of the patients had nonmetastatic disease at the time of surgical resection; 37 patients had R0 resections, and 7 patients had a positive margin from an outside hospital, but obtained R0 resections on a subsequent resection (Table 1 and Table 2). In all, 30 patients received preoperative radiation, 14 patients received postoperative radiation, 32 patients received external beam radiation, 8 received Cyberknife treatment, and information for 4 patients was not unavailable. Mean preoperative external beam radiation and Cyberknife dose was 4,931 Gy and 3,750 Gy, respectively. Mean postoperative external beam and Cyberknife radiation dose was 6,077 Gy and 4,000 Gy, respectively. When evaluating radiation dose delivered between those who had wound complications and those who did not, there was no significant difference (Table 3).
Of the total, 13 patients had a wound complication (30%). Ten patients had preoperative radiation, and 3 had postoperative radiation. Ten patients had major wound complications requiring a combined 27 surgeries. Three patients had minor wound complications, which resolved with conservative management. One patient had a major wound complication in the group that had an initial R1 resection.
The OPNI was calculated based on the aforementioned formula. When the univariate analysis was performed, only age and OPNI were statistically significant. Patients older than 72.6 years had a 6.8 times higher risk of a wound complication (P = .01; 95% confidence interval [CI], 1.6-28.7). When the OPNI value of 45.4 was used as the threshold, a patient with a preoperative OPNI value of <45.4 had a 7.5 times increased risk of developing a wound complication (P = .005; 95% CI, 1.8-31.0).
When the receiver operating curve and recursive partitioning was performed, an OPNI value of 45.4 showed a sensitivity of 62% and specificity of 82% in predicting wound complications (Figure 1).
When a multiple variable analysis was performed, OPNI and age were not statistically significant (P = .06 and P = .11, respectively). A test for mediation was performed, and the OPNI seemed to mediate the effect age has on wound complications, accounting for 36% of the total effect (Sobel test statistic, 1.79; P = .07).
Discussion
Wound complications after pre- and postoperative radiation for soft tissue sarcomas are well known. The best study to date to demonstrate that relationship was a randomized controlled trial performed in Canada, which showed that preoperative radiation resulted in 37% wound complications, compared with 17% for postoperative radiation.6 In that study, of the wound complications in both radiation types, more than 50%-60% required a secondary surgical procedure, designating it as a major wound complication. Other variables that have been shown to contribute to wound complications include being older than 40 years and/or having large tumors, diabetes, peripheral vascular disease, and begin a smoker.7-10
In our study, we applied OPNI to orthopedic oncology and showed that the patient’s age and preoperative nutritional status were significant predictors of developing a wound complication. An OPNI of <45.4 increased the chance of a wound complication by 7.5 times. Being older than 73 years increased the risk of a wound complication by 6.8 times. Most of these wound complications were major and required surgical intervention.
In general surgical oncology, the evaluation of nutritional status has had a significant impact on the care of patients, especially for those patients undergoing gastrointestinal surgery. The OPNI was initially designed to assess the nutritional and immunological statuses of patients undergoing gastrointestinal surgery.11 Preoperative OPNI has been shown to be a good predictor of postoperative complications and survival in patients with colorectal cancer, malignant mesothelioma, hepatocellular carcinoma and in patients who undergo total gastrectomy.12-15 Chen and colleagues evaluated the significance of OPNI in patients with colorectal cancer. They found an optimal cut-off value of 45. An OPNI value <45 has a sensitivity and specificity of 85% and 69%, respectively, in predicting 5-year overall survival.16 Hong and colleagues noted that an OPNI cut-off value of 52.6 as a predictor of overall survival.17
Poor preoperative nutritional status has been shown to have a negative impact on wound healing. In patients who underwent emergency laparotomy, a low OPNI had significantly higher rates of wound dehiscence and infection.18 This happens because protein deficiency leads to decreased wound tensile strength, decreased T-cell function, decreased phagocytic activity, which ultimately diminish the patient’s ability to heal and defend against wound infections.19-21
In soft tissue sarcoma patients, poor preoperative nutritional status is further compromised by radiation therapy to the wound. Gu and colleagues showed that radiation to wounds in mice showed early inhibition of the inflammatory phase, injury and inhibition of fibroblasts, and collagen formation, and then prolonged re-epithelialization.22 This “double hit” with radiation onto host tissue that is already nutritionally compromised could be an important cause of why wound complications occur at such high rates in our soft tissue sarcoma patients.
There are several limitations to this study. First, the study has a small sample size, which was a direct result of the number of patients who were excluded because an OPNI value could not be calculated for them. Second, we could not determine if the OPNI was more valuable in patients who underwent pre- or postoperative radiation. This study did not look at other nutritional indices such as prealbumin and vitamin levels. Third, the radiation was provided by different providers, so technique was variable, but the patients received nearly equivalent doses and variability in technique is likely limited. Fourth, we were not able to meaningfully analyze the role of chemotherapy in this patient population because there was a significant heterogeneity of patients receiving pre- and postoperative chemotherapy.
Our findings strongly suggest that a preoperative OPNI of <45.4 and being older than 73 years are strong predictors of patients who will experience a wound complication after radiation therapy for soft tissue sarcomas. This study has led us to start measuring preoperative albumin levels and assess complete metabolic panels. Our goal is to identify patients who are at high risk of wound complication and perform interventions to improve nutrition, then to study whether the interventions help lower the rates of wound complications. TSJ
Correspondence
References
1. Ormsby MV, Hilaris BS, Nori D, Brennan MF. Wound complications of adjuvant radiation therapy in patients with soft-tissue sarcomas. Ann Surg. 1989;210(1):93-99.
2. Greene KA, Wilde AH, Stulberg BN. Preoperative nutritional status of total joint patients: relationship to postoperative wound complications. J Arthroplasty. 1991;6(4):321-325.
3. Nozoe T, Kimura Y, Ishida M, Saeki H, Korenaga D, Sugimachi K. Correlation of pre-operative nutritional condition with post-operative complications in surgical treatment for oesophageal carcinoma. Eur J Surg Oncol. 2002;28(4):396-400.
4. Nozoe T, Kohno M, Iguchi T, et al. The prognostic nutritional index can be a prognostic indicator in colorectal carcinoma. Surg Today. 2012;42(6):532-535.
5. Nozoe T, Ninomiya M, Maeda T, Matsukuma A, Nakashima H, Ezaki T. Prognostic nutritional index: a tool to predict the biological aggressiveness of gastric carcinoma. Surg Today. 2010;40(5):440-443.
6. O’Sullivan B, Davis AM, Turcotte R, Bell R, Catton C, Chabot P, et al. Preoperative versus postoperative radiotherapy in soft-tissue sarcoma of the limbs: a randomised trial. Lancet. 2002;359(9325):2235-2241.
7. Peat BG, Bell RS, Davis A, et al. Wound-healing complications after soft-tissue sarcoma surgery. Plast Reconstr Surg. 1994;93(5):980-987.
8. Kunisada T, Ngan SY, Powell G, Choong PF. Wound complications following pre-operative radiotherapy for soft tissue sarcoma. Eur J Surg Oncol. 2002;28(1):75-79.
9. Saddegh MK, Bauer HC. Wound complication in surgery of soft tissue sarcoma: analysis of 103 consecutive patients managed without adjuvant therapy. Clin Orthop Relat Res. 1993;289:247-253.
10. Tseng JF, Ballo MT, Langstein HN, et al. The effect of preoperative radiotherapy and reconstructive surgery on wound complications after resection of extremity soft-tissue sarcomas. Ann Surg Oncol. 2006;13(9):1209-1215.
11. Smale BF, Mullen JL, Buzby GP, Rosato EF. The efficacy of nutritional assessment and support in cancer surgery. Cancer. 1981;47(10):2375-2381.
12. Mohri Y, Inoue Y, Tanaka K, Hiro J, Uchida K, Kusunoki M. Prognostic nutritional index predicts postoperative outcome in colorectal cancer. World J Surg. 2013;37(11):2688-2692.
13. Jiang N, Deng JY, Ding XW, et al. Prognostic nutritional index predicts postoperative complications and long-term outcomes of gastric cancer. World J Gastroenterol. 2014;20(30):10537-10544.
14. Pinato DJ, North BV, Sharma R. A novel, externally validated inflammation-based prognostic algorithm in hepatocellular carcinoma: the prognostic nutritional index (PNI). Brit J Cancer. 2012;106(8):1439-1445.
15. Yao ZH, Tian GY, Wan YY, et al. Prognostic nutritional index predicts outcomes of malignant pleural mesothelioma. J Cancer Res Clin Oncol. 2013;139(12):2117-2123.
16. Jian-Hui C, Iskandar EA, Cai Sh I, et al. Significance of Onodera’s prognostic nutritional index in patients with colorectal cancer: a large cohort study in a single Chinese institution. Tumour Biol. 2016;37(3):3277-3283.
17. Hong S, Zhou T, Fang W, et al. The prognostic nutritional index (PNI) predicts overall survival of small-cell lung cancer patients. Tumour Biol. 2015;36(5):3389-9337.
18. Mohil RS, Agarwal A, Singh N, Arora J, Bhatnagar D. Does nutritional status play a role in patients undergoing emergency laparotomy? E Spen Eur E J Clin Nutr Metab. 2008;3(5):e226-e231.
19. Kay SP, Moreland JR, Schmitter E. Nutritional status and wound healing in lower extremity amputations. Clin Orthop Relat Res. 1987;(217):253-256.
20. Dickhaut SC, DeLee JC, Page CP. Nutritional status: importance in predicting wound-healing after amputation. J Bone Joint Surg Am. 1984;66(1):71-75.
21. Casey J, Flinn WR, Yao JS, Fahey V, Pawlowski J, Bergan JJ. Correlation of immune and nutritional status with wound complications in patients undergoing vascular operations. Surgery. 1983;93(6):822-827.
22. Gu Q, Wang D, Cui C, Gao Y, Xia G, Cui X. Effects of radiation on wound healing. J Environ Pathol Toxicol Oncol. 1998;17(2):117-123.
Cardiac pleomorphic sarcoma after placement of a Dacron graft
Primary cardiac tumors, either benign or malignant, are very rare. The combined incidence is 0.002% on pooled autopsy series.1 The benign tumors account for 63% of primary cardiac tumors and include myxoma, the most common, and followed by papillary fibroelastoma, fibroma, and hemangioma. The remaining 37% are malignant tumors, essentially predominated by sarcomas.1
Although myxoma is the most common tumor arising in the left atrium, we present a case that shows that sarcoma can also arise from the same chamber. In fact, sarcomas could mimic cardiac myxoma.2 The cardiac sarcomas can have similar clinical presentation and more importantly can share similar histopathological features. Sarcomas may have myxoid features.2 Cases diagnosed as cardiac myxomas should be diligently worked up to rule out the presence of sarcomas with myxoid features. In addition, foreign bodies have been found to induce sarcomas in experimental animals.3,4 In particular, 2 case reports have described sarcomas arising in association with Dacron vascular prostheses in humans.5,6 We present here the case of a patient who was diagnosed with cardiac pleomorphic sarcoma 8 years after the placement of a Dacron graft.
Case presentation and summary
A 56-year-old woman with history of left atrial myxoma status after resection in 2005 and placement of a Dacron graft, morbid obesity, hypertension, and asthma presented to the emergency department with progressively worsening shortness of breath and blurry vision over period of 2 months. Acute coronary syndrome was ruled out by electrocardiogram and serial biomarkers. A computed-tomography angiogram was pursued because of her history of left atrial myxoma, and the results suggested the presence of a left atrial tumor. She underwent a transesophageal echocardiogram, which confirmed the presence of a large left atrial mass that likely was attached to the interatrial septum prolapsing across the mitral valve and was suggestive for recurrent left atrial myxoma (Figure 1). The results of a cardiac catheterization showed normal coronaries.
The patient subsequently underwent an excision of the left atrial tumor with profound internal and external myocardial cooling using antegrade blood cardioplegia under mildly hypothermic cardiopulmonary bypass. Frozen sections showed high-grade malignancy in favor of sarcoma. The hematoxylin and eosin stained permanent sections showed sheets of malignant pleomorphic spindle cells focally arranged in a storiform pattern. There were areas of necrosis and abundant mitotic activity. By immunohistochemical (IHC) stains, the tumor cells were diffusely positive for vimentin, and negative for pan-cytokeratin antibody (AE1/AE3), S-100 protein, Melan-A antibody, HMB45, CD34, CD31, myogenin, and MYOD1. IHC stains for CK-OSCAR, desmin, and smooth muscle actin were focally positive, and a ki-67 stain showed a proliferation index of about 80%. The histologic and IHC findings were consistent with a final diagnosis of high-grade undifferentiated pleomorphic sarcoma (Figure 2).
A positron emission tomography scan performed November 2013 did not show any other activity. The patient was scheduled for chemotherapy with adriamycin and ifosfamide with a plan for total of 6 cycles. Before her admission for the chemotherapy, the patient was admitted to the hospital for atrial fibrillation with rapid ventricular response and had multiple complications requiring prolonged hospitalization and rehabilitation. Repeat imaging 2 months later showed diffuse metastatic disease. However, her performance status had declined and she was not eligible for chemotherapy. She was placed under hospice care.
Discussion
This case demonstrates development of a cardiac pleomorphic sarcoma, a rare tumor, after placement of a Dacron graft. Given that foreign bodies have been found to induce sarcomas in experimental animals,3,4 and a few case reports have described sarcomas arising in association with Dacron vascular prostheses, 5-10 it seems that an exuberant host response around the foreign body might represent an important intermediate step in the development of the sarcoma.
There is no clearly defined pathogenesis that explains the link between a Dacron graft and sarcomas. In 1950s, Oppenheimer and colleagues described the formation of malignant tumors by various types of plastics, including Dacron, that were embedded in rats. 3,4 Most of the tumors were some form of sarcomas. It was inferred that physical properties of the plastics may have some role in tumor development. Plastics in sheet form or film that remained in situ for more than 6 months induced significant number of tumors compared with other forms such as sponges, films with holes, or powders.3,4 The 3-dimensional polymeric structure of the Dacron graft seems to play a role in induction of sarcoma as well. A pore diameter of less than 0.4 mm may increase tumorigenicity.11 The removal of the material before the 6-month mark does not lead to malignant tumors, which further supports the link between Dacron graft and formation of tumor. A pocket is formed around the foreign material after a certain period, as has been shown in histologic studies as the site of tumor origin.9,10
At the molecular level, the MDM-2/p53 pathway has been cited as possible mechanism for pathogenesis of intimal sarcoma.12,13 It has been suggested that endothelial dysplasia occurs as a precursor lesion in these sarcomas.14 The Dacron graft may cause a dysplastic effect on the endothelium leading to this precursor lesion and in certain cases transforming into sarcoma. Further definitive studies are required.
The primary treatment for cardiac sarcoma is surgical removal, although it is not always feasible. Findings in a Mayo clinic study showed that the median survival was 17 months for patients who underwent complete surgical excision, compared with 6 months for those who complete resection was not possible.15 In addition, a 10% survival rate at 1 year has been reported in primary cardiac sarcomas that are treated without any type of surgery.16
There is no clear-cut evidence supporting or refuting adjuvant chemotherapy for cardiac sarcoma. Some have inferred a potential benefit of adjuvant chemotherapy although definitive conclusions cannot be drawn. The median survival was 16.5 months in a case series of patients who received adjuvant chemotherapy, compared with 9 months and 11 months in 2 other case series.17,18,19 Multiple chemotherapy regimens have been used in the past for treatment. A retrospective s
Radiation showed some benefit in progression-free survival in a French retrospective study.21 Radiation therapies have been tried in other cases, as well in addition to chemotherapy. However, there is not enough data to support or refute it at this time.15,17,20 Several sporadic cases reported show benefit of cardiac transplantation.21,22
Conclusion
In consideration of the placement of the Dacron graft 8 years before the tumor occurrence, the anatomic proximity of the tumor to the Dacron graft, and the association between sarcoma with Dacron in medical literature, it seems logical to infer that this unusual malignancy in our patient is associated with the Dacron prosthesis. TSJ
Correspondence
1. Patil HR, Singh D, Hajdu M. Cardiac sarcoma presenting as heart failure and diagnosed as recurrent myxoma by echocardiogram. Eur J Echocardiogr. 2010;11(4):E12.
2. Awamleh P, Alberca MT, Gamallo C, Enrech S, Sarraj A. Left atrium myxosarcoma: an exceptional cardiac malignant primary tumor. Clin Cardiol. 2007;30(6):306-308.
3. Oppenheimer BS, Oppenheimer ET, Stout AP, Danishefsky I. Malignant tumors resulting from embedding plastics in rodents. Science. 1953;118:305-306.
4. Oppenheimer BS, Oppenheimer ET, Stout AP, Willhite M, Danishefski, I. The latent period in carcinogenesis by plastics in rats and its relation to the presarcomatous stage. Cancer. 1958;11(1):204-213.
5. Almeida NJ, Hoang P, Biddle P, Arouni A, Esterbrooks D. Primary cardiac angiosarcoma: in a patient with a Dacron aortic prosthesis. Tex Heart Inst J. 2011;38(1):61-65; discussion 65.
6. Stewart B, Manglik N, Zhao B, et al. Aortic intimal sarcoma: report of two cases with immunohistochemical analysis for pathogenesis. Cardiovasc Pathol. 2013;22(5):351-356.
7. Umscheid TW, Rouhani G, Morlang T, et al. Hemangiosarcoma after endovascular aortic aneurysm repair. J Endovasc Ther. 2007;14(1):101-105.
8. Ben-Izhak O, Vlodavsky E, Ofer A, Engel A, Nitecky S, Hoffman A. Epithelioid angiosarcoma associated with a Dacron vascular graft. Am J Surg Pathol. 1999;23(11):1418-1422.
9. Fyfe BS, Quintana CS, Kaneko M, Griepp RB. Aortic sarcoma four years after Dacron graft insertion. Ann Thorac Surg. 1994;58(6):1752-1754.
10. O’Connell TX, Fee HJ, Golding A. Sarcoma associated with Dacron prosthetic material: case report and review of the literature. J Thorac Cardiovasc Surg. 1976;72(1):94-96.
11. Karp RD, Johnson KH, Buoen LC, et al. Tumorogenesis by millipore filters in mice: histology and ultastructure of tissue reactions, as related to pore size. J Natl Cancer Inst. 1973;51:1275-1285.
12. Bode-Lesniewska B, Zhao J, Speel EJ, et al. Gains of 12q13-14 and overexpression of mdm2 are frequent findings in intimal sarcomas of the pulmonary artery. Virchows Arch. 2001;438:57-65.
13. Zeitz C, Rossle M, Haas C, et al. MDM-2 oncoprotein overexpression, p53 gene mutation, and VEGF up-regulation in angiosarcomas. Am J Surg Pathol. 1998;153:1425-1433.
14. Haber LM, Truong L. Immunohistochemical demonstration of the endothelialnature of aortic intimal sarcoma. Am J Surg Pathol. 1988 Oct;12(10):798-802. PubMed PMID: 3138923.
15. Simpson L, Kumar SK, Okuno SH, et al. Malignant primary cardiac tumors: review of a single institution experience. Cancer. 2008;112(11):2440-2446.
16. Leja MJ, Shah DJ, Reardon MJ. Primary cardiac tumors. Tex Heart Inst J. 2011;38(3):261-262.
17. Donsbeck AV, Ranchere D, Coindre JM, Le Gall F, Cordier JF, Loire R. Primary cardiac sarcomas: an immunohistochemical and grading study with long-term follow-up of 24 cases. Histopathology. 1999;34(4):295-304.
18. Putnam JB, Sweeney MS, Colon R, Lanza LA, Frazier OH, Cooley DC. Primary cardiac sarcomas. Ann Thorac Surg. 1990; 51; 906-910.
19. Murphy WR, Sweeney MS, Putnam JB et al. Surgical treatment of cardiac tumors: a 25-year experience. Ann Thorac Surg. 1990;49;612-618.
20. Llombart-Cussac A, Pivot X, Contesso G, et al. Adjuvant chemotherapy for primary cardiac sarcomas: the IGR experience. Br J Cancer. 1998;78(12):1624-1628.
21. Isambert N, Ray-Coquard I, Italiano A, et al. Primary cardiac sarcomas: a retrospective study of the French Sarcoma Group. Eur J Cancer. 2014;50(1):128-136.
22. Agaimy A, Rösch J, Weyand M, Strecker T. Primary and metastatic cardiac sarcomas: a 12-year experience at a German heart center. Int J Clin Exp Pathol. 2012;5(9):928-938.
Know the danger signs of CVI and VTE in pregnant patients
A new review of the literature on chronic venous insufficiency in pregnant women reveals considerable guidance for their treatment. CVI occurs in up to 80% of pregnant women, while around 7 of every 1,000 pregnant mothers face venous thromboembolism and pulmonary embolism.
As reported in the March edition of the Journal of Vascular Surgery: Venous and Lymphatic Disorders, clinicians from Johns Hopkins Hospital and the Greater Baltimore Medical Center led by vascular surgeon Dr. Jennifer Heller, analyzed 80 studies related to pregnancy, VTE and CVI.
Pregnancy causes significant hemodynamic changes within the circulatory system. While these are considered essential for the health of the developing fetus, the changes place considerable stress on the expectant mother’s heart and lower extremity veins.
Chronic venous insufficiency (CVI), marked by varicose veins, pain, edema, itching, skin discoloration, night cramps and heaviness are all common, particularly during the third trimester. Venous thromboembolism (VTE) and pulmonary embolism (PE) affects pregnant women nearly five times more than non-pregnant women. In fact, VTE is the number one cause of maternal death in developing countries.
With regards to the hemodynamic and physiologic changes, the review reveals pregnancy:
- Decreases systemic vascular resistance
- Increases heart rate
- Increases cardiac output
- Decreases deep venous blood flow
- Increases deep vein diameters, and
- Induces a hypercoagulable state
Treatment strategies for primary CVI in pregnancy, which occurs in up to 80% of women, were reviewed and include indications for non-pharmacologic therapies (compression, reflexology, water emersion), and pharmacologic treatments (non-steroidal anti-inflammatory drugs, fondaparinux, and low-molecular-weight heparin).
With an incidence up to 7 per 1,000 pregnancies, acute VTE remains an important issue in pregnancy. The authors provided a thorough review of VTE prevention during pregnancy, and VTE treatment during pregnancy (including indications for caval filters and management of iliofemoral thrombosis).
“It is important for physicians to comprehend the full extent of the hemodynamic factors that contribute to the increased risk of lower extremity venous disease as well as the most appropriate and effective evidence-based management options,” stated Dr. Heller. “While prophylaxis and treatment of VTE has been extensively studied in pregnancy, further research is required to look at the potential effectiveness and long-term safety profiles of new oral anticoagulants in the mother and fetus.”
She also hopes that future randomized trials will evaluate treatment strategies to relieve symptoms associated with chronic venous insufficiency during pregnancy.
Complete understanding of these issues helps physicians prepare their patients for these eventualities during pregnancy and treat venous complications effectively.
To download the complete article, open access through April 30, click here.
RAS Inhibitors Show Promise for CLTI Patients After Interventions
Physicians should consider prescribing high-dose angiotensin inhibitors for patients with chronic limb-threatening ischemia (CLTI), a recent study from Harvard University suggests.
The report was published in the March edition of the Journal of Vascular Surgery by researchers from the Division of Vascular and Endovascular Surgery from the Beth Israel Deaconess Medical Center led by vascular surgeon Dr. Marc Schermerhorn.
The team conducted a retrospective review of 1,161 patients between 2005 and 2014 and evaluated the effect of renin-angiotensin system (RAS) inhibition on mortality in patients undergoing revascularization (both endovascular and surgical bypass) for CLTI.
In this population, RAS inhibition resulted in:
• Reduced mortality (67% versus 54% survival at three years)
• Lower 30-day myocardial infarction (1.6% versus 4.3%)
• No difference in major adverse limb events, amputation, or reinterventions
“These benefits were restricted to those prescribed high-dose RAS inhibition, and not realized in those on lower doses,” noted first author Dr. Thomas Bodewes. As such, the authors recommend that, “physicians should strive to maintain patients on high-dose RAS inhibition, provided that such doses are tolerated in terms of blood pressure.”
Patients with CLTI are heavily burdened with atherosclerosis, which affects nearly all important vascular beds, including the cerebral, coronary, peripheral, renal and mesenteric circulatory systems.
A growing body of evidence suggests that renin-angiotensin system (RAS) inhibition has multiple cardiovascular benefits including:
• Blood pressure control
• Decrease in preload and afterload
• Stabilization of plaque
• Inhibition of smooth muscle proliferation
• Improved vascular endothelial function
• Reduced ventricular hypertrophy
• Enhanced fibrinolysis
Despite this evidence, questions remain. The authors note that this was a retrospective single institution review and despite adjustment for multiple variables, the association between RAS inhibitor use and long-term outcomes may be confounded by other factors including some that were unmeasured.
There are relatively modest number of non-white patients, and actual use of the medications beyond hospital discharge among the study patients is unknown. There are potential side effects to the use of RAS inhibitors that providers must consider in the dosing of these medications. Larger confirmatory studies are needed to confirm these findings and strengthen the evidence.
ClIck here to read the full-article, which is free to non-subscribers until April 30.