User login
Outcomes of patients with subsegmental PE with and without anticoagulation
Clinical question: Should patients with subsegmental pulmonary embolism be anticoagulated?
Background: A recent CHEST clinical guideline suggests it is reasonable to withhold anticoagulation for subsegmental pulmonary embolism. This has been a topic of controversy given the lack of a systematic review.
Study design: Systematic review and meta-analysis.

Setting: A comprehensive literature search was performed by a medical librarian in Ovid, MEDLINE, PubMed, Embase, the Cochrane Library, Scopus, Web of Science, ClinicalTrials.gov, and Google Scholar.
Synopsis: After 1,512 papers were screened, 14 studies were included in the review and analysis. Primary outcomes were frequency of bleeding, venous thromboembolism recurrence, and death for patients with subsegmental pulmonary embolism with and without treatment. Because of a lack of precision in pooled data and high heterogeneity of outcomes, no inferences could be made about benefit or harm with either approach.
The conclusions were limited because of the small numbers, imprecision, and lack of controlled trials. There is a need for a randomized controlled trial regarding subsegmental pulmonary embolism.
Bottom line: The decision to treat or not treat a patient with subsegmental pulmonary embolism should be done based on clinical judgment and a shared decision-making model with the patient.
Citation: Bariteau A et al. Systematic review and meta-analysis of outcomes of patients with subsegmental pulmonary embolism with and without anticoagulation treatment. Acad Emerg Med. 2018 Mar 2. doi: 10.1111/acem.13399.
Dr. Chadha is an assistant professor in the division of hospital medicine at the University of Kentucky, Lexington.
Clinical question: Should patients with subsegmental pulmonary embolism be anticoagulated?
Background: A recent CHEST clinical guideline suggests it is reasonable to withhold anticoagulation for subsegmental pulmonary embolism. This has been a topic of controversy given the lack of a systematic review.
Study design: Systematic review and meta-analysis.
Setting: A comprehensive literature search was performed by a medical librarian in Ovid, MEDLINE, PubMed, Embase, the Cochrane Library, Scopus, Web of Science, ClinicalTrials.gov, and Google Scholar.
Synopsis: After 1,512 papers were screened, 14 studies were included in the review and analysis. Primary outcomes were frequency of bleeding, venous thromboembolism recurrence, and death for patients with subsegmental pulmonary embolism with and without treatment. Because of a lack of precision in pooled data and high heterogeneity of outcomes, no inferences could be made about benefit or harm with either approach.
The conclusions were limited because of the small numbers, imprecision, and lack of controlled trials. There is a need for a randomized controlled trial regarding subsegmental pulmonary embolism.
Bottom line: The decision to treat or not treat a patient with subsegmental pulmonary embolism should be done based on clinical judgment and a shared decision-making model with the patient.
Citation: Bariteau A et al. Systematic review and meta-analysis of outcomes of patients with subsegmental pulmonary embolism with and without anticoagulation treatment. Acad Emerg Med. 2018 Mar 2. doi: 10.1111/acem.13399.
Dr. Chadha is an assistant professor in the division of hospital medicine at the University of Kentucky, Lexington.
Restrictive transfusion will likely be standard, doc says
MUNICH—A restrictive transfusion strategy during cardiovascular surgery will likely become the standard of care, according to an investigator from the TRICS III trial.
The study showed that a restrictive approach to transfusion did not increase the risk of poor outcomes at 6 months after cardiac surgery.
David Mazer, MD, of St. Michael’s Hospital, University of Toronto in Ontario, Canada, presented these findings at the 2018 ESC Congress. The results were published simultaneously in NEJM.
Dr. Mazer and his colleagues previously reported results from the TRICS III trial showing that 28-day outcomes were similar whether patients undergoing cardiac surgery were treated with a restrictive or a liberal transfusion strategy.
However, the team wanted to look into 6-month results to rule out latent problems, such as sequelae from perioperative organ hypoxia.
“Our research question was, ‘At what point does the risk of anemia, or the risk of a lower hemoglobin, outweigh the risk of transfusion?’” Dr. Mazer said. “We wanted to know whether it is safe to let your hemoglobin go to a lower level before you transfuse. The answer is yes. It’ll save blood, make blood more available, reduce costs of transfusion, and result in similar or better outcomes.”
Patients
The trial included 2317 patients who were randomized to a restrictive transfusion strategy, which meant they received red cell transfusions if their hemoglobin concentrations fell below 7.5 g/dL intraoperatively or postoperatively.
Another 2347 patients were randomized to the liberal approach, which meant they received transfusions if their hemoglobin fell below 9.5 g/dL in the operating room and intensive care unit (ICU) and below 8.5 g/dL outside the ICU.
Baseline characteristics were well balanced between the arms. Patients were a mean of 72 years old, and 35% were female. The majority of patients in both arms underwent coronary artery bypass surgery, valve surgery, or both. Heart transplants were excluded.
Results
At 6 months, 17.4% of patients in the restrictive arm and 17.1% in the liberal arm met the primary composite outcome of death from any cause, myocardial infarction, stroke, or new-onset renal failure with dialysis (P=0.006 for noninferiority).
Unexpectedly, patients age 75 and older had a lower risk of the primary outcome with the restrictive strategy, while the liberal strategy was associated with lower risk in younger patients.
For all age groups, there were no significant differences between the treatment arms for the individual components of the primary composite outcome or for secondary outcomes.
The mortality rate was 6.2% in the restrictive arm and 6.4% in the liberal arm. The rate of myocardial infarction was 7.3% in both arms.
The rate of stroke was 4% in the restrictive arm and 3.3% in the liberal arm. The incidence of new-onset renal failure with dialysis was 3.9% and 4.2%, respectively.
The secondary composite outcome included the components of the primary outcome plus hospital readmissions, emergency department visits, and coronary revascularization. This outcome occurred in 43.8% of patients in the restrictive arm and 42.8% in the liberal arm.
The incidence of hospital readmissions/emergency visits was 35.5% in the restrictive arm and 33.6% in the liberal arm. The incidence of coronary revascularization was 0.7% and 0.9%, respectively.
The investigators also found the restrictive transfusion strategy effectively saved blood. Just over half of patients (52.3%) in the restrictive arm and almost three-quarters (72.6%) of those in the liberal arm were transfused after randomization.
“This research has already started to change transfusion practice around the world,” Dr. Mazer said. “With this data at six months, we’ve proven the longer-term safety of restrictive therapy. This approach has already been adopted into guidelines and will likely become the standard of care worldwide.”
This study was funded by the Canadian Institutes of Health Research, Canadian Blood Services, the National Health and Medical Research Council in Australia, and the Health Research Council of New Zealand. Dr. Mazer had no relevant disclosures.
NICE says CAR T-cell therapy isn’t cost-effective
The National Institute for Health and Care Excellence (NICE) has issued a draft guidance recommending against the use of axicabtagene ciloleucel (Yescarta) in England.
Axicabtagene ciloleucel is a chimeric antigen receptor (CAR) T-cell therapy that was just approved by the European Commission to treat patients with relapsed/refractory diffuse large B-cell lymphoma (DLBCL) or primary mediastinal B-cell lymphoma (PMBCL) who have received two or more lines of systemic therapy.
However, NICE has said it isn’t clear how much of a benefit axicabtagene ciloleucel may provide over salvage chemotherapy.
Additionally, the cost of axicabtagene ciloleucel is too high for the therapy to be considered a cost-effective use of National Health Service (NHS) resources.
NICE’s draft guidance points out that there is no standard treatment for patients with relapsed or refractory DLBCL or PMBCL who have received two or more systemic therapies. These patients receive best supportive care, which usually includes salvage chemotherapy.
Results from the ZUMA-1 trial suggest the majority of DLBCL/PMBCL patients given axicabtagene ciloleucel do respond to treatment.
However, there is no direct data comparing axicabtagene ciloleucel with salvage chemotherapy, so the benefit of the CAR T-cell therapy over chemotherapy is unknown.
The draft guidance also notes that axicabtagene ciloleucel meets NICE’s criteria to be considered a life-extending treatment at the end of life.
However, the CAR T-cell therapy cannot be considered a cost-effective use of NHS resources. The cost-effectiveness estimates for axicabtagene ciloleucel, compared with salvage chemotherapy, were above £50,000 per year of quality adjusted life gained, the upper limit of the specially extended range of cost-effectiveness for cancer treatments.
Furthermore, axicabtagene ciloleucel does not meet the criteria for inclusion in the Cancer Drugs Fund. NICE said axicabtagene ciloleucel does not have the plausible potential to be cost effective, which would be necessary for inclusion in the fund while further evidence of the treatment’s longer-term benefits is collected.
“Although promising, there is still much more we need to know about CAR-T, and, unfortunately, in this case, we are not able to recommend axicabtagene ciloleucel for use in the NHS in England at the cost per patient set by Kite Pharma,” said Meindert Boysen, director of the centre for health technology evaluation at NICE.
The consultation period for the draft guidance runs until September 18, 2018.
Lots of blood collection system recalled
The US Food and Drug Administration (FDA) has announced a recall of 10 lots of the Leukotrap RC System with RC2D Filter, a blood collection system for leukoreduced red blood cells.
Haemonetics Corporation issued the recall due to reports of higher than expected residual white blood cells in blood processed with certain lot numbers of Leukotrap RC Systems with RC2D Filter.
The FDA said the problem is the result of a manufacturing assembly issue, and use of the affected lots may result in a higher than expected level of leukocytes in transfused blood.
Therefore, these lots should not be used, unused product can be returned to Haemonetics, and the company will replace these recalled lots. Customers can contact their local customer service representative to coordinate returns and shipments of replacement product.
The FDA said blood processed using the affected lots should not be re-filtered. If blood products processed by the affected lots are shown to have levels of leukocytes above recognized standards, the products should be labeled as non-leukoreduced. However, if the blood products have levels of leukocytes within recognized standards, they can still be labeled as leukoreduced.
The affected lots, which were shipped between April 2018 and July 2018, are:
- 1856199, Product ID 129-62
- 1856113, Product ID 129-63
- 1856114, Product ID 129-63
- 1856131, Product ID 129-63
- 1856134, Product ID 129-63
- 1856135, Product ID 129-63
- 1856183, Product ID 129-63
- 1856185, Product ID 129-63
- 1856186, Product ID 129-63
- 1856201, Product ID 129-63.
Risankizumab proves more effective in psoriasis than ustekinumab
, according to results of a pair of head-to-head trials published in the Lancet.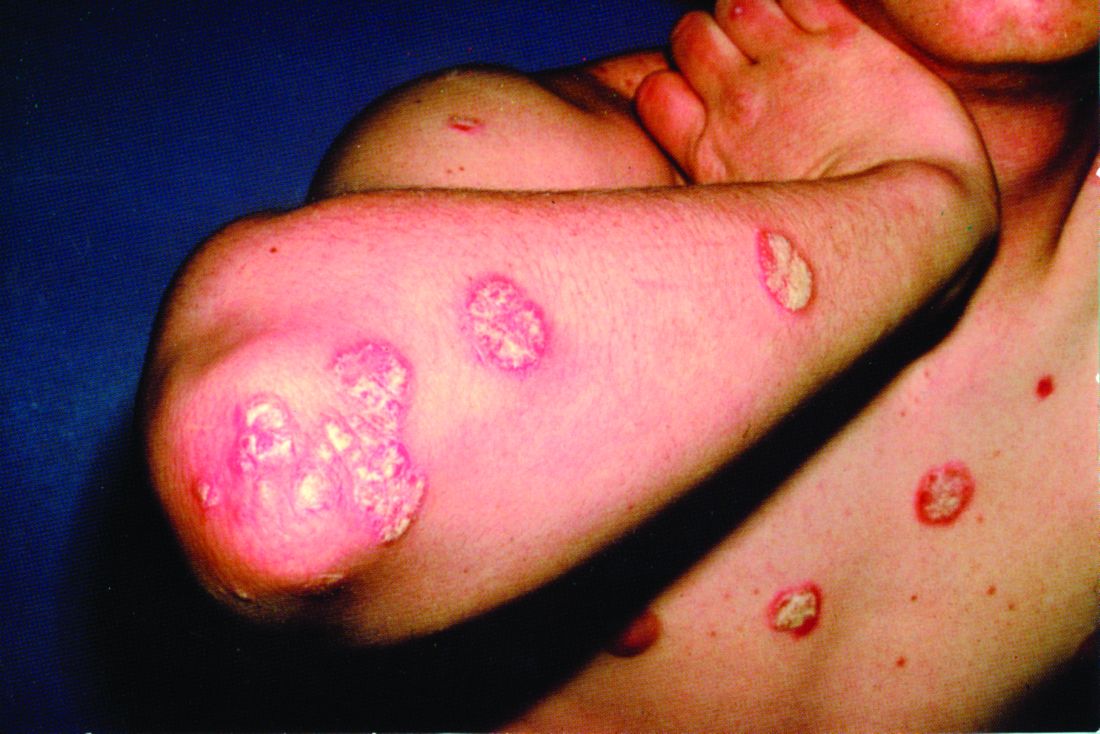
The replicate phase 3, randomized, double-blind, placebo- and active comparator–controlled trials, UltIMMa-1 (NCT02684370) and UltIMMa-2 (NCT02684375) altogether randomized 997 patients to risankizumab, ustekinumab, or placebo. The coprimary endpoints were the proportions of patients achieving 90% reduction in Psoriasis Area and Severity Index (PASI 90) at 16 weeks and a static Physician Global Assessment (sPGA) score of 0 or 1, and the 15 ranked secondary endpoints included proportions of those achieving PASI 100 or sPGA 0, both of which demonstrate total clearance of psoriasis, as well as measures of quality of life improvement.
Compared with those receiving either ustekinumab or placebo, a significantly higher proportion of patients receiving risankizumab achieved the coprimary endpoints, and all secondary endpoints were met. In UltIMMA-1, 75.3% of risankizumab patients achieved PASI 90, compared with 4.9% of placebo patients and 42% of ustekinumab patients (P less than .0001 when comparing it with both placebo and ustekinumab); sPGA of 0 or 1 was achieved by 87.8% of risankizumab patients and only 7.8% of placebo patients and 63% of ustekinumab patients (P less than .0001 when comparing it with both placebo and ustekinumab). Results were similar in UltIMMA-2: 74.8% of risankizumab patients achieved PASI 90, and 83.7% of them achieved sPGA 0 or 1 (P less than .0001 when comparing them with placebo and ustekinumab). According to results of the secondary endpoints, both studies also showed greater rates of clearance and improvements in quality of life among patients receiving risankizumab than among those receiving either placebo or ustekinumab.
The safety profiles across treatment groups were similar in both studies, with the most common adverse events including upper respiratory tract infection, headache, and diarrhea.
Risankizumab is a humanized IgG1 monoclonal antibody that targets the p19 subunit of only interleukin-23, unlike the studies’ active comparator, ustekinumab, which targets both interleukin-23 and interleukin-12. “Selectively blocking interleukin 23 with a p19 inhibitor appears to be one of the best ways to treat psoriasis,” commented Abigail Cline, MD, and Steven R. Feldman, MD, PhD, both of Wake Forest University, Winston-Salem, N.C., in an accompanying editorial (Lancet. 2018 Aug 7;392:616-71.).
The authors of the study reported relationships with various industry entities, including AbbVie, which sponsored the studies and developed risankizumab, and Boehringer Ingelheim, which collaborated in the studies. The authors of the editorial also disclosed relationships with entities, including AbbVie.
SOURCE: Gordon KB et al. Lancet. 2018 Aug 7;392:650-61.
FROM THE LANCET
Registration now open for the Crohn’s & Colitis Congress
Registration for the Crohn’s & Colitis Congress,® the premier conference on inflammatory bowel disease (IBD), is open. The Crohn’s & Colitis Congress, a partnership of the Crohn’s & Colitis Foundation and the American Gastroenterological Association, will take place Feb. 7-9, 2019, at the Bellagio, in Las Vegas.
Led by committee chair Brent Polk, MD, AGAF, and co-chairs Maria T. Abreu, MD, AGAF, and David T. Rubin, MD, AGAF, invited faculty include IBD thought-leaders in the fields of GI, research investigation, surgery, pediatrics, advanced practice, IBD nursing, diet and nutrition, mental health, radiology, and pathology.
The 2019 Congress’ agenda includes main sessions that will emphasize case studies and panel discussions. There will also be parallel sessions on basic and translational science for senior and junior investigators.
In addition, several pre-Congress workshops, taking place Feb. 7, will be available for selection.
There will also be plenty of social events and plenty of time to enjoy Las Vegas; including a Friday night Welcome Reception that should not be missed. It’s a great opportunity to network and celebrate.
Abstract submissions for basic, translational, and clinical research will be accepted beginning Aug. 1 and ending Oct. 24.
To learn more and register, visit www.crohnscolitiscongress.org.
Hand hygiene linked to reduced ICU health care–associated infections
A hospital-wide infection control program (ICP) was found to be associated with reduced health care-associated severe sepsis/septic shock or death in the ICU, but it was not clear whether this decrease was a consequence of the ICP or because of a concomitant improvement in HAI case management, according to a the results of a prospective analysis.
In addition, there was no significant decrease in overall HAIs seen despite implementation of the program, according to the report published online in Clinical Microbiology and Infection (doi: 10.1016/j.cmi.2018.07.010), according to Stefan Hagel, MD, of the Institute for Infectious Diseases and Infection Control, Jena (Germany) University Hospital, and his colleagues.
They assessed two surveillance periods (September 2011 to August 2012 and May 2013 to August 2014). The ICP started in October 2012, and included hand-hygiene promotion and bundle implementation for common HAIs.
The data were analyzed by segmented mixed-effects Poisson regression and multi-state models and reported as adjusted incidence rate ratios (aIRR) and 50 adjusted hazard ratios (aHR) with 95% confidence intervals (CI).
In the first period, 62,154 patients were under surveillance, with 1,568 HAIs identified in 1,170 patients (4.3/100 admissions) and 2,336 HAIs identified in 1,711 patients (4.9/100 admissions) in the second surveillance period. No differences were found in the overall HAI incidence rates between the periods in the general wards and ICUs. There was only a slight decline in the incidence rate of HAIs in the ICUs (aIRR 0.98 [0.97, 1.00] per 1-week increment), compared with the general wards (aIRR 1.01 [1.00, 1.02]).
However, a reduction in severe HAIs (aIRR 0.13 [0.05, 0.32]) and a lower probability of HAI-associated in-hospital deaths (aHR 0.56 [0.31, 0.99]) were observed in the second period in the ICUs.
In attempting to explain the variance seen between the results for general wards and the ICU, an analysis of alcohol-based handrub solution consumption as a marker of hand-hygiene behavior indicated that a remarkable increase in consumption occurred in the ICUs while a less pronounced increase occurred in the general wards. “This finding might explain the observed decline in the HAI incidence after starting the campaign in the ICUs, which was not observed on the general wards.” Dr. Hagel and his colleagues suggested.
The authors discussed how several confounding factors that influenced the incidence of HAIs needed to be considered. As a consequence of the improvement in HAI management, the number of collected blood culture sets nearly doubled hospital-wide from 13,126 to 25,805 per year between 2011 and 2014, which likely undermined the study objective, they stated. The increase in cultures may have impacted the number of overall HAIs found.
“Although the primary aim of the study of reducing the overall incidence of HAIs was not achieved, the study demonstrated a decline of severe HAIs in patients in ICUs in the second surveillance period. Whether this result was a consequence of the ICP or a general improvement in HAI management remains unclear,” the researchers concluded.
The authors reported that they had no conflicts of interest.
SOURCE: Hagel S et al. Clin Microbiol Infect. doi: 10.1016/j.cmi.2018.07.010].
FROM CLINICAL MICROBIOLOGY AND INFECTION
Key clinical point: Hand hygiene was the key factor associated with a decrease in severe HAIs.
Major finding: A reduction in severe HAIs (aIRR 0.13) and a lower probability of HAI-associated in-hospital deaths (aHR 0.56]) were observed.
Study details: A prospective database analysis of more nearly 65,000 hospitalized patients.
Disclosures: The authors reported that they had no conflicts of interest.
Source: Hagel S et al. Clin Microbiol Infect. doi: 10.1016/j.cmi.2018.07.010.
Learning Curves: Historical Trends of FDA-Reported Adverse Events for Dermal Fillers
Dermal fillers are considered Class III medical devices by the US Food and Drug Administration (FDA).1 Reports of adverse events (AEs) for medical devices are made public by the FDA to allow for transparent postmarketing surveillance.2The AE trends extracted from these historical data may help distinguish between expected learning curves of new dermal fillers versus unsafe products that may require FDA intervention. Considering that aesthetic treatments are not medically necessary, a low risk profile is paramount and determining what constitutes normal learning curves is important for impartial assessment of AEs as new fillers come on the market. The concept of a 3-year learning curve can be an important tool for safety monitoring going forward, creating a bar for quality that could trigger increased surveillance if a product fails to meet an expected arc of diminished AEs over time. This study serves to evaluate historical AE data and to establish learning curves for FDA-approved dermal fillers.
Methods
We searched the OpenFDA Device Adverse Event Report Browser (http://openfda.shinyapps.io/devicereports/) for reported AEs within the FDA product code LMH (Implant, Dermal, For Aesthetic Use) that were received from January 1, 1983, to December 31, 2017. For each reported AE, information related to the date of the reported event and the device brand name were recorded. Devices implicated in each AE were classified based on primary composition according to the following 5 categories: collagen, hyaluronic acid (HA), hydroxylapatite, poly-L-lactic acid (PLLA), and polymethyl methacrylate (PMMA). Inaccurate entries of reported AEs or those intended for nonaesthetic use were excluded from the study. A total of 8530 AEs were included in the study. To normalize the data, we obtained annual reports for the number of procedures performed by filler type from the American Society of Plastic Surgeons (ASPS) cosmetic procedure trends. 3 We calculated the annual AE rates for each approved filler by dividing the number of AEs by the number of procedures performed that year.
Results
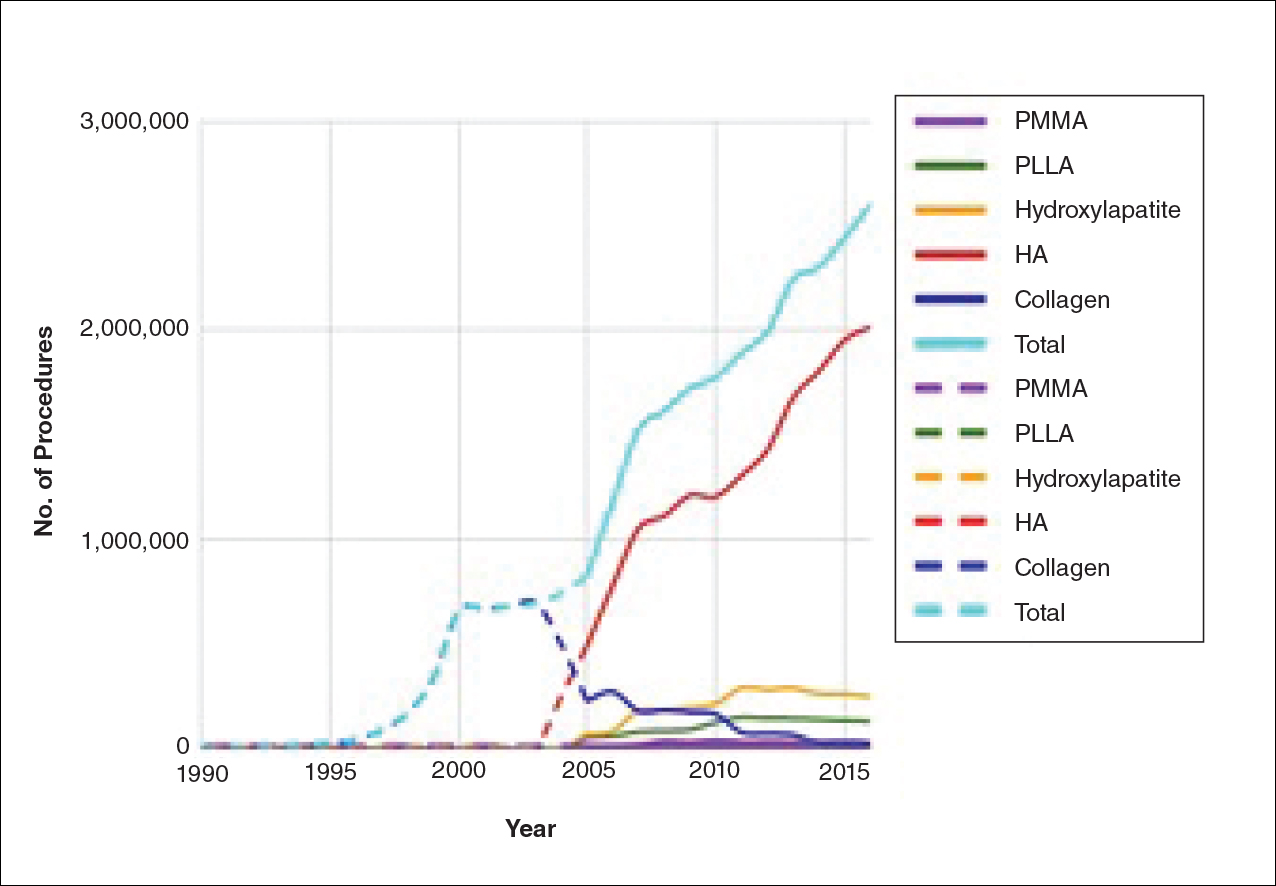
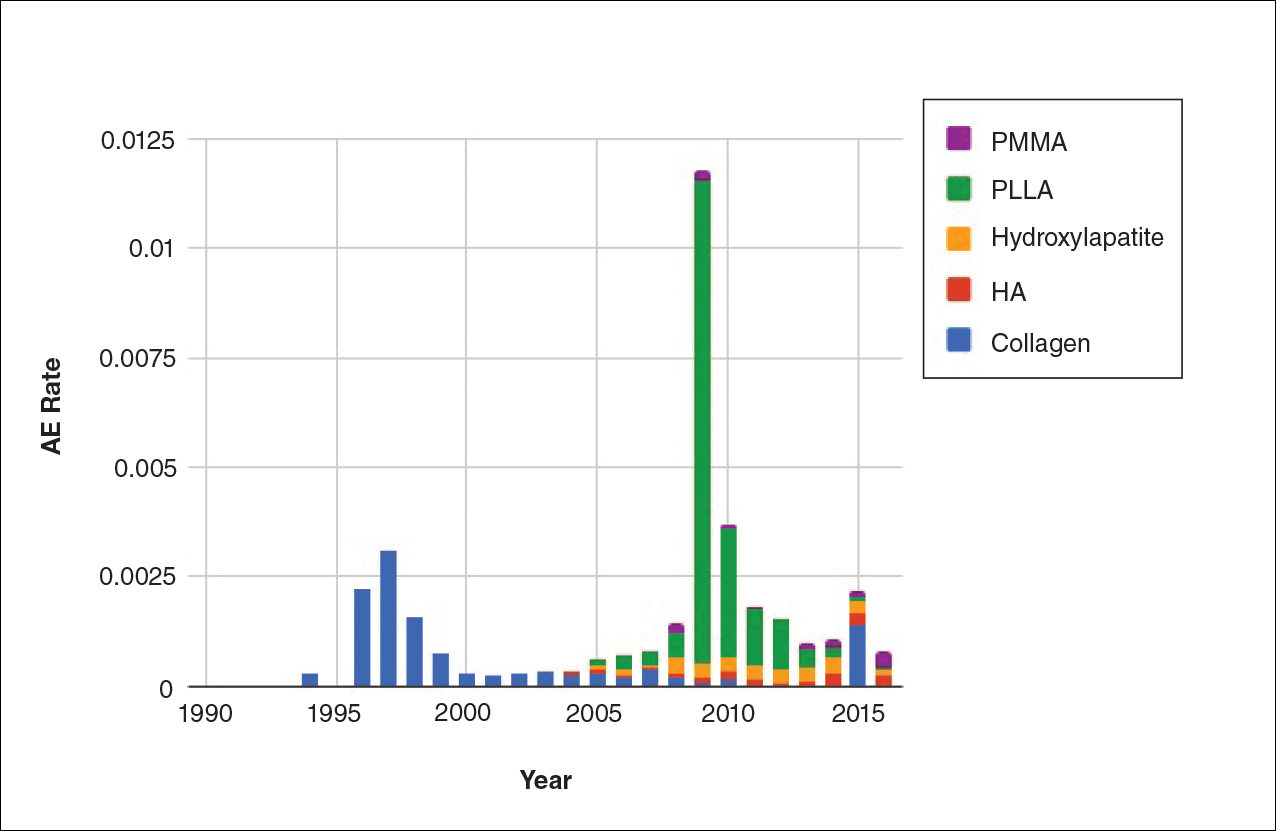
The trends of different filler types depicting the number of procedures performed over time are shown in Figure 1. Data from the ASPS dated back to 2005; therefore, the number of procedures performed prior to that were extrapolated with knowledge of products’ approval dates and market share, indicated by a dotted line. To determine AE rates for each year, we divided the number of AEs by the number of reported procedures for each filler type. The AE rates are displayed graphically in Figures 2 and 3 with superimposed FDA approval dates for each filler.4
Two major peaks in reported AE rates for all fillers were noted in the late 1990s and late 2000s, mostly associated with collagen and PLLA fillers, respectively (Figure 2). Overall, there has been a low rate of AEs associated with HA fillers since their initial approval in the early 2000s.
Individual filler AE rates also were analyzed. Hyaluronic acid fillers were associated with an extremely low rate of AEs, ranging from 1 to 4 AEs per 10,000 procedures (Figure 3A). This low AE rate profile underscores the safety of HA fillers, which has spurred their popularity. Adverseevent rates for collagen fillers spiked in the mid- to late 1990s and resolved over the course of the next 3 years (Figure 3B). Hydroxylapatite fillers had a rather uniform AE rate with an early indication of a drop-off after 2015 (Figure 3C). Poly-L-lactic acid fillers showed the steepest learning curve, with a peak of 1 AE per 100 procedures after they were approved in 2008 (Figure 3D); however, there is a comparable 3-year resolution of AE rates. Adverse events for PMMA fillers did not show specific resolution, meaning that they did not follow the 3-year arc that was seen for the other dermal fillers reported in the data set (Figure 3E).
Comment
Our study is unique in that it analyzes reported AE data over a 34-year period for injectable dermal fillers. To our knowledge, this novel method of calculating AE rates across dermal fillers and for individual products is the first of its kind that facilitates usage-normalized comparison of different filler types.
All OpenFDA data are self-reported and therefore have inherent limitations. Anyone can enter information on AEs in this system, including both patients and health care providers, so the quality of the input may be variable. However, this output is the only representation we have for nearly 35 years of AE history for this burgeoning category of popular aesthetic treatments. Another study limitation is that not everyone may know that reporting an AE in the OpenFDA is an option; therefore, we may be missing a portion of AEs due to underreporting. Underreporting may be especially at play in the years before the Internet was prevalent for residential use since access to the Internet would be required to report an AR on the website. However, examining the available data provides an important window into valuable information on complications that have occurred and have been reported for FDA-approved dermal fillers.
An additional challenge in constructing this study was assessing the total number of injectable dermal filler treatments being performed annually across filler types for normalization of the data. Although the absolute numbers of filler use as captured by the ASPS are smaller than the true total filler use across all injectors, the relative use of different filler products will be similar across all specialties because it reflects product popularity. Annual surveys on aesthetic procedures also are conducted by the American Society for Dermatologic Surgery and the American Association for Facial Plastic and Reconstructive Surgery, but neither one captures the relative usage of different filler types. Because individual filler companies do not publish their annual sales numbers by product, the ASPS data give us the best gauge of relative use of fillers by product type given the available information. We conclude that the comparison of AE rates would remain the same even if we had data for total annual filler use across specialties.
Our graphical depiction of the data clearly demonstrates the low AE profile of HA fillers, which is in line with the general consensus of their safety that has contributed to their vast popularity; however, this study represents the first time usage-normalized AE rates are compared to other filler compositions. Hyaluronic acid fillers have the unique feature of being able to be dissolved with the hyaluronidase enzyme, which can limit adverse event potential as compared to other ingredient classes of filler types and may be reflected in their low overall AE profile. The AE rate spike and resolution for collagen fillers represent what we refer to as a “normal learning curve” based on our analysis of the data set as a whole, suggesting an appropriate time course of increased familiarity with the product without inherent issues with the product itself. Multiple sequential anatomic site indications were approved for hydroxylapatite fillers from 2006 through 2015, which may have yielded overlapping learning curves for each approval, resulting in a rather uniform AE rate. The early drop-off in AE rates after the 2015 anatomic site approval may represent the beginning of a normal learning curve, and continued surveillance of AE rates would be of value to confirm this trend. We saw a similar 3-year learning curve for PLLA fillers as the curve for collagen fillers, suggesting a normal learning curve and no out-of-line safety issues. Polymethylmethacrylate fillers were approved in 2006 and were taken off the market for a period in the late 2000s, explaining the drop-off. Once they were back on the market, we do not see a typical learning curve for PMMA, which may warrant surveillance for safety by both clinicians and the FDA.
Conclusion
Our study represents a novel method of evaluating the safety of medical devices, specifically aesthetic fillers. We showed that every AE rate curve for different filler types tells a story. Reactions to AEs for new fillers should be placed in the context of whether they seem to be following the established learning curve.
- Dermal fillers (soft tissue fillers). US Food and Drug Administration website. https://www.fda.gov/MedicalDevices/ucm2007470.htm. Updated May 31, 2018. Accessed June 29, 2018.
- Kass-Hout TA, Xu Z, Mohebbi M, et al. OpenFDA: an innovative platform providing access to a wealth of FDA’s publicly available data. J Am Med Inform Assoc. 2016;23:596-600.
- Plastic surgery statistics. American Society of Plastic Surgeons website. https://www.plasticsurgery.org/documents/News/Statistics/2017/plastic-surgery-statistics-full-report-2017.pdf. Accessed June 28, 2018.
- Dermal fillers approved by the Center for Devices and Radiological Health. US Food and Drug Administration website. https://www.fda.gov/MedicalDevices/ProductsandMedicalProcedures/CosmeticDevices/WrinkleFillers/ucm227749.htm. Accessed June 28, 2018. Updated March 19, 2018.
Dermal fillers are considered Class III medical devices by the US Food and Drug Administration (FDA).1 Reports of adverse events (AEs) for medical devices are made public by the FDA to allow for transparent postmarketing surveillance.2The AE trends extracted from these historical data may help distinguish between expected learning curves of new dermal fillers versus unsafe products that may require FDA intervention. Considering that aesthetic treatments are not medically necessary, a low risk profile is paramount and determining what constitutes normal learning curves is important for impartial assessment of AEs as new fillers come on the market. The concept of a 3-year learning curve can be an important tool for safety monitoring going forward, creating a bar for quality that could trigger increased surveillance if a product fails to meet an expected arc of diminished AEs over time. This study serves to evaluate historical AE data and to establish learning curves for FDA-approved dermal fillers.
Methods
We searched the OpenFDA Device Adverse Event Report Browser (http://openfda.shinyapps.io/devicereports/) for reported AEs within the FDA product code LMH (Implant, Dermal, For Aesthetic Use) that were received from January 1, 1983, to December 31, 2017. For each reported AE, information related to the date of the reported event and the device brand name were recorded. Devices implicated in each AE were classified based on primary composition according to the following 5 categories: collagen, hyaluronic acid (HA), hydroxylapatite, poly-L-lactic acid (PLLA), and polymethyl methacrylate (PMMA). Inaccurate entries of reported AEs or those intended for nonaesthetic use were excluded from the study. A total of 8530 AEs were included in the study. To normalize the data, we obtained annual reports for the number of procedures performed by filler type from the American Society of Plastic Surgeons (ASPS) cosmetic procedure trends. 3 We calculated the annual AE rates for each approved filler by dividing the number of AEs by the number of procedures performed that year.
Results
The trends of different filler types depicting the number of procedures performed over time are shown in Figure 1. Data from the ASPS dated back to 2005; therefore, the number of procedures performed prior to that were extrapolated with knowledge of products’ approval dates and market share, indicated by a dotted line. To determine AE rates for each year, we divided the number of AEs by the number of reported procedures for each filler type. The AE rates are displayed graphically in Figures 2 and 3 with superimposed FDA approval dates for each filler.4
Two major peaks in reported AE rates for all fillers were noted in the late 1990s and late 2000s, mostly associated with collagen and PLLA fillers, respectively (Figure 2). Overall, there has been a low rate of AEs associated with HA fillers since their initial approval in the early 2000s.
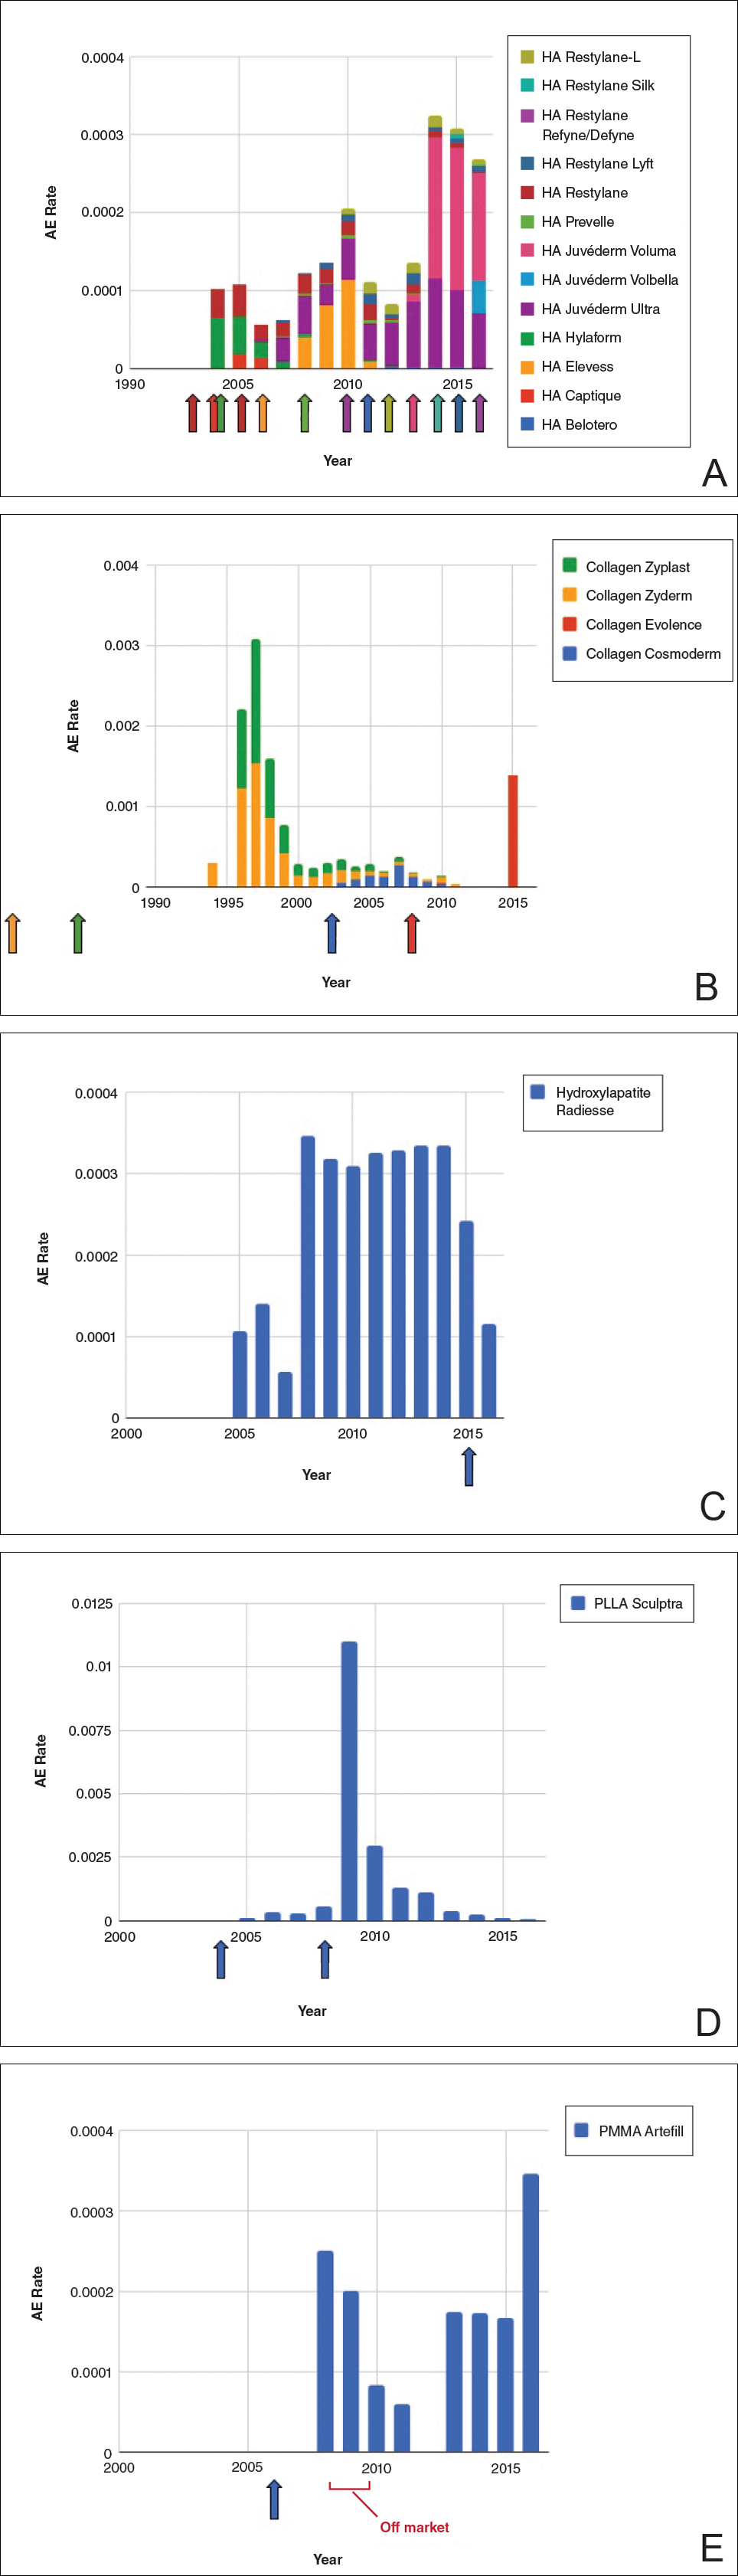
Individual filler AE rates also were analyzed. Hyaluronic acid fillers were associated with an extremely low rate of AEs, ranging from 1 to 4 AEs per 10,000 procedures (Figure 3A). This low AE rate profile underscores the safety of HA fillers, which has spurred their popularity. Adverseevent rates for collagen fillers spiked in the mid- to late 1990s and resolved over the course of the next 3 years (Figure 3B). Hydroxylapatite fillers had a rather uniform AE rate with an early indication of a drop-off after 2015 (Figure 3C). Poly-L-lactic acid fillers showed the steepest learning curve, with a peak of 1 AE per 100 procedures after they were approved in 2008 (Figure 3D); however, there is a comparable 3-year resolution of AE rates. Adverse events for PMMA fillers did not show specific resolution, meaning that they did not follow the 3-year arc that was seen for the other dermal fillers reported in the data set (Figure 3E).
Comment
Our study is unique in that it analyzes reported AE data over a 34-year period for injectable dermal fillers. To our knowledge, this novel method of calculating AE rates across dermal fillers and for individual products is the first of its kind that facilitates usage-normalized comparison of different filler types.
All OpenFDA data are self-reported and therefore have inherent limitations. Anyone can enter information on AEs in this system, including both patients and health care providers, so the quality of the input may be variable. However, this output is the only representation we have for nearly 35 years of AE history for this burgeoning category of popular aesthetic treatments. Another study limitation is that not everyone may know that reporting an AE in the OpenFDA is an option; therefore, we may be missing a portion of AEs due to underreporting. Underreporting may be especially at play in the years before the Internet was prevalent for residential use since access to the Internet would be required to report an AR on the website. However, examining the available data provides an important window into valuable information on complications that have occurred and have been reported for FDA-approved dermal fillers.
An additional challenge in constructing this study was assessing the total number of injectable dermal filler treatments being performed annually across filler types for normalization of the data. Although the absolute numbers of filler use as captured by the ASPS are smaller than the true total filler use across all injectors, the relative use of different filler products will be similar across all specialties because it reflects product popularity. Annual surveys on aesthetic procedures also are conducted by the American Society for Dermatologic Surgery and the American Association for Facial Plastic and Reconstructive Surgery, but neither one captures the relative usage of different filler types. Because individual filler companies do not publish their annual sales numbers by product, the ASPS data give us the best gauge of relative use of fillers by product type given the available information. We conclude that the comparison of AE rates would remain the same even if we had data for total annual filler use across specialties.
Our graphical depiction of the data clearly demonstrates the low AE profile of HA fillers, which is in line with the general consensus of their safety that has contributed to their vast popularity; however, this study represents the first time usage-normalized AE rates are compared to other filler compositions. Hyaluronic acid fillers have the unique feature of being able to be dissolved with the hyaluronidase enzyme, which can limit adverse event potential as compared to other ingredient classes of filler types and may be reflected in their low overall AE profile. The AE rate spike and resolution for collagen fillers represent what we refer to as a “normal learning curve” based on our analysis of the data set as a whole, suggesting an appropriate time course of increased familiarity with the product without inherent issues with the product itself. Multiple sequential anatomic site indications were approved for hydroxylapatite fillers from 2006 through 2015, which may have yielded overlapping learning curves for each approval, resulting in a rather uniform AE rate. The early drop-off in AE rates after the 2015 anatomic site approval may represent the beginning of a normal learning curve, and continued surveillance of AE rates would be of value to confirm this trend. We saw a similar 3-year learning curve for PLLA fillers as the curve for collagen fillers, suggesting a normal learning curve and no out-of-line safety issues. Polymethylmethacrylate fillers were approved in 2006 and were taken off the market for a period in the late 2000s, explaining the drop-off. Once they were back on the market, we do not see a typical learning curve for PMMA, which may warrant surveillance for safety by both clinicians and the FDA.
Conclusion
Our study represents a novel method of evaluating the safety of medical devices, specifically aesthetic fillers. We showed that every AE rate curve for different filler types tells a story. Reactions to AEs for new fillers should be placed in the context of whether they seem to be following the established learning curve.
Dermal fillers are considered Class III medical devices by the US Food and Drug Administration (FDA).1 Reports of adverse events (AEs) for medical devices are made public by the FDA to allow for transparent postmarketing surveillance.2The AE trends extracted from these historical data may help distinguish between expected learning curves of new dermal fillers versus unsafe products that may require FDA intervention. Considering that aesthetic treatments are not medically necessary, a low risk profile is paramount and determining what constitutes normal learning curves is important for impartial assessment of AEs as new fillers come on the market. The concept of a 3-year learning curve can be an important tool for safety monitoring going forward, creating a bar for quality that could trigger increased surveillance if a product fails to meet an expected arc of diminished AEs over time. This study serves to evaluate historical AE data and to establish learning curves for FDA-approved dermal fillers.
Methods
We searched the OpenFDA Device Adverse Event Report Browser (http://openfda.shinyapps.io/devicereports/) for reported AEs within the FDA product code LMH (Implant, Dermal, For Aesthetic Use) that were received from January 1, 1983, to December 31, 2017. For each reported AE, information related to the date of the reported event and the device brand name were recorded. Devices implicated in each AE were classified based on primary composition according to the following 5 categories: collagen, hyaluronic acid (HA), hydroxylapatite, poly-L-lactic acid (PLLA), and polymethyl methacrylate (PMMA). Inaccurate entries of reported AEs or those intended for nonaesthetic use were excluded from the study. A total of 8530 AEs were included in the study. To normalize the data, we obtained annual reports for the number of procedures performed by filler type from the American Society of Plastic Surgeons (ASPS) cosmetic procedure trends. 3 We calculated the annual AE rates for each approved filler by dividing the number of AEs by the number of procedures performed that year.
Results
The trends of different filler types depicting the number of procedures performed over time are shown in Figure 1. Data from the ASPS dated back to 2005; therefore, the number of procedures performed prior to that were extrapolated with knowledge of products’ approval dates and market share, indicated by a dotted line. To determine AE rates for each year, we divided the number of AEs by the number of reported procedures for each filler type. The AE rates are displayed graphically in Figures 2 and 3 with superimposed FDA approval dates for each filler.4
Two major peaks in reported AE rates for all fillers were noted in the late 1990s and late 2000s, mostly associated with collagen and PLLA fillers, respectively (Figure 2). Overall, there has been a low rate of AEs associated with HA fillers since their initial approval in the early 2000s.
Individual filler AE rates also were analyzed. Hyaluronic acid fillers were associated with an extremely low rate of AEs, ranging from 1 to 4 AEs per 10,000 procedures (Figure 3A). This low AE rate profile underscores the safety of HA fillers, which has spurred their popularity. Adverseevent rates for collagen fillers spiked in the mid- to late 1990s and resolved over the course of the next 3 years (Figure 3B). Hydroxylapatite fillers had a rather uniform AE rate with an early indication of a drop-off after 2015 (Figure 3C). Poly-L-lactic acid fillers showed the steepest learning curve, with a peak of 1 AE per 100 procedures after they were approved in 2008 (Figure 3D); however, there is a comparable 3-year resolution of AE rates. Adverse events for PMMA fillers did not show specific resolution, meaning that they did not follow the 3-year arc that was seen for the other dermal fillers reported in the data set (Figure 3E).
Comment
Our study is unique in that it analyzes reported AE data over a 34-year period for injectable dermal fillers. To our knowledge, this novel method of calculating AE rates across dermal fillers and for individual products is the first of its kind that facilitates usage-normalized comparison of different filler types.
All OpenFDA data are self-reported and therefore have inherent limitations. Anyone can enter information on AEs in this system, including both patients and health care providers, so the quality of the input may be variable. However, this output is the only representation we have for nearly 35 years of AE history for this burgeoning category of popular aesthetic treatments. Another study limitation is that not everyone may know that reporting an AE in the OpenFDA is an option; therefore, we may be missing a portion of AEs due to underreporting. Underreporting may be especially at play in the years before the Internet was prevalent for residential use since access to the Internet would be required to report an AR on the website. However, examining the available data provides an important window into valuable information on complications that have occurred and have been reported for FDA-approved dermal fillers.
An additional challenge in constructing this study was assessing the total number of injectable dermal filler treatments being performed annually across filler types for normalization of the data. Although the absolute numbers of filler use as captured by the ASPS are smaller than the true total filler use across all injectors, the relative use of different filler products will be similar across all specialties because it reflects product popularity. Annual surveys on aesthetic procedures also are conducted by the American Society for Dermatologic Surgery and the American Association for Facial Plastic and Reconstructive Surgery, but neither one captures the relative usage of different filler types. Because individual filler companies do not publish their annual sales numbers by product, the ASPS data give us the best gauge of relative use of fillers by product type given the available information. We conclude that the comparison of AE rates would remain the same even if we had data for total annual filler use across specialties.
Our graphical depiction of the data clearly demonstrates the low AE profile of HA fillers, which is in line with the general consensus of their safety that has contributed to their vast popularity; however, this study represents the first time usage-normalized AE rates are compared to other filler compositions. Hyaluronic acid fillers have the unique feature of being able to be dissolved with the hyaluronidase enzyme, which can limit adverse event potential as compared to other ingredient classes of filler types and may be reflected in their low overall AE profile. The AE rate spike and resolution for collagen fillers represent what we refer to as a “normal learning curve” based on our analysis of the data set as a whole, suggesting an appropriate time course of increased familiarity with the product without inherent issues with the product itself. Multiple sequential anatomic site indications were approved for hydroxylapatite fillers from 2006 through 2015, which may have yielded overlapping learning curves for each approval, resulting in a rather uniform AE rate. The early drop-off in AE rates after the 2015 anatomic site approval may represent the beginning of a normal learning curve, and continued surveillance of AE rates would be of value to confirm this trend. We saw a similar 3-year learning curve for PLLA fillers as the curve for collagen fillers, suggesting a normal learning curve and no out-of-line safety issues. Polymethylmethacrylate fillers were approved in 2006 and were taken off the market for a period in the late 2000s, explaining the drop-off. Once they were back on the market, we do not see a typical learning curve for PMMA, which may warrant surveillance for safety by both clinicians and the FDA.
Conclusion
Our study represents a novel method of evaluating the safety of medical devices, specifically aesthetic fillers. We showed that every AE rate curve for different filler types tells a story. Reactions to AEs for new fillers should be placed in the context of whether they seem to be following the established learning curve.
- Dermal fillers (soft tissue fillers). US Food and Drug Administration website. https://www.fda.gov/MedicalDevices/ucm2007470.htm. Updated May 31, 2018. Accessed June 29, 2018.
- Kass-Hout TA, Xu Z, Mohebbi M, et al. OpenFDA: an innovative platform providing access to a wealth of FDA’s publicly available data. J Am Med Inform Assoc. 2016;23:596-600.
- Plastic surgery statistics. American Society of Plastic Surgeons website. https://www.plasticsurgery.org/documents/News/Statistics/2017/plastic-surgery-statistics-full-report-2017.pdf. Accessed June 28, 2018.
- Dermal fillers approved by the Center for Devices and Radiological Health. US Food and Drug Administration website. https://www.fda.gov/MedicalDevices/ProductsandMedicalProcedures/CosmeticDevices/WrinkleFillers/ucm227749.htm. Accessed June 28, 2018. Updated March 19, 2018.
Resident Pearl
- The US Food and Drug Administration’s (FDA) adverse event database, OpenFDA, provides extensive information regarding safety for a variety of cosmetic devices. Injectable dermal fillers are classified as a medical device by the FDA; therefore, safety studies can be performed using this publicly available database.

Brown Papules on the Penis
The Diagnosis: Bowenoid Papulosis
A 4-mm punch biopsy was performed from the active border of brown plaques on the dorsal penis. Histopathology revealed parakeratotic hyperkeratosis, acanthosis, loss of maturation in epithelium, and full-size atypia (Figure 1). Ki-67 index was 90% positive in the epidermis (Figure 2). Staining for p16 and human papillomavirus (HPV) screening was positive for HPV type 16 (Figure 3). Serologic tests for other sexually transmitted infections were negative. A diagnosis of penile bowenoid papulosis (BP) with grade 3 penile intraepithelial neoplasia was made, and treatment with topical 5-fluorouracil (5-FU) was initiated. Almost total regression was appreciated at 1-month follow-up (Figure 4), and he also was recurrence free at 1-year follow-up.

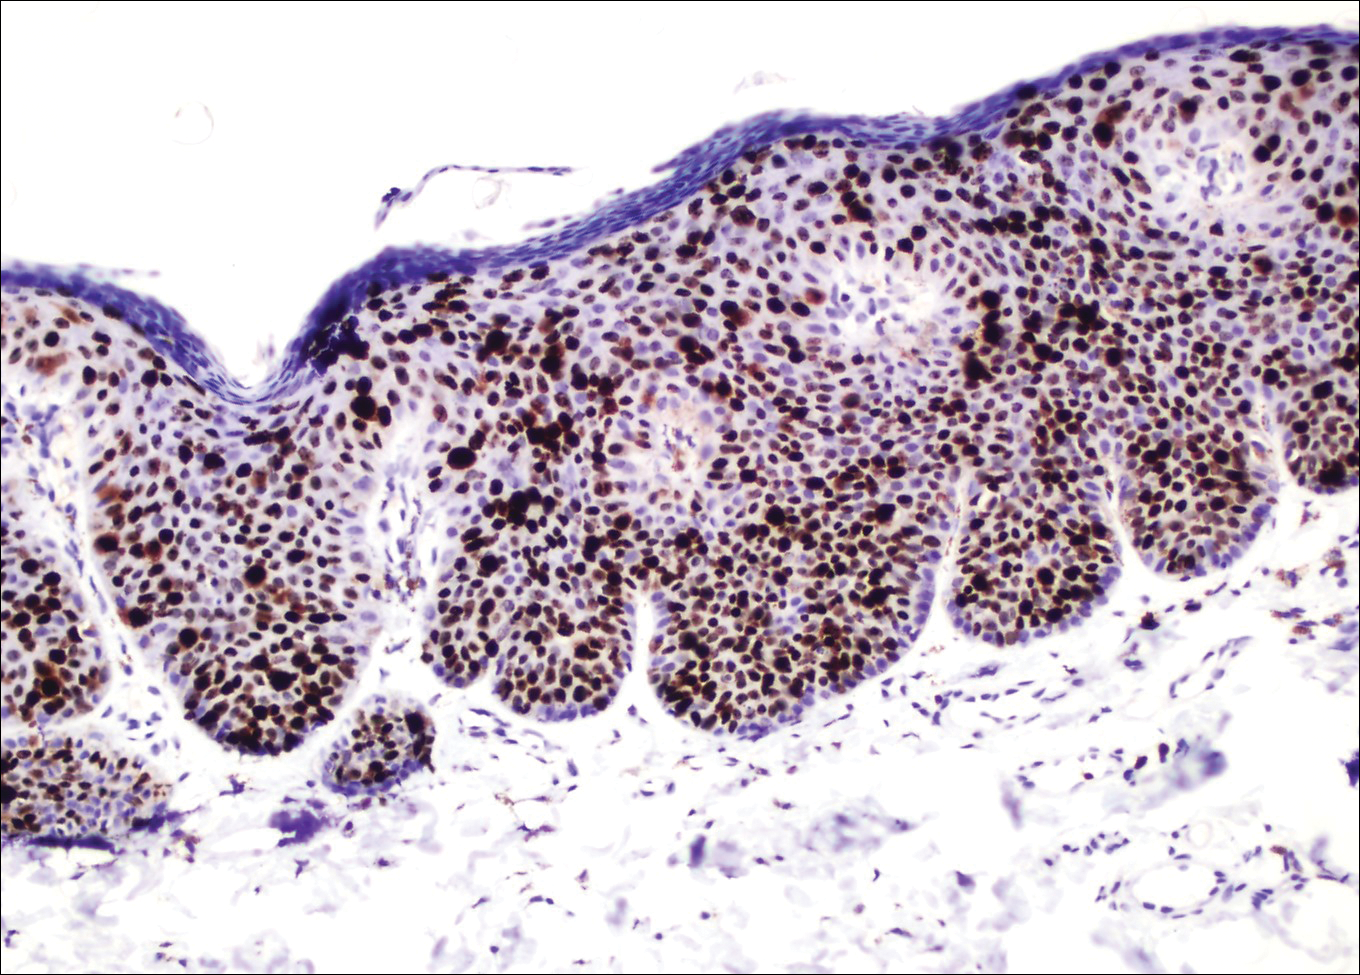
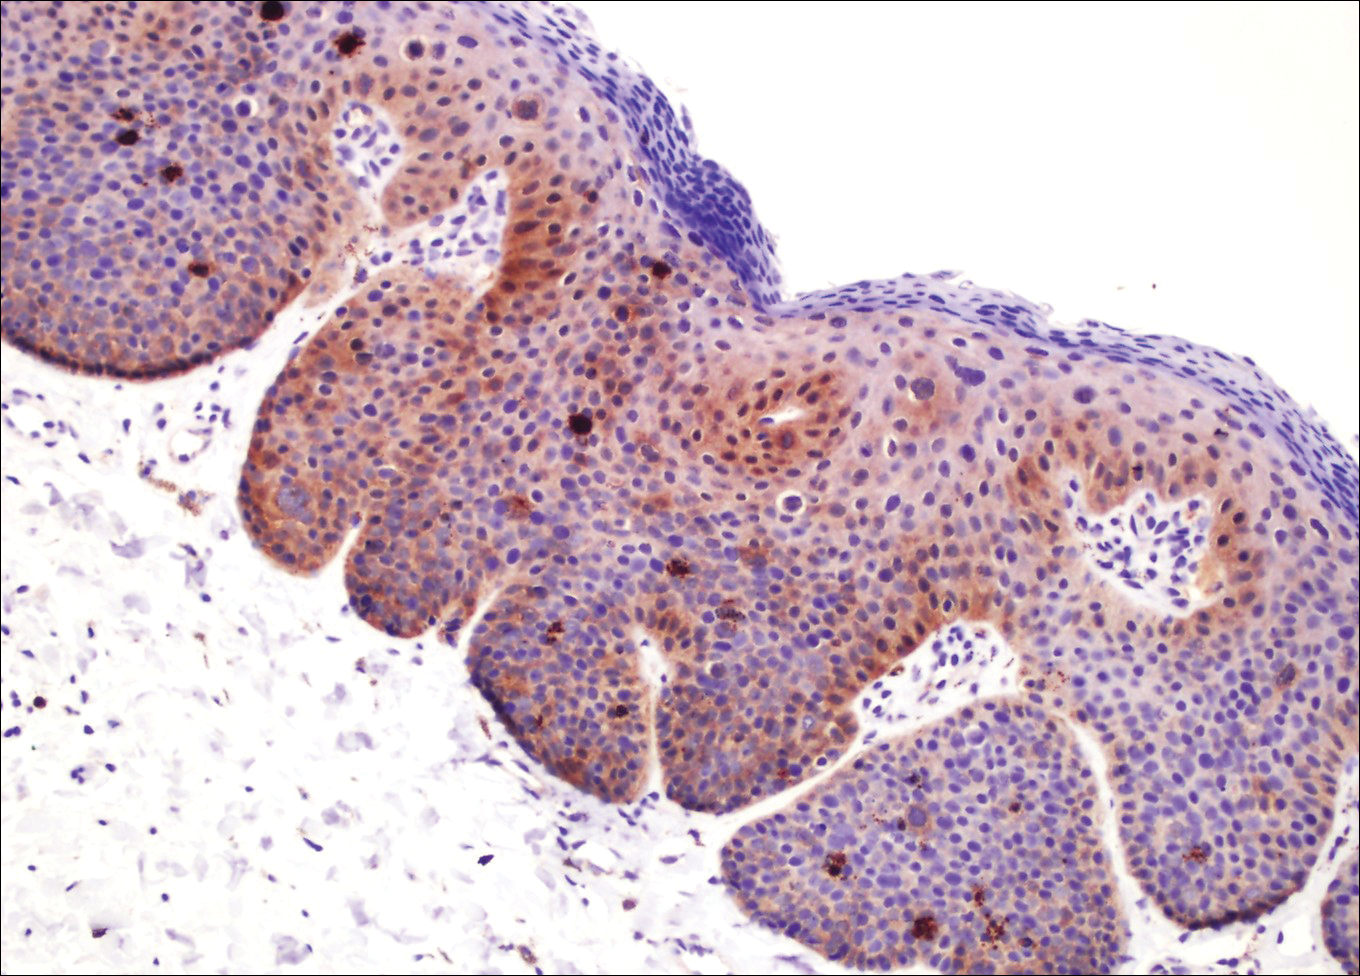
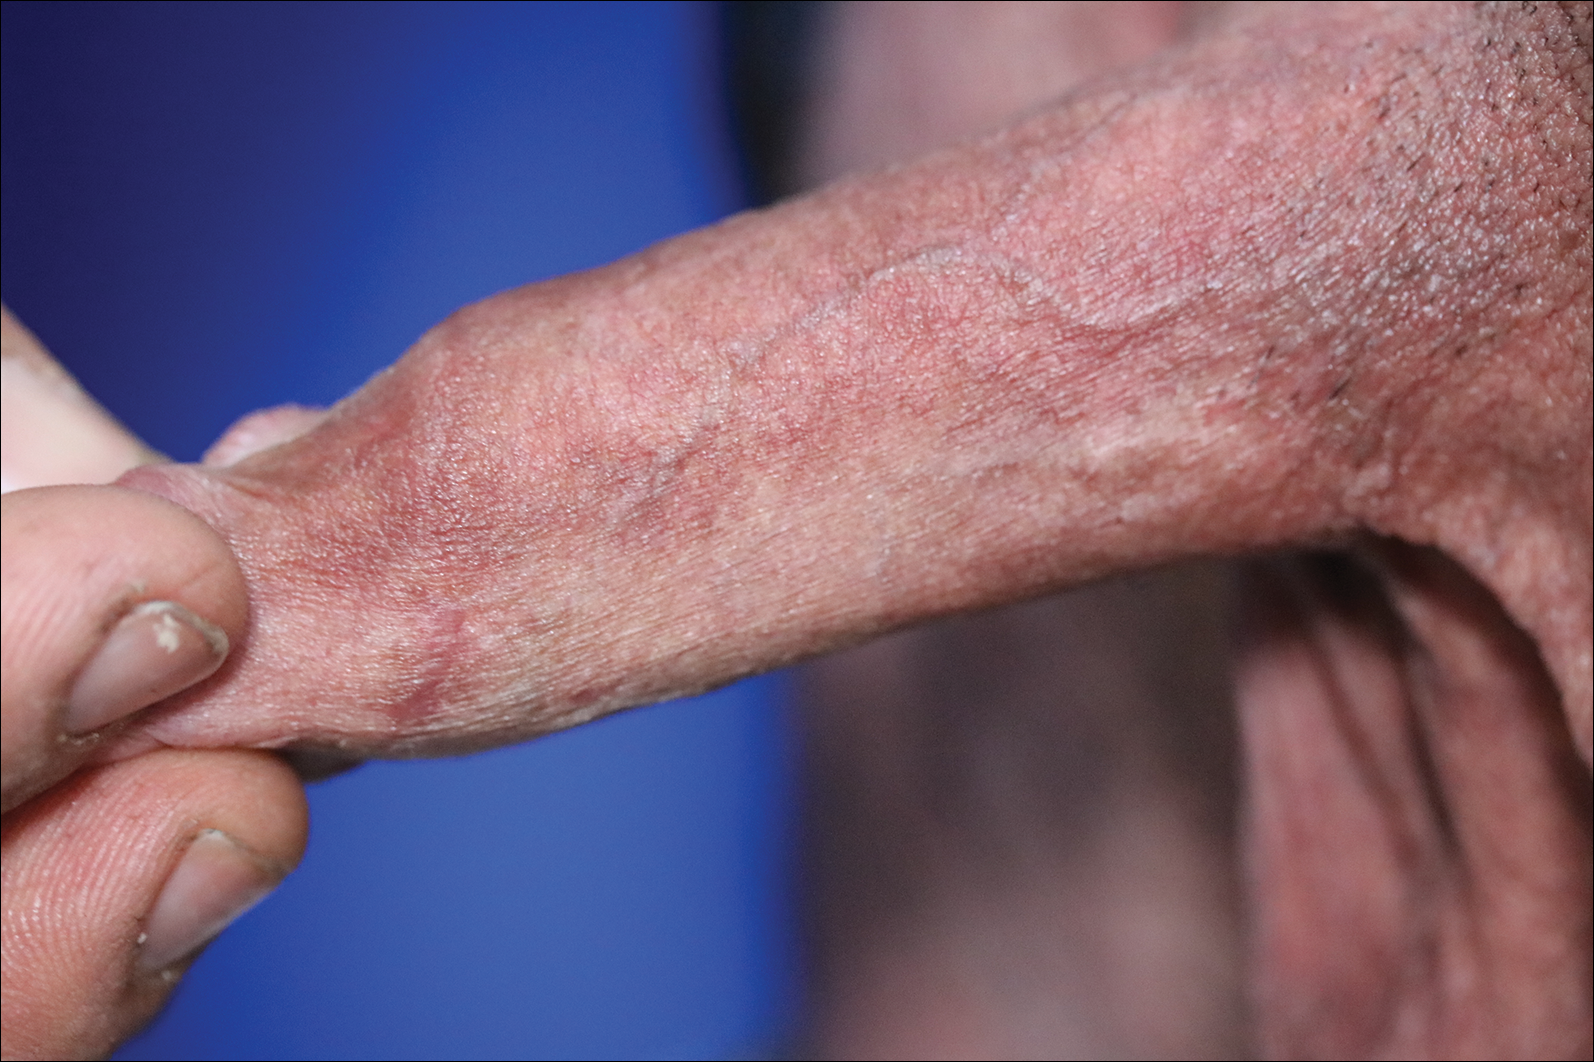
Penile intraepithelial neoplasia (PIN), or penile squamous cell carcinoma in situ, is a rare disease with high morbidity and mortality rates. Clinically, PIN is comprised of a clinical spectrum including 3 different entities: erythroplasia of Queyrat, Bowen disease, and BP.1 Histologically, PIN also is classified into 3 subtypes according to histological depth of epidermal atypia.1
Bowenoid papulosis usually is characterized by multiple red-brown or flesh-colored papules that most commonly appear on the shaft or glans of the penis. Bowenoid papulosis frequently is associated with high-risk types of HPV, such as HPV type 16, and is sometimes difficult to differentiate clinically from pigmented condyloma acuminatum. The clinical lesions of BP usually are less papillomatous, smoother topped, more polymorphic, and more coalescent compared to common genital viral condyloma acuminatum.2 Bowenoid papulosis usually is seen in young (<30 years of age) sexually active men, unlike the patches or plaques of erythroplasia of Queyrat or Bowen disease, which are seen in older men aged 45 to 75 years. Bowenoid papulosis also has a lower malignancy potential than erythroplasia of Queyrat and Bowen disease.2
Penile melanosis, penile lentigo, and seborrheic keratosis comprise the differential diagnosis of dark spots on the penis and also should be kept in mind. Penile melanosis is the most common cause of dark spots on the penis. When the dark spots have irregular borders and change in color, they may be misdiagnosed as malignant lesions such as melanoma.3 In most cases, biopsy is indicated. Histologically, penile melanosis is characterized by hyperpigmentation of the basal cell layer with no melanocytic hyperplasia. Treatment is unnecessary in most cases.
Penile lentigo presents as small flat pigmented spots on the penile skin with clearly defined margins surrounded by normal-appearing skin. Histologically, it is characterized by hyperplasia of melanocytes above the basement membrane of the epidermis.3
Penile pigmented seborrheic keratosis is a rare clinical entity that can be easily misinterpreted as condyloma acuminatum. Histologically, it is characterized by basal cell hyperplasia with cystic formation in the thickened epidermis. Excisional biopsy may be the only way to rule out malignant disease.
Treatment options for PIN include cryotherapy, CO2 or Nd:YAG lasers, photodynamic therapy, topical 5-FU or imiquimod therapy, and surgical excision such as Mohs micrographic surgery.4-9 Although these therapeutic modalities usually are effective, recurrence is common.6 The patients' discomfort and poor cosmetic and functional outcomes from the surgical removal of lesions also present a challenge in treatment planning.
In our patient, we quickly achieved a good result with topical 5-FU, though the disease was in local advanced stage. It is important for clinicians to consider 5-FU as an effective treatment option for PIN before planning surgery.
- Deen K, Burdon-Jones D. Imiquimod in the treatment of penile intraepithelial neoplasia: an update. Australas J Dermatol. 2017;58:86-92.
- Porter WM, Francis N, Hawkins D, et al. Penile intraepithelial neoplasia: clinical spectrum and treatment of 35 cases. Br J Dermatol. 2002;147:1159-1165.
- Fahmy M. Dermatological disease of the penis. In: Fahmy M. Congenital Anomalies of the Penis. Cham, Switzerland: Springer; 2017:257-264.
- Shimizu A, Kato M, Ishikawa O. Bowenoid papulosis successfully treated with imiquimod 5% cream. J Dermatol. 2014;41:545-546.
- Lucky M, Murthy KV, Rogers B, et al. The treatment of penile carcinoma in situ (CIS) within a UK supra-regional network [published online December 15, 2014]. BJU Int. 2015;115:595-598.
- Alnajjar HM, Lam W, Bolgeri M, et al. Treatment of carcinoma in situ of the glans penis with topical chemotherapy agents. Eur Urol. 2012;62:923-928.
- Wang XL, Wang HW, Guo MX, et al. Combination of immunotherapy and photodynamic therapy in the treatment of bowenoid papulosis. Photodiagnosis Photodyn Ther. 2007;4:88-93.
- Zreik A, Rewhorn M, Vint R, et al. Carbon dioxide laser treatment of penile intraepithelial neoplasia [published online December 7, 2016]. Surgeon. 2017;15:321-324.
- Machan M, Brodland D, Zitelli J. Penile squamous cell carcinoma: penis-preserving treatment with Mohs micrographic surgery. Dermatol Surg. 2016;42:936-944.
The Diagnosis: Bowenoid Papulosis
A 4-mm punch biopsy was performed from the active border of brown plaques on the dorsal penis. Histopathology revealed parakeratotic hyperkeratosis, acanthosis, loss of maturation in epithelium, and full-size atypia (Figure 1). Ki-67 index was 90% positive in the epidermis (Figure 2). Staining for p16 and human papillomavirus (HPV) screening was positive for HPV type 16 (Figure 3). Serologic tests for other sexually transmitted infections were negative. A diagnosis of penile bowenoid papulosis (BP) with grade 3 penile intraepithelial neoplasia was made, and treatment with topical 5-fluorouracil (5-FU) was initiated. Almost total regression was appreciated at 1-month follow-up (Figure 4), and he also was recurrence free at 1-year follow-up.
Penile intraepithelial neoplasia (PIN), or penile squamous cell carcinoma in situ, is a rare disease with high morbidity and mortality rates. Clinically, PIN is comprised of a clinical spectrum including 3 different entities: erythroplasia of Queyrat, Bowen disease, and BP.1 Histologically, PIN also is classified into 3 subtypes according to histological depth of epidermal atypia.1
Bowenoid papulosis usually is characterized by multiple red-brown or flesh-colored papules that most commonly appear on the shaft or glans of the penis. Bowenoid papulosis frequently is associated with high-risk types of HPV, such as HPV type 16, and is sometimes difficult to differentiate clinically from pigmented condyloma acuminatum. The clinical lesions of BP usually are less papillomatous, smoother topped, more polymorphic, and more coalescent compared to common genital viral condyloma acuminatum.2 Bowenoid papulosis usually is seen in young (<30 years of age) sexually active men, unlike the patches or plaques of erythroplasia of Queyrat or Bowen disease, which are seen in older men aged 45 to 75 years. Bowenoid papulosis also has a lower malignancy potential than erythroplasia of Queyrat and Bowen disease.2
Penile melanosis, penile lentigo, and seborrheic keratosis comprise the differential diagnosis of dark spots on the penis and also should be kept in mind. Penile melanosis is the most common cause of dark spots on the penis. When the dark spots have irregular borders and change in color, they may be misdiagnosed as malignant lesions such as melanoma.3 In most cases, biopsy is indicated. Histologically, penile melanosis is characterized by hyperpigmentation of the basal cell layer with no melanocytic hyperplasia. Treatment is unnecessary in most cases.
Penile lentigo presents as small flat pigmented spots on the penile skin with clearly defined margins surrounded by normal-appearing skin. Histologically, it is characterized by hyperplasia of melanocytes above the basement membrane of the epidermis.3
Penile pigmented seborrheic keratosis is a rare clinical entity that can be easily misinterpreted as condyloma acuminatum. Histologically, it is characterized by basal cell hyperplasia with cystic formation in the thickened epidermis. Excisional biopsy may be the only way to rule out malignant disease.
Treatment options for PIN include cryotherapy, CO2 or Nd:YAG lasers, photodynamic therapy, topical 5-FU or imiquimod therapy, and surgical excision such as Mohs micrographic surgery.4-9 Although these therapeutic modalities usually are effective, recurrence is common.6 The patients' discomfort and poor cosmetic and functional outcomes from the surgical removal of lesions also present a challenge in treatment planning.
In our patient, we quickly achieved a good result with topical 5-FU, though the disease was in local advanced stage. It is important for clinicians to consider 5-FU as an effective treatment option for PIN before planning surgery.
- Deen K, Burdon-Jones D. Imiquimod in the treatment of penile intraepithelial neoplasia: an update. Australas J Dermatol. 2017;58:86-92.
- Porter WM, Francis N, Hawkins D, et al. Penile intraepithelial neoplasia: clinical spectrum and treatment of 35 cases. Br J Dermatol. 2002;147:1159-1165.
- Fahmy M. Dermatological disease of the penis. In: Fahmy M. Congenital Anomalies of the Penis. Cham, Switzerland: Springer; 2017:257-264.
- Shimizu A, Kato M, Ishikawa O. Bowenoid papulosis successfully treated with imiquimod 5% cream. J Dermatol. 2014;41:545-546.
- Lucky M, Murthy KV, Rogers B, et al. The treatment of penile carcinoma in situ (CIS) within a UK supra-regional network [published online December 15, 2014]. BJU Int. 2015;115:595-598.
- Alnajjar HM, Lam W, Bolgeri M, et al. Treatment of carcinoma in situ of the glans penis with topical chemotherapy agents. Eur Urol. 2012;62:923-928.
- Wang XL, Wang HW, Guo MX, et al. Combination of immunotherapy and photodynamic therapy in the treatment of bowenoid papulosis. Photodiagnosis Photodyn Ther. 2007;4:88-93.
- Zreik A, Rewhorn M, Vint R, et al. Carbon dioxide laser treatment of penile intraepithelial neoplasia [published online December 7, 2016]. Surgeon. 2017;15:321-324.
- Machan M, Brodland D, Zitelli J. Penile squamous cell carcinoma: penis-preserving treatment with Mohs micrographic surgery. Dermatol Surg. 2016;42:936-944.
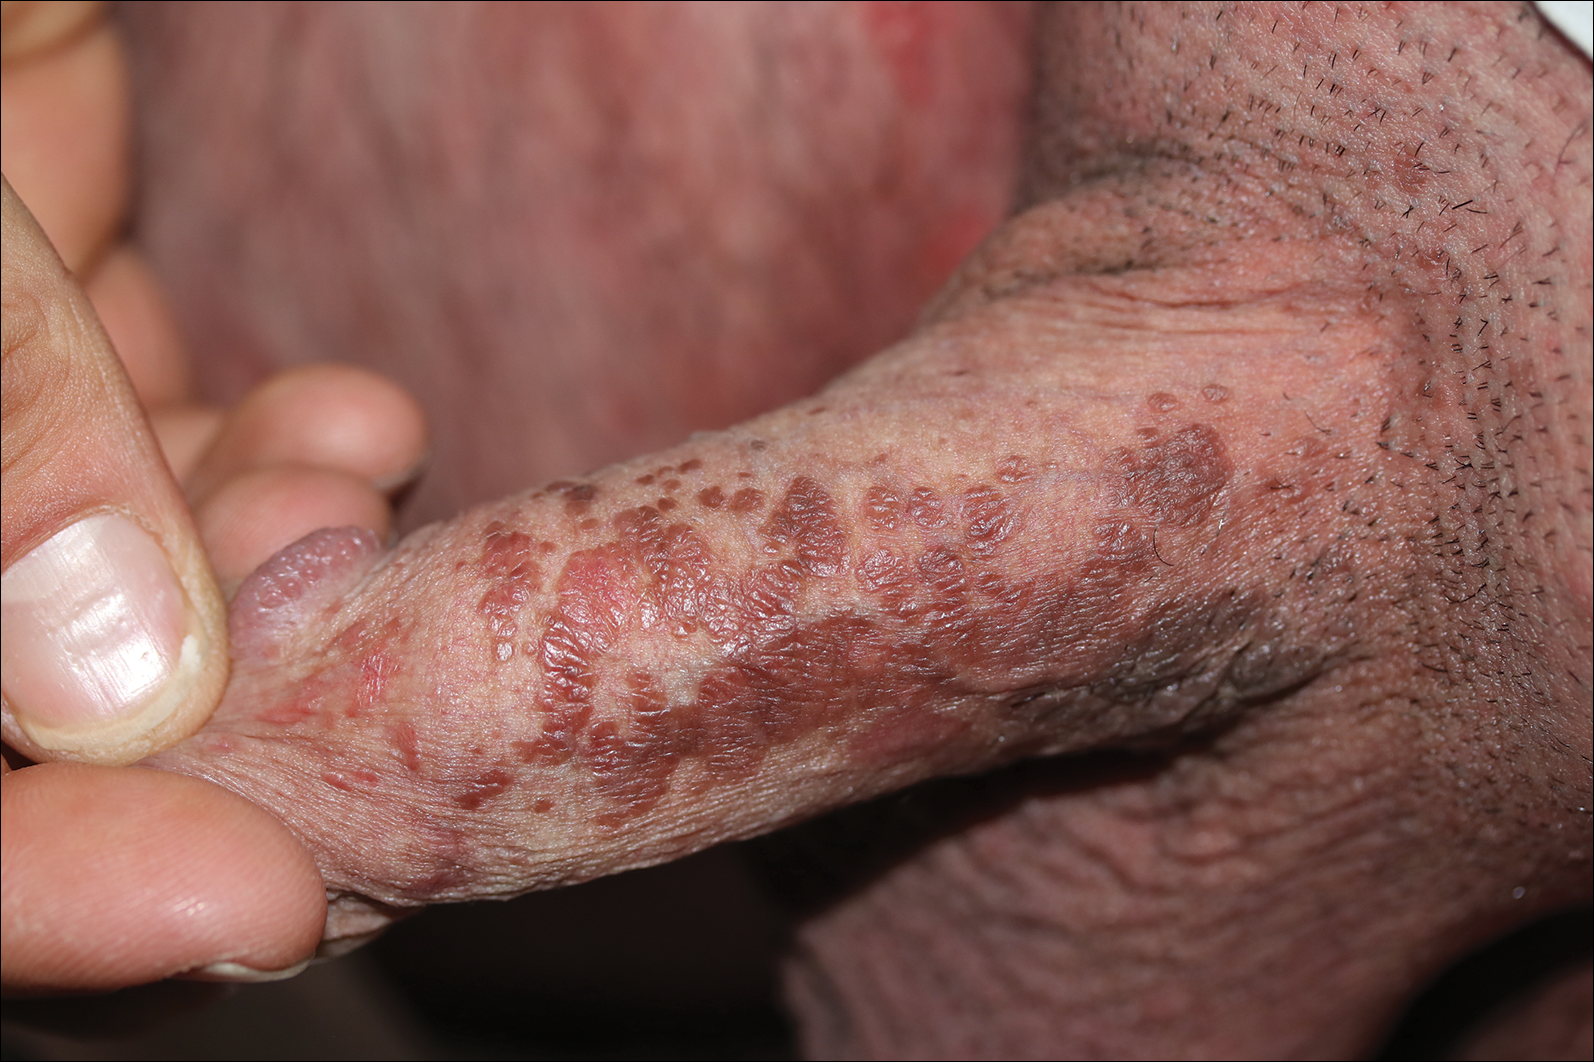
A 32-year-old man presented to the outpatient clinic with reddish brown lesions on the penis of 5 months' duration. Dermatologic examination revealed multiple mildly infiltrated, bright reddish brown papules and plaques on the dorsal penis.

Excision of a Bartholin gland cyst
Bartholin gland cysts comprise up to 2% of all outpatient gynecology visits each year1 and are a common consult for trainees in obstetrics and gynecology. Although excision of a Bartholin gland cyst is a procedure performed infrequently, knowledge of its anatomy and physiology is important for ObGyn trainees and practicing gynecologists, especially when attempts at conservative management have been exhausted.
Before proceeding with surgical excision, it is important to understand the basics of Bartholin gland anatomy, pathologies, and treatment options. This video demonstrates the excisional technique for a 46-year-old woman with a recurrent, symptomatic Bartholin gland cyst who failed prior conservative management. I hope that you will find this video from my colleagues beneficial to your clinical practice.

- Marzano DA, Haefner HK. The bartholin gland cyst: past, present, and future. J Low Genit Tract Dis. 2004;8(3):195–204.
Bartholin gland cysts comprise up to 2% of all outpatient gynecology visits each year1 and are a common consult for trainees in obstetrics and gynecology. Although excision of a Bartholin gland cyst is a procedure performed infrequently, knowledge of its anatomy and physiology is important for ObGyn trainees and practicing gynecologists, especially when attempts at conservative management have been exhausted.
Before proceeding with surgical excision, it is important to understand the basics of Bartholin gland anatomy, pathologies, and treatment options. This video demonstrates the excisional technique for a 46-year-old woman with a recurrent, symptomatic Bartholin gland cyst who failed prior conservative management. I hope that you will find this video from my colleagues beneficial to your clinical practice.
- Marzano DA, Haefner HK. The bartholin gland cyst: past, present, and future. J Low Genit Tract Dis. 2004;8(3):195–204.
- Marzano DA, Haefner HK. The bartholin gland cyst: past, present, and future. J Low Genit Tract Dis. 2004;8(3):195–204.