User login
Relatively high starting infliximab doses recommended for hidradenitis suppurativa
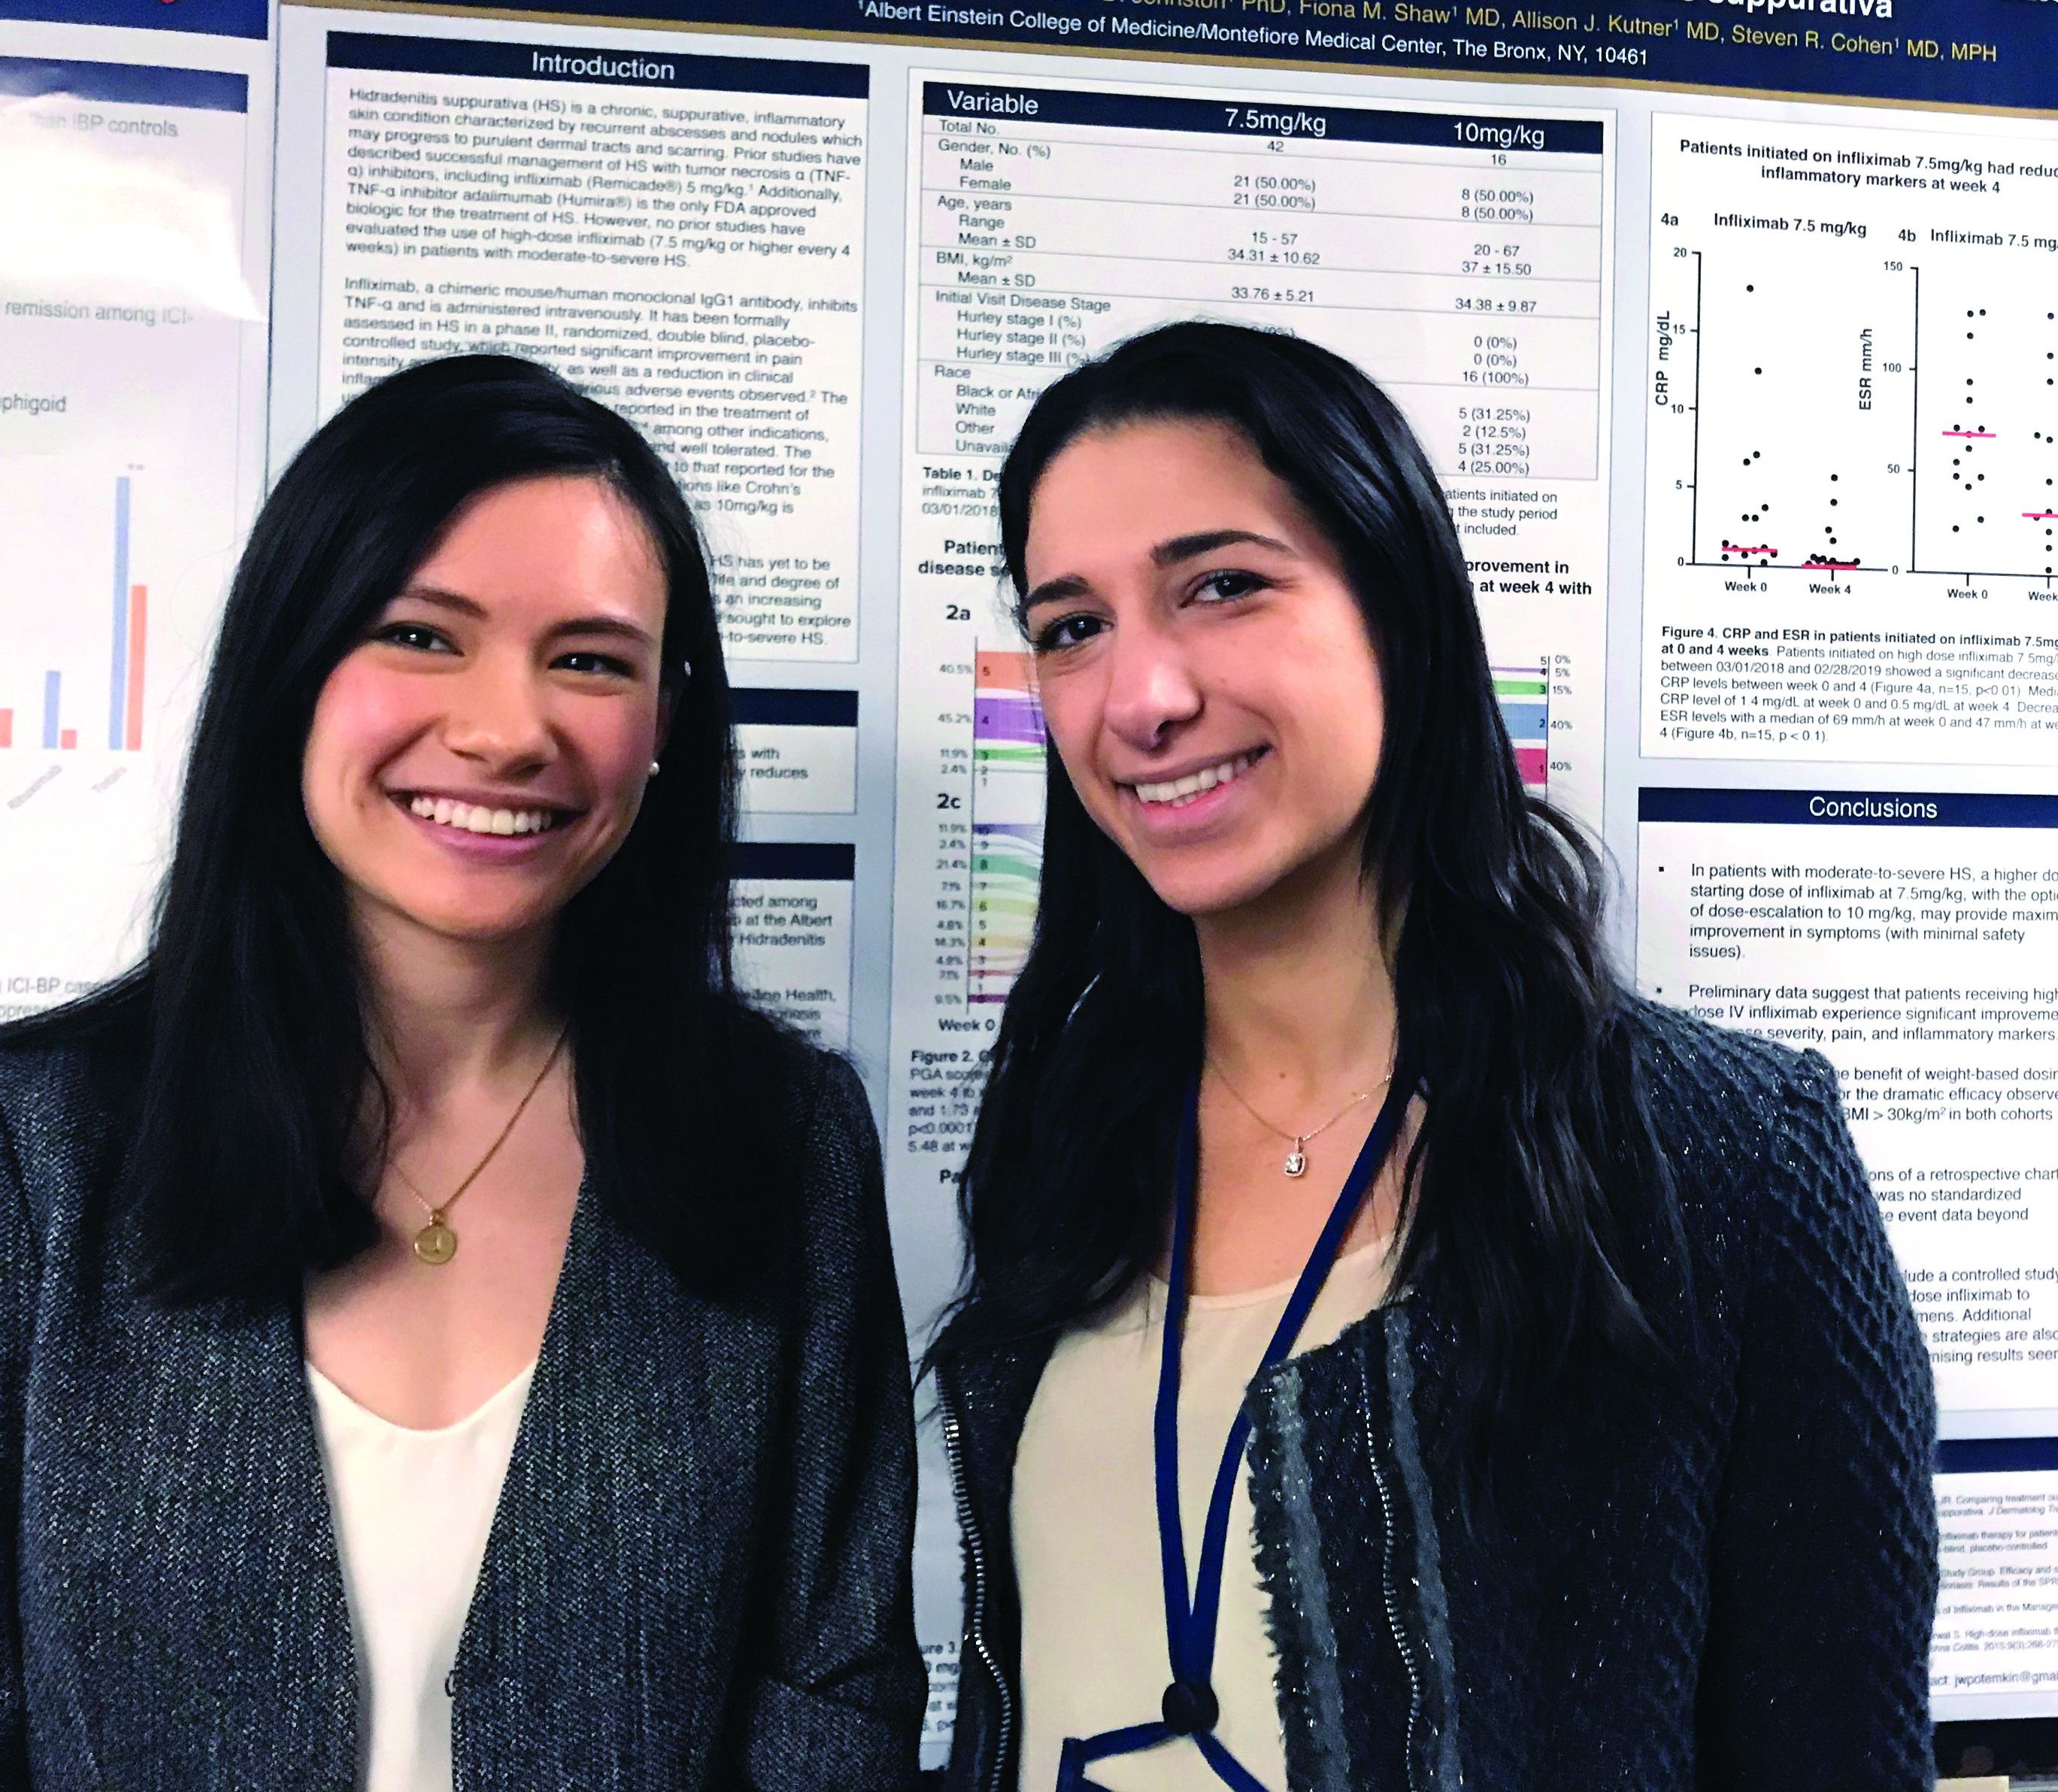
CHICAGO – In patients with hidradenitis suppurativa (HS), infliximab started at 7.5 mg/kg was highly effective and well tolerated and may be a more appropriate starting dose than the 5 mg/kg that is recommended in the treatment of plaque psoriasis, according to a chart review presented as a late breaker at the annual meeting of the Society for Investigative Dermatology.
_Ghias_web.jpg)
“Based on these data, we believe that a high starting dose of infliximab should be the new paradigm for this disease,” reported Justine Potemkin, a medical student at Albert Einstein College of Medicine, New York. The analysis was performed under the mentorship of Steven R. Cohen, MD, professor of dermatology and chief of the division of dermatology at Albert Einstein.
Infliximab, a tumor necrosis factor (TNF) blocker, is not approved for the treatment of HS, but it has been widely used following numerous reports of benefit in the literature, including a phase 2 randomized study published several years ago (J Am Acad Dermatol. 2010 Feb;62[2]:205-17), according to Ms. Potemkin.
“Based on dosing recommended for psoriasis, many hidradenitis suppurativa patients are started on 5 mg/kg, but doses of up to 10 mg/kg are within labeling for psoriasis, and our data support more aggressive initial treatment in patients with HS,” said Mondana Ghias, a research assistant in the department of dermatology at Albert Einstein, who was also involved in this study and joined Ms. Potemkin in presenting the data at the meeting.
In the chart review, 58 patients with moderate to severe HS initiated on 7.5 mg/kg of intravenous infliximab were identified. Due to a suboptimal response, 16 of these patients received 10 mg/kg infliximab in subsequent infusions, but the average response scores at 4 weeks compared favorably to previous reports with lower doses of infliximab, without increased toxicity.
“Starting with the 7.5 mg/kg dose with dose escalation if needed appears to provide a maximal response with minimal safety issues, based on our experience,” Ms. Potemkin reported.
At 4 weeks, a 10-point pain scale fell from a baseline mean of 5.65 to 1.34 (P less than .01). It reached 0.52 at week 12. The HS Physician Global Assessment (HS-PGA) fell from a baseline mean of 4.2 to 2.1 at week 4 (P less than .01) and then to 1.9 at week 12. The control of disease activity correlated with significant reductions in C-reactive protein and erythrocyte sedimentation rate.
The mean age in this patient population was 34.6 years. Slightly more than half (53.3%) were female. The average body mass index was 34.
“Obese patients also achieved a good response, which is consistent with weight-based dosing,” Ms. Potemkin reported.
The TNF blocker adalimumab is the only biologic and the only systemic therapy given regulatory approval for the treatment of HS, but Ms. Potemkin indicated that infliximab remains a widely used treatment option. She suggested that the responses observed in this patient series suggest infliximab is effective when used aggressively.
“No previous reports have examined the efficacy of high-dose infliximab,” Ms. Potemkin noted. “We think these findings are relevant to HS management.”
CHICAGO – In patients with hidradenitis suppurativa (HS), infliximab started at 7.5 mg/kg was highly effective and well tolerated and may be a more appropriate starting dose than the 5 mg/kg that is recommended in the treatment of plaque psoriasis, according to a chart review presented as a late breaker at the annual meeting of the Society for Investigative Dermatology.
“Based on these data, we believe that a high starting dose of infliximab should be the new paradigm for this disease,” reported Justine Potemkin, a medical student at Albert Einstein College of Medicine, New York. The analysis was performed under the mentorship of Steven R. Cohen, MD, professor of dermatology and chief of the division of dermatology at Albert Einstein.
Infliximab, a tumor necrosis factor (TNF) blocker, is not approved for the treatment of HS, but it has been widely used following numerous reports of benefit in the literature, including a phase 2 randomized study published several years ago (J Am Acad Dermatol. 2010 Feb;62[2]:205-17), according to Ms. Potemkin.
“Based on dosing recommended for psoriasis, many hidradenitis suppurativa patients are started on 5 mg/kg, but doses of up to 10 mg/kg are within labeling for psoriasis, and our data support more aggressive initial treatment in patients with HS,” said Mondana Ghias, a research assistant in the department of dermatology at Albert Einstein, who was also involved in this study and joined Ms. Potemkin in presenting the data at the meeting.
In the chart review, 58 patients with moderate to severe HS initiated on 7.5 mg/kg of intravenous infliximab were identified. Due to a suboptimal response, 16 of these patients received 10 mg/kg infliximab in subsequent infusions, but the average response scores at 4 weeks compared favorably to previous reports with lower doses of infliximab, without increased toxicity.
“Starting with the 7.5 mg/kg dose with dose escalation if needed appears to provide a maximal response with minimal safety issues, based on our experience,” Ms. Potemkin reported.
At 4 weeks, a 10-point pain scale fell from a baseline mean of 5.65 to 1.34 (P less than .01). It reached 0.52 at week 12. The HS Physician Global Assessment (HS-PGA) fell from a baseline mean of 4.2 to 2.1 at week 4 (P less than .01) and then to 1.9 at week 12. The control of disease activity correlated with significant reductions in C-reactive protein and erythrocyte sedimentation rate.
The mean age in this patient population was 34.6 years. Slightly more than half (53.3%) were female. The average body mass index was 34.
“Obese patients also achieved a good response, which is consistent with weight-based dosing,” Ms. Potemkin reported.
The TNF blocker adalimumab is the only biologic and the only systemic therapy given regulatory approval for the treatment of HS, but Ms. Potemkin indicated that infliximab remains a widely used treatment option. She suggested that the responses observed in this patient series suggest infliximab is effective when used aggressively.
“No previous reports have examined the efficacy of high-dose infliximab,” Ms. Potemkin noted. “We think these findings are relevant to HS management.”
REPORTING FROM SID 2019
Baseline imaging recommended in all Merkel cell carcinoma patients
CHICAGO – , including those without palpable lymph nodes, according to results of an analysis of a large MCC registry presented at the annual meeting of the Society for Investigative Dermatology.
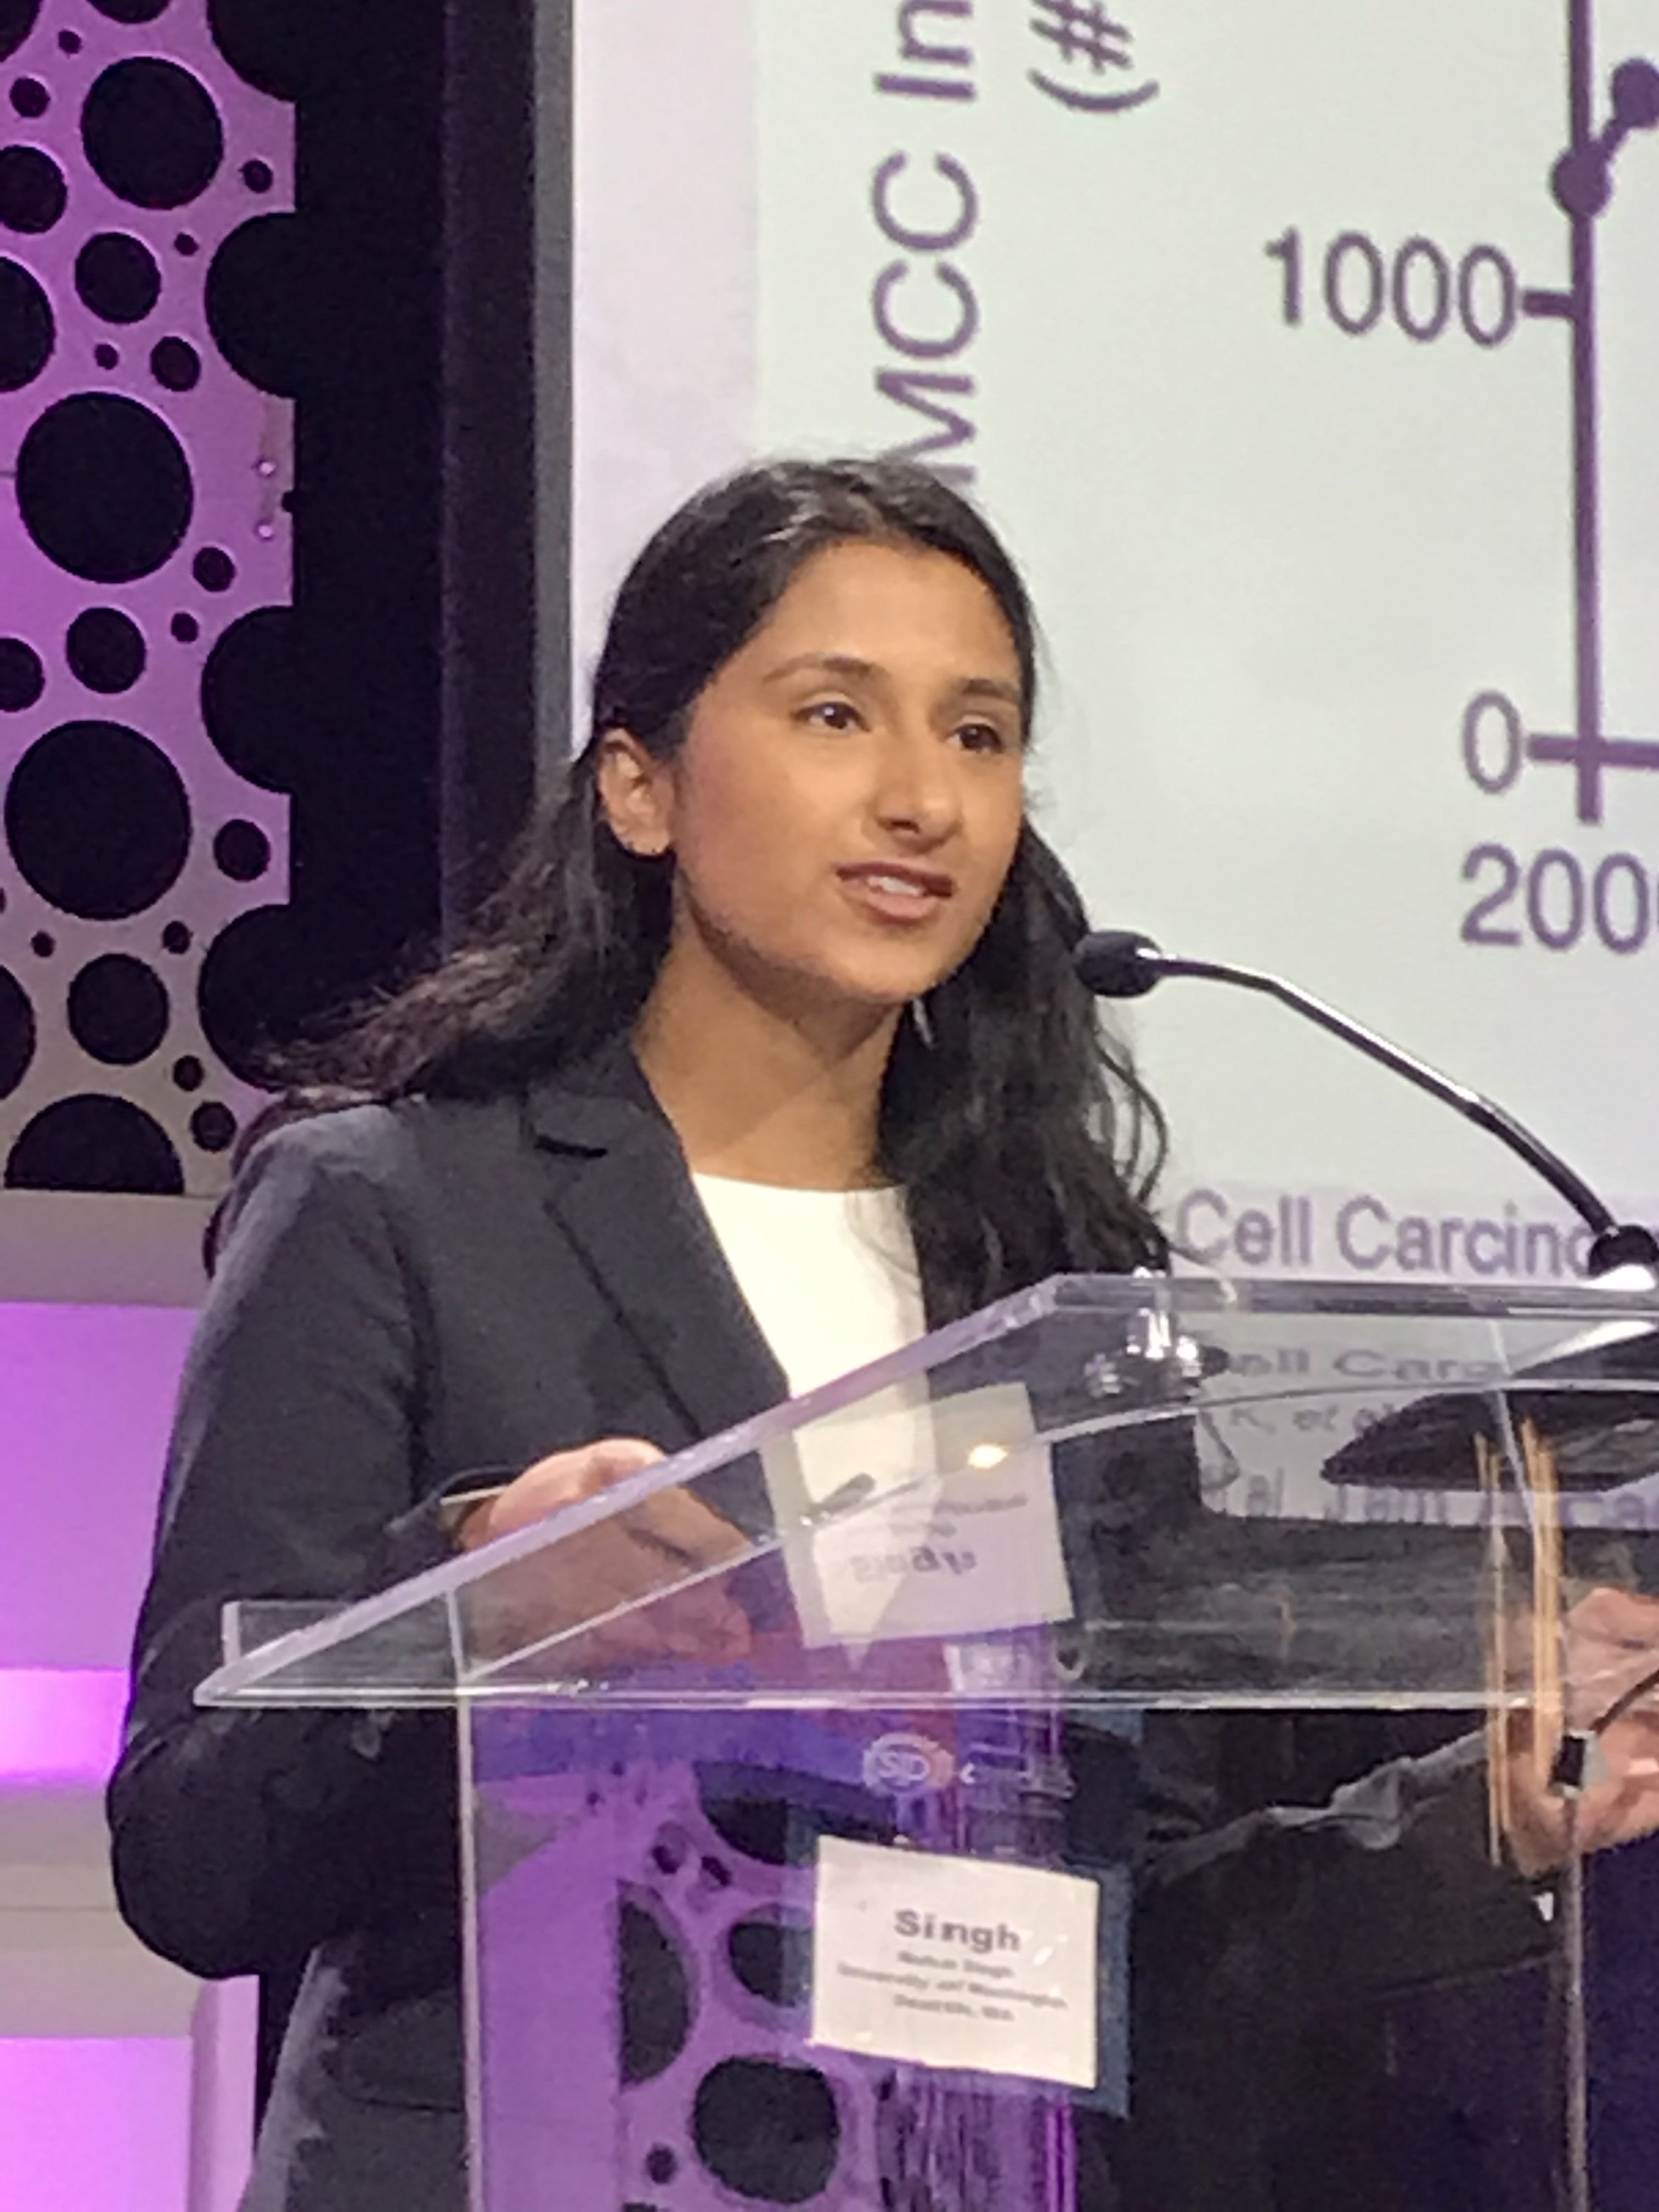
The results were a “surprise,” according to Neha Singh, a researcher in the division of dermatology at the University of Washington, Seattle. She contended that many treatment guidelines for MCC, including imaging at the time of diagnosis, are borrowed from those developed for melanoma but should not be.
“MCC is much more frequently metastatic to regional and distant sites than melanoma, so current melanoma guidelines may not be appropriate for use with MCC,” she said. According to the data she cited, 41% of MCC patients, versus 14% of melanoma patients, already have metastatic disease at the time of diagnosis.
The presence of more aggressive disease and the need for scanning was confirmed in the analysis of the MCC Registry in Seattle, which contains 1,439 patients. Of 586 patients who met inclusion criteria for this analysis, 493 MCC patients had no palpable lymph nodes at the time of diagnosis. Yet, 60 (12%) proved to already have regional or distant metastases on the basis of scans.
This contrasts starkly with melanoma data, according to Ms. Singh. Guidelines from the National Comprehensive Cancer Network (NCCN) do not recommend scans in melanoma patients without palpable lymph nodes based on evidence that only 1% of these will be upstaged by imaging. This figure was judged too small to justify routine scans, she said.
In melanoma patients with palpable lymph nodes, NCCN guidelines do recommend imaging at diagnosis because upstaging is common, and the same is true in MCC, Ms. Singh noted. In the Seattle registry, 10 (11%) of the 93 patients with palpable lymph nodes were upstaged for distant metastases found on imaging.
In those without palpable lymph nodes, “even a small tumor does not guarantee the absence of distant metastases,” Ms. Singh cautioned. Although the median tumor size in this group was 2.3 cm, tumors of less than 1 cm were still associated with distant disease.
The likelihood of distant disease in MCC patients without palpable lymph nodes might be even greater than that identified in this analysis. At least some of the patients in this series were evaluated with CT rather than PET imaging, which is more sensitive. Ms. Singh reported that no stratification to determine rates of distant disease by imaging type have yet been undertaken in this dataset.
Based on these findings, guidelines for MCC should include consideration of baseline imaging in all patients, Ms. Singh said. In making this point, she also emphasized the guidelines for melanoma should not be considered transferable to MCC.
“Why is this important?” Ms. Singh asked. Understaging MCC “may lead to inadequate surgery, overaggressive local therapy, and a potential delay to effective systemic therapy.”
CHICAGO – , including those without palpable lymph nodes, according to results of an analysis of a large MCC registry presented at the annual meeting of the Society for Investigative Dermatology.
The results were a “surprise,” according to Neha Singh, a researcher in the division of dermatology at the University of Washington, Seattle. She contended that many treatment guidelines for MCC, including imaging at the time of diagnosis, are borrowed from those developed for melanoma but should not be.
“MCC is much more frequently metastatic to regional and distant sites than melanoma, so current melanoma guidelines may not be appropriate for use with MCC,” she said. According to the data she cited, 41% of MCC patients, versus 14% of melanoma patients, already have metastatic disease at the time of diagnosis.
The presence of more aggressive disease and the need for scanning was confirmed in the analysis of the MCC Registry in Seattle, which contains 1,439 patients. Of 586 patients who met inclusion criteria for this analysis, 493 MCC patients had no palpable lymph nodes at the time of diagnosis. Yet, 60 (12%) proved to already have regional or distant metastases on the basis of scans.
This contrasts starkly with melanoma data, according to Ms. Singh. Guidelines from the National Comprehensive Cancer Network (NCCN) do not recommend scans in melanoma patients without palpable lymph nodes based on evidence that only 1% of these will be upstaged by imaging. This figure was judged too small to justify routine scans, she said.
In melanoma patients with palpable lymph nodes, NCCN guidelines do recommend imaging at diagnosis because upstaging is common, and the same is true in MCC, Ms. Singh noted. In the Seattle registry, 10 (11%) of the 93 patients with palpable lymph nodes were upstaged for distant metastases found on imaging.
In those without palpable lymph nodes, “even a small tumor does not guarantee the absence of distant metastases,” Ms. Singh cautioned. Although the median tumor size in this group was 2.3 cm, tumors of less than 1 cm were still associated with distant disease.
The likelihood of distant disease in MCC patients without palpable lymph nodes might be even greater than that identified in this analysis. At least some of the patients in this series were evaluated with CT rather than PET imaging, which is more sensitive. Ms. Singh reported that no stratification to determine rates of distant disease by imaging type have yet been undertaken in this dataset.
Based on these findings, guidelines for MCC should include consideration of baseline imaging in all patients, Ms. Singh said. In making this point, she also emphasized the guidelines for melanoma should not be considered transferable to MCC.
“Why is this important?” Ms. Singh asked. Understaging MCC “may lead to inadequate surgery, overaggressive local therapy, and a potential delay to effective systemic therapy.”
REPORTING FROM SID 2019
A 72-year-old white male with a history of psoriatic arthritis presented with a 1-year history of multiple, intermittently pruritic papules on his face and trunk
Scleromyxedema
area, characteristically involving the glabella and ears. In some patients, the skin may be intensely pruritic, but this is not a universal finding and varies considerably among patients. In addition to affecting the skin, scleromyxedema has variable multisystem effects on the gastrointestinal tract, and musculoskeletal, pulmonary, cardiovascular, renal, and central nervous systems. The most common symptoms are proximal muscle weakness, dysphagia, and dyspnea on exertion. Scleromyxedema can also be associated with a paraproteinemia, mainly immunoglobulin G-lambda type.

Scleromyxedema shares some features with other cutaneous diseases, and the main differential diagnosis includes localized scleromyxedema, also known as lichen myxedematosus. Lichen myxedematosus presents with waxy, firm papules and plaques. Systemic involvement and monoclonal gammopathy are characteristically absent. Scleroderma differs given the increase in fibrosis of cutaneous lesions, a higher percentage of Raynaud’s phenomenon, prominent lung disease, and autoantibodies.
On histopathologic review, scleromyxedema is associated with papular and mucin deposition, and increased fibroblast proliferation. The punch biopsy of the exhibited patient demonstrated a dome-shaped dermal nodule composed of fibroblasts in an edematous stroma. An Alcian blue stain highlighted increased mucin in the dermis and S-100 staining highlighted rare cells in the dermis.

The treatment of choice for scleromyxedema varies but includes intravenous immunoglobulins, systemic glucocorticosteroids, thalidomide, or immunosuppressant medications. In this patient, an IgG paraproteinemia was found on serum protein electrophoresis. The patient was evaluated by hematology-oncology, and no underlying myeloproliferative or dysplastic disease was found. The patient was started on intravenous immunoglobulin infusions with near complete resolution of his eruption and arthritic symptoms.
This case and photo were submitted by Jennifer Maldonado, a medical student at Nova Southeastern University, Ft. Lauderdale, Fla., and Kate Oberlin, MD, and Brian Morrison, MD, of the department of dermatology and cutaneous surgery, University of Miami; and Michelle Demory Beckler, PhD, of the College of Osteopathic Medicine and the department of microbiology, College of Medical Sciences, Nova Southeastern University.
Dr. Bilu Martin is a board-certified dermatologist in private practice at Premier Dermatology, MD, in Aventura, Fla. More diagnostic cases are available at mdedge.com/dermatology. To submit a case for possible publication, send an email to [email protected].
Scleromyxedema
area, characteristically involving the glabella and ears. In some patients, the skin may be intensely pruritic, but this is not a universal finding and varies considerably among patients. In addition to affecting the skin, scleromyxedema has variable multisystem effects on the gastrointestinal tract, and musculoskeletal, pulmonary, cardiovascular, renal, and central nervous systems. The most common symptoms are proximal muscle weakness, dysphagia, and dyspnea on exertion. Scleromyxedema can also be associated with a paraproteinemia, mainly immunoglobulin G-lambda type.
Scleromyxedema shares some features with other cutaneous diseases, and the main differential diagnosis includes localized scleromyxedema, also known as lichen myxedematosus. Lichen myxedematosus presents with waxy, firm papules and plaques. Systemic involvement and monoclonal gammopathy are characteristically absent. Scleroderma differs given the increase in fibrosis of cutaneous lesions, a higher percentage of Raynaud’s phenomenon, prominent lung disease, and autoantibodies.
On histopathologic review, scleromyxedema is associated with papular and mucin deposition, and increased fibroblast proliferation. The punch biopsy of the exhibited patient demonstrated a dome-shaped dermal nodule composed of fibroblasts in an edematous stroma. An Alcian blue stain highlighted increased mucin in the dermis and S-100 staining highlighted rare cells in the dermis.
The treatment of choice for scleromyxedema varies but includes intravenous immunoglobulins, systemic glucocorticosteroids, thalidomide, or immunosuppressant medications. In this patient, an IgG paraproteinemia was found on serum protein electrophoresis. The patient was evaluated by hematology-oncology, and no underlying myeloproliferative or dysplastic disease was found. The patient was started on intravenous immunoglobulin infusions with near complete resolution of his eruption and arthritic symptoms.
This case and photo were submitted by Jennifer Maldonado, a medical student at Nova Southeastern University, Ft. Lauderdale, Fla., and Kate Oberlin, MD, and Brian Morrison, MD, of the department of dermatology and cutaneous surgery, University of Miami; and Michelle Demory Beckler, PhD, of the College of Osteopathic Medicine and the department of microbiology, College of Medical Sciences, Nova Southeastern University.
Dr. Bilu Martin is a board-certified dermatologist in private practice at Premier Dermatology, MD, in Aventura, Fla. More diagnostic cases are available at mdedge.com/dermatology. To submit a case for possible publication, send an email to [email protected].

C-sections play role in 300% higher severe maternal morbidity in twin pregnancies
according to findings from the prospective EPIMOMS study.

The population-based incidence of severe acute maternal morbidity occurring between 22 weeks’ of gestation and 42 days post partum in the 2012-2013 French multicenter study was 6.2% among 3,202 twin pregnancies and 1.3% among 179,107 singleton pregnancies, Hugo Madar, MD, MPH, of Bordeaux University Hospital, France, and colleagues reported on behalf of the EPIMOMS (Epidémiologie de la Morbidité Maternelle Sévère) study group.
For the current analysis – a population-based, cohort-nested, case-control analysis of study data – the investigators compared 2,500 case patients (8% had twin pregnancies) and 3,650 controls (2% had twin pregnancies) who did not experience severe acute maternal morbidity during that time period (odds ratio, 4.7). After accounting for confounding factors, the increased risk among women with twin versus singleton pregnancies persisted (OR, 4.2) during both the antepartum (OR, 4.1) and intrapartum/postpartum (OR, 4.2) periods.
The majority of events (77%) occurred during the latter periods, and the two most common underlying causal conditions were severe obstetric hemorrhage (66%) and severe hypertensive complications (20%); however, the increased risk in twin pregnancies was apparent, regardless of the underlying cause.
The cesarean delivery rates for twin versus singleton pregnancies were 72% and 34%, respectively, in the case group, and 58% and 18%, respectively, in the control group. A path analysis taking potential indication bias into account showed that 21% of the total risk of intrapartum or postpartum severe acute maternal morbidity risk associated with twin pregnancy was mediated by cesarean delivery, Dr. Madar and associates noted, explaining that, “in other words, if twin pregnancies had the same probability of cesarean delivery as singleton pregnancies, the association found between twin pregnancy and intrapartum or postpartum severe acute maternal morbidity would be reduced by one-fifth.”
This provides further support for limiting the use of cesarean for twin deliveries to cases with clear medical indications, as increasing the rate of vaginal deliveries may decrease the rate of severe acute maternal morbidity, they concluded.
EPIMOMS was supported by the National Research Agency and the Ile de France Regional Health Agency. Dr. Madar received a training grant from the Aquitaine Regional Health Agency. The authors reported having no other relevant financial disclosures.
SOURCE: Madar H et al. Obstet Gynecol. 2019;133:1141-50.
Twin pregnancies are known to be associated with increased risk of maternal morbidity, so the findings of this “very well-designed” study by Madar et al. are “not strikingly different than what we know,” according to Ozhan M. Turan, MD, PhD.

These data alone will do little to change practice, but paired with an increased focus on training with respect to vaginal twin delivery – including in cases of breech presentation of the second baby – they could lead to improved maternal outcomes, he explained, adding that “breech extraction can be very fast and safe in skilled hands.”
Except for the lack of information in the study about whether the twins were monozygotic or dizygotic, the study is sound, and the data may prove useful for counseling patients about the risks and benefits of vaginal versus cesarean delivery and for promoting improved training of residents, maternal-fetal medicine fellows, and junior obstetricians in vaginal twin delivery techniques, he said.
Dr. Turan is director of the division of maternal and fetal medicine and of fetal therapy & complex obstetric surgery at the University of Maryland, Baltimore County. He reported having no relevant financial disclosures.
Twin pregnancies are known to be associated with increased risk of maternal morbidity, so the findings of this “very well-designed” study by Madar et al. are “not strikingly different than what we know,” according to Ozhan M. Turan, MD, PhD.
These data alone will do little to change practice, but paired with an increased focus on training with respect to vaginal twin delivery – including in cases of breech presentation of the second baby – they could lead to improved maternal outcomes, he explained, adding that “breech extraction can be very fast and safe in skilled hands.”
Except for the lack of information in the study about whether the twins were monozygotic or dizygotic, the study is sound, and the data may prove useful for counseling patients about the risks and benefits of vaginal versus cesarean delivery and for promoting improved training of residents, maternal-fetal medicine fellows, and junior obstetricians in vaginal twin delivery techniques, he said.
Dr. Turan is director of the division of maternal and fetal medicine and of fetal therapy & complex obstetric surgery at the University of Maryland, Baltimore County. He reported having no relevant financial disclosures.
according to findings from the prospective EPIMOMS study.
The population-based incidence of severe acute maternal morbidity occurring between 22 weeks’ of gestation and 42 days post partum in the 2012-2013 French multicenter study was 6.2% among 3,202 twin pregnancies and 1.3% among 179,107 singleton pregnancies, Hugo Madar, MD, MPH, of Bordeaux University Hospital, France, and colleagues reported on behalf of the EPIMOMS (Epidémiologie de la Morbidité Maternelle Sévère) study group.
For the current analysis – a population-based, cohort-nested, case-control analysis of study data – the investigators compared 2,500 case patients (8% had twin pregnancies) and 3,650 controls (2% had twin pregnancies) who did not experience severe acute maternal morbidity during that time period (odds ratio, 4.7). After accounting for confounding factors, the increased risk among women with twin versus singleton pregnancies persisted (OR, 4.2) during both the antepartum (OR, 4.1) and intrapartum/postpartum (OR, 4.2) periods.
The majority of events (77%) occurred during the latter periods, and the two most common underlying causal conditions were severe obstetric hemorrhage (66%) and severe hypertensive complications (20%); however, the increased risk in twin pregnancies was apparent, regardless of the underlying cause.
The cesarean delivery rates for twin versus singleton pregnancies were 72% and 34%, respectively, in the case group, and 58% and 18%, respectively, in the control group. A path analysis taking potential indication bias into account showed that 21% of the total risk of intrapartum or postpartum severe acute maternal morbidity risk associated with twin pregnancy was mediated by cesarean delivery, Dr. Madar and associates noted, explaining that, “in other words, if twin pregnancies had the same probability of cesarean delivery as singleton pregnancies, the association found between twin pregnancy and intrapartum or postpartum severe acute maternal morbidity would be reduced by one-fifth.”
This provides further support for limiting the use of cesarean for twin deliveries to cases with clear medical indications, as increasing the rate of vaginal deliveries may decrease the rate of severe acute maternal morbidity, they concluded.
EPIMOMS was supported by the National Research Agency and the Ile de France Regional Health Agency. Dr. Madar received a training grant from the Aquitaine Regional Health Agency. The authors reported having no other relevant financial disclosures.
SOURCE: Madar H et al. Obstet Gynecol. 2019;133:1141-50.
FROM OBSTETRICS & GYNECOLOGY
Canagliflozin after metabolic surgery may aid weight loss, reduce glucose levels
LOS ANGELES – Patients who took the sodium-glucose cotransporter-2 inhibitor canagliflozin after undergoing metabolic surgery experienced reductions in blood glucose, body mass index, and truncal body fat, results from a small pilot study have shown.

“We hypothesized that canagliflozin would be a good choice for these patients, because these drugs work independently of insulin,” the study’s principal investigator, Sangeeta R. Kashyap, MD, said in an interview at the annual scientific and clinical congress of the American Association of Clinical Endocrinologists. “They help promote weight loss and improve blood pressure. [After] bariatric surgery, patients have an issue with weight regain, and sometimes their diabetes comes back.”
In what she said is the first prospective, randomized, controlled trial of its kind, Dr. Kashyap, an endocrinologist at the Cleveland Clinic, and her colleagues enrolled 11 women and 5 men with type 2 diabetes who had undergone Roux-en-Y gastric bypass or sleeve gastrectomy to study the effects of canagliflozin on clinical parameters over a period of 6 months. At baseline, the patients’ mean body mass index was 39.2 kg/m2 and their mean hemoglobin A1c level was 7.4%. The researchers used maximum likelihood estimation in a linear mixed-effect model to deduce differences between the treatment and placebo groups. Patients randomized to the study drug were assigned a 6-month course of canagliflozin, starting on 100 mg for 2 weeks titrated up to 300 mg daily.
At 6 months, fasting glucose was significantly reduced in the canagliflozin group, compared with baseline (from 163 to 122 mg/dL; P = .007), but it rose in the placebo group (from 164 to 192 mg/dL), a between-group difference that fell short of statistical significance (P = .12). In addition, C-reactive protein in the treatment group fell from 8.9 mg/L to 3.9 mg/L, but rose from 1.6 mg/L to 4.7 mg/L in the placebo group, a between-group difference that trended toward significance (P = .07).
During the 6-month study period, the mean BMI fell from 39.6 kg/m2 to 38 kg/m2 in the canagliflozin group but increased from 38 to 41 in the placebo group, a between-group difference that reached statistical significance (P = .014). Mean changes in body fat (a reduction of 1.82%), truncal fat (a reduction of 2.67%), and android fat (a reduction of 3%) also reached statistical significance in the treatment group, compared with the placebo group. Reductions in adiponectin, leptin, and high–molecular weight adiponectin did not reach statistical significance.
“I think these drugs have a place in post–bariatric surgery care,” Dr. Kashyap said. “Canagliflozin after metabolic surgery improved weight-loss outcomes and blood sugar levels. It also improved abdominal fat levels, and in this way might even lower cardiovascular disease risk in these patients.”
She acknowledged the study’s small sample size and single-center design as limitations. “It was very difficult to recruit patients for this study,” she said. “Not many patients have recurrent diabetes after bariatric surgery.”
Janssen provided funding to Dr. Kashyap for the trial.
LOS ANGELES – Patients who took the sodium-glucose cotransporter-2 inhibitor canagliflozin after undergoing metabolic surgery experienced reductions in blood glucose, body mass index, and truncal body fat, results from a small pilot study have shown.
“We hypothesized that canagliflozin would be a good choice for these patients, because these drugs work independently of insulin,” the study’s principal investigator, Sangeeta R. Kashyap, MD, said in an interview at the annual scientific and clinical congress of the American Association of Clinical Endocrinologists. “They help promote weight loss and improve blood pressure. [After] bariatric surgery, patients have an issue with weight regain, and sometimes their diabetes comes back.”
In what she said is the first prospective, randomized, controlled trial of its kind, Dr. Kashyap, an endocrinologist at the Cleveland Clinic, and her colleagues enrolled 11 women and 5 men with type 2 diabetes who had undergone Roux-en-Y gastric bypass or sleeve gastrectomy to study the effects of canagliflozin on clinical parameters over a period of 6 months. At baseline, the patients’ mean body mass index was 39.2 kg/m2 and their mean hemoglobin A1c level was 7.4%. The researchers used maximum likelihood estimation in a linear mixed-effect model to deduce differences between the treatment and placebo groups. Patients randomized to the study drug were assigned a 6-month course of canagliflozin, starting on 100 mg for 2 weeks titrated up to 300 mg daily.
At 6 months, fasting glucose was significantly reduced in the canagliflozin group, compared with baseline (from 163 to 122 mg/dL; P = .007), but it rose in the placebo group (from 164 to 192 mg/dL), a between-group difference that fell short of statistical significance (P = .12). In addition, C-reactive protein in the treatment group fell from 8.9 mg/L to 3.9 mg/L, but rose from 1.6 mg/L to 4.7 mg/L in the placebo group, a between-group difference that trended toward significance (P = .07).
During the 6-month study period, the mean BMI fell from 39.6 kg/m2 to 38 kg/m2 in the canagliflozin group but increased from 38 to 41 in the placebo group, a between-group difference that reached statistical significance (P = .014). Mean changes in body fat (a reduction of 1.82%), truncal fat (a reduction of 2.67%), and android fat (a reduction of 3%) also reached statistical significance in the treatment group, compared with the placebo group. Reductions in adiponectin, leptin, and high–molecular weight adiponectin did not reach statistical significance.
“I think these drugs have a place in post–bariatric surgery care,” Dr. Kashyap said. “Canagliflozin after metabolic surgery improved weight-loss outcomes and blood sugar levels. It also improved abdominal fat levels, and in this way might even lower cardiovascular disease risk in these patients.”
She acknowledged the study’s small sample size and single-center design as limitations. “It was very difficult to recruit patients for this study,” she said. “Not many patients have recurrent diabetes after bariatric surgery.”
Janssen provided funding to Dr. Kashyap for the trial.
REPORTING FROM AACE 2019
Flu vaccine visits reveal missed opportunities for HPV vaccination
BALTIMORE – according to a study.
“Overall in preventive visits, missed opportunities were much higher for HPV, compared to the other two vaccines” recommended for adolescents, MenACWY (meningococcal conjugate vaccine) and Tdap, Mary Kate Kelly, MPH, of Children’s Hospital of Philadelphia, told attendees at the Pediatric Academic Societies annual meeting. “In order to increase vaccination rates, it’s essential to implement efforts to reduce missed opportunities.”
According to 2018 Centers for Disease Control and Prevention data, Ms. Kelly said, vaccine coverage for the HPV vaccine is approximately 66%, compared with 85% for the MenACWY vaccine and 89% for the Tdap vaccine.
Ms. Kelly and her colleagues investigated how often children or adolescents missed an opportunity to get an HPV vaccine when they received an influenza vaccine during an office visit. This study was part of the larger STOP HPV trial funded by the National Institutes of Health and aimed at implementing evidence-based interventions to reduce missed opportunities for HPV vaccination in primary care.
The researchers retrospectively reviewed EHRs from 2015 to 2018 for 48 pediatric practices across 19 states. All practices were part of the American Academy of Pediatrics’ Pediatric Research in Office Settings (PROS) national pediatric primary care network. The researchers isolated all visits for patients aged 11-17 years who received their flu vaccine and were eligible to receive the HPV vaccine.
The investigators defined a missed opportunity as one in which a patient was due for the HPV vaccine but did not receive one at the visit when they received their flu vaccine.
The study involved 40,129 patients who received the flu vaccine at 52,818 visits when they also were eligible to receive the HPV vaccine. The median age of patients was 12 years old, and 47% were female.
In 68% of visits, the patient could have received an HPV vaccine but did not – even though they were due and eligible for one. The rate was the same for boys and for girls. By contrast, only 38% of visits involved a missed opportunity for the MenACWY vaccines and 39% for the Tdap vaccine.
Rates of missed opportunities for HPV vaccination ranged among individual practices from 22% to 81% of overall visits. Patients were more than twice as likely to miss the opportunity for an HPV vaccine dose if it would have been their first dose – 70% of missed opportunities – versus being a second or third dose, which comprised 30% of missed opportunities (adjusted relative risk, 2.48; P less than .001)).
“However, missed opportunities were also common for subsequent HPV doses when vaccine hesitancy is less likely to be an issue,” Ms. Kelly added.
It also was much more likely that missed opportunities occurred during nurse visits or visits for an acute or chronic condition rather than preventive visits, which made up about half (51%) of all visits analyzed. While 48% of preventive visits involved a missed opportunity, 93% of nurse visits (aRR compared with preventive, 2.18; P less than.001) and 89% of acute or chronic visits (aRR, 2.11; P less than .001) did.
Percentages of missed opportunities were similarly high for the MenACWY and Tdap vaccines at nurse visits and acute/chronic visits, but much lower at preventive visits for the MenACWY (12%) and Tdap (15%) vaccines.
“Increasing simultaneous administration of HPV and other adolescent vaccines with the influenza vaccine may help to improve coverage,” Ms. Kelly concluded.
The study was limited by its use of a convenience sample from practices that were interested in participating and willing to stock the HPV vaccine. Additionally, the researchers could not detect or adjust for EHR errors or inaccurate or incomplete vaccine histories, and they were unable to look at vaccine hesitancy or refusal with the EHRs.
The research was funded by the National Institutes of Health, the U.S. Department of Health & Human Services, and the National Research Network to Improve Children’s Health. The authors reported no relevant financial disclosures.
REPORTING FROM PAS 2019
Higher plasma cell-free DNA tracks with worse PAH survival
NEW ORLEANS – Cell-free (cf) DNA looked like an informative biomarker for both the severity of pulmonary artery hypertension and the survival prognosis for patients with this disease, based on results from two preliminary studies involving a total of 173 people.
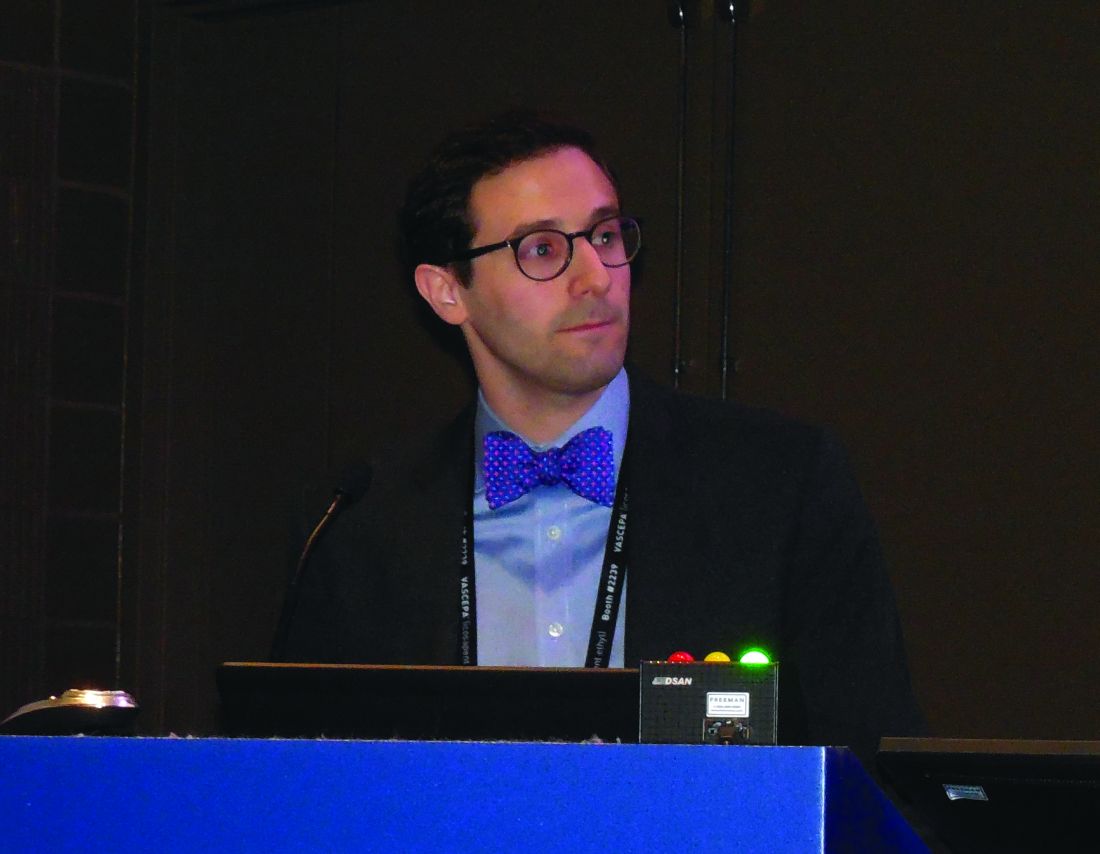
“Plasma levels of cell-free DNA are elevated in patients with pulmonary artery hypertension, compared with healthy controls, and may predict disease severity and mortality,” Samuel B. Brusca, MD, said at the at the annual meeting of the American College of Cardiology.
A growing biomedical literature has documented a role for cfDNA in tracking the course of cancer, septic shock, and transplanted organs (Transplantation. 2019 Feb;103[2]:273-83) (Cell-Free DNA: Applications in Different Diseases, in “Cell-free DNA as Diagnostic Markers.” [New York: Humana Press, 2018, pp. 3-12]). Based on this background Dr. Brusca and his associates decided to examine whether plasma levels of cfDNA linked with pulmonary artery hypertension (PAH) severity and survival.
Their first study included seven patients with mild PAH (defined as patients with a tricuspid annular plane systolic excursion [TAPSE] of more than 18 mm and a maximum oxygen uptake [VO2] of at least 75% of predicted), eight with severe PAH (a TAPSE of 18 mm or less and a VO2 of less than 75%), and seven healthy adult controls. Measurement of plasma cfDNA showed an average level of 19.4 ng/mL among the healthy controls (prior reports had indicated that 10-20 ng/mL were normal levels), 22.0 ng/mL among patients with mild PAH, and 36.2 ng/mL in those with severe PAH. The level among the severe PAH patients was significantly higher than the level in controls by two different statistical tests, said Dr. Brusca, a critical care medicine physician at the National Institutes of Health Clinical Center in Bethesda, Md.
The second analysis by Dr. Brusca and his associates included 151 PAH patients followed by physicians at the Clinical Center for an average of 40 months. Their analysis tracked survival of these patients relative to their baseline levels of cfDNA and divided into tertiles. Patients in the lowest tertile had a starting cfDNA level of up to 39 ng/mL, those in the middle tertile had levels of 39.1-64.0 ng/mL, and those in the top tertile had levels of at least 64.1 ng/mL. A Kaplan-Meier analysis showed statistically significant differences in survival rates between each of the tertiles. Patients in the lowest tertile had a 5-year actuarial survival rate of about 65%, those in the middle tertile had a survival rate of about 48%, and those in the tertile with the highest level of cfDNA had a survival rate of about 28%.
Additional studies of cfDNA are needed in larger numbers of PAH patients, and cfDNA levels should be compared with levels of other, more established biomarkers, such as inflammatory cytokines, Dr. Brusca said in an interview.
Dr. Brusca had no disclosures. The study received no commercial funding.
SOURCE: Brusca SB et al. J Am Coll Cardiol. 2019 March 12;73(9 Suppl 1):1897.
I was very excited to hear Dr. Brusca’s report on using cell-free (cf) DNA to track the severity of pulmonary artery hypertension and survival of these patients. I’m now using cfDNA frequently to monitor heart transplant patients, and the information it provides has been very valuable. But cfDNA may be even better suited to assessing patients with pulmonary artery hypertension (PAH) because it’s a vascular disease, and increases in cfDNA appears to reflect damage to the vascular endothelium. It’s a brilliant application of this technology. Brain natriuretic peptide and troponin are markers of right heart damage, but cfDNA appears to be able to track the progression of the vascular component of PAH. It appears to be the first disease-specific biomarker we have for PAH. It’s time to start routinely measuring levels of cfDNA in trials so we can gather more data on the clinical correlates of changing levels of this biomarker.
I was very excited to hear Dr. Brusca’s report on using cell-free (cf) DNA to track the severity of pulmonary artery hypertension and survival of these patients. I’m now using cfDNA frequently to monitor heart transplant patients, and the information it provides has been very valuable. But cfDNA may be even better suited to assessing patients with pulmonary artery hypertension (PAH) because it’s a vascular disease, and increases in cfDNA appears to reflect damage to the vascular endothelium. It’s a brilliant application of this technology. Brain natriuretic peptide and troponin are markers of right heart damage, but cfDNA appears to be able to track the progression of the vascular component of PAH. It appears to be the first disease-specific biomarker we have for PAH. It’s time to start routinely measuring levels of cfDNA in trials so we can gather more data on the clinical correlates of changing levels of this biomarker.
I was very excited to hear Dr. Brusca’s report on using cell-free (cf) DNA to track the severity of pulmonary artery hypertension and survival of these patients. I’m now using cfDNA frequently to monitor heart transplant patients, and the information it provides has been very valuable. But cfDNA may be even better suited to assessing patients with pulmonary artery hypertension (PAH) because it’s a vascular disease, and increases in cfDNA appears to reflect damage to the vascular endothelium. It’s a brilliant application of this technology. Brain natriuretic peptide and troponin are markers of right heart damage, but cfDNA appears to be able to track the progression of the vascular component of PAH. It appears to be the first disease-specific biomarker we have for PAH. It’s time to start routinely measuring levels of cfDNA in trials so we can gather more data on the clinical correlates of changing levels of this biomarker.
NEW ORLEANS – Cell-free (cf) DNA looked like an informative biomarker for both the severity of pulmonary artery hypertension and the survival prognosis for patients with this disease, based on results from two preliminary studies involving a total of 173 people.
“Plasma levels of cell-free DNA are elevated in patients with pulmonary artery hypertension, compared with healthy controls, and may predict disease severity and mortality,” Samuel B. Brusca, MD, said at the at the annual meeting of the American College of Cardiology.
A growing biomedical literature has documented a role for cfDNA in tracking the course of cancer, septic shock, and transplanted organs (Transplantation. 2019 Feb;103[2]:273-83) (Cell-Free DNA: Applications in Different Diseases, in “Cell-free DNA as Diagnostic Markers.” [New York: Humana Press, 2018, pp. 3-12]). Based on this background Dr. Brusca and his associates decided to examine whether plasma levels of cfDNA linked with pulmonary artery hypertension (PAH) severity and survival.
Their first study included seven patients with mild PAH (defined as patients with a tricuspid annular plane systolic excursion [TAPSE] of more than 18 mm and a maximum oxygen uptake [VO2] of at least 75% of predicted), eight with severe PAH (a TAPSE of 18 mm or less and a VO2 of less than 75%), and seven healthy adult controls. Measurement of plasma cfDNA showed an average level of 19.4 ng/mL among the healthy controls (prior reports had indicated that 10-20 ng/mL were normal levels), 22.0 ng/mL among patients with mild PAH, and 36.2 ng/mL in those with severe PAH. The level among the severe PAH patients was significantly higher than the level in controls by two different statistical tests, said Dr. Brusca, a critical care medicine physician at the National Institutes of Health Clinical Center in Bethesda, Md.
The second analysis by Dr. Brusca and his associates included 151 PAH patients followed by physicians at the Clinical Center for an average of 40 months. Their analysis tracked survival of these patients relative to their baseline levels of cfDNA and divided into tertiles. Patients in the lowest tertile had a starting cfDNA level of up to 39 ng/mL, those in the middle tertile had levels of 39.1-64.0 ng/mL, and those in the top tertile had levels of at least 64.1 ng/mL. A Kaplan-Meier analysis showed statistically significant differences in survival rates between each of the tertiles. Patients in the lowest tertile had a 5-year actuarial survival rate of about 65%, those in the middle tertile had a survival rate of about 48%, and those in the tertile with the highest level of cfDNA had a survival rate of about 28%.
Additional studies of cfDNA are needed in larger numbers of PAH patients, and cfDNA levels should be compared with levels of other, more established biomarkers, such as inflammatory cytokines, Dr. Brusca said in an interview.
Dr. Brusca had no disclosures. The study received no commercial funding.
SOURCE: Brusca SB et al. J Am Coll Cardiol. 2019 March 12;73(9 Suppl 1):1897.
REPORTING FROM ACC 2019
Various adjuncts to IVIg help treat coronary artery abnormalities in pediatric Kawasaki disease
Two studies published in Pediatrics add new information on potential therapies as adjuncts to intravenous immunoglobulin to treat coronary artery abnormalities in pediatric Kawasaki disease patients.

In the phase 3, randomized, placebo-controlled EATAK (Etanercept as Adjunctive Treatment for Acute Kawasaki Disease) trial, Michael A. Portman, MD, and his colleagues examine the effects of adding etanercept to intravenous immunoglobulin (IVIg) to study IVIg resistance in children with Kawasaki disease.
The researchers enrolled 201 participants from eight pediatric centers who received an IVIg infusion followed immediately by either subcutaneous etanercept (0.8 mg/kg; n = 100) or placebo (n = 101) and then received two more weekly doses. They performed a subgroup analysis based on age, gender, and race. The participants were between 2 months and 18 years old with incomplete (10 etanercept, 12 placebo) or complete Kawasaki disease as determined by American Heart Association criteria and American Academy of Pediatrics 2004 criteria.
Of the 35 patients who showed IVIg resistance and received a second dose, the IVIg resistance rate for participants receiving etanercept was 13%, compared with 22% in the placebo group. The overall odds ratio for IVIg resistance was 0.54. While etanercept did not lower the rate of IVIg resistance in participants younger than 1 year old, it significantly reduced IVIg resistance in those older than 1 year.
IVIg fever response significantly differed by race, which ranged from Asian participants having a 7% resistance rate to African Americans having a resistance rate of 57%.
Forty-five of all participants had greater than 2.5 baseline coronary z scores, 23 in the etanercept group and 22 in the placebo group. While etanercept reduced change in coronary z score among participants with baseline dilation (P = .04) and without baseline dilation (P = .001), there was no improvement among participants in the placebo group. Etanercept additionally reduced progression of dilation, compared with the placebo group (P = .03). The researchers noted etanercept had a good safety profile, and there were no differences between the groups receiving the intervention or placebo.
“With these considerations, EATAK results reveal a reasonable risk/benefit profile for etanercept,” Dr. Portman of Seattle Children’s Research Institute, and his colleagues concluded. “Future clinical trials, conducted in these subgroups or stratified according to patient demographics or genotypes, will be necessary to validate our findings before wide clinical adoption.”
In a second study, Audrey Dionne, MD, of Boston Children’s Hospital, and her colleagues explored how corticosteroids or infliximab together with IVIg can reduce the progression of coronary artery aneurysms (CAA). They performed a retrospective study of 121 children (73% boys; median age, 3 years) with Kawasaki disease and CAA at three different centers who received corticosteroid and IVIg therapy (n = 30), infliximab and IVIg therapy (n = 58), or IVIg alone (n = 33). The children had a coronary z score greater than or equal to 2.5 and less than 10, and there were no significant differences between median z scores among the treatment groups (P = .39).
The researchers found that patients who received corticosteroids with IVIg therapy were protected against coronary size progression (coefficient, −1.31); in addition, those patients who received infliximab and IVIg therapy were protected against coronary size progression at follow-up (coefficient, −1.07), the researchers said. Those on placebo were not.
“Our data suggest that adjunctive treatment at the time of diagnosis may be beneficial in patients with CAA,” Dr. Dionne and colleagues concluded. “Future adequately powered, prospective randomized trials are needed to determine the best adjunctive treatment of patients with KD [Kawasaki disease] who present with coronary changes.”
The EATAK trial was funded by the Food and Drug Administration Office of Orphan Product Development, Amgen, and the National Institutes of Health. Dr. Portman and colleagues reported no relevant financial disclosures. The study from Dionne et al. received funding from the McCance Family Foundation and the Vella Fund. One of the authors reported being a paid expert witness for missed diagnoses of Kawasaki disease, which was unrelated to the study. The other authors said they had no conflicts of interest.
SOURCES: Portman MA et al. Pediatrics. 2019. doi: 10.1542/peds.2018-3675; Dionne A et al. Pediatrics. 2019. doi: 10.1542/peds.2018-3341.
Two studies published in Pediatrics add new information on potential therapies as adjuncts to intravenous immunoglobulin to treat coronary artery abnormalities in pediatric Kawasaki disease patients.
In the phase 3, randomized, placebo-controlled EATAK (Etanercept as Adjunctive Treatment for Acute Kawasaki Disease) trial, Michael A. Portman, MD, and his colleagues examine the effects of adding etanercept to intravenous immunoglobulin (IVIg) to study IVIg resistance in children with Kawasaki disease.
The researchers enrolled 201 participants from eight pediatric centers who received an IVIg infusion followed immediately by either subcutaneous etanercept (0.8 mg/kg; n = 100) or placebo (n = 101) and then received two more weekly doses. They performed a subgroup analysis based on age, gender, and race. The participants were between 2 months and 18 years old with incomplete (10 etanercept, 12 placebo) or complete Kawasaki disease as determined by American Heart Association criteria and American Academy of Pediatrics 2004 criteria.
Of the 35 patients who showed IVIg resistance and received a second dose, the IVIg resistance rate for participants receiving etanercept was 13%, compared with 22% in the placebo group. The overall odds ratio for IVIg resistance was 0.54. While etanercept did not lower the rate of IVIg resistance in participants younger than 1 year old, it significantly reduced IVIg resistance in those older than 1 year.
IVIg fever response significantly differed by race, which ranged from Asian participants having a 7% resistance rate to African Americans having a resistance rate of 57%.
Forty-five of all participants had greater than 2.5 baseline coronary z scores, 23 in the etanercept group and 22 in the placebo group. While etanercept reduced change in coronary z score among participants with baseline dilation (P = .04) and without baseline dilation (P = .001), there was no improvement among participants in the placebo group. Etanercept additionally reduced progression of dilation, compared with the placebo group (P = .03). The researchers noted etanercept had a good safety profile, and there were no differences between the groups receiving the intervention or placebo.
“With these considerations, EATAK results reveal a reasonable risk/benefit profile for etanercept,” Dr. Portman of Seattle Children’s Research Institute, and his colleagues concluded. “Future clinical trials, conducted in these subgroups or stratified according to patient demographics or genotypes, will be necessary to validate our findings before wide clinical adoption.”
In a second study, Audrey Dionne, MD, of Boston Children’s Hospital, and her colleagues explored how corticosteroids or infliximab together with IVIg can reduce the progression of coronary artery aneurysms (CAA). They performed a retrospective study of 121 children (73% boys; median age, 3 years) with Kawasaki disease and CAA at three different centers who received corticosteroid and IVIg therapy (n = 30), infliximab and IVIg therapy (n = 58), or IVIg alone (n = 33). The children had a coronary z score greater than or equal to 2.5 and less than 10, and there were no significant differences between median z scores among the treatment groups (P = .39).
The researchers found that patients who received corticosteroids with IVIg therapy were protected against coronary size progression (coefficient, −1.31); in addition, those patients who received infliximab and IVIg therapy were protected against coronary size progression at follow-up (coefficient, −1.07), the researchers said. Those on placebo were not.
“Our data suggest that adjunctive treatment at the time of diagnosis may be beneficial in patients with CAA,” Dr. Dionne and colleagues concluded. “Future adequately powered, prospective randomized trials are needed to determine the best adjunctive treatment of patients with KD [Kawasaki disease] who present with coronary changes.”
The EATAK trial was funded by the Food and Drug Administration Office of Orphan Product Development, Amgen, and the National Institutes of Health. Dr. Portman and colleagues reported no relevant financial disclosures. The study from Dionne et al. received funding from the McCance Family Foundation and the Vella Fund. One of the authors reported being a paid expert witness for missed diagnoses of Kawasaki disease, which was unrelated to the study. The other authors said they had no conflicts of interest.
SOURCES: Portman MA et al. Pediatrics. 2019. doi: 10.1542/peds.2018-3675; Dionne A et al. Pediatrics. 2019. doi: 10.1542/peds.2018-3341.
FROM PEDIATRICS
A breath of objectivity
How many minutes do you spend each day trying to coax new parents off the guilt train? They have delayed their childbearing until they felt comfortable economically and emotionally ready to raise a child. Convinced that up to this point they have done enough correctly to be considered successful, they see no reason that they won’t be able to tackle parenthood just as easily. Their black lab is a model of obedience. Housebreaking him was a breeze. They are skilled at using the Internet and social media to gather the information they will need for raising a child.
However, at some point in the first 72 hours after the birth of their child, most parents are going to hit the wall of reality. It may be that breastfeeding doesn’t work as well their cousin told them it would or simply that babies cry, often for no discernible reason. Desperately wanting to do what’s right for their child, guilt creeps in as the little failures and fatigue begin to accumulate.
In their search for answers, new parents naturally come to us as pediatricians and family practitioners for the facts, but they also will search the Internet, talk to lactation consultants, and be bombarded by unsolicited advice from family members and neighbors. Every source they turn to, including physicians, will be filtered through its own bias.
I recently came across the most sensible advice for new parents I have read in a long time, and it came not from a pediatrician but from an economics professor at Brown University. Emily Oster, PhD, writing in the New York Times, examines the available data on the topics of breastfeeding, sleep training, and parents working out of the home with the objectivity of an economist and the sensitivity of a mother who has been there and done that (“The Data All Guilt-Ridden Parents Need,” New York Times, April 19, 2019).

For example, she observes that many of the benefits of breastfeeding are supported by some evidence, “just not always especially good evidence. And even when the evidence is good, the benefits are smaller than many people realize.” She points out that “most studies of breastfeeding are biased by the fact that women who breastfeed are typically different from those who do not.” I will leave it to you to read her full discussion that includes a comparison of random trials versus observational studies. But she concludes that, if one relies on only good evidence, the only demonstrable benefit of breastfeeding is for mothers who nurse longer than 12 months who may have a 20%-30% decrease in breast cancer risk.
Using the same kind of careful analysis, Dr. Oster finds that sleep training may have a short-term benefit for parents who will have improved sleep and less maternal depression, but in the long run children who were sleep trained were no different than those that weren’t.
She also finds that, when it comes to the “optimal configuration of adult work hours” for a household, there is “no compelling evidence that proves that having a stay-at-home parent affects child outcomes, positively or negatively.” It is up to each household what works best for all it members, not just the child.
I found it particularly helpful as a practitioner who has often felt shackled, or at least disadvantaged, by the American Academy of Pediatrics’ overly simplistic and sometimes biased recommendations on issues that send my patients’ parents on unfortunate and avoidable guilt trips.
Dr. Wilkoff practiced primary care pediatrics in Brunswick, Maine for nearly 40 years. He has authored several books on behavioral pediatrics, including “How to Say No to Your Toddler.” Email him at [email protected].
How many minutes do you spend each day trying to coax new parents off the guilt train? They have delayed their childbearing until they felt comfortable economically and emotionally ready to raise a child. Convinced that up to this point they have done enough correctly to be considered successful, they see no reason that they won’t be able to tackle parenthood just as easily. Their black lab is a model of obedience. Housebreaking him was a breeze. They are skilled at using the Internet and social media to gather the information they will need for raising a child.
However, at some point in the first 72 hours after the birth of their child, most parents are going to hit the wall of reality. It may be that breastfeeding doesn’t work as well their cousin told them it would or simply that babies cry, often for no discernible reason. Desperately wanting to do what’s right for their child, guilt creeps in as the little failures and fatigue begin to accumulate.
In their search for answers, new parents naturally come to us as pediatricians and family practitioners for the facts, but they also will search the Internet, talk to lactation consultants, and be bombarded by unsolicited advice from family members and neighbors. Every source they turn to, including physicians, will be filtered through its own bias.
I recently came across the most sensible advice for new parents I have read in a long time, and it came not from a pediatrician but from an economics professor at Brown University. Emily Oster, PhD, writing in the New York Times, examines the available data on the topics of breastfeeding, sleep training, and parents working out of the home with the objectivity of an economist and the sensitivity of a mother who has been there and done that (“The Data All Guilt-Ridden Parents Need,” New York Times, April 19, 2019).
For example, she observes that many of the benefits of breastfeeding are supported by some evidence, “just not always especially good evidence. And even when the evidence is good, the benefits are smaller than many people realize.” She points out that “most studies of breastfeeding are biased by the fact that women who breastfeed are typically different from those who do not.” I will leave it to you to read her full discussion that includes a comparison of random trials versus observational studies. But she concludes that, if one relies on only good evidence, the only demonstrable benefit of breastfeeding is for mothers who nurse longer than 12 months who may have a 20%-30% decrease in breast cancer risk.
Using the same kind of careful analysis, Dr. Oster finds that sleep training may have a short-term benefit for parents who will have improved sleep and less maternal depression, but in the long run children who were sleep trained were no different than those that weren’t.
She also finds that, when it comes to the “optimal configuration of adult work hours” for a household, there is “no compelling evidence that proves that having a stay-at-home parent affects child outcomes, positively or negatively.” It is up to each household what works best for all it members, not just the child.
I found it particularly helpful as a practitioner who has often felt shackled, or at least disadvantaged, by the American Academy of Pediatrics’ overly simplistic and sometimes biased recommendations on issues that send my patients’ parents on unfortunate and avoidable guilt trips.
Dr. Wilkoff practiced primary care pediatrics in Brunswick, Maine for nearly 40 years. He has authored several books on behavioral pediatrics, including “How to Say No to Your Toddler.” Email him at [email protected].
Experimental drug holds promise for the treatment of thyroid eye disease
LOS ANGELES – researchers reported at the annual scientific and clinical congress of the American Association of Clinical Endocrinologists.
“For the first time, there appears to be a medicine that can be given during the active phase of the disease and can actually reverse not just the eyelid swelling and the clinical activity score, but also reduce the eye bulging and double vision and [improve] the [patient’s] quality of life. It could be a watershed moment in the treatment of the disease,” said ophthalmologist Raymond Douglas, MD, PhD, professor of surgery at Cedar-Sinai Medical Center Los Angeles and the study’s coprincipal investigator, in an interview at the meeting.
According to Dr. Douglas, thyroid eye disease, which is also known as Graves’ eye disease, is a severely disabling condition that causes swelling, pain, discomfort, and blindness. “The burden really is quite significant,” he said, with an impact that’s been compared with that of breast cancer in quality-of-life studies.
“Current treatments for thyroid eye disease are rather limited,” he said. “They really encompass just reducing the swelling and the short-term manifestations of the disease. Treatments such as IV steroids and radiation have been shown to not have any effect on long-term manifestations such as eye bulging and double vision.”
Teprotumumab is a fully human monoclonal antibody that targets the insulinlike growth factor I receptor (IGF-IR). It seems to downregulate thyroid eye disease, Dr. Douglas said.
Researchers studied the drug in a randomized, placebo-controlled study: 41 patients were designated to receive eight intravenous infusions of the drug over 21 weeks (10 mg/kg for the first infusion, then 20 mg/kg thereafter). At week 24, 83% of the study group (34 of 41 patients) reached the endpoint of a reduction of eye bulging by at least 2 mm, compared with 10% of patients (4 of 42) in the placebo group, which received infusions of saline solution.
Two millimeters is significant, Dr. Douglas said. “If you noticed someone’s eye was bulging 2 millimeters, you’d say, ‘Hey, I think something is wrong with your eye.’ ”
Initial study results were released in February 2019. New data about secondary endpoints were released at the AACE meeting: Researchers reported that the average reduction in proptosis (eye bulging) was 2.82 mm in the study group, compared with 0.54 mm in the placebo group (P less than .001).
Dr. Douglas said he can “achieve 3 mm of reduction through surgery to drill out the bone between the eye and the brain. [The patients in the study group] were able to achieve almost 3 millimeters of reduction by the drug alone. It’s a rather significant improvement.”
The new data also provided some insight into the timing of clinical improvements. According to Dr. Douglas, “most of the endpoints were met as early as 6 weeks or [after] two infusions of this drug.”
The adverse effects were relatively mild and included muscle spasms, said Dr. Douglas. The side effects seem to be “well tolerated,” he noted, and none led to cessation of therapy.
Participants with potential for motherhood or fatherhood during the trial had to agree to take precautions to avoid becoming pregnant or impregnating a partner.
Dr. Douglas didn’t provide cost information about the drug. However, it seems likely to be expensive. A writer with Seeking Alpha, a stock market analysis site, estimated that the cost could reach “$250,000 or $300,000 per patient per year, which translates to a $3.7 billion to $6 billion market in the United States alone (based on the estimated patient population in the 15,000-20,000 range).”
The drug’s manufacturer, Horizon Therapeutics, expects to apply to the Food and Drug Administration later this year for approval of the drug.
If it is approved, endocrinologists will have an opportunity to partner with eye surgeons to treat thyroid eye disease, Dr. Douglas said. “The crux will be the comanagement with the endocrinologist helping to control the thyroid function and manage some of the side effects of this medication, and the oculoplastic surgeon [working on] diagnosis, appropriate use, and management.”
Horizon Therapeutics funded the study. Dr. Douglas disclosed that he is a consultant with the company.
REPORTING FROM AACE 2019