User login
Lambert-Eaton Myasthenic Syndrome and Merkel Cell Carcinoma
Merkel cell carcinoma (MCC) is an aggressive neuroendocrine malignancy of the skin that is thought to arise from neural crest cells. It has an estimated annual incidence of 0.6 per 100,000 individuals, typically occurs in the elderly population, and is most common in white males.1 The tumor presents as a rapidly growing, violaceous nodule in sun-exposed areas of the skin; early in the course, it can be mistaken for a benign entity such as an epidermal cyst.2 Merkel cell carcinoma has a propensity to spread to regional lymph nodes, and in some cases, it occurs in the absence of skin findings.3 Histologically, MCC is nearly indistinguishable from small cell lung carcinoma (SCLC).4 The overall prognosis for patients with MCC is poor and largely dependent on the stage at diagnosis. Patients with regional and distant metastases have a 5-year survival rate of 26% to 42% and 18%, respectively.3
Lambert-Eaton myasthenic syndrome (LEMS) is a paraneoplastic or autoimmune disorder of the neuromuscular junction that is found in 3% of cases of SCLC.4 Reported cases of LEMS in patients with MCC are exceedingly rare.5-8 We provide a full report and longitudinal clinical follow-up of a case that was briefly discussed by Simmons et al,8 and we review the literature regarding paraneoplastic syndromes associated with MCC and other extrapulmonary small cell carcinomas (EPSCCs).
Case Report
A 63-year-old man was evaluated in the neurology clinic due to difficulty walking, climbing stairs, and performing push-ups over the last month. Prior to the onset of symptoms, he was otherwise healthy, walking 3 miles daily; however, at presentation he required use of a cane. Leg weakness worsened as the day progressed. In addition, he reported constipation, urinary urgency, dry mouth, mild dysphagia, reduced sensation below the knees, and a nasal quality in his speech. He had no ptosis, diplopia, dysarthria, muscle cramps, myalgia, or facial weakness. He denied fevers, chills, and night sweats but did admit to an unintentional 10- to 15-lb weight loss over the preceding few months.
The neurologic examination revealed mild proximal upper extremity weakness in the bilateral shoulder abductors, infraspinatus, hip extensors, and hip flexors (Medical Research Council muscle scale grade 4). All deep tendon reflexes, except the Achilles reflex, were present. Despite subjective sensory concerns, objective examination of all sensory modalities was normal. Cranial nerve examination was normal, except for a slight nasal quality to his voice.
A qualitative assay was positive for the presence of P/Q-type voltage-gated calcium channel (VGCC) antibodies. Other laboratory studies were within reference range, including acetylcholine-receptor antibodies (blocking, binding, and modulating) and muscle-specific kinase antibodies.
Lumbar and cervical spine magnetic resonance imaging revealed multilevel neuroforaminal stenosis without spinal canal stenosis or myelopathy. Computed tomography (CT) of the chest was notable for 2 pathologically enlarged lymph nodes in the left axilla and no evidence of primary pulmonary malignancy. Nerve-conduction studies (NCSs) in conjunction with other clinical findings were consistent with the diagnosis of LEMS.
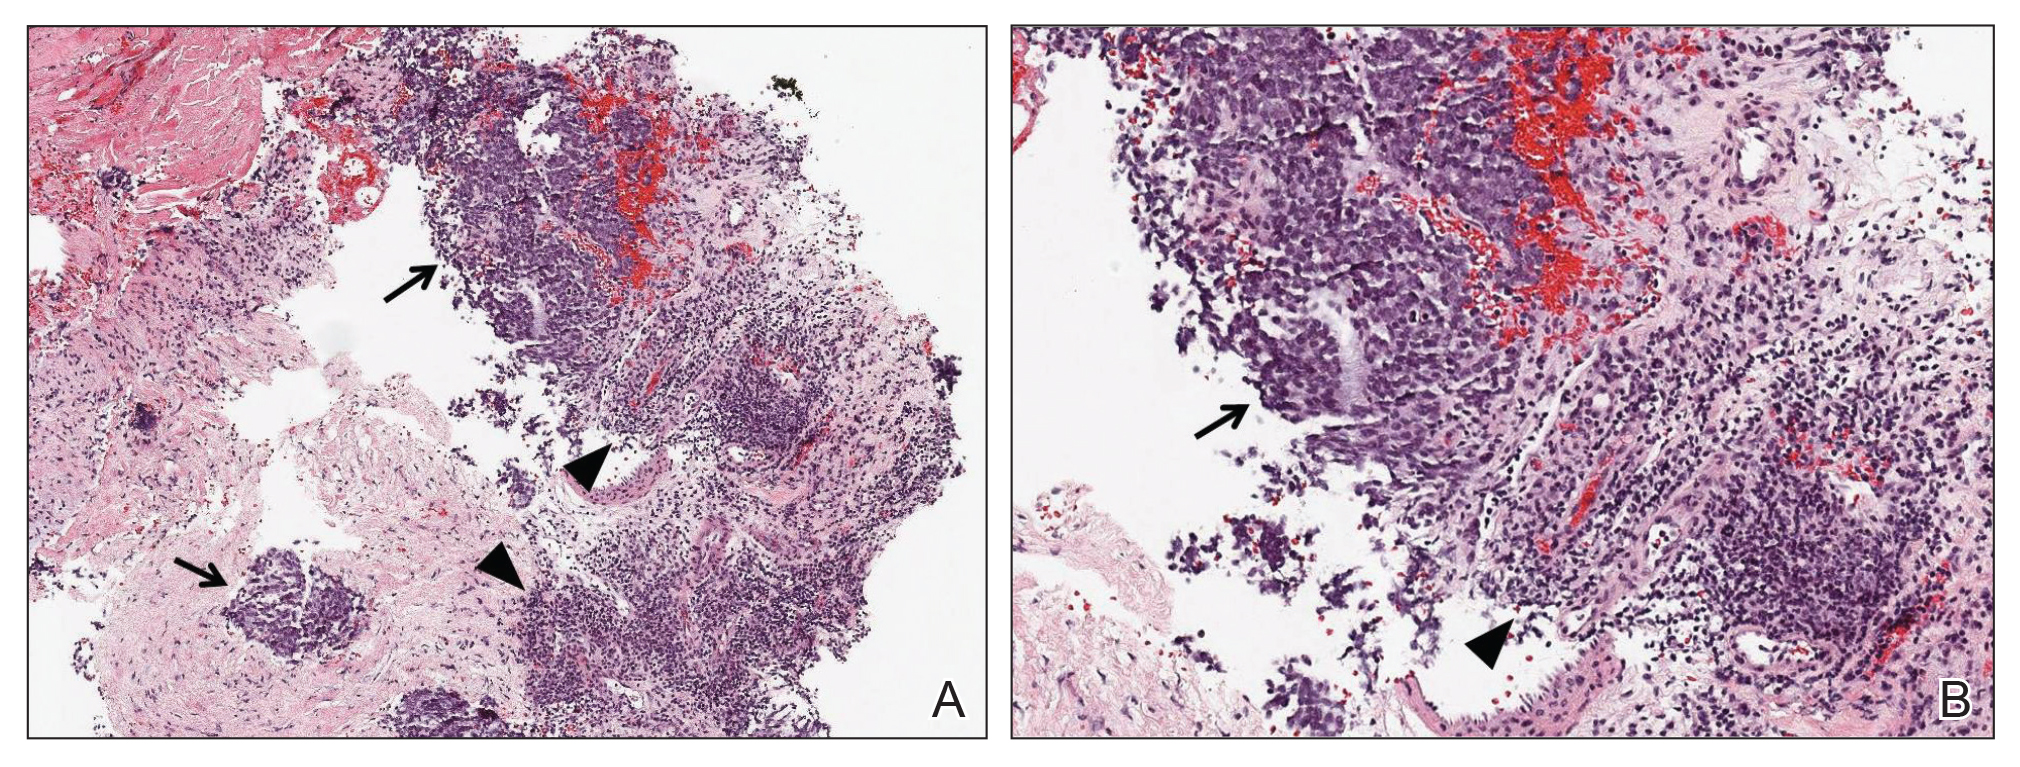
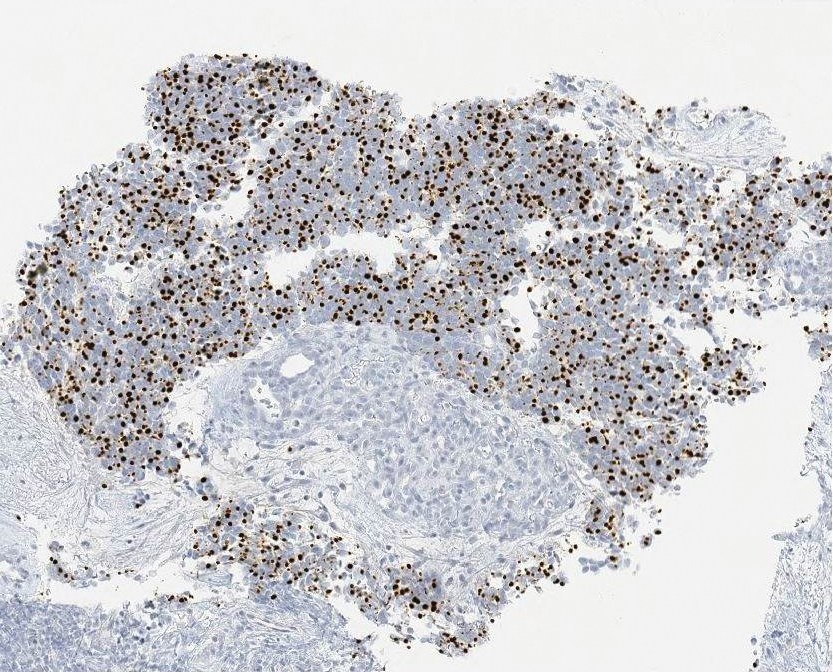
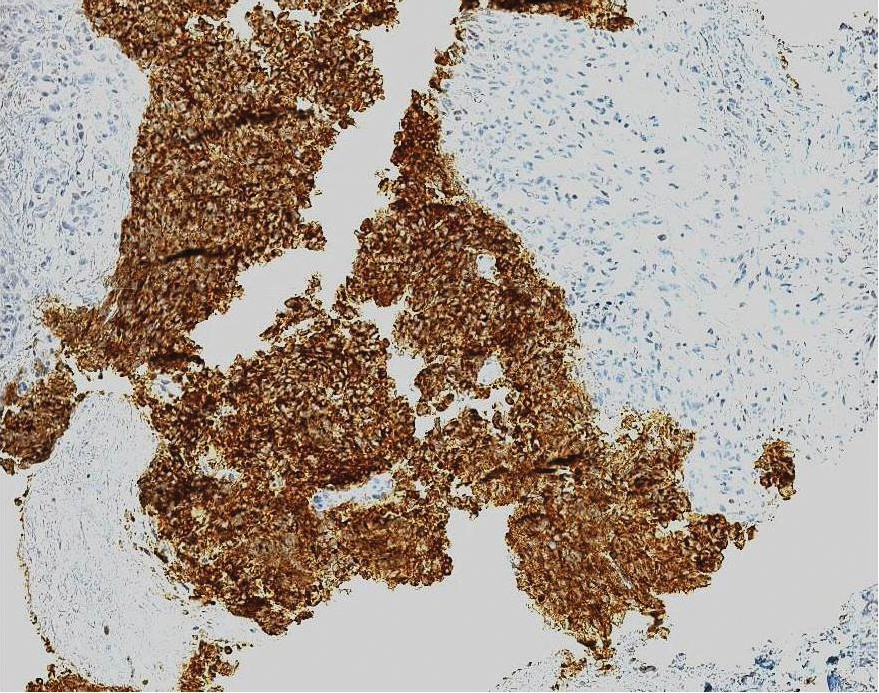
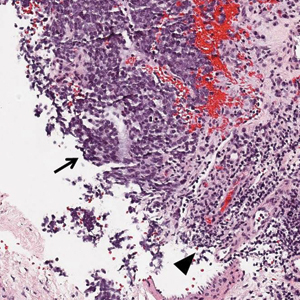
Ultrasound-guided biopsy of the enlarged axillary lymph nodes demonstrated sheets and nests of small round blue tumor cells with minimal cytoplasm, high mitotic rate, and foci of necrosis (Figure 1). The tumor cells were positive for pancytokeratin (Lu-5) and cytokeratin (CK) 20 in a perinuclear dotlike pattern (Figure 2), as well as for the neuroendocrine markers synaptophysin (Figure 3), chromogranin A, and CD56. The tumor cells showed no immunoreactivity for CK7, thyroid transcription factor 1, CD3, CD5, or CD20. Flow cytometry demonstrated low cellularity, low specimen viability, and no evidence of an abnormal B-cell population. These findings were consistent with the diagnosis of MCC.
The patient underwent surgical excision of the involved lymph nodes. Four weeks after surgery, he reported dramatic improvement in strength, with complete resolution of the nasal speech, dysphagia, dry mouth, urinary retention, and constipation. Two months after surgery, his strength had normalized, except for slight persistent weakness in the bilateral shoulder abductors, trace weakness in the hip flexors, and a slight Trendelenburg gait. He was able to rise from a chair without using his arms and no longer required a cane for ambulation.
The patient underwent adjuvant radiation therapy after 2-month surgical follow-up with 5000-cGy radiation treatment to the left axillary region. Six months following primary definitive surgery and 4 months following adjuvant radiation therapy, he reported a 95% subjective return of physical strength. The patient was able to return to near-baseline physical activity. He continued to deny symptoms of dry mouth, incontinence, or constipation. Objectively, he had no focal neurologic deficits or weakness; no evidence of new skin lesions or lymphadenopathy was noted.
Comment
MCC vs SCLC
Merkel cell carcinoma is classified as a type of EPSCC. The histologic appearance of MCC is indistinguishable from SCLC. Both tumors are composed of uniform sheets of small round cells with a high nucleus to cytoplasm ratio, and both can express neuroendocrine markers, such as neuron-specific enolase, chromogranin A, and synaptophysin.9 Immunohistochemical positivity for CK20 and neurofilaments in combination with negative staining for thyroid transcription factor 1 and CK7 effectively differentiate MCC from SCLC.9 In addition, MCC often displays CK20 positivity in a perinuclear dotlike or punctate pattern, which is characteristic of this tumor.3,9,10 Negative immunohistochemical markers for B cells (CD20) and T cells (CD3) are important in excluding lymphoma.
LEMS Diagnosis
Lambert-Eaton myasthenic syndrome is a paraneoplastic or autoimmune disorder involving the neuromuscular junction. Autoantibodies to VGCC impair calcium influx into the presynaptic terminal, resulting in marked reduction of acetylcholine release into the synaptic cleft. The reduction in acetylcholine activity impairs production of muscle fiber action potentials, resulting in clinical weakness. The diagnosis of LEMS rests on clinical presentation, positive serology, and confirmatory neurophysiologic testing by NCS. Clinically, patients present with proximal weakness, hyporeflexia or areflexia, and autonomic dysfunction. Antibodies to P/Q-type VGCCs are found in 85% to 90% of cases of LEMS and are thought to play a direct causative role in the development of weakness.11 The finding of postexercise facilitation on motor NCS is the neurophysiologic hallmark and is highly specific for the diagnosis.
Approximately 50% to 60% of patients who present with LEMS have an underlying tumor, the vast majority of which are SCLC.11 There are a few reports of LEMS associated with other malignancies, including lymphoma; thymoma; neuroblastoma; and carcinoma of the breast, stomach, prostate, bladder, kidney, and gallbladder.12 Patients with nontumor or autoimmune LEMS tend to be younger, and there is no male predominance, as there is in paraneoplastic LEMS.13 Given the risk of underlying malignancy in LEMS, Titulaer et al14 proposed a screening protocol for patients presenting with LEMS, recommending initial primary screening using CT of the chest. If the CT scan is negative, total-body fludeoxyglucose positron emission tomography should be performed to assess for fludeoxyglucose avid lesions. If both initial studies are negative, routine follow-up with CT of the chest at 6-month intervals for a minimum of 2 to 4 years after the initial diagnosis of LEMS was recommended. An exception to this protocol was suggested to allow consideration to stop screening after the first 6-month follow-up chest CT for patients younger than 45 years who have never smoked and who have an HLA 8.1 haplotype for which nontumor LEMS would be a more probable diagnosis.14
In addition to a screening protocol, a validated prediction tool, the Dutch-English LEMS Tumor Association prediction score, was developed. It uses common signs and symptoms of LEMS and risk factors for SCLC to help guide the need for further screening.15
Paraneoplastic Syndromes Associated With MCC
Other paraneoplastic syndromes have been reported in association with MCC. A patient with brainstem encephalitis associated with MCC was reported in a trial of a novel immunotherapy for paraneoplastic neurologic syndromes.16,17 A syndrome of inappropriate antidiuretic hormone (SIADH) secretion was reported in a patient with N-type calcium channel antibodies.18 Two cases of paraneoplastic cerebellar degeneration have been reported; the first was associated with a novel 70-kD antibody,19 and the second was associated with the P/Q-type VGCC antibody.20 Anti-Hu antibodies have been found in a handful of reports of neurologic deterioration in patients with MCC. Hocar et al21 reported a severe necrotizing myopathy; Greenlee et al22 described a syndrome of progressive sensorimotor and autonomic neuropathy with encephalopathy; and Lopez et al23 described a constellation of vision changes, gait imbalance, and proximal weakness. Support for a pathophysiologic connection among these 3 cases is suggested by the finding of Hu antigen expression by MCC in 2 studies.24,25 Because MCC can present with occult lymph node involvement in the absence of primary cutaneous findings,3 there are more cases of paraneoplastic neurologic syndromes that were not recognized.
Extrapulmonary small cell carcinomas such as MCC are morphologically indistinguishable from their pulmonary counterparts and have been reported in most anatomic regions of the body, including gynecologic organs (eg, ovaries, cervix), genitourinary organs (eg, bladder, prostate), the gastrointestinal tract (eg, esophagus), skin (eg, MCC), and the head and neck region. Extrapulmonary small cell carcinoma is a rare entity, with the most common form found in the gynecologic tract, representing only 2% of gynecologic malignancies.26
Paraneoplastic syndromes of EPSCC are rare given the paucity of the malignancy. Several case reports discuss findings of SIADH in EPSCC of the cervix, as well as hypercalcemia, polyneuropathy, Cushing syndrome, limbic encephalitis, and peripheral neuropathy in EPSCC of the prostate.27,28 In contrast, SCLC has long been associated with paraneoplastic syndromes. Numerous case reports have been published describing SCLC-associated paraneoplastic syndromes to include hypercalcemia, Cushing syndrome, SIADH, vasoactive peptide production, cerebellar degeneration, limbic encephalitis, visceral plexopathy, autonomic dysfunction, and LEMS.29 As more cases of EPSCC with paraneoplastic syndromes are identified and reported, we might gain a better understanding of this interesting phenomenon.
Conclusion
Merkel cell carcinoma is an aggressive neuroendocrine malignancy associated with paraneoplastic neurologic syndromes, including LEMS. A thorough search for an underlying malignancy is highly recommended in patients with diagnosed LEMS without clear cause. Early identification and treatment of the primary tumor can lead to improvement of neurologic symptoms.
We present a case of LEMS with no clearly identifiable cause on presentation with later diagnosis of metastatic MCC of unknown primary origin. After surgical excision of affected lymph nodes and adjuvant radiation therapy, the patient had near-complete resolution of LEMS symptoms at 6-month follow-up, without additional findings of lymphadenopathy or skin lesions. Although this patient is not undergoing routine surveillance imaging to monitor for recurrence of MCC, a chest CT or positron emission tomography–CT for secondary screening would be considered if the patient experienced clinical symptoms consistent with LEMS.
In cases of LEMS without pulmonary malignancy, we recommend considering MCC in the differential diagnosis during the workup of an underlying malignancy
- Albores-Saavedra J, Batich K, Chable-Montero F, et al. Merkel cell carcinoma demographics, morphology, and survival based on 3870 cases: a population based study. J Cutan Pathol. 2010;37:20-27.
- Senchenkov A, Moran SL. Merkel cell carcinoma: diagnosis, management, and outcomes. Plast Reconstr Surg. 2013;131:E771-E778.
- Han SY, North JP, Canavan T, et al. Merkel cell carcinoma. Hematol Oncol Clin N Am. 2012;26:1351-1374.
- Vernino S. Paraneoplastic disorders affecting the neuromuscular junction or anterior horn cell. CONTINUUM Lifelong Learning in Neurology. 2009;15:132-146.
- Eggers SD, Salomao DR, Dinapoli RP, et al. Paraneoplastic and metastatic neurologic complications of Merkel cell carcinoma. Mayo Clin Proc. 2001;76:327-330.
- Siau RT, Morris A, Karoo RO. Surgery results in complete cure of Lambert-Eaton myasthenic syndrome in a patient with metastatic Merkel cell carcinoma. J Plast Reconstr Aesthet Surg. 2014;67:e162-e164.
- Bombelli F, Lispi L, Calabrò F, et al. Lambert-Eaton myasthenic syndrome associated to Merkel cell carcinoma: report of a case. Neurol Sci. 2015;36:1491-1492.
- Simmons DB, Duginski TM, McClean JC, et al. Lambert-eaton myasthenic syndrome and merkel cell carcinoma. Muscle Nerve. 2015;53:325-326.
- Bobos M, Hytiroglou P, Kostopoulos I, et al. Immunohistochemical distinction between Merkel cell carcinoma and small cell carcinoma of the lung. Am J Dermatopathol. 2006;28:99-104.
- Jensen K, Kohler S, Rouse RV. Cytokeratin staining in Merkel cell carcinoma: an immunohistochemical study of cytokeratins 5/6, 7, 17, and 20. Appl Immunohistochem Mol Morphol. 2000;8:310-315.
- Titulaer MJ, Lang B, Verschuuren JJ. Lambert-Eaton myasthenic syndrome: from clinical characteristics to therapeutic strategies. Lancet Neurol. 2011;10:1098-1107.
- Sanders DB. Lambert-Eaton myasthenic syndrome. In: Daroff R, Aminoff MJ, eds. Encyclopedia of the Neurological Sciences. Vol 2. New York, NY: Elsevier; 2009:819-822.
- Wirtz PW, Smallegange TM, Wintzen AR, et al. Differences in clinical features between the Lambert-Eaton myasthenic syndrome with and without cancer: an analysis of 227 published cases. Clin Neurol Neurosurg. 2002;104:359-363.
- Titulaer MJ, Wirtz PW, Willems LN, et al. Screening for small-cell lung cancer: a follow-up study of patients with Lambert-Eaton myasthenic syndrome. J Clin Oncol. 2008;26:4276-4281.
- Titulaer MJ, Maddison P, Sont JK, et al. Clinical Dutch-English Lambert-Eaton Myasthenic Syndrome (LEMS) Tumor Association prediction score accurately predicts small-cell lung cancer in the LEMS. J Clin Oncol. 2011;7:902-908.
- Cher LM, Hochberg FH, Teruya J, et al. Therapy for paraneoplastic neurologic syndromes in six patients with protein A column immunoadsorption. Cancer. 1995;75:1678-1683.
- Batchelor TT, Platten M, Hochberg FH. Immunoadsorption therapy for paraneoplastic syndromes. J Neurooncol. 1998;40:131-136.
- Blondin NA, Vortmeyer AO, Harel NY. Paraneoplastic syndrome of inappropriate antidiuretic hormone mimicking limbic encephalitis. Arch Neurol. 2011;68:1591-1594.
- Balegno S, Ceroni M, Corato M, et al. Antibodies to cerebellar nerve fibres in two patients with paraneoplastic cerebellar ataxia. Anticancer Res. 2005;25:3211-3214.
- Zhang C, Emery L, Lancaster E. Paraneoplastic cerebellar degeneration associated with noncutaneous Merkel cell carcinoma. Neurol Neuroimmunol Neuroinflamm. 2014;1:e17.
- Hocar O, Poszepczynska-Guigné E, Faye O, et al. Severe necrotizing myopathy subsequent to Merkel cell carcinoma. Ann Dermatol Venereol. 2011;138:130-134.
- Greenlee JE, Steffens JD, Clawson SA, et al. Anti-Hu antibodies in Merkel cell carcinoma. Ann Neurol. 2002;52:111-115.
- Lopez MC, Pericay C, Agustí M, et al. Merkel cell carcinoma associated with a paraneoplastic neurologic syndrome. Histopathology. 2004;44:628-629.
- Dalmau J, Furneaux HM, Cordon-Cardo C, et al. The expression of the Hu (paraneoplastic encephalomyelitis/sensory neuronopathy) antigen in human normal and tumor tissues. Am J Pathol. 1992;141:881-886.
- Gultekin SH, Rosai J, Demopoulos A, et al. Hu immunolabeling as a marker of neural and neuroendocrine differentiation in normal and neoplastic human tissues: assessment using a recombinant anti-Hu Fab fragment. Int J Surg Pathol. 2000;8:109-117.
- Zheng X, Liu D, Fallon JT, et al. Distinct genetic alterations in small cell carcinoma from different anatomic sites. Exp Hematol Oncol. 2015;4:2.
- Kim D, Yun H, Lee Y, et al. Small cell neuroendocrine carcinoma of the uterine cervix presenting with syndrome of inappropriate antidiuretic hormone secretion. Obstet Gynecol Sci. 2013;56:420-425.
- Venkatesh PK, Motwani B, Sherman N, et al. Metastatic pure small-cell carcinoma of prostate. Am J Med Sci. 2004;328:286-289.
- Kaltsas G, Androulakis II, de Herder WW, et al. Paraneoplastic syndromes secondary to neuroendocrine tumours. Endocr Relat Cancer. 2010;17:R173-R193.
Merkel cell carcinoma (MCC) is an aggressive neuroendocrine malignancy of the skin that is thought to arise from neural crest cells. It has an estimated annual incidence of 0.6 per 100,000 individuals, typically occurs in the elderly population, and is most common in white males.1 The tumor presents as a rapidly growing, violaceous nodule in sun-exposed areas of the skin; early in the course, it can be mistaken for a benign entity such as an epidermal cyst.2 Merkel cell carcinoma has a propensity to spread to regional lymph nodes, and in some cases, it occurs in the absence of skin findings.3 Histologically, MCC is nearly indistinguishable from small cell lung carcinoma (SCLC).4 The overall prognosis for patients with MCC is poor and largely dependent on the stage at diagnosis. Patients with regional and distant metastases have a 5-year survival rate of 26% to 42% and 18%, respectively.3
Lambert-Eaton myasthenic syndrome (LEMS) is a paraneoplastic or autoimmune disorder of the neuromuscular junction that is found in 3% of cases of SCLC.4 Reported cases of LEMS in patients with MCC are exceedingly rare.5-8 We provide a full report and longitudinal clinical follow-up of a case that was briefly discussed by Simmons et al,8 and we review the literature regarding paraneoplastic syndromes associated with MCC and other extrapulmonary small cell carcinomas (EPSCCs).
Case Report
A 63-year-old man was evaluated in the neurology clinic due to difficulty walking, climbing stairs, and performing push-ups over the last month. Prior to the onset of symptoms, he was otherwise healthy, walking 3 miles daily; however, at presentation he required use of a cane. Leg weakness worsened as the day progressed. In addition, he reported constipation, urinary urgency, dry mouth, mild dysphagia, reduced sensation below the knees, and a nasal quality in his speech. He had no ptosis, diplopia, dysarthria, muscle cramps, myalgia, or facial weakness. He denied fevers, chills, and night sweats but did admit to an unintentional 10- to 15-lb weight loss over the preceding few months.
The neurologic examination revealed mild proximal upper extremity weakness in the bilateral shoulder abductors, infraspinatus, hip extensors, and hip flexors (Medical Research Council muscle scale grade 4). All deep tendon reflexes, except the Achilles reflex, were present. Despite subjective sensory concerns, objective examination of all sensory modalities was normal. Cranial nerve examination was normal, except for a slight nasal quality to his voice.
A qualitative assay was positive for the presence of P/Q-type voltage-gated calcium channel (VGCC) antibodies. Other laboratory studies were within reference range, including acetylcholine-receptor antibodies (blocking, binding, and modulating) and muscle-specific kinase antibodies.
Lumbar and cervical spine magnetic resonance imaging revealed multilevel neuroforaminal stenosis without spinal canal stenosis or myelopathy. Computed tomography (CT) of the chest was notable for 2 pathologically enlarged lymph nodes in the left axilla and no evidence of primary pulmonary malignancy. Nerve-conduction studies (NCSs) in conjunction with other clinical findings were consistent with the diagnosis of LEMS.
Ultrasound-guided biopsy of the enlarged axillary lymph nodes demonstrated sheets and nests of small round blue tumor cells with minimal cytoplasm, high mitotic rate, and foci of necrosis (Figure 1). The tumor cells were positive for pancytokeratin (Lu-5) and cytokeratin (CK) 20 in a perinuclear dotlike pattern (Figure 2), as well as for the neuroendocrine markers synaptophysin (Figure 3), chromogranin A, and CD56. The tumor cells showed no immunoreactivity for CK7, thyroid transcription factor 1, CD3, CD5, or CD20. Flow cytometry demonstrated low cellularity, low specimen viability, and no evidence of an abnormal B-cell population. These findings were consistent with the diagnosis of MCC.
The patient underwent surgical excision of the involved lymph nodes. Four weeks after surgery, he reported dramatic improvement in strength, with complete resolution of the nasal speech, dysphagia, dry mouth, urinary retention, and constipation. Two months after surgery, his strength had normalized, except for slight persistent weakness in the bilateral shoulder abductors, trace weakness in the hip flexors, and a slight Trendelenburg gait. He was able to rise from a chair without using his arms and no longer required a cane for ambulation.
The patient underwent adjuvant radiation therapy after 2-month surgical follow-up with 5000-cGy radiation treatment to the left axillary region. Six months following primary definitive surgery and 4 months following adjuvant radiation therapy, he reported a 95% subjective return of physical strength. The patient was able to return to near-baseline physical activity. He continued to deny symptoms of dry mouth, incontinence, or constipation. Objectively, he had no focal neurologic deficits or weakness; no evidence of new skin lesions or lymphadenopathy was noted.
Comment
MCC vs SCLC
Merkel cell carcinoma is classified as a type of EPSCC. The histologic appearance of MCC is indistinguishable from SCLC. Both tumors are composed of uniform sheets of small round cells with a high nucleus to cytoplasm ratio, and both can express neuroendocrine markers, such as neuron-specific enolase, chromogranin A, and synaptophysin.9 Immunohistochemical positivity for CK20 and neurofilaments in combination with negative staining for thyroid transcription factor 1 and CK7 effectively differentiate MCC from SCLC.9 In addition, MCC often displays CK20 positivity in a perinuclear dotlike or punctate pattern, which is characteristic of this tumor.3,9,10 Negative immunohistochemical markers for B cells (CD20) and T cells (CD3) are important in excluding lymphoma.
LEMS Diagnosis
Lambert-Eaton myasthenic syndrome is a paraneoplastic or autoimmune disorder involving the neuromuscular junction. Autoantibodies to VGCC impair calcium influx into the presynaptic terminal, resulting in marked reduction of acetylcholine release into the synaptic cleft. The reduction in acetylcholine activity impairs production of muscle fiber action potentials, resulting in clinical weakness. The diagnosis of LEMS rests on clinical presentation, positive serology, and confirmatory neurophysiologic testing by NCS. Clinically, patients present with proximal weakness, hyporeflexia or areflexia, and autonomic dysfunction. Antibodies to P/Q-type VGCCs are found in 85% to 90% of cases of LEMS and are thought to play a direct causative role in the development of weakness.11 The finding of postexercise facilitation on motor NCS is the neurophysiologic hallmark and is highly specific for the diagnosis.
Approximately 50% to 60% of patients who present with LEMS have an underlying tumor, the vast majority of which are SCLC.11 There are a few reports of LEMS associated with other malignancies, including lymphoma; thymoma; neuroblastoma; and carcinoma of the breast, stomach, prostate, bladder, kidney, and gallbladder.12 Patients with nontumor or autoimmune LEMS tend to be younger, and there is no male predominance, as there is in paraneoplastic LEMS.13 Given the risk of underlying malignancy in LEMS, Titulaer et al14 proposed a screening protocol for patients presenting with LEMS, recommending initial primary screening using CT of the chest. If the CT scan is negative, total-body fludeoxyglucose positron emission tomography should be performed to assess for fludeoxyglucose avid lesions. If both initial studies are negative, routine follow-up with CT of the chest at 6-month intervals for a minimum of 2 to 4 years after the initial diagnosis of LEMS was recommended. An exception to this protocol was suggested to allow consideration to stop screening after the first 6-month follow-up chest CT for patients younger than 45 years who have never smoked and who have an HLA 8.1 haplotype for which nontumor LEMS would be a more probable diagnosis.14
In addition to a screening protocol, a validated prediction tool, the Dutch-English LEMS Tumor Association prediction score, was developed. It uses common signs and symptoms of LEMS and risk factors for SCLC to help guide the need for further screening.15
Paraneoplastic Syndromes Associated With MCC
Other paraneoplastic syndromes have been reported in association with MCC. A patient with brainstem encephalitis associated with MCC was reported in a trial of a novel immunotherapy for paraneoplastic neurologic syndromes.16,17 A syndrome of inappropriate antidiuretic hormone (SIADH) secretion was reported in a patient with N-type calcium channel antibodies.18 Two cases of paraneoplastic cerebellar degeneration have been reported; the first was associated with a novel 70-kD antibody,19 and the second was associated with the P/Q-type VGCC antibody.20 Anti-Hu antibodies have been found in a handful of reports of neurologic deterioration in patients with MCC. Hocar et al21 reported a severe necrotizing myopathy; Greenlee et al22 described a syndrome of progressive sensorimotor and autonomic neuropathy with encephalopathy; and Lopez et al23 described a constellation of vision changes, gait imbalance, and proximal weakness. Support for a pathophysiologic connection among these 3 cases is suggested by the finding of Hu antigen expression by MCC in 2 studies.24,25 Because MCC can present with occult lymph node involvement in the absence of primary cutaneous findings,3 there are more cases of paraneoplastic neurologic syndromes that were not recognized.
Extrapulmonary small cell carcinomas such as MCC are morphologically indistinguishable from their pulmonary counterparts and have been reported in most anatomic regions of the body, including gynecologic organs (eg, ovaries, cervix), genitourinary organs (eg, bladder, prostate), the gastrointestinal tract (eg, esophagus), skin (eg, MCC), and the head and neck region. Extrapulmonary small cell carcinoma is a rare entity, with the most common form found in the gynecologic tract, representing only 2% of gynecologic malignancies.26
Paraneoplastic syndromes of EPSCC are rare given the paucity of the malignancy. Several case reports discuss findings of SIADH in EPSCC of the cervix, as well as hypercalcemia, polyneuropathy, Cushing syndrome, limbic encephalitis, and peripheral neuropathy in EPSCC of the prostate.27,28 In contrast, SCLC has long been associated with paraneoplastic syndromes. Numerous case reports have been published describing SCLC-associated paraneoplastic syndromes to include hypercalcemia, Cushing syndrome, SIADH, vasoactive peptide production, cerebellar degeneration, limbic encephalitis, visceral plexopathy, autonomic dysfunction, and LEMS.29 As more cases of EPSCC with paraneoplastic syndromes are identified and reported, we might gain a better understanding of this interesting phenomenon.
Conclusion
Merkel cell carcinoma is an aggressive neuroendocrine malignancy associated with paraneoplastic neurologic syndromes, including LEMS. A thorough search for an underlying malignancy is highly recommended in patients with diagnosed LEMS without clear cause. Early identification and treatment of the primary tumor can lead to improvement of neurologic symptoms.
We present a case of LEMS with no clearly identifiable cause on presentation with later diagnosis of metastatic MCC of unknown primary origin. After surgical excision of affected lymph nodes and adjuvant radiation therapy, the patient had near-complete resolution of LEMS symptoms at 6-month follow-up, without additional findings of lymphadenopathy or skin lesions. Although this patient is not undergoing routine surveillance imaging to monitor for recurrence of MCC, a chest CT or positron emission tomography–CT for secondary screening would be considered if the patient experienced clinical symptoms consistent with LEMS.
In cases of LEMS without pulmonary malignancy, we recommend considering MCC in the differential diagnosis during the workup of an underlying malignancy
- Albores-Saavedra J, Batich K, Chable-Montero F, et al. Merkel cell carcinoma demographics, morphology, and survival based on 3870 cases: a population based study. J Cutan Pathol. 2010;37:20-27.
- Senchenkov A, Moran SL. Merkel cell carcinoma: diagnosis, management, and outcomes. Plast Reconstr Surg. 2013;131:E771-E778.
- Han SY, North JP, Canavan T, et al. Merkel cell carcinoma. Hematol Oncol Clin N Am. 2012;26:1351-1374.
- Vernino S. Paraneoplastic disorders affecting the neuromuscular junction or anterior horn cell. CONTINUUM Lifelong Learning in Neurology. 2009;15:132-146.
- Eggers SD, Salomao DR, Dinapoli RP, et al. Paraneoplastic and metastatic neurologic complications of Merkel cell carcinoma. Mayo Clin Proc. 2001;76:327-330.
- Siau RT, Morris A, Karoo RO. Surgery results in complete cure of Lambert-Eaton myasthenic syndrome in a patient with metastatic Merkel cell carcinoma. J Plast Reconstr Aesthet Surg. 2014;67:e162-e164.
- Bombelli F, Lispi L, Calabrò F, et al. Lambert-Eaton myasthenic syndrome associated to Merkel cell carcinoma: report of a case. Neurol Sci. 2015;36:1491-1492.
- Simmons DB, Duginski TM, McClean JC, et al. Lambert-eaton myasthenic syndrome and merkel cell carcinoma. Muscle Nerve. 2015;53:325-326.
- Bobos M, Hytiroglou P, Kostopoulos I, et al. Immunohistochemical distinction between Merkel cell carcinoma and small cell carcinoma of the lung. Am J Dermatopathol. 2006;28:99-104.
- Jensen K, Kohler S, Rouse RV. Cytokeratin staining in Merkel cell carcinoma: an immunohistochemical study of cytokeratins 5/6, 7, 17, and 20. Appl Immunohistochem Mol Morphol. 2000;8:310-315.
- Titulaer MJ, Lang B, Verschuuren JJ. Lambert-Eaton myasthenic syndrome: from clinical characteristics to therapeutic strategies. Lancet Neurol. 2011;10:1098-1107.
- Sanders DB. Lambert-Eaton myasthenic syndrome. In: Daroff R, Aminoff MJ, eds. Encyclopedia of the Neurological Sciences. Vol 2. New York, NY: Elsevier; 2009:819-822.
- Wirtz PW, Smallegange TM, Wintzen AR, et al. Differences in clinical features between the Lambert-Eaton myasthenic syndrome with and without cancer: an analysis of 227 published cases. Clin Neurol Neurosurg. 2002;104:359-363.
- Titulaer MJ, Wirtz PW, Willems LN, et al. Screening for small-cell lung cancer: a follow-up study of patients with Lambert-Eaton myasthenic syndrome. J Clin Oncol. 2008;26:4276-4281.
- Titulaer MJ, Maddison P, Sont JK, et al. Clinical Dutch-English Lambert-Eaton Myasthenic Syndrome (LEMS) Tumor Association prediction score accurately predicts small-cell lung cancer in the LEMS. J Clin Oncol. 2011;7:902-908.
- Cher LM, Hochberg FH, Teruya J, et al. Therapy for paraneoplastic neurologic syndromes in six patients with protein A column immunoadsorption. Cancer. 1995;75:1678-1683.
- Batchelor TT, Platten M, Hochberg FH. Immunoadsorption therapy for paraneoplastic syndromes. J Neurooncol. 1998;40:131-136.
- Blondin NA, Vortmeyer AO, Harel NY. Paraneoplastic syndrome of inappropriate antidiuretic hormone mimicking limbic encephalitis. Arch Neurol. 2011;68:1591-1594.
- Balegno S, Ceroni M, Corato M, et al. Antibodies to cerebellar nerve fibres in two patients with paraneoplastic cerebellar ataxia. Anticancer Res. 2005;25:3211-3214.
- Zhang C, Emery L, Lancaster E. Paraneoplastic cerebellar degeneration associated with noncutaneous Merkel cell carcinoma. Neurol Neuroimmunol Neuroinflamm. 2014;1:e17.
- Hocar O, Poszepczynska-Guigné E, Faye O, et al. Severe necrotizing myopathy subsequent to Merkel cell carcinoma. Ann Dermatol Venereol. 2011;138:130-134.
- Greenlee JE, Steffens JD, Clawson SA, et al. Anti-Hu antibodies in Merkel cell carcinoma. Ann Neurol. 2002;52:111-115.
- Lopez MC, Pericay C, Agustí M, et al. Merkel cell carcinoma associated with a paraneoplastic neurologic syndrome. Histopathology. 2004;44:628-629.
- Dalmau J, Furneaux HM, Cordon-Cardo C, et al. The expression of the Hu (paraneoplastic encephalomyelitis/sensory neuronopathy) antigen in human normal and tumor tissues. Am J Pathol. 1992;141:881-886.
- Gultekin SH, Rosai J, Demopoulos A, et al. Hu immunolabeling as a marker of neural and neuroendocrine differentiation in normal and neoplastic human tissues: assessment using a recombinant anti-Hu Fab fragment. Int J Surg Pathol. 2000;8:109-117.
- Zheng X, Liu D, Fallon JT, et al. Distinct genetic alterations in small cell carcinoma from different anatomic sites. Exp Hematol Oncol. 2015;4:2.
- Kim D, Yun H, Lee Y, et al. Small cell neuroendocrine carcinoma of the uterine cervix presenting with syndrome of inappropriate antidiuretic hormone secretion. Obstet Gynecol Sci. 2013;56:420-425.
- Venkatesh PK, Motwani B, Sherman N, et al. Metastatic pure small-cell carcinoma of prostate. Am J Med Sci. 2004;328:286-289.
- Kaltsas G, Androulakis II, de Herder WW, et al. Paraneoplastic syndromes secondary to neuroendocrine tumours. Endocr Relat Cancer. 2010;17:R173-R193.
Practice Points
- Approximately 50% to 60% of patients with Lambert-Eaton myasthenic syndrome (LEMS) have an underlying tumor, most commonly small cell lung carcinoma.
- A thorough search for an underlying malignancy is highly recommended in patients with diagnosed LEMS without clear cause; to this end, a screening protocol comprising computed tomography and total-body fludeoxyglucose positron emission tomography has been established.
- Because Merkel cell carcinoma (MCC) can present as occult lymph node involvement with primary cutaneous findings absent, it is recommended that MCC be considered in the differential diagnosis of an underlying malignancy in a LEMS patient.
- Early identification and treatment of the primary tumor can lead to improvement of neurologic symptoms.
FDA permits marketing of Zika diagnostic test
A Zika virus test initially authorized only for emergency use has now been approved for use in nonemergency situations, according to a statement from the Food and Drug Administration.

The ZIKV Detect 2.0 IgM Capture ELISA (enzyme-linked immunosorbent assay) is now authorized for use in patients with clinical signs and symptoms consistent with Zika virus infection, as well as those who meet the Centers for Disease Control and Prevention epidemiologic criteria, including residence in or travel to a region deemed high risk because of active Zika transmission.
The test is designed to identify Zika antibodies in the blood, and the FDA cited a review of clinical trial data and analytic data to support the test’s safety and effectiveness.
“Results of this test are intended to be used in conjunction with clinical observations, patient history, epidemiological information, and other laboratory evidence to make patient management decisions,” the FDA stated.
The ZIKV Detect 2.0 IgM Capture ELISA, initially approved in 2016, had been authorized by the FDA only for emergency use, along with other tests for detecting Zika virus, under the under the FDA’s Emergency Use Authorization (EUA) authority.
The FDA granted marketing authorization to test manufacturer InBios International.
The FDA is communicating with four EUA holders to gather information to evaluate whether the FDA should revoke the EUAs for these specific tests. The marketing authorization of ZIKV Detect 2.0 IgM Capture ELISA does not impact the availability of the other 14 Zika nucleic acid diagnostics available under EUAs.
The Zika virus, typically transmitted by an infected mosquito, is especially a risk for pregnant women as the fetus may experience neurologic complications and microcephaly as a result of infection.
A Zika virus test initially authorized only for emergency use has now been approved for use in nonemergency situations, according to a statement from the Food and Drug Administration.
The ZIKV Detect 2.0 IgM Capture ELISA (enzyme-linked immunosorbent assay) is now authorized for use in patients with clinical signs and symptoms consistent with Zika virus infection, as well as those who meet the Centers for Disease Control and Prevention epidemiologic criteria, including residence in or travel to a region deemed high risk because of active Zika transmission.
The test is designed to identify Zika antibodies in the blood, and the FDA cited a review of clinical trial data and analytic data to support the test’s safety and effectiveness.
“Results of this test are intended to be used in conjunction with clinical observations, patient history, epidemiological information, and other laboratory evidence to make patient management decisions,” the FDA stated.
The ZIKV Detect 2.0 IgM Capture ELISA, initially approved in 2016, had been authorized by the FDA only for emergency use, along with other tests for detecting Zika virus, under the under the FDA’s Emergency Use Authorization (EUA) authority.
The FDA granted marketing authorization to test manufacturer InBios International.
The FDA is communicating with four EUA holders to gather information to evaluate whether the FDA should revoke the EUAs for these specific tests. The marketing authorization of ZIKV Detect 2.0 IgM Capture ELISA does not impact the availability of the other 14 Zika nucleic acid diagnostics available under EUAs.
The Zika virus, typically transmitted by an infected mosquito, is especially a risk for pregnant women as the fetus may experience neurologic complications and microcephaly as a result of infection.
Equal access to care for black men lowers risk of prostate cancer-specific mortality
Black men with newly diagnosed nonmetastatic prostate cancer had no significant difference in prostate cancer–specific mortality compared with white men when treated with a standardized approach and follow-up or at a health care system with standardized access, according to recent research published in JAMA Oncology.
Robert T. Dess, MD, from the department of radiation oncology at the University of Michigan, Ann Arbor, and colleagues examined data from 296,273 patients in the Surveillance, Epidemiology, and End Results (SEER) cohort, 3,972 patients from the Veterans Affairs (VA) health system, and 5,854 patients in four randomized controlled trials (RCTs) from the National Cancer Institute–sponsored Radiation Therapy Oncology Group between January 1992 and December 2013. Of these, 52,840 patients (17.8%) in the SEER cohort, 1,513 patients (38.1%) in the VA cohort, and 1,129 (19.3%) in the RCT cohort were black men. The mean age across all cohorts was 64.9 years, and the median follow-up was 75 months in the SEER cohort, 97 months in the VA cohort, and 104 months in the RCT cohort.
After adjustment for age in the SEER cohort, black men had a 30% increased risk of prostate cancer–specific mortality (PCSM) compared with white men (subdistribution hazard ratio, 1.30; 95% CI, 1.23-1.37; P less than .001). However, after the researchers performed inverse probability weighting (IPW) to adjust for race-based imbalances such as access to care and standardized treatment, there was a 0.5% increased risk over 10 years (sHR, 1.09; 95% CI, 1.04-1.15; P less than .001) after diagnosis.
In the VA cohort, IPW yielded no significant differences between black men and white men (sHR, 0.85; 95% CI, 0.56-1.30; P = .46), and there was a significantly lower risk for black men in the RCT cohort after IPW (sHR, 0.81; 95% CI, 0.66-0.99; P = .04). With regard to other outcomes, other-cause mortality was significantly higher for black men in the SEER cohort (sHR, 1.30; 95% CI, 1.27-1.34; P less than .001) and in the RCT cohort (sHR, 1.17; 95% CI, 1.06-1.29; P = .002) after IPW.
“Black race remains associated with many factors that negatively affect outcomes, and disparities persist at the population level,” Dr. Dess and colleagues wrote in their study. “Continued efforts are needed to address this clear racial health inequity driven by modifiable nonbiological risk factors.”
The researchers said some residual confounding may exist, but noted the strengths of the study included a diverse cohort with a large range of treatment approaches.
This study was funded in part by the Prostate Cancer Foundation, a grant from the Prostate Cancer National Institutes of Health Specialized Programs of Research Excellence, two grants from the Department of Defense, a grant from NIH, and a grant from the NIH Cancer Center. One or more of the authors reported relationships in the form of grants, personal fees, and consulting fees with numerous companies. The other authors report no relevant conflicts of interest.
SOURCE: Dess RT et al. JAMA Oncol. 2019 May 23. doi: 10.1001/jamaoncol.2019.0826.
The results by Dess et al. show that inequality in prostate cancer mortality is the result of socioeconomic barriers that reduce access to care rather than a biological predisposition, Channing J. Paller, MD; Lin Wang, MSc, MMed; and Otis W. Brawley, MD, wrote in an editorial (JAMA Oncol 2019 May 23. doi: 10.1001/jamaoncol.2019.0812).
As registries collect more socioeconomic data from patients, including information on insurance status and health care system where treatment occurred, adjusting for confounders to study the effects of prevention, diagnostic and treatment strategies in addition to “open-minded analyses will help to mitigate some of the prevailing biases” about racial differences in medicine, they said.
While profiling by population can be a useful tool, tracking by geographical location may be a better way to categorize patients, such as glucose-6-phosphate dehydrogenase deficiency that came about as protection from malaria in the case of Mediterranean, African, and Asian populations.
“Although it is still true that men of African origin have a higher incidence of prostate cancer and higher mortality rates, the causes of these differences are complex and may involve exposure to prostate cancer risk factors, genomic differences, and other biology-based factors,” the authors wrote. “Research to determine the relative contributions of these factors should continue; but in the meantime, we as health care professionals are likely to have the greatest effect on improved outcomes for African American patients with prostate cancer by ensuring that they get the same care as white patients, not just in clinical trials but throughout the national health care system.”
In addition, comorbid disease associated with prostate cancer is a significant cause of mortality among African American and white patients, and efforts to treat cancer should also consider cardiovascular disease, diabetes and other comorbidities.
“It is an unsettling fact that there is not equal treatment in the United States. African Americans, other minorities, and the poor in general often experience disparate quality of care or no care at all,” they said. “Although race does not matter biologically, race still matters.”
Dr. Paller and Dr. Brawley are from Johns Hopkins School of Medicine; Lin Wang and Dr. Brawley are from the Johns Hopkins Bloomberg School of Public Health in Baltimore. These comments summarize their editorial in response to Dess et al. Dr. Brawley reports receiving grants from the National Cancer Institute and Bloomberg Philanthropies. The other authors report no relevant conflicts of interest.
Black men with newly diagnosed nonmetastatic prostate cancer had no significant difference in prostate cancer–specific mortality compared with white men when treated with a standardized approach and follow-up or at a health care system with standardized access, according to recent research published in JAMA Oncology.
Robert T. Dess, MD, from the department of radiation oncology at the University of Michigan, Ann Arbor, and colleagues examined data from 296,273 patients in the Surveillance, Epidemiology, and End Results (SEER) cohort, 3,972 patients from the Veterans Affairs (VA) health system, and 5,854 patients in four randomized controlled trials (RCTs) from the National Cancer Institute–sponsored Radiation Therapy Oncology Group between January 1992 and December 2013. Of these, 52,840 patients (17.8%) in the SEER cohort, 1,513 patients (38.1%) in the VA cohort, and 1,129 (19.3%) in the RCT cohort were black men. The mean age across all cohorts was 64.9 years, and the median follow-up was 75 months in the SEER cohort, 97 months in the VA cohort, and 104 months in the RCT cohort.
After adjustment for age in the SEER cohort, black men had a 30% increased risk of prostate cancer–specific mortality (PCSM) compared with white men (subdistribution hazard ratio, 1.30; 95% CI, 1.23-1.37; P less than .001). However, after the researchers performed inverse probability weighting (IPW) to adjust for race-based imbalances such as access to care and standardized treatment, there was a 0.5% increased risk over 10 years (sHR, 1.09; 95% CI, 1.04-1.15; P less than .001) after diagnosis.
In the VA cohort, IPW yielded no significant differences between black men and white men (sHR, 0.85; 95% CI, 0.56-1.30; P = .46), and there was a significantly lower risk for black men in the RCT cohort after IPW (sHR, 0.81; 95% CI, 0.66-0.99; P = .04). With regard to other outcomes, other-cause mortality was significantly higher for black men in the SEER cohort (sHR, 1.30; 95% CI, 1.27-1.34; P less than .001) and in the RCT cohort (sHR, 1.17; 95% CI, 1.06-1.29; P = .002) after IPW.
“Black race remains associated with many factors that negatively affect outcomes, and disparities persist at the population level,” Dr. Dess and colleagues wrote in their study. “Continued efforts are needed to address this clear racial health inequity driven by modifiable nonbiological risk factors.”
The researchers said some residual confounding may exist, but noted the strengths of the study included a diverse cohort with a large range of treatment approaches.
This study was funded in part by the Prostate Cancer Foundation, a grant from the Prostate Cancer National Institutes of Health Specialized Programs of Research Excellence, two grants from the Department of Defense, a grant from NIH, and a grant from the NIH Cancer Center. One or more of the authors reported relationships in the form of grants, personal fees, and consulting fees with numerous companies. The other authors report no relevant conflicts of interest.
SOURCE: Dess RT et al. JAMA Oncol. 2019 May 23. doi: 10.1001/jamaoncol.2019.0826.
FROM JAMA ONCOLOGY
Warfarin boosts OA risk in Rotterdam Study
TORONTO – The use of warfarin or related vitamin K antagonists was associated with a more than 100% increased risk of incident or progressive knee or hip osteoarthritis in the Rotterdam Study, Cindy G. Boer reported at the OARSI 2019 World Congress.
A biologically plausible mechanism exists for this relationship, added Ms. Boer, a PhD student with a special interest in the molecular genetics of OA at Erasmus University, Rotterdam, the Netherlands.

In a previous genetic study, she and her coinvestigators identified two genetic variants that result in loss of function of matrix Gla protein (MGP), a key inhibitor of cartilage calcification. They showed that the presence of these alleles was associated with a significantly increased risk of hand OA, which makes sense because increased calcification within a vulnerable joint promotes OA.
“The interesting thing here is that, in order for MGP to inhibit calcification, it needs to be gamma-carboxylated by vitamin K. If it’s not gamma-carboxylated it cannot inhibit calcification,” Ms. Boer said at the meeting sponsored by the Osteoarthritis Research Society International.
This observation led her to hypothesize that patients on warfarin or other vitamin K antagonists might have an increased risk of developing new-onset OA or, if they already had OA, of experiencing disease progression, since their medication inhibits MGP. To test this hypothesis, she and her coinvestigators turned to the landmark Rotterdam Study, a prospective, population-based cohort study of 15,000 participants, ongoing since 1990. Two large cohorts within the study had data available on the incidence and progression of radiographic knee and hip OA, one group over the course of 5 years of follow-up, the other with 10 years.
Serial x-rays of 8,845 knee joints were available, including 657 of warfarin users. Their rate of incident or progressive knee OA was 13%, compared with 5.9% in the nonusers in an analysis adjusted for age, sex, BMI, baseline OA status, and time between study visits.
In a similar vein, the rate of incident or progressive hip OA was 12% in the warfarin users, compared with 3.1% in nonusers.
About 80% of the OA endpoints in this analysis involved incident OA, defined radiographically as Kellgren-Lawrence grade 2. Progressive OA was defined as going from grade 2 at baseline to grade 3-4 during follow-up.
There was a signal of a treatment duration-related effect, with OA rates trending highest in individuals on warfarin for longer than 365 days, followed by those on the oral anticoagulant for more than 100 days, who in turn had higher rates than those on warfarin for less time.
Ms. Boer said an important next step in this research is to replicate the warfarin/OA association in an independent cohort. Also, she and her coworkers are now gathering OA incidence and progression data in patients on direct oral anticoagulants rather than warfarin to test the hypothesis that they will not have an increased rate of OA, compared with nonusers, since these newer agents don’t affect vitamin K. Of course, if they do turn out to have an elevated risk, it would point to one or more of the conditions for which oral anticoagulants are commonly prescribed as the explanation.
She reported having no financial conflicts regarding her study, sponsored by Erasmus University and the Dutch government.
TORONTO – The use of warfarin or related vitamin K antagonists was associated with a more than 100% increased risk of incident or progressive knee or hip osteoarthritis in the Rotterdam Study, Cindy G. Boer reported at the OARSI 2019 World Congress.
A biologically plausible mechanism exists for this relationship, added Ms. Boer, a PhD student with a special interest in the molecular genetics of OA at Erasmus University, Rotterdam, the Netherlands.
In a previous genetic study, she and her coinvestigators identified two genetic variants that result in loss of function of matrix Gla protein (MGP), a key inhibitor of cartilage calcification. They showed that the presence of these alleles was associated with a significantly increased risk of hand OA, which makes sense because increased calcification within a vulnerable joint promotes OA.
“The interesting thing here is that, in order for MGP to inhibit calcification, it needs to be gamma-carboxylated by vitamin K. If it’s not gamma-carboxylated it cannot inhibit calcification,” Ms. Boer said at the meeting sponsored by the Osteoarthritis Research Society International.
This observation led her to hypothesize that patients on warfarin or other vitamin K antagonists might have an increased risk of developing new-onset OA or, if they already had OA, of experiencing disease progression, since their medication inhibits MGP. To test this hypothesis, she and her coinvestigators turned to the landmark Rotterdam Study, a prospective, population-based cohort study of 15,000 participants, ongoing since 1990. Two large cohorts within the study had data available on the incidence and progression of radiographic knee and hip OA, one group over the course of 5 years of follow-up, the other with 10 years.
Serial x-rays of 8,845 knee joints were available, including 657 of warfarin users. Their rate of incident or progressive knee OA was 13%, compared with 5.9% in the nonusers in an analysis adjusted for age, sex, BMI, baseline OA status, and time between study visits.
In a similar vein, the rate of incident or progressive hip OA was 12% in the warfarin users, compared with 3.1% in nonusers.
About 80% of the OA endpoints in this analysis involved incident OA, defined radiographically as Kellgren-Lawrence grade 2. Progressive OA was defined as going from grade 2 at baseline to grade 3-4 during follow-up.
There was a signal of a treatment duration-related effect, with OA rates trending highest in individuals on warfarin for longer than 365 days, followed by those on the oral anticoagulant for more than 100 days, who in turn had higher rates than those on warfarin for less time.
Ms. Boer said an important next step in this research is to replicate the warfarin/OA association in an independent cohort. Also, she and her coworkers are now gathering OA incidence and progression data in patients on direct oral anticoagulants rather than warfarin to test the hypothesis that they will not have an increased rate of OA, compared with nonusers, since these newer agents don’t affect vitamin K. Of course, if they do turn out to have an elevated risk, it would point to one or more of the conditions for which oral anticoagulants are commonly prescribed as the explanation.
She reported having no financial conflicts regarding her study, sponsored by Erasmus University and the Dutch government.
REPORTING FROM OARSI 2019
Restrictive transfusion strategy in cardiac surgery remains noninferior
Clinical question: Does using a restrictive transfusion strategy with patients undergoing cardiac surgery affect long-term outcomes?

Background: Using a restrictive transfusion strategy in patients undergoing cardiac surgery is known to use fewer units of allogeneic red cells, compared with a liberal strategy, while still having noninferior short-term clinical outcomes. At this time, little is known about such a strategy’s long-term effects.
Study design: Randomized, open-label, noninferiority trial.
Setting: 74 hospitals in 19 countries.
Synopsis: 5,243 adults undergoing nontransplant cardiac surgeries and having at least a moderate predicted risk for death were randomly divided into a liberal or restrictive transfusion strategy. Restrictive-strategy participants received a transfusion when hemoglobin was less than 7.5 g/dL, compared with either a hemoglobin of 8.5 g/dL on the floor or 9.5 g/dL in the ICU for the liberal-strategy group. During the hospitalization, the restrictive group received fewer U of red cells and had a lower mean predischarge hemoglobin. At 6 months, the groups were compared for the primary outcomes of death, MI, stroke, or renal failure requiring dialysis, finding an occurrence of such in 402/2,317 in the restrictive-strategy group and 402/2,347 in the liberal-strategy group (P = .006 for noninferiority). Limitations include the study being a noninferiority trial and the very specific patient population selected.
Bottom line: In patients undergoing cardiac surgery, a restrictive transfusion strategy is noninferior to a liberal strategy with respect to death from any cause, MI, stroke, and new renal failure requiring dialysis at 6 months postop.
Citation: Mazer CD et al. Six-month outcomes after restrictive or liberal transfusion for cardiac surgery. N Eng J Med. 2018 Sep 27;379(13):1224-33.
Dr. Shaw is an assistant professor in the division of hospital medicine,University of New Mexico.
Clinical question: Does using a restrictive transfusion strategy with patients undergoing cardiac surgery affect long-term outcomes?
Background: Using a restrictive transfusion strategy in patients undergoing cardiac surgery is known to use fewer units of allogeneic red cells, compared with a liberal strategy, while still having noninferior short-term clinical outcomes. At this time, little is known about such a strategy’s long-term effects.
Study design: Randomized, open-label, noninferiority trial.
Setting: 74 hospitals in 19 countries.
Synopsis: 5,243 adults undergoing nontransplant cardiac surgeries and having at least a moderate predicted risk for death were randomly divided into a liberal or restrictive transfusion strategy. Restrictive-strategy participants received a transfusion when hemoglobin was less than 7.5 g/dL, compared with either a hemoglobin of 8.5 g/dL on the floor or 9.5 g/dL in the ICU for the liberal-strategy group. During the hospitalization, the restrictive group received fewer U of red cells and had a lower mean predischarge hemoglobin. At 6 months, the groups were compared for the primary outcomes of death, MI, stroke, or renal failure requiring dialysis, finding an occurrence of such in 402/2,317 in the restrictive-strategy group and 402/2,347 in the liberal-strategy group (P = .006 for noninferiority). Limitations include the study being a noninferiority trial and the very specific patient population selected.
Bottom line: In patients undergoing cardiac surgery, a restrictive transfusion strategy is noninferior to a liberal strategy with respect to death from any cause, MI, stroke, and new renal failure requiring dialysis at 6 months postop.
Citation: Mazer CD et al. Six-month outcomes after restrictive or liberal transfusion for cardiac surgery. N Eng J Med. 2018 Sep 27;379(13):1224-33.
Dr. Shaw is an assistant professor in the division of hospital medicine,University of New Mexico.
Orthostatic Hypotension

FDA grants marketing clearance for chlamydia and gonorrhea extragenital tests
The new tests, the Aptima Combo 2 Assay and Xpert CT/NG, use samples from the throat and rectum to test for chlamydia and gonorrhea, according to a statement from the FDA.
“It is best for patients if both [chlamydia and gonorrhea] are caught and treated right away, as significant complications can occur if left untreated,” noted Tim Stenzel, MD, in the statement.
“Today’s clearances provide a mechanism for more easily diagnosing these infections,” said Dr. Stenzel, director of the Office of In Vitro Diagnostics and Radiological Health in the FDA’s Center for Devices and Radiological Health.
The two tests were reviewed through the premarket notification – or 510(k) – pathway, which seeks to demonstrate to the FDA that the device to be marketed is equivalent or better in safety and effectiveness to the legally marketed device.
In the FDA’s evaluation of the tests, it reviewed clinical data from a multisite study of more than 2,500 patients. This study evaluated the diagnostic accuracy of multiple commercially available nucleic acid amplification tests for detection of Neisseria gonorrhoeae and Chlamydia trachomatis from throat and rectal sites. The results of this study and other information reviewed by the FDA demonstrated that the two tests “are safe and effective for extragenital testing for chlamydia and gonorrhea,” according to the statement.
The data were collected through a cross-sectional study coordinated by the Antibacterial Resistance Leadership Group, which is funded and supported by the National Institute of Allergy and Infectious Diseases.
The FDA granted marketing clearance to Hologic and Cepheid for the Aptima Combo 2 Assay and the Xpert CT/NG, respectively.
House committee debates single-payer health care design
House Budget Committee Chairman John Yarmuth (D-Ky.) opened a May 22 hearing on the prospect of moving to some kind of single-payer health care system with a bold prediction.
“I strongly believe it’s not a matter of if we will have universal coverage, but when,” Rep. Yarmuth said, adding that the “trick is closing the information gap on what single-payer health care truly is, so that we can close the health coverage gap for millions of American families.”
The hearing was held to review a Congressional Budget Office report ordered by Chairman Yarmuth, which examines the key design elements to be considered in establishing a single-payer system.
Mark Hadley, deputy director of the Congressional Budget Office, highlighted two key points with regard to establishing a single-payer system.
“First, moving to a single-payer system would be a major undertaking,” he said. “It would involve significant changes for all participants – individuals, providers, insurers, employers, and manufacturers of drugs and medical devices. Because health care spending currently accounts for about one-sixth of the nation’s economic activity, those changes could significantly affect the overall U.S. economy. And the transition toward a single-payer system could be complicated, challenging, and potentially disruptive.”
Mr. Hadley continued: “Second, to establish a single-payer system, lawmakers would need to make many decisions and would face complex trade-offs.”
And because of the multitude of trade-offs related to the design of a single-payer system, questions related to coverage, cost, and access to health care services were generally met with vague answers.
For example, would a single-payer system create access issues because of the potential increased burden on providers by providing health care coverage to all?
“Whether the supply of providers would be adequate to meet the greater demand would depend on various components of the system,” Mr. Hadley said. “If the supply of services was not sufficient to meet the demand for care, patients might face increased wait times and reduced access to care. The government, however, could implement policies to encourage the provision of services, and in the longer run, providers might deliver care more efficiently.”
Republican lawmakers on the panel focused on a detail lacking in the report: a cost estimate for implementing a single-payer system.
“What’s noticeably missing from the report is a cost estimate for specific proposals,” said Rep. Steve Womack (R-Ark.), the committee’s ranking member. “My friends across the aisle didn’t ask for one. I think I know why. While the score would be useful, we already know how much a one-size-fits-all health care system would cost the American people. Independent analyses from economists across the ideological spectrum, including George Mason University, the Urban Institute, [and] the American Action Forum have projected single-payer type proposals, such as Medicare-for-all, to cost at least $32 trillion.”
Rep. Womack also said that the report “has been especially helpful in showing that these ideas will never work in America.”
He noted that the report warns that a single-payer system could end up “reducing payment rates for providers. That is payments for doctors, hospitals, and so on. The report explains there will not only be a reduction in the quality of care, there would be a reduction in the supply of care, hampering access to the treatments and services people need.”
The report does caution that using cost-containment measures, such as global budgets and utilization management, “could adversely affect access to and quality of care by causing providers to supply less care to patients covered by the public plan. Less spending on medical services could also alter manufacturers’ incentive to develop new technologies or providers’ incentive to invest in capital, which could affect patients’ choices over the long term.”
Additionally, the report notes that the structure of a single-payer system could result in lower reimbursement for health care services. “Proposals like Medicare-for-all will chase a lot of doctors out of health care,” Rep. Womack said.
REPORTING FROM A HOUSE BUDGET COMMITTEE HEARING
Early cholecystectomy prevents recurrent biliary events
SAN DIEGO – In a retrospective study of 234 patients admitted for gallstone pancreatitis, almost 90% of recurrent biliary events occurred in patients who did not receive a cholecystectomy within 60 days of hospital discharge. The overall rate of recurrence was 19%, and over half of patients (59%) did not receive a cholecystectomy during their index hospitalization.

Additionally, none of the recurrent biliary events occurred in those patients who did receive a cholecystectomy during the index hospitalization or within the first 30 days after discharge. “It really is the case that, ‘if you snooze, you lose,’ ” said Vijay Dalapathi, MD, presenting the findings during an oral presentation at the annual Digestive Disease Week.
Dr. Dalapathi and colleagues had observed that cholecystectomy during an index hospitalization for mild biliary pancreatitis was a far from universal practice, despite guidelines recommending early cholecystectomy.
To delve further into practice patterns, Dr. Dalapathi, first author Mohammed Ullah, MD, and their coauthors at the University of Rochester (N.Y.) conducted a single-site retrospective study of patients who were admitted with gallstone pancreatitis over a 5-year period ending December 2017. Dr. Dalapathi and Dr. Ullah are both second-year gastroenterology fellows.
The study had twin primary outcome measures: cholecystectomy rates performed during an index hospitalization for gallstone pancreatitis and recurrent biliary events after hospitalization. Adult patients were included if they had a diagnosis of acute gallstone pancreatitis, with or without recurrent cholangitis, choledocholithiasis, or acute cholecystitis. Pediatric patients and those with prior cholecystectomy were excluded.
A total of 234 patients were included in the study. Their mean age was 58.3 years, and patients were mostly female (57.3%) and white (91.5%). Mean body mass index was 29.1 kg/m2. A total of 175 patients (74.8%) had endoscopic retrograde cholangiopancreatography.
Out of the entire cohort of patients, 138 (59%) did not have a cholecystectomy during the index hospitalization. Among the patients who did not receive a cholecystectomy, 33 (24%) were deemed unsuitable candidates for the procedure, either because they were critically ill or because they were poor candidates for surgery for other reasons. No reason was provided for the nonperformance of cholecystectomy for an additional 28 patients (20%).
The remaining 75 patients (54%) were deferred to outpatient management. Looking at this subgroup of patients, Dr. Dalapathi and his coinvestigators tracked the amount of time that passed before cholecystectomy.
The researchers found that 19 patients (25%) had not had a cholecystectomy within the study period. A total of 21 patients (28%) had the procedure more than 60 days from hospitalization, and another 23 (31%) had the procedure between 30 and 60 days after hospitalization. Just 12 patients (16%) of this subgroup had their cholecystectomy within 30 days of hospitalization.
Among patients who were discharged without a cholecystectomy, Dr. Dalapathi and his coauthors found 26 recurrent biliary events (19%): 15 were gallstone pancreatitis and 10 were cholecystitis; 1 patient developed cholangitis.
The crux of the study’s findings came when the investigators looked at the association between recurrent events and cholecystectomy timing. They found no recurrent biliary events among those who received cholecystectomy while hospitalized or within the first 30 days after discharge. Of the 26 events, 3 (12%) occurred in those whose cholecystectomies came 30-60 days after discharge. The remaining 23 events (88%) were seen in those receiving a cholecystectomy more than 60 days after discharge, or not at all.
Guidelines from the American Gastroenterological Association, the Society of American Gastrointestinal and Endoscopic Surgeons, and the American College of Gastroenterology all recommend early cholecystectomy after mild acute gallstone pancreatitis, said Dr. Dalapathi.
However, two separate systematic reviews including a total of 22 studies and over 3,000 patients showed that about half (48% and 51%) of patients admitted with mild acute biliary pancreatitis received a cholecystectomy during the index hospitalization or within 14 days of the hospitalization.
Further, he said, previous work had shown recurrent biliary event rates approaching 20% for patients whose biliary pancreatitis bout was not followed by cholecystectomy, a figure in line with the rate seen in the present study.
“Cholecystectomy should be performed during index hospitalization or as soon as possible within 30 days of mild biliary pancreatitis to minimize risk of recurrent biliary events,” said Dr. Dalapathi.
The authors reported no outside sources of funding and no conflicts of interest.
SOURCE: Ullah M. et al. DDW 2019, Abstract 24.
SAN DIEGO – In a retrospective study of 234 patients admitted for gallstone pancreatitis, almost 90% of recurrent biliary events occurred in patients who did not receive a cholecystectomy within 60 days of hospital discharge. The overall rate of recurrence was 19%, and over half of patients (59%) did not receive a cholecystectomy during their index hospitalization.
Additionally, none of the recurrent biliary events occurred in those patients who did receive a cholecystectomy during the index hospitalization or within the first 30 days after discharge. “It really is the case that, ‘if you snooze, you lose,’ ” said Vijay Dalapathi, MD, presenting the findings during an oral presentation at the annual Digestive Disease Week.
Dr. Dalapathi and colleagues had observed that cholecystectomy during an index hospitalization for mild biliary pancreatitis was a far from universal practice, despite guidelines recommending early cholecystectomy.
To delve further into practice patterns, Dr. Dalapathi, first author Mohammed Ullah, MD, and their coauthors at the University of Rochester (N.Y.) conducted a single-site retrospective study of patients who were admitted with gallstone pancreatitis over a 5-year period ending December 2017. Dr. Dalapathi and Dr. Ullah are both second-year gastroenterology fellows.
The study had twin primary outcome measures: cholecystectomy rates performed during an index hospitalization for gallstone pancreatitis and recurrent biliary events after hospitalization. Adult patients were included if they had a diagnosis of acute gallstone pancreatitis, with or without recurrent cholangitis, choledocholithiasis, or acute cholecystitis. Pediatric patients and those with prior cholecystectomy were excluded.
A total of 234 patients were included in the study. Their mean age was 58.3 years, and patients were mostly female (57.3%) and white (91.5%). Mean body mass index was 29.1 kg/m2. A total of 175 patients (74.8%) had endoscopic retrograde cholangiopancreatography.
Out of the entire cohort of patients, 138 (59%) did not have a cholecystectomy during the index hospitalization. Among the patients who did not receive a cholecystectomy, 33 (24%) were deemed unsuitable candidates for the procedure, either because they were critically ill or because they were poor candidates for surgery for other reasons. No reason was provided for the nonperformance of cholecystectomy for an additional 28 patients (20%).
The remaining 75 patients (54%) were deferred to outpatient management. Looking at this subgroup of patients, Dr. Dalapathi and his coinvestigators tracked the amount of time that passed before cholecystectomy.
The researchers found that 19 patients (25%) had not had a cholecystectomy within the study period. A total of 21 patients (28%) had the procedure more than 60 days from hospitalization, and another 23 (31%) had the procedure between 30 and 60 days after hospitalization. Just 12 patients (16%) of this subgroup had their cholecystectomy within 30 days of hospitalization.
Among patients who were discharged without a cholecystectomy, Dr. Dalapathi and his coauthors found 26 recurrent biliary events (19%): 15 were gallstone pancreatitis and 10 were cholecystitis; 1 patient developed cholangitis.
The crux of the study’s findings came when the investigators looked at the association between recurrent events and cholecystectomy timing. They found no recurrent biliary events among those who received cholecystectomy while hospitalized or within the first 30 days after discharge. Of the 26 events, 3 (12%) occurred in those whose cholecystectomies came 30-60 days after discharge. The remaining 23 events (88%) were seen in those receiving a cholecystectomy more than 60 days after discharge, or not at all.
Guidelines from the American Gastroenterological Association, the Society of American Gastrointestinal and Endoscopic Surgeons, and the American College of Gastroenterology all recommend early cholecystectomy after mild acute gallstone pancreatitis, said Dr. Dalapathi.
However, two separate systematic reviews including a total of 22 studies and over 3,000 patients showed that about half (48% and 51%) of patients admitted with mild acute biliary pancreatitis received a cholecystectomy during the index hospitalization or within 14 days of the hospitalization.
Further, he said, previous work had shown recurrent biliary event rates approaching 20% for patients whose biliary pancreatitis bout was not followed by cholecystectomy, a figure in line with the rate seen in the present study.
“Cholecystectomy should be performed during index hospitalization or as soon as possible within 30 days of mild biliary pancreatitis to minimize risk of recurrent biliary events,” said Dr. Dalapathi.
The authors reported no outside sources of funding and no conflicts of interest.
SOURCE: Ullah M. et al. DDW 2019, Abstract 24.
REPORTING FROM DDW 2019
Preventing delayed genitourinary tract injury during benign hysterectomy
and the circumstances under which it should be performed. Procedures directed at prolapse and incontinence have rates of genitourinary injury as high as 11%-38%, and national guidelines affirm the importance of cystoscopy in these patients.1 However, for patients undergoing hysterectomy in the absence of these procedures, the optimal strategy is debated. One approach that has been advanced is a policy of universal cystoscopy at the time of hysterectomy. This policy, by which all women undergoing hysterectomy would undergo cystoscopy, aims to prevent the occurrence of an unrecognized genitourinary injury by diagnosing and treating the injury intraoperatively. However, cystoscopy is not the only method that can be used to evaluate the urinary tract. Retroperitoneal dissection also can be used to visually identify the pertinent structures and has been performed with high fidelity by generations of experienced and skilled pelvic surgeons.

Injuries that are not identified intraoperatively at the time of surgery, so-called delayed genitourinary tract injuries, are associated with serious postoperative consequences for patients and high costs for institutions. As surgeons strive to decrease complications and improve the quality of gynecologic surgery, the question of whether cystoscopy should routinely be performed at the time of hysterectomy for benign indications remains unanswered. Proponents argue that cystoscopy is a low-cost assessment and that 75% of genitourinary injuries occur in women without identifiable risk factors.2 Opponents point out that cystoscopy is not an entirely benign intervention; it is associated with increased rates of urinary tract infection, bladder and ureteral trauma, and additional operating room time. Furthermore, it is unclear that the use of cystoscopy will reduce the incidence of delayed genitourinary tract injury in clinical practice.
Ultimately, cystoscopy after hysterectomy is being used as a screening test for genitourinary injury, and this lens can be applied to provide more information about its usefulness. For screening tests, the sensitivity and false negative rate are of paramount importance. High sensitivity and resultant few false negatives are the characteristics of a robust screening test which has a low likelihood of missing a diagnosis. Unfortunately, the sensitivity of cystoscopy is not 100% for genitourinary tract injury; it ranges from 60% to 85% and can be as low as 43% for ureteral injury.3,4 This means that cystoscopy will falsely reassure the surgeon with normal results in greater than 50% of the cases in which the patient actually has a ureteral injury.
Some larger series call into question the usefulness of cystoscopy as a screening tool, finding that this evaluation is not associated with a decreased rate of delayed genitourinary injury. A recent publication by our group of a series of 39,529 women who underwent benign hysterectomy without procedures directed at incontinence and prolapse recorded in the National Surgical Quality Improvement Program (NSQIP) database between 2015 and 2017 found no difference in the rate of delayed genitourinary injury among women exposed to diagnostic cystoscopy and those who were not.5 These results are consistent with those of the largest systematic review and meta-analysis of 79 studies capturing 41,482 hysterectomies which found universal cystoscopy was not associated with a decreased rate of delayed genitourinary tract injury.6

Another consideration with the use of universal cystoscopy is cost. Although cystoscopy is typically a short procedure, the false positive rate is approximately 2%,2 often leading to additional interventions to evaluate the urinary tract which can be time consuming. In the limited available data regarding operative time, patients who underwent cystoscopy had a median operative time that was 17 minutes longer than it was among patients who did not.5 Moreover, there may be risks associated with this additional bladder instrumentation, evidenced by an increased incidence of urinary tract infection among women undergoing cystoscopy. In a recent cost-effectiveness analysis of cystoscopy at the time of benign hysterectomy, universal cystoscopy was found to add $51.39-$57.86 per case, and the risk of bladder injury would need to exceed 21%-47% and ureteral injury 27%-38% to be cost saving, compared with selective cystoscopy.7 A prior cost-effectiveness analysis concluded that universal cystoscopy is cost effective when the incidence of ureteral injury at the time of hysterectomy exceeds 1.5%-2.0%.8 Given these high thresholds, with a contemporary composite lower–genitourinary tract injury incidence of 0.24%-0.27%, it is unlikely that universal cystoscopy could be considered a cost-saving strategy in the majority of clinical settings.
Potential explanations for these results are many. Intraoperative cystoscopy is likely to be normal in the setting of nonobstructive and thermal injuries, which in the current era of minimally invasive surgery may be more prevalent mechanisms of injury. False positives can occur leading to unnecessary interventions, as well as overdiagnosis of asymptomatic urinary tract injuries that may have resolved spontaneously.9 It has been observed that cystoscopy is performed less frequently when hysterectomy is completed by a high-volume surgeon, which suggests that surgeon skill and experience play a significant role in the usefulness of this evaluation.9
Given these data, what is the best way forward regarding evaluation of the urinary tract at the time of benign hysterectomy? Ultimately, this is a clinical question that should be individualized, taking into account patient and surgical complexity, as well as surgeon training and individual rates of genitourinary injuries.9 Given its low sensitivity, caution should be exercised regarding the routine use of cystoscopy alone for evaluation of the urinary tract because false negatives occur with significant frequency. Benefits of cystoscopy in a given clinical scenario should be weighed against the risks of longer operative time, increased costs, and increased rate of urinary tract infection. In the absence of clinical scenarios with high rates of genitourinary injury (greater than 5%), selective rather than universal cystoscopy is the preferred strategy.7 Cystoscopy is fundamentally a form of secondary prevention that aims to mitigate damage that has already been done, and is no substitute for primary prevention of genitourinary tract injury itself through thorough knowledge of pelvic anatomy, comfort with retroperitoneal dissection, and awareness of the ureter and bladder at all times.
Dr. Polan is a resident in obstetrics and gynecology at Northwestern University, Chicago. Dr. Barber is an assistant professor of obstetrics and gynecology, specializing in gynecologic oncology, at the university. Neither of them have relevant financial disclosures. Email Dr. Polan and Dr. Barber at [email protected].
References
1. Am J Obstet Gynecol. 2018 Jul;219(1):75-7.
2. Obstet Gynecol. 2009 Jan;113(1):6-10.
3. Obstet Gynecol. 2016 Feb;127(2):369-75.
4. J Minim Invasive Gynecol. 2015 Nov-Dec;22(7):1278-86.
5. Obstet Gynecol. 2019 May;133(5):888-95.
6. Obstet Gynecol. 2015 Dec;126(6):1161-9.
7. Am J Obstet Gynecol. 2019 Apr;220(4):369.e1-7.
8. Obstet Gynecol. 2001 May;97(5 Pt 1):685-92.
9. Obstet Gynecol. 2012 Dec;120(6):1363-70.
and the circumstances under which it should be performed. Procedures directed at prolapse and incontinence have rates of genitourinary injury as high as 11%-38%, and national guidelines affirm the importance of cystoscopy in these patients.1 However, for patients undergoing hysterectomy in the absence of these procedures, the optimal strategy is debated. One approach that has been advanced is a policy of universal cystoscopy at the time of hysterectomy. This policy, by which all women undergoing hysterectomy would undergo cystoscopy, aims to prevent the occurrence of an unrecognized genitourinary injury by diagnosing and treating the injury intraoperatively. However, cystoscopy is not the only method that can be used to evaluate the urinary tract. Retroperitoneal dissection also can be used to visually identify the pertinent structures and has been performed with high fidelity by generations of experienced and skilled pelvic surgeons.
Injuries that are not identified intraoperatively at the time of surgery, so-called delayed genitourinary tract injuries, are associated with serious postoperative consequences for patients and high costs for institutions. As surgeons strive to decrease complications and improve the quality of gynecologic surgery, the question of whether cystoscopy should routinely be performed at the time of hysterectomy for benign indications remains unanswered. Proponents argue that cystoscopy is a low-cost assessment and that 75% of genitourinary injuries occur in women without identifiable risk factors.2 Opponents point out that cystoscopy is not an entirely benign intervention; it is associated with increased rates of urinary tract infection, bladder and ureteral trauma, and additional operating room time. Furthermore, it is unclear that the use of cystoscopy will reduce the incidence of delayed genitourinary tract injury in clinical practice.
Ultimately, cystoscopy after hysterectomy is being used as a screening test for genitourinary injury, and this lens can be applied to provide more information about its usefulness. For screening tests, the sensitivity and false negative rate are of paramount importance. High sensitivity and resultant few false negatives are the characteristics of a robust screening test which has a low likelihood of missing a diagnosis. Unfortunately, the sensitivity of cystoscopy is not 100% for genitourinary tract injury; it ranges from 60% to 85% and can be as low as 43% for ureteral injury.3,4 This means that cystoscopy will falsely reassure the surgeon with normal results in greater than 50% of the cases in which the patient actually has a ureteral injury.
Some larger series call into question the usefulness of cystoscopy as a screening tool, finding that this evaluation is not associated with a decreased rate of delayed genitourinary injury. A recent publication by our group of a series of 39,529 women who underwent benign hysterectomy without procedures directed at incontinence and prolapse recorded in the National Surgical Quality Improvement Program (NSQIP) database between 2015 and 2017 found no difference in the rate of delayed genitourinary injury among women exposed to diagnostic cystoscopy and those who were not.5 These results are consistent with those of the largest systematic review and meta-analysis of 79 studies capturing 41,482 hysterectomies which found universal cystoscopy was not associated with a decreased rate of delayed genitourinary tract injury.6
Another consideration with the use of universal cystoscopy is cost. Although cystoscopy is typically a short procedure, the false positive rate is approximately 2%,2 often leading to additional interventions to evaluate the urinary tract which can be time consuming. In the limited available data regarding operative time, patients who underwent cystoscopy had a median operative time that was 17 minutes longer than it was among patients who did not.5 Moreover, there may be risks associated with this additional bladder instrumentation, evidenced by an increased incidence of urinary tract infection among women undergoing cystoscopy. In a recent cost-effectiveness analysis of cystoscopy at the time of benign hysterectomy, universal cystoscopy was found to add $51.39-$57.86 per case, and the risk of bladder injury would need to exceed 21%-47% and ureteral injury 27%-38% to be cost saving, compared with selective cystoscopy.7 A prior cost-effectiveness analysis concluded that universal cystoscopy is cost effective when the incidence of ureteral injury at the time of hysterectomy exceeds 1.5%-2.0%.8 Given these high thresholds, with a contemporary composite lower–genitourinary tract injury incidence of 0.24%-0.27%, it is unlikely that universal cystoscopy could be considered a cost-saving strategy in the majority of clinical settings.
Potential explanations for these results are many. Intraoperative cystoscopy is likely to be normal in the setting of nonobstructive and thermal injuries, which in the current era of minimally invasive surgery may be more prevalent mechanisms of injury. False positives can occur leading to unnecessary interventions, as well as overdiagnosis of asymptomatic urinary tract injuries that may have resolved spontaneously.9 It has been observed that cystoscopy is performed less frequently when hysterectomy is completed by a high-volume surgeon, which suggests that surgeon skill and experience play a significant role in the usefulness of this evaluation.9
Given these data, what is the best way forward regarding evaluation of the urinary tract at the time of benign hysterectomy? Ultimately, this is a clinical question that should be individualized, taking into account patient and surgical complexity, as well as surgeon training and individual rates of genitourinary injuries.9 Given its low sensitivity, caution should be exercised regarding the routine use of cystoscopy alone for evaluation of the urinary tract because false negatives occur with significant frequency. Benefits of cystoscopy in a given clinical scenario should be weighed against the risks of longer operative time, increased costs, and increased rate of urinary tract infection. In the absence of clinical scenarios with high rates of genitourinary injury (greater than 5%), selective rather than universal cystoscopy is the preferred strategy.7 Cystoscopy is fundamentally a form of secondary prevention that aims to mitigate damage that has already been done, and is no substitute for primary prevention of genitourinary tract injury itself through thorough knowledge of pelvic anatomy, comfort with retroperitoneal dissection, and awareness of the ureter and bladder at all times.
Dr. Polan is a resident in obstetrics and gynecology at Northwestern University, Chicago. Dr. Barber is an assistant professor of obstetrics and gynecology, specializing in gynecologic oncology, at the university. Neither of them have relevant financial disclosures. Email Dr. Polan and Dr. Barber at [email protected].
References
1. Am J Obstet Gynecol. 2018 Jul;219(1):75-7.
2. Obstet Gynecol. 2009 Jan;113(1):6-10.
3. Obstet Gynecol. 2016 Feb;127(2):369-75.
4. J Minim Invasive Gynecol. 2015 Nov-Dec;22(7):1278-86.
5. Obstet Gynecol. 2019 May;133(5):888-95.
6. Obstet Gynecol. 2015 Dec;126(6):1161-9.
7. Am J Obstet Gynecol. 2019 Apr;220(4):369.e1-7.
8. Obstet Gynecol. 2001 May;97(5 Pt 1):685-92.
9. Obstet Gynecol. 2012 Dec;120(6):1363-70.