User login
Interhospital Transfers for Quality Assessment of Healthcare Systems
With the increasing percentage of our gross national product being allotted to healthcare and concerns about the care received by patients, the number of measures to assess the quality and efficiency of care delivered by healthcare professionals has increased. The paper by Mueller et al.1 adds to our understanding of an important yet relatively understudied group of patients: those that require transfer from one inpatient facility to another. In general, these patients are sicker and exhibit poor outcomes, especially with time-sensitive management conditions, such as cerebrovascular accidents, or conditions where the transfer itself may cause harm to the patient, such as the case of an infant born prematurely. However, transferring patients with less time-dependent conditions may not be associated with such negative results.1 The uniqueness of interhospital transfers is attributed to their ability to provide insights into the care practices of other actors within the healthcare system, namely, the transferring hospital and the larger healthcare system, and to describe how the care quality may change in hospitals during periods of stress, such as during overcrowding or high patient acuity.
As described by Mueller et al. the care and outcomes of patients transferred to a hospital may provide information regarding the key aspects of care at the receiving hospital; these aspects include the capability for triage of potentially high-acuity patients and the management of such patients during periods of crowding and organizational stress. These measures of efficiency have rarely been studied in relation to the care provided to patients and their ultimate outcomes. The most studied efficiency measure is hospital crowding, which has been shown in numerous studies to be associated with lower efficiency as measured by the length of stay, lower quality of care, and higher mortality.2-3 This report by Mueller et al. is one of the first papers to highlight how other aspects of the care delivery system, including the triage practices and the response of a hospital system to stress, may influence care outcomes. The limitation of other studies in exploring the relationship between the measures of efficiency and quality of care, as noted by a systematic review of healthcare efficiency measures by Hussey et al.4 emphasizes the need to understand the drivers of low quality of care and to determine the specific times at which such care may be compromised by other factors, such as patient volumes.
Although interhospital transfers may offer certain insights into the efficiency of care delivered at the hospitals receiving these patients, they are generally rare and centered on a few quaternary hospitals within a region.3 In addition, the Mueller paper reveals that not all these transfers have high disease acuity, particularly for cardiac patients. Whether claims-based approaches to risk adjustment would sufficiently differentiate the reasons for the transfer/failure to transfer of patients is unclear and thus may be affected by the selection bias. With these issues, the outcome of transferred patients may be only of limited value when assessing the care quality of hospitals that generally receive transferred patients from other medical institutions within a given geographic area.5
Interhospital transfers may provide insights into the care of patients at the hospitals which transfer out such patients, focusing on the appropriateness of transfers, how these hospitals operate when such a sick patient arrives at that hospital, and the outcomes of patients with conditions that may require transfer. A few studies have explored the preventable transfer, particularly for trauma patients, where a preventable transfer was defined as a transfer that was was not admitted to the receiving hospital and did not receive any procedures or testing. Although not readily defined for numerous conditions, such a measure would provide insights into how hospitals decide whether a patient requires care at a higher-level hospital and assessing the processes needed to optimize this decision-making process, including where the patient ultimately is transferred. In a study of patients with acute myocardial infarction, 36.8% of cases that required transfer were not directed to hospitals with the best outcomes as measured by 30-day risk-adjusted mortality rates within a given geographic region.6 Such decisions would contribute to the potential worse outcomes observed in patients requiring interhospital transfer.
Finally, transfers provide insights into the functioning of the larger healthcare system. The measures assessing the functioning of the healthcare system are rare. In theory, interhospital transfers meet the goals of a functioning regional healthcare system by matching the patients to facilities with the suitable capabilities to manage the patient’s given type of illness or injury. Such a system, however, requires collaboration between hospitals who otherwise compete for patients. The literature suggests that such collaboration is widely variable and dependent on patient factors, such as the types of conditions and their insurance status,7 and the costs required by hospitals to add the services needed to care for increasingly ill patients. In addition, the growth of so-called narrow insurance networks, which limit the number of hospitals an insurance company will include on their preferred network, may place barriers on the appropriate location of such transfers based on the quality of the receiving hospital.8
The paper by Mueller et al. adds to the literature the unique aspects of the care needed by the patients requiring interhospital transfer. Unlike most other measures of care quality and efficiency, interhospital transfers potentially offer knowledge about the quality of the larger healthcare system, assessing the appropriateness and ultimate outcomes not only of patients who are transferred but similarly sick patients who could have potentially benefited from a transfer and how the actors within the system may respond to periods of high patient load and stress. By understanding the drivers of the appropriateness of where patients receive care, we can gain insights into the mechanisms needed to fulfill the goals of a functional regionalized healthcare system.
Disclosures
The author has no financial or other relevant conflicts of interest to disclose.
1. Mueller SK, Fiskio J, Schnipper J. Interhospital transfer: transfer processes and patient outcomes. J Hosp Med. 2019;(8):486-491. https://doi.org/10.12788/jhm.3192.
2. Lorch SA, Millman AM, Zhang X, Even-Shoshan O, Silber JH. Impact of admission-day crowding on the length of stay of pediatric hospitalizations. Pediatrics. 2008;121(4):e718-e730. https://doi.org/10.1542/peds.2007-1280.
3. Sun BC, Hsia RY, Weiss RE, et al. Effect of emergency department crowding on outcomes of admitted patients. Ann Emerg Med. 2013;61(6):605-611.e6. https://doi.org/10.1016/j.annemergmed.2012.10.026
4. Hussey PS, de Vries H, Romley J, et al. A systematic review of health care efficiency measures. Health Serv Res. 2009;44(3):784-805. https://doi.org/10.1111/j.1475-6773.2008.00942.x.
5. Lorch SA. National quality measures in perinatal medicine. Clin Perinatol. 2017;44(3):485-509. https://doi.org/10.1016/j.clp.2017.05.001
6. Iwashyna TJ, Kahn JM, Hayward RA, Nallamothu BK. Interhospital transfers among Medicare beneficiaries admitted for acute myocardial infarction at nonrevascularization hospitals. Circ Cardiovasc Qual Outcomes. 2010;3(5):468-475. https://doi.org/10.1161/CIRCOUTCOMES.110.957993.
7. Green A, Showstack J, Rennie D, Goldman L. The relationship of insurance status, hospital ownership, and teaching status with interhospital transfers in California in 2000. Acad Med. 2005;80(8):774-779. https://doi.org/10.1097/00001888-200508000-00015
8. Colvin JD, Hall M, Thurm C, et al. Hypothetical network adequacy schemes for children fail to ensure patients’ access to in-network children’s hospital. Health Aff (Millwood). 2018;37(6):873-880. https://doi.org/10.1377/hlthaff.2017.1339.
With the increasing percentage of our gross national product being allotted to healthcare and concerns about the care received by patients, the number of measures to assess the quality and efficiency of care delivered by healthcare professionals has increased. The paper by Mueller et al.1 adds to our understanding of an important yet relatively understudied group of patients: those that require transfer from one inpatient facility to another. In general, these patients are sicker and exhibit poor outcomes, especially with time-sensitive management conditions, such as cerebrovascular accidents, or conditions where the transfer itself may cause harm to the patient, such as the case of an infant born prematurely. However, transferring patients with less time-dependent conditions may not be associated with such negative results.1 The uniqueness of interhospital transfers is attributed to their ability to provide insights into the care practices of other actors within the healthcare system, namely, the transferring hospital and the larger healthcare system, and to describe how the care quality may change in hospitals during periods of stress, such as during overcrowding or high patient acuity.
As described by Mueller et al. the care and outcomes of patients transferred to a hospital may provide information regarding the key aspects of care at the receiving hospital; these aspects include the capability for triage of potentially high-acuity patients and the management of such patients during periods of crowding and organizational stress. These measures of efficiency have rarely been studied in relation to the care provided to patients and their ultimate outcomes. The most studied efficiency measure is hospital crowding, which has been shown in numerous studies to be associated with lower efficiency as measured by the length of stay, lower quality of care, and higher mortality.2-3 This report by Mueller et al. is one of the first papers to highlight how other aspects of the care delivery system, including the triage practices and the response of a hospital system to stress, may influence care outcomes. The limitation of other studies in exploring the relationship between the measures of efficiency and quality of care, as noted by a systematic review of healthcare efficiency measures by Hussey et al.4 emphasizes the need to understand the drivers of low quality of care and to determine the specific times at which such care may be compromised by other factors, such as patient volumes.
Although interhospital transfers may offer certain insights into the efficiency of care delivered at the hospitals receiving these patients, they are generally rare and centered on a few quaternary hospitals within a region.3 In addition, the Mueller paper reveals that not all these transfers have high disease acuity, particularly for cardiac patients. Whether claims-based approaches to risk adjustment would sufficiently differentiate the reasons for the transfer/failure to transfer of patients is unclear and thus may be affected by the selection bias. With these issues, the outcome of transferred patients may be only of limited value when assessing the care quality of hospitals that generally receive transferred patients from other medical institutions within a given geographic area.5
Interhospital transfers may provide insights into the care of patients at the hospitals which transfer out such patients, focusing on the appropriateness of transfers, how these hospitals operate when such a sick patient arrives at that hospital, and the outcomes of patients with conditions that may require transfer. A few studies have explored the preventable transfer, particularly for trauma patients, where a preventable transfer was defined as a transfer that was was not admitted to the receiving hospital and did not receive any procedures or testing. Although not readily defined for numerous conditions, such a measure would provide insights into how hospitals decide whether a patient requires care at a higher-level hospital and assessing the processes needed to optimize this decision-making process, including where the patient ultimately is transferred. In a study of patients with acute myocardial infarction, 36.8% of cases that required transfer were not directed to hospitals with the best outcomes as measured by 30-day risk-adjusted mortality rates within a given geographic region.6 Such decisions would contribute to the potential worse outcomes observed in patients requiring interhospital transfer.
Finally, transfers provide insights into the functioning of the larger healthcare system. The measures assessing the functioning of the healthcare system are rare. In theory, interhospital transfers meet the goals of a functioning regional healthcare system by matching the patients to facilities with the suitable capabilities to manage the patient’s given type of illness or injury. Such a system, however, requires collaboration between hospitals who otherwise compete for patients. The literature suggests that such collaboration is widely variable and dependent on patient factors, such as the types of conditions and their insurance status,7 and the costs required by hospitals to add the services needed to care for increasingly ill patients. In addition, the growth of so-called narrow insurance networks, which limit the number of hospitals an insurance company will include on their preferred network, may place barriers on the appropriate location of such transfers based on the quality of the receiving hospital.8
The paper by Mueller et al. adds to the literature the unique aspects of the care needed by the patients requiring interhospital transfer. Unlike most other measures of care quality and efficiency, interhospital transfers potentially offer knowledge about the quality of the larger healthcare system, assessing the appropriateness and ultimate outcomes not only of patients who are transferred but similarly sick patients who could have potentially benefited from a transfer and how the actors within the system may respond to periods of high patient load and stress. By understanding the drivers of the appropriateness of where patients receive care, we can gain insights into the mechanisms needed to fulfill the goals of a functional regionalized healthcare system.
Disclosures
The author has no financial or other relevant conflicts of interest to disclose.
1. Mueller SK, Fiskio J, Schnipper J. Interhospital transfer: transfer processes and patient outcomes. J Hosp Med. 2019;(8):486-491. https://doi.org/10.12788/jhm.3192.
2. Lorch SA, Millman AM, Zhang X, Even-Shoshan O, Silber JH. Impact of admission-day crowding on the length of stay of pediatric hospitalizations. Pediatrics. 2008;121(4):e718-e730. https://doi.org/10.1542/peds.2007-1280.
3. Sun BC, Hsia RY, Weiss RE, et al. Effect of emergency department crowding on outcomes of admitted patients. Ann Emerg Med. 2013;61(6):605-611.e6. https://doi.org/10.1016/j.annemergmed.2012.10.026
4. Hussey PS, de Vries H, Romley J, et al. A systematic review of health care efficiency measures. Health Serv Res. 2009;44(3):784-805. https://doi.org/10.1111/j.1475-6773.2008.00942.x.
5. Lorch SA. National quality measures in perinatal medicine. Clin Perinatol. 2017;44(3):485-509. https://doi.org/10.1016/j.clp.2017.05.001
6. Iwashyna TJ, Kahn JM, Hayward RA, Nallamothu BK. Interhospital transfers among Medicare beneficiaries admitted for acute myocardial infarction at nonrevascularization hospitals. Circ Cardiovasc Qual Outcomes. 2010;3(5):468-475. https://doi.org/10.1161/CIRCOUTCOMES.110.957993.
7. Green A, Showstack J, Rennie D, Goldman L. The relationship of insurance status, hospital ownership, and teaching status with interhospital transfers in California in 2000. Acad Med. 2005;80(8):774-779. https://doi.org/10.1097/00001888-200508000-00015
8. Colvin JD, Hall M, Thurm C, et al. Hypothetical network adequacy schemes for children fail to ensure patients’ access to in-network children’s hospital. Health Aff (Millwood). 2018;37(6):873-880. https://doi.org/10.1377/hlthaff.2017.1339.
© 2019 Society of Hospital Medicine
Quantity, Quality, or Neither–Measuring the Effectiveness of Rounds
Medicine has a rich history of attending-led rounds, with some iteration of this ritual occurring as far back as the 1600s.1 In the early 1900s, the concept of “bedside rounds” was popularized by William Osler, who widely espoused their importance as a clinical and educational tool. Despite our best intentions, however, rounds today may be little reminiscent of the rounds of Osler’s day. Recent investigations into the characteristics of rounds have specifically revealed a “shift in the format from the beside to conference rooms and hallways.”2 Most of our practices for rounding in the modern era are built on tradition and belief rather than evidence. The ecosystem of modern hospital care is dramatically different than that of Osler’s day, and fundamental questions about the format, content, stakeholders, and processes of rounds remain. Perhaps the greatest and most needed change in rounding in recent years is the shift of rounds from a physician-centric activity to an activity that values the modern interprofessional hospital team. Ultimately, the very definition of “rounds” and the purpose they are meant to serve in the context of a dynamic and complicated hospital ecosystem has become increasingly complex and thus, difficult to assess and improve.
In this month’s Journal of Hospital Medicine, Sang et al.3 address this complexity by returning to basics and utilizing a novel approach to precisely measure the frequency and duration of a necessary (albeit insufficient) condition for interdisciplinary bedside rounding to occur: colocation of physician, nurse, and patient. Ultimately, their results provide a springboard to ask more complex and meaningful questions. Why, despite a recent culture shift prioritizing a return to bedside, is substantive physician and nurse colocation so persistently difficult to attain? How can we study outcomes of interdisciplinary bedside rounds if we cannot reliably facilitate their occurrence? What does “effective” rounding even mean? That is, what variables would be both meaningful and sensitive to changes in rounds?
After centuries of rounding, the medical community would be presumed to have perfected this art; however, we are instead left with more questions than answers. Prior research efforts have demonstrated the shifting of rounds away from the bedside, with bedside rounds occurring only 10%-40% of the time based on bias-prone survey data.2,4 Interestingly, a study by Huang et al., designed specifically to increase implementation of interdisciplinary bedside rounds, showed a frequency of only 64%.5 These studies are focused primarily on parameters such as patient and nursing satisfaction and did not include other important outcomes such as length of stay, readmission rates, diagnostic quality, patient engagement, or mortality.2,4,6
In Sang et al.,3 the authors utilized a real-time locator system, namely, radiofrequency identification, to precisely track the physical workflow of both attending hospitalists and bedside nurses and then subsequently used the data obtained to measure the frequency and duration of colocation at the patient bedside. The authors defined a physician “rounding event” as the physician’s presence in a single bed patient room for at least 10 seconds. The study revealed that colocation of physician and nurse (for at least 10 seconds) occurred in only 30% of all physician rounding events recorded. The duration of a physician rounding event was 5.68 minutes without nurse colocation and 9.56 minutes if a nurse was present. No difference in the frequency of physician-nurse overlap was observed between weekdays and weekends. Interestingly and not surprisingly, patient rooms located farther from the nursing station had a decreased likelihood of physician-nurse overlap.
A greater understanding of the medical community’s inability to reliably implement interdisciplinary bedside rounding may be found by examining the ecosystem of inpatient medicine. Physicians and nurses function in an environment with increasingly complex patients, more stringent (and non- evidence-based) documentation requirements, the physical decoupling of patients and their clinical information, and, as Sang et al.3 illuminate, complex geographical ward structures. As the rapidity with which patients are diagnosed and treated continues to escalate, physicians and nurses are also asked to attempt to squeeze an Oslerian-type rounding system into an ecosystem that is in overdrive. That the puzzle pieces do not fit should not be a surprise.
There is a risk that systems may implement interventions to “check the box” for interdisciplinary bedside rounding instead of seeking to change outcomes. How much time is time enough together at the bedside? Sang et al., among others, ponder whether a rounding duration of just under 10 minutes is enough.3,6 However, Rothberg et al. demonstrated that increased duration of communication alone is not necessarily associated with increased patient satisfaction or nurse–physician agreement on plan of care,7 suggesting that colocation and communication are necessary but not sufficient for true interdisciplinary patient care. The discordance between communication and understanding can potentially be explained by the varying agendas of the members of the interdisciplinary team during the same interaction.8
Ultimately, the future of interdisciplinary bedside rounding, and rounding in general, remains uncertain. Potential areas for improvement and further study include patient regionalization,3,5 tools to align agendas among stakeholders,8 integrating recommendations for interdisciplinary communication,9 and utilizing a common definition and taxonomy for study design.10 These interventions may improve future study designs and outcomes. However, these interventions are small tweaks in a complex ecosystem, and the return on these interventions may eventually reach an asymptote. Perhaps the concept of rounding as we know it is broken beyond repair, and a more radical approach is needed: either the creation of a completely innovative shared mental model of acute care that acknowledges the complex environment of inpatient medicine, or a complete restructuring of the ecosystem itself. Nonetheless, the findings of Sang et al.3 with respect to the ongoing difficulty of implementing interdisciplinary bedside rounding elucidate the need for innovation in study design and rounding implementation strategies; they also prompt us to ask—and answer—the complicated questions related to this integral component of our practice.
Disclosures
The authors have nothing to disclose.
1. Linfors EW, Neelon FA. The case for bedside rounds. N Engl J Med. 1980;303(21):1230-1233. https://doi.org/10.1056/NEJM198011203032110.
2. Stickrath C, Noble M, Prochazka A, et al. Attending rounds in the current era. JAMA Intern Med. 2013;173(12):1084. https://doi.org/10.1001/jamainternmed.2013.6041.
3. Sang AX, Tisdale RL, Nielson D, et al. How much time are physicians and nurses spending together at the patient bedside? J Hosp Med. 2019;14(8):468-473. https://doi.org/10.12788/jhm.3204.
4. O’leary KJ, Killarney A, Hansen LO, et al. Effect of patient-centred bedside rounds on hospitalised patients’ decision control, activation and satisfaction with care. BMJ Qual Saf. https://doi.org/10.1136/bmjqs-2015-005035.
5. Huang KTL, Minahan J, Brita-Rossi P, et al. All together now: impact of a regionalization and bedside rounding initiative on the efficiency and inclusiveness of clinical rounds OR. J Hosp Med. 2017;12(3):150-156. https://doi.org/10.12788/jhm.2696.
6. Gonzalo JD, Wolpaw DR, Lehman E, Chuang CH. Patient-centered interprofessional collaborative care: factors associated with bedside interprofessional rounds. J Gen Intern Med. 2014;29(7):1040-1047. https://doi.org/10.1007/s11606-014-2817-x.
7. Rothberg MB, Steele JR, Wheeler J, Arora A, Priya A, Lindenauer PK. The relationship between time spent communicating and communication outcomes on a hospital medicine service. J Gen Intern Med. 2012;27(2):185-189. https://doi.org/10.1007/s11606-011-1857-8.
8. Holton R, Patel R, Eggebrecht M, et al. Rounding on rounds. Am J Med Qual. 2015;30(5):493-493. https://doi.org/10.1177/1062860615596388.
9. Kassutto S , Seam N, Carlos WG, et al. Twelve tips for conducting successful interprofessional teaching rounds [published online ahead of print February 1, 2019]. Med Teach. https://doi.org/10.1080/0142159X.2018.1545086.
10. Bhamidipati VS, Elliott DJ, Justice EM, Belleh E, Sonnad SS, Robinson EJ. Structure and outcomes of interdisciplinary rounds in hospitalized medicine patients: a systematic review and suggested taxonomy. J Hosp Med. 2016;11(7):513-523. https://doi.org/10.1002/jhm.2575.
Medicine has a rich history of attending-led rounds, with some iteration of this ritual occurring as far back as the 1600s.1 In the early 1900s, the concept of “bedside rounds” was popularized by William Osler, who widely espoused their importance as a clinical and educational tool. Despite our best intentions, however, rounds today may be little reminiscent of the rounds of Osler’s day. Recent investigations into the characteristics of rounds have specifically revealed a “shift in the format from the beside to conference rooms and hallways.”2 Most of our practices for rounding in the modern era are built on tradition and belief rather than evidence. The ecosystem of modern hospital care is dramatically different than that of Osler’s day, and fundamental questions about the format, content, stakeholders, and processes of rounds remain. Perhaps the greatest and most needed change in rounding in recent years is the shift of rounds from a physician-centric activity to an activity that values the modern interprofessional hospital team. Ultimately, the very definition of “rounds” and the purpose they are meant to serve in the context of a dynamic and complicated hospital ecosystem has become increasingly complex and thus, difficult to assess and improve.
In this month’s Journal of Hospital Medicine, Sang et al.3 address this complexity by returning to basics and utilizing a novel approach to precisely measure the frequency and duration of a necessary (albeit insufficient) condition for interdisciplinary bedside rounding to occur: colocation of physician, nurse, and patient. Ultimately, their results provide a springboard to ask more complex and meaningful questions. Why, despite a recent culture shift prioritizing a return to bedside, is substantive physician and nurse colocation so persistently difficult to attain? How can we study outcomes of interdisciplinary bedside rounds if we cannot reliably facilitate their occurrence? What does “effective” rounding even mean? That is, what variables would be both meaningful and sensitive to changes in rounds?
After centuries of rounding, the medical community would be presumed to have perfected this art; however, we are instead left with more questions than answers. Prior research efforts have demonstrated the shifting of rounds away from the bedside, with bedside rounds occurring only 10%-40% of the time based on bias-prone survey data.2,4 Interestingly, a study by Huang et al., designed specifically to increase implementation of interdisciplinary bedside rounds, showed a frequency of only 64%.5 These studies are focused primarily on parameters such as patient and nursing satisfaction and did not include other important outcomes such as length of stay, readmission rates, diagnostic quality, patient engagement, or mortality.2,4,6
In Sang et al.,3 the authors utilized a real-time locator system, namely, radiofrequency identification, to precisely track the physical workflow of both attending hospitalists and bedside nurses and then subsequently used the data obtained to measure the frequency and duration of colocation at the patient bedside. The authors defined a physician “rounding event” as the physician’s presence in a single bed patient room for at least 10 seconds. The study revealed that colocation of physician and nurse (for at least 10 seconds) occurred in only 30% of all physician rounding events recorded. The duration of a physician rounding event was 5.68 minutes without nurse colocation and 9.56 minutes if a nurse was present. No difference in the frequency of physician-nurse overlap was observed between weekdays and weekends. Interestingly and not surprisingly, patient rooms located farther from the nursing station had a decreased likelihood of physician-nurse overlap.
A greater understanding of the medical community’s inability to reliably implement interdisciplinary bedside rounding may be found by examining the ecosystem of inpatient medicine. Physicians and nurses function in an environment with increasingly complex patients, more stringent (and non- evidence-based) documentation requirements, the physical decoupling of patients and their clinical information, and, as Sang et al.3 illuminate, complex geographical ward structures. As the rapidity with which patients are diagnosed and treated continues to escalate, physicians and nurses are also asked to attempt to squeeze an Oslerian-type rounding system into an ecosystem that is in overdrive. That the puzzle pieces do not fit should not be a surprise.
There is a risk that systems may implement interventions to “check the box” for interdisciplinary bedside rounding instead of seeking to change outcomes. How much time is time enough together at the bedside? Sang et al., among others, ponder whether a rounding duration of just under 10 minutes is enough.3,6 However, Rothberg et al. demonstrated that increased duration of communication alone is not necessarily associated with increased patient satisfaction or nurse–physician agreement on plan of care,7 suggesting that colocation and communication are necessary but not sufficient for true interdisciplinary patient care. The discordance between communication and understanding can potentially be explained by the varying agendas of the members of the interdisciplinary team during the same interaction.8
Ultimately, the future of interdisciplinary bedside rounding, and rounding in general, remains uncertain. Potential areas for improvement and further study include patient regionalization,3,5 tools to align agendas among stakeholders,8 integrating recommendations for interdisciplinary communication,9 and utilizing a common definition and taxonomy for study design.10 These interventions may improve future study designs and outcomes. However, these interventions are small tweaks in a complex ecosystem, and the return on these interventions may eventually reach an asymptote. Perhaps the concept of rounding as we know it is broken beyond repair, and a more radical approach is needed: either the creation of a completely innovative shared mental model of acute care that acknowledges the complex environment of inpatient medicine, or a complete restructuring of the ecosystem itself. Nonetheless, the findings of Sang et al.3 with respect to the ongoing difficulty of implementing interdisciplinary bedside rounding elucidate the need for innovation in study design and rounding implementation strategies; they also prompt us to ask—and answer—the complicated questions related to this integral component of our practice.
Disclosures
The authors have nothing to disclose.
1. Linfors EW, Neelon FA. The case for bedside rounds. N Engl J Med. 1980;303(21):1230-1233. https://doi.org/10.1056/NEJM198011203032110.
2. Stickrath C, Noble M, Prochazka A, et al. Attending rounds in the current era. JAMA Intern Med. 2013;173(12):1084. https://doi.org/10.1001/jamainternmed.2013.6041.
3. Sang AX, Tisdale RL, Nielson D, et al. How much time are physicians and nurses spending together at the patient bedside? J Hosp Med. 2019;14(8):468-473. https://doi.org/10.12788/jhm.3204.
4. O’leary KJ, Killarney A, Hansen LO, et al. Effect of patient-centred bedside rounds on hospitalised patients’ decision control, activation and satisfaction with care. BMJ Qual Saf. https://doi.org/10.1136/bmjqs-2015-005035.
5. Huang KTL, Minahan J, Brita-Rossi P, et al. All together now: impact of a regionalization and bedside rounding initiative on the efficiency and inclusiveness of clinical rounds OR. J Hosp Med. 2017;12(3):150-156. https://doi.org/10.12788/jhm.2696.
6. Gonzalo JD, Wolpaw DR, Lehman E, Chuang CH. Patient-centered interprofessional collaborative care: factors associated with bedside interprofessional rounds. J Gen Intern Med. 2014;29(7):1040-1047. https://doi.org/10.1007/s11606-014-2817-x.
7. Rothberg MB, Steele JR, Wheeler J, Arora A, Priya A, Lindenauer PK. The relationship between time spent communicating and communication outcomes on a hospital medicine service. J Gen Intern Med. 2012;27(2):185-189. https://doi.org/10.1007/s11606-011-1857-8.
8. Holton R, Patel R, Eggebrecht M, et al. Rounding on rounds. Am J Med Qual. 2015;30(5):493-493. https://doi.org/10.1177/1062860615596388.
9. Kassutto S , Seam N, Carlos WG, et al. Twelve tips for conducting successful interprofessional teaching rounds [published online ahead of print February 1, 2019]. Med Teach. https://doi.org/10.1080/0142159X.2018.1545086.
10. Bhamidipati VS, Elliott DJ, Justice EM, Belleh E, Sonnad SS, Robinson EJ. Structure and outcomes of interdisciplinary rounds in hospitalized medicine patients: a systematic review and suggested taxonomy. J Hosp Med. 2016;11(7):513-523. https://doi.org/10.1002/jhm.2575.
© 2019 Society of Hospital Medicine
Counting the Ways to Count Medications: The Challenges of Defining Pediatric Polypharmacy
Polypharmacy, the practice of taking multiple medications to manage health conditions, is common for children. Many children today have a higher burden chronic illness and an increasing number of pharmaceuticals—often delivered in various doses throughout the day. Polypharmacy has been linked to a variety of pediatric and adult outcomes, including medication errors and readmission.1-3 Consequently, the Society of Hospital Medicine recognizes polypharmacy as a risk factor for readmission for adult populations.4 These adverse outcomes are related to both the human elements of polypharmacy (eg, cognitive burden, adherence) and the pharmacologic elements, including drug–drug interactions. For many children, the safety implications of polypharmacy may be more consequential due to the reliance of multiple caregivers to administer medications, which requires additional coordination to ensure that medications are administered and not duplicated. Dual administration of the same medication by both parents is the most common reason for pediatric calls to Poison Control Centers.5 Yet, there is a paucity of research in this area, with most of the pediatric literature focusing on the outpatient setting and specific populations, including epilepsy and mental health.6-8
How providers, patients, and families translate medication lists to counts of medications—and hence the burden of polypharmacy—is not clearly or consistently described. Often in studies of polypharmacy, researchers utilize medication claims data to count the number of medications a patient has filled from the pharmacy. However, in routine clinical practice, clinicians rarely have access to medication claims and thus rely on patient or family report, which may or may not match the list of medications in the patients’ medical records.
Therefore, linking polypharmacy research to the pragmatic complexities of clinical care requires greater clarity and consistent application of concepts. At hospital discharge, families receive a list of medications to take, including home medications to resume as well as newly prescribed medications. However, not all medications are equally essential to patients’ care regarding importance of administration (eg, hydrocortisone ointment versus an anticonvulsant medication). Patients, parents, and caregivers are ultimately responsible for determining which medications to prioritize and administer.
Although there is no standard numerical definition for how to identify polypharmacy, five medications is commonly considered the threshold for polypharmacy.9 A recent review of the pediatric polypharmacy literature suggested a lower threshold, with any two concurrent medications for at least a day.7 Yet, the best approach to “count” medications at hospital discharge is unclear. The simplest method is to tally the number of medications listed in the discharge summary. However, medications are sometimes listed twice due to different dosages administered at different times. Frequently, medications are prescribed on an as-needed basis; these medications could be administered routinely or very infrequently (eg, epinephrine for anaphylaxis). Over-the-counter medications are also sometimes included in discharge summaries and consideration should be given as to whether these medications count toward measures of polypharmacy. Over-the-counter medications would not be counted by a polypharmacy measure that relies on claims data if those medications are not paid by the insurer.
We sought consensus on how to count discharge medications through a series of informal interviews with hospitalists, nurses, and parents. We asked the seemingly simple question, “How many medications is this child on?” across a variety of scenarios (Figure). For panel A, all stakeholders agreed that this medication list includes two medications. All other scenarios elicited disagreement. For panel B, many people responded three medications, but others (often physicians) counted only clindamycin and therefore responded one medication.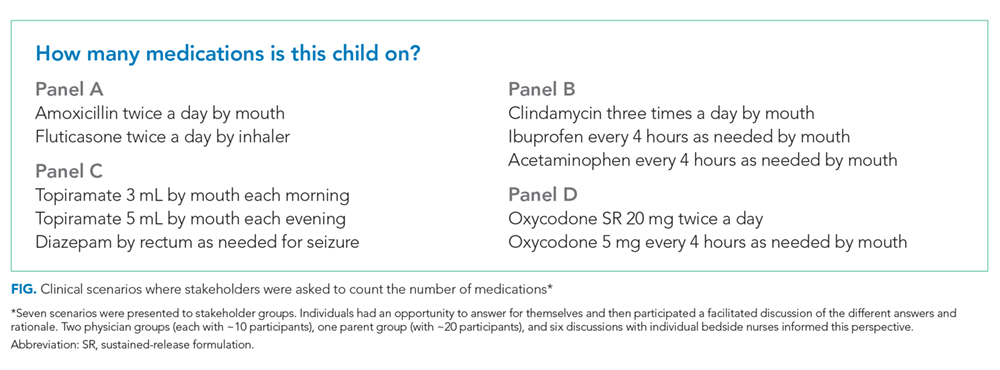
For panel C, stakeholders were split between one (only topiramate), two (topiramate and rectal diazepam), and three medications (two different doses of topiramate, which counted as two different medications, plus rectal diazepam). Interestingly, one parent reflected that they would count panel C differently, depending on with whom they were discussing the medications. If the parent were speaking with a physician, they would consider the two different doses of topiramate as a single medication; however, if they were conveying a list of medications to a babysitter, they would consider them as two different medications. Finally, panel D also split stakeholders between counting one and two medications, with some parents expressing confusion as to why the child would be prescribed the same medication at different times.
While our informal conversations with physicians, nurses, and families should not be construed as rigorous qualitative research, we are concerned about the lack of a shared mental model about the best way to count discharge polypharmacy. In reviewing the comments that we collected, the family voice stands out—physicians do not know how a parent or a caregiver will prioritize the medications to give to their child; physicians do not know whether families will count medications as a group or as separate entities. Although providers, patients, and families share a list of medications at discharge, this list may contain items not considered as “medications” by physicians.10 Nevertheless, the medication list provided at discharge is what the family must navigate once home. One way to consider discharge polypharmacy would be to count all the medications in the discharge summary, regardless of clinicians’ perceptions of necessity or importance. Electronic health record based tools should sum medications counts. Ultimately, further research is needed to understand the cognitive and care burden discharge polypharmacy places on families as well as understand this burden’s relationship to safety and transition outcomes.
Disclosures
Dr. Auger has nothing to disclose. Dr. Shah is the Editor-in-Chief of the Journal of Hospital Medicine. Dr. Davis has nothing to disclose. Dr. Brady reports grants from Agency for Healthcare Research and Quality, outside the submitted work.
Funding
This project is supported by a grant from the Agency for Healthcare Research and Quality (1K08HS204735-01A1).
1. Winer JC, Aragona E, Fields AI, Stockwell DC. Comparison of clinical risk factors among pediatric patients with single admission, multiple admissions (without any 7-day readmissions), and 7-day readmission. Hosp Pediatr. 2016;6(3):119-125. https://doi.org/10.1542/hpeds.2015-0110.
2. Feinstein J, Dai D, Zhong W, Freedman J, Feudtner C. Potential drug-drug interactions in infant, child, and adolescent patients in children’s hospitals. Pediatrics. 2015;135(1):e99-e108. https://doi.org/10.1542/peds.2014-2015.
3. Patterson SM, Cadogan CA, Kerse N, et al. Interventions to improve the appropriate use of polypharmacy for older people. Cochrane Database Syst Rev. 2014(10):CD008165. https://doi.org/10.1002/14651858.CD008165.pub3.
4. Society of Hospital Medicine. Project BOOST: better outcomes for older adults through safe transitions—implementation guide to improve care transitions.
5. Smith MD, Spiller HA, Casavant MJ, Chounthirath T, Brophy TJ, Xiang H. Out-of-hospital medication errors among young children in the United States, 2002-2012. Pediatrics. 2014;134(5):867-876. https://doi.org/10.1542/peds.2014-0309.
6. Baker C, Feinstein JA, Ma X, et al. Variation of the prevalence of pediatric polypharmacy: a scoping review. Pharmacoepidemiol Drug Saf. 2019;28(3):275-287. https://doi.org/10.1002/pds.4719.
7. Bakaki PM, Horace A, Dawson N, et al. Defining pediatric polypharmacy: a scoping review. PLoS One. 2018;13(11):e0208047. https://doi.org/10.1371/journal.pone.0208047.
8. Horace AE, Ahmed F. Polypharmacy in pediatric patients and opportunities for pharmacists’ involvement. Integr Pharm Res Pract. 2015;4:113-126. https://doi.org/10.2147/IPRP.S64535.
9. Masnoon N, Shakib S, Kalisch-Ellett L, Caughey GE. What is polypharmacy? A systematic review of definitions. BMC Geriatr. 2017;17(1):230. https://doi.org/10.1186/s12877-017-0621-2.
10. Auger KA, Shah SS, Huang B, et al. Discharge Medical Complexity, Change in Medical Complexity and Pediatric Thirty-day Readmission. J Hosp Med. 2019;14(8):474-481. https://doi.org/10.12788/jhm.3222.
11. Martin P, Tamblyn R, Benedetti A, Ahmed S, Tannenbaum C. Effect of a pharmacist-led educational intervention on inappropriate medication prescriptions in older adults: the D-PRESCRIBE randomized clinical trial. Jama. 2018;320(18):1889-1898. https://doi.org/10.1001/jama.2018.16131.
12. Page AT, Clifford RM, Potter K, Schwartz D, Etherton-Beer CD. The feasibility and effect of deprescribing in older adults on mortality and health: a systematic review and meta-analysis. Br J Clin Pharmacol. 2016;82(3):583-623. https://doi.org/10.1111/bcp.12975.
Polypharmacy, the practice of taking multiple medications to manage health conditions, is common for children. Many children today have a higher burden chronic illness and an increasing number of pharmaceuticals—often delivered in various doses throughout the day. Polypharmacy has been linked to a variety of pediatric and adult outcomes, including medication errors and readmission.1-3 Consequently, the Society of Hospital Medicine recognizes polypharmacy as a risk factor for readmission for adult populations.4 These adverse outcomes are related to both the human elements of polypharmacy (eg, cognitive burden, adherence) and the pharmacologic elements, including drug–drug interactions. For many children, the safety implications of polypharmacy may be more consequential due to the reliance of multiple caregivers to administer medications, which requires additional coordination to ensure that medications are administered and not duplicated. Dual administration of the same medication by both parents is the most common reason for pediatric calls to Poison Control Centers.5 Yet, there is a paucity of research in this area, with most of the pediatric literature focusing on the outpatient setting and specific populations, including epilepsy and mental health.6-8
How providers, patients, and families translate medication lists to counts of medications—and hence the burden of polypharmacy—is not clearly or consistently described. Often in studies of polypharmacy, researchers utilize medication claims data to count the number of medications a patient has filled from the pharmacy. However, in routine clinical practice, clinicians rarely have access to medication claims and thus rely on patient or family report, which may or may not match the list of medications in the patients’ medical records.
Therefore, linking polypharmacy research to the pragmatic complexities of clinical care requires greater clarity and consistent application of concepts. At hospital discharge, families receive a list of medications to take, including home medications to resume as well as newly prescribed medications. However, not all medications are equally essential to patients’ care regarding importance of administration (eg, hydrocortisone ointment versus an anticonvulsant medication). Patients, parents, and caregivers are ultimately responsible for determining which medications to prioritize and administer.
Although there is no standard numerical definition for how to identify polypharmacy, five medications is commonly considered the threshold for polypharmacy.9 A recent review of the pediatric polypharmacy literature suggested a lower threshold, with any two concurrent medications for at least a day.7 Yet, the best approach to “count” medications at hospital discharge is unclear. The simplest method is to tally the number of medications listed in the discharge summary. However, medications are sometimes listed twice due to different dosages administered at different times. Frequently, medications are prescribed on an as-needed basis; these medications could be administered routinely or very infrequently (eg, epinephrine for anaphylaxis). Over-the-counter medications are also sometimes included in discharge summaries and consideration should be given as to whether these medications count toward measures of polypharmacy. Over-the-counter medications would not be counted by a polypharmacy measure that relies on claims data if those medications are not paid by the insurer.
We sought consensus on how to count discharge medications through a series of informal interviews with hospitalists, nurses, and parents. We asked the seemingly simple question, “How many medications is this child on?” across a variety of scenarios (Figure). For panel A, all stakeholders agreed that this medication list includes two medications. All other scenarios elicited disagreement. For panel B, many people responded three medications, but others (often physicians) counted only clindamycin and therefore responded one medication.
For panel C, stakeholders were split between one (only topiramate), two (topiramate and rectal diazepam), and three medications (two different doses of topiramate, which counted as two different medications, plus rectal diazepam). Interestingly, one parent reflected that they would count panel C differently, depending on with whom they were discussing the medications. If the parent were speaking with a physician, they would consider the two different doses of topiramate as a single medication; however, if they were conveying a list of medications to a babysitter, they would consider them as two different medications. Finally, panel D also split stakeholders between counting one and two medications, with some parents expressing confusion as to why the child would be prescribed the same medication at different times.
While our informal conversations with physicians, nurses, and families should not be construed as rigorous qualitative research, we are concerned about the lack of a shared mental model about the best way to count discharge polypharmacy. In reviewing the comments that we collected, the family voice stands out—physicians do not know how a parent or a caregiver will prioritize the medications to give to their child; physicians do not know whether families will count medications as a group or as separate entities. Although providers, patients, and families share a list of medications at discharge, this list may contain items not considered as “medications” by physicians.10 Nevertheless, the medication list provided at discharge is what the family must navigate once home. One way to consider discharge polypharmacy would be to count all the medications in the discharge summary, regardless of clinicians’ perceptions of necessity or importance. Electronic health record based tools should sum medications counts. Ultimately, further research is needed to understand the cognitive and care burden discharge polypharmacy places on families as well as understand this burden’s relationship to safety and transition outcomes.
Disclosures
Dr. Auger has nothing to disclose. Dr. Shah is the Editor-in-Chief of the Journal of Hospital Medicine. Dr. Davis has nothing to disclose. Dr. Brady reports grants from Agency for Healthcare Research and Quality, outside the submitted work.
Funding
This project is supported by a grant from the Agency for Healthcare Research and Quality (1K08HS204735-01A1).
1. Winer JC, Aragona E, Fields AI, Stockwell DC. Comparison of clinical risk factors among pediatric patients with single admission, multiple admissions (without any 7-day readmissions), and 7-day readmission. Hosp Pediatr. 2016;6(3):119-125. https://doi.org/10.1542/hpeds.2015-0110.
2. Feinstein J, Dai D, Zhong W, Freedman J, Feudtner C. Potential drug-drug interactions in infant, child, and adolescent patients in children’s hospitals. Pediatrics. 2015;135(1):e99-e108. https://doi.org/10.1542/peds.2014-2015.
3. Patterson SM, Cadogan CA, Kerse N, et al. Interventions to improve the appropriate use of polypharmacy for older people. Cochrane Database Syst Rev. 2014(10):CD008165. https://doi.org/10.1002/14651858.CD008165.pub3.
4. Society of Hospital Medicine. Project BOOST: better outcomes for older adults through safe transitions—implementation guide to improve care transitions.
5. Smith MD, Spiller HA, Casavant MJ, Chounthirath T, Brophy TJ, Xiang H. Out-of-hospital medication errors among young children in the United States, 2002-2012. Pediatrics. 2014;134(5):867-876. https://doi.org/10.1542/peds.2014-0309.
6. Baker C, Feinstein JA, Ma X, et al. Variation of the prevalence of pediatric polypharmacy: a scoping review. Pharmacoepidemiol Drug Saf. 2019;28(3):275-287. https://doi.org/10.1002/pds.4719.
7. Bakaki PM, Horace A, Dawson N, et al. Defining pediatric polypharmacy: a scoping review. PLoS One. 2018;13(11):e0208047. https://doi.org/10.1371/journal.pone.0208047.
8. Horace AE, Ahmed F. Polypharmacy in pediatric patients and opportunities for pharmacists’ involvement. Integr Pharm Res Pract. 2015;4:113-126. https://doi.org/10.2147/IPRP.S64535.
9. Masnoon N, Shakib S, Kalisch-Ellett L, Caughey GE. What is polypharmacy? A systematic review of definitions. BMC Geriatr. 2017;17(1):230. https://doi.org/10.1186/s12877-017-0621-2.
10. Auger KA, Shah SS, Huang B, et al. Discharge Medical Complexity, Change in Medical Complexity and Pediatric Thirty-day Readmission. J Hosp Med. 2019;14(8):474-481. https://doi.org/10.12788/jhm.3222.
11. Martin P, Tamblyn R, Benedetti A, Ahmed S, Tannenbaum C. Effect of a pharmacist-led educational intervention on inappropriate medication prescriptions in older adults: the D-PRESCRIBE randomized clinical trial. Jama. 2018;320(18):1889-1898. https://doi.org/10.1001/jama.2018.16131.
12. Page AT, Clifford RM, Potter K, Schwartz D, Etherton-Beer CD. The feasibility and effect of deprescribing in older adults on mortality and health: a systematic review and meta-analysis. Br J Clin Pharmacol. 2016;82(3):583-623. https://doi.org/10.1111/bcp.12975.
© 2019 Society of Hospital Medicine
The Management of Anticoagulation for Venous Thromboembolism in the Hospitalized Adult
Anticoagulation for patients with venous thromboembolism (VTE) is associated not only with considerable benefits, including prevention of pulmonary embolus and thrombus extension, but also with potential significant risks, such as life-threatening bleeding.1 Hospitalized patients may require anticoagulation to treat new VTE or for secondary prevention of prior events. Hospital admission is a high-risk time for anticoagulation control.2 Additionally, anticoagulation has become an increasingly complex decision as the number of therapeutic agents on the market has significantly increased, coupled with medication interactions and dosing intricacies. Management is multifaceted and associated with wide variation in practice patterns.3 Thus, further evidence-based guidance for providers is necessary for the care of the hospitalized patient with VTE.
KEY RECOMMENDATIONS FOR THE HOSPITALIST
The following are 16 selected guideline recommendations most relevant to adult hospitalists.4 Recommendations were graded as “strong” if most individuals should follow the recommended course of action and “conditional” if different choices are appropriate for different patients.
Initial Anticoagulant Dosing, Monitoring, and Medication Interactions
(for all recommendations–evidence quality: low certainty; recommendation strength: conditional)
Recommendation 1. In obese patients receiving low molecular weight heparin (LMWH), determine the initial dose based on actual body weight rather than a fixed or “capped” maximum dose.
Recommendation 2. For obese patients or those with renal dysfunction receiving LMWH, avoid dosing based on serum antifactor Xa levels. Instead, adjust dosing based on product labeling, with appropriate dose reduction in patients with chronic kidney disease.
Recommendation 3. For patients receiving direct oral anticoagulant (DOAC) therapy, avoid measuring the anticoagulation effect during management of bleeding as there is no evidence to support a beneficial effect, and it may result in a delay in treatment.
Recommendation 4. For patients requiring administration of inhibitors or inducers of P-glycoprotein or cytochrome P450 enzymes, use LMWH or vitamin K antagonists (VKA) rather than a DOAC.
Recommendation 5. When transitioning from a DOAC to a VKA, the medications should overlap until the international normalized ratio (INR) is therapeutic instead of bridging with a heparin agent.
Recommendations for Ongoing Outpatient Monitoring upon Discharge from the Hospital
Recommendation 6. Use point-of-care INR testing by patients at home, with self-adjustment of VKA dose (evidence quality: low certainty; recommendation strength: strong).
Recommendation 7. Patients should be referred for specialized anticoagulation management rather than to their primary care provider (PCP) (evidence quality: very low certainty; recommendation strength: conditional).
Recommendation 8. Supplementary education, in addition to basic education, should be made available to patients to help improve outcomes (evidence quality: very low certainty; recommendation strength: conditional).
Hospitalists are often responsible for the coordination of care upon discharge from the hospital, including discharge teaching, subspecialty referrals, and determination of patient suitability for home monitoring and dose adjustment. The follow-up plan may depend on local systems and access. A PCP can manage anticoagulation if performed in a systematic and coordinated fashion.5
Recommendations for Patients on Anticoagulation Undergoing Procedures
Recommendation 9. For patients with a low or moderate risk of recurrent VTE on VKA therapy undergoing procedures, periprocedural bridging with heparin or LMWH should be avoided. This excludes patients at high risk for recurrent VTE, defined as those with recent VTE (<3 months); having a known thrombophilic abnormality such as antiphospholipid syndrome, protein C/S deficiency, or antithrombin deficiency; or high-risk patient populations by expert consensus and practice guidelines4,6 (evidence quality: moderate certainty; recommendation strength: strong).
Recommendation 10. For patients on DOACs undergoing procedures, measurement of the anticoagulation effect of the DOAC should be avoided (evidence quality: very low certainty; recommendation strength: conditional).
Recommendations for Patients on Anticoagulation Suffering from Supratherapeutic Levels or Bleeding Complications
(for all recommendations–evidence quality: very low certainty; recommendation strength: conditional)
Recommendation 11. If a patient on VKA therapy has an INR between 4.5 and 10 without clinically relevant bleeding, the use of vitamin K therapy can be avoided in favor of temporary cessation of VKA alone.
Recommendation 12. If a patient on VKA therapy has life-threatening bleeding, four-factor prothrombin complex concentrate (PCC) should be used in addition to the cessation of VKA therapy and initiation of vitamin K therapy, over the use of fresh frozen plaza, because of the ease of administration and minimal risk of volume overload.
Recommendation 13. If a patient has life-threatening bleeding on a Xa inhibitor, the panel recommends discontinuation of the medication and the option to administer either PCC or recombinant coagulation factor Xa, as there have been no studies comparing these two strategies.
Recommendation 14. If life-threatening bleeding occurs in a patient on dabigatran, idarucizumab should be administered, if available.
Recommendation 15. In patients with bleeding while on heparin or LMWH, protamine should be administered.
Recommendation 16. Following an episode of life-threatening bleeding, anticoagulation should be resumed within 90 days, provided that the patient is at moderate to high risk for recurrent VTE, is not at high risk for recurrent bleeding, and is willing to continue anticoagulation.
CRITIQUE
Methods in Preparing Guidelines
The panel was funded by the American Society of Hematology (ASH), a nonprofit medical specialty society.4 The panel is multidisciplinary, including physicians and providers as well as patient representatives, and is supported by the McMaster University GRADE Center, which conducted new and updated systematic reviews of the evidence according to the “Cochrane Handbook for Systematic Reviews of Interventions.” The panel members agreed on 25 recommendations and two good practice statements. The recommendations were made available to external review by stakeholders and addressed. Comments made by 10 individuals or organizations were subsequently incorporated.
Sources of Potential Conflict of Interest
Panel members, other than patient representatives, did not receive funding, and the majority of the panel had no conflicts of interest to report. Given the minimal influence of outside parties including pharmaceutical companies, and the wide diversity of opinions sought in the creation of the guidelines, concern for conflict of interest is low.
Generalizability
These guidelines assume that the decision to anticoagulate a patient, and which agent to use, has already been made and thus do not offer further guidance on this decision. These guidelines also do not address optimal choices for anticoagulation in specific patient populations, such as patients with cancer. They are limited in scope to exclude the treatment of specific thromboembolic disease processes such as subsegmental pulmonary emboli, superficial venous thrombus, or distal vein thrombosis. Unfortunately, challenging decisions made by hospitalists frequently fall into one of these categories. Coincident with these guidelines, ASH introduced comprehensive guidelines to support basic diagnostic decisions.7
AREAS IN NEED OF FUTURE STUDY
More evidence is needed to better understand optimal monitoring practices for patients on anticoagulation therapy, including the ideal INR monitoring frequency for patients on VKA therapy. Additionally, there is a need to better understand the difference in clinical outcomes and resources utilization when care is provided by an anticoagulation specialist as compared with a PCP. Finally, while guidelines suggest that anticoagulation should be resumed within 90 days of a life-threatening bleed, there is a need to better understand the optimal timing of a restart, as well as the patient factors to be considered in this decision.
Disclosures
The authors have nothing to disclose.
Funding
There was no funding support in the creation of this manuscript.
1. Nutescu EA, Burnett A, Fanikos J, Spinler S, Wittkowsky A. Pharmacology of anticoagulants used in the treatment of venous thromboembolism [published correction appears in J Thromb Thrombolysis. 2016;42(2):296-311]. J Thromb Thrombolysis. 2016;41(1):15-31. https://doi.org/10.1007/s11239-015-1314-3.
2. van Walraven C, Austin PC, Oake N, Wells PS, Mamdani M, Forster AJ. The influence of hospitalization on oral anticoagulation control: a population-based study. Thromb Res. 2007;119(6):705-714. PubMed
3. Rodwin BA, Salami JA, Spatz ES, et al. Variation in the use of warfarin and direct oral anticoagulants in atrial fibrillation and associated cost implications. Am J Med. 2019:132(1):61-70. https://doi.org/10.1016/j.amjmed.2018.09.026.
4. Witt DM, Nieuwlaat R, Clark NP, et al. American Society of Hematology 2018 guidelines for management of venous thromboembolism: optimal management of anticoagulation therapy. Blood Adv. 2018;2(22):3257-3291. https://doi.org/10.1182/bloodadvances.2018024893.
5. Kearon C, Akl EA, Comerota AJ, et al. Antithrombotic therapy for VTE disease: antithrombotic therapy and prevention of thrombosis, 9th ed: American College of Chest Physicians Evidence-Based Clinical Practice Guidelines [published correction appears in Chest. 2012;142(6):1698-1704]. Chest. 2012;141(2 suppl):e419S-e496S. https://doi.org/10.1378/chest.11-2301.
6. Douketis JD, Berger PB, Dunn AS, et al. The perioperative management of antithrombotic therapy: American College of Chest Physicians Evidence-Based Clinical Practice Guidelines (8th Edition). Chest. 2008;133(6 suppl):299S-339S. https://doi.org/10.1378/chest.08-0675.
7. Lim W, Le Gal G, Bates SM, et al. American Society of Hematology 2018 guidelines for management of venous thromboembolism: diagnosis of venous thromboembolism. Blood Adv. 2018;2(22):3226-3256. https://doi.org/10.1182/bloodadvances.2018024828.
Anticoagulation for patients with venous thromboembolism (VTE) is associated not only with considerable benefits, including prevention of pulmonary embolus and thrombus extension, but also with potential significant risks, such as life-threatening bleeding.1 Hospitalized patients may require anticoagulation to treat new VTE or for secondary prevention of prior events. Hospital admission is a high-risk time for anticoagulation control.2 Additionally, anticoagulation has become an increasingly complex decision as the number of therapeutic agents on the market has significantly increased, coupled with medication interactions and dosing intricacies. Management is multifaceted and associated with wide variation in practice patterns.3 Thus, further evidence-based guidance for providers is necessary for the care of the hospitalized patient with VTE.
KEY RECOMMENDATIONS FOR THE HOSPITALIST
The following are 16 selected guideline recommendations most relevant to adult hospitalists.4 Recommendations were graded as “strong” if most individuals should follow the recommended course of action and “conditional” if different choices are appropriate for different patients.
Initial Anticoagulant Dosing, Monitoring, and Medication Interactions
(for all recommendations–evidence quality: low certainty; recommendation strength: conditional)
Recommendation 1. In obese patients receiving low molecular weight heparin (LMWH), determine the initial dose based on actual body weight rather than a fixed or “capped” maximum dose.
Recommendation 2. For obese patients or those with renal dysfunction receiving LMWH, avoid dosing based on serum antifactor Xa levels. Instead, adjust dosing based on product labeling, with appropriate dose reduction in patients with chronic kidney disease.
Recommendation 3. For patients receiving direct oral anticoagulant (DOAC) therapy, avoid measuring the anticoagulation effect during management of bleeding as there is no evidence to support a beneficial effect, and it may result in a delay in treatment.
Recommendation 4. For patients requiring administration of inhibitors or inducers of P-glycoprotein or cytochrome P450 enzymes, use LMWH or vitamin K antagonists (VKA) rather than a DOAC.
Recommendation 5. When transitioning from a DOAC to a VKA, the medications should overlap until the international normalized ratio (INR) is therapeutic instead of bridging with a heparin agent.
Recommendations for Ongoing Outpatient Monitoring upon Discharge from the Hospital
Recommendation 6. Use point-of-care INR testing by patients at home, with self-adjustment of VKA dose (evidence quality: low certainty; recommendation strength: strong).
Recommendation 7. Patients should be referred for specialized anticoagulation management rather than to their primary care provider (PCP) (evidence quality: very low certainty; recommendation strength: conditional).
Recommendation 8. Supplementary education, in addition to basic education, should be made available to patients to help improve outcomes (evidence quality: very low certainty; recommendation strength: conditional).
Hospitalists are often responsible for the coordination of care upon discharge from the hospital, including discharge teaching, subspecialty referrals, and determination of patient suitability for home monitoring and dose adjustment. The follow-up plan may depend on local systems and access. A PCP can manage anticoagulation if performed in a systematic and coordinated fashion.5
Recommendations for Patients on Anticoagulation Undergoing Procedures
Recommendation 9. For patients with a low or moderate risk of recurrent VTE on VKA therapy undergoing procedures, periprocedural bridging with heparin or LMWH should be avoided. This excludes patients at high risk for recurrent VTE, defined as those with recent VTE (<3 months); having a known thrombophilic abnormality such as antiphospholipid syndrome, protein C/S deficiency, or antithrombin deficiency; or high-risk patient populations by expert consensus and practice guidelines4,6 (evidence quality: moderate certainty; recommendation strength: strong).
Recommendation 10. For patients on DOACs undergoing procedures, measurement of the anticoagulation effect of the DOAC should be avoided (evidence quality: very low certainty; recommendation strength: conditional).
Recommendations for Patients on Anticoagulation Suffering from Supratherapeutic Levels or Bleeding Complications
(for all recommendations–evidence quality: very low certainty; recommendation strength: conditional)
Recommendation 11. If a patient on VKA therapy has an INR between 4.5 and 10 without clinically relevant bleeding, the use of vitamin K therapy can be avoided in favor of temporary cessation of VKA alone.
Recommendation 12. If a patient on VKA therapy has life-threatening bleeding, four-factor prothrombin complex concentrate (PCC) should be used in addition to the cessation of VKA therapy and initiation of vitamin K therapy, over the use of fresh frozen plaza, because of the ease of administration and minimal risk of volume overload.
Recommendation 13. If a patient has life-threatening bleeding on a Xa inhibitor, the panel recommends discontinuation of the medication and the option to administer either PCC or recombinant coagulation factor Xa, as there have been no studies comparing these two strategies.
Recommendation 14. If life-threatening bleeding occurs in a patient on dabigatran, idarucizumab should be administered, if available.
Recommendation 15. In patients with bleeding while on heparin or LMWH, protamine should be administered.
Recommendation 16. Following an episode of life-threatening bleeding, anticoagulation should be resumed within 90 days, provided that the patient is at moderate to high risk for recurrent VTE, is not at high risk for recurrent bleeding, and is willing to continue anticoagulation.
CRITIQUE
Methods in Preparing Guidelines
The panel was funded by the American Society of Hematology (ASH), a nonprofit medical specialty society.4 The panel is multidisciplinary, including physicians and providers as well as patient representatives, and is supported by the McMaster University GRADE Center, which conducted new and updated systematic reviews of the evidence according to the “Cochrane Handbook for Systematic Reviews of Interventions.” The panel members agreed on 25 recommendations and two good practice statements. The recommendations were made available to external review by stakeholders and addressed. Comments made by 10 individuals or organizations were subsequently incorporated.
Sources of Potential Conflict of Interest
Panel members, other than patient representatives, did not receive funding, and the majority of the panel had no conflicts of interest to report. Given the minimal influence of outside parties including pharmaceutical companies, and the wide diversity of opinions sought in the creation of the guidelines, concern for conflict of interest is low.
Generalizability
These guidelines assume that the decision to anticoagulate a patient, and which agent to use, has already been made and thus do not offer further guidance on this decision. These guidelines also do not address optimal choices for anticoagulation in specific patient populations, such as patients with cancer. They are limited in scope to exclude the treatment of specific thromboembolic disease processes such as subsegmental pulmonary emboli, superficial venous thrombus, or distal vein thrombosis. Unfortunately, challenging decisions made by hospitalists frequently fall into one of these categories. Coincident with these guidelines, ASH introduced comprehensive guidelines to support basic diagnostic decisions.7
AREAS IN NEED OF FUTURE STUDY
More evidence is needed to better understand optimal monitoring practices for patients on anticoagulation therapy, including the ideal INR monitoring frequency for patients on VKA therapy. Additionally, there is a need to better understand the difference in clinical outcomes and resources utilization when care is provided by an anticoagulation specialist as compared with a PCP. Finally, while guidelines suggest that anticoagulation should be resumed within 90 days of a life-threatening bleed, there is a need to better understand the optimal timing of a restart, as well as the patient factors to be considered in this decision.
Disclosures
The authors have nothing to disclose.
Funding
There was no funding support in the creation of this manuscript.
1. Nutescu EA, Burnett A, Fanikos J, Spinler S, Wittkowsky A. Pharmacology of anticoagulants used in the treatment of venous thromboembolism [published correction appears in J Thromb Thrombolysis. 2016;42(2):296-311]. J Thromb Thrombolysis. 2016;41(1):15-31. https://doi.org/10.1007/s11239-015-1314-3.
2. van Walraven C, Austin PC, Oake N, Wells PS, Mamdani M, Forster AJ. The influence of hospitalization on oral anticoagulation control: a population-based study. Thromb Res. 2007;119(6):705-714. PubMed
3. Rodwin BA, Salami JA, Spatz ES, et al. Variation in the use of warfarin and direct oral anticoagulants in atrial fibrillation and associated cost implications. Am J Med. 2019:132(1):61-70. https://doi.org/10.1016/j.amjmed.2018.09.026.
4. Witt DM, Nieuwlaat R, Clark NP, et al. American Society of Hematology 2018 guidelines for management of venous thromboembolism: optimal management of anticoagulation therapy. Blood Adv. 2018;2(22):3257-3291. https://doi.org/10.1182/bloodadvances.2018024893.
5. Kearon C, Akl EA, Comerota AJ, et al. Antithrombotic therapy for VTE disease: antithrombotic therapy and prevention of thrombosis, 9th ed: American College of Chest Physicians Evidence-Based Clinical Practice Guidelines [published correction appears in Chest. 2012;142(6):1698-1704]. Chest. 2012;141(2 suppl):e419S-e496S. https://doi.org/10.1378/chest.11-2301.
6. Douketis JD, Berger PB, Dunn AS, et al. The perioperative management of antithrombotic therapy: American College of Chest Physicians Evidence-Based Clinical Practice Guidelines (8th Edition). Chest. 2008;133(6 suppl):299S-339S. https://doi.org/10.1378/chest.08-0675.
7. Lim W, Le Gal G, Bates SM, et al. American Society of Hematology 2018 guidelines for management of venous thromboembolism: diagnosis of venous thromboembolism. Blood Adv. 2018;2(22):3226-3256. https://doi.org/10.1182/bloodadvances.2018024828.
© 2019 Society of Hospital Medicine
Treatment of Pediatric Venous Thromboembolism
Venous thromboembolism (VTE) occurs uncommonly in pediatrics, affecting 0.07-0.14 per 10,000 children.1,2 Yet, in the last 20 years, the incidence of VTE in hospitalized children has increased dramatically to approximately 58 per 10,000 admissions.3 This increase may be attributed to improved survival of very ill children, better diagnostic imaging modalities, and heightened awareness by managing physicians.3 Randomized controlled trials are lacking in pediatric thrombosis, and clinical care is based on extrapolation of adult data and expert consensus guidelines.4,5 In 2014, the American Society of Hematology (ASH) sought to develop comprehensive guidelines on thrombosis. The pediatric VTE treatment guideline is one of six published to date.
RECOMMENDATIONS FOR THE HOSPITALIST
The following are five selected guideline recommendations thought most relevant to pediatric hospitalists. Three focus on the central venous access device (CVAD), since it is the most common risk factor for pediatric VTE.1 Recommendations were graded as “strong” if most providers, patients, and policy makers agreed with the intervention and if it was supported by credible research. Conditional recommendations had less uniform agreement with an emphasis on individualized care and weighing patients’ values and preferences.6
Recommendation 1. It is recommended that pediatric patients receive anticoagulation, versus no anticoagulation, for symptomatic VTE (evidence quality: low certainty; recommendation strength: strong).
There is strong indirect data in adults that symptomatic VTE requires treatment, with limited direct evidence in children. As VTE occurs most commonly in ill, hospitalized children with the potential for VTE to be life threatening, the benefit was felt to justify the strong recommendation despite low-quality evidence.
The primary benefit of anticoagulation in children with symptomatic VTE is the prevention of progressive or recurrent thrombosis with high morbidity and the prevention of life-threatening VTE. The greatest potential harm from the use of anticoagulation, particularly in very ill children, is the risk for major bleeding.4Recommendation 2. Children with asymptomatic VTE can be managed with or without anticoagulation (evidence quality: poor; recommendation strength: conditional).
Recommendation 2. Children with asymptomatic VTE can be managed with or without anticoagulation (evidence quality: poor; recommendation strength: conditional).
The panel focused on the unique features of pediatric VTE related to the heterogeneity in both the site and pathophysiology of VTE in children, such as age, presence of a CVAD, and comorbidities. There is little certainty that treating asymptomatic VTE is beneficial in the same way that treating symptomatic VTE would be in preventing recurrent thrombosis and embolization.
Until better evidence is available to guide care, the primary benefit of this recommendation is individualization of care related to each patient’s risk-benefit profile and parental preferences.
Potential problems with using this recommendation include the cost of anticoagulant drugs and major bleeding if anticoagulation is used. Potential problems with not using anticoagulation would be progressive or recurrent thromboembolism. Close monitoring of children with VTE—regardless of whether anticoagulation is prescribed—is warranted.
Pediatric Patients with Symptomatic CVAD-Related Thrombosis
Recommendations three through five pertain to CVAD-associated thrombosis, so they are reviewed together.
Recommendation 3. No removal of a functioning CVAD is suggested if venous access is still required (evidence quality: low certainty; recommendation strength: conditional).Recommendation 4. It is recommended to remove a nonfunctioning or unneeded CVAD (evidence quality: low certainty; recommendation strength: strong).Recommendation 5. It is suggested to delay CVAD removal until after initiation of anticoagulation (days), rather than immediate removal if the CVAD is nonfunctioning or no longer needed (evidence quality: low certainty; recommendation strength: conditional).
Recommendation 4. It is recommended to remove a nonfunctioning or unneeded CVAD (evidence quality: low certainty; recommendation strength: strong).
Recommendation 5. It is suggested to delay CVAD removal until after initiation of anticoagulation (days), rather than immediate removal if the CVAD is nonfunctioning or no longer needed (evidence quality: low certainty; recommendation strength: conditional).
CVAD is the most common precipitating factor for pediatric VTE, particularly in neonates and older children.1 Based on limited direct and indirect observational studies, there is low evidence of benefit for CVAD removal, but high-quality indirect evidence of harm and high cost, which the panel felt justified the strong recommendation for removing an unneeded or nonfunctioning line. If ongoing care can be safely administered without central access, removing the thrombosis stimulus is recommended. The guideline suggests keeping a functioning CVAD in a patient who requires ongoing venous access and placing high value on avoiding new line insertion when access sites may be limited to avoid the potential thrombogenic effect of new line placement.
In the limited direct and indirect observational studies identified, the optimal timing of CVAD removal is uncertain. Given the potential risk of emboli leading to pulmonary embolism or stroke, prior publications have suggested delaying removal until after three to five days of anticoagulation, particularly in children with known or potential right-to-left shunts.4 The risk of infection and bleeding with anticoagulation prior to CVAD removal was considered small by the panel. This recommendation is primarily based on the panel’s anecdotal experience and first principles, which is a limitation.
CRITIQUE
Methods in Preparing Guideline. The panel included pediatric experts with clinical and research expertise in the guideline topic, including nine hematologists, one intensivist, one cardiologist, one hematology pharmacist, and one anticoagulation nurse practitioner. It also included two methodologists with evidence appraisal and guideline development expertise, as well as two patient representatives.
The panel brainstormed and prioritized questions to be addressed and selected outcomes of interest for each question. The McMaster University GRADE Centre vetted and retained researchers to conduct or update systematic evidence reviews and coordinate the guideline development using the Grading of Recommendations, Assessment, Development, and Evaluation (GRADE) approach.6 For each guideline question, the results of systematic reviews were summarized in GRADE Evidence-to-Decision tables. The evidence quality was categorized into four levels ranging from ver
Draft recommendations were made available online for review by stakeholders, including allied organizations, medical professionals, patients, and the public. Revisions were made to address pertinent submitted comments, but the recommendations were not changed. After approval by ASH, the guideline was subjected to peer review by Blood Advances.
Sources of Potential Conflict of Interest or Bias. The guideline was developed and funded by ASH. All participants’ conflicts of interest were managed according to ASH policies based on recommendations of the Institute of Medicine and the Guideline International Network. A majority of the guideline panel had no conflicts. During deliberations, panelists with direct financial interests were recused from making judgments about relevant recommendations. The McMaster University-affiliated researchers had no conflicts.Generalizability. While this guideline included 30 recommendations, the ones highlighted apply to the most commonly seen pediatric VTE cases in hospital medicine. ASH emphasized that these guidelines should not be construed as the standard of care, but as a guide to help clinicians make treatment decisions for children with VTE and to enable them to individualize care when needed. The greatest limitation of this guideline is the lack of strong direct supporting evidence in pediatric VTE management.
Generalizability. While this guideline included 30 recommendations, the ones highlighted apply to the most commonly seen pediatric VTE cases in hospital medicine. ASH emphasized that these guidelines should not be construed as the standard of care, but as a guide to help clinicians make treatment decisions for children with VTE and to enable them to individualize care when needed. The greatest limitation of this guideline is the lack of strong direct supporting evidence in pediatric VTE management.
AREAS IN NEED OF FUTURE STUDY
Although there is increasing interest in pediatric VTE prevention and risk assessment,7 there is currently limited evidence on the best ways to mitigate VTE risk or anticoagulation-associated major bleeding in hospitalized children. The relatively low incidence of VTE in children makes large randomized controlled trials difficult, but several are ongoing. The Evaluation of the Duration of Therapy for Thrombosis in Children (Kids-DOTT) multicenter, randomized trial will inform care on the optimal duration of anticoagulation in children with a transient provoking factor,8 and several phase III studies are investigating the safety and efficacy of direct oral anticoagulants in children (NCT02234843, NCT02464969, NCT01895777, NCT02234843). These and future trials will better inform therapy in pediatric VTE.
Disclosures
The authors have no financial relationships or conflicts of interest relevant to this article to disclose.
Funding
No funding was secured for this study.
1. Andrew M, David M, Adams M, et al. Venous thromboembolic complications (VTE) in children: first analyses of the Canadian registry of VTE. Blood. 1994;83(5):1251-1257. PubMed
2. van Ommen CH, Heijboer H, Buller HR, Hirasing RA, Heijmans HS, Peters M. Venous thromboembolism in childhood: a prospective two-year registry in the Netherlands. J Pediatr. 2001;139(5):676-681. https://doi.org/10.1067/mpd.2001.118192.
3. Raffini L, Huang YS, Witmer C, Feudtner C. Dramatic increase in venous thromboembolism in children’s hospitals in the United States from 2001 to 2007. Pediatrics. 2009;124(4):1001-1008. https://doi.org/10.1542/peds.2009-0768.
4. Monagle P, Chan AK, Goldenberg NA, et al. Antithrombotic therapy in neonates and children: antithrombotic therapy and prevention of thrombosis, 9th ed: American College of Chest Physicians Evidence-Based Clinical Practice Guidelines. Chest. 2012;141(2):e737S-e801S. https://doi.org/10.1378/chest.11-2308.
5. Monagle P, Cuello CA, Augustine C, et al. American Society of Hematology 2018 Guidelines for management of venous thromboembolism: treatment of pediatric venous thromboembolism. Blood Adv. 2018;2(22):3292-3316. https://doi.org/10.1182/bloodadvances.2018024786.
6. Guyatt GH, Oxman AD, Vist GE, et al. GRADE: an emerging consensus on rating quality of evidence and strength of recommendations. BMJ. 2008;336(7650):924-926. https://doi.org/10.1136/bmj.39489.470347.AD.
7. Faustino EV, Raffini LJ. Prevention of hospital-acquired venous thromboembolism in children: a review of published guidelines. Front Pediatr. 2017;5(9):1597-605. https://doi.org/10.3389/fped.2017.00009.8. Goldenberg NA, Abshire T, Blatchford PJ, et al. Multicenter randomized controlled trial on Duration of Therapy for Thrombosis in Children and Young Adults (the Kids-DOTT trial): pilot/feasibility phase findings. J Thromb Haemost. 2015;13(9):1597-1605. https://doi.org/10.1111/jth.13038.
Venous thromboembolism (VTE) occurs uncommonly in pediatrics, affecting 0.07-0.14 per 10,000 children.1,2 Yet, in the last 20 years, the incidence of VTE in hospitalized children has increased dramatically to approximately 58 per 10,000 admissions.3 This increase may be attributed to improved survival of very ill children, better diagnostic imaging modalities, and heightened awareness by managing physicians.3 Randomized controlled trials are lacking in pediatric thrombosis, and clinical care is based on extrapolation of adult data and expert consensus guidelines.4,5 In 2014, the American Society of Hematology (ASH) sought to develop comprehensive guidelines on thrombosis. The pediatric VTE treatment guideline is one of six published to date.
RECOMMENDATIONS FOR THE HOSPITALIST
The following are five selected guideline recommendations thought most relevant to pediatric hospitalists. Three focus on the central venous access device (CVAD), since it is the most common risk factor for pediatric VTE.1 Recommendations were graded as “strong” if most providers, patients, and policy makers agreed with the intervention and if it was supported by credible research. Conditional recommendations had less uniform agreement with an emphasis on individualized care and weighing patients’ values and preferences.6
Recommendation 1. It is recommended that pediatric patients receive anticoagulation, versus no anticoagulation, for symptomatic VTE (evidence quality: low certainty; recommendation strength: strong).
There is strong indirect data in adults that symptomatic VTE requires treatment, with limited direct evidence in children. As VTE occurs most commonly in ill, hospitalized children with the potential for VTE to be life threatening, the benefit was felt to justify the strong recommendation despite low-quality evidence.
The primary benefit of anticoagulation in children with symptomatic VTE is the prevention of progressive or recurrent thrombosis with high morbidity and the prevention of life-threatening VTE. The greatest potential harm from the use of anticoagulation, particularly in very ill children, is the risk for major bleeding.4Recommendation 2. Children with asymptomatic VTE can be managed with or without anticoagulation (evidence quality: poor; recommendation strength: conditional).
Recommendation 2. Children with asymptomatic VTE can be managed with or without anticoagulation (evidence quality: poor; recommendation strength: conditional).
The panel focused on the unique features of pediatric VTE related to the heterogeneity in both the site and pathophysiology of VTE in children, such as age, presence of a CVAD, and comorbidities. There is little certainty that treating asymptomatic VTE is beneficial in the same way that treating symptomatic VTE would be in preventing recurrent thrombosis and embolization.
Until better evidence is available to guide care, the primary benefit of this recommendation is individualization of care related to each patient’s risk-benefit profile and parental preferences.
Potential problems with using this recommendation include the cost of anticoagulant drugs and major bleeding if anticoagulation is used. Potential problems with not using anticoagulation would be progressive or recurrent thromboembolism. Close monitoring of children with VTE—regardless of whether anticoagulation is prescribed—is warranted.
Pediatric Patients with Symptomatic CVAD-Related Thrombosis
Recommendations three through five pertain to CVAD-associated thrombosis, so they are reviewed together.
Recommendation 3. No removal of a functioning CVAD is suggested if venous access is still required (evidence quality: low certainty; recommendation strength: conditional).Recommendation 4. It is recommended to remove a nonfunctioning or unneeded CVAD (evidence quality: low certainty; recommendation strength: strong).Recommendation 5. It is suggested to delay CVAD removal until after initiation of anticoagulation (days), rather than immediate removal if the CVAD is nonfunctioning or no longer needed (evidence quality: low certainty; recommendation strength: conditional).
Recommendation 4. It is recommended to remove a nonfunctioning or unneeded CVAD (evidence quality: low certainty; recommendation strength: strong).
Recommendation 5. It is suggested to delay CVAD removal until after initiation of anticoagulation (days), rather than immediate removal if the CVAD is nonfunctioning or no longer needed (evidence quality: low certainty; recommendation strength: conditional).
CVAD is the most common precipitating factor for pediatric VTE, particularly in neonates and older children.1 Based on limited direct and indirect observational studies, there is low evidence of benefit for CVAD removal, but high-quality indirect evidence of harm and high cost, which the panel felt justified the strong recommendation for removing an unneeded or nonfunctioning line. If ongoing care can be safely administered without central access, removing the thrombosis stimulus is recommended. The guideline suggests keeping a functioning CVAD in a patient who requires ongoing venous access and placing high value on avoiding new line insertion when access sites may be limited to avoid the potential thrombogenic effect of new line placement.
In the limited direct and indirect observational studies identified, the optimal timing of CVAD removal is uncertain. Given the potential risk of emboli leading to pulmonary embolism or stroke, prior publications have suggested delaying removal until after three to five days of anticoagulation, particularly in children with known or potential right-to-left shunts.4 The risk of infection and bleeding with anticoagulation prior to CVAD removal was considered small by the panel. This recommendation is primarily based on the panel’s anecdotal experience and first principles, which is a limitation.
CRITIQUE
Methods in Preparing Guideline. The panel included pediatric experts with clinical and research expertise in the guideline topic, including nine hematologists, one intensivist, one cardiologist, one hematology pharmacist, and one anticoagulation nurse practitioner. It also included two methodologists with evidence appraisal and guideline development expertise, as well as two patient representatives.
The panel brainstormed and prioritized questions to be addressed and selected outcomes of interest for each question. The McMaster University GRADE Centre vetted and retained researchers to conduct or update systematic evidence reviews and coordinate the guideline development using the Grading of Recommendations, Assessment, Development, and Evaluation (GRADE) approach.6 For each guideline question, the results of systematic reviews were summarized in GRADE Evidence-to-Decision tables. The evidence quality was categorized into four levels ranging from ver
Draft recommendations were made available online for review by stakeholders, including allied organizations, medical professionals, patients, and the public. Revisions were made to address pertinent submitted comments, but the recommendations were not changed. After approval by ASH, the guideline was subjected to peer review by Blood Advances.
Sources of Potential Conflict of Interest or Bias. The guideline was developed and funded by ASH. All participants’ conflicts of interest were managed according to ASH policies based on recommendations of the Institute of Medicine and the Guideline International Network. A majority of the guideline panel had no conflicts. During deliberations, panelists with direct financial interests were recused from making judgments about relevant recommendations. The McMaster University-affiliated researchers had no conflicts.Generalizability. While this guideline included 30 recommendations, the ones highlighted apply to the most commonly seen pediatric VTE cases in hospital medicine. ASH emphasized that these guidelines should not be construed as the standard of care, but as a guide to help clinicians make treatment decisions for children with VTE and to enable them to individualize care when needed. The greatest limitation of this guideline is the lack of strong direct supporting evidence in pediatric VTE management.
Generalizability. While this guideline included 30 recommendations, the ones highlighted apply to the most commonly seen pediatric VTE cases in hospital medicine. ASH emphasized that these guidelines should not be construed as the standard of care, but as a guide to help clinicians make treatment decisions for children with VTE and to enable them to individualize care when needed. The greatest limitation of this guideline is the lack of strong direct supporting evidence in pediatric VTE management.
AREAS IN NEED OF FUTURE STUDY
Although there is increasing interest in pediatric VTE prevention and risk assessment,7 there is currently limited evidence on the best ways to mitigate VTE risk or anticoagulation-associated major bleeding in hospitalized children. The relatively low incidence of VTE in children makes large randomized controlled trials difficult, but several are ongoing. The Evaluation of the Duration of Therapy for Thrombosis in Children (Kids-DOTT) multicenter, randomized trial will inform care on the optimal duration of anticoagulation in children with a transient provoking factor,8 and several phase III studies are investigating the safety and efficacy of direct oral anticoagulants in children (NCT02234843, NCT02464969, NCT01895777, NCT02234843). These and future trials will better inform therapy in pediatric VTE.
Disclosures
The authors have no financial relationships or conflicts of interest relevant to this article to disclose.
Funding
No funding was secured for this study.
1. Andrew M, David M, Adams M, et al. Venous thromboembolic complications (VTE) in children: first analyses of the Canadian registry of VTE. Blood. 1994;83(5):1251-1257. PubMed
2. van Ommen CH, Heijboer H, Buller HR, Hirasing RA, Heijmans HS, Peters M. Venous thromboembolism in childhood: a prospective two-year registry in the Netherlands. J Pediatr. 2001;139(5):676-681. https://doi.org/10.1067/mpd.2001.118192.
3. Raffini L, Huang YS, Witmer C, Feudtner C. Dramatic increase in venous thromboembolism in children’s hospitals in the United States from 2001 to 2007. Pediatrics. 2009;124(4):1001-1008. https://doi.org/10.1542/peds.2009-0768.
4. Monagle P, Chan AK, Goldenberg NA, et al. Antithrombotic therapy in neonates and children: antithrombotic therapy and prevention of thrombosis, 9th ed: American College of Chest Physicians Evidence-Based Clinical Practice Guidelines. Chest. 2012;141(2):e737S-e801S. https://doi.org/10.1378/chest.11-2308.
5. Monagle P, Cuello CA, Augustine C, et al. American Society of Hematology 2018 Guidelines for management of venous thromboembolism: treatment of pediatric venous thromboembolism. Blood Adv. 2018;2(22):3292-3316. https://doi.org/10.1182/bloodadvances.2018024786.
6. Guyatt GH, Oxman AD, Vist GE, et al. GRADE: an emerging consensus on rating quality of evidence and strength of recommendations. BMJ. 2008;336(7650):924-926. https://doi.org/10.1136/bmj.39489.470347.AD.
7. Faustino EV, Raffini LJ. Prevention of hospital-acquired venous thromboembolism in children: a review of published guidelines. Front Pediatr. 2017;5(9):1597-605. https://doi.org/10.3389/fped.2017.00009.8. Goldenberg NA, Abshire T, Blatchford PJ, et al. Multicenter randomized controlled trial on Duration of Therapy for Thrombosis in Children and Young Adults (the Kids-DOTT trial): pilot/feasibility phase findings. J Thromb Haemost. 2015;13(9):1597-1605. https://doi.org/10.1111/jth.13038.
© 2019 Society of Hospital Medicine
Mission-Driven Criteria for Life and Career
“I think healthcare is more about love than most other things”
—Don Berwick
Dr. Berwick speaks of the relationship between the doctor and the patient and family. I believe this relationship is sacred. My job as CEO of Blue Cross North Carolina is hard. But it was so much harder on a recent weekend to give a new diagnosis of a certainly fatal disease of a less than 1-year old child to her parents and discuss palliative care options. I cried and they cried. Being a leader, particularly in healthcare, requires us to maintain sight of what is important and return to those things often as we le
Growing up, my parents stressed two things: service and education. I decided early on that I wanted to improve our health care system. I have had a sometimes-winding path to this goal - including work as a consultant, medical school and residency, an RWJ Clinical Scholar, clinical work as a pediatric hospitalist and two tours through government as a White House Fellow, the Centers for Medicare and Medicaid Services (CMS) as Chief Medical Officer, Deputy Administrator and leader of the CMS Innovation Center. With each step I have used five criteria that have allowed me to consider decisions while staying true to myself and my mission.
First, Family. My wife and I have four children, age 10 and under. I put them first as I make decisions.
Second, Impact. Better quality, lower costs, and exceptional experience for populations of people. The triple aim, as we better know it.
Third, People. In the beginning, I took jobs to work with specific mentors. Now, I look carefully at the people and culture where I serve to assess fit and how I could uniquely add value.
Fourth, Learning. How much will I learn every day? When I interviewed for my current job, I told them that they could hire an insurance executive who would be better on day one than me, but if they wanted someone who would improve every day and try to make a model of health transformation and a model health plan for the nation, then they should choose me.
Fifth, Joy in Work. Self-explanatory.
We also have a family mission statement, which was my wife’s good idea. We wrote it together right after we were married. It is too personal to share in detail, but it talks about family, public service, commitment to community, life balance, faith, etc. It is short but to the point and has guided us well.
At some point, you will have someone more senior than you who says you must do A before B and then C. My advice: ignore them. Choose your own path. During my journey, I was encouraged to go down a traditional academic path. I did not do it. Yet, somehow, I was elected to the National Academy of Medicine before I turned 40. It was poignant because it was almost the only accomplishment that my father (a PhD scientist), who passed away before I was elected, would have understood.
So please, decide on your criteria and mission for career and life. Write them down, share them if you wish. Then follow them! Passionately! When things are going well, review them. Are you still aligned with what is important to you? When you are at a crossroads to make a decision, review them again. They should help guide your choice.
I often get asked “what keeps me up at night?” Honestly, nothing as I fall asleep in 10 seconds or less. But if something did, it is the fact that I am always worried that someone is falling through the cracks and getting suboptimal care. We must continue to strive to build a more highly reliable health system that delivers better quality, lower costs, and exceptional experience to all people. We cannot do that without great leaders. So, choose your own path, use your mission as a guide and lead focused on a better health system for all!
Disclosures
Dr. Conway has nothing to disclose.
Discharge Medical Complexity, Change in Medical Complexity and Pediatric 30-day Readmission
Hospitalizations are disruptive, stressful, and costly for patients and families.1-5 Hospital readmissions subject families to the additional morbidity inherent to hospitalization and place patients at additional risk of hospital-acquired conditions or other harm.6-9 In pediatrics, hospital readmissions are common for specific conditions;10 with rates varying across institutions;10,11 and as many as one-third of unplanned pediatric readmissions are potentially preventable.12
Reducing pediatric readmissions requires a deeper understanding of the mechanisms through which readmissions occur. Medical complexity—specifically chronic conditions and use of medical technology—is associated with increased risk of readmission.13,14 Polypharmacy at discharge has also been associated with readmission.15,16 However, prior studies on polypharmacy and readmission risk examined the count of total medications and did not consider the nuances of scheduled versus as-needed medications, or the frequency of doses. These nuances may be critical to caregivers as discharge medical complexity can be overwhelming, even in diagnoses which are not traditionally considered complex.17 Finally, of potentially greater importance than medical complexity at discharge is a change in medical complexity during a hospitalization—for example, new diagnoses or new technologies that require additional education in hospital and management at home.
We sought to further understand the relationship between discharge medical complexity and readmission risk with regards to polypharmacy and home healthcare referrals at discharge. Specifically, we hypothesized that a change in medical complexity during an admission—ie, a new chronic diagnosis or new technology—would be a more prominent risk factor for readmission than discharge complexity alone. We examined these factors in the context of length of stay (LOS) since this is a marker of in-hospital severity of illness and a potentially modifiable function of time allowed for in-hospital teaching and discharge preparation.
METHODS
We conducted a retrospective, case-control study of pediatric hospitalizations at one tertiary care children’s hospital. Children <18 years were eligible for inclusion. Normal birth hospitalizations were excluded. We randomly selected one hospitalization from each child as the index visit. We identified cases, hospitalizations at C.S. Mott Children’s Hospital between 2008 and 2012 with a subsequent unplanned 30-day readmission,18 and matched them one to one with hospitalizations at the same hospital during the same period without subsequent readmission. We matched cases to controls based on the month of admission to account for seasonality of certain illnesses. We also matched on distance and direction from the hospital to the patient’s home to account for the potential to have readmissions to other institutions. We utilized both distance and direction recognizing that a family living 30 miles in one direction would be closer to an urban area with access to more facilities, as opposed to 30 miles in another direction in a rural area without additional access. We subsequently performed medical record review to abstract relevant covariates.
Primary Predictors
Medical Complexity Models (Models 1 and 2):
We evaluated three attributes of discharge medical complexity abstracted by medical record review—discharge medications, technology assistance (ie, tracheostomy, cerebral spinal fluid ventricular shunt, enteral feeding tube, central line), and the need for home healthcare after discharge. We counted discharge medications based on the number of medications listed on the discharge summary separated into scheduled or as needed.19 We also considered the number of scheduled doses to be administered in a 24-hour period (see Appendix methods for more information on counting discharge medications). For assistance by technology, we considered the presence of tracheostomy, cerebral spinal fluid ventricular shunt, enteral feeding tube, and central lines. While we describe these technologies separately, for multivariable analyses we considered the presence of any of the four types of technology.
Change in Medical Complexity Models (Models 3 and 4)
We examined two aspects of change in medical complexity—the presence of a new complex chronic condition (CCC)20 diagnosed during the hospitalization, and a new reliance on medical technology. The presence of new CCC was determined by comparing discharge diagnoses to past medical history abstracted by medical record review. A new CCC was defined as any complex chronic condition that was captured in the discharge diagnoses but was not evident in the past medical history. By definition, all CCCs coded during birth hospitalization (eg, at discharge from the neonatal intensive care unit) were assigned to “new” CCC. We calculated a kappa statistic to determine interrater reliability in determining the designation of new CCC. A sensitivity analysis examining these birth CCCs was also performed comparing no new CCC, new CCC, and new CCC after birth hospitalization. The methods appendix provides additional information on considering new CCCs. New technology, abstracted from chart review, was defined as technology placed during hospitalization that remained in place at discharge. If a child with existing technology had additional technology placed during the hospitalization (eg, a new tracheostomy in a child with a previously placed enteral feeding tube), the encounter was considered as having new technology placed.
Covariates
We created different sets of multivariable models to account for patient/hospitalization characteristics.
Statistical Analysis
A review of 600 cases and 600 controls yields 89% power to detect statistical significance for covariates with an odds ratio of 1.25 (β = 0.22) if the candidate covariate has low to moderate correlation with other covariates (<0.3). If a candidate covariate has a moderate correlation with other covariates (0.6), we have 89% power to detect an odds ratio of 1.35 (β = 0.30).21 We calculated odds of 30-days unplanned readmission using conditional logistic regression to account for matched case-control design. All the analyses were performed using STATA 13 (Stata Corp., College Station, Texas).
RESULTS
Of the 41,422 eligible index hospitalizations during the study period, 9.4% resulted in a 30-day unplanned readmission. After randomly selecting one hospitalization per child, there were 781 eligible cases. We subsequent matched all but one eligible case to a control. We randomly selected encounters for medical record review, reviewing a total of 1,212 encounters. After excluding pairs with incomplete records, we included 595 cases and 595 controls in this analysis (Figure). Patient/hospitalization characteristics are displayed in Table 1. The most frequent primary discharge diagnoses are displayed in Appendix Table 1.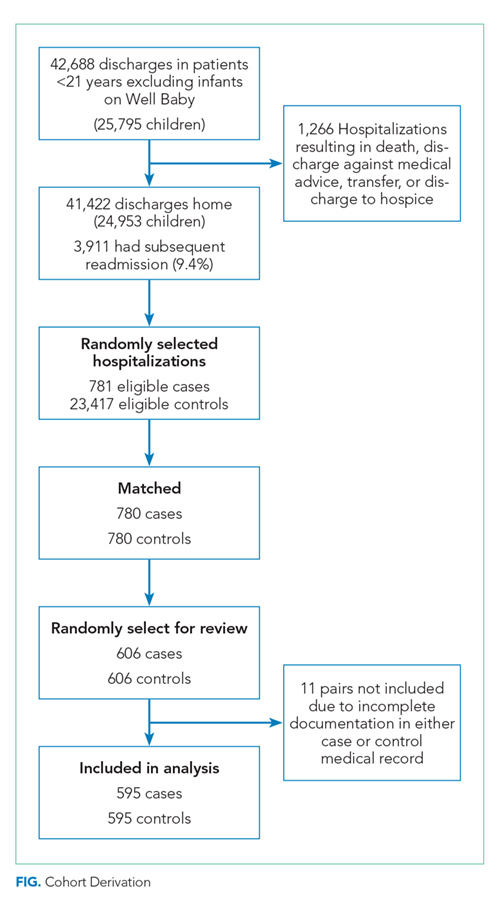
Models of Medical Complexity at Discharge
Polypharmacy after discharge was common for both readmitted and nonreadmitted patients. Children who experienced unplanned readmission in 30 days were discharged with a median of four different scheduled medications (interquartile range [IQR] 2,7) which translated into a median of six (IQR 3,12) scheduled doses in a 24-hour period. In comparison, children without an unplanned readmission had a median of two different scheduled medications (IQR 1,3) with a median of three (IQR 0,7) scheduled doses in a 24-hour period. Medical technology was more common in case children (42%) than in control children (14%). Central lines and enteral tubes were the most common forms of medical technology in both cases and controls. Home health referral was common in both cases (44%) and controls (23%; Table 1).
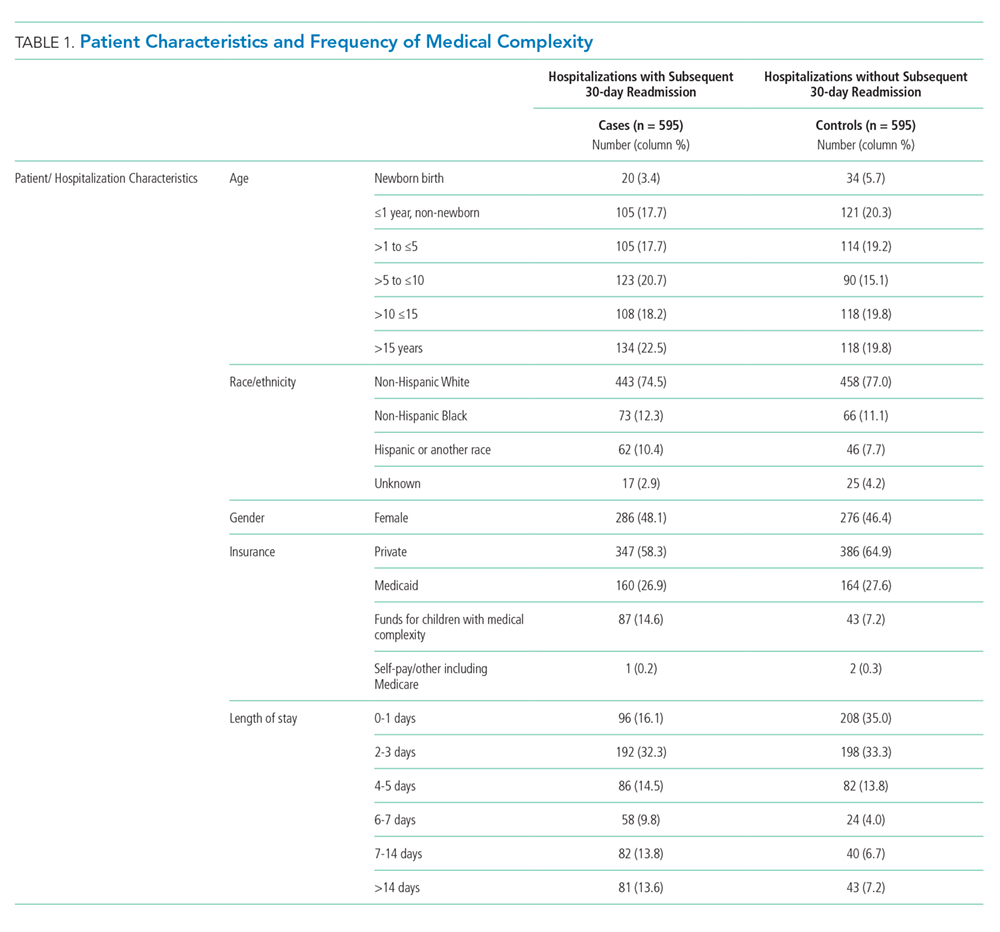
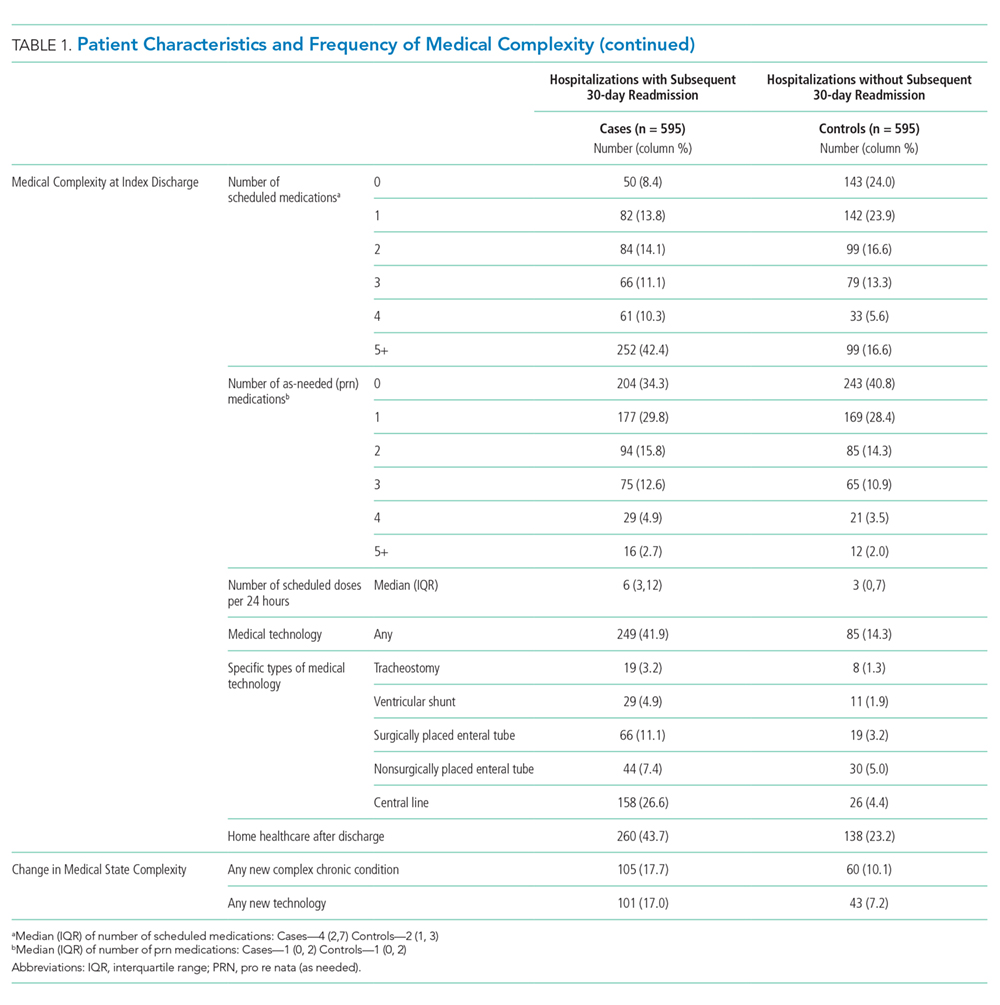
In Model 1 (adjusting only for patient characteristics; Table 3), being discharged on two or more scheduled medications was associated with higher odds of readmission compared to being discharged without medications, with additional medications associated with even higher odds of readmission. Children with any technology had higher odds of readmission than children without medical technology. Likewise, home healthcare visits after discharge were associated with elevated odds of readmission in multivariable analyses without LOS. However, after adding LOS to the model (Model 2), home healthcare visits were no longer significantly associated with readmission.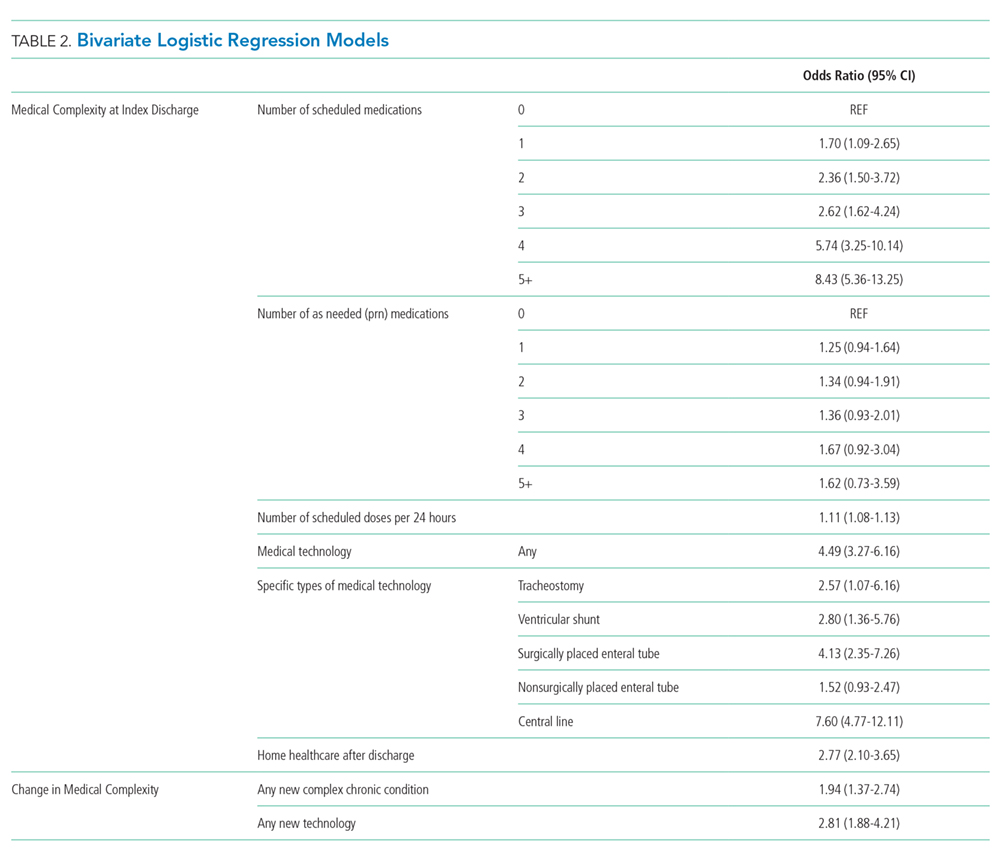
Change in Medical Complexity Models
The adjudication of new CCCs had good reliability (Κ = 0.72). New CCCs occurred in 18% and new technologies occurred in 17% of cases. Comparatively, new CCCs occurred in 10% and new technologies in 7% of hospitalizations in control children (Table 1). In bivariate analyses, both aspects of change in medical complexity were associated with higher odds of readmission (Table 2). In multivariate analysis with patient characteristics (Model 3; Table 3), all aspects of change in complexity were associated with elevated odds of readmission. A new CCC was associated with higher odds of readmission (adjusted OR (AOR) 1.75, 95% CI: 1.11-2.75) as was new technology during admission (AOR 1.84, 95%CI: 1.09-3.10). Furthermore, the odds of readmission for medical complexity variables (polypharmacy and home healthcare need) remained largely unchanged when adding the change in medical complexity variables (ie, comparing Model 1 and Model 3). However, when accounting for LOS (Model 4), neither the acquisition of a new CCC nor the addition of new technology was associated with readmission. The most common form of new technology was central line followed by nonsurgically placed enteral tube (Appendix Table 2). Finally, in sensitivity analyses (results not detailed), separating new CCC acquired at birth and new CCCs in nonbirth hospitalizations, compared to hospitalizations with no new CCC, yielded similar results as the primary analyses.
DISCUSSION
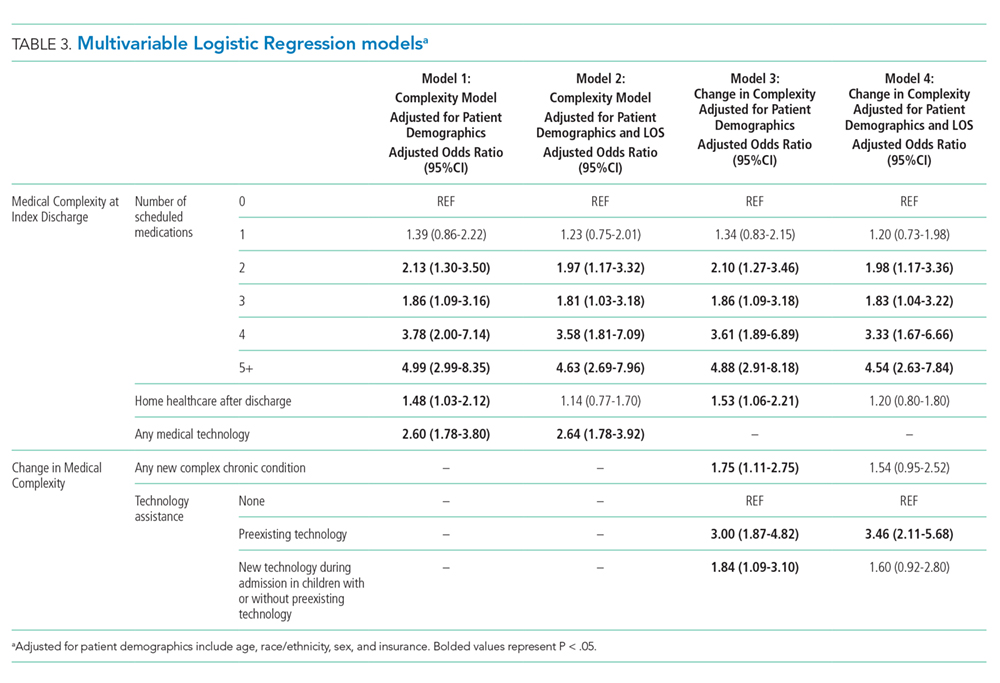
We examined multiple attributes of polypharmacy—the number of scheduled medications, number of as-needed medications, and number of scheduled doses per 24 hours. Interestingly, only the scheduled medications (count of medication and number of doses) were associated with elevated readmission risk. As-needed medications have heterogeneity in the level of importance from critical (eg, seizure rescue) to discretionary (eg, antipyretics, creams). The burden of managing these types of medications may still be high (ie, parents must decide when to administer a critical medication); however, this burden does not translate into increased readmission risk in this population.
Not surprisingly, greater medical complexity—as defined by higher numbers of scheduled discharge medications and technology assistance—is associated with 30-day readmission risk. Our analyses do not allow us to determine how much of the increased risk is due to additional care burden and risks of polypharmacy versus the inherent increase in complexity and severity of illness for which polypharmacy is a marker. Tailoring discharge regimens to the realities of daily life, with the goal of “minimally disruptive medicine”22,23 (eg, integrating manageable discharge medication routines into school and work schedules), is not a common feature of pediatric discharge planning. For adult patients with complex medical conditions, tailoring medication regimens in a minimally disruptive way is known to improve outcomes.24 Similarly, adopting minimally disruptive techniques to integrate the polypharmacy inherent in discharge could potentially mitigate some of the readmission risks for children and adolescents.
Contrary to our hypothesis, new technologies and new diagnoses did not confer additional readmission risk when accounting for LOS and patient characteristics. One potential explanation is varying risks conveyed by different types of new technologies placed during hospitalization. Central lines, the most common form of new technology, is associated with higher odds of reutilization in unadjusted analyses. However, the second most common form of new technology, nonsurgically placed enteral feeding tube, was not. Further analyses of the differential effects of new technology should be further examined in larger datasets. Additionally, the lack of additional readmission risk from new technology may relate to additional teaching and support provided to families of patients undergoing unfamiliar procedures offsets the risks inherent of greater complexity. If so, it may be that the more intensive teaching and postdischarge support provided to families with new technology or a new diagnosis could be replicated through refresher teaching during hospitalizations, when a patient’s state of health is status quo for the family (ie, the child was admitted and discharged with the same technology and diagnoses). This notion is supported by prior work that demonstrated successful readmission reduction interventions for children with chronic conditions often rely on enhanced education or coaching.25,26
We elected to present models both with and without LOS as a confounder because it is a potentially modifiable attribute of hospitalization. Change in medical complexity aspects were significantly associated with readmission in multivariable models without LOS. However, with the addition of LOS, they were no longer significant. Thus, the readmission risk of new complexity is accounted for by the readmission risk inherent in a longer LOS. This finding prompts additional questions that merit further study: is it that LOS is a general marker for heightened complexity, or is it that a longer LOS can modify readmission risk through additional in-hospital care and time for enhanced education?
Our study has several strengths. We were able to discern true complexity at the time of discharge through medical record review. For example, if a child had a peripherally inserted central catheter placed during hospitalization, it cannot be ascertained through administrative data without medical record review if the technology was removed or in place at discharge. Likewise, medical record review allows for identification of medical technology which is not surgically implanted (eg, nasogastric feeding tubes). Given the “fog” families report as part of their in-hospital experience and its threats to education and postdischarge contingency planning,17 we felt it important to evaluate medical technology regardless of whether or not it was surgically placed. Additionally, the more detailed and nuanced understanding gained of polypharmacy burden can better inform both risk prediction models and interventions to improve the transition from hospital to home.
This study
CONCLUSION
Medical complexity at discharge is associated with pediatric readmission risk. Contrary to our hypothesis, the addition of new technologies and new CCC diagnoses are not associated with pediatric readmission, after accounting for patient and hospitalization factors including LOS. The dynamics of LOS as a risk factor for readmission for children with medical complexity are likely multifaceted and merit further investigation in a multi-institutional study.
Disclosures
The authors report no potential conflicts of interest.
Funding
This work was supported by a grant from the Agency for Healthcare Research and Quality (1K08HS204735-01A1) and a grant from the Blue Cross Blue Shield of Michigan Foundation.
1. Diaz-Caneja A, Gledhill J, Weaver T, Nadel S, Garralda E. A child’s admission to hospital: a qualitative study examining the experiences of parents. Intensive Care Med. 2005;31(9):1248-1254. https://doi.org/10.1007/s00134-005-2728-8.
2. Lapillonne A, Regnault A, Gournay V, et al. Impact on parents of bronchiolitis hospitalization of full-term, preterm and congenital heart disease infants. BMC Pediatrics. 2012;12:171. https://doi.org/10.1186/1471-2431-12-171.
3. Leader S, Jacobson P, Marcin J, Vardis R, Sorrentino M, Murray D. A method for identifying the financial burden of hospitalized infants on families. Value Health. 2002;5(1):55-59. https://doi.org/10.1046/j.1524-4733.2002.51076.x.
4. Leidy NK, Margolis MK, Marcin JP, et al. The impact of severe respiratory syncytial virus on the child, caregiver, and family during hospitalization and recovery. Pediatrics. 2005;115(6):1536-1546. https://doi.org/10.1542/peds.2004-1149.
5. Rennick JE, Johnston CC, Dougherty G, Platt R, Ritchie JA. Children’s psychological responses after critical illness and exposure to invasive technology. J Dev Behav Pediatr. 2002;23(3):133-144. PubMed
6. Brennan TA, Leape LL, Laird NM, et al. Incidence of adverse events and negligence in hospitalized patients. Results of the Harvard Medical Practice Study I. N Engl J Med. 1991;324(6):370-376. https://doi.org/10.1056/NEJM199102073240604.
7. Kohn LT, Corrigan J, Donaldson MS. To err is human: building a safer health system. Washington DC: National Academy Press; 2000.
8. Landrigan CP, Parry GJ, Bones CB, Hackbarth AD, Goldmann DA, Sharek PJ. Temporal trends in rates of patient harm resulting from medical care. N Engl J Med. 2010;363(22):2124-2134. https://doi.org/10.1056/NEJMsa1004404.
9. Magill SS, Edwards JR, Bamberg W, et al. Multistate point-prevalence survey of healthcare-associated infections. N Engl J Med. 2014;370(13):1198-1208. https://doi.org/10.1056/NEJMoa1306801.
10. Berry JG, Toomey SL, Zaslavsky AM, et al. Pediatric readmission prevalence and variability across hospitals. JAMA. 2013;309(4):372-380. https://doi.org/10.1001/jama.2012.188351.
11. Bardach NS, Vittinghoff E, Asteria-Penaloza R, et al. Measuring hospital quality using pediatric readmission and revisit rates. Pediatrics. 2013;132(3):429-436. https://doi.org/10.1542/peds.2012-3527.
12. Toomey SL, Peltz A, Loren S, et al. Potentially preventable 30-day hospital readmissions at a children’s hospital. Pediatrics. 2016;138(2):pii: e20154182. https://doi.org/10.1542/peds.2015-4182.
13. Bucholz EM, Gay JC, Hall M, Harris M, Berry JG. Timing and causes of common pediatric readmissions. J Pediatr. 2018;200:240-248. https://doi.org/10.1016/j.jpeds.2018.04.044.
14. Berry JG, Hall DE, Kuo DZ, et al. Hospital utilization and characteristics of patients experiencing recurrent readmissions within children’s hospitals. JAMA. 2011;305(7):682-690. https://doi.org/10.1001/jama.2011.122.
15. Winer JC, Aragona E, Fields AI, Stockwell DC. Comparison of clinical risk factors among pediatric patients with single admission, multiple admissions (without any 7-day readmissions), and 7-day readmission. Hosp Pediatr. 2016;6(3):119-125. https://doi.org/10.1542/hpeds.2015-0110.
16. Brittan MS, Martin S, Anderson L, Moss A, Torok MR. An electronic health record tool designed to improve pediatric hospital discharge has low predictive utility for readmissions. J Hosp Med. 2018;13(11):779-782. https://doi.org/10.12788/jhm.3043.
17. Solan LG, Beck AF, Brunswick SA, et al. The family perspective on hospital to home transitions: a qualitative study. Pediatrics. 2015;136(6):e1539-e1549. https://doi.org/10.1542/peds.2015-2098.
18. Auger KA, Mueller EL, Weinberg SH, et al. A validated method for identifying unplanned pediatric readmission. J Pediatr. 2016;170:105-112. https://doi.org/10.1016/j.jpeds.2015.11.051.
19. Auger KA, Shah SS, Davis MD, Brady PW. Counting the Ways to Count Medications: The Challenges of Defining Pediatric Polypharmacy. J Hosp Med. 2019;14(8):506-507. https://doi.org/10.12788/jhm.3213.
20. Feudtner C, Feinstein JA, Zhong W, Hall M, Dai D. Pediatric complex chronic conditions classification system version 2: updated for ICD-10 and complex medical technology dependence and transplantation. BMC Pediatrics. 2014;14:199. https://doi.org/10.1186/1471-2431-14-199.
21. Hsieh FY. Sample size tables for logistic regression. Stat Med. 1989;8(7):795-802. https://doi.org/10.1002/sim.4780080704.
22. May C, Montori VM, Mair FS. We need minimally disruptive medicine. BMJ. 2009;339:b2803. https://doi.org/10.1136/bmj.b2803.
23. Leppin AL, Montori VM, Gionfriddo MR. Minimally disruptive medicine: a pragmatically comprehensive model for delivering care to patients with multiple chronic conditions. Healthcare (Basel). 2015;3(1):50-63. https://doi.org/10.3390/healthcare3010050.
24. Serrano V, Spencer-Bonilla G, Boehmer KR, Montori VM. Minimally disruptive medicine for patients with diabetes. Curr Diab Rep. 2017;17(11):104. https://doi.org/10.1007/s11892-017-0935-7.
25. Auger KA, Kenyon CC, Feudtner C, Davis MM. Pediatric hospital discharge interventions to reduce subsequent utilization: a systematic review. J Hosp Med. 2013;9(4):251-260. https://doi.org/10.1002/jhm.2134.
26. Coller RJ, Klitzner TS, Lerner CF, et al. Complex care hospital use and postdischarge coaching: a randomized controlled trial. Pediatrics. 2018;142(2):pii: e20174278. https://doi.org/10.1542/peds.2017-4278.
27. Hain PD, Gay JC, Berutti TW, Whitney GM, Wang W, Saville BR. Preventability of early readmissions at a children’s hospital. Pediatrics. 2013;131(1):e171-e181. https://doi.org/10.1542/peds.2012-0820.
28. Auger KA, Teufel RJ, 2nd, Harris JM, 2nd, et al. Children’s hospital characteristics and readmission metrics. Pediatrics. 2017;139(2). https://doi.org/10.1542/peds.2016-1720.
29. Gay JC, Agrawal R, Auger KA, et al. Rates and impact of potentially preventable readmissions at children’s hospitals. J Pediatr. 2015;166(3):613-619 e615. https://doi.org/10.1016/j.jpeds.2014.10.052.
Hospitalizations are disruptive, stressful, and costly for patients and families.1-5 Hospital readmissions subject families to the additional morbidity inherent to hospitalization and place patients at additional risk of hospital-acquired conditions or other harm.6-9 In pediatrics, hospital readmissions are common for specific conditions;10 with rates varying across institutions;10,11 and as many as one-third of unplanned pediatric readmissions are potentially preventable.12
Reducing pediatric readmissions requires a deeper understanding of the mechanisms through which readmissions occur. Medical complexity—specifically chronic conditions and use of medical technology—is associated with increased risk of readmission.13,14 Polypharmacy at discharge has also been associated with readmission.15,16 However, prior studies on polypharmacy and readmission risk examined the count of total medications and did not consider the nuances of scheduled versus as-needed medications, or the frequency of doses. These nuances may be critical to caregivers as discharge medical complexity can be overwhelming, even in diagnoses which are not traditionally considered complex.17 Finally, of potentially greater importance than medical complexity at discharge is a change in medical complexity during a hospitalization—for example, new diagnoses or new technologies that require additional education in hospital and management at home.
We sought to further understand the relationship between discharge medical complexity and readmission risk with regards to polypharmacy and home healthcare referrals at discharge. Specifically, we hypothesized that a change in medical complexity during an admission—ie, a new chronic diagnosis or new technology—would be a more prominent risk factor for readmission than discharge complexity alone. We examined these factors in the context of length of stay (LOS) since this is a marker of in-hospital severity of illness and a potentially modifiable function of time allowed for in-hospital teaching and discharge preparation.
METHODS
We conducted a retrospective, case-control study of pediatric hospitalizations at one tertiary care children’s hospital. Children <18 years were eligible for inclusion. Normal birth hospitalizations were excluded. We randomly selected one hospitalization from each child as the index visit. We identified cases, hospitalizations at C.S. Mott Children’s Hospital between 2008 and 2012 with a subsequent unplanned 30-day readmission,18 and matched them one to one with hospitalizations at the same hospital during the same period without subsequent readmission. We matched cases to controls based on the month of admission to account for seasonality of certain illnesses. We also matched on distance and direction from the hospital to the patient’s home to account for the potential to have readmissions to other institutions. We utilized both distance and direction recognizing that a family living 30 miles in one direction would be closer to an urban area with access to more facilities, as opposed to 30 miles in another direction in a rural area without additional access. We subsequently performed medical record review to abstract relevant covariates.
Primary Predictors
Medical Complexity Models (Models 1 and 2):
We evaluated three attributes of discharge medical complexity abstracted by medical record review—discharge medications, technology assistance (ie, tracheostomy, cerebral spinal fluid ventricular shunt, enteral feeding tube, central line), and the need for home healthcare after discharge. We counted discharge medications based on the number of medications listed on the discharge summary separated into scheduled or as needed.19 We also considered the number of scheduled doses to be administered in a 24-hour period (see Appendix methods for more information on counting discharge medications). For assistance by technology, we considered the presence of tracheostomy, cerebral spinal fluid ventricular shunt, enteral feeding tube, and central lines. While we describe these technologies separately, for multivariable analyses we considered the presence of any of the four types of technology.
Change in Medical Complexity Models (Models 3 and 4)
We examined two aspects of change in medical complexity—the presence of a new complex chronic condition (CCC)20 diagnosed during the hospitalization, and a new reliance on medical technology. The presence of new CCC was determined by comparing discharge diagnoses to past medical history abstracted by medical record review. A new CCC was defined as any complex chronic condition that was captured in the discharge diagnoses but was not evident in the past medical history. By definition, all CCCs coded during birth hospitalization (eg, at discharge from the neonatal intensive care unit) were assigned to “new” CCC. We calculated a kappa statistic to determine interrater reliability in determining the designation of new CCC. A sensitivity analysis examining these birth CCCs was also performed comparing no new CCC, new CCC, and new CCC after birth hospitalization. The methods appendix provides additional information on considering new CCCs. New technology, abstracted from chart review, was defined as technology placed during hospitalization that remained in place at discharge. If a child with existing technology had additional technology placed during the hospitalization (eg, a new tracheostomy in a child with a previously placed enteral feeding tube), the encounter was considered as having new technology placed.
Covariates
We created different sets of multivariable models to account for patient/hospitalization characteristics.
Statistical Analysis
A review of 600 cases and 600 controls yields 89% power to detect statistical significance for covariates with an odds ratio of 1.25 (β = 0.22) if the candidate covariate has low to moderate correlation with other covariates (<0.3). If a candidate covariate has a moderate correlation with other covariates (0.6), we have 89% power to detect an odds ratio of 1.35 (β = 0.30).21 We calculated odds of 30-days unplanned readmission using conditional logistic regression to account for matched case-control design. All the analyses were performed using STATA 13 (Stata Corp., College Station, Texas).
RESULTS
Of the 41,422 eligible index hospitalizations during the study period, 9.4% resulted in a 30-day unplanned readmission. After randomly selecting one hospitalization per child, there were 781 eligible cases. We subsequent matched all but one eligible case to a control. We randomly selected encounters for medical record review, reviewing a total of 1,212 encounters. After excluding pairs with incomplete records, we included 595 cases and 595 controls in this analysis (Figure). Patient/hospitalization characteristics are displayed in Table 1. The most frequent primary discharge diagnoses are displayed in Appendix Table 1.
Models of Medical Complexity at Discharge
Polypharmacy after discharge was common for both readmitted and nonreadmitted patients. Children who experienced unplanned readmission in 30 days were discharged with a median of four different scheduled medications (interquartile range [IQR] 2,7) which translated into a median of six (IQR 3,12) scheduled doses in a 24-hour period. In comparison, children without an unplanned readmission had a median of two different scheduled medications (IQR 1,3) with a median of three (IQR 0,7) scheduled doses in a 24-hour period. Medical technology was more common in case children (42%) than in control children (14%). Central lines and enteral tubes were the most common forms of medical technology in both cases and controls. Home health referral was common in both cases (44%) and controls (23%; Table 1).
In Model 1 (adjusting only for patient characteristics; Table 3), being discharged on two or more scheduled medications was associated with higher odds of readmission compared to being discharged without medications, with additional medications associated with even higher odds of readmission. Children with any technology had higher odds of readmission than children without medical technology. Likewise, home healthcare visits after discharge were associated with elevated odds of readmission in multivariable analyses without LOS. However, after adding LOS to the model (Model 2), home healthcare visits were no longer significantly associated with readmission.
Change in Medical Complexity Models
The adjudication of new CCCs had good reliability (Κ = 0.72). New CCCs occurred in 18% and new technologies occurred in 17% of cases. Comparatively, new CCCs occurred in 10% and new technologies in 7% of hospitalizations in control children (Table 1). In bivariate analyses, both aspects of change in medical complexity were associated with higher odds of readmission (Table 2). In multivariate analysis with patient characteristics (Model 3; Table 3), all aspects of change in complexity were associated with elevated odds of readmission. A new CCC was associated with higher odds of readmission (adjusted OR (AOR) 1.75, 95% CI: 1.11-2.75) as was new technology during admission (AOR 1.84, 95%CI: 1.09-3.10). Furthermore, the odds of readmission for medical complexity variables (polypharmacy and home healthcare need) remained largely unchanged when adding the change in medical complexity variables (ie, comparing Model 1 and Model 3). However, when accounting for LOS (Model 4), neither the acquisition of a new CCC nor the addition of new technology was associated with readmission. The most common form of new technology was central line followed by nonsurgically placed enteral tube (Appendix Table 2). Finally, in sensitivity analyses (results not detailed), separating new CCC acquired at birth and new CCCs in nonbirth hospitalizations, compared to hospitalizations with no new CCC, yielded similar results as the primary analyses.
DISCUSSION
We examined multiple attributes of polypharmacy—the number of scheduled medications, number of as-needed medications, and number of scheduled doses per 24 hours. Interestingly, only the scheduled medications (count of medication and number of doses) were associated with elevated readmission risk. As-needed medications have heterogeneity in the level of importance from critical (eg, seizure rescue) to discretionary (eg, antipyretics, creams). The burden of managing these types of medications may still be high (ie, parents must decide when to administer a critical medication); however, this burden does not translate into increased readmission risk in this population.
Not surprisingly, greater medical complexity—as defined by higher numbers of scheduled discharge medications and technology assistance—is associated with 30-day readmission risk. Our analyses do not allow us to determine how much of the increased risk is due to additional care burden and risks of polypharmacy versus the inherent increase in complexity and severity of illness for which polypharmacy is a marker. Tailoring discharge regimens to the realities of daily life, with the goal of “minimally disruptive medicine”22,23 (eg, integrating manageable discharge medication routines into school and work schedules), is not a common feature of pediatric discharge planning. For adult patients with complex medical conditions, tailoring medication regimens in a minimally disruptive way is known to improve outcomes.24 Similarly, adopting minimally disruptive techniques to integrate the polypharmacy inherent in discharge could potentially mitigate some of the readmission risks for children and adolescents.
Contrary to our hypothesis, new technologies and new diagnoses did not confer additional readmission risk when accounting for LOS and patient characteristics. One potential explanation is varying risks conveyed by different types of new technologies placed during hospitalization. Central lines, the most common form of new technology, is associated with higher odds of reutilization in unadjusted analyses. However, the second most common form of new technology, nonsurgically placed enteral feeding tube, was not. Further analyses of the differential effects of new technology should be further examined in larger datasets. Additionally, the lack of additional readmission risk from new technology may relate to additional teaching and support provided to families of patients undergoing unfamiliar procedures offsets the risks inherent of greater complexity. If so, it may be that the more intensive teaching and postdischarge support provided to families with new technology or a new diagnosis could be replicated through refresher teaching during hospitalizations, when a patient’s state of health is status quo for the family (ie, the child was admitted and discharged with the same technology and diagnoses). This notion is supported by prior work that demonstrated successful readmission reduction interventions for children with chronic conditions often rely on enhanced education or coaching.25,26
We elected to present models both with and without LOS as a confounder because it is a potentially modifiable attribute of hospitalization. Change in medical complexity aspects were significantly associated with readmission in multivariable models without LOS. However, with the addition of LOS, they were no longer significant. Thus, the readmission risk of new complexity is accounted for by the readmission risk inherent in a longer LOS. This finding prompts additional questions that merit further study: is it that LOS is a general marker for heightened complexity, or is it that a longer LOS can modify readmission risk through additional in-hospital care and time for enhanced education?
Our study has several strengths. We were able to discern true complexity at the time of discharge through medical record review. For example, if a child had a peripherally inserted central catheter placed during hospitalization, it cannot be ascertained through administrative data without medical record review if the technology was removed or in place at discharge. Likewise, medical record review allows for identification of medical technology which is not surgically implanted (eg, nasogastric feeding tubes). Given the “fog” families report as part of their in-hospital experience and its threats to education and postdischarge contingency planning,17 we felt it important to evaluate medical technology regardless of whether or not it was surgically placed. Additionally, the more detailed and nuanced understanding gained of polypharmacy burden can better inform both risk prediction models and interventions to improve the transition from hospital to home.
This study
CONCLUSION
Medical complexity at discharge is associated with pediatric readmission risk. Contrary to our hypothesis, the addition of new technologies and new CCC diagnoses are not associated with pediatric readmission, after accounting for patient and hospitalization factors including LOS. The dynamics of LOS as a risk factor for readmission for children with medical complexity are likely multifaceted and merit further investigation in a multi-institutional study.
Disclosures
The authors report no potential conflicts of interest.
Funding
This work was supported by a grant from the Agency for Healthcare Research and Quality (1K08HS204735-01A1) and a grant from the Blue Cross Blue Shield of Michigan Foundation.
1. Diaz-Caneja A, Gledhill J, Weaver T, Nadel S, Garralda E. A child’s admission to hospital: a qualitative study examining the experiences of parents. Intensive Care Med. 2005;31(9):1248-1254. https://doi.org/10.1007/s00134-005-2728-8.
2. Lapillonne A, Regnault A, Gournay V, et al. Impact on parents of bronchiolitis hospitalization of full-term, preterm and congenital heart disease infants. BMC Pediatrics. 2012;12:171. https://doi.org/10.1186/1471-2431-12-171.
3. Leader S, Jacobson P, Marcin J, Vardis R, Sorrentino M, Murray D. A method for identifying the financial burden of hospitalized infants on families. Value Health. 2002;5(1):55-59. https://doi.org/10.1046/j.1524-4733.2002.51076.x.
4. Leidy NK, Margolis MK, Marcin JP, et al. The impact of severe respiratory syncytial virus on the child, caregiver, and family during hospitalization and recovery. Pediatrics. 2005;115(6):1536-1546. https://doi.org/10.1542/peds.2004-1149.
5. Rennick JE, Johnston CC, Dougherty G, Platt R, Ritchie JA. Children’s psychological responses after critical illness and exposure to invasive technology. J Dev Behav Pediatr. 2002;23(3):133-144. PubMed
6. Brennan TA, Leape LL, Laird NM, et al. Incidence of adverse events and negligence in hospitalized patients. Results of the Harvard Medical Practice Study I. N Engl J Med. 1991;324(6):370-376. https://doi.org/10.1056/NEJM199102073240604.
7. Kohn LT, Corrigan J, Donaldson MS. To err is human: building a safer health system. Washington DC: National Academy Press; 2000.
8. Landrigan CP, Parry GJ, Bones CB, Hackbarth AD, Goldmann DA, Sharek PJ. Temporal trends in rates of patient harm resulting from medical care. N Engl J Med. 2010;363(22):2124-2134. https://doi.org/10.1056/NEJMsa1004404.
9. Magill SS, Edwards JR, Bamberg W, et al. Multistate point-prevalence survey of healthcare-associated infections. N Engl J Med. 2014;370(13):1198-1208. https://doi.org/10.1056/NEJMoa1306801.
10. Berry JG, Toomey SL, Zaslavsky AM, et al. Pediatric readmission prevalence and variability across hospitals. JAMA. 2013;309(4):372-380. https://doi.org/10.1001/jama.2012.188351.
11. Bardach NS, Vittinghoff E, Asteria-Penaloza R, et al. Measuring hospital quality using pediatric readmission and revisit rates. Pediatrics. 2013;132(3):429-436. https://doi.org/10.1542/peds.2012-3527.
12. Toomey SL, Peltz A, Loren S, et al. Potentially preventable 30-day hospital readmissions at a children’s hospital. Pediatrics. 2016;138(2):pii: e20154182. https://doi.org/10.1542/peds.2015-4182.
13. Bucholz EM, Gay JC, Hall M, Harris M, Berry JG. Timing and causes of common pediatric readmissions. J Pediatr. 2018;200:240-248. https://doi.org/10.1016/j.jpeds.2018.04.044.
14. Berry JG, Hall DE, Kuo DZ, et al. Hospital utilization and characteristics of patients experiencing recurrent readmissions within children’s hospitals. JAMA. 2011;305(7):682-690. https://doi.org/10.1001/jama.2011.122.
15. Winer JC, Aragona E, Fields AI, Stockwell DC. Comparison of clinical risk factors among pediatric patients with single admission, multiple admissions (without any 7-day readmissions), and 7-day readmission. Hosp Pediatr. 2016;6(3):119-125. https://doi.org/10.1542/hpeds.2015-0110.
16. Brittan MS, Martin S, Anderson L, Moss A, Torok MR. An electronic health record tool designed to improve pediatric hospital discharge has low predictive utility for readmissions. J Hosp Med. 2018;13(11):779-782. https://doi.org/10.12788/jhm.3043.
17. Solan LG, Beck AF, Brunswick SA, et al. The family perspective on hospital to home transitions: a qualitative study. Pediatrics. 2015;136(6):e1539-e1549. https://doi.org/10.1542/peds.2015-2098.
18. Auger KA, Mueller EL, Weinberg SH, et al. A validated method for identifying unplanned pediatric readmission. J Pediatr. 2016;170:105-112. https://doi.org/10.1016/j.jpeds.2015.11.051.
19. Auger KA, Shah SS, Davis MD, Brady PW. Counting the Ways to Count Medications: The Challenges of Defining Pediatric Polypharmacy. J Hosp Med. 2019;14(8):506-507. https://doi.org/10.12788/jhm.3213.
20. Feudtner C, Feinstein JA, Zhong W, Hall M, Dai D. Pediatric complex chronic conditions classification system version 2: updated for ICD-10 and complex medical technology dependence and transplantation. BMC Pediatrics. 2014;14:199. https://doi.org/10.1186/1471-2431-14-199.
21. Hsieh FY. Sample size tables for logistic regression. Stat Med. 1989;8(7):795-802. https://doi.org/10.1002/sim.4780080704.
22. May C, Montori VM, Mair FS. We need minimally disruptive medicine. BMJ. 2009;339:b2803. https://doi.org/10.1136/bmj.b2803.
23. Leppin AL, Montori VM, Gionfriddo MR. Minimally disruptive medicine: a pragmatically comprehensive model for delivering care to patients with multiple chronic conditions. Healthcare (Basel). 2015;3(1):50-63. https://doi.org/10.3390/healthcare3010050.
24. Serrano V, Spencer-Bonilla G, Boehmer KR, Montori VM. Minimally disruptive medicine for patients with diabetes. Curr Diab Rep. 2017;17(11):104. https://doi.org/10.1007/s11892-017-0935-7.
25. Auger KA, Kenyon CC, Feudtner C, Davis MM. Pediatric hospital discharge interventions to reduce subsequent utilization: a systematic review. J Hosp Med. 2013;9(4):251-260. https://doi.org/10.1002/jhm.2134.
26. Coller RJ, Klitzner TS, Lerner CF, et al. Complex care hospital use and postdischarge coaching: a randomized controlled trial. Pediatrics. 2018;142(2):pii: e20174278. https://doi.org/10.1542/peds.2017-4278.
27. Hain PD, Gay JC, Berutti TW, Whitney GM, Wang W, Saville BR. Preventability of early readmissions at a children’s hospital. Pediatrics. 2013;131(1):e171-e181. https://doi.org/10.1542/peds.2012-0820.
28. Auger KA, Teufel RJ, 2nd, Harris JM, 2nd, et al. Children’s hospital characteristics and readmission metrics. Pediatrics. 2017;139(2). https://doi.org/10.1542/peds.2016-1720.
29. Gay JC, Agrawal R, Auger KA, et al. Rates and impact of potentially preventable readmissions at children’s hospitals. J Pediatr. 2015;166(3):613-619 e615. https://doi.org/10.1016/j.jpeds.2014.10.052.
© 2019 Society of Hospital Medicine
HHS proposes pathways for drug importation
Officials at the U.S. Department of Health and Human Services have announced a new plan that they say would lay the foundation for safe importation of certain medications, with the aim of expanding drug access and lowering prescription costs for patients.

The action plan, unveiled July 31, outlines two pathways for drug importation from foreign markets. The first route would authorize states, wholesalers, or pharmacists to propose pilot demonstrations on how they would import drugs from Canada into the United States, provided these are versions of drugs already approved by the Food and Drug Administration. Similarly, a second pathway would allow manufacturers that sell in foreign countries the opportunity to import drugs that are versions of FDA-approved medications.
HHS Secretary Alex M. Azar II said the action plan is part of President Trump’s drug-pricing blueprint and is intended to combat the sky-high price tags on many prescription medications.
“President Trump has been clear: For too long American patients have been paying exorbitantly high prices for prescription drugs that are made available to other countries at lower prices,” Mr. Azar said in a statement. “[The] announcement outlines the pathways the administration intends to explore to allow safe importation of certain prescription drugs to lower prices and reduce out of pocket costs for American patients. This is the next important step in the administration’s work to end foreign freeloading and put American patients first.”

Under the first pathway, HHS would review plans submitted by states, pharmacists, or drugmakers that outline how the entities would import Health Canada–approved drugs that are in compliance with the federal Food, Drug, and Cosmetic Act. The importation would occur in a manner that assures the drug’s validity and meets the cost requirements of federal rule making, according to an HHS fact sheet.
Demonstration projects would be time-limited and require regular reporting to ensure safety and cost conditions are being met.
Under the second pathway, manufacturers of FDA-approved drug products would be able to import versions of those drugs that they sell in foreign countries through a special process to be outlined by the agency. As part of the process, drugmakers would need to establish that the foreign version is the same as the U.S. version. The FDA would then allow the drug to be labeled for sale in the U.S. and imported, according to the fact sheet. HHS officials said they believe that manufacturers would use this pathway to offer U.S. patients lower-cost versions of their drugs and the medications affected could potentially include those used to treat diabetes, rheumatoid arthritis, cardiovascular disorders, and cancer.
“In recent years, multiple manufacturers have stated (either publicly or in statements to the Administration) that they wanted to offer lower cost versions but could not readily do so because they were locked into contracts with other parties in the supply chain,” HHS officials stated in the fact sheet. “This pathway would highlight an opportunity for manufacturers to use importation to offer lower-cost versions of their drugs.”
HHS plans to introduce its action plan through a formal notice of proposed rulemaking, which has not yet been finalized. Some elements of the final proposal may differ from its initial descriptions to reflect further consideration of the relevant issues, the agency noted.
Acting FDA Commissioner Ned Sharpless, MD, said the agency has a unique role to play in promoting competition that can help reduce drug prices and improve access to medicine for Americans.
“Driving down drug prices requires a comprehensive approach and we must continue to look at all innovative solutions to this challenge,” Dr. Sharpless said in a statement. “[The] proposal is the result of the hard work by the dedicated staff of the FDA, in close collaboration with HHS and the White House, to identify potential pathways we can pursue to support the safe importation of certain prescription drugs.”
Sen. Lamar Alexander (R-Tenn.), chair of the Health, Education, Labor and Pensions committee, said the administration’s proposal sounds promising as long as the plan ensures the safety and efficacy of imported medications.
“This is the first administration to take concrete steps to allow importation of prescription drugs to reduce their cost and I welcome it,” Sen. Alexander said in a statement. “The key for me is whether this plan preserves the Food and Drug Administration’s gold standard for safety and effectiveness. Millions of Americans every day buy prescription drugs relying on the FDA’s guarantee of quality.”
Officials at the U.S. Department of Health and Human Services have announced a new plan that they say would lay the foundation for safe importation of certain medications, with the aim of expanding drug access and lowering prescription costs for patients.
The action plan, unveiled July 31, outlines two pathways for drug importation from foreign markets. The first route would authorize states, wholesalers, or pharmacists to propose pilot demonstrations on how they would import drugs from Canada into the United States, provided these are versions of drugs already approved by the Food and Drug Administration. Similarly, a second pathway would allow manufacturers that sell in foreign countries the opportunity to import drugs that are versions of FDA-approved medications.
HHS Secretary Alex M. Azar II said the action plan is part of President Trump’s drug-pricing blueprint and is intended to combat the sky-high price tags on many prescription medications.
“President Trump has been clear: For too long American patients have been paying exorbitantly high prices for prescription drugs that are made available to other countries at lower prices,” Mr. Azar said in a statement. “[The] announcement outlines the pathways the administration intends to explore to allow safe importation of certain prescription drugs to lower prices and reduce out of pocket costs for American patients. This is the next important step in the administration’s work to end foreign freeloading and put American patients first.”
Under the first pathway, HHS would review plans submitted by states, pharmacists, or drugmakers that outline how the entities would import Health Canada–approved drugs that are in compliance with the federal Food, Drug, and Cosmetic Act. The importation would occur in a manner that assures the drug’s validity and meets the cost requirements of federal rule making, according to an HHS fact sheet.
Demonstration projects would be time-limited and require regular reporting to ensure safety and cost conditions are being met.
Under the second pathway, manufacturers of FDA-approved drug products would be able to import versions of those drugs that they sell in foreign countries through a special process to be outlined by the agency. As part of the process, drugmakers would need to establish that the foreign version is the same as the U.S. version. The FDA would then allow the drug to be labeled for sale in the U.S. and imported, according to the fact sheet. HHS officials said they believe that manufacturers would use this pathway to offer U.S. patients lower-cost versions of their drugs and the medications affected could potentially include those used to treat diabetes, rheumatoid arthritis, cardiovascular disorders, and cancer.
“In recent years, multiple manufacturers have stated (either publicly or in statements to the Administration) that they wanted to offer lower cost versions but could not readily do so because they were locked into contracts with other parties in the supply chain,” HHS officials stated in the fact sheet. “This pathway would highlight an opportunity for manufacturers to use importation to offer lower-cost versions of their drugs.”
HHS plans to introduce its action plan through a formal notice of proposed rulemaking, which has not yet been finalized. Some elements of the final proposal may differ from its initial descriptions to reflect further consideration of the relevant issues, the agency noted.
Acting FDA Commissioner Ned Sharpless, MD, said the agency has a unique role to play in promoting competition that can help reduce drug prices and improve access to medicine for Americans.
“Driving down drug prices requires a comprehensive approach and we must continue to look at all innovative solutions to this challenge,” Dr. Sharpless said in a statement. “[The] proposal is the result of the hard work by the dedicated staff of the FDA, in close collaboration with HHS and the White House, to identify potential pathways we can pursue to support the safe importation of certain prescription drugs.”
Sen. Lamar Alexander (R-Tenn.), chair of the Health, Education, Labor and Pensions committee, said the administration’s proposal sounds promising as long as the plan ensures the safety and efficacy of imported medications.
“This is the first administration to take concrete steps to allow importation of prescription drugs to reduce their cost and I welcome it,” Sen. Alexander said in a statement. “The key for me is whether this plan preserves the Food and Drug Administration’s gold standard for safety and effectiveness. Millions of Americans every day buy prescription drugs relying on the FDA’s guarantee of quality.”
Critics say hospital price transparency proposal ‘misses the mark’
A proposal by the Centers for Medicare & Medicaid Services to require full price transparency, including the disclosure of both list prices and payer-negotiated prices, is already receiving pushback.

Rick Pollack, president and CEO of the American Hospital Association, said in a statement that “mandating disclosure of negotiated rates between insurers and hospitals is the wrong approach,” adding that it “could seriously limit the choices available to patients in the private market and fuel anticompetitive behavior among commercial health insurers in an already highly concentrated insurance industry.”
The requirement for hospital price transparency was posted online July 29 as part of the proposed annual update to the hospital outpatient prospective payment system (OPPS) for 2020. It is scheduled for publication in the Federal Register on Aug. 9.
CMS is proposing, beginning in calendar year 2020, that hospitals make publicly available their “standard charges,” defined as the gross – or list – price of for all services provided by the hospital, as well as payer-specific negotiated prices. To allow for price comparisons, prices would be posted on the Internet in a machine-readable file that includes common billing or accounting codes and a description of the item of service being delivered.
Additionally, hospitals must make payer-specific negotiated prices for “shoppable” services, defined as services that can be scheduled in advance – such as x-rays, outpatient visits, imaging and laboratory tests, or bundled services like a cesarean delivery with pre- and postdelivery care – in a consumer-friendly manner.
“As deductibles rise and with 29 million uninsured, patients have the right to know the price of health care services so they can shop around for the best deal,” CMS Administrator Seema Verma said during a July 29 press conference. “In fact, a recent poll showed that the majority of Americans have tried to get pricing information before getting care, but have found it challenging to find that information.”
She noted that patients may see prices that range from 150% of Medicare rates to more than 400% for the same service.
Hospitals will need to display at least 300 shoppable services, including 70 that are CMS selected and 230 that are hospital selected, according to a fact sheet outlining this and other proposed OPPS updates for 2020.
“If a hospital does not provide one or more of the 70 CMS selected shoppable services, the hospital must select additional shoppable services such that the total number of shoppable services is at least 300,” the fact sheet states.
Information on pricing will be required to be updated at least annually.
CMS is including enforcement tools as part of the proposal, including fines to hospitals for noncompliance.
“Price transparency creates a marketplace where providers compete on the basis of cost and quality that will lower cost,” Ms. Verma said.
However, that notion has been challenged by America’s Health Insurance Plans (AHIP).
Matt Eyles, president and CEO of AHIP said in a statement that “multiple experts, including the Federal Trade Commission, agree that disclosing privately negotiated rates will make it harder to bargain for lower rates, creating a floor, not a ceiling, for the prices that hospitals would be willing to accept. Publicly disclosing competitively negotiated, proprietary rates will push prices and premiums higher, not lower, for consumers, patients, and taxpayers.”
Mr. Pollack of the American Hospital Association agreed. “While we support transparency, [this] proposal misses the mark, exceeds the Administration’s legal authority, and should be abandoned.”
Ms. Verma said she believed the agency had legal authority to impose this requirement and is not worried about possible lawsuits that could challenge this provision.
“This administration is not afraid of those things,” she said. “We are not about protecting the status quo when it doesn’t work for patients.”
A proposal by the Centers for Medicare & Medicaid Services to require full price transparency, including the disclosure of both list prices and payer-negotiated prices, is already receiving pushback.
Rick Pollack, president and CEO of the American Hospital Association, said in a statement that “mandating disclosure of negotiated rates between insurers and hospitals is the wrong approach,” adding that it “could seriously limit the choices available to patients in the private market and fuel anticompetitive behavior among commercial health insurers in an already highly concentrated insurance industry.”
The requirement for hospital price transparency was posted online July 29 as part of the proposed annual update to the hospital outpatient prospective payment system (OPPS) for 2020. It is scheduled for publication in the Federal Register on Aug. 9.
CMS is proposing, beginning in calendar year 2020, that hospitals make publicly available their “standard charges,” defined as the gross – or list – price of for all services provided by the hospital, as well as payer-specific negotiated prices. To allow for price comparisons, prices would be posted on the Internet in a machine-readable file that includes common billing or accounting codes and a description of the item of service being delivered.
Additionally, hospitals must make payer-specific negotiated prices for “shoppable” services, defined as services that can be scheduled in advance – such as x-rays, outpatient visits, imaging and laboratory tests, or bundled services like a cesarean delivery with pre- and postdelivery care – in a consumer-friendly manner.
“As deductibles rise and with 29 million uninsured, patients have the right to know the price of health care services so they can shop around for the best deal,” CMS Administrator Seema Verma said during a July 29 press conference. “In fact, a recent poll showed that the majority of Americans have tried to get pricing information before getting care, but have found it challenging to find that information.”
She noted that patients may see prices that range from 150% of Medicare rates to more than 400% for the same service.
Hospitals will need to display at least 300 shoppable services, including 70 that are CMS selected and 230 that are hospital selected, according to a fact sheet outlining this and other proposed OPPS updates for 2020.
“If a hospital does not provide one or more of the 70 CMS selected shoppable services, the hospital must select additional shoppable services such that the total number of shoppable services is at least 300,” the fact sheet states.
Information on pricing will be required to be updated at least annually.
CMS is including enforcement tools as part of the proposal, including fines to hospitals for noncompliance.
“Price transparency creates a marketplace where providers compete on the basis of cost and quality that will lower cost,” Ms. Verma said.
However, that notion has been challenged by America’s Health Insurance Plans (AHIP).
Matt Eyles, president and CEO of AHIP said in a statement that “multiple experts, including the Federal Trade Commission, agree that disclosing privately negotiated rates will make it harder to bargain for lower rates, creating a floor, not a ceiling, for the prices that hospitals would be willing to accept. Publicly disclosing competitively negotiated, proprietary rates will push prices and premiums higher, not lower, for consumers, patients, and taxpayers.”
Mr. Pollack of the American Hospital Association agreed. “While we support transparency, [this] proposal misses the mark, exceeds the Administration’s legal authority, and should be abandoned.”
Ms. Verma said she believed the agency had legal authority to impose this requirement and is not worried about possible lawsuits that could challenge this provision.
“This administration is not afraid of those things,” she said. “We are not about protecting the status quo when it doesn’t work for patients.”
Key clinical point: CMS proposes complete transparency in hospital prices.
Major finding: Hospitals would be required to make public the list prices, as well as all payer-negotiated prices.
Study details: CMS asserts that the disclosure of pricing data will lead to reduced prices through market competition.
Disclosures: CMS, as issuer of the proposed rule, makes no disclosures.
Source: Proposed rule updating the hospital outpatient prospective payment system for 2020.
Timing, volume of transfusion may not matter in children with severe anemia
Trial results suggest African children with uncomplicated, severe anemia may not require immediate blood transfusion, and the volume of transfusion may only matter in the context of fever.

The TRACT trial showed no significant differences in 28-day mortality or other clinical outcomes between children who received immediate transfusions and those who did not.
Similarly, there was no significant difference in 28-day mortality among children who received transfusions of 20 mL/kg and those who received transfusions of 30 mL/kg. There was evidence to suggest a higher transfusion volume may benefit children without fevers, but this was an exploratory endpoint. The findings were published in the New England Journal of Medicine.
These results suggest “there is no credible reason to transfuse immediately or to transfuse a higher volume of blood, at least in pediatric populations in regions such as these two sub-Saharan countries [Uganda and Malawi],” Julie R. Ingelfinger, MD, of Massachusetts General Hospital in Boston, wrote in an accompanying editorial, also published in the New England Journal of Medicine (2019;381:475-6).
“The possible effect of higher volume transfusion in patients with fever may trigger additional and potentially useful studies,” she added.
Immediate transfusion
One goal of the TRACT trial was to determine if blood transfusion is the best treatment for children with severe anemia. With this in mind, Kathryn Maitland, MD, PhD, of Imperial College London and colleagues evaluated 1,565 Ugandan and Malawian children with uncomplicated, severe anemia. The patients’ median age was 26 months, and 984 (62.9%) had malaria.
The children were randomized to immediate transfusion (n = 778) or no immediate transfusion (n = 787). Children who did not have an immediate transfusion (control group) could receive a transfusion if they exhibited new signs of clinical severity or had their hemoglobin decrease to below 4 g/dL.
All children in the immediate-transfusion group received a transfusion, as did 386 (49.0%) in the control group. The median time to transfusion was 1.3 hours in the immediate group and 24.9 hours in the control group. The mean total blood volume transfused per child was 314 plus or minus 228 mL and 142 plus or minus 224, respectively. The follow-up period was 180 days, and 4.5% of patients (n = 71) were lost to follow-up.
The researchers found no significant difference between the treatment groups with regard to mortality, other clinical outcomes, or the cost of care.
The 28-day mortality rate was 0.9% in the immediate-transfusion group and 1.7% in the control group (hazard ratio, 0.54; 95% confidence interval, 0.22-1.36; P = .19). The 180-day mortality was 4.5% and 6.0%, respectively (HR, 0.75; 95% CI, 0.48-1.15).
Transfusion volume
To assess the effects of transfusion volume, Dr. Maitland and colleagues evaluated 3,196 Ugandan and Malawian children with severe anemia. The median age of the children was 37 months, and 2,050 (64.1%) had malaria.
The children received a transfusion of 30 mL/kg (n = 1,592) or 20 mL/kg (n = 1,596) at a median of 1.2 hours after randomization. Some children – 197 in the 30-mL/kg group and 300 in the 20-mL/kg group – received additional transfusions. The mean volume of total blood transfused per child was 475 plus or minus 385 mL, and 353 plus or minus 348 mL, respectively.
Overall, there was no significant between-group difference with regard to mortality. The 28-day mortality rate was 3.4% in the 30 mL/kg group and 4.5% in the 20 mL/kg group (HR = 0.76; 95% CI, 0.54 to 1.08; P = .12).
However, the 28-day mortality rate did differ according to the presence of fever at screening. The mortality rate was lower in the 30 mL/kg group for children without fevers (HR = 0.43; 95% CI, 0.27 to 0.69) but higher in the 30 mL/kg group for febrile children (HR = 1.91; 95% CI, 1.04 to 3.49).
For other outcomes, including readmissions and serious adverse events, the researchers found no significant between-group differences.
This trial was supported by a grant from the United Kingdom Medical Research Council through a concordat with the Department for International Development. One researcher has a Wellcome Senior Research Fellowship, and another is a National Institute for Health Research Senior Investigator. Dr. Ingelfinger is a deputy editor at the New England Journal of Medicine. No other relevant conflicts of interest were reported.
SOURCES: Maitland K et al. N Engl J Med. 2019;381:407-19. Maitland K et al. N Engl J Med. 2019;381:420-31.
Trial results suggest African children with uncomplicated, severe anemia may not require immediate blood transfusion, and the volume of transfusion may only matter in the context of fever.
The TRACT trial showed no significant differences in 28-day mortality or other clinical outcomes between children who received immediate transfusions and those who did not.
Similarly, there was no significant difference in 28-day mortality among children who received transfusions of 20 mL/kg and those who received transfusions of 30 mL/kg. There was evidence to suggest a higher transfusion volume may benefit children without fevers, but this was an exploratory endpoint. The findings were published in the New England Journal of Medicine.
These results suggest “there is no credible reason to transfuse immediately or to transfuse a higher volume of blood, at least in pediatric populations in regions such as these two sub-Saharan countries [Uganda and Malawi],” Julie R. Ingelfinger, MD, of Massachusetts General Hospital in Boston, wrote in an accompanying editorial, also published in the New England Journal of Medicine (2019;381:475-6).
“The possible effect of higher volume transfusion in patients with fever may trigger additional and potentially useful studies,” she added.
Immediate transfusion
One goal of the TRACT trial was to determine if blood transfusion is the best treatment for children with severe anemia. With this in mind, Kathryn Maitland, MD, PhD, of Imperial College London and colleagues evaluated 1,565 Ugandan and Malawian children with uncomplicated, severe anemia. The patients’ median age was 26 months, and 984 (62.9%) had malaria.
The children were randomized to immediate transfusion (n = 778) or no immediate transfusion (n = 787). Children who did not have an immediate transfusion (control group) could receive a transfusion if they exhibited new signs of clinical severity or had their hemoglobin decrease to below 4 g/dL.
All children in the immediate-transfusion group received a transfusion, as did 386 (49.0%) in the control group. The median time to transfusion was 1.3 hours in the immediate group and 24.9 hours in the control group. The mean total blood volume transfused per child was 314 plus or minus 228 mL and 142 plus or minus 224, respectively. The follow-up period was 180 days, and 4.5% of patients (n = 71) were lost to follow-up.
The researchers found no significant difference between the treatment groups with regard to mortality, other clinical outcomes, or the cost of care.
The 28-day mortality rate was 0.9% in the immediate-transfusion group and 1.7% in the control group (hazard ratio, 0.54; 95% confidence interval, 0.22-1.36; P = .19). The 180-day mortality was 4.5% and 6.0%, respectively (HR, 0.75; 95% CI, 0.48-1.15).
Transfusion volume
To assess the effects of transfusion volume, Dr. Maitland and colleagues evaluated 3,196 Ugandan and Malawian children with severe anemia. The median age of the children was 37 months, and 2,050 (64.1%) had malaria.
The children received a transfusion of 30 mL/kg (n = 1,592) or 20 mL/kg (n = 1,596) at a median of 1.2 hours after randomization. Some children – 197 in the 30-mL/kg group and 300 in the 20-mL/kg group – received additional transfusions. The mean volume of total blood transfused per child was 475 plus or minus 385 mL, and 353 plus or minus 348 mL, respectively.
Overall, there was no significant between-group difference with regard to mortality. The 28-day mortality rate was 3.4% in the 30 mL/kg group and 4.5% in the 20 mL/kg group (HR = 0.76; 95% CI, 0.54 to 1.08; P = .12).
However, the 28-day mortality rate did differ according to the presence of fever at screening. The mortality rate was lower in the 30 mL/kg group for children without fevers (HR = 0.43; 95% CI, 0.27 to 0.69) but higher in the 30 mL/kg group for febrile children (HR = 1.91; 95% CI, 1.04 to 3.49).
For other outcomes, including readmissions and serious adverse events, the researchers found no significant between-group differences.
This trial was supported by a grant from the United Kingdom Medical Research Council through a concordat with the Department for International Development. One researcher has a Wellcome Senior Research Fellowship, and another is a National Institute for Health Research Senior Investigator. Dr. Ingelfinger is a deputy editor at the New England Journal of Medicine. No other relevant conflicts of interest were reported.
SOURCES: Maitland K et al. N Engl J Med. 2019;381:407-19. Maitland K et al. N Engl J Med. 2019;381:420-31.
FROM NEW ENGLAND JOURNAL OF MEDICINE
Key clinical point:
Major finding: The 28-day mortality was 0.9% in patients who had immediate transfusions and 1.7% in those who did not (hazard ratio, 0.54; P = .19). The 28-day mortality rate was 3.4% in patients who received transfusions of 30 mL/kg and 4.5% in those who received transfusions of 20 mL/kg (HR, 0.76; P = .12). However, the mortality rate was lower in the 30-mL/kg group for children without fevers (HR, 0.43) and higher in the 30-mL/kg group for febrile children (HR, 1.91).
Study details: A phase 3 trial of African children with severe anemia who were randomized to immediate transfusion (n = 778) or no immediate transfusion (n = 787) and transfusions of 30 mL/kg (n = 1,592) or 20 mL/kg (n = 1,596)
Disclosures: The trial was supported by a grant from the United Kingdom Medical Research Council through a concordat with the Department for International Development. One researcher has a Wellcome Senior Research Fellowship, and another is a National Institute for Health Research Senior Investigator.
Sources: Maitland K et al. N Engl J Med. 2019;381:407-19. Maitland K et al. N Engl J Med. 2019;381:420-31.