User login
The postgraduate course on liver, pancreas, and biliary tract
The course was framed with the theme, “The Practice of Gastroenterology: The Literature and the Art,” with each speaker highlighting not only the relevant updates in the literature, but also sharing the insights into the art of medical practice. The course incorporated an audience response system to fully utilize the available educational technology and increase participant engagement.

Manal Abdelmalek, MD, provided an update on the hot topic of nonalcoholic fatty liver disease, including new developments in pharmacotherapy. The AGA President-elect, Hashem El-Serag, MD, MPH, AGAF, delivered a state-of-the-art presentation on the burgeoning burden of hepatocellular carcinoma and cutting-edge multidisciplinary management. Vijay Shah, MD, then reminded us of the persistent presence of alcoholic liver disease in the United States and the controversies surrounding liver transplantation in this setting. Steven Flamm, MD, completed the liver session by sharing the secrets of managing the complications of cirrhosis.
The second session, on the pancreas and biliary tract, was headed by Timothy Gardner, MD, who shared the pearls of the management of pancreatitis. Michelle Kim, MD, provided fresh and up-to-date insights on the management of pancreatic and biliary cancer, including updated technological options. Finally, Marcia Canto, MD, discussed the hot topic of pancreatic cancer and whether screening should be instituted. Both of these sessions had designated time set aside for panel discussions with questions from the audience.
This is a summary provided by the moderator of one of the AGA Postgraduate Course sessions held at DDW 2019. Dr. Ahn, MD, MS, MBA, is professor of medicine and director of clinical hepatology at Oregon Health & Science University, Portland. He has no relevant conflicts of interest.
The course was framed with the theme, “The Practice of Gastroenterology: The Literature and the Art,” with each speaker highlighting not only the relevant updates in the literature, but also sharing the insights into the art of medical practice. The course incorporated an audience response system to fully utilize the available educational technology and increase participant engagement.
Manal Abdelmalek, MD, provided an update on the hot topic of nonalcoholic fatty liver disease, including new developments in pharmacotherapy. The AGA President-elect, Hashem El-Serag, MD, MPH, AGAF, delivered a state-of-the-art presentation on the burgeoning burden of hepatocellular carcinoma and cutting-edge multidisciplinary management. Vijay Shah, MD, then reminded us of the persistent presence of alcoholic liver disease in the United States and the controversies surrounding liver transplantation in this setting. Steven Flamm, MD, completed the liver session by sharing the secrets of managing the complications of cirrhosis.
The second session, on the pancreas and biliary tract, was headed by Timothy Gardner, MD, who shared the pearls of the management of pancreatitis. Michelle Kim, MD, provided fresh and up-to-date insights on the management of pancreatic and biliary cancer, including updated technological options. Finally, Marcia Canto, MD, discussed the hot topic of pancreatic cancer and whether screening should be instituted. Both of these sessions had designated time set aside for panel discussions with questions from the audience.
This is a summary provided by the moderator of one of the AGA Postgraduate Course sessions held at DDW 2019. Dr. Ahn, MD, MS, MBA, is professor of medicine and director of clinical hepatology at Oregon Health & Science University, Portland. He has no relevant conflicts of interest.
In newborns, concentrated urine helps rule out UTI
SEATTLE – according to investigators at the University of Texas Health Science Center, Houston.

The researchers found that urine testing negative for nitrites with a specific gravity above 1.015 in children up to 2 months old had a sensitivity of 53% for ruling out UTIs, but that urine with a specific gravity below that mark had a sensitivity of just 14%. The finding “should be taken into account when interpreting nitrite results ... in this high-risk population,” they concluded.
Bacteria in the bladder convert nitrates to nitrites, so positive results are pretty much pathognomonic for UTIs, with a specificity of nearly 100%, according to the researchers.
Negative results, however, don’t reliably rule out infection, and are even less reliable in infants because they urinate frequently, which means they usually flush out bacteria before they have enough time to make the conversion, which takes several hours, they said.
The lead investigator Raymond Parlar-Chun, MD, an assistant professor of pediatrics at the University of Texas McGovern Medical School in Houston, said he had a hunch that negative results might be more reliable when newborns urinate less frequently and have more concentrated urine.
He and his team reviewed data collected on 413 infants up to 2 months old who were admitted for fever workup and treated for UTIs both in the hospital and after discharge. Nitrite results were stratified by urine concentration. A specific gravity of 1.015 was used as the cutoff between concentrated and dilute urine, which was “midway between the parameters reported” in every urinalysis, Dr. Parlar-Chun said.
Although the sensitivity of concentrated urine was only 53%, “it’s a stark difference from” the 14% in dilute urine, he said.“You should take a look at specific gravity to interpret nitrites. If urine is concentrated, you have [more confidence] that you don’t have a UTI if you’re negative. It’s better than taking [nitrites] at face value.”
The subjects were 31 days old, on average, and 62% were boys; 112 had a specific gravity above 1.015, and 301 below.
There was no external funding, and Dr. Parlar-Chun didn’t have any disclosures.
SEATTLE – according to investigators at the University of Texas Health Science Center, Houston.
The researchers found that urine testing negative for nitrites with a specific gravity above 1.015 in children up to 2 months old had a sensitivity of 53% for ruling out UTIs, but that urine with a specific gravity below that mark had a sensitivity of just 14%. The finding “should be taken into account when interpreting nitrite results ... in this high-risk population,” they concluded.
Bacteria in the bladder convert nitrates to nitrites, so positive results are pretty much pathognomonic for UTIs, with a specificity of nearly 100%, according to the researchers.
Negative results, however, don’t reliably rule out infection, and are even less reliable in infants because they urinate frequently, which means they usually flush out bacteria before they have enough time to make the conversion, which takes several hours, they said.
The lead investigator Raymond Parlar-Chun, MD, an assistant professor of pediatrics at the University of Texas McGovern Medical School in Houston, said he had a hunch that negative results might be more reliable when newborns urinate less frequently and have more concentrated urine.
He and his team reviewed data collected on 413 infants up to 2 months old who were admitted for fever workup and treated for UTIs both in the hospital and after discharge. Nitrite results were stratified by urine concentration. A specific gravity of 1.015 was used as the cutoff between concentrated and dilute urine, which was “midway between the parameters reported” in every urinalysis, Dr. Parlar-Chun said.
Although the sensitivity of concentrated urine was only 53%, “it’s a stark difference from” the 14% in dilute urine, he said.“You should take a look at specific gravity to interpret nitrites. If urine is concentrated, you have [more confidence] that you don’t have a UTI if you’re negative. It’s better than taking [nitrites] at face value.”
The subjects were 31 days old, on average, and 62% were boys; 112 had a specific gravity above 1.015, and 301 below.
There was no external funding, and Dr. Parlar-Chun didn’t have any disclosures.
REPORTING FROM PHM 2019

White and black patients have similar rates of giant cell arteritis

To determine the incidence of biopsy-proven GCA (BP-GCA) in a racially diverse cohort, Anna M. Gruener of Nottingham (England) University Hospitals NHS Trust and coauthors analyzed the medical records of more than 10 years of patients who underwent temporal artery biopsy at Johns Hopkins Wilmer Eye Institute in Baltimore. Of the 586 patients in the study, 167 (28.5%) were black, 382 (65.2%) were white, and 37 (6.3%) were other or unknown. The mean age was 70.5 years.
Of the 573 patients who were aged 50 years and older, 92 (16.1%) had a positive biopsy for BP-GCA; 14 were black (8.4% of all black patients), 75 were white (19.6% of all white patients), and 3 were other or unknown. The population-adjusted, age- and sex-standardized incidence rates per 100,000 were 3.1 (95% confidence interval, 1.0-5.2) for black patients and 3.6 (95% CI, 2.5-4.7) for white patients.
Overall, BP-GCA occurred more frequently in women than in men (incidence rate ratio, 1.9; 95% CI, 1.1-3.4; P = .03) but at similar levels in white and black patients (IRR, 1.2; 95% CI, 0.6-2.4; P = .66).
In an accompanying editorial, Michael K. Yoon, MD, and Joseph F. Rizzo III, MD, of Harvard Medical School, Boston, praised the researchers for conducting their study in a population with a large percentage of black patients, a noted weakness of earlier studies in this area (JAMA Ophthalmol. 2019 Aug 8. doi: 10.1001/jamaophthalmol.2019.2933). That said, the two doctors also recognized the limitations of the work done by Gruener et al., including relying on U.S. Census data to calculate adjusted incidence rates instead of local racial distribution and also the potentially problematic choice to count patients with healed arteritis as having BP-GCA.
Still, Dr. Yoon and Dr. Rizzo commended Gruener et al. for questioning previous findings on GCA rates. “Although the authors’ methods are imperfect,” they wrote, “the studies that had previously established a low incidence of GCA in black patients were also flawed in design.”
The study had no outside funding source, and no conflicts of interest were reported.
SOURCE: Gruener AM et al. JAMA Ophthalmol. 2019 Aug 8. doi: 10.1001/jamaophthalmol.2019.2919.
FROM JAMA OPHTHALMOLOGY
PCOS incidence is on the rise, but it remains underdiagnosed and undermanaged
SAN DIEGO – The incidence of polycystic ovary syndrome (PCOS) is on the rise, and a nurse practitioner urged her colleagues to give it full attention because of the danger it poses to patients.
“Underdiagnosed and undermanaged, it’s complex and a more serious condition than ever before because of the complications that can occur,” said R. Mimi Secor, DNP, FNP-BC, FAANP, FAAN, who spoke at the Metabolic & Endocrine Disease Summit by Global Academy for Medical Education.
PCOS is the most common reproductive endocrine disorder in the United States, affecting more than 5 million women, or an estimated 6%-10% of the population. Obesity is a risk factor, although lean women account for 10% of cases for reasons that are not understood, according to Dr. Secor, a senior lecturer at Advanced Practice Education Associates in Onset, Mass. In addition, the condition is linked to many sequelae, including multiple sclerosis, diabetes, cardiovascular disease, infertility, mental health problems, and cancer, she said.
Dr. Secor offered these pearls about PCOS:
- Understand the predictive value of oligomenorrhea (infrequent menstrual periods) as a sign of PCOS. “If you’re working in a low-income clinic, you can do well to make a diagnosis without a lot of expensive tests,” she said.
- Urge women with PCOS to get pregnant early if they want to have children. “Infertility is a big problem [among these women],” she said. “They shouldn’t wait until they’re 35 to have babies. They should have them in their 20s.”
- Use insulin control as a tool. “Insulin stimulates ovarian production of testosterone. If we can manage patients around insulin, that can be very helpful.” Losing just 5% of body weight can make a difference in insulin control, Dr. Secor said. “Go for a small change, and help [the patient] maintain that.”
- Monitor patients carefully for cancer. Women who don’t ovulate regularly on a monthly basis face a higher risk of uterine cancer, compared with women who ovulate monthly, she said, and tumors can develop with few symptoms. “If [there is] one drop of bleeding more than a year after menopause,” you need to get a mandatory workup to make sure the patient doesn’t have uterine cancer. Biopsy remains the “gold standard” as a diagnostic tool, she reminded attendees.
- Watch for mental health conditions, especially anxiety, in patients with PCOS. “They seem to be wired for anxiety, and they need a lot of emotional support,” Dr. Secor said.
- Hormonal contraceptives can be safe and effective as a treatment for PCOS in women who don’t wish to become pregnant, she said. But be aware that combination contraceptive drugs can affect women emotionally.
Global Academy and this news organization are owned by the same parent company. Dr. Secor disclosed speaker relationships with Duchesnay and Osphena.
REPORTING FROM MEDS 2019
Perils of ‘type’-casting: When adult-onset diabetes isn’t what you think it is
SAN DIEGO – We all know about type 1 and type 2 diabetes. But when an adult patient comes in with symptoms suggestive of diabetes, it is never a good idea to assume it’s either one or the other. In fact, said physician assistant Ji Hyun “CJ” Chun, PA-C, MPAS, BC-ADM, there are plenty of other possibilities from cancer, to monogenetic diabetes, to a condition informally known as type 1.5.

“In most cases, it will be type 1 or type 2, but don’t default everything,” Mr. Chun said at the Metabolic & Endocrine Disease Summit by Global Academy for Medical Education.
He offered the following advice on the diagnosis of adult-onset diabetes:
- Don’t forget the 5% ... and the other 5%. In adults, an estimated 90% of cases of diabetes are type 2, but 5% are type 1 and another 5% are secondary to other conditions, said Mr. Chun, who is based at OptumCare Medical Group, Laguna Niguel, Calif., and has served as president of the American Society of Endocrine PAs. In the past, age seemed to be an important tool for diagnosis, because younger patients typically had type 1 diabetes and older patients typically had type 2, he said. But age alone is no longer useful for diagnosis. Cases of type 2 diabetes are much more common in children these days because of the prevalence of obesity in that population, and an estimated 60% of cases of type 1 disease are diagnosed after the age of 20. In fact, patients may develop type 1 into their 30s, 40s, or 50s, he said, depending on the severity of their autoimmunity.
- Keep ‘type 1.5’ in mind. Latent autoimmune diabetes in adults (LADA), also known as type 1.5, is a slowly developing subtype of type 1 diabetes, Mr. Chun said. There is reason to suspect LADA in lean patients, those younger than 50, and those with personal or family histories of autoimmunity, Mr. Chun said.
- Consider monogenetic diabetes. Many conditions can cause secondary diabetes, among them, monogenetic diabetes, which is caused by a single genetic mutation, whereas type 1 and type 2 diabetes are caused by multiple mutations. Monogenetic diabetes causes an estimated 1%-2% of diabetes cases, said Mr. Chun. Research findings have suggested that it is most likely to be misdiagnosed in younger adults, and that patients may go many years without receiving a correct diagnosis. Maturity-onset diabetes of the young (MODY) is a kind of monogenetic diabetes and typically occurs before the age of 25. There are many subtypes, of which one – MODY 2 – requires no treatment at all. In those patients, said Mr. Chun, “you do nothing. You leave them alone.” It is important to keep in mind that the genetic testing for MODY is expensive, Mr Chun cautioned. Some labs charge between $5,000 and $7,000 for panels, so “look for labs that perform cheaper tests,” he advised, adding that he has found a lab that charges just $250.
- Watch out for cancer. There is a long list of other possible causes of secondary diabetes, including Cushing’s syndrome, hyperthyroidism, hemochromatosis (iron overload), and pancreatic cancer. Mr. Chun said he has lost three patients to pancreatic cancer, while two other patients did well. “Keep in mind that these cases aren’t that common, but they’re there.” He suggested that pancreatic cancer should be considered in patients with rapid onset or worsening of diabetes without known cause, abnormal weight loss, abnormal liver/biliary studies, and jaundice.
Global Academy and this news organization are owned by the same parent company. Mr. Chun disclosed that he is on the AstraZeneca speakers bureau and the Sanofi advisory board.
SAN DIEGO – We all know about type 1 and type 2 diabetes. But when an adult patient comes in with symptoms suggestive of diabetes, it is never a good idea to assume it’s either one or the other. In fact, said physician assistant Ji Hyun “CJ” Chun, PA-C, MPAS, BC-ADM, there are plenty of other possibilities from cancer, to monogenetic diabetes, to a condition informally known as type 1.5.
“In most cases, it will be type 1 or type 2, but don’t default everything,” Mr. Chun said at the Metabolic & Endocrine Disease Summit by Global Academy for Medical Education.
He offered the following advice on the diagnosis of adult-onset diabetes:
- Don’t forget the 5% ... and the other 5%. In adults, an estimated 90% of cases of diabetes are type 2, but 5% are type 1 and another 5% are secondary to other conditions, said Mr. Chun, who is based at OptumCare Medical Group, Laguna Niguel, Calif., and has served as president of the American Society of Endocrine PAs. In the past, age seemed to be an important tool for diagnosis, because younger patients typically had type 1 diabetes and older patients typically had type 2, he said. But age alone is no longer useful for diagnosis. Cases of type 2 diabetes are much more common in children these days because of the prevalence of obesity in that population, and an estimated 60% of cases of type 1 disease are diagnosed after the age of 20. In fact, patients may develop type 1 into their 30s, 40s, or 50s, he said, depending on the severity of their autoimmunity.
- Keep ‘type 1.5’ in mind. Latent autoimmune diabetes in adults (LADA), also known as type 1.5, is a slowly developing subtype of type 1 diabetes, Mr. Chun said. There is reason to suspect LADA in lean patients, those younger than 50, and those with personal or family histories of autoimmunity, Mr. Chun said.
- Consider monogenetic diabetes. Many conditions can cause secondary diabetes, among them, monogenetic diabetes, which is caused by a single genetic mutation, whereas type 1 and type 2 diabetes are caused by multiple mutations. Monogenetic diabetes causes an estimated 1%-2% of diabetes cases, said Mr. Chun. Research findings have suggested that it is most likely to be misdiagnosed in younger adults, and that patients may go many years without receiving a correct diagnosis. Maturity-onset diabetes of the young (MODY) is a kind of monogenetic diabetes and typically occurs before the age of 25. There are many subtypes, of which one – MODY 2 – requires no treatment at all. In those patients, said Mr. Chun, “you do nothing. You leave them alone.” It is important to keep in mind that the genetic testing for MODY is expensive, Mr Chun cautioned. Some labs charge between $5,000 and $7,000 for panels, so “look for labs that perform cheaper tests,” he advised, adding that he has found a lab that charges just $250.
- Watch out for cancer. There is a long list of other possible causes of secondary diabetes, including Cushing’s syndrome, hyperthyroidism, hemochromatosis (iron overload), and pancreatic cancer. Mr. Chun said he has lost three patients to pancreatic cancer, while two other patients did well. “Keep in mind that these cases aren’t that common, but they’re there.” He suggested that pancreatic cancer should be considered in patients with rapid onset or worsening of diabetes without known cause, abnormal weight loss, abnormal liver/biliary studies, and jaundice.
Global Academy and this news organization are owned by the same parent company. Mr. Chun disclosed that he is on the AstraZeneca speakers bureau and the Sanofi advisory board.
REPORTING FROM MEDS 2019
Go easy on the testosterone when treating hypogonadism
SAN DIEGO – A physician assistant urged colleagues to cast a skeptical eye on male patients who try to jump on board the testosterone therapy train.
“I see many patients getting onto testosterone without having had an adequate evaluation. And I see many patients who might not need testosterone replacement,” Ji Hyun “CJ” Chun, PA-C, MPAS, BC-ADM, said at the Metabolic & Endocrine Disease Summit by Global Academy for Medical Education.
Mr. Chun, who is based at OptumCare Medical Group, Laguna Niguel, Calif., and has served as president of the American Society of Endocrine PAs, offered this advice on evaluating male patients for testosterone therapy:
- Pinpoint the type of hypogonadism. After hypogonadism has been confirmed with lab tests, additional testing should be done to distinguish primary from secondary hypogonadism. Primary hypogonadism refers to the failure of the testes to properly produce testosterone and sperm and is indicated by elevated levels of LH and FSH. Secondary hypogonadism is caused by failures of the hypothalamus, the pituitary, or both, to stimulate the testes to produce testosterone and sperm. It is indicated by low or low-normal levels of LH and FSH.
- Determine the cause of hypogonadism. Cases of hypogonadism are either organic or functional. Diagnostic guidelines provided by the Endocrine Society are helpful in determining the proper category, Mr. Chun said (J Clin Endocrinol Metab. 2018;103[5]:1715-44). Functional hypogonadism is caused by some medications; opioids; abuse of steroids, alcohol, or marijuana; and obesity, which also greatly increases the risk of secondary hypogonadism. These factors – and functional hypogonadism itself – can conceivably be stopped and/or reversed. This form of hypogonadism tends to be mild, compared with organic or “classic” hypogonadism, which is permanent and caused by factors such as advanced age, some types of chemotherapy, and testicle removal. “Organic male hypogonadism mimics female menopause,” Mr. Chun said, in areas such as rate of hormonal decline, which is typically rapid, and hormone deficiency, which is profound. When it comes to treatment, “the benefits far outweigh the risks in organic hypogonadism. But if [a patient has] late-onset [functional] hypogonadism, it gets more complicated.”
- Late-onset hypogonadism treatment. What should be done for patients who have late-onset, organic hypogonadism? According to Mr. Chun, the data regarding testosterone therapy in this population are mixed. The Food and Drug Administration has approved testosterone therapy only for men with organic hypogonadism, he said, noting that “none of the FDA-approved testosterone products are approved for use in men with low testosterone levels who lack an associated medical condition.” However, the Endocrine Society guidelines are less restrictive. In its 2018 guidelines, the society frowned on testosterone therapy for men younger than 65 years with age-related hypogonadism. As for older men, it said that for those “who have symptoms or conditions suggestive of testosterone deficiency (such as low libido or unexplained anemia) and consistently and unequivocally low morning testosterone concentrations, we suggest that clinicians offer testosterone therapy on an individualized basis after explicit discussion of the potential risks and benefits.”
- Don’t push for high testosterone levels. When treating patients, “you want to restore the testosterone to an adequate level,” Mr. Chun said. “What’s an adequate level? We don’t know.” He urged colleagues to not overdo it and to consider aiming for a testosterone level ranging between 350 ng/dL and 700 ng/dL. “I get [the levels] to the lowest level at which the patient is symptomatically fine.”
Global Academy and this news organization are owned by the same parent company. Mr. Chun disclosed that he is on the AstraZeneca speakers bureau and the Sanofi advisory board.
REPORTING FROM MEDS 2019
NAFLD unchecked is a ‘harbinger of deadly dysmetabolism’
SAN DIEGO – When it comes to metabolic and endocrine health, nonalcoholic fatty liver disease (NAFLD) is the furthest thing from a nonissue – it’s “a harbinger of deadly dysmetabolism,” said Christine Kessler, MN, ANP-BC, CNS, BC-ADM, FAANP, a nurse practitioner and founder of Metabolic Medicine Associates, King George, Va.

“I chase it, I follow it, I worry about it. Never look at it again as a benign thing,” Ms. Kessler said in a presentation at the Metabolic & Endocrine Disease Summit by Global Academy for Medical Education. “It’s the most common chronic liver disease in the United States – move over, hep C ... and it’ll be the number one cause of liver transplant within 20 years.”
But the news isn’t all grim: NAFLD can be reversible, because the liver is one organ that can “take a licking and keep on ticking,” she said.
An estimated 30%-40% of adults in the United States have NAFLD, according to the National Institute of Diabetes and Digestive and Kidney Diseases. The most severe form of the disease, nonalcoholic steatohepatitis (NASH), causes liver cell damage and affects an estimated 3%-12% of adults.
Why worry about NAFLD? Because it can boost cardiovascular risk (especially in conjunction with metabolic syndrome) and the risk for liver cancer, said Ms. Kessler.
Among the risk factors for NAFLD are obesity, type 2 diabetes, metabolic syndrome, polycystic ovary syndrome, and many others, including medications such as methotrexate, corticosteroids, and tetracyclines. Men, and Latino and Asian individuals are especially vulnerable, whereas black individuals may have protection against it.
Researchers are exploring the possibility that NAFLD is a “multihit” condition that is linked to multiple causes, possibly including overgrowth of bacteria in the gut, Ms. Kessler noted. It is not clear, however, whether regulation of gut microbiota would be helpful in preventing the condition.
Ms. Kessler urged her colleagues to consider workups in the following situations: when an incidental finding is noticed during imaging, when liver enzymes are abnormal (although they can misleadingly appear normal), and when there are overt symptoms of liver diseases. Causes such as alcohol use, medications, and hepatitis must first be ruled out, she said, and patients should be referred to a gastroenterologist if NAFLD is confirmed.
In regard to treatment, weight and diet control are crucial because they can have a significant impact in a patient with NAFLD. “You don’t come down with NAFLD, and then NASH, and then cirrhosis,” she explained. “It goes back and forth. You can go from normal liver to fatty liver, and back to normal. We’ve all seen it.”
Reduce weight, blood pressure, and blood sugar, she said, “and you’ll see NASH go to fatty liver, and fatty liver go over to normal. If you can have someone lose between 9% and 10% of their weight, you can turn around NASH. This is huge.”
As for medications, she said, “there is no one drug for fatty liver disease.” No medication has been approved by the Food and Drug Administration for the treatment of NAFLD or NASH, but there are several treatments that seem to be helpful, she said.
They include statins, though not for patients with decompensated cirrhosis, and some of the diabetes drugs – pioglitazone (Actos; to treat steatohepatitis in patients with or without type 2 diabetes who have biopsy-proven NASH); metformin (only in patients with diabetes); and the glucagon-like peptide-1 receptor agonists.
Also included among the therapies are vitamin E 800 IU/day and omega-3 fatty acids for patients who have a high levels of triglycerides, as well as lower-dose vitamin E (600 IU/day) and vitamin C (500 mg/day), which are best when used with lifestyle changes; increased choline intake – which supports liver health in menopausal women – from foods such as eggs; and milk thistle, which helps decrease liver inflammation.
Patients without chronic liver disease may find another helpful preventive tool on the shelves of their local liquor store: red wine, but with moderation, Ms. Kessler cautioned.
Global Academy and this news organization are owned by the same parent company. Ms. Kessler disclosed relationships as an adviser and speaker with Novo Nordisk, and with Clarion Brands.
SAN DIEGO – When it comes to metabolic and endocrine health, nonalcoholic fatty liver disease (NAFLD) is the furthest thing from a nonissue – it’s “a harbinger of deadly dysmetabolism,” said Christine Kessler, MN, ANP-BC, CNS, BC-ADM, FAANP, a nurse practitioner and founder of Metabolic Medicine Associates, King George, Va.
“I chase it, I follow it, I worry about it. Never look at it again as a benign thing,” Ms. Kessler said in a presentation at the Metabolic & Endocrine Disease Summit by Global Academy for Medical Education. “It’s the most common chronic liver disease in the United States – move over, hep C ... and it’ll be the number one cause of liver transplant within 20 years.”
But the news isn’t all grim: NAFLD can be reversible, because the liver is one organ that can “take a licking and keep on ticking,” she said.
An estimated 30%-40% of adults in the United States have NAFLD, according to the National Institute of Diabetes and Digestive and Kidney Diseases. The most severe form of the disease, nonalcoholic steatohepatitis (NASH), causes liver cell damage and affects an estimated 3%-12% of adults.
Why worry about NAFLD? Because it can boost cardiovascular risk (especially in conjunction with metabolic syndrome) and the risk for liver cancer, said Ms. Kessler.
Among the risk factors for NAFLD are obesity, type 2 diabetes, metabolic syndrome, polycystic ovary syndrome, and many others, including medications such as methotrexate, corticosteroids, and tetracyclines. Men, and Latino and Asian individuals are especially vulnerable, whereas black individuals may have protection against it.
Researchers are exploring the possibility that NAFLD is a “multihit” condition that is linked to multiple causes, possibly including overgrowth of bacteria in the gut, Ms. Kessler noted. It is not clear, however, whether regulation of gut microbiota would be helpful in preventing the condition.
Ms. Kessler urged her colleagues to consider workups in the following situations: when an incidental finding is noticed during imaging, when liver enzymes are abnormal (although they can misleadingly appear normal), and when there are overt symptoms of liver diseases. Causes such as alcohol use, medications, and hepatitis must first be ruled out, she said, and patients should be referred to a gastroenterologist if NAFLD is confirmed.
In regard to treatment, weight and diet control are crucial because they can have a significant impact in a patient with NAFLD. “You don’t come down with NAFLD, and then NASH, and then cirrhosis,” she explained. “It goes back and forth. You can go from normal liver to fatty liver, and back to normal. We’ve all seen it.”
Reduce weight, blood pressure, and blood sugar, she said, “and you’ll see NASH go to fatty liver, and fatty liver go over to normal. If you can have someone lose between 9% and 10% of their weight, you can turn around NASH. This is huge.”
As for medications, she said, “there is no one drug for fatty liver disease.” No medication has been approved by the Food and Drug Administration for the treatment of NAFLD or NASH, but there are several treatments that seem to be helpful, she said.
They include statins, though not for patients with decompensated cirrhosis, and some of the diabetes drugs – pioglitazone (Actos; to treat steatohepatitis in patients with or without type 2 diabetes who have biopsy-proven NASH); metformin (only in patients with diabetes); and the glucagon-like peptide-1 receptor agonists.
Also included among the therapies are vitamin E 800 IU/day and omega-3 fatty acids for patients who have a high levels of triglycerides, as well as lower-dose vitamin E (600 IU/day) and vitamin C (500 mg/day), which are best when used with lifestyle changes; increased choline intake – which supports liver health in menopausal women – from foods such as eggs; and milk thistle, which helps decrease liver inflammation.
Patients without chronic liver disease may find another helpful preventive tool on the shelves of their local liquor store: red wine, but with moderation, Ms. Kessler cautioned.
Global Academy and this news organization are owned by the same parent company. Ms. Kessler disclosed relationships as an adviser and speaker with Novo Nordisk, and with Clarion Brands.
EXPERT ANALYSIS FROM MEDS 2019
Treatment Facility: An Important Prognostic Factor for Dedifferentiated Liposarcoma Survival (FULL)
Approximately 17% to 25% of all softtissue sarcomas (STS) are liposarcomas, making liposarcoma the most common type of STS.1 The 2013 World Health Organization (WHO) classification separates liposarcoma into 4 histologic subtypes: atypical lipomatous tumor/well-differentiated (ALT/ WDLPS), dedifferentiated (DDLPS), myxoid, and pleomorphic.2 Each subtype has unique histology, morphology, and natural history. WDLPS and DDLPS are the most common histologic subtypes, comprising approximately 50% of all sarcomas that arise in the retroperitoneum.3 DDLPS represents 18% of all liposarcomas, making it the second most common subtype of liposarcoma.4
In 1979, DDLPS was first characterized.5 Most (90%) cases of DDLPS present de novo, whereas the other 10% transform from preexisting low-grade WDLPS.2 DDLPSs are formed by an amplification of 12q14-15 involving the MDM2 gene.4 These malignancies most commonly present in the retroperitoneum as a large painless mass, consisting of both fatty and nonfatty components.2 Primary site has been previously reported as a major prognostic factor for DDLPSs, with retroperitoneal DDLPSs demonstrating the worst prognosis.6 DDLPSs have a high risk of local recurrence, with some reports estimating recurrence rates approaching 40%.2 Overall mortality at 5 years for DDLPS is estimated to be between 30% and 40%.4
Previous literature has determined that median income, race, health insurance, and facility type are related to survival outcomes for patients with DDLPS.7-9 When comparing the most common types of cancers, residents of poorer US counties consistently had a higher risk of mortality than residents in affluent US counties, and all racial minorities showed worse survival outcomes when compared with white patients.7 Differences in survival outcomes have been reported in patients attending different treatment facilities for other cancers including pancreatic cancers, glioblastomas, and oral cancers, with multiple studies concluding that academic and research programs are associated with the longest survival outcomes.10-12 For many cancers, insurance status has been shown to be a significant prognostic factor, with private insurance typically resulting in the best prognosis.8,9
The goal of this retrospective study was to assess the prognostic effects of socioeconomic variables on the overall survival (OS) probabilities in a large cohort of DDLPS patients in order to inform clinicians about a potentially at-risk population.
Method
The National Cancer Database (NCDB) was created by the Commission on Cancer (CoC) of the American College of Surgeons and the American Cancer Society. The NCDB is the largest cancer database in the US and includes data on almost 70% of US patients with cancer. CoC-accredited cancer programs add data on patients with cancer to the NCDB. The authors accessed the NCDB data through the use of the NCDB Participant Use File program.
Patients’ data from 2004 through 2015 were abstracted. Only patients with the International Classification of Diseases for Oncology histology code 8858, corresponding to DDLPS, were analyzed. Patients with other comorbid malignant tumors were excluded to accurately capture the true survival rates for DDLPS. Variables analyzed included age, sex, race, insurance status, treatment facility type, median household income by zip code, and percentage of adults in the patient’s zip code with no high school (HS) education.
Median survival, 5- and 10-year OS probabilities, and Kaplan-Meier survival curves were calculated for multiple variables, specifically race, insurance status, treatment facility type, median family income, and percentage of adults without a HS degree. Both 5- and 10-year OS probabilities were determined by race with the patients separated into white, African American, Asian, American Indian/Alaska Native (AI/AN), and Asian Indian or Pakistani groups. Our study categorized Chinese, Japanese, Filipino, Hmong, Korean, Vietnamese, Thai, Guamanian, Asian not otherwise specified, and other Asian ethnicity patients together into one collective Asian group. Insurance status was classified into Medicare, Medicaid, other government insurance, and private insurance groups. Other government insurance consisted of US Department of Veterans Affairs, Indian Health Service, Public Health Service, and other government health care programs. Further analysis could not be performed into the distribution of the other government insurance variable.
Facility types were divided into 4 groups: community, comprehensive community, academic/ research, and integrated network cancer treatment facilities. Median income quartiles and the percentage of adults with no high school degree were estimated by comparison of the patient’s zip code with US Census Bureau data. Median household income was separated into 4 groups, including lowest level of household income (< $38,000), low level of household income ($38,000 to $47,999), moderate level of household income ($48,000 to $62,999), and highest level of household income (≥ $63,000). The percentages of adults with no high school degree were divided into 4 groups: lowest level of HS education (≥ 21% ), low level of HS education (13.0% to 20.9%), moderate level of HS education (7.0% to 12.9%), and highest level of HS education (≤ 7%). The 5- and 10-year survival probabilities were calculated using the number of months between the date of diagnosis and the date of death or last known contact.
Continuous variables are presented as median and interquartile range (IQR) whereas categorical variables are presented as frequencies and proportion. IBM SPSS version 25.0 was used to produce Kaplan-Meier survival curves and descriptive statistics. This study used Kaplan- Meier survival tables and log-rank tests to analyze both the 5- and 10-year OS rates for the 5 variables listed above. This study also used a multivariable Cox regression model that accommodated the correlative nature of outcomes within facilities to study the association of the treatment facility type and other socioeconomic factors, while controlling for age, race (which was collapsed into 3 categories), sex, primary site, tumor stage, and treatment approaches. The proportional hazards assumption was individually checked for all pertinent variables. Any patient records that were missing data were excluded from the multivariable Cox regression model, which was analyzed with SAS version 9.4 (Cary, NC). P < 0.05 was used to indicate statistical significance for all analyses.
Results
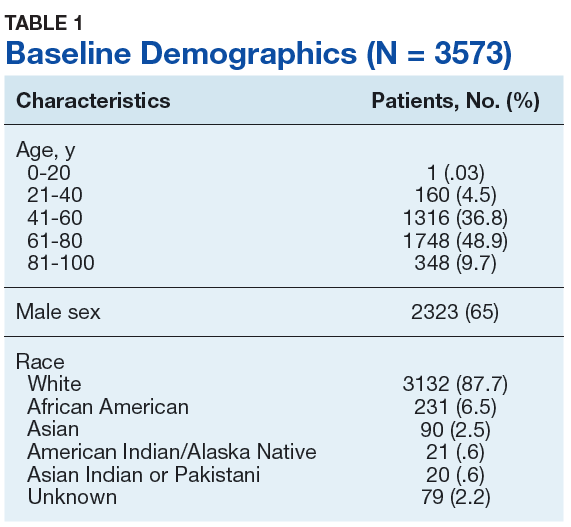
Table 1 provides descriptive analysis for demographic characteristics of the 3573 patients including age, sex, and race. The median age at diagnosis was 64 years. There were 1073 more men (65%) than women (35%) in this analysis. Whites were the predominant racial category, comprising 87.7% of the patient population, followed by African Americans (6.5%) and Asians (2.5%).
Socioeconomic Variables
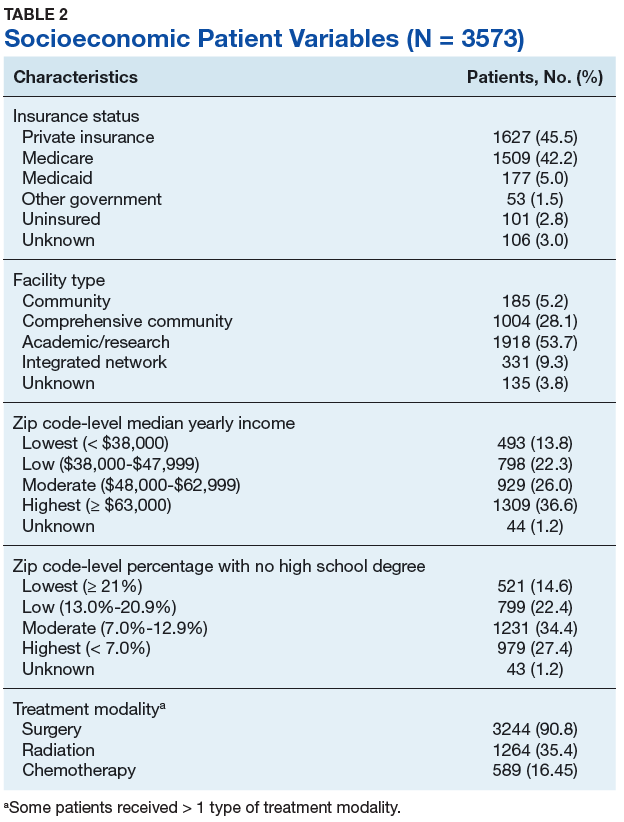
The largest proportion of the patient population (45.5%) had private insurance (Table 2). Medicare came in a close second covering almost 42.2% of the population, followed by Medicaid (5.0%), uninsured (2.8%), and other government insurance (1.5%). About half (53.7%) of the patients were treated at academic or research facilities, while the fewest number of patients (5.2%) underwent treatment at community cancer facilities. The largest percentage (36.6%) of patients lived in zip codes with the highest level of median household income, while 26.0% and 22.3% had moderate and low levels of income, respectively. About 14% of patients lived within an area of the lowest level of income. Similarly, almost 15% of patients lived in an area of lowest level of HS education. The greatest percentage of the patient population (34.5%) lived in a zip code with moderate level of HS education. Surgery was the most common treatment modality with 90.8% of the cohort undergoing surgery, while 35.4% and 16.5% were treated with radiation and chemotherapy, respectively (some patients received more than one type of treatment modality).
Survival Data
Survival data were available for 3112 patients. Kaplan-Meier survival curves were used to analyze OS according to insurance status, racial background, treatment facility type, median family income, and percentage of adults with no high school education. Overall 5- and 10- year OS probabilities were 51.5% and 34.8%, respectively, while the median OS (SD) was 63.57 (2.8) months (Table 3).
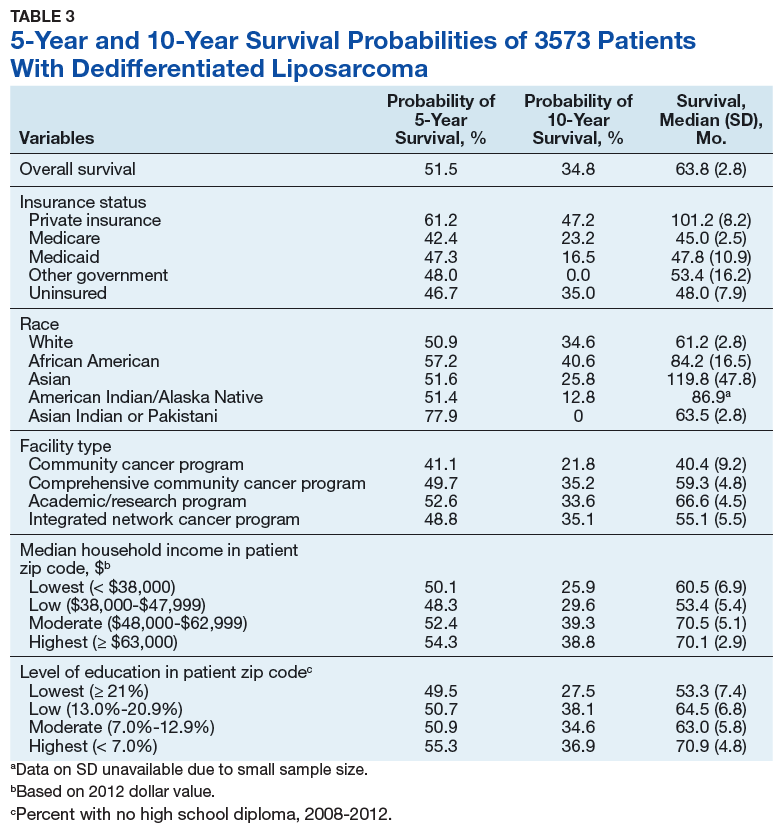
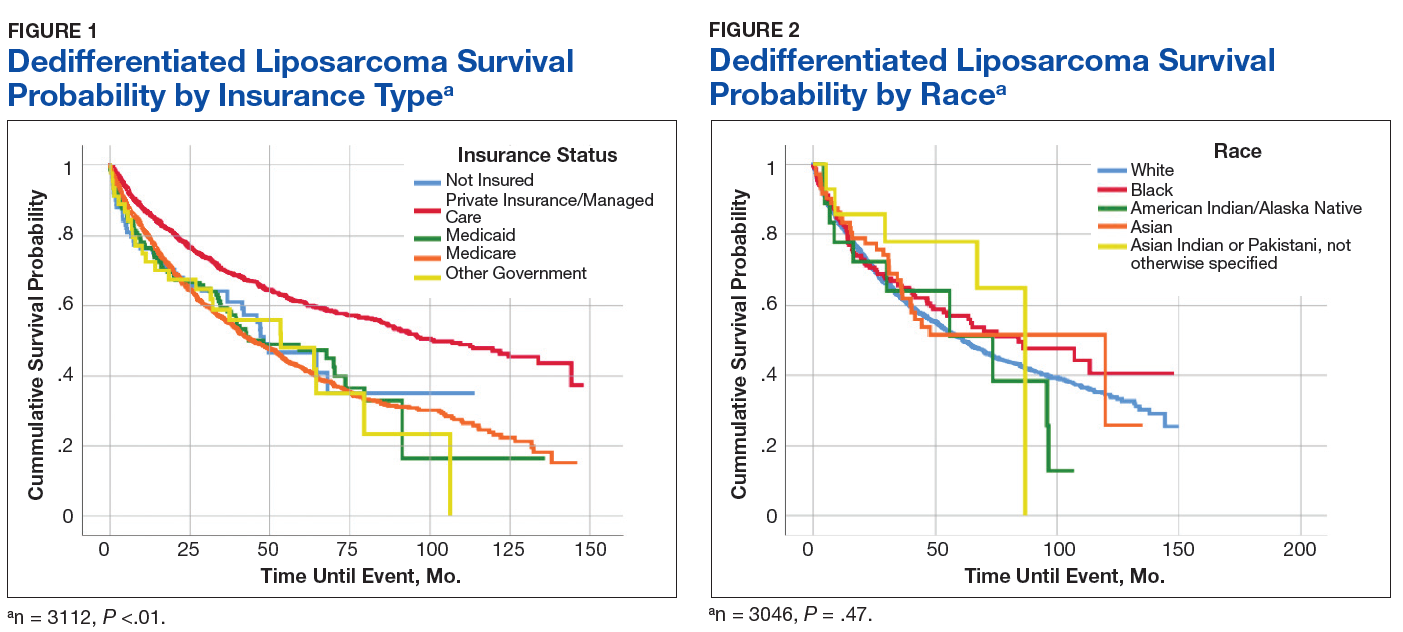
Private insurance showed significantly higher 5- and 10-year OS probabilities and median OS: 5-year OS was 61.2%, 10-year OS was 47.2%, and median survival (SD) was 101.2 (8.2) months compared with that of all other insurance groups (Medicare, Medicaid, other government insurance, and uninsured) (Figure 1). These other insurance types were fairly similar in their 5-year and median OS, but surprisingly, patients with no insurance had the second longest 10-year OS. The difference between the 5-year OS probabilities of private insurance compared with an average of the other insurances was 15.1%, which had almost doubled to 28.5% at 10 years, with a median OS difference of almost 5 years (56 months; data not shown).
Using the Kaplan-Meier survival curve, Asian Indians had the longest 5-year OS probability of 77.9% and African Americans had the longest 10-year OS probability of 40.6%. However, Asians as a group demonstrated the longest median (SD) OS outcome with 119.8 (47.8) months (Figure 2).
Overall, academic/research programs had the longest median OS and 5-year OS probability (SD) of 66.6 (4.5) months and 52.6%, respectively (Figure 3). Comprehensive community cancer programs and integrated network cancer programs had nearly identical 10-year OS rates (35.2% vs 35.1%, respectively). Community cancer programs had the worst 5- and 10-year OS probabilities (41.1% and 21.8%, respectively).
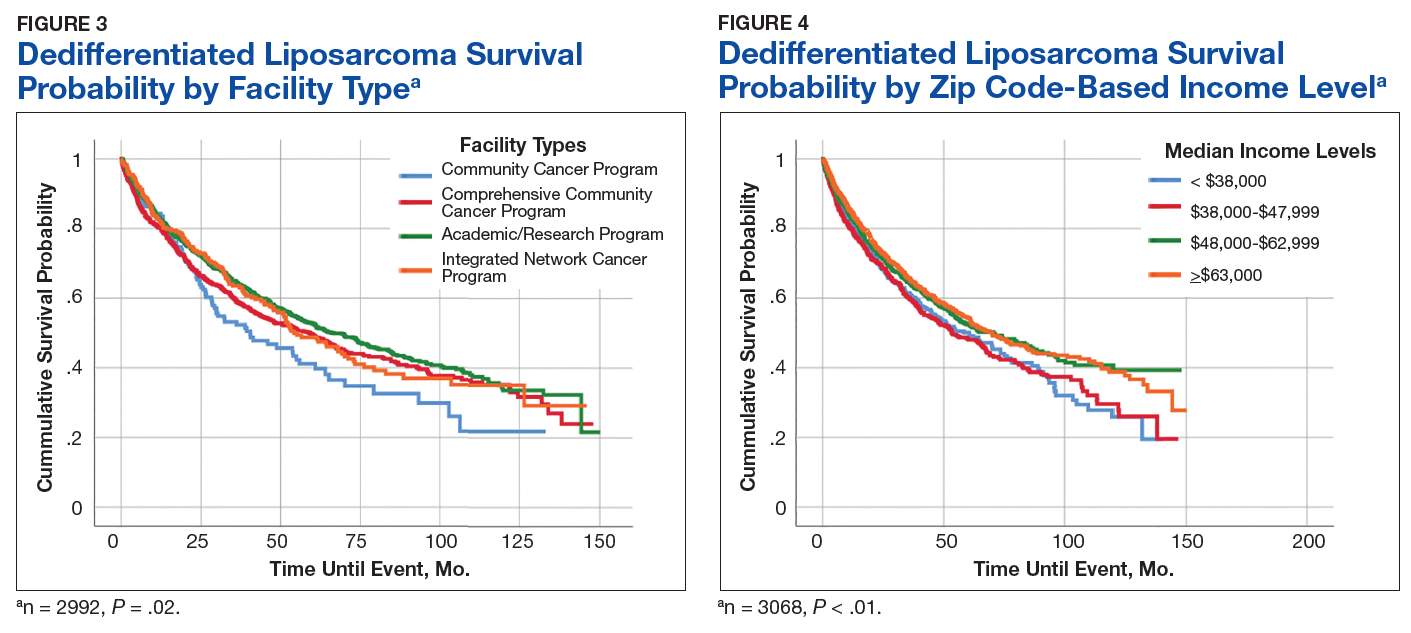
The top 2 income quartiles combined to demonstrate the longest median, 5-year, and 10-year OS probabilities and were very similar. Patients living in a zip code with the highest income level had the longest 5-year OS rates of 54.3%, while patients living in zip codes with a moderate income level had the longest 10-year OS at 39.3% and the longest median OS of about 71 months. Patients with the lowest level of median household income had the worst 5-year OS rates (48.3%) and a median (SD) OS of 53.4 (5.4) months (Figure 4).
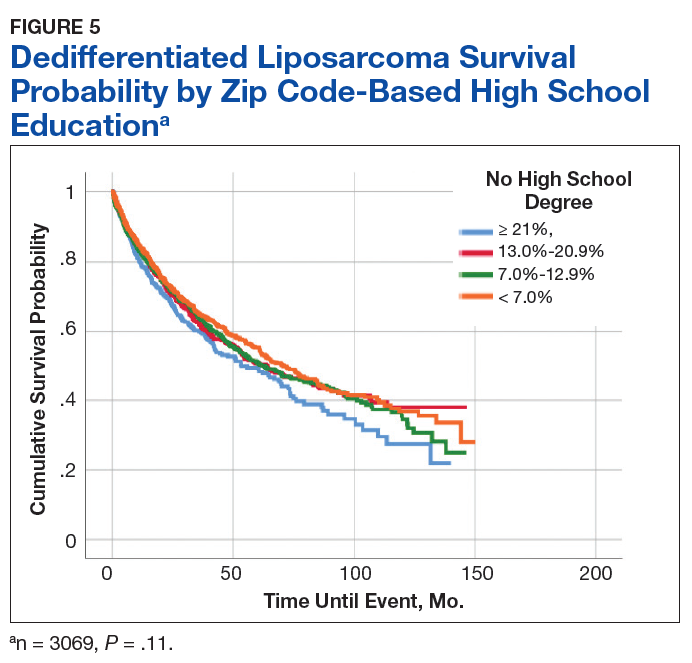
A Kaplan-Meier curve for percentage of adults without a HS degree is displayed in Figure 5. Zip codes with the highest level of education had the longest 5-year OS rates and median (SD) OS of 55.3% and 70.9 (4.8) months, respectively. The longest 10-year OS outcomes at 38.1% were found in patients who lived in areas of low-education levels. The worst 5- and 10- year OS outcomes and median OS were found in the least educated zip codes.
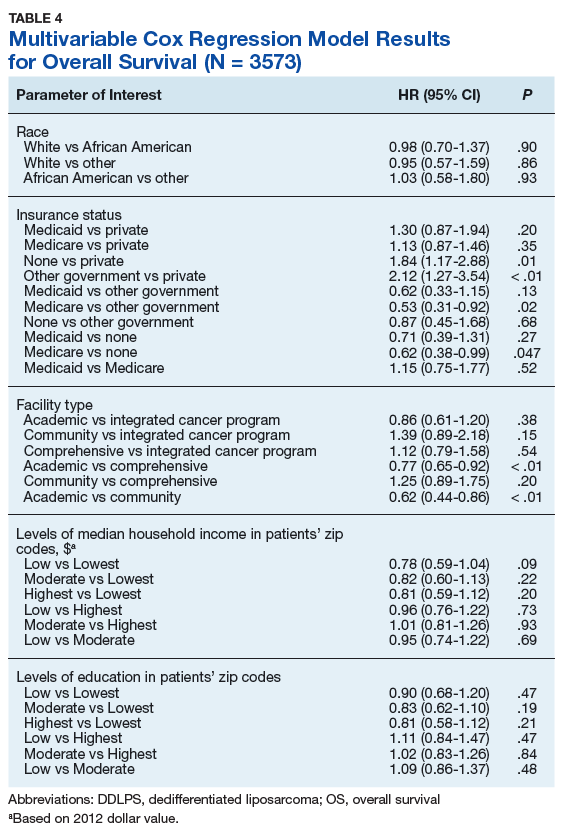
Results from the Cox regression model of OS are displayed in Table 4. Race and ethnicity, zip code-level median household income, and zip code-level education were not associated with OS. Patients with no insurance had an increased risk of death (hazard ratio [HR], 1.84; 95% CI, 1.17-2.88; P < .01) when compared with patients with private insurance. Patients with other government insurance also had an increased risk of death (HR, 2.12; 95% CI, 1.27-3.54; P < .01) when compared with patients with private insurance while controlling for all other variables. Patients with Medicare had a decreased risk of death when compared with patients with other government insurance and no insurance (HR, 0.53; 95% CI, 0.31-0.92; P = .02 and HR, 0.62; 95% CI, 0.38-0.99; P = .05, respectively). Patients treated at academic centers had better OS when compared with patients treated at comprehensive treatment centers (HR, 0.77; 95% CI, 0.65-0.92;P < .01) and community treatment centers (HR, 0.62; 95% CI, 0.44-0.86; P < .01).
Discussion
This study is the largest study to date that specifically studies the type of treatment facilities and socioeconomic factors, including insurance status, race, income, and education, and how they affect survival of DDLPS. The overall 5- and 10-year OS probabilities for DDLPS in this study were 51.5% and 34.8%, respectively, with median OS of 63.6 months. These results were more encouraging than previous reports, which found a 5-year survival probability of 36.5% and a median OS of 45 months.13,14
The largest age grouping was aged 61 to 80 years (48.9% of the cohort), and the median age at diagnosis was 64 years. DDLPSs most typically present between the ages of 50 and 70 years.15 Our cohort was 65% male. Previous studies have indicated that DDLPSs affect the sexes equally; however, another study showed a similar male predominance (68.8%) at the MD Anderson Cancer Center in Houston, Texas.13,16
In our study, approximately 88% of patients were white, 6.5% were African American, and 2.5% were Asian, which differed from a previous study of 84 patients that had a 78.6% white, 4.8% Asian, and 1.2% African American patient population.14
Asian Indian or Pakistani patients had the best 5-year OS probability at 77.9%, followed by African American (57.2%), Asian (51.6%), AI/AN (51.4%), and white patients (50.9%). This trend had disappeared by 10 years and Asian, AI/AN, African American, and Asian Indian or Pakistani groups all demonstrated longer median OS than did white patients. In fact, Asian patients had the longest median OS at 119.8 months, which was almost double that of white patients with the lowest median OS of 61.2 months. This finding is contrary to previous studies, which reported that racial minorities typically had worse OS outcomes when compared with white patients in different types of cancer.7,17 Notably, these findings were not statistically significant in our current study in the log-rank or multivariable analyses.
Private insurance was the most common form of insurance followed in decreasing order by Medicare, Medicaid, uninsured, and other government insurance. About 42% of the cohort had Medicare, which is a federally funded US insurance program designated for patients aged ≥ 65 years and certain younger patients with disabilities.
Patients with private insurance demonstrated the longest OS, essentially twice the median OS of all other insured groups at 101 months. Medicare had the worst 5-year OS probability and median OS of all groups. A previous study of 77 patients with DDLPS reported that patients aged > 65 years had reduced OS.13 Medicare patients in this study were older, with a mean and median age at DDLPS diagnosis of 71 and 72 years, respectively, while private insurance had a mean and median age at diagnosis of 56 and 57 years, respectively. Medicare inherently covers older patients and this age difference could account for the decrease in overall survival.
Improved OS for privately insured patients was most notable compared with the uninsured or patients with other government insurance. Uninsured patients had an 83.7% increased risk of mortality when compared with patients with private insurance. When compared with patients with private insurance, patients with other government insurance had an 111.5% increased risk of mortality. Comparing patients with Medicare vs patients with no insurance or other government insurance, there was a decreased risk of mortality of 38.5% and 46.6%, respectively. This decreased OS in patients with other government insurance could be related to the choice of treatment facility, because only 31% of the patients with other government insurance went to academic or research centers when compared with the 58.4% and 50.8% of patients with private and Medicare insurance treated there (data not shown). Such centers often have access to more advanced technology and protocols that may not be available at other treatment facilities.
A little more than half of the patients in the cohort went to an academic or research center for treatment (53.7%); comprehensive community cancer programs were the second most common treatment facility at 28%. Patients treated at academic or research centers demonstrated the best outcomes with a 5-year OS of 52.6%, followed in decreasing order by comprehensive community cancer programs (49.7%), integrated network cancer programs (48.8%), and community cancer programs (41.1%). In our patient cocohort, patients treated at an academic/research center had slightly decreased 10-year OS rates compared with those patients treated at a comprehensive community cancer program, although the median OS for the academic/research centers were still the highest of all treatment facilities.
Treatment options varied significantly by facility, and the number of patients treated surgically followed a similar trend, with 92% undergoing surgery as the primary treatment at academic or research programs compared with 89% at comprehensive cancer programs and 82.7% at community cancer programs (data not shown). Another potential explaination for differing OS outcomes across facilities is the surgical margin outcome. Surgeries performed at community cancer programs or comprehensive cancer programs resulted with no residual tumor in 36% and 40% of cases, respectively, whereas cases performed at academic or research programs resulted with no residual tumor in 47% of cases (data not shown). Regardless, multivariate analysis demonstrated a marked decrease in the chance of mortality when comparing treatment received at academic facility centers with that received at comprehensive cancer centers (22.9%) and community cancer centers (38.3%) (data not shown).
A recent study demonstrated improved outcomes for patients with retroperitoneal or extremity STS treated at high-volume treatment centers.18 Patients treated at high-volume centers were found to have an 8% decreased risk of death compared with patients treated at low-volume centers. Notably, they found highvolume academic centers demonstrated the strongest improvement in survival, while highvolume community centers showed decreased survival.18 Similarly, we found that patients treated at academic/research institutions had improved 5-year OS and greater median OS than did patients treated at community cancer programs or comprehensive community cancer programs.
The top 2 income quartiles (≥ $48,000) combined to demonstrate the longest median, 5-year, and 10-year OS and were fairly similar between the quartiles. Patients living in zip codes with a median income of $38,000 to $47,999 had the worst 5-year OS and median OS. The log-rank analysis showed statistical evidence of differences in survival associated with income, but within the context of the multivariable analysis, there was no remaining evidence of a difference.
The longest 5-year OS outcomes were seen in patients living in zip codes with the highest level of education (55.3%). However, the difference in OS was not statistically significant using either the log-rank analysis or multivariate analysis.
Limitations
This study has certain inherent limitations in using a retrospective design and a large database such as the NCDB. Many different pathologists at CoC-accredited cancer programs perform the pathology that contributes to the data in the NCDB. There was no pathological review of these findings, which could potentially introduce error into the findings of this study. With the NCDB, potential selection bias is possible because patients in the database are added only from CoC-accredited cancer programs. This risk is minimized because NCDB contains data on most newly diagnosed cancer patients in the US. Further potential risks, which are unable to be controlled for, include potential interobserver error and data that may be incompletely, improperly, or inaccurately recorded from the patients’ charts. Without patient-specific information regarding income and education, it is challenging to utilize zip codes to estimate socioeconomic status and educational level. Even though a patient may live in a zip code identified with specific economic and educational characteristics, that patient may not share those characteristics. Furthermore, patients with Medicare tend to be older than patients with other forms of insurance, which limits the significance of comparisons across insurance groups. A future SEER (Surveillance, Epidemiology, and End Results) program study to confirm this study’s results and the effects of socioeconomic variables on DDLPS would be an excellent followup study.
Conclusion
This study used a large cohort of patients with DDLPS to study the effects of treatment facility, insurance status, and socioeconomic variables on survival outcomes. Although insurance status, median household income, and treatment facility were associated with differences in median OS and 5- and 10-year OS probabilities, evidence for a difference remained for only insurance status and facility type within the context of a multivariable analysis irrespective of age, race, sex, insurance status, education, and median income. Patients with private insurance and Medicaid had a decreased risk of mortality compared with other government insurance and no insurance. Patients receiving treatment at academic research programs had the highest median and 5-year OS of 66.6 months and 52.6%, respectively. Patients receiving treatment at academic centers had improved survival outcomes with a decrease in mortality of 23% and 38% compared to comprehensive or community cancer programs.
1. Dodd LG. Update on liposarcoma: a review for cytopathologists. Diagn Cytopathol. 2012;40(12):1122-1131.
2. Mangham D. World Health Organisation classification of tumours: pathology and genetics of tumours of soft tissue and bone. J Bone Joint Surg Am. 2004;86(3):466.
3. Dalal KM, Kattan MW, Antonescu CR, Brennan MF, Singer S. Subtype specific prognostic nomogram for patients with primary liposarcoma of the retroperitoneum, extremity, or trunk. Ann Surg. 2006;244(3):381-391.
4. Coindre JM, Pédeutour F, Aurias A. Well-differentiated and dedifferentiated liposarcomas. Virchows Arch. 2010;456(2):167-179.
5. Evans HL. Liposarcoma: a study of 55 cases with a reassessment of its classification. Am J Surg Pathol. 1979;3(6):507-523.
6. Henricks WH, Chu YC, Goldblum JR, Weiss SW. Dedifferentiated liposarcoma: a clinicopathological analysis of 155 cases with a proposal for an expanded definition of dedifferentiation. Am J Surg Pathol. 1997;21(3):271-281.
7. Ward E, Jemal A, Cokkinides V, et al. Cancer disparities by race/ethnicity and socioeconomic status. CA Cancer J Clin. 2004;54(2):78-93.
8. Halpern MT, Ward EM, Pavluck AL, Schrag NM, Bian J, Chen AY. Association of insurance status and ethnicity with cancer stage at diagnosis for 12 cancer sites: a retrospective analysis. Lancet Oncol. 2008;9(3):222-231.
9. Niu X, Roche LM, Pawlish KS, Henry KA. Cancer survival disparities by health insurance status. Cancer Med. 2013;2(3):403-411.
10. Hauser A, Dutta SW, Showalter TN, Sheehan JP, Grover S, Trifiletti DM. Impact of academic facility type and volume on post-surgical outcomes following diagnosis of glioblastoma. J Clin Neurosci. 2018;47:103-110.
11. Chu Q, Medeiros K, Zhou M, et al. Effect of facility type on outcome following pancreatectomy for pancreatic adenocarcinoma: analysis of the National Cancer Data Base [Abstract FP26-02]. HPB (Oxford). 2016;18(suppl 1):E81-E82.
12. Rubin SJ, Cohen MB, Kirke DN, Qureshi MM, Truong MT, Jalisi S. Comparison of facility type outcomes for oral cavity cancer: analysis of the National Cancer Database. Laryngoscope. 2017;127(11):2551-2557.
13. Lahat G, Anaya DA, Wang X, Tuvin D, Lev D, Pollock RE. Resectable well-differentiated versus dedifferentiated liposarcomas: two different diseases possibly requiring different treatment approaches. Ann Surg Oncol. 2008;15(6):1585-1593.
14. Livingston JA, Bugano D, Barbo A, et al. Role of chemotherapy in dedifferentiated liposarcoma of the retroperitoneum: defining the benefit and challenges of the standard. Sci Rep. 2017;7(1):11836.
15. Brennan MF, Antonescu CR, Alektiar KM, Maki RG. Management of Soft Tissue Sarcoma. 2nd ed. New York, NY: Springer; 2016.
16. Goldblum JR, Folpe AL, Weiss SW. Enzinger and Weiss’s Soft Tissue Tumors. 6th ed. Philadelphia, PA: Saunders; 2014.
17. White A, Djenaba J, Rim SH, Johnson CJ, Coleman MP, Allemani C. Colon cancer survival in the United States by race and stage (2001‐2009): findings from the CONCORD‐2 study. Cancer. 2017;123 (suppl 24):5014-5036.
18. Murphy JD, Padwal J, Guss ZD, Okamoto K, Sardar R. Impact of hospital volume on patterns of care and outcomes in soft tissue sarcoma [ASCO Abstract e23550]. J Clin Oncol. 2018;36(suppl 15):e23550
Approximately 17% to 25% of all softtissue sarcomas (STS) are liposarcomas, making liposarcoma the most common type of STS.1 The 2013 World Health Organization (WHO) classification separates liposarcoma into 4 histologic subtypes: atypical lipomatous tumor/well-differentiated (ALT/ WDLPS), dedifferentiated (DDLPS), myxoid, and pleomorphic.2 Each subtype has unique histology, morphology, and natural history. WDLPS and DDLPS are the most common histologic subtypes, comprising approximately 50% of all sarcomas that arise in the retroperitoneum.3 DDLPS represents 18% of all liposarcomas, making it the second most common subtype of liposarcoma.4
In 1979, DDLPS was first characterized.5 Most (90%) cases of DDLPS present de novo, whereas the other 10% transform from preexisting low-grade WDLPS.2 DDLPSs are formed by an amplification of 12q14-15 involving the MDM2 gene.4 These malignancies most commonly present in the retroperitoneum as a large painless mass, consisting of both fatty and nonfatty components.2 Primary site has been previously reported as a major prognostic factor for DDLPSs, with retroperitoneal DDLPSs demonstrating the worst prognosis.6 DDLPSs have a high risk of local recurrence, with some reports estimating recurrence rates approaching 40%.2 Overall mortality at 5 years for DDLPS is estimated to be between 30% and 40%.4
Previous literature has determined that median income, race, health insurance, and facility type are related to survival outcomes for patients with DDLPS.7-9 When comparing the most common types of cancers, residents of poorer US counties consistently had a higher risk of mortality than residents in affluent US counties, and all racial minorities showed worse survival outcomes when compared with white patients.7 Differences in survival outcomes have been reported in patients attending different treatment facilities for other cancers including pancreatic cancers, glioblastomas, and oral cancers, with multiple studies concluding that academic and research programs are associated with the longest survival outcomes.10-12 For many cancers, insurance status has been shown to be a significant prognostic factor, with private insurance typically resulting in the best prognosis.8,9
The goal of this retrospective study was to assess the prognostic effects of socioeconomic variables on the overall survival (OS) probabilities in a large cohort of DDLPS patients in order to inform clinicians about a potentially at-risk population.
Method
The National Cancer Database (NCDB) was created by the Commission on Cancer (CoC) of the American College of Surgeons and the American Cancer Society. The NCDB is the largest cancer database in the US and includes data on almost 70% of US patients with cancer. CoC-accredited cancer programs add data on patients with cancer to the NCDB. The authors accessed the NCDB data through the use of the NCDB Participant Use File program.
Patients’ data from 2004 through 2015 were abstracted. Only patients with the International Classification of Diseases for Oncology histology code 8858, corresponding to DDLPS, were analyzed. Patients with other comorbid malignant tumors were excluded to accurately capture the true survival rates for DDLPS. Variables analyzed included age, sex, race, insurance status, treatment facility type, median household income by zip code, and percentage of adults in the patient’s zip code with no high school (HS) education.
Median survival, 5- and 10-year OS probabilities, and Kaplan-Meier survival curves were calculated for multiple variables, specifically race, insurance status, treatment facility type, median family income, and percentage of adults without a HS degree. Both 5- and 10-year OS probabilities were determined by race with the patients separated into white, African American, Asian, American Indian/Alaska Native (AI/AN), and Asian Indian or Pakistani groups. Our study categorized Chinese, Japanese, Filipino, Hmong, Korean, Vietnamese, Thai, Guamanian, Asian not otherwise specified, and other Asian ethnicity patients together into one collective Asian group. Insurance status was classified into Medicare, Medicaid, other government insurance, and private insurance groups. Other government insurance consisted of US Department of Veterans Affairs, Indian Health Service, Public Health Service, and other government health care programs. Further analysis could not be performed into the distribution of the other government insurance variable.
Facility types were divided into 4 groups: community, comprehensive community, academic/ research, and integrated network cancer treatment facilities. Median income quartiles and the percentage of adults with no high school degree were estimated by comparison of the patient’s zip code with US Census Bureau data. Median household income was separated into 4 groups, including lowest level of household income (< $38,000), low level of household income ($38,000 to $47,999), moderate level of household income ($48,000 to $62,999), and highest level of household income (≥ $63,000). The percentages of adults with no high school degree were divided into 4 groups: lowest level of HS education (≥ 21% ), low level of HS education (13.0% to 20.9%), moderate level of HS education (7.0% to 12.9%), and highest level of HS education (≤ 7%). The 5- and 10-year survival probabilities were calculated using the number of months between the date of diagnosis and the date of death or last known contact.
Continuous variables are presented as median and interquartile range (IQR) whereas categorical variables are presented as frequencies and proportion. IBM SPSS version 25.0 was used to produce Kaplan-Meier survival curves and descriptive statistics. This study used Kaplan- Meier survival tables and log-rank tests to analyze both the 5- and 10-year OS rates for the 5 variables listed above. This study also used a multivariable Cox regression model that accommodated the correlative nature of outcomes within facilities to study the association of the treatment facility type and other socioeconomic factors, while controlling for age, race (which was collapsed into 3 categories), sex, primary site, tumor stage, and treatment approaches. The proportional hazards assumption was individually checked for all pertinent variables. Any patient records that were missing data were excluded from the multivariable Cox regression model, which was analyzed with SAS version 9.4 (Cary, NC). P < 0.05 was used to indicate statistical significance for all analyses.
Results
Table 1 provides descriptive analysis for demographic characteristics of the 3573 patients including age, sex, and race. The median age at diagnosis was 64 years. There were 1073 more men (65%) than women (35%) in this analysis. Whites were the predominant racial category, comprising 87.7% of the patient population, followed by African Americans (6.5%) and Asians (2.5%).
Socioeconomic Variables
The largest proportion of the patient population (45.5%) had private insurance (Table 2). Medicare came in a close second covering almost 42.2% of the population, followed by Medicaid (5.0%), uninsured (2.8%), and other government insurance (1.5%). About half (53.7%) of the patients were treated at academic or research facilities, while the fewest number of patients (5.2%) underwent treatment at community cancer facilities. The largest percentage (36.6%) of patients lived in zip codes with the highest level of median household income, while 26.0% and 22.3% had moderate and low levels of income, respectively. About 14% of patients lived within an area of the lowest level of income. Similarly, almost 15% of patients lived in an area of lowest level of HS education. The greatest percentage of the patient population (34.5%) lived in a zip code with moderate level of HS education. Surgery was the most common treatment modality with 90.8% of the cohort undergoing surgery, while 35.4% and 16.5% were treated with radiation and chemotherapy, respectively (some patients received more than one type of treatment modality).
Survival Data
Survival data were available for 3112 patients. Kaplan-Meier survival curves were used to analyze OS according to insurance status, racial background, treatment facility type, median family income, and percentage of adults with no high school education. Overall 5- and 10- year OS probabilities were 51.5% and 34.8%, respectively, while the median OS (SD) was 63.57 (2.8) months (Table 3).
Private insurance showed significantly higher 5- and 10-year OS probabilities and median OS: 5-year OS was 61.2%, 10-year OS was 47.2%, and median survival (SD) was 101.2 (8.2) months compared with that of all other insurance groups (Medicare, Medicaid, other government insurance, and uninsured) (Figure 1). These other insurance types were fairly similar in their 5-year and median OS, but surprisingly, patients with no insurance had the second longest 10-year OS. The difference between the 5-year OS probabilities of private insurance compared with an average of the other insurances was 15.1%, which had almost doubled to 28.5% at 10 years, with a median OS difference of almost 5 years (56 months; data not shown).
Using the Kaplan-Meier survival curve, Asian Indians had the longest 5-year OS probability of 77.9% and African Americans had the longest 10-year OS probability of 40.6%. However, Asians as a group demonstrated the longest median (SD) OS outcome with 119.8 (47.8) months (Figure 2).
Overall, academic/research programs had the longest median OS and 5-year OS probability (SD) of 66.6 (4.5) months and 52.6%, respectively (Figure 3). Comprehensive community cancer programs and integrated network cancer programs had nearly identical 10-year OS rates (35.2% vs 35.1%, respectively). Community cancer programs had the worst 5- and 10-year OS probabilities (41.1% and 21.8%, respectively).
The top 2 income quartiles combined to demonstrate the longest median, 5-year, and 10-year OS probabilities and were very similar. Patients living in a zip code with the highest income level had the longest 5-year OS rates of 54.3%, while patients living in zip codes with a moderate income level had the longest 10-year OS at 39.3% and the longest median OS of about 71 months. Patients with the lowest level of median household income had the worst 5-year OS rates (48.3%) and a median (SD) OS of 53.4 (5.4) months (Figure 4).
A Kaplan-Meier curve for percentage of adults without a HS degree is displayed in Figure 5. Zip codes with the highest level of education had the longest 5-year OS rates and median (SD) OS of 55.3% and 70.9 (4.8) months, respectively. The longest 10-year OS outcomes at 38.1% were found in patients who lived in areas of low-education levels. The worst 5- and 10- year OS outcomes and median OS were found in the least educated zip codes.
Results from the Cox regression model of OS are displayed in Table 4. Race and ethnicity, zip code-level median household income, and zip code-level education were not associated with OS. Patients with no insurance had an increased risk of death (hazard ratio [HR], 1.84; 95% CI, 1.17-2.88; P < .01) when compared with patients with private insurance. Patients with other government insurance also had an increased risk of death (HR, 2.12; 95% CI, 1.27-3.54; P < .01) when compared with patients with private insurance while controlling for all other variables. Patients with Medicare had a decreased risk of death when compared with patients with other government insurance and no insurance (HR, 0.53; 95% CI, 0.31-0.92; P = .02 and HR, 0.62; 95% CI, 0.38-0.99; P = .05, respectively). Patients treated at academic centers had better OS when compared with patients treated at comprehensive treatment centers (HR, 0.77; 95% CI, 0.65-0.92;P < .01) and community treatment centers (HR, 0.62; 95% CI, 0.44-0.86; P < .01).
Discussion
This study is the largest study to date that specifically studies the type of treatment facilities and socioeconomic factors, including insurance status, race, income, and education, and how they affect survival of DDLPS. The overall 5- and 10-year OS probabilities for DDLPS in this study were 51.5% and 34.8%, respectively, with median OS of 63.6 months. These results were more encouraging than previous reports, which found a 5-year survival probability of 36.5% and a median OS of 45 months.13,14
The largest age grouping was aged 61 to 80 years (48.9% of the cohort), and the median age at diagnosis was 64 years. DDLPSs most typically present between the ages of 50 and 70 years.15 Our cohort was 65% male. Previous studies have indicated that DDLPSs affect the sexes equally; however, another study showed a similar male predominance (68.8%) at the MD Anderson Cancer Center in Houston, Texas.13,16
In our study, approximately 88% of patients were white, 6.5% were African American, and 2.5% were Asian, which differed from a previous study of 84 patients that had a 78.6% white, 4.8% Asian, and 1.2% African American patient population.14
Asian Indian or Pakistani patients had the best 5-year OS probability at 77.9%, followed by African American (57.2%), Asian (51.6%), AI/AN (51.4%), and white patients (50.9%). This trend had disappeared by 10 years and Asian, AI/AN, African American, and Asian Indian or Pakistani groups all demonstrated longer median OS than did white patients. In fact, Asian patients had the longest median OS at 119.8 months, which was almost double that of white patients with the lowest median OS of 61.2 months. This finding is contrary to previous studies, which reported that racial minorities typically had worse OS outcomes when compared with white patients in different types of cancer.7,17 Notably, these findings were not statistically significant in our current study in the log-rank or multivariable analyses.
Private insurance was the most common form of insurance followed in decreasing order by Medicare, Medicaid, uninsured, and other government insurance. About 42% of the cohort had Medicare, which is a federally funded US insurance program designated for patients aged ≥ 65 years and certain younger patients with disabilities.
Patients with private insurance demonstrated the longest OS, essentially twice the median OS of all other insured groups at 101 months. Medicare had the worst 5-year OS probability and median OS of all groups. A previous study of 77 patients with DDLPS reported that patients aged > 65 years had reduced OS.13 Medicare patients in this study were older, with a mean and median age at DDLPS diagnosis of 71 and 72 years, respectively, while private insurance had a mean and median age at diagnosis of 56 and 57 years, respectively. Medicare inherently covers older patients and this age difference could account for the decrease in overall survival.
Improved OS for privately insured patients was most notable compared with the uninsured or patients with other government insurance. Uninsured patients had an 83.7% increased risk of mortality when compared with patients with private insurance. When compared with patients with private insurance, patients with other government insurance had an 111.5% increased risk of mortality. Comparing patients with Medicare vs patients with no insurance or other government insurance, there was a decreased risk of mortality of 38.5% and 46.6%, respectively. This decreased OS in patients with other government insurance could be related to the choice of treatment facility, because only 31% of the patients with other government insurance went to academic or research centers when compared with the 58.4% and 50.8% of patients with private and Medicare insurance treated there (data not shown). Such centers often have access to more advanced technology and protocols that may not be available at other treatment facilities.
A little more than half of the patients in the cohort went to an academic or research center for treatment (53.7%); comprehensive community cancer programs were the second most common treatment facility at 28%. Patients treated at academic or research centers demonstrated the best outcomes with a 5-year OS of 52.6%, followed in decreasing order by comprehensive community cancer programs (49.7%), integrated network cancer programs (48.8%), and community cancer programs (41.1%). In our patient cocohort, patients treated at an academic/research center had slightly decreased 10-year OS rates compared with those patients treated at a comprehensive community cancer program, although the median OS for the academic/research centers were still the highest of all treatment facilities.
Treatment options varied significantly by facility, and the number of patients treated surgically followed a similar trend, with 92% undergoing surgery as the primary treatment at academic or research programs compared with 89% at comprehensive cancer programs and 82.7% at community cancer programs (data not shown). Another potential explaination for differing OS outcomes across facilities is the surgical margin outcome. Surgeries performed at community cancer programs or comprehensive cancer programs resulted with no residual tumor in 36% and 40% of cases, respectively, whereas cases performed at academic or research programs resulted with no residual tumor in 47% of cases (data not shown). Regardless, multivariate analysis demonstrated a marked decrease in the chance of mortality when comparing treatment received at academic facility centers with that received at comprehensive cancer centers (22.9%) and community cancer centers (38.3%) (data not shown).
A recent study demonstrated improved outcomes for patients with retroperitoneal or extremity STS treated at high-volume treatment centers.18 Patients treated at high-volume centers were found to have an 8% decreased risk of death compared with patients treated at low-volume centers. Notably, they found highvolume academic centers demonstrated the strongest improvement in survival, while highvolume community centers showed decreased survival.18 Similarly, we found that patients treated at academic/research institutions had improved 5-year OS and greater median OS than did patients treated at community cancer programs or comprehensive community cancer programs.
The top 2 income quartiles (≥ $48,000) combined to demonstrate the longest median, 5-year, and 10-year OS and were fairly similar between the quartiles. Patients living in zip codes with a median income of $38,000 to $47,999 had the worst 5-year OS and median OS. The log-rank analysis showed statistical evidence of differences in survival associated with income, but within the context of the multivariable analysis, there was no remaining evidence of a difference.
The longest 5-year OS outcomes were seen in patients living in zip codes with the highest level of education (55.3%). However, the difference in OS was not statistically significant using either the log-rank analysis or multivariate analysis.
Limitations
This study has certain inherent limitations in using a retrospective design and a large database such as the NCDB. Many different pathologists at CoC-accredited cancer programs perform the pathology that contributes to the data in the NCDB. There was no pathological review of these findings, which could potentially introduce error into the findings of this study. With the NCDB, potential selection bias is possible because patients in the database are added only from CoC-accredited cancer programs. This risk is minimized because NCDB contains data on most newly diagnosed cancer patients in the US. Further potential risks, which are unable to be controlled for, include potential interobserver error and data that may be incompletely, improperly, or inaccurately recorded from the patients’ charts. Without patient-specific information regarding income and education, it is challenging to utilize zip codes to estimate socioeconomic status and educational level. Even though a patient may live in a zip code identified with specific economic and educational characteristics, that patient may not share those characteristics. Furthermore, patients with Medicare tend to be older than patients with other forms of insurance, which limits the significance of comparisons across insurance groups. A future SEER (Surveillance, Epidemiology, and End Results) program study to confirm this study’s results and the effects of socioeconomic variables on DDLPS would be an excellent followup study.
Conclusion
This study used a large cohort of patients with DDLPS to study the effects of treatment facility, insurance status, and socioeconomic variables on survival outcomes. Although insurance status, median household income, and treatment facility were associated with differences in median OS and 5- and 10-year OS probabilities, evidence for a difference remained for only insurance status and facility type within the context of a multivariable analysis irrespective of age, race, sex, insurance status, education, and median income. Patients with private insurance and Medicaid had a decreased risk of mortality compared with other government insurance and no insurance. Patients receiving treatment at academic research programs had the highest median and 5-year OS of 66.6 months and 52.6%, respectively. Patients receiving treatment at academic centers had improved survival outcomes with a decrease in mortality of 23% and 38% compared to comprehensive or community cancer programs.
1. Dodd LG. Update on liposarcoma: a review for cytopathologists. Diagn Cytopathol. 2012;40(12):1122-1131.
2. Mangham D. World Health Organisation classification of tumours: pathology and genetics of tumours of soft tissue and bone. J Bone Joint Surg Am. 2004;86(3):466.
3. Dalal KM, Kattan MW, Antonescu CR, Brennan MF, Singer S. Subtype specific prognostic nomogram for patients with primary liposarcoma of the retroperitoneum, extremity, or trunk. Ann Surg. 2006;244(3):381-391.
4. Coindre JM, Pédeutour F, Aurias A. Well-differentiated and dedifferentiated liposarcomas. Virchows Arch. 2010;456(2):167-179.
5. Evans HL. Liposarcoma: a study of 55 cases with a reassessment of its classification. Am J Surg Pathol. 1979;3(6):507-523.
6. Henricks WH, Chu YC, Goldblum JR, Weiss SW. Dedifferentiated liposarcoma: a clinicopathological analysis of 155 cases with a proposal for an expanded definition of dedifferentiation. Am J Surg Pathol. 1997;21(3):271-281.
7. Ward E, Jemal A, Cokkinides V, et al. Cancer disparities by race/ethnicity and socioeconomic status. CA Cancer J Clin. 2004;54(2):78-93.
8. Halpern MT, Ward EM, Pavluck AL, Schrag NM, Bian J, Chen AY. Association of insurance status and ethnicity with cancer stage at diagnosis for 12 cancer sites: a retrospective analysis. Lancet Oncol. 2008;9(3):222-231.
9. Niu X, Roche LM, Pawlish KS, Henry KA. Cancer survival disparities by health insurance status. Cancer Med. 2013;2(3):403-411.
10. Hauser A, Dutta SW, Showalter TN, Sheehan JP, Grover S, Trifiletti DM. Impact of academic facility type and volume on post-surgical outcomes following diagnosis of glioblastoma. J Clin Neurosci. 2018;47:103-110.
11. Chu Q, Medeiros K, Zhou M, et al. Effect of facility type on outcome following pancreatectomy for pancreatic adenocarcinoma: analysis of the National Cancer Data Base [Abstract FP26-02]. HPB (Oxford). 2016;18(suppl 1):E81-E82.
12. Rubin SJ, Cohen MB, Kirke DN, Qureshi MM, Truong MT, Jalisi S. Comparison of facility type outcomes for oral cavity cancer: analysis of the National Cancer Database. Laryngoscope. 2017;127(11):2551-2557.
13. Lahat G, Anaya DA, Wang X, Tuvin D, Lev D, Pollock RE. Resectable well-differentiated versus dedifferentiated liposarcomas: two different diseases possibly requiring different treatment approaches. Ann Surg Oncol. 2008;15(6):1585-1593.
14. Livingston JA, Bugano D, Barbo A, et al. Role of chemotherapy in dedifferentiated liposarcoma of the retroperitoneum: defining the benefit and challenges of the standard. Sci Rep. 2017;7(1):11836.
15. Brennan MF, Antonescu CR, Alektiar KM, Maki RG. Management of Soft Tissue Sarcoma. 2nd ed. New York, NY: Springer; 2016.
16. Goldblum JR, Folpe AL, Weiss SW. Enzinger and Weiss’s Soft Tissue Tumors. 6th ed. Philadelphia, PA: Saunders; 2014.
17. White A, Djenaba J, Rim SH, Johnson CJ, Coleman MP, Allemani C. Colon cancer survival in the United States by race and stage (2001‐2009): findings from the CONCORD‐2 study. Cancer. 2017;123 (suppl 24):5014-5036.
18. Murphy JD, Padwal J, Guss ZD, Okamoto K, Sardar R. Impact of hospital volume on patterns of care and outcomes in soft tissue sarcoma [ASCO Abstract e23550]. J Clin Oncol. 2018;36(suppl 15):e23550
Undiagnosed COPD may change heart function before heart attacks occur
, data from a clinical trial suggest.
The finding could represent an opportunity for early intervention, Rita Pavasini, MD, wrote in COPD: Journal of Chronic Obstructive Pulmonary Disease.
“Early change of the right ventricular function, as detected by reduced right ventricular strain and reduced fractional area change, is present in [these] patients,” wrote Dr. Pavasini of Azienda Ospedaliero-Universitaria di Ferrara, Cona, Italy. “Further studies are warranted to determine whether these alterations can be reversed or modulated by an early identification and treatment and whether targeting early right ventricular strain reduction results in better clinical outcomes in these comorbid patients.”
Dr. Pavasini and colleagues reported a prespecified subanalysis of the Screening for COPD in ACS Patients (SCAP) trial, which showed that screening patients admitted for acute coronary syndromes with respiratory measures could identify those at risk for undiagnosed COPD. The substudy examined the echocardiographic characteristics of these patients.
SCAP comprised 137 patients who were current or past smokers. At baseline, 29% had a COPD diagnosis. However, most displayed airflow limitation (59% mild, 38% moderate). All underwent transthoracic echocardiogram at baseline and at 6 months.
At baseline, fractional area change (FAC) was already significantly lower in patients with occult COPD than in those without it (38% vs. 44%). Patients with undiagnosed COPD also had significantly reduced right ventricular strain (RVS) (–15 vs. –20).
“Interestingly, the inferior location of myocardial infarction did not influence the results,” the authors said. “Indeed, RVS and FAC did not differ between patients with inferior location of myocardial infarction vs. those without inferior location.”
At 6 months, these differences were unabated. FAC was still significantly lower among those with COPD (37% vs. 46%), and RVS still significantly less (–16 vs. –20). Systolic pulmonary artery pressure (sPAP) was also significantly higher in patients with concomitant COPD (35 vs. 27 mm Hg).
“The early impairment in RVS might reflect the impact of endothelial dysfunction, increased arterial stiffness and inflammation on right heart function, rather than only hypoxia, and even more in a population with mainly mild to moderate COPD,” the team said. “Thus, it is highly probable that sPAP in patients with undiagnosed COPD is mainly determined by concomitant pulmonary disease, which did not differ between acute and chronic phase.”
On the whole, the data suggest that the impairment of right ventricular strain was primarily related to the undiagnosed COPD, and not the cardiovascular event, they said,
“These data are consistent with the observed impairment of RVS and indirectly confirms that undiagnosed COPD determines early changes in the structure and function of the right heart.”
Dr. Pavasini had no relevant financial disclosures.
SOURCE: Pavasini R et al. COPD 2019 Jul 21. doi: 10.1080/15412555.2019.16451059.
FROM COPD: JOURNAL OF CHRONIC OBSTRUCTIVE PULMONARY DISEASE
Beyond sunscreen: Skin cancer preventive agents finding a role
NEW YORK – (KCs) that deserves to be considered for selective use in at-risk patients, according to an update at the American Academy of Dermatology summer meeting.

In providing her perspective on the available options, Rebecca Hartman, MD, MPH, director of melanoma epidemiology at Brigham and Women’s Hospital, Boston, emphasized that the therapies are not interchangeable but deserve to be used selectively according to their relative protection and relative risks.
Of oral agents, she characterized two, nicotinamide and acitretin, as “clinic-ready.” Acitretin is “an oldie but goodie,” but there is an important issue of tolerability. In the published studies, 15%-39% of patients withdrew because of adverse events, according to Dr. Hartman, which suggests the need for a motivated patient.
In addition, acitretin can be esterified into etretinate, a teratogen that can persist as long as 3 years after the drug is discontinued, making this drug contraindicated in women of childbearing potential, she noted.
However, most patients in need of prophylaxis for KCs are older, so teratogenicity is not an issue. In her practice, she offers acitretin to patients who are developing three or more KCs per year, as well as in situations of extensive skin damage in which a course of acitretin might provide some degree of clearing.
“When you are faced with the potential of a large number of biopsies, you could start acitretin to see if lesions can be reduced,” Dr. Hartman said .
Prevention of KCs became somewhat more attractive as a routine practice following publication of a phase 3 trial with nicotinamide. In this study, nicotinamide, an over-the-counter water-soluble form of vitamin B3, was associated with significantly reduced nonmelanoma skin cancers, including KCs and actinic keratoses, relative to placebo (N Engl J Med. 2015 Oct 22;373[17]:1618-26). Importantly, there was no greater risk of adverse events relative to placebo.
When assessed individually, the relative reduction in squamous cell carcinomas (SCCs; P = .05) and basal cell carcinomas (P = .12) fell short of statistical significance, but there was a highly significant 13% reduction in actinic keratoses after 12 months (P less than .001). An increase in SCCs was observed after therapy was stopped, which led Dr. Hartman to conclude that nicotinamide must be used on a “use-it-or-lose-it” basis. However, she does routinely offer this option.
“When do I recommend nicotinamide? Any patient with multiple actinic keratoses who wants to get ahead of the game and wants something that is relative safe,” Dr. Hartman explained. She uses the same dosing employed in the study, which was 500 mg twice daily.
There are other options for chemoprevention of KCs, but they are less attractive.
For example, capecitabine is effective, but tolerability is an even greater issue with this agent than it is for acitretin. According to Dr. Hartman, “we use this therapy very rarely and only in select cases.” As an alternative to the 14 days on and 7 days off schedule used for treatment of cancer, capecitabine is sometimes better tolerated in a 7 day on and 7 day off schedule, she said.
Topical 5-fluorouracil with or without calcipotriol is another chemoprevention option for those who can tolerate a skin reaction that lasts several days, Dr. Hartman said. She cited one study that associated this therapy with a nearly 80% reduction in face and scalp SCC.
Ultimately, she offers 5-fluorouracil with or without calcipotriol to “patients who want an evidence-based chemoprevention,” but she indicated that patients must be motivated to endure the adverse effects.
Many remain unaware of the array of options for chemoprevention of KCs, but Dr. Hartman emphasized that this is an area of active research with new options expected.
“I am really excited about the future direction of chemoprevention in skin cancer,” said Dr. Hartman, citing ongoing work to develop vitamin A, polypodium leucotomas extract, and human papillomavirus vaccine as options.
“If we can stop skin cancer in the first place, avoiding the morbidity and mortality of treatment, we will also hopefully save costs as well,” she commented. So far, essentially all of the strategies for chemoprevention, other than sunscreen, involve KCs, which leaves a large unmet need for better ways to prevent melanoma. However, Dr. Hartman noted that KCs represent the most common type of cancer of any type.
Just days after Dr. Hartman spoke at the meeting, a prospective study of vitamin A that found an inverse association between vitamin A intake and cutaneous SCC risk was, in fact, published in JAMA Dermatology (2019 Jul 31. doi: 10.1001/jamadermatol.2019.1937).
Dr. Hartman reported no financial relationships relevant to her presentation.
NEW YORK – (KCs) that deserves to be considered for selective use in at-risk patients, according to an update at the American Academy of Dermatology summer meeting.
In providing her perspective on the available options, Rebecca Hartman, MD, MPH, director of melanoma epidemiology at Brigham and Women’s Hospital, Boston, emphasized that the therapies are not interchangeable but deserve to be used selectively according to their relative protection and relative risks.
Of oral agents, she characterized two, nicotinamide and acitretin, as “clinic-ready.” Acitretin is “an oldie but goodie,” but there is an important issue of tolerability. In the published studies, 15%-39% of patients withdrew because of adverse events, according to Dr. Hartman, which suggests the need for a motivated patient.
In addition, acitretin can be esterified into etretinate, a teratogen that can persist as long as 3 years after the drug is discontinued, making this drug contraindicated in women of childbearing potential, she noted.
However, most patients in need of prophylaxis for KCs are older, so teratogenicity is not an issue. In her practice, she offers acitretin to patients who are developing three or more KCs per year, as well as in situations of extensive skin damage in which a course of acitretin might provide some degree of clearing.
“When you are faced with the potential of a large number of biopsies, you could start acitretin to see if lesions can be reduced,” Dr. Hartman said .
Prevention of KCs became somewhat more attractive as a routine practice following publication of a phase 3 trial with nicotinamide. In this study, nicotinamide, an over-the-counter water-soluble form of vitamin B3, was associated with significantly reduced nonmelanoma skin cancers, including KCs and actinic keratoses, relative to placebo (N Engl J Med. 2015 Oct 22;373[17]:1618-26). Importantly, there was no greater risk of adverse events relative to placebo.
When assessed individually, the relative reduction in squamous cell carcinomas (SCCs; P = .05) and basal cell carcinomas (P = .12) fell short of statistical significance, but there was a highly significant 13% reduction in actinic keratoses after 12 months (P less than .001). An increase in SCCs was observed after therapy was stopped, which led Dr. Hartman to conclude that nicotinamide must be used on a “use-it-or-lose-it” basis. However, she does routinely offer this option.
“When do I recommend nicotinamide? Any patient with multiple actinic keratoses who wants to get ahead of the game and wants something that is relative safe,” Dr. Hartman explained. She uses the same dosing employed in the study, which was 500 mg twice daily.
There are other options for chemoprevention of KCs, but they are less attractive.
For example, capecitabine is effective, but tolerability is an even greater issue with this agent than it is for acitretin. According to Dr. Hartman, “we use this therapy very rarely and only in select cases.” As an alternative to the 14 days on and 7 days off schedule used for treatment of cancer, capecitabine is sometimes better tolerated in a 7 day on and 7 day off schedule, she said.
Topical 5-fluorouracil with or without calcipotriol is another chemoprevention option for those who can tolerate a skin reaction that lasts several days, Dr. Hartman said. She cited one study that associated this therapy with a nearly 80% reduction in face and scalp SCC.
Ultimately, she offers 5-fluorouracil with or without calcipotriol to “patients who want an evidence-based chemoprevention,” but she indicated that patients must be motivated to endure the adverse effects.
Many remain unaware of the array of options for chemoprevention of KCs, but Dr. Hartman emphasized that this is an area of active research with new options expected.
“I am really excited about the future direction of chemoprevention in skin cancer,” said Dr. Hartman, citing ongoing work to develop vitamin A, polypodium leucotomas extract, and human papillomavirus vaccine as options.
“If we can stop skin cancer in the first place, avoiding the morbidity and mortality of treatment, we will also hopefully save costs as well,” she commented. So far, essentially all of the strategies for chemoprevention, other than sunscreen, involve KCs, which leaves a large unmet need for better ways to prevent melanoma. However, Dr. Hartman noted that KCs represent the most common type of cancer of any type.
Just days after Dr. Hartman spoke at the meeting, a prospective study of vitamin A that found an inverse association between vitamin A intake and cutaneous SCC risk was, in fact, published in JAMA Dermatology (2019 Jul 31. doi: 10.1001/jamadermatol.2019.1937).
Dr. Hartman reported no financial relationships relevant to her presentation.
EXPERT ANALYSIS FROM SUMMER AAD 2019