User login
Evinacumab, novel lipid-lowerer, extends promise in phase 2 results
Treatment with evinacumab, an investigational lipid-lowering drug with a novel mechanism of action, safely led to roughly a halving of LDL cholesterol levels in patients with treatment-refractory hypercholesterolemia in a multicenter, phase 2 study of 272 patients treated for 16 weeks.
The study enrolled patients with either heterozygous familial hypercholesterolemia (FH) (72% of patients), or patients with hypercholesterolemia and clinical evidence of atherosclerotic cardiovascular disease who had failed to reached their recommended level of LDL cholesterol by treatment (when tolerated) with a statin, ezetimibe, and a PCSK9 (proprotein convertase subtilisin/kexin type 9) inhibitor.
Notably, only 8 of the 272 randomized patients entered the study not on treatment with a PCSK9 inhibitor. Despite these background treatments, all enrolled patients were above their goal LDL-cholesterol level, with an average level of 148 mg/dL.
The study’s primary endpoint was the percent change from baseline in LDL cholesterol after 16 weeks compared with placebo among patients treated with subcutaneous drug delivery either weekly or every other week, and among patients treated with intravenous delivery every 4 weeks. Results of the dose-ranging study showed that the highest subcutaneous dosage tested produced a 56% cut in LDL cholesterol, while the highest IV dosage led to a 51% drop, Robert S. Rosenson, MD, said at the virtual scientific sessions of the American Heart Association. Concurrently with his report, the results were published online in the New England Journal of Medicine.
The drug’s safety among 194 patients who received evinacumab was “reassuring,” said Dr. Rosenson, professor of medicine and director of the cardiometabolic disorders unit at Icahn School of Medicine at Mount Sinai in New York. “I see no concerning signals in the safety profile,” he said in an interview, an assessment that other experts shared.
“Safety looks pretty good. I don’t see any major concerns,” said lipidologist and endocrinologist Anne C. Goldberg, MD, professor of medicine at Washington University in St. Louis. The LDL-cholesterol effect shown was “very, very impressive in these hard to treat patients,” added Dr. Goldberg, who was a coinvestigator on the study.
“Nothing stands out” as a safety concern in the new data, agreed Robert H. Eckel, MD, an endocrinologist and lipid specialist at the University of Colorado in Aurora.
Drug’s unique mechanism extends potential benefits
The phase 2 study included dose-ranging assessments of both subcutaneous and intravenous treatment with evinacumab, a fully human monoclonal antibody against angiopoietin-like 3, an enzyme that inhibits two different lipases involved in metabolizing LDL cholesterol and other lipoproteins including triglycerides. When the drug inhibits angiopoietin-like 3, the lipases remain more active and further reduce levels of their target lipoproteins.
“The powerful contribution of this drug is that it works by a pathway independent of the LDL receptor,” said Dr. Rosenson.
By this mechanism evinacumab cut not only LDL cholesterol, but also lowered triglycerides by 53%-62% at the highest dosages, an effect seen as a potential plus. “Prospects are favorable for a drug that not only lowers atherogenic lipoproteins but also lowers triglycerides [TGs]. That’s a distinguishing feature of this treatment,” compared with other agents that lower LDL cholesterol, Dr. Rosenson said. It could make evinacumab especially attractive for treating patients with diabetes, who often have elevated TG levels, he noted. But Dr. Eckel cautioned that a clinical benefit directly linked to TG lowering has not yet been proven.
The drug also cut HDL cholesterol by an average of as much as 31% from baseline, though the consequence of this effect isn’t clear. “I’m not worried about the HDL levels,” said Dr. Goldberg, who noted that changes in HDL cholesterol produced by drug treatment have often not shown discernible effects.
Reaching goals by IV or subcutaneous delivery
Another measure of evinacumab’s efficacy was the percentage of patients who fell below the LDL-cholesterol threshold of 70 mg/dL set by recommendations of the American Heart Association and American College of Cardiology for the highest risk patients, and the less than 55 mg/dL goal set for similar patients by the European Society of Cardiology. Among the subcutaneously-treated patients, 64% achieved the goal of less than 70 mg/dL, and 49% hit the goal of less than 55 mg/dL. Among those who received IV treatment, 71% fell below the 70 mg/dL threshold, and 50% dropped below 55 mg/dL.
The good efficacy shown with subcutaneous dosing is critical, noted Dr. Eckel, as this represents a new dimension for evinacumab that had previously been tested only as an IV agent in patients with homozygous FH (N Engl J Med. 2020 Aug 20;383[8]:711-20).
“Subcutaneous delivery is needed for wide real world use,” Dr. Eckel noted in an interview.
Evinacumab’s role hangs on further studies
The path that evinacumab takes from here into U.S. practice is not yet clear, said Dr. Rosenson. He cited the approval earlier in 2020 of another LDL-lowering drug, bempedoic acid (Nexletol) that received U.S. regulatory approval for a similar patient population after studies that proved only lipid-lowering safety and efficacy, without any clinical-endpoint data. He wondered: “Will the [Food and Drug Administration] require a cardiovascular outcomes trial” for evinacumab?
The growing experience using the PCSK9 inhibitor antibodies to treat hyperlipidemia has made clinicians comfortable with this general approach to lipid management, but if evinacumab never accumulates similar efficacy evidence that may relegate it to the backseat compared with the PCSK9 inhibitors for quite some time, suggested Dr. Goldberg, though she said she’d be willing to prescribe evinacumab to selected patients based on lipid-lowering evidence alone.
By providing an alternative mechanism for lipid lowering, evinacumab can serve as a useful add-on for patients not reaching their LDL-cholesterol goal with more established agents, thereby providing an alternative to LDL apheresis, which now serves as the lipid-lowering therapy of last resort, said both Dr. Rosenson and Dr. Goldberg.
The study was sponsored by Regeneron, the company developing evinacumab. Dr. Rosenson has been a consultant to Regeneron, and has also been a consultant to or received research funding from Amgen, 89Bio, Corvidia, CVS Caremark, Kowa, Novartis, and The Medicines Company. Dr. Goldberg has received research grants, personal fees, and nonfinancial support from Regeneron and Sanofi, research grants from Amarin, Amgen, Ionis/AKCEA, Novartis, and Pfizer, and personal fees from AKCEA, Esperion, Merck and Novartis. Dr. Eckel has been a consultant to KOWA and Novo Nordisk.
AHA 2020
Chronic inflammatory diseases vary widely in CHD risk
Not all chronic systemic inflammatory diseases are equal enhancers of atherosclerotic cardiovascular disease risk, according to a large case-control study.

Current AHA/American College of Cardiology guidelines cite three chronic inflammatory diseases as atherosclerotic cardiovascular disease risk enhancers: rheumatoid arthritis, psoriasis, and HIV infection. But this study of those three diseases, along with three others marked by elevated high sensitivity C-reactive protein (systemic sclerosis, inflammatory bowel disease, and systemic lupus erythematosus [SLE]), showed that chronic inflammatory diseases are not monolithic in terms of their associated risk of incident coronary heart disease (CHD).
Indeed, two of the six inflammatory diseases – psoriasis and inflammatory bowel disease – turned out to be not at all associated with increased cardiovascular risk in the 37,117-patient study. The highest-risk disease was SLE, not specifically mentioned in the guidelines, Arjun Sinha, MD, a cardiology fellow at Northwestern University, Chicago, noted in his presentation at the virtual American Heart Association scientific sessions.
The study included 18,129 patients with one of the six chronic inflammatory diseases and 18,988 matched controls, none with CHD at baseline. All regularly received outpatient care at Northwestern during 2000-2019. There were 1,011 incident CHD events during a median of 3.5 years of follow-up.
In a Cox proportional hazards analysis adjusted for demographics, insurance status, hypertension, diabetes, current smoking, total cholesterol, and estimated glomerular filtration rate, here’s how the chronic inflammatory diseases stacked up in terms of incident CHD and MI risks:
- SLE: hazard ratio for CHD, 2.85; for MI, 4.76.
- Systemic sclerosis: HR for CHD, 2.14; for MI, 3.19.
- HIV: HR for CHD, 1.38; for MI, 1.69.
- Rheumatoid arthritis: HR for CHD, 1.22; for MI, 1.45.
- Psoriasis: no significant increase.
- Inflammatory bowel disease: no significant increase.
In an exploratory analysis, Dr. Sinha and coinvestigators evaluated the risk of incident CHD stratified by disease severity. For lack of standardized disease severity scales, the investigators relied upon tertiles of CD4 T cell count in the HIV group and CRP in the others. The HR for new-onset CHD in the more than 5,000 patients with psoriasis didn’t vary by CRP tertile. However, there was a nonsignificant trend for greater disease severity, as reflected by CRP tertile, to be associated with increased incident CHD risk in the HIV and inflammatory bowel disease groups.
In contrast, patients with rheumatoid arthritis or systemic sclerosis who were in the top CRP tertile had a significantly greater risk of developing CHD than that of controls, with HRs of 2.11 in the rheumatoid arthritis group and 4.59 with systemic sclerosis, although patients in the other two tertiles weren’t at significantly increased risk. But all three tertiles of CRP in patients with SLE were associated with significantly increased CHD risk: 3.17-fold in the lowest tertile of lupus severity, 5.38-fold in the middle tertile, and 4.04-fold in the top tertile for inflammation.
These findings could be used in clinical practice to fine-tune atherosclerotic cardiovascular disease risk assessment based upon chronic inflammatory disease type and severity. That’s information which in turn can help guide the timing and intensity of preventive therapy for patients with each disease type.
But studying the association between chronic systemic inflammatory diseases and CHD risk can be useful in additional ways, according to Dr. Sinha. These inflammatory diseases can serve as models of atherosclerosis that shed light on the non–lipid-related mechanisms involved in cardiovascular disease.
“The gradient in risk may be hypothesis-generating with respect to which specific inflammatory pathways may contribute to CHD,” he explained.
Each of these six chronic inflammatory diseases is characterized by a different form of major immune dysfunction, Dr. Sinha continued. A case in point is SLE, the inflammatory disease associated with the highest risk of CHD and MI. Lupus is characterized by a form of neutrophil dysfunction marked by increased formation and reduced degradation of neutrophil extracellular traps, or NETs, as well as by an increase in autoreactive B cells and dysfunctional CD4+ T helper cells. The increase in NETs of of particular interest because NETs have also been shown to contribute to the development of atherosclerosis, endothelial dysfunction, plaque erosion, and thrombosis.
In another exploratory analysis, Dr. Sinha and coworkers found that SLE patients with a neutrophil count above the median level were twice as likely to develop CHD than were those with a neutrophil count below the median.
A better understanding of the upstream pathways linking NET formation in SLE and atherosclerosis could lead to development of new or repurposed medications that target immune dysfunction in order to curb atherosclerosis, said Dr. Sinha, whose study won the AHA’s Samuel A. Levine Early Career Clinical Investigator Award.
He reported having no financial conflicts regarding his study.
Not all chronic systemic inflammatory diseases are equal enhancers of atherosclerotic cardiovascular disease risk, according to a large case-control study.
Current AHA/American College of Cardiology guidelines cite three chronic inflammatory diseases as atherosclerotic cardiovascular disease risk enhancers: rheumatoid arthritis, psoriasis, and HIV infection. But this study of those three diseases, along with three others marked by elevated high sensitivity C-reactive protein (systemic sclerosis, inflammatory bowel disease, and systemic lupus erythematosus [SLE]), showed that chronic inflammatory diseases are not monolithic in terms of their associated risk of incident coronary heart disease (CHD).
Indeed, two of the six inflammatory diseases – psoriasis and inflammatory bowel disease – turned out to be not at all associated with increased cardiovascular risk in the 37,117-patient study. The highest-risk disease was SLE, not specifically mentioned in the guidelines, Arjun Sinha, MD, a cardiology fellow at Northwestern University, Chicago, noted in his presentation at the virtual American Heart Association scientific sessions.
The study included 18,129 patients with one of the six chronic inflammatory diseases and 18,988 matched controls, none with CHD at baseline. All regularly received outpatient care at Northwestern during 2000-2019. There were 1,011 incident CHD events during a median of 3.5 years of follow-up.
In a Cox proportional hazards analysis adjusted for demographics, insurance status, hypertension, diabetes, current smoking, total cholesterol, and estimated glomerular filtration rate, here’s how the chronic inflammatory diseases stacked up in terms of incident CHD and MI risks:
- SLE: hazard ratio for CHD, 2.85; for MI, 4.76.
- Systemic sclerosis: HR for CHD, 2.14; for MI, 3.19.
- HIV: HR for CHD, 1.38; for MI, 1.69.
- Rheumatoid arthritis: HR for CHD, 1.22; for MI, 1.45.
- Psoriasis: no significant increase.
- Inflammatory bowel disease: no significant increase.
In an exploratory analysis, Dr. Sinha and coinvestigators evaluated the risk of incident CHD stratified by disease severity. For lack of standardized disease severity scales, the investigators relied upon tertiles of CD4 T cell count in the HIV group and CRP in the others. The HR for new-onset CHD in the more than 5,000 patients with psoriasis didn’t vary by CRP tertile. However, there was a nonsignificant trend for greater disease severity, as reflected by CRP tertile, to be associated with increased incident CHD risk in the HIV and inflammatory bowel disease groups.
In contrast, patients with rheumatoid arthritis or systemic sclerosis who were in the top CRP tertile had a significantly greater risk of developing CHD than that of controls, with HRs of 2.11 in the rheumatoid arthritis group and 4.59 with systemic sclerosis, although patients in the other two tertiles weren’t at significantly increased risk. But all three tertiles of CRP in patients with SLE were associated with significantly increased CHD risk: 3.17-fold in the lowest tertile of lupus severity, 5.38-fold in the middle tertile, and 4.04-fold in the top tertile for inflammation.
These findings could be used in clinical practice to fine-tune atherosclerotic cardiovascular disease risk assessment based upon chronic inflammatory disease type and severity. That’s information which in turn can help guide the timing and intensity of preventive therapy for patients with each disease type.
But studying the association between chronic systemic inflammatory diseases and CHD risk can be useful in additional ways, according to Dr. Sinha. These inflammatory diseases can serve as models of atherosclerosis that shed light on the non–lipid-related mechanisms involved in cardiovascular disease.
“The gradient in risk may be hypothesis-generating with respect to which specific inflammatory pathways may contribute to CHD,” he explained.
Each of these six chronic inflammatory diseases is characterized by a different form of major immune dysfunction, Dr. Sinha continued. A case in point is SLE, the inflammatory disease associated with the highest risk of CHD and MI. Lupus is characterized by a form of neutrophil dysfunction marked by increased formation and reduced degradation of neutrophil extracellular traps, or NETs, as well as by an increase in autoreactive B cells and dysfunctional CD4+ T helper cells. The increase in NETs of of particular interest because NETs have also been shown to contribute to the development of atherosclerosis, endothelial dysfunction, plaque erosion, and thrombosis.
In another exploratory analysis, Dr. Sinha and coworkers found that SLE patients with a neutrophil count above the median level were twice as likely to develop CHD than were those with a neutrophil count below the median.
A better understanding of the upstream pathways linking NET formation in SLE and atherosclerosis could lead to development of new or repurposed medications that target immune dysfunction in order to curb atherosclerosis, said Dr. Sinha, whose study won the AHA’s Samuel A. Levine Early Career Clinical Investigator Award.
He reported having no financial conflicts regarding his study.
FROM AHA 2020
SCAPIS: Simple questionnaire can identify silent atherosclerosis
Individuals in the general population with high levels of silent coronary atherosclerosis can be successfully identified with a simple questionnaire that they can complete themselves at home, a new study suggests.
The Swedish CardioPulmonary BioImage Study (SCAPIS) found that 40% of middle-aged adults without known heart disease had evidence of coronary atherosclerosis on coronary CT angiography (CCTA), and 13% had extensive atherosclerotic disease.
The authors found that the screening questionnaire could identify individuals who had extensive coronary atherosclerosis with a reasonably high predictive value.
Initial results from the study were presented today at the virtual American Heart Association (AHA) Scientific Sessions 2020.
“Our study is looking to see if we can estimate how many people in the general population have significant coronary atherosclerosis and therefore could benefit from preventative treatment,” lead author, Göran Bergström, MD, explained to Medscape Medical News.
Bergström, who is professor and lead physician at Sahlgrenska Academy, Gothenburg University, Gothenburg, Sweden, said there are no good data on this as yet. “There are studies of atherosclerosis burden in patients who have had a cardiovascular event, but our study was conducted in a random selection of the middle-aged general population who did not have symptoms of heart disease.”
“Our study also suggests that in future we may be able to identify these people with an online questionnaire, and those that reached a certain score could be referred for an imaging test,” he added.
SCAPIS included more than 30,000 men and women, age 50 to 64 years, who had no history of cardiovascular events or cardiac intervention. They were asked questions about sex, age, lifestyle, smoking, body measurements, cholesterol medication, and blood pressure to predict their risk for coronary artery disease.
Researchers then used CCTA images to examine patients’ arteries for the presence of plaque. More than 25,000 individuals from the original sample were successfully imaged.
Results showed that 40% of the middle-aged population had some coronary atherosclerosis and 5% had severe atherosclerosis, defined as the presence of a stenosis blocking 50% or more of blood flow in one of the coronary arteries.
A second aim of the study was to use data from the questionnaire to develop a prediction model to identify people with widespread atherosclerosis — those with any type of stenosis in four different segments of their coronary arteries, who made up 13% of the population.
The questionnaire included data on 120 different variables. Of these variables, around 100 could be assessed by the patients themselves and another 20 measurements could be performed in the clinic, such as blood pressure and cholesterol levels.
The researchers then used artificial intelligence to assess which variables were associated with widespread atherosclerosis. This had an area under the curve (AUC, a measure of the predictive value) of 0.8.
“An AUC of 1.0 would show a perfect prediction, and a value of 0.5 shows no value. A result of 0.8 shows reasonable predictive potential. This is an encouraging result and suggests this strategy could work,” Bergström said.
“We know silent atherosclerosis is a big problem and causes sudden cardiac events in people who have not shown symptoms,” he said.
The goal is to identify these patients before they have an event and offer them preventive treatments. “At present we try and identify patients at high risk of cardiovascular events by using cholesterol and blood pressure measurements and cardiovascular risk scores such as Framingham. But this is not so effective,” Bergström explained.
“Using imaging such as CCTA, where you can actually see atherosclerotic plaque, could be better for prediction, but we can’t image everyone. So, we wanted to see whether we could narrow down the population who should receive imaging with a detailed questionnaire, and it looks like we can.”
The study found that including clinical measurements such as blood pressure and cholesterol did not add much to the predictive value for identifying people with extensive coronary atherosclerosis, a result that Bergström said was surprising.
Which population to target?
Discussant of the study, Pamela Douglas, MD, professor of research in cardiovascular diseases at Duke University, Durham, North Carolina, congratulated the SCAPIS investigators on creating “a very rich data set for current and future study.”

“The SCAPIS study has already yielded novel data on the prevalence of coronary artery disease in the general population, and will address many critical questions over the long term,” she said.
But Douglas suggested that individuals with extensive coronary atherosclerosis were not the most appropriate target population to identify.
“The rationale for choosing this cutpoint is unclear as clinical risk/mortality is higher in all nonobstructive coronary artery disease, starting at one-vessel involvement,” she noted. “Therefore, effective preventive strategies likely need to start with detection and treatment of patients with even minimal plaque.”
Responding to Medscape Medical News, Bergström said this was a valid argument. “We plan to reanalyze our results with different populations as the target — that is something that we can do in the future.
But targeting everyone with just one coronary plaque is going to identify a large group — it was 40% of the population in our study. This will be too many people in whom to perform confirmatory CCTA imaging. It would be impractical to try and conduct cardiac imaging on that many people.”
Bergström noted that more data are needed on the danger of various levels of coronary atherosclerosis in this population who have not had any symptoms.
“We don’t have this information at present, but we are continuing to follow our population and we will have data on cardiac events in a few years’ time. Then we will know which level of atherosclerosis we need to target. It will probably be somewhere in between the extensive levels we used in this first analysis (which occurred in 13% of people) and the 40% of people who showed just one area of plaque.”
This study is the first report from SCAPIS, a collaborative project between six Swedish universities with the following vision statement: to “reduce the risk of cardiovascular and respiratory diseases for generations to come.”
The SCAPIS project is funded by the Swedish Heart and Lung Foundation. Bergström reports no disclosures.
This article first appeared on Medscape.com.
Individuals in the general population with high levels of silent coronary atherosclerosis can be successfully identified with a simple questionnaire that they can complete themselves at home, a new study suggests.
The Swedish CardioPulmonary BioImage Study (SCAPIS) found that 40% of middle-aged adults without known heart disease had evidence of coronary atherosclerosis on coronary CT angiography (CCTA), and 13% had extensive atherosclerotic disease.
The authors found that the screening questionnaire could identify individuals who had extensive coronary atherosclerosis with a reasonably high predictive value.
Initial results from the study were presented today at the virtual American Heart Association (AHA) Scientific Sessions 2020.
“Our study is looking to see if we can estimate how many people in the general population have significant coronary atherosclerosis and therefore could benefit from preventative treatment,” lead author, Göran Bergström, MD, explained to Medscape Medical News.
Bergström, who is professor and lead physician at Sahlgrenska Academy, Gothenburg University, Gothenburg, Sweden, said there are no good data on this as yet. “There are studies of atherosclerosis burden in patients who have had a cardiovascular event, but our study was conducted in a random selection of the middle-aged general population who did not have symptoms of heart disease.”
“Our study also suggests that in future we may be able to identify these people with an online questionnaire, and those that reached a certain score could be referred for an imaging test,” he added.
SCAPIS included more than 30,000 men and women, age 50 to 64 years, who had no history of cardiovascular events or cardiac intervention. They were asked questions about sex, age, lifestyle, smoking, body measurements, cholesterol medication, and blood pressure to predict their risk for coronary artery disease.
Researchers then used CCTA images to examine patients’ arteries for the presence of plaque. More than 25,000 individuals from the original sample were successfully imaged.
Results showed that 40% of the middle-aged population had some coronary atherosclerosis and 5% had severe atherosclerosis, defined as the presence of a stenosis blocking 50% or more of blood flow in one of the coronary arteries.
A second aim of the study was to use data from the questionnaire to develop a prediction model to identify people with widespread atherosclerosis — those with any type of stenosis in four different segments of their coronary arteries, who made up 13% of the population.
The questionnaire included data on 120 different variables. Of these variables, around 100 could be assessed by the patients themselves and another 20 measurements could be performed in the clinic, such as blood pressure and cholesterol levels.
The researchers then used artificial intelligence to assess which variables were associated with widespread atherosclerosis. This had an area under the curve (AUC, a measure of the predictive value) of 0.8.
“An AUC of 1.0 would show a perfect prediction, and a value of 0.5 shows no value. A result of 0.8 shows reasonable predictive potential. This is an encouraging result and suggests this strategy could work,” Bergström said.
“We know silent atherosclerosis is a big problem and causes sudden cardiac events in people who have not shown symptoms,” he said.
The goal is to identify these patients before they have an event and offer them preventive treatments. “At present we try and identify patients at high risk of cardiovascular events by using cholesterol and blood pressure measurements and cardiovascular risk scores such as Framingham. But this is not so effective,” Bergström explained.
“Using imaging such as CCTA, where you can actually see atherosclerotic plaque, could be better for prediction, but we can’t image everyone. So, we wanted to see whether we could narrow down the population who should receive imaging with a detailed questionnaire, and it looks like we can.”
The study found that including clinical measurements such as blood pressure and cholesterol did not add much to the predictive value for identifying people with extensive coronary atherosclerosis, a result that Bergström said was surprising.
Which population to target?
Discussant of the study, Pamela Douglas, MD, professor of research in cardiovascular diseases at Duke University, Durham, North Carolina, congratulated the SCAPIS investigators on creating “a very rich data set for current and future study.”
“The SCAPIS study has already yielded novel data on the prevalence of coronary artery disease in the general population, and will address many critical questions over the long term,” she said.
But Douglas suggested that individuals with extensive coronary atherosclerosis were not the most appropriate target population to identify.
“The rationale for choosing this cutpoint is unclear as clinical risk/mortality is higher in all nonobstructive coronary artery disease, starting at one-vessel involvement,” she noted. “Therefore, effective preventive strategies likely need to start with detection and treatment of patients with even minimal plaque.”
Responding to Medscape Medical News, Bergström said this was a valid argument. “We plan to reanalyze our results with different populations as the target — that is something that we can do in the future.
But targeting everyone with just one coronary plaque is going to identify a large group — it was 40% of the population in our study. This will be too many people in whom to perform confirmatory CCTA imaging. It would be impractical to try and conduct cardiac imaging on that many people.”
Bergström noted that more data are needed on the danger of various levels of coronary atherosclerosis in this population who have not had any symptoms.
“We don’t have this information at present, but we are continuing to follow our population and we will have data on cardiac events in a few years’ time. Then we will know which level of atherosclerosis we need to target. It will probably be somewhere in between the extensive levels we used in this first analysis (which occurred in 13% of people) and the 40% of people who showed just one area of plaque.”
This study is the first report from SCAPIS, a collaborative project between six Swedish universities with the following vision statement: to “reduce the risk of cardiovascular and respiratory diseases for generations to come.”
The SCAPIS project is funded by the Swedish Heart and Lung Foundation. Bergström reports no disclosures.
This article first appeared on Medscape.com.

Combined OCT, cardiac MRI unravels root cause in most MINOCA
Optical CT (OCT) plus cardiac MRI (CMR) provides a more specific diagnosis in the majority of women presenting with myocardial infarction with nonobstructive coronary arteries (MINOCA).
The multimodal imaging strategy identified the underlying cause of MINOCA in 85% of women in the HARP-MINOCA study. Overall, 64% of women had a true MI and 21% had an alternate nonischemic diagnosis, most commonly myocarditis.

“OCTCMR findings correlated well with OCT culprit lesions, demonstrating that nonobstructive culprit lesions frequently cause MINOCA,” said study author Harmony Reynolds, MD, director of New York University Langone’s Sarah Ross Soter Center for Women’s Cardiovascular Research.
The results were presented at the virtual American Heart Association (AHA) Scientific Sessions 2020 and published simultaneously in Circulation.
MINOCA occurs in up to 15% of patients with MI and is defined as MI meeting the universal definition but with less than 50% stenosis in all major epicardial arteries on angiography and no specific alternate diagnosis to explain the presentation.
It is three times more common in women than in men and also disproportionately affects Black, Hispanic, Maori, and Pacific persons. MINOCA has several causes, leading to uncertainty in diagnostic testing and treatment.
“Different doctors tell patients different messages about MINOCA and may incorrectly say the event wasn’t a heart attack,” Dr. Reynolds said in an earlier press briefing. “I had a patient who was told ‘your arteries are open,’ and they gave her Xanax.”
As part of the Women’s Heart Attack Research Program (HARP), researchers enrolled 301 women with a clinical diagnosis of MI, of whom 170 were diagnosed with MINOCA during angiography and underwent OCT at that time, followed by CMR within 1 week of the acute presentation.
All images were interpreted by an independent core laboratory blinded to results of the other tests and clinical information. The final cohort included 145 women with interpretable OCT images.
Their median age was 60 years, 49.7% were white non-Hispanic, and 97% presented with a provisional diagnosis of non–ST-segment MI. Their median peak troponin level was 0.94 ng/mL.
OCT identified a definite or probable culprit lesion in 46% of women, most commonly atherosclerosis or thrombosis. On multivariable analysis, having a culprit lesion was associated with older age, abnormal angiography findings at the site, and diabetes, but not peak troponin level or severity of angiographic stenosis.
CMR available in 116 women showed evidence of infarction or regional injury in 69%. Multivariate predictors of an abnormal CMR were higher peak troponin and diastolic blood pressure but not an OCT culprit lesion or angiographic stenosis severity.
When the OCT and CMR results were combined, a cause of MINOCA was identified in 84.5% of women. Three-fourths of the causes were ischemic (64% MI) and one-quarter were nonischemic (15% myocarditis, 3% Takotsubo syndrome, and 3% nonischemic cardiomyopathy). In the remaining 15%, no cause of MINOCA was identified.
To emphasize the effect multimodal imaging can have on treatment, Dr. Reynolds highlighted a 44-year-old woman with no risk factors for coronary artery disease who had chest pain in the context of heavy menstrual bleeding, a low hemoglobin level, and peak troponin level of 3.25 ng/mL.
Unexpectedly, imaging revealed a left anterior descending (LAD) plaque rupture in a thin-cap fibroatheroma, causing a small transmural infarction at the terminus of the LAD.
“Without this diagnosis, it’s unlikely she would have received antiplatelet therapy or statins and might have been given a diagnosis of supply/demand mismatch, when the real diagnosis was MI,” Dr. Reynolds observed.
“Finally we can say this is not just crazy women. There is really something going on,” said panelist Roxana Mehran, MD, of the Icahn School of Medicine at Mount Sinai in New York. “You have now told us this is most likely atherosclerosis for pretty much 85% of the cases. So make the diagnosis and, of course, make sure you treat these patients accordingly for risk factor modification, really thinking about a ruptured plaque.”
Combining OCT and MRI may result in a more specific diagnosis and better treatment but also raises costs and logistical considerations.
“Implementation challenges are that not every form of testing is available in every medical center,” Dr. Reynolds said in an interview. “Many centers have cardiac MRI,” whereas “OCT is not currently available at most medical centers where heart attack patients are treated but is available at specialized centers.”
Asked during the session about the use of CT angiography, invited discussant Martha Gulati, MD, president-elect of the American Society for Preventive Cardiology, said, “For me, CT is helpful when I’m not sure if there’s any plaque because the angiogram looked really normal and there was no opportunity to do intracoronary imaging. And sometimes that will help me, in particular, if a patient doesn’t want to take a statin.”
Dr. Gulati pointed out that the European Society of Cardiology MINOCA guidelines recommend OCT and CMR, whereas the 2019 AHA statement on MINOCA, which she coauthored, also recommends OCT and CMR, but almost as one or the other.
“We already said that you should do cardiac MR to try to make a diagnosis, but I think the combination of the two needs to be emphasized when we next draft these guidelines. It really will help,” Dr. Gulati said in an interview.
“But using OCT, particularly, needs to be in the setting of the MI. I don’t think you want to do a procedure again,” she said. “So we really need it to become more widely available because at the time of an MI, you won’t necessarily know that you’re not going to find an obstructive lesion.”
Dr. Gulati pointed out several unanswered questions, including whether the diagnosis was missed in some patients, because OCT of all three vessels was available in only 59%, and how the use of high-sensitivity troponin, which was left up to the individual institution, might affect the usefulness of OCT and CMR.
It’s also unknown whether the mechanism is different for ST-segment elevation MI, as the trial included very few cases, although MINOCA often occurs in this setting. Future OCT/CMR studies will also need to enroll men to determine potential sex differences, if any.
Commenting on the study, B. Hadley Wilson, MD, Sanger Heart & Vascular Institute in Charlotte, N.C., said, “There would need to be further justification of this invasive interventional procedure to be sure that the benefit outweighed the risk of putting a wire and an OCT catheter down patients without any significant angiographic blockage and to assure interventional cardiologists of its value here.”
He pointed out that noninvasive CMR appears helpful in the diagnosis of nearly three-quarters of these patients and perhaps could be done first to direct which of those with an ischemic cause might benefit from invasive OCT at catheterization. This seems most pertinent in patients with a high suspicion of coronary artery disease or recurrent MINOCA.
“Overall, we need to consider the expense, logistics, and small risk of these combined modalities, particularly in everyday practice, before making recommendations,” Dr. Wilson said. “ Since OCT is much less available than intravascular ultrasound, it would require a challenging marketplace paradigm shift to implement this multimodality imaging strategy regionally and locally in the U.S., including the added costs. However, further study to direct the more judicious use of either CMR and/or combined with OCT is warranted in these patients.”
The study was funded by the AHA through a grant from the Go Red for Women Strategically Focused Research Network. Dr. Reynolds reported in-kind donations from Abbott Vascular and Siemens related to the study and nonfinancial support from BioTelemetry outside the study. Dr. Gulati and Dr. Wilson reported having no relevant disclosures.
A version of this article originally appeared on Medscape.com.
Optical CT (OCT) plus cardiac MRI (CMR) provides a more specific diagnosis in the majority of women presenting with myocardial infarction with nonobstructive coronary arteries (MINOCA).
The multimodal imaging strategy identified the underlying cause of MINOCA in 85% of women in the HARP-MINOCA study. Overall, 64% of women had a true MI and 21% had an alternate nonischemic diagnosis, most commonly myocarditis.
“OCTCMR findings correlated well with OCT culprit lesions, demonstrating that nonobstructive culprit lesions frequently cause MINOCA,” said study author Harmony Reynolds, MD, director of New York University Langone’s Sarah Ross Soter Center for Women’s Cardiovascular Research.
The results were presented at the virtual American Heart Association (AHA) Scientific Sessions 2020 and published simultaneously in Circulation.
MINOCA occurs in up to 15% of patients with MI and is defined as MI meeting the universal definition but with less than 50% stenosis in all major epicardial arteries on angiography and no specific alternate diagnosis to explain the presentation.
It is three times more common in women than in men and also disproportionately affects Black, Hispanic, Maori, and Pacific persons. MINOCA has several causes, leading to uncertainty in diagnostic testing and treatment.
“Different doctors tell patients different messages about MINOCA and may incorrectly say the event wasn’t a heart attack,” Dr. Reynolds said in an earlier press briefing. “I had a patient who was told ‘your arteries are open,’ and they gave her Xanax.”
As part of the Women’s Heart Attack Research Program (HARP), researchers enrolled 301 women with a clinical diagnosis of MI, of whom 170 were diagnosed with MINOCA during angiography and underwent OCT at that time, followed by CMR within 1 week of the acute presentation.
All images were interpreted by an independent core laboratory blinded to results of the other tests and clinical information. The final cohort included 145 women with interpretable OCT images.
Their median age was 60 years, 49.7% were white non-Hispanic, and 97% presented with a provisional diagnosis of non–ST-segment MI. Their median peak troponin level was 0.94 ng/mL.
OCT identified a definite or probable culprit lesion in 46% of women, most commonly atherosclerosis or thrombosis. On multivariable analysis, having a culprit lesion was associated with older age, abnormal angiography findings at the site, and diabetes, but not peak troponin level or severity of angiographic stenosis.
CMR available in 116 women showed evidence of infarction or regional injury in 69%. Multivariate predictors of an abnormal CMR were higher peak troponin and diastolic blood pressure but not an OCT culprit lesion or angiographic stenosis severity.
When the OCT and CMR results were combined, a cause of MINOCA was identified in 84.5% of women. Three-fourths of the causes were ischemic (64% MI) and one-quarter were nonischemic (15% myocarditis, 3% Takotsubo syndrome, and 3% nonischemic cardiomyopathy). In the remaining 15%, no cause of MINOCA was identified.
To emphasize the effect multimodal imaging can have on treatment, Dr. Reynolds highlighted a 44-year-old woman with no risk factors for coronary artery disease who had chest pain in the context of heavy menstrual bleeding, a low hemoglobin level, and peak troponin level of 3.25 ng/mL.
Unexpectedly, imaging revealed a left anterior descending (LAD) plaque rupture in a thin-cap fibroatheroma, causing a small transmural infarction at the terminus of the LAD.
“Without this diagnosis, it’s unlikely she would have received antiplatelet therapy or statins and might have been given a diagnosis of supply/demand mismatch, when the real diagnosis was MI,” Dr. Reynolds observed.
“Finally we can say this is not just crazy women. There is really something going on,” said panelist Roxana Mehran, MD, of the Icahn School of Medicine at Mount Sinai in New York. “You have now told us this is most likely atherosclerosis for pretty much 85% of the cases. So make the diagnosis and, of course, make sure you treat these patients accordingly for risk factor modification, really thinking about a ruptured plaque.”
Combining OCT and MRI may result in a more specific diagnosis and better treatment but also raises costs and logistical considerations.
“Implementation challenges are that not every form of testing is available in every medical center,” Dr. Reynolds said in an interview. “Many centers have cardiac MRI,” whereas “OCT is not currently available at most medical centers where heart attack patients are treated but is available at specialized centers.”
Asked during the session about the use of CT angiography, invited discussant Martha Gulati, MD, president-elect of the American Society for Preventive Cardiology, said, “For me, CT is helpful when I’m not sure if there’s any plaque because the angiogram looked really normal and there was no opportunity to do intracoronary imaging. And sometimes that will help me, in particular, if a patient doesn’t want to take a statin.”
Dr. Gulati pointed out that the European Society of Cardiology MINOCA guidelines recommend OCT and CMR, whereas the 2019 AHA statement on MINOCA, which she coauthored, also recommends OCT and CMR, but almost as one or the other.
“We already said that you should do cardiac MR to try to make a diagnosis, but I think the combination of the two needs to be emphasized when we next draft these guidelines. It really will help,” Dr. Gulati said in an interview.
“But using OCT, particularly, needs to be in the setting of the MI. I don’t think you want to do a procedure again,” she said. “So we really need it to become more widely available because at the time of an MI, you won’t necessarily know that you’re not going to find an obstructive lesion.”
Dr. Gulati pointed out several unanswered questions, including whether the diagnosis was missed in some patients, because OCT of all three vessels was available in only 59%, and how the use of high-sensitivity troponin, which was left up to the individual institution, might affect the usefulness of OCT and CMR.
It’s also unknown whether the mechanism is different for ST-segment elevation MI, as the trial included very few cases, although MINOCA often occurs in this setting. Future OCT/CMR studies will also need to enroll men to determine potential sex differences, if any.
Commenting on the study, B. Hadley Wilson, MD, Sanger Heart & Vascular Institute in Charlotte, N.C., said, “There would need to be further justification of this invasive interventional procedure to be sure that the benefit outweighed the risk of putting a wire and an OCT catheter down patients without any significant angiographic blockage and to assure interventional cardiologists of its value here.”
He pointed out that noninvasive CMR appears helpful in the diagnosis of nearly three-quarters of these patients and perhaps could be done first to direct which of those with an ischemic cause might benefit from invasive OCT at catheterization. This seems most pertinent in patients with a high suspicion of coronary artery disease or recurrent MINOCA.
“Overall, we need to consider the expense, logistics, and small risk of these combined modalities, particularly in everyday practice, before making recommendations,” Dr. Wilson said. “ Since OCT is much less available than intravascular ultrasound, it would require a challenging marketplace paradigm shift to implement this multimodality imaging strategy regionally and locally in the U.S., including the added costs. However, further study to direct the more judicious use of either CMR and/or combined with OCT is warranted in these patients.”
The study was funded by the AHA through a grant from the Go Red for Women Strategically Focused Research Network. Dr. Reynolds reported in-kind donations from Abbott Vascular and Siemens related to the study and nonfinancial support from BioTelemetry outside the study. Dr. Gulati and Dr. Wilson reported having no relevant disclosures.
A version of this article originally appeared on Medscape.com.

Omega-3 caps, vitamin D both fail for atrial fib primary prevention: VITAL-Rhythm
Clinical trials of omega-3 fatty acid or vitamin D supplements have followed a long and winding road in search of benefits in cardiovascular (CV) disease, with wildly mixed results. But the journey may be in vain in one of cardiology’s frontier research areas, primary prevention of atrial fibrillation (AF), suggest primary results of the VITAL-Rhythm trial, presented Nov. 13 during the American Heart Association (AHA) Scientific Sessions 2020 virtual meeting.

Neither marine-oil caps nor the vitamin D3 supplements made a difference to risk for incident AF, whether paroxysmal or persistent, over more than 5 years in the study, with more than 25,000 adults in the community. Nor did they seem to cause harm.
“To our knowledge, this is the first large-scale, long-term, randomized placebo-controlled trial to test the effect of any intervention on incident AF,” Christine M. Albert, MD, MPH, Cedars-Sinai Medical Center in Los Angeles, said at a media briefing on VITAL-Rhythm before her formal presentation of the trial during the conference.
Its findings, she said, don’t support the use of marine-oil caps or vitamin D3 for primary prevention of incident AF. “Fortunately, they also do not show any increased risk in atrial fibrillation for patients who are using these supplements for other indications.”
Both agents are widely taken without physician supervision for their perceived benefits, and marine-oil caps in particular – often in special prescription formulations – may be used for reducing elevated triglyceride levels and, based on the results of REDUCE-IT, cutting cardiovascular risk.
“It’s pretty clear that there’s no evidence to suggest that either of these supplements is helpful for preventing atrial fibrillation. And I think that’s clear from the evidence these investigators presented,” said Jonathan P. Piccini, MD, MHS, Duke University, Durham, N.C., who wasn’t part of the study.
“It’s also a little disappointing because atrial fibrillation is such a huge problem, and the inability to identify preventative strategies is a repeated theme,” he said in an interview.
VITAL-Rhythm is an ancillary study within the VITAL trial, which showed no benefit from either supplement regarding risk for incident cancer or CV events, as reported at the AHA sessions 2 years ago. In fact, their effects seem sweepingly negative throughout the trial; in another ancillary study, VITAL-DKD, neither supplement helped preserve renal function over 5 years in patients with type 2 diabetes.
The participants started VITAL without a history of AF, CV disease, or cancer; they were randomly assigned to take about a gram of omega-3 fatty acids, 2000 IU vitamin D3 daily, or their placebos, in a double randomization.
VITAL and its ancillary studies collectively undercut mechanistic theories about how omega-3 fatty acid and vitamin D supplements may affect AF risk, ideas derived from epidemiologic and dietary studies. They were thought perhaps “to have direct antiarrhythmic effects on myocytes through effects on ion channels, electrical remodeling, electrical stabilizing effects, and fluidity of the cell membranes,” observed Renate B. Schnabel, MD, MSc, University Heart Center, Hamburg, Germany, at the briefing. Or such effects might be related to beneficial effects on atherosclerosis, inflammation, or ischemic heart disease, she noted.
Neither idea is likely after VITAL and VITAL-Rhythm, said Dr. Schnabel, who spoke as an invited discussant after Albert’s formal presentation at AHA 2020.
That omega-3 fatty acid supplements may not improve AF incidence or risks has also been evident from many clinical trials and observational studies. Several, including REDUCE-IT, included some evidence for increasing risk for AF with marine-oil supplement intake. That may have happened in VITAL-Rhythm as well.
“While there was no evidence that the omega-3 three fatty acids prevented atrial fibrillation, there was a signal of perhaps more atrial fibrillation in the omega-3 fatty-acids group,” said Dr. Piccini, who directs his center’s electrophysiology clinical trials program.
A sensitivity analysis limited to participants who adhered to their assigned regimens, as opposed to the main intention-to-treat (ITT) analysis, showed a nonsignificant 13% increased hazard ratio for incident AF for the marine-oil supplement group. It reached a P value of .09, which can be interpreted as a trend.
“There are a few studies that have now showed a trend or an increased incidence of arrhythmia in patients treated with omega-3 fatty acids,” Dr. Piccini noted. “I don’t think it’s definitive, but it’s certainly something to keep an eye on.”
VITAL-Rhythm included an electrocardiography (ECG) substudy, yet to be reported, that should yield more insights about any such effects of marine-oil or vitamin D supplements in the trial, Dr. Albert said at the briefing.
The ancillary study assigned its 25,119 patients (mean age, 67 years; 51% women) to take vitamin D3 at 2000 IU/day, marine-oil supplements containing omega-3 fatty acids at 840 mg per day – 460 mg eicosapentaenoic acid (EPA) plus 380 mg docosahexaenoic acid (DHA) (Omacor, Pronova BioPharma) – or their placebos in a 2 x 2 randomization.
Incident cases of AF were identified through annual questionnaires in which the participants self-reported whether they had received a physician diagnosis of the arrhythmia, supplemented by Centers for Medicare & Medicaid Services claims data for AF hospital and clinical visits. Those led to a review of inpatient and outpatient records, from which AF events were adjudicated by an endpoint committee.
An electrocardiogram (72.9%) or physician’s report (27.1%) confirmed the AF diagnosis as the protocol required.
By those standards, 900 incident cases were identified, for a rate of 3.6% over a median of 5.3 years. They were paroxysmal in 58.4%, persistent in 38.4%, and indeterminant in 3.1%, Dr. Albert reported.
Of the 12,542 patients assigned to marine-oil caps by ITT, 469 (3.74%) developed incident AF in the ITT analysis, compared to 431 of 12,577 (3.43%) who received placebo, for an adjusted hazard ratio (HR) of 1.09 (95% CI, 0.96-1.24; P = .19).
The results were similar in two sensitivity analyses, one of which omitted patients with AF who may have had symptoms before randomization and another excluding those whose incident AF was identified solely in CMS data. But in the third “on treatment” sensitivity analysis, the HR for events was 1.13 (95% CI, 0.98-1.30; P = .09).
Outcomes for the vitamin D randomization were nearly the same, for an HR of 1.09 (95% CI, 0.96-1.25; P = .19) by ITT; the results were similar in all three sensitivity analyses.
“It’s not a tremendous signal of risk,” said Piccini of the marine-oil on-treatment analysis. But it, along with consistent evidence from other studies, does give him pause. “If a patient came to me and said,
Doctor, I want to take omega-3 fish oil, because I want to reduce my risk of events, as an arrhythmia doctor I would say, ‘We don’t have great evidence to do that for preventing atrial fibrillation. And there’s actually some evidence that it could mildly increase your risk of developing it.’ ”
For those prescribed evidence-based marine-oil therapy for other indications, he said, “I think the take-home message certainly is, if they report palpitations or other signs or symptoms that could be due to atrial fibrillation, we should be aggressive about screening for atrial fibrillation,” and making the diagnosis as appropriate. If the incident AF resolves after stopping the treatment, “maybe it’s reasonable to refrain from prescribing the medication for that patient.”
VITAL-Rhythm and VITAL are supported by multiple grants from the National Institutes of Health. Albert discloses receiving grant support from St. Jude Medical, Abbott, and Roche. Schnabel reports receiving honoraria from Bristol-Myers Squibb/Pfizer. Piccini previously disclosed receiving research grants from Abbott, the Association for the Advancement of Medical Instrumentation, Bayer, Boston Scientific, and Philips and serving as a consultant to Abbott, Allergan, ARCA Biopharma, Biotronik, Boston Scientific, LivaNova, Medtronic, Milestone, Sanofi, Philips, and UptoDate.
A version of this article originally appeared on Medscape.com.
Clinical trials of omega-3 fatty acid or vitamin D supplements have followed a long and winding road in search of benefits in cardiovascular (CV) disease, with wildly mixed results. But the journey may be in vain in one of cardiology’s frontier research areas, primary prevention of atrial fibrillation (AF), suggest primary results of the VITAL-Rhythm trial, presented Nov. 13 during the American Heart Association (AHA) Scientific Sessions 2020 virtual meeting.
Neither marine-oil caps nor the vitamin D3 supplements made a difference to risk for incident AF, whether paroxysmal or persistent, over more than 5 years in the study, with more than 25,000 adults in the community. Nor did they seem to cause harm.
“To our knowledge, this is the first large-scale, long-term, randomized placebo-controlled trial to test the effect of any intervention on incident AF,” Christine M. Albert, MD, MPH, Cedars-Sinai Medical Center in Los Angeles, said at a media briefing on VITAL-Rhythm before her formal presentation of the trial during the conference.
Its findings, she said, don’t support the use of marine-oil caps or vitamin D3 for primary prevention of incident AF. “Fortunately, they also do not show any increased risk in atrial fibrillation for patients who are using these supplements for other indications.”
Both agents are widely taken without physician supervision for their perceived benefits, and marine-oil caps in particular – often in special prescription formulations – may be used for reducing elevated triglyceride levels and, based on the results of REDUCE-IT, cutting cardiovascular risk.
“It’s pretty clear that there’s no evidence to suggest that either of these supplements is helpful for preventing atrial fibrillation. And I think that’s clear from the evidence these investigators presented,” said Jonathan P. Piccini, MD, MHS, Duke University, Durham, N.C., who wasn’t part of the study.
“It’s also a little disappointing because atrial fibrillation is such a huge problem, and the inability to identify preventative strategies is a repeated theme,” he said in an interview.
VITAL-Rhythm is an ancillary study within the VITAL trial, which showed no benefit from either supplement regarding risk for incident cancer or CV events, as reported at the AHA sessions 2 years ago. In fact, their effects seem sweepingly negative throughout the trial; in another ancillary study, VITAL-DKD, neither supplement helped preserve renal function over 5 years in patients with type 2 diabetes.
The participants started VITAL without a history of AF, CV disease, or cancer; they were randomly assigned to take about a gram of omega-3 fatty acids, 2000 IU vitamin D3 daily, or their placebos, in a double randomization.
VITAL and its ancillary studies collectively undercut mechanistic theories about how omega-3 fatty acid and vitamin D supplements may affect AF risk, ideas derived from epidemiologic and dietary studies. They were thought perhaps “to have direct antiarrhythmic effects on myocytes through effects on ion channels, electrical remodeling, electrical stabilizing effects, and fluidity of the cell membranes,” observed Renate B. Schnabel, MD, MSc, University Heart Center, Hamburg, Germany, at the briefing. Or such effects might be related to beneficial effects on atherosclerosis, inflammation, or ischemic heart disease, she noted.
Neither idea is likely after VITAL and VITAL-Rhythm, said Dr. Schnabel, who spoke as an invited discussant after Albert’s formal presentation at AHA 2020.
That omega-3 fatty acid supplements may not improve AF incidence or risks has also been evident from many clinical trials and observational studies. Several, including REDUCE-IT, included some evidence for increasing risk for AF with marine-oil supplement intake. That may have happened in VITAL-Rhythm as well.
“While there was no evidence that the omega-3 three fatty acids prevented atrial fibrillation, there was a signal of perhaps more atrial fibrillation in the omega-3 fatty-acids group,” said Dr. Piccini, who directs his center’s electrophysiology clinical trials program.
A sensitivity analysis limited to participants who adhered to their assigned regimens, as opposed to the main intention-to-treat (ITT) analysis, showed a nonsignificant 13% increased hazard ratio for incident AF for the marine-oil supplement group. It reached a P value of .09, which can be interpreted as a trend.
“There are a few studies that have now showed a trend or an increased incidence of arrhythmia in patients treated with omega-3 fatty acids,” Dr. Piccini noted. “I don’t think it’s definitive, but it’s certainly something to keep an eye on.”
VITAL-Rhythm included an electrocardiography (ECG) substudy, yet to be reported, that should yield more insights about any such effects of marine-oil or vitamin D supplements in the trial, Dr. Albert said at the briefing.
The ancillary study assigned its 25,119 patients (mean age, 67 years; 51% women) to take vitamin D3 at 2000 IU/day, marine-oil supplements containing omega-3 fatty acids at 840 mg per day – 460 mg eicosapentaenoic acid (EPA) plus 380 mg docosahexaenoic acid (DHA) (Omacor, Pronova BioPharma) – or their placebos in a 2 x 2 randomization.
Incident cases of AF were identified through annual questionnaires in which the participants self-reported whether they had received a physician diagnosis of the arrhythmia, supplemented by Centers for Medicare & Medicaid Services claims data for AF hospital and clinical visits. Those led to a review of inpatient and outpatient records, from which AF events were adjudicated by an endpoint committee.
An electrocardiogram (72.9%) or physician’s report (27.1%) confirmed the AF diagnosis as the protocol required.
By those standards, 900 incident cases were identified, for a rate of 3.6% over a median of 5.3 years. They were paroxysmal in 58.4%, persistent in 38.4%, and indeterminant in 3.1%, Dr. Albert reported.
Of the 12,542 patients assigned to marine-oil caps by ITT, 469 (3.74%) developed incident AF in the ITT analysis, compared to 431 of 12,577 (3.43%) who received placebo, for an adjusted hazard ratio (HR) of 1.09 (95% CI, 0.96-1.24; P = .19).
The results were similar in two sensitivity analyses, one of which omitted patients with AF who may have had symptoms before randomization and another excluding those whose incident AF was identified solely in CMS data. But in the third “on treatment” sensitivity analysis, the HR for events was 1.13 (95% CI, 0.98-1.30; P = .09).
Outcomes for the vitamin D randomization were nearly the same, for an HR of 1.09 (95% CI, 0.96-1.25; P = .19) by ITT; the results were similar in all three sensitivity analyses.
“It’s not a tremendous signal of risk,” said Piccini of the marine-oil on-treatment analysis. But it, along with consistent evidence from other studies, does give him pause. “If a patient came to me and said,
Doctor, I want to take omega-3 fish oil, because I want to reduce my risk of events, as an arrhythmia doctor I would say, ‘We don’t have great evidence to do that for preventing atrial fibrillation. And there’s actually some evidence that it could mildly increase your risk of developing it.’ ”
For those prescribed evidence-based marine-oil therapy for other indications, he said, “I think the take-home message certainly is, if they report palpitations or other signs or symptoms that could be due to atrial fibrillation, we should be aggressive about screening for atrial fibrillation,” and making the diagnosis as appropriate. If the incident AF resolves after stopping the treatment, “maybe it’s reasonable to refrain from prescribing the medication for that patient.”
VITAL-Rhythm and VITAL are supported by multiple grants from the National Institutes of Health. Albert discloses receiving grant support from St. Jude Medical, Abbott, and Roche. Schnabel reports receiving honoraria from Bristol-Myers Squibb/Pfizer. Piccini previously disclosed receiving research grants from Abbott, the Association for the Advancement of Medical Instrumentation, Bayer, Boston Scientific, and Philips and serving as a consultant to Abbott, Allergan, ARCA Biopharma, Biotronik, Boston Scientific, LivaNova, Medtronic, Milestone, Sanofi, Philips, and UptoDate.
A version of this article originally appeared on Medscape.com.

Empagliflozin favorably reshaped left ventricles in HFrEF patients
Treatment with the SGLT2 inhibitor empagliflozin led to significant reductions in both left ventricular end systolic and diastolic volumes in two independent randomized studies of patients with heart failure with reduced ejection fraction.

These results provide important new evidence that one way a drug from this class exerts its beneficial effects on cardiovascular outcomes in these patients is by producing favorable left-ventricular remodeling.
One of the two studies involved only patients with heart failure with reduced ejection fraction (HFrEF) with diabetes and examined treatment impact after 36 weeks. The second study focused exclusively on HFrEF patients without diabetes and followed patients for 6 months. Both studies also generated additional significant evidence of favorable left-ventricular effects.
“The results of these two new trials are incredibly important, as they tell cardiologists one of the mechanisms by which SGLT2 [sodium glucose co-transporter 2] inhibitors reduce heart failure hospitalizations and cardiovascular death,” said Mark C. Petrie, MBChB, professor at the Institute of Cardiovascular & Medical Sciences at the University of Glasgow, and principal investigator for one of the two studies.
“Many cardiologists want to know mechanisms as well as clinical benefit. These remodeling data showing that these drugs reduce the size of abnormally large hearts [and] are also very important for patients,” Dr. Petrie said in an interview. “There have been more than 50 publications on potential mechanisms of benefit of SGLT2 inhibitors in HFrEF, but these are the first randomized, mechanistic data.”
Mechanistic clues follow large cardiovascular outcome trials
Results from a large randomized trial, EMPEROR-Reduced, recently showed that treatment with empagliflozin (Jardiance) on top of standard HFrEF treatment led to significant benefits in patients with or without type 2 diabetes (T2D), compared with placebo, for major cardiovascular and renal endpoints, including the combination of cardiovascular death or hospitalization for heart failure. And results from a second large randomized trial, DAPA-HF, showed similar results with a different drug from the same class, dapagliflozin (Farxiga), in an earlier report.
But while these reports led to quick uptake of these two drugs for the treatment of patients with HFrEF, the means by which these agents exert their HFrEF benefits have been unclear.
“Our study identifies why this drug [empagliflozin] is effective – because it improves heart function, something that has not been understood until now,” Carlos G. Santos-Gallego, MD, lead investigator for the second new report, said in a written statement. “Many doctors are afraid of prescribing a drug they do not understand, and our findings will help clinicians feel more comfortable giving this to patients once approved.”
On the strength of the DAPA-HF results, dapagliflozin received a revised U.S. label in May 2020 that added the indication for treating patients with HFrEF regardless of the whether patients also have T2D, the original indication for prescribing the drug. Many experts anticipate that a similar addition to the label for empagliflozin will soon occur.
EMPA-TROPISM examines patients with no T2D
The single-center study reported by Dr. Santos-Gallego randomized 84 patients with HFrEF and no diabetes to standard treatment with empagliflozin or placebo and measured several parameters in 80 patients who completed the planned 6 months of treatment. The primary endpoints were the changes in both left ventricular end systolic and diastolic volume from baseline in the empagliflozin-treated patients compared with patients on placebo, measured by cardiac MR.
The results showed an average reduction of end systolic volume of 26.6 mL from baseline compared with a small rise in the placebo patients, and an average drop in end diastolic volume of 25.1 mL from baseline compared again with a small increase in the controls. Both differences were statistically significant, reported the senior author of the study, Juan J. Badimon, PhD, in a talk at the virtual scientific sessions of the American Heart Association. Concurrently, the results were published online in the Journal of the American College of Cardiology.
Results from the EMPA-TROPISM study also showed several other significant benefits from empagliflozin treatment, both to left ventricular shape and function as well as to other measures of patient well being. The drug regimen led to an increase in left ventricular ejection fraction, a decrease in left ventricular mass, reduced myocardial fibrosis and aortic stiffness, increased peak oxygen consumption, an increased distance traveled in a 6-minute walk test, and improved quality of life, said Dr. Badimon, professor of medicine and director of the Atherothrombosis Research Unit at the Cardiovascular Institute at the Icahn School of Medicine at Mount Sinai in New York.
SUGAR-DM-HF enrolled only T2D patients
The second study, SUGAR-DM-HF, randomized 105 patients with HFrEF and T2D to treatment with empagliflozin or placebo at any of 15 centers in Scotland, with 92 patients completing the full 36 weeks on treatment. One of the study’s two primary endpoints was the change in left ventricular end systolic volume index, which dropped by an average of 7.9 mL/m2 in patients who received empagliflozin and by 1.5 mL/m2 in the controls, a significant average between-group difference of 6.0 mL/m2, reported Matthew M.Y. Lee, MBChB, at the same meeting.
However, the second primary endpoint, change in left ventricular global longitudinal strain, showed no significant difference in effect on empagliflozin compared with placebo, said Dr. Lee, a cardiologist at the University of Glasgow. Concurrently with his report the results appeared in an article published online in Circulation.
The results also showed a significant drop in left ventricular end diastolic volume index from baseline compared with the control patients, with an average between-group difference in the reduction from baseline of 8.2 mL/m2.
“Reverse cardiac remodeling is a mechanism by which SGLT2 inhibitors reduce heart failure hospitalizations and cardiovascular mortality,” Dr. Lee concluded during his presentation at the meeting.
Although the findings from both studies together provide strong evidence for an effect by empagliflozin on left ventricular shape and function, neither study provides much insight into how this drug exerts these effects. The authors of both studies agreed on several potential explanations, including reductions in cardiac preload and afterload that could reduce left ventricular stretch and volume; a change triggered in myocardial energetics that switches from a metabolism mostly dependent on glucose to one more geared to using fatty acids, ketone bodies, and branched chain amino acids; and a possible drug-induced reduction in oxidative stress and inflammation.
SUGAR-DM-HF was sponsored by a grant from Boehringer Ingelheim, the company that along with Eli Lilly markets empagliflozin (Jardiance). Dr. Lee had no disclosures. Dr. Petrie has been a consultant to Boehringer Ingelheim and Eli Lilly and to several other companies. EMPA-TROPISM was sponsored by a grant from Boehringer Ingelheim. Dr. Badimon and Dr. Santos-Gallego had no disclosures.
Treatment with the SGLT2 inhibitor empagliflozin led to significant reductions in both left ventricular end systolic and diastolic volumes in two independent randomized studies of patients with heart failure with reduced ejection fraction.
These results provide important new evidence that one way a drug from this class exerts its beneficial effects on cardiovascular outcomes in these patients is by producing favorable left-ventricular remodeling.
One of the two studies involved only patients with heart failure with reduced ejection fraction (HFrEF) with diabetes and examined treatment impact after 36 weeks. The second study focused exclusively on HFrEF patients without diabetes and followed patients for 6 months. Both studies also generated additional significant evidence of favorable left-ventricular effects.
“The results of these two new trials are incredibly important, as they tell cardiologists one of the mechanisms by which SGLT2 [sodium glucose co-transporter 2] inhibitors reduce heart failure hospitalizations and cardiovascular death,” said Mark C. Petrie, MBChB, professor at the Institute of Cardiovascular & Medical Sciences at the University of Glasgow, and principal investigator for one of the two studies.
“Many cardiologists want to know mechanisms as well as clinical benefit. These remodeling data showing that these drugs reduce the size of abnormally large hearts [and] are also very important for patients,” Dr. Petrie said in an interview. “There have been more than 50 publications on potential mechanisms of benefit of SGLT2 inhibitors in HFrEF, but these are the first randomized, mechanistic data.”
Mechanistic clues follow large cardiovascular outcome trials
Results from a large randomized trial, EMPEROR-Reduced, recently showed that treatment with empagliflozin (Jardiance) on top of standard HFrEF treatment led to significant benefits in patients with or without type 2 diabetes (T2D), compared with placebo, for major cardiovascular and renal endpoints, including the combination of cardiovascular death or hospitalization for heart failure. And results from a second large randomized trial, DAPA-HF, showed similar results with a different drug from the same class, dapagliflozin (Farxiga), in an earlier report.
But while these reports led to quick uptake of these two drugs for the treatment of patients with HFrEF, the means by which these agents exert their HFrEF benefits have been unclear.
“Our study identifies why this drug [empagliflozin] is effective – because it improves heart function, something that has not been understood until now,” Carlos G. Santos-Gallego, MD, lead investigator for the second new report, said in a written statement. “Many doctors are afraid of prescribing a drug they do not understand, and our findings will help clinicians feel more comfortable giving this to patients once approved.”
On the strength of the DAPA-HF results, dapagliflozin received a revised U.S. label in May 2020 that added the indication for treating patients with HFrEF regardless of the whether patients also have T2D, the original indication for prescribing the drug. Many experts anticipate that a similar addition to the label for empagliflozin will soon occur.
EMPA-TROPISM examines patients with no T2D
The single-center study reported by Dr. Santos-Gallego randomized 84 patients with HFrEF and no diabetes to standard treatment with empagliflozin or placebo and measured several parameters in 80 patients who completed the planned 6 months of treatment. The primary endpoints were the changes in both left ventricular end systolic and diastolic volume from baseline in the empagliflozin-treated patients compared with patients on placebo, measured by cardiac MR.
The results showed an average reduction of end systolic volume of 26.6 mL from baseline compared with a small rise in the placebo patients, and an average drop in end diastolic volume of 25.1 mL from baseline compared again with a small increase in the controls. Both differences were statistically significant, reported the senior author of the study, Juan J. Badimon, PhD, in a talk at the virtual scientific sessions of the American Heart Association. Concurrently, the results were published online in the Journal of the American College of Cardiology.
Results from the EMPA-TROPISM study also showed several other significant benefits from empagliflozin treatment, both to left ventricular shape and function as well as to other measures of patient well being. The drug regimen led to an increase in left ventricular ejection fraction, a decrease in left ventricular mass, reduced myocardial fibrosis and aortic stiffness, increased peak oxygen consumption, an increased distance traveled in a 6-minute walk test, and improved quality of life, said Dr. Badimon, professor of medicine and director of the Atherothrombosis Research Unit at the Cardiovascular Institute at the Icahn School of Medicine at Mount Sinai in New York.
SUGAR-DM-HF enrolled only T2D patients
The second study, SUGAR-DM-HF, randomized 105 patients with HFrEF and T2D to treatment with empagliflozin or placebo at any of 15 centers in Scotland, with 92 patients completing the full 36 weeks on treatment. One of the study’s two primary endpoints was the change in left ventricular end systolic volume index, which dropped by an average of 7.9 mL/m2 in patients who received empagliflozin and by 1.5 mL/m2 in the controls, a significant average between-group difference of 6.0 mL/m2, reported Matthew M.Y. Lee, MBChB, at the same meeting.
However, the second primary endpoint, change in left ventricular global longitudinal strain, showed no significant difference in effect on empagliflozin compared with placebo, said Dr. Lee, a cardiologist at the University of Glasgow. Concurrently with his report the results appeared in an article published online in Circulation.
The results also showed a significant drop in left ventricular end diastolic volume index from baseline compared with the control patients, with an average between-group difference in the reduction from baseline of 8.2 mL/m2.
“Reverse cardiac remodeling is a mechanism by which SGLT2 inhibitors reduce heart failure hospitalizations and cardiovascular mortality,” Dr. Lee concluded during his presentation at the meeting.
Although the findings from both studies together provide strong evidence for an effect by empagliflozin on left ventricular shape and function, neither study provides much insight into how this drug exerts these effects. The authors of both studies agreed on several potential explanations, including reductions in cardiac preload and afterload that could reduce left ventricular stretch and volume; a change triggered in myocardial energetics that switches from a metabolism mostly dependent on glucose to one more geared to using fatty acids, ketone bodies, and branched chain amino acids; and a possible drug-induced reduction in oxidative stress and inflammation.
SUGAR-DM-HF was sponsored by a grant from Boehringer Ingelheim, the company that along with Eli Lilly markets empagliflozin (Jardiance). Dr. Lee had no disclosures. Dr. Petrie has been a consultant to Boehringer Ingelheim and Eli Lilly and to several other companies. EMPA-TROPISM was sponsored by a grant from Boehringer Ingelheim. Dr. Badimon and Dr. Santos-Gallego had no disclosures.
FROM AHA 2020
Clopidogrel bests ticagrelor head-to-head for elective PCI in ALPHEUS
Ticagrelor failed to unseat clopidogrel as the guideline-recommended P2Y12 inhibitor of choice in patients undergoing elective percutaneous coronary intervention for stable CAD in the randomized ALPHEUS trial.
“The higher level of platelet inhibition obtained with ticagrelor does not translate into a reduction of periprocedural MI or myocardial injury within 48 hours of high-risk PCI performed in stable coronary patients,” reported Johanne Silvain, MD, PhD, professor of cardiology at the Sorbonne University and director of the ICU at Pitie-Salpetriere Hospital, Paris, at the virtual American Heart Association scientific sessions.

Ticagrelor did, however, result in a significantly higher rate of nuisance or minor bleeding than clopidogrel within 30 days post PCI, as well as more frequent dyspnea and treatment discontinuation.
ALPHEUS was an open-label, randomized trial including 1,883 patients undergoing elective PCI for stable coronary disease at 49 French or Czech PCI centers. All participants were either troponin-negative or had a modestly elevated but declining high-sensitivity troponin level. They possessed an average of 3.2 procedure-related or patient-related high-risk features, among the most common of which were multivessel disease, long lesions requiring multiple stents, and diabetes. Patients were randomized to a 300- or 600-mg loading dose of clopidogrel (Kengreal) or 180 mg of ticagrelor (Brilinta) prior to PCI. Afterwards they continued on 90 mg of ticagrelor twice daily or 75 mg of clopidogrel once daily for 30 days. Everyone was also on aspirin.
Myonecrosis hypothesis falls flat
The primary endpoint was the occurrence of major myocardial injury, defined as a periprocedural troponin elevated greater than 5 times the upper limit of normal within 48 hours of PCI; type 4a MI, defined as major myocardial injury plus signs or symptoms of ischemia; or stent thrombosis.
The rates were closely similar: 35.5% with ticagrelor, 36.2% with clopidogrel. The bulk of events consisted of major myocardial injury, with an incidence of 26.7% in the ticagrelor group and 27.7% with clopidogrel. Stent thrombosis occurred in 0.3% of patients in each group. Type 4a MI occurred in 8.5% of the ticagrelor group and 8.2% of patients on clopidogrel.
The study hypothesis was that a substantial portion of periprocedural myonecrosis may be thrombotic in nature, and that a stronger P2Y12 inhibitor could reduce the occurrence of these mini-infarcts and thus provide patient benefit. But the hypothesis was not borne out.
“We don’t know if these events are a risk factor or just a marker of risk,” Dr. Silvain said.
There were no between-group differences in major bleeding events at 48 hours or 30 days. However, the rate of nuisance or minor bleeding at 30 days was 11.2% in the ticagrelor arm, significantly higher than the 7.5% incidence with clopidogrel. Moreover, dyspnea occurred in 11.2% of patients on ticagrelor, compared to 0.2% with clopidogrel. Study drug discontinuation was more frequent in the ticagrelor arm: 2.2%, versus 0.4%.
Dr. Silvain also presented a pooled analysis of the 1,883 patients in ALPHEUS plus 781 from the similarly designed SASSICAIA trial, which compared prasugrel (Effient) to clopidogrel. Neither of the more potent P2Y12 inhibitors showed superiority over clopidogrel.

Discussant Stephen D. Wiviott, MD, summed things up: “With no evidence for ischemic benefit and higher rates of low-severity bleeding, this trial does not support the use of more potent P2Y12 antagonists for elective PCI. Based on these results, and consistent with SASSICAIA, aspirin with clopidogrel should remain the standard of care in this population.”
Troponin response may vary
A striking finding in ALPHEUS was the discrepancy between very high rates of periprocedural troponin elevation and very low rates of clinical events through 30 days of follow-up. “When you look at these modest elevations of troponin it appears that there is a lot of noise here,” said Dr. Wiviott, vice president for clinical trials research and administration at Massachusetts General Hospital and Brigham and Women’s Hospital and a cardiologist at Harvard Medical School, Boston.
Troponin elevations in stable coronary patients undergoing PCI may have a different underlying mechanism than elevated troponins in patients undergoing PCI for an acute coronary syndrome, he added. In stable CAD patients, the phenomenon may be more related to atherosclerosis than to platelet activation and thrombosis.
During a panel discussion, Sunil V. Rao, MD, said cardiologists are “probably going to have to go back to the drawing board and think about what kinds of events are really, really important.”

“It’s incumbent on our profession to figure out whether periprocedural MI should continue to be a component of the composite endpoint in PCI trials, because it’s highly dependent on the definition that’s being used,” observed Dr. Rao, professor of medicine at Duke University, Durham, N.C.
Dr. Silvain reported receiving institutional research funding and consulting fees from AstraZeneca, which funded the ALPHEUS trial. He serves as a consultant to a handful of other pharmaceutical companies as well.
Simultaneously with Dr. Silvain’s presentation at AHA 2020, the ALPHEUS results were published online in The Lancet.
SOURCE: Silvain J. AHA 2020. Session LBS 3.
Ticagrelor failed to unseat clopidogrel as the guideline-recommended P2Y12 inhibitor of choice in patients undergoing elective percutaneous coronary intervention for stable CAD in the randomized ALPHEUS trial.
“The higher level of platelet inhibition obtained with ticagrelor does not translate into a reduction of periprocedural MI or myocardial injury within 48 hours of high-risk PCI performed in stable coronary patients,” reported Johanne Silvain, MD, PhD, professor of cardiology at the Sorbonne University and director of the ICU at Pitie-Salpetriere Hospital, Paris, at the virtual American Heart Association scientific sessions.
Ticagrelor did, however, result in a significantly higher rate of nuisance or minor bleeding than clopidogrel within 30 days post PCI, as well as more frequent dyspnea and treatment discontinuation.
ALPHEUS was an open-label, randomized trial including 1,883 patients undergoing elective PCI for stable coronary disease at 49 French or Czech PCI centers. All participants were either troponin-negative or had a modestly elevated but declining high-sensitivity troponin level. They possessed an average of 3.2 procedure-related or patient-related high-risk features, among the most common of which were multivessel disease, long lesions requiring multiple stents, and diabetes. Patients were randomized to a 300- or 600-mg loading dose of clopidogrel (Kengreal) or 180 mg of ticagrelor (Brilinta) prior to PCI. Afterwards they continued on 90 mg of ticagrelor twice daily or 75 mg of clopidogrel once daily for 30 days. Everyone was also on aspirin.
Myonecrosis hypothesis falls flat
The primary endpoint was the occurrence of major myocardial injury, defined as a periprocedural troponin elevated greater than 5 times the upper limit of normal within 48 hours of PCI; type 4a MI, defined as major myocardial injury plus signs or symptoms of ischemia; or stent thrombosis.
The rates were closely similar: 35.5% with ticagrelor, 36.2% with clopidogrel. The bulk of events consisted of major myocardial injury, with an incidence of 26.7% in the ticagrelor group and 27.7% with clopidogrel. Stent thrombosis occurred in 0.3% of patients in each group. Type 4a MI occurred in 8.5% of the ticagrelor group and 8.2% of patients on clopidogrel.
The study hypothesis was that a substantial portion of periprocedural myonecrosis may be thrombotic in nature, and that a stronger P2Y12 inhibitor could reduce the occurrence of these mini-infarcts and thus provide patient benefit. But the hypothesis was not borne out.
“We don’t know if these events are a risk factor or just a marker of risk,” Dr. Silvain said.
There were no between-group differences in major bleeding events at 48 hours or 30 days. However, the rate of nuisance or minor bleeding at 30 days was 11.2% in the ticagrelor arm, significantly higher than the 7.5% incidence with clopidogrel. Moreover, dyspnea occurred in 11.2% of patients on ticagrelor, compared to 0.2% with clopidogrel. Study drug discontinuation was more frequent in the ticagrelor arm: 2.2%, versus 0.4%.
Dr. Silvain also presented a pooled analysis of the 1,883 patients in ALPHEUS plus 781 from the similarly designed SASSICAIA trial, which compared prasugrel (Effient) to clopidogrel. Neither of the more potent P2Y12 inhibitors showed superiority over clopidogrel.
Discussant Stephen D. Wiviott, MD, summed things up: “With no evidence for ischemic benefit and higher rates of low-severity bleeding, this trial does not support the use of more potent P2Y12 antagonists for elective PCI. Based on these results, and consistent with SASSICAIA, aspirin with clopidogrel should remain the standard of care in this population.”
Troponin response may vary
A striking finding in ALPHEUS was the discrepancy between very high rates of periprocedural troponin elevation and very low rates of clinical events through 30 days of follow-up. “When you look at these modest elevations of troponin it appears that there is a lot of noise here,” said Dr. Wiviott, vice president for clinical trials research and administration at Massachusetts General Hospital and Brigham and Women’s Hospital and a cardiologist at Harvard Medical School, Boston.
Troponin elevations in stable coronary patients undergoing PCI may have a different underlying mechanism than elevated troponins in patients undergoing PCI for an acute coronary syndrome, he added. In stable CAD patients, the phenomenon may be more related to atherosclerosis than to platelet activation and thrombosis.
During a panel discussion, Sunil V. Rao, MD, said cardiologists are “probably going to have to go back to the drawing board and think about what kinds of events are really, really important.”
“It’s incumbent on our profession to figure out whether periprocedural MI should continue to be a component of the composite endpoint in PCI trials, because it’s highly dependent on the definition that’s being used,” observed Dr. Rao, professor of medicine at Duke University, Durham, N.C.
Dr. Silvain reported receiving institutional research funding and consulting fees from AstraZeneca, which funded the ALPHEUS trial. He serves as a consultant to a handful of other pharmaceutical companies as well.
Simultaneously with Dr. Silvain’s presentation at AHA 2020, the ALPHEUS results were published online in The Lancet.
SOURCE: Silvain J. AHA 2020. Session LBS 3.
REPORTING FROM AHA 2020
Intravenous iron reduces HF readmissions: AFFIRM-AHF
Iron supplementation reduces heart failure (HF) readmissions in iron-deficient patients hospitalized for acute HF, according to results of the AFFIRM-AHF trial.
After 52 weeks, intravenous ferric carboxymaltose (Ferinject) reduced the risk of total HF hospitalizations and cardiovascular (CV) death by 21% compared with placebo (293 vs 372 events; rate ratio [RR] 0.79; 95% CI, 0.62 - 1.01).
Although the composite primary endpoint failed to achieve statistical significance, it was driven by a significant 26% reduction in the risk of total HF hospital readmissions (P = .013) without an effect on CV mortality (P =.809).
Because the management and follow-up of patients was affected by the COVID-19 pandemic, a prespecified sensitivity analysis was performed that censored patients in each country at the date when its first COVID-19 patient was reported, explained principal investigator Piotr Ponikowski, MD, PhD, Wroclaw Medical University, Wroclaw, Poland.
That analysis revealed a significant 30% reduction in total HF readmissions (P = .005) in patients receiving ferric carboxymaltose (FCM), as well as significant benefits on the primary composite and secondary endpoints.
Notably, 80% of patients required only one or two injections and HF hospitalizations were reduced irrespective of anemia status.
“Iron deficiency should be searched in patients hospitalized with acute heart failure — assessed using a simple blood test — and is now an important therapeutic target,” Ponikowski said at the virtual American Heart Association (AHA) Scientific Sessions 2020.
The results were also published simultaneously in The Lancet.
Iron deficiency is present in up to 70% of patients with acute HF and a predictor of poor outcome, independent of anemia and ejection fraction, he noted.
The FAIR-HF, CONFIRM-HF, and EFFECT-HF trials demonstrated that IV iron supplementation improves exercise capacity, symptoms, and quality of life in iron-deficient HF patients.
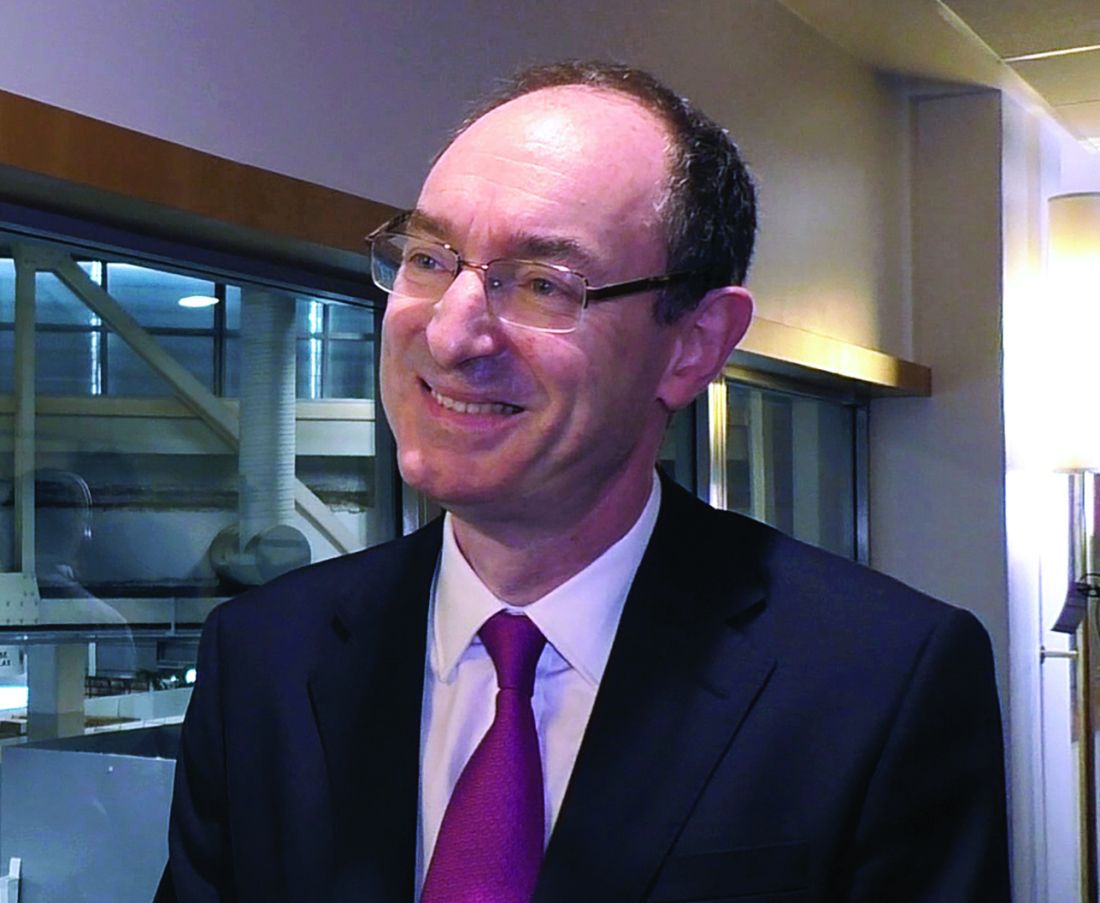
However, no such benefit was seen with oral IV in the IRONOUT trial. “So it seems if we are to replace iron, it needs to be done using intravenous therapy,” said John McMurray, MD, University of Glasgow, Scotland, who was invited to discuss the results.
He observed that the reduction in HF hospitalizations in AFFIRM-AHF were relatively modest and that the trial was never expected to show a benefit on CV mortality. Also, the COVID-19 sensitivity analysis providing more convincing effects is a valid approach and one recommended by regulators.
Further, the findings are supported by independent evidence in chronic kidney disease, from the PIVOTAL trial, that intravenous iron reduces HF hospitalizations, McMurray said.
“The million-dollar question, of course, is what will the results of this study mean for the guidelines: I think they probably will change the guidelines,” he said. “Certainly, I hope they will change the US guidelines, which have really given a very lukewarm recommendation for intravenous iron and I think that should probably be stronger.”
In a class IIb recommendation, the 2017 American College of Cardiology/AHA/Heart Failure Society of America heart failure guidelines say intravenous iron “might be reasonable” to improve functional status and quality of life in New York Heart Association class II and III patients with iron deficiency.
The 2016 European Society of Cardiology guidelines include a class IIa recommendation that IV iron “should be considered” in iron-deficient patients with symptomatic HF with reduced ejection fraction.
“This is the first large-scale [trial] of IV supplementation that could potentially change the way we approach patients, particularly those with hospitalized heart failure,” past AHA president Clyde Yancy, MD, MSc, Northwestern University Feinberg School of Medicine in Chicago, said during an earlier press briefing.

He pointed out that clinicians have been circumspect about the early IV iron data. “I have to congratulate you because you’ve changed the narrative,” Yancy said. “We have to start thinking about iron deficiency; we have to think about how we incorporate this in treatment protocols.”
Press briefing panelist Marc Pfeffer, MD, PhD, Brigham and Women’s Hospital and Harvard Medical School in Boston, acknowledged he was among those circumspect.
“I’m no longer a skeptic and I want to congratulate them for showing it’s a risk factor,” he said. “It’s one thing to have a risk factor; it’s another to be a modifiable risk factor and I think that’s what’s so exciting about this.”
The double-blind, phase 4 AFFIRM-AHF trial randomly assigned 1132 patients to receive a bolus injection of ferric carboxymaltose or normal saline before hospital discharge for an acute HF episode. Subsequent treatment was given, as needed, up to 24 weeks post-randomization.
At admission, all patients had left ventricular ejection fractions less than 50% and iron deficiency (serum ferritin <100 ng/mL or serum ferritin 100-299 ng/mL if transferrin saturation <20%).
The modified intention-to-treat (mITT) analysis included 558 FCM patients and 550 controls in whom study treatment was started and for whom at least one post-randomization value was available.
Press briefing discussant Nancy Sweitzer, MD, PhD, director of the University of Arizona’s Sarver Heart Center in Tucson, said AFFIRM-AHF is an “important trial likely to change guidelines” and “targeted one of the highest risk populations we have in heart failure.”
Patients with iron deficiency tend to be elderly with more comorbidities, have longer hospital lengths of stay, and higher readmission rates. “So impacting hospitalizations in this population is incredibly impactful,” she said.
“Awareness and assessment of iron deficiency are an important part of inpatient care of patients with ejection fractions less than or equal to 50% and acute decompensated heart failure, and I think all of us in the community need to pay much more attention to this issue.”
As with any new therapy, there are implementation challenges such as how to monitor patients and deliver the therapy in a cost-effective way, Sweitzer said.
The trial focused on the most vulnerable period for HF patients, but these patients should be rechecked every 3 to 4 months for iron deficiency, Ponikowski observed during the briefing.
“This is a modifiable risk factor,” he said. “We only need to remember, we only need to assess it, and we have a very, very simple tool in our hands. We just need to measure two biomarkers, transferrin saturation and ferritin — that’s all.”
Unanswered questions include the mechanism behind the reduction in hospitalization, the relationship of benefit to hemoglobin levels, and whether there is a differential benefit based on age, presence of ischemia, or sex, especially as women tend to be more severely affected by iron deficiency, Sweitzer said.
During the formal presentation, Ponikowski said the primary endpoint was consistent in subgroup analyses across baseline hemoglobin, estimated glomerular filtration rate, and N-terminal pro-brain natriuretic peptide levels, HF etiology, ejection fraction, and whether HF was diagnosed prior to the index hospitalization.
Treatment with FCM was safe, with no significant differences between the FCM and placebo groups in serious adverse events (45% vs 51%) or adverse events leading to study discontinuation (18% vs 17%), he reported. The most common adverse events were cardiac disorders (40.1% vs 44.3%) and infections (18.2% vs 22%).
AFFIRM-AHF is the first of three ongoing mortality and morbidity trials in heart failure with intravenous ferric carboxymaltose; the others are FAIR-HF2 and HEART-FID. Additional insights are also expected next year on intravenous iron isomaltoside from the Scottish-based IRONMAN trial in 1300 HF patients with iron deficiency.
The study was sponsored by Vifor International. Ponikowski has received research grants and personal fees from Vifor Pharma; and personal fees from Amgen, Bayer, Novartis, Abbott Vascular, Boehringer Ingelheim, Merck, Pfizer, Servier, AstraZeneca, Berlin Chemie, Cibiem, Renal Guard Solutions Bristol-Myers Squibb, and Impulse Dynamics.
Pfeffer reported honoraria from AstraZeneca, Corvidia, GlaxoSmithKline, Jazz, MyoKardia, Novartis, Roche, Sanofi, and Servier; other relationships with DalCor and Novo Nordisk; research grants from Novartis; and an ownership interest in DalCor. Sweitzer reported research payments from Merck and Novartis; and consulting fees from Myocardia.
McMurray reported relationships with Amgen, AstraZeneca, Bayer, Boehringer Ingelheim, Cytokinetics, Novartis, and Servier. Yancy reported a relationship with Abbott and JAMA Network.
Lancet. Published online November 13, 2020. Full text
American Heart Association Scientific Sessions 2020: Presented November 13, 2020.
A version of this article originally appeared on Medscape.com.
Iron supplementation reduces heart failure (HF) readmissions in iron-deficient patients hospitalized for acute HF, according to results of the AFFIRM-AHF trial.
After 52 weeks, intravenous ferric carboxymaltose (Ferinject) reduced the risk of total HF hospitalizations and cardiovascular (CV) death by 21% compared with placebo (293 vs 372 events; rate ratio [RR] 0.79; 95% CI, 0.62 - 1.01).
Although the composite primary endpoint failed to achieve statistical significance, it was driven by a significant 26% reduction in the risk of total HF hospital readmissions (P = .013) without an effect on CV mortality (P =.809).
Because the management and follow-up of patients was affected by the COVID-19 pandemic, a prespecified sensitivity analysis was performed that censored patients in each country at the date when its first COVID-19 patient was reported, explained principal investigator Piotr Ponikowski, MD, PhD, Wroclaw Medical University, Wroclaw, Poland.
That analysis revealed a significant 30% reduction in total HF readmissions (P = .005) in patients receiving ferric carboxymaltose (FCM), as well as significant benefits on the primary composite and secondary endpoints.
Notably, 80% of patients required only one or two injections and HF hospitalizations were reduced irrespective of anemia status.
“Iron deficiency should be searched in patients hospitalized with acute heart failure — assessed using a simple blood test — and is now an important therapeutic target,” Ponikowski said at the virtual American Heart Association (AHA) Scientific Sessions 2020.
The results were also published simultaneously in The Lancet.
Iron deficiency is present in up to 70% of patients with acute HF and a predictor of poor outcome, independent of anemia and ejection fraction, he noted.
The FAIR-HF, CONFIRM-HF, and EFFECT-HF trials demonstrated that IV iron supplementation improves exercise capacity, symptoms, and quality of life in iron-deficient HF patients.
However, no such benefit was seen with oral IV in the IRONOUT trial. “So it seems if we are to replace iron, it needs to be done using intravenous therapy,” said John McMurray, MD, University of Glasgow, Scotland, who was invited to discuss the results.
He observed that the reduction in HF hospitalizations in AFFIRM-AHF were relatively modest and that the trial was never expected to show a benefit on CV mortality. Also, the COVID-19 sensitivity analysis providing more convincing effects is a valid approach and one recommended by regulators.
Further, the findings are supported by independent evidence in chronic kidney disease, from the PIVOTAL trial, that intravenous iron reduces HF hospitalizations, McMurray said.
“The million-dollar question, of course, is what will the results of this study mean for the guidelines: I think they probably will change the guidelines,” he said. “Certainly, I hope they will change the US guidelines, which have really given a very lukewarm recommendation for intravenous iron and I think that should probably be stronger.”
In a class IIb recommendation, the 2017 American College of Cardiology/AHA/Heart Failure Society of America heart failure guidelines say intravenous iron “might be reasonable” to improve functional status and quality of life in New York Heart Association class II and III patients with iron deficiency.
The 2016 European Society of Cardiology guidelines include a class IIa recommendation that IV iron “should be considered” in iron-deficient patients with symptomatic HF with reduced ejection fraction.
“This is the first large-scale [trial] of IV supplementation that could potentially change the way we approach patients, particularly those with hospitalized heart failure,” past AHA president Clyde Yancy, MD, MSc, Northwestern University Feinberg School of Medicine in Chicago, said during an earlier press briefing.
He pointed out that clinicians have been circumspect about the early IV iron data. “I have to congratulate you because you’ve changed the narrative,” Yancy said. “We have to start thinking about iron deficiency; we have to think about how we incorporate this in treatment protocols.”
Press briefing panelist Marc Pfeffer, MD, PhD, Brigham and Women’s Hospital and Harvard Medical School in Boston, acknowledged he was among those circumspect.
“I’m no longer a skeptic and I want to congratulate them for showing it’s a risk factor,” he said. “It’s one thing to have a risk factor; it’s another to be a modifiable risk factor and I think that’s what’s so exciting about this.”
The double-blind, phase 4 AFFIRM-AHF trial randomly assigned 1132 patients to receive a bolus injection of ferric carboxymaltose or normal saline before hospital discharge for an acute HF episode. Subsequent treatment was given, as needed, up to 24 weeks post-randomization.
At admission, all patients had left ventricular ejection fractions less than 50% and iron deficiency (serum ferritin <100 ng/mL or serum ferritin 100-299 ng/mL if transferrin saturation <20%).
The modified intention-to-treat (mITT) analysis included 558 FCM patients and 550 controls in whom study treatment was started and for whom at least one post-randomization value was available.
Press briefing discussant Nancy Sweitzer, MD, PhD, director of the University of Arizona’s Sarver Heart Center in Tucson, said AFFIRM-AHF is an “important trial likely to change guidelines” and “targeted one of the highest risk populations we have in heart failure.”
Patients with iron deficiency tend to be elderly with more comorbidities, have longer hospital lengths of stay, and higher readmission rates. “So impacting hospitalizations in this population is incredibly impactful,” she said.
“Awareness and assessment of iron deficiency are an important part of inpatient care of patients with ejection fractions less than or equal to 50% and acute decompensated heart failure, and I think all of us in the community need to pay much more attention to this issue.”
As with any new therapy, there are implementation challenges such as how to monitor patients and deliver the therapy in a cost-effective way, Sweitzer said.
The trial focused on the most vulnerable period for HF patients, but these patients should be rechecked every 3 to 4 months for iron deficiency, Ponikowski observed during the briefing.
“This is a modifiable risk factor,” he said. “We only need to remember, we only need to assess it, and we have a very, very simple tool in our hands. We just need to measure two biomarkers, transferrin saturation and ferritin — that’s all.”
Unanswered questions include the mechanism behind the reduction in hospitalization, the relationship of benefit to hemoglobin levels, and whether there is a differential benefit based on age, presence of ischemia, or sex, especially as women tend to be more severely affected by iron deficiency, Sweitzer said.
During the formal presentation, Ponikowski said the primary endpoint was consistent in subgroup analyses across baseline hemoglobin, estimated glomerular filtration rate, and N-terminal pro-brain natriuretic peptide levels, HF etiology, ejection fraction, and whether HF was diagnosed prior to the index hospitalization.
Treatment with FCM was safe, with no significant differences between the FCM and placebo groups in serious adverse events (45% vs 51%) or adverse events leading to study discontinuation (18% vs 17%), he reported. The most common adverse events were cardiac disorders (40.1% vs 44.3%) and infections (18.2% vs 22%).
AFFIRM-AHF is the first of three ongoing mortality and morbidity trials in heart failure with intravenous ferric carboxymaltose; the others are FAIR-HF2 and HEART-FID. Additional insights are also expected next year on intravenous iron isomaltoside from the Scottish-based IRONMAN trial in 1300 HF patients with iron deficiency.
The study was sponsored by Vifor International. Ponikowski has received research grants and personal fees from Vifor Pharma; and personal fees from Amgen, Bayer, Novartis, Abbott Vascular, Boehringer Ingelheim, Merck, Pfizer, Servier, AstraZeneca, Berlin Chemie, Cibiem, Renal Guard Solutions Bristol-Myers Squibb, and Impulse Dynamics.
Pfeffer reported honoraria from AstraZeneca, Corvidia, GlaxoSmithKline, Jazz, MyoKardia, Novartis, Roche, Sanofi, and Servier; other relationships with DalCor and Novo Nordisk; research grants from Novartis; and an ownership interest in DalCor. Sweitzer reported research payments from Merck and Novartis; and consulting fees from Myocardia.
McMurray reported relationships with Amgen, AstraZeneca, Bayer, Boehringer Ingelheim, Cytokinetics, Novartis, and Servier. Yancy reported a relationship with Abbott and JAMA Network.
Lancet. Published online November 13, 2020. Full text
American Heart Association Scientific Sessions 2020: Presented November 13, 2020.
A version of this article originally appeared on Medscape.com.
FROM AHA 2020
TIPS-3: Polypill provides meaningful primary cardiovascular prevention
A once-daily polypill containing four drugs to lower blood pressure and LDL cholesterol reduced major adverse cardiovascular events by 21% relative to placebo in people at intermediate cardiovascular risk in the landmark TIPS-3 trial.
And with the addition of aspirin at 75 mg per day the combination achieved an even more robust 31% relative risk reduction, investigators reported at the.
“Aspirin contributes importantly to the benefits,” Salim Yusuf, MD, DPhil, emphasized in presenting the International Polycap Study (TIPS-3) results jointly with study coprincipal investigator Prem Pais, MD, at the virtual American Heart Association scientific sessions.
The multinational study provides powerful new support for a broad, population health–based approach to primary cardiovascular prevention.
“If half of eligible people [were to] use a polypill with aspirin, 3-5 million cardiovascular events per year would be avoided globally,” according to Dr. Yusuf, professor of medicine and director of the Population Health Research Institute at McMaster University in Hamilton, Ont.
“This is likely a cost-effective strategy to meet global targets of reducing cardiovascular disease by 30% by 2020,” added Dr. Pais of St. John’s Research Institute in Bangalore, India.
TIPS-3 included 5,713 participants at intermediate cardiovascular risk, with an estimated event risk of 1.8% per year using the INTERHEART Risk Score. Half were women. More than 80% of participants had hypertension, and nearly 40% had diabetes or impaired fasting glucose. Nearly 90% of participants came from India, the Philippines, Malaysia, Indonesia, or Bangladesh. All participants received advice about lifestyle management.
They were then randomized to receive a polypill or placebo, and then each group was further randomized to receive 75 mg/day of aspirin or matching placebo. The polypill contained 40 mg of simvastatin, 100 mg of atenolol, 25 mg of hydrochlorothiazide, and 10 mg of ramipril.
During a mean 4.6 years of follow-up, the primary composite major adverse cardiovascular event rate occurred in 4.4% of the polypill group, 4.1% of the polypill-plus-aspirin group, and 5.8% of the double-placebo group. This translated to a 21% reduction in cardiovascular disease with the polypill, a 31% reduction with polypill plus aspirin, and a 14% reduction in the composite of cardiovascular death, MI, or stroke with aspirin alone.
The polypill and placebo groups diverged in terms of the primary outcome starting about 6 months into the study, Dr. Pais noted.
Serious adverse events were less common with the polypill than with placebo. Importantly, there was no difference in major, minor, or GI bleeding between the polypill-plus-aspirin group and placebo-treated controls. Dr. Yusuf attributed the lack of excess bleeding in aspirin recipients to two factors: people with a history of bleeding or GI symptoms were excluded from TIPS-3, and the dose of aspirin used was lower than in other primary prevention trials, where bleeding offset the reduction in cardiovascular events.
Nonadherence was a major issue in TIPS-3, mainly because of delays in polypill production and distribution, coupled late in the trial with the COVID-19 pandemic. The nonadherence rate was 19% at 2 years, 32% at 4 years, and 43% at the study’s end. Only 5% of discontinuations were due to side effects. In a sensitivity analysis carried out in participants without discontinuation for nonmedical reasons, the benefits of the polypill plus aspirin were larger than in the overall study: a 39% relative risk reduction in the primary endpoint that probably offers a more accurate picture of the combination’s likely real-world performance.
Discussant Anushka Patel, MBBS, PhD, noted that TIPS-3 is the third randomized trial to provide direct evidence that a polypill-based strategy improves clinical outcomes. The effect sizes of the benefits – a 20%-30% reduction in major cardiovascular events – has been consistent in TIPS-3, PolyIran, and HOPE-3, each of which tested a different polypill drug combination.
“If implementation and adherence challenges can be addressed at the system, prescriber, and patient levels, and if high-quality polypills can be made affordable, the public health impact could actually be enormous,” said Dr. Patel, chief scientist at the George Institute for Global Health and professor of medicine at the University of New South Wales in Sydney, Australia.
However, she parted company with Dr. Yusuf regarding routine incorporation of aspirin into polypills.
“I think the totality of evidence would still probably favor taking an individualized approach that also considers bleeding risk,” the cardiologist said.
Donald Lloyd-Jones, MD, who chaired a press conference highlighting TIPS-3, declared, “You’re seeing a paradigm shift right here in front of your eyes today. This could be a game changer in terms of preventing large numbers of cardiovascular events.”
While TIPS-3 was conducted mainly in low- and middle-income countries, it’s important to recognize that’s where 75% of cardiovascular events and cardiovascular deaths now occur.
“This is very much a disease that has emerged in the developing world,” commented Dr. Lloyd-Jones, the AHA president-elect, chair of the AHA Council on Scientific Sessions Programming, and professor and chair of the department of preventive medicine at Northwestern University, Chicago.
He also sees a polypill strategy for primary cardiovascular prevention as highly viable in high-resource countries. It makes sense to employ it there initially in underserved communities, where a polypill-based approach sidesteps difficulties in monitoring care and adjusting medication doses due to reduced access to health care while minimizing cost and adherence issues, he added.
Dr. Yusuf and Dr. Pais reported receiving institutional research support from the TIPS-3 major sponsors: the Wellcome Trust, Cadila Pharmaceuticals, the Canadian Institutes of Health Research, and the Heart and Stroke Foundation of Canada.
Simultaneously with their presentation at AHA 2020, the TIPS-3 results were published online in the New England Journal of Medicine.
SOURCE: Yusuf, S. AHA 2020. Session LBS.02.
REPORTING FROM AHA 2020
A novel method for assessing attractiveness and beauty
While Phi (or the Golden Ratio) and Leonardo da Vinci’s neoclassical canons have been used as traditional mathematical approaches to assess and calculate beauty, there may be more than meets the eye.
This model was created to denote “natural beauty,” both at baseline and after cosmetic procedures, which is what many physicians and patients ideally want to achieve after any aesthetic procedure.
In this model, when all three variables are at a maximum, a desirable attractive appearance is achieved that can be interpreted as “natural.” In his paper introducing this novel model, Dr. Dayan wrote that similar to the time-space dilemma, attractiveness “is relative, dynamic, and highly dependent on the position of the projector and the interpreter.” The 3-D cube of attractiveness “is therefore contained within a fourth dimension that takes into account the perspective of the judger.”

Similarly, in a pilot study,2 Dr. Dayan and colleagues also demonstrated that visually blind individuals can detect beauty. “This study further isolates the nature of beauty as a primal form of messaging that is subconsciously appreciated via embodied senses other than vision,” he and his coauthors wrote.
This observational study consisted of 8 blind and 10 nonblind test subjects and 6 models who were categorized into predetermined beauty categories. Test subjects were blindfolded and unblindfolded during their assessments. All groups rated those models, who were preselected as more beautiful, higher, except for the blindfolded, nonblind group – demonstrating a primal or neural pathway ability to perceive attractiveness in blind individuals. The study, “revealed that beauty is not only detected by visual sense but also through embodied senses other than sight,” the authors commented.

It should be noted that sometimes ethnic features and features that are unique outside of the neoclassical canons or golden ratio can also uniquely make people look more attractive. Ethnic variations in beauty standards exist and need to be further studied and celebrated. There is certainly high expertise and an art required to perceiving aesthetics and performing aesthetic procedures, further exemplified by the complex nature of the different models and mathematical approaches of assessing it. These newer models account for attractiveness that may also start on the inside or beyond purely visual perception.
Dr. Wesley and Dr. Talakoub are cocontributors to this column. Dr. Wesley practices dermatology in Beverly Hills, Calif. Dr. Talakoub is in private practice in McLean, Va. This month’s column is by Dr. Wesley. Write to them at [email protected]. They had no relevant disclosures.
References:
1. Dayan S, Romero DH. J Cosmet Dermatol. 2018 Oct;17(5):925-30.
2. Dayan SH et al. Dermatol Surg. 2020 Oct;46(10):1317-22.
While Phi (or the Golden Ratio) and Leonardo da Vinci’s neoclassical canons have been used as traditional mathematical approaches to assess and calculate beauty, there may be more than meets the eye.
This model was created to denote “natural beauty,” both at baseline and after cosmetic procedures, which is what many physicians and patients ideally want to achieve after any aesthetic procedure.
In this model, when all three variables are at a maximum, a desirable attractive appearance is achieved that can be interpreted as “natural.” In his paper introducing this novel model, Dr. Dayan wrote that similar to the time-space dilemma, attractiveness “is relative, dynamic, and highly dependent on the position of the projector and the interpreter.” The 3-D cube of attractiveness “is therefore contained within a fourth dimension that takes into account the perspective of the judger.”
Similarly, in a pilot study,2 Dr. Dayan and colleagues also demonstrated that visually blind individuals can detect beauty. “This study further isolates the nature of beauty as a primal form of messaging that is subconsciously appreciated via embodied senses other than vision,” he and his coauthors wrote.
This observational study consisted of 8 blind and 10 nonblind test subjects and 6 models who were categorized into predetermined beauty categories. Test subjects were blindfolded and unblindfolded during their assessments. All groups rated those models, who were preselected as more beautiful, higher, except for the blindfolded, nonblind group – demonstrating a primal or neural pathway ability to perceive attractiveness in blind individuals. The study, “revealed that beauty is not only detected by visual sense but also through embodied senses other than sight,” the authors commented.
It should be noted that sometimes ethnic features and features that are unique outside of the neoclassical canons or golden ratio can also uniquely make people look more attractive. Ethnic variations in beauty standards exist and need to be further studied and celebrated. There is certainly high expertise and an art required to perceiving aesthetics and performing aesthetic procedures, further exemplified by the complex nature of the different models and mathematical approaches of assessing it. These newer models account for attractiveness that may also start on the inside or beyond purely visual perception.
Dr. Wesley and Dr. Talakoub are cocontributors to this column. Dr. Wesley practices dermatology in Beverly Hills, Calif. Dr. Talakoub is in private practice in McLean, Va. This month’s column is by Dr. Wesley. Write to them at [email protected]. They had no relevant disclosures.
References:
1. Dayan S, Romero DH. J Cosmet Dermatol. 2018 Oct;17(5):925-30.
2. Dayan SH et al. Dermatol Surg. 2020 Oct;46(10):1317-22.