User login
Testicular cancer deaths rising among Hispanic men
, but there are wide variations by race/ethnicity and geographic location, a new analysis shows.
Testicular cancer is the most common type of malignancy in young men between the ages of 20 and 34 years, although overall, it is relatively uncommon and represents only 0.5% of all new cancer cases in the U.S.
The new analysis shows that age-adjusted testicular cancer–specific mortality rates in the United States increased from 1999-2019, particularly among Hispanic men. During the same period, mortality rates declined somewhat among Black men as compared to White men.
“Given that testicular cancer generally has a favorable prognosis, it is concerning that mortality rates for this disease are increasing,” said lead author Anushka Ghosh, BS, a clinical research coordinator at Massachusetts General Hospital, Boston. “It is crucial to understand these trends and make targeted efforts to address any geographic, racial, and ethnic gaps in testicular cancer care.”
She presented the findings at the Genitourinary Cancers Symposium (GUCS) 2022.
“Testicular cancer is a rare but very curable disease,” said Daniel Geynisman, MD, associate professor in the Department of Hematology/Oncology at Fox Chase Cancer Center, Philadelphia, who was approached for comment. “The increase in testicular cancer deaths for Hispanic men is concerning.”
“Whether this change relates to suboptimal access to appropriate care or change in biology as a result of socioeconomic or geographic changes in Hispanic men over the recent years is unknown but needs to be urgently explored and addressed,” he added.
Details of the new findings
For their analysis, Ms. Ghosh and colleagues assessed recent changes in testicular cancer mortality rates over time in the United States with respect to race, ethnicity, and geography. They used the Centers for Disease Control’s Wide-Ranging Online Data for Epidemiologic Research database to obtain the number of age-adjusted death rates for individuals across all U.S. counties over a 21-year period (1999-2019).
During this period, overall age-adjusted testicular cancer mortality rates rose slowly but not significantly, with an overall increase of 0.0002 per 100,000 population per year. This increase was significantly worse among Hispanic men, among whom the increase was 0.0019 per 100,000, compared with a 0.0003 per 100,000 decrease among non-Hispanic men (comparison P = .010).
But when stratified by race (Black vs. White), the authors saw that Black men had somewhat improved rates. Among Black men, the rate decreased by 0.0007 per 100,000, compared with an increase of 0.0006 per 100,000 among White men, a difference that reached statistical significance (P = .049).
“We also observed significant geographical differences in mortality rates,” said Ms. Ghosh.
They divided the U.S. into four regions: the Northeast, the Midwest, the South, and the West. There were no differences in the South and the Midwest, but mortality rates decreased in the Northeast by 0.00092 per 100,000 and rose in the West by 0.00086 per 100,000 (P for difference between slopes = .032).
The authors also looked at differences in urbanization categories or population density and found that large central metro regions (central counties in metro areas with population greater than 1 million) and small metro regions (counties with population 50,000-249,999) were significantly different. While testicular cancer mortality rates decreased slightly in large central metropolitan regions by 0.0004, rates increased slightly in small metropolitan regions (0.0022; P for difference = .048). No other significant differences based on urbanization were noted.
Also approached for comment, Matt D. Galsky, MD, director of genitourinary medical oncology at the Tisch Cancer Institute at Mount Sinai, noted that the finding that testicular cancer mortality rates increased from 1999-2019 was not statistically significant.
However, there were significant trends among subgroups. Testicular cancer mortality increased during this period among Hispanic men, he pointed out. “Importantly, while statistically significant, the differences are numerically small. That said, testicular cancer is a generally a highly curable malignancy, so any disparities related to mortality may be notable and worth further investigation.
“There are several potential underlying causes of such disparities, some of which could be probed with additional clinical details, and some of which might involve a more complex interplay of access and tumor biology,” he continued. “For example, testicular cancers are broadly separated into two subtypes: seminoma and nonseminoma. Whether the trends in these two subtypes in Hispanic men are different compared to non-Hispanic men could be one clue into the observed disparities.”
Ms. Ghosh, Dr. Geynisman, and Dr. Galsky have disclosed no relevant financial relationships.
A version of this article first appeared on Medscape.com.
FROM ASCO GI 2022
Patch Testing on Dupilumab: Reliable or Not?
In patients with persistent atopic dermatitis (AD) who are taking dupilumab, is there benefit of patch testing to determine if allergic contact dermatitis (ACD) also is contributing to their disease? Results of patch testing are likely be influenced by the immunomodulatory effects of dupilumab. Similar to the recommendation for patients to refrain from using topical or systemic corticosteroids for 1 week or more prior to patch testing to eliminate false negatives, we reviewed the literature to create practice guidelines for dermatologists regarding patch testing while a patient is taking dupilumab.
Pathophysiology and Pathomechanism
Dupilumab functions through the blockade of T helper 2 (TH2) cells; ACD is propagated through the T helper 1 (TH1) cellular pathway. However, patients with ACD that is unresponsive to allergen avoidance and traditional therapies, such as topical and oral corticosteroids, have responded to dupilumab. The more common reports of this responsiveness are with fragrances; multiple case series described patients with ACD to fragrance mix I1 and balsam of Peru1,2 who improved on dupilumab when other treatments failed. There also are reports of response when ACD was secondary to nickel,2,3p-phenylenediamine,1 Compositae,4 and non–formaldehyde-releasing preservatives (non-FRPs).5 Therefore, not all ACD is propagated through the TH1 cellular pathway.
As noted in these cases, ACD can be a response to an allergen whose pathogenesis involves the TH2 pathway or when patient characteristics favor a TH2 response. It has been suggested that AD patients are more susceptible to TH2-mediated contact sensitization to less-potent allergens, such as fragrances.6
Patch Test Results
Positive patch test results for allergens have been reported while patients are on dupilumab therapy, including a few studies in which results prior to starting dupilumab were compared with those while patients were on dupilumab therapy. In a retrospective chart review of 48 patients on dupilumab for AD with persistent disease, 23 patients were patch tested before and during dupilumab therapy. In these patients, the majority of contact allergies were persistent and only 10% (13/125) of patch test–positive results resolved on dupilumab therapy.7 Contact allergies that resolved included those to emulsifiers (propylene glycol, Amerchol L101 [lanolin-containing products found in cosmetics and other goods], dimethylaminopropylamine), fragrances (fragrance mix I, balsam of Peru), sunscreens (sulisobenzone, phenylbenzimidazole-5-sulfonic acid), and metals (vanadium chloride, phenylmercuric acetate).7 The following results observed in individual cases demonstrated conflicting findings: persistence of allergy to non-FRPs (methylisothiazolinone [MI]) but resolution of allergy to formaldehyde8; persistence of allergy to corticosteroids (budesonide and alclometasone)9; persistence of allergy to an antibiotic (neomycin sulfate) but resolution of allergies to a different antibiotic (bacitracin), glues (ethyl acrylate), bleach, and glutaraldehyde9; persistence of nickel allergy but resolution of allergies to fragrances (cinnamic aldehyde, balsam of Peru) and non-FRPs (methylchloroisothiazolinone or MI)10; and persistence of allergies to non-FRPs (MI) and FRPs (bronopol) but resolution of allergies to nickel, fragrances (hydroperoxides of linalool), and Compositae.11 Additional case reports of positive patch test results while on dupilumab but with no pretreatment results for comparison include allergies to rubber additives,12-14 nickel,14 textile dyes,14 cosmetic and hair care additives,12,14,15 corticosteroids,15 FRPs,15 fragrances,15,16 emulsifiers,16 and non-FRPs.17
An evident theme in the dupilumab patch-testing literature has been that results are variable and case specific: a given patient with ACD to an allergen will respond to dupilumab treatment and have subsequent negative patch testing, while another patient will not respond to dupilumab treatment and have persistent positive patch testing. This is likely because, in certain individuals, the allergen-immune system combination shifts ACD pathogenesis from a purely TH1 response to at least a partial TH2 response, thus allowing for benefit from dupilumab therapy. T helper 1 cell–mediated ACD should not be affected by dupilumab; therefore, reliable results can be elucidated from patch testing despite the drug.
Final Thoughts
We propose that AD patients with residual disease after taking dupilumab undergo patch testing. Positive results indicate allergens that are not inhibited by the drug. Patients will need to follow strict allergen avoidance to resolve this component of their disease; failure to improve might suggest the result was a nonrelevant positive.
If patch testing is negative, an alternative cause for residual disease must be sought. We do not recommend stopping dupilumab prior to patch testing to avoid a disease flare from AD or possible TH2-mediated ACD.
- Chipalkatti N, Lee N, Zancanaro P, et al. Dupilumab as a treatment for allergic contact dermatitis. Dermatitis. 2018;29:347-348. doi:10.1097/DER.0000000000000414
- Jacob SE, Sung CT, Machler BC. Dupilumab for systemic allergy syndrome with dermatitis. Dermatitis. 2019;30:164-167. doi:10.1097/DER.0000000000000446
- Joshi SR, Khan DA. Effective use of dupilumab in managing systemic allergic contact dermatitis. Dermatitis. 2018;29:282-284. doi:10.1097/DER.0000000000000409
- Ruge IF, Skov L, Zachariae C, et al. Dupilumab treatment in two patients with severe allergic contact dermatitis caused by sesquiterpene lactones. Contact Dermatitis. 2020:83;137-139. doi:10.1111/cod.13545
- Goldminz AM, Scheinman PL. A case series of dupilumab-treated allergic contact dermatitis patients. Dermatol Ther. 2018;31:e12701. doi:10.1111/dth.12701
- Kohli N, Nedorost S. Inflamed skin predisposes to sensitization to less potent allergens. J Am Acad Dermatol. 2016;75:312-317. doi:10.1016/j.jaad.2016.03.010
- Raffi J, Suresh R, Botto N, et al. The impact of dupilumab on patch testing and the prevalence of comorbid allergic contact dermatitis in recalcitrant atopic dermatitis: a retrospective chart review. J Am Acad Dermatol. 2020;82:132-138. doi:10.1016/j.jaad.2019.09.028
- Puza CJ, Atwater AR. Positive patch test reaction in a patient taking dupilumab. Dermatitis. 2018;29:89. doi:10.1097/DER.0000000000000346
- Suresh R, Murase JE. The role of expanded series patch testing in identifying causality of residual facial dermatitis following initiation of dupilumab therapy. JAAD Case Rep. 2018;4:899-904. doi:10.1016/j.jdcr.2018.08.027
- Stout M, Silverberg JI. Variable impact of dupilumab on patch testing results and allergic contact dermatitis in adults with atopic dermatitis. J Am Acad Dermatol. 2019;81:157-162. doi:10.1016/j.jaad.2019.03.020
- Raffi J, Botto N. Patch testing and allergen-specific inhibition in a patient taking dupilumab. JAMA Dermatol. 2019;155:120-121. doi:10.1001/jamadermatol.2018.4098
- Hoot JW, Douglas JD, Falo LD Jr. Patch testing in a patient on dupilumab. Dermatitis. 2018;29:164. doi:10.1097/DER.0000000000000357
- Crepy M-N, Nosbaum A, Bensefa-Colas L. Blocking type 2 inflammation by dupilumab does not control classic (type 1-driven) allergic contact dermatitis in chronic hand eczema. Contact Dermatitis. 2019;81:145-147. doi:10.1111/cod.13266
- Raffi J, Chen R, Botto N. Wide dye reactors. JAAD Case Rep. 2019;5:877-879. doi:10.1016/j.jdcr.2019.08.005
- Koblinski JE, Hamann D. Mixed occupational and iatrogenic allergic contact dermatitis in a hairdresser. Occup Med (Lond). 2020;70:523-526. doi:10.1093/occmed/kqaa152
- Raffi J, Suresh R, Fishman H, et al. Investigating the role of allergic contact dermatitis in residual ocular surface disease on dupilumab (ROSDD). Int J Womens Dermatol. 2019;5:308-313. doi:10.1016/j.ijwd.2019.10.001
- Zhu GA, Chen JK, Chiou A, et al. Repeat patch testing in a patient with allergic contact dermatitis improved on dupilumab. JAAD Case Rep. 2019;5:336-338. doi:10.1016/j.jdcr.2019.01.023
In patients with persistent atopic dermatitis (AD) who are taking dupilumab, is there benefit of patch testing to determine if allergic contact dermatitis (ACD) also is contributing to their disease? Results of patch testing are likely be influenced by the immunomodulatory effects of dupilumab. Similar to the recommendation for patients to refrain from using topical or systemic corticosteroids for 1 week or more prior to patch testing to eliminate false negatives, we reviewed the literature to create practice guidelines for dermatologists regarding patch testing while a patient is taking dupilumab.
Pathophysiology and Pathomechanism
Dupilumab functions through the blockade of T helper 2 (TH2) cells; ACD is propagated through the T helper 1 (TH1) cellular pathway. However, patients with ACD that is unresponsive to allergen avoidance and traditional therapies, such as topical and oral corticosteroids, have responded to dupilumab. The more common reports of this responsiveness are with fragrances; multiple case series described patients with ACD to fragrance mix I1 and balsam of Peru1,2 who improved on dupilumab when other treatments failed. There also are reports of response when ACD was secondary to nickel,2,3p-phenylenediamine,1 Compositae,4 and non–formaldehyde-releasing preservatives (non-FRPs).5 Therefore, not all ACD is propagated through the TH1 cellular pathway.
As noted in these cases, ACD can be a response to an allergen whose pathogenesis involves the TH2 pathway or when patient characteristics favor a TH2 response. It has been suggested that AD patients are more susceptible to TH2-mediated contact sensitization to less-potent allergens, such as fragrances.6
Patch Test Results
Positive patch test results for allergens have been reported while patients are on dupilumab therapy, including a few studies in which results prior to starting dupilumab were compared with those while patients were on dupilumab therapy. In a retrospective chart review of 48 patients on dupilumab for AD with persistent disease, 23 patients were patch tested before and during dupilumab therapy. In these patients, the majority of contact allergies were persistent and only 10% (13/125) of patch test–positive results resolved on dupilumab therapy.7 Contact allergies that resolved included those to emulsifiers (propylene glycol, Amerchol L101 [lanolin-containing products found in cosmetics and other goods], dimethylaminopropylamine), fragrances (fragrance mix I, balsam of Peru), sunscreens (sulisobenzone, phenylbenzimidazole-5-sulfonic acid), and metals (vanadium chloride, phenylmercuric acetate).7 The following results observed in individual cases demonstrated conflicting findings: persistence of allergy to non-FRPs (methylisothiazolinone [MI]) but resolution of allergy to formaldehyde8; persistence of allergy to corticosteroids (budesonide and alclometasone)9; persistence of allergy to an antibiotic (neomycin sulfate) but resolution of allergies to a different antibiotic (bacitracin), glues (ethyl acrylate), bleach, and glutaraldehyde9; persistence of nickel allergy but resolution of allergies to fragrances (cinnamic aldehyde, balsam of Peru) and non-FRPs (methylchloroisothiazolinone or MI)10; and persistence of allergies to non-FRPs (MI) and FRPs (bronopol) but resolution of allergies to nickel, fragrances (hydroperoxides of linalool), and Compositae.11 Additional case reports of positive patch test results while on dupilumab but with no pretreatment results for comparison include allergies to rubber additives,12-14 nickel,14 textile dyes,14 cosmetic and hair care additives,12,14,15 corticosteroids,15 FRPs,15 fragrances,15,16 emulsifiers,16 and non-FRPs.17
An evident theme in the dupilumab patch-testing literature has been that results are variable and case specific: a given patient with ACD to an allergen will respond to dupilumab treatment and have subsequent negative patch testing, while another patient will not respond to dupilumab treatment and have persistent positive patch testing. This is likely because, in certain individuals, the allergen-immune system combination shifts ACD pathogenesis from a purely TH1 response to at least a partial TH2 response, thus allowing for benefit from dupilumab therapy. T helper 1 cell–mediated ACD should not be affected by dupilumab; therefore, reliable results can be elucidated from patch testing despite the drug.
Final Thoughts
We propose that AD patients with residual disease after taking dupilumab undergo patch testing. Positive results indicate allergens that are not inhibited by the drug. Patients will need to follow strict allergen avoidance to resolve this component of their disease; failure to improve might suggest the result was a nonrelevant positive.
If patch testing is negative, an alternative cause for residual disease must be sought. We do not recommend stopping dupilumab prior to patch testing to avoid a disease flare from AD or possible TH2-mediated ACD.
- Chipalkatti N, Lee N, Zancanaro P, et al. Dupilumab as a treatment for allergic contact dermatitis. Dermatitis. 2018;29:347-348. doi:10.1097/DER.0000000000000414
- Jacob SE, Sung CT, Machler BC. Dupilumab for systemic allergy syndrome with dermatitis. Dermatitis. 2019;30:164-167. doi:10.1097/DER.0000000000000446
- Joshi SR, Khan DA. Effective use of dupilumab in managing systemic allergic contact dermatitis. Dermatitis. 2018;29:282-284. doi:10.1097/DER.0000000000000409
- Ruge IF, Skov L, Zachariae C, et al. Dupilumab treatment in two patients with severe allergic contact dermatitis caused by sesquiterpene lactones. Contact Dermatitis. 2020:83;137-139. doi:10.1111/cod.13545
- Goldminz AM, Scheinman PL. A case series of dupilumab-treated allergic contact dermatitis patients. Dermatol Ther. 2018;31:e12701. doi:10.1111/dth.12701
- Kohli N, Nedorost S. Inflamed skin predisposes to sensitization to less potent allergens. J Am Acad Dermatol. 2016;75:312-317. doi:10.1016/j.jaad.2016.03.010
- Raffi J, Suresh R, Botto N, et al. The impact of dupilumab on patch testing and the prevalence of comorbid allergic contact dermatitis in recalcitrant atopic dermatitis: a retrospective chart review. J Am Acad Dermatol. 2020;82:132-138. doi:10.1016/j.jaad.2019.09.028
- Puza CJ, Atwater AR. Positive patch test reaction in a patient taking dupilumab. Dermatitis. 2018;29:89. doi:10.1097/DER.0000000000000346
- Suresh R, Murase JE. The role of expanded series patch testing in identifying causality of residual facial dermatitis following initiation of dupilumab therapy. JAAD Case Rep. 2018;4:899-904. doi:10.1016/j.jdcr.2018.08.027
- Stout M, Silverberg JI. Variable impact of dupilumab on patch testing results and allergic contact dermatitis in adults with atopic dermatitis. J Am Acad Dermatol. 2019;81:157-162. doi:10.1016/j.jaad.2019.03.020
- Raffi J, Botto N. Patch testing and allergen-specific inhibition in a patient taking dupilumab. JAMA Dermatol. 2019;155:120-121. doi:10.1001/jamadermatol.2018.4098
- Hoot JW, Douglas JD, Falo LD Jr. Patch testing in a patient on dupilumab. Dermatitis. 2018;29:164. doi:10.1097/DER.0000000000000357
- Crepy M-N, Nosbaum A, Bensefa-Colas L. Blocking type 2 inflammation by dupilumab does not control classic (type 1-driven) allergic contact dermatitis in chronic hand eczema. Contact Dermatitis. 2019;81:145-147. doi:10.1111/cod.13266
- Raffi J, Chen R, Botto N. Wide dye reactors. JAAD Case Rep. 2019;5:877-879. doi:10.1016/j.jdcr.2019.08.005
- Koblinski JE, Hamann D. Mixed occupational and iatrogenic allergic contact dermatitis in a hairdresser. Occup Med (Lond). 2020;70:523-526. doi:10.1093/occmed/kqaa152
- Raffi J, Suresh R, Fishman H, et al. Investigating the role of allergic contact dermatitis in residual ocular surface disease on dupilumab (ROSDD). Int J Womens Dermatol. 2019;5:308-313. doi:10.1016/j.ijwd.2019.10.001
- Zhu GA, Chen JK, Chiou A, et al. Repeat patch testing in a patient with allergic contact dermatitis improved on dupilumab. JAAD Case Rep. 2019;5:336-338. doi:10.1016/j.jdcr.2019.01.023
Practice Points
- Allergic contact dermatitis is an important diagnostic consideration in patients with refractory or persistent dermatitis.
- Patch testing is important to help determine a possible allergic contactant, but there is confusion about its accuracy in patients taking dupilumab.
- Patients with residual dermatitis while on dupilumab are likely to benefit from patch testing.
Wet Your Whistles: Alcohol-Induced Flushing With Use of Topical Calcineurin Inhibitors
Practice Gap
The topical calcineurin inhibitors (TCIs) tacrolimus and pimecrolimus are US Food and Drug Administration approved for the treatment of atopic dermatitis.1 In addition, these 2 drugs are utilized off label for many other dermatologic conditions, including vitiligo, psoriasis, and periorificial dermatitis. They can be used safely for prolonged periods and on sensitive areas, including the face.
Treatment with a TCI provides advantages over topical steroids, which can cause atrophy, telangiectasia, dyspigmentation, ocular hypertension, cataracts, and tachyphylaxis after prolonged use. Adverse events resulting from use of a TCI most commonly include transient burning, warmth, and erythema in areas of application. Patients typically acclimate to these effects after a few consecutive days of use.
Localized flushing after alcohol ingestion is a known potential side effect of TCIs1; however, this association may be underappreciated and underreported to patients.
Counseling Patients Taking TCIs
Topical calcineurin inhibitors cause alcohol-induced flushing on areas of application (Figures 1 and 2) in approximately 3.4% to 6.9% of patients.1 The reaction has been reported with both topical TCIs but more often is noted with tacrolimus.2,3 Typically, flushing begins 2 to 4 weeks after treatment is initiated and within 5 to 20 minutes after alcohol intake.4 The phenomenon is self-limited; erythema typically resolves in 20 to 60 minutes.
 to the entire face")
Topical calcineurin inhibitors are hypothesized to cause alcohol-induced flushing by locally inhibiting acetaldehyde dehydrogenase, an enzyme necessary for alcohol metabolism. This leads to accumulation of acetaldehyde, a by-product of alcohol metabolism, which indirectly causes concentrated vasodilation by means of prostaglandins, histamines, and other vasodilatory mediators. The combination of ethanol and a TCI also might induce release of neuropeptides, which could cause vasodilation.4
Alcohol-related flushing commonly is seen among individuals who are aldehyde dehydrogenase 2 (ALDH2) deficient; it is sometimes accompanied by nausea, headache, and tachycardia. The same pathway is implicated in disulfiram reactions, to a more intense and systemic degree, to discourage alcohol intake.
Oral calcineurin inhibitors are not reported to cause generalized flushing, perhaps because of differences in the relative dose. For example, topical tacrolimus 0.1% is 1 mg/g that is applied to a relatively small body surface area; oral calcineurin inhibitors are dosed at a range of 1 to 15 mg for an entire person.
Notably, erythema that develops after alcohol intake in a patient taking a topical TCI can mimic the dermatosis being treated—similar to one of our patients (Figure 2) whose flushing was mistaken for a flare of periorificial dermatitis—contact dermatitis or another flushing disorder such as rosacea. Uninformed patients might mistakenly self-diagnose the flushing as an allergic or anaphylactic reaction to foods, drugs, or other exposures contemporaneous with alcohol ingestion. The side effect can be frustrating owing to its appearance and discomfort, which often coincide with social interactions involving alcohol.

Techniques to Avoid Flushing
Discontinuing a TCI altogether leads to resolution of associated adverse effects, including flushing, typically within weeks to 1 month.5 Alternatively, oral aspirin (81 mg) might eliminate or attenuate symptoms, as documented in a double-blind, controlled trial in which relief of TCI-induced flushing after consuming wine was investigated.6
Another approach (albeit nontraditional) is for patients who experience this phenomenon to “wet their whistles” with an alcoholic drink before a social engagement. After flushing resolves in 20 to 60 minutes, subsequent drinks do not appear to elicit symptoms again in most patients. That said, we stop short of calling this tip “doctor’s orders.”
Practical Implication
Counseling patients who will be using a TCI—tacrolimus or pimecrolimus—about the potential for these drugs to produce localized flushing after alcohol ingestion as well as techniques for lessening or eliminating this adverse effect are important facets of their dermatologic care.
- Soter NA, Fleischer AB Jr, Webster GF, et al. Tacrolimus ointment for the treatment of atopic dermatitis in adult patients: part II, safety. J Am Acad Dermatol. 2001;44(suppl 1):S39-S46. doi:10.1067/mjd.2001.109817
- Milingou M, Antille C, Sorg O, et al. Alcohol intolerance and facial flushing in patients treated with topical tacrolimus. Arch Dermatol. 2004;140:1542-1544. doi:10.1001/archderm.140.12.1542-b
- Sabater-Abad J, Matellanes-Palacios M, Millán Parrilla F. Image gallery: interaction between alcohol and topical tacrolimus as a cause of facial flushing. Br J Dermatol. 2019;180:E144. doi:10.1111/bjd.17611
- Stinco G, Piccirillo F, Sallustio M, et al. Facial flush reaction after alcohol ingestion during topical pimecrolimus and tacrolimus treatment. Dermatology. 2009;218:71-72. doi:10.1159/000161123
- Lübbe J, Milingou M. Images in clinical medicine. tacrolimus ointment, alcohol, and facial flushing. N Engl J Med. 2004;351:2740. doi:10.1056/NEJMicm040139
- Ehst BD, Warshaw EM. Alcohol-induced application site erythema after topical immunomodulator use and its inhibition by aspirin. Arch Dermatol. 2004;140:1014-1015. doi:10.1001/archderm.140.8.1014
Practice Gap
The topical calcineurin inhibitors (TCIs) tacrolimus and pimecrolimus are US Food and Drug Administration approved for the treatment of atopic dermatitis.1 In addition, these 2 drugs are utilized off label for many other dermatologic conditions, including vitiligo, psoriasis, and periorificial dermatitis. They can be used safely for prolonged periods and on sensitive areas, including the face.
Treatment with a TCI provides advantages over topical steroids, which can cause atrophy, telangiectasia, dyspigmentation, ocular hypertension, cataracts, and tachyphylaxis after prolonged use. Adverse events resulting from use of a TCI most commonly include transient burning, warmth, and erythema in areas of application. Patients typically acclimate to these effects after a few consecutive days of use.
Localized flushing after alcohol ingestion is a known potential side effect of TCIs1; however, this association may be underappreciated and underreported to patients.
Counseling Patients Taking TCIs
Topical calcineurin inhibitors cause alcohol-induced flushing on areas of application (Figures 1 and 2) in approximately 3.4% to 6.9% of patients.1 The reaction has been reported with both topical TCIs but more often is noted with tacrolimus.2,3 Typically, flushing begins 2 to 4 weeks after treatment is initiated and within 5 to 20 minutes after alcohol intake.4 The phenomenon is self-limited; erythema typically resolves in 20 to 60 minutes.
Topical calcineurin inhibitors are hypothesized to cause alcohol-induced flushing by locally inhibiting acetaldehyde dehydrogenase, an enzyme necessary for alcohol metabolism. This leads to accumulation of acetaldehyde, a by-product of alcohol metabolism, which indirectly causes concentrated vasodilation by means of prostaglandins, histamines, and other vasodilatory mediators. The combination of ethanol and a TCI also might induce release of neuropeptides, which could cause vasodilation.4
Alcohol-related flushing commonly is seen among individuals who are aldehyde dehydrogenase 2 (ALDH2) deficient; it is sometimes accompanied by nausea, headache, and tachycardia. The same pathway is implicated in disulfiram reactions, to a more intense and systemic degree, to discourage alcohol intake.
Oral calcineurin inhibitors are not reported to cause generalized flushing, perhaps because of differences in the relative dose. For example, topical tacrolimus 0.1% is 1 mg/g that is applied to a relatively small body surface area; oral calcineurin inhibitors are dosed at a range of 1 to 15 mg for an entire person.
Notably, erythema that develops after alcohol intake in a patient taking a topical TCI can mimic the dermatosis being treated—similar to one of our patients (Figure 2) whose flushing was mistaken for a flare of periorificial dermatitis—contact dermatitis or another flushing disorder such as rosacea. Uninformed patients might mistakenly self-diagnose the flushing as an allergic or anaphylactic reaction to foods, drugs, or other exposures contemporaneous with alcohol ingestion. The side effect can be frustrating owing to its appearance and discomfort, which often coincide with social interactions involving alcohol.
Techniques to Avoid Flushing
Discontinuing a TCI altogether leads to resolution of associated adverse effects, including flushing, typically within weeks to 1 month.5 Alternatively, oral aspirin (81 mg) might eliminate or attenuate symptoms, as documented in a double-blind, controlled trial in which relief of TCI-induced flushing after consuming wine was investigated.6
Another approach (albeit nontraditional) is for patients who experience this phenomenon to “wet their whistles” with an alcoholic drink before a social engagement. After flushing resolves in 20 to 60 minutes, subsequent drinks do not appear to elicit symptoms again in most patients. That said, we stop short of calling this tip “doctor’s orders.”
Practical Implication
Counseling patients who will be using a TCI—tacrolimus or pimecrolimus—about the potential for these drugs to produce localized flushing after alcohol ingestion as well as techniques for lessening or eliminating this adverse effect are important facets of their dermatologic care.
- Soter NA, Fleischer AB Jr, Webster GF, et al. Tacrolimus ointment for the treatment of atopic dermatitis in adult patients: part II, safety. J Am Acad Dermatol. 2001;44(suppl 1):S39-S46. doi:10.1067/mjd.2001.109817
- Milingou M, Antille C, Sorg O, et al. Alcohol intolerance and facial flushing in patients treated with topical tacrolimus. Arch Dermatol. 2004;140:1542-1544. doi:10.1001/archderm.140.12.1542-b
- Sabater-Abad J, Matellanes-Palacios M, Millán Parrilla F. Image gallery: interaction between alcohol and topical tacrolimus as a cause of facial flushing. Br J Dermatol. 2019;180:E144. doi:10.1111/bjd.17611
- Stinco G, Piccirillo F, Sallustio M, et al. Facial flush reaction after alcohol ingestion during topical pimecrolimus and tacrolimus treatment. Dermatology. 2009;218:71-72. doi:10.1159/000161123
- Lübbe J, Milingou M. Images in clinical medicine. tacrolimus ointment, alcohol, and facial flushing. N Engl J Med. 2004;351:2740. doi:10.1056/NEJMicm040139
- Ehst BD, Warshaw EM. Alcohol-induced application site erythema after topical immunomodulator use and its inhibition by aspirin. Arch Dermatol. 2004;140:1014-1015. doi:10.1001/archderm.140.8.1014
Weight-related GI cancer risks partly sex dependent
The results show, for instance, that obesity increases the risk of colon cancer in both men and women but increases the risk of rectal and liver cancers in men only.
“Our data suggest that obesity represents a decisive risk factor for the development of colon, rectal, and liver cancer, partly in a sex-dependent manner,” Sven H. Loosen, MD, of Heinrich Heine University, Düsseldorf, Germany, and colleagues write.
The study was published online Feb. 13 in Cancers.
Among 287,357 adults from the Disease Analyzers database, Dr. Loosen and colleagues compared the development of GI cancers in preobese (body mass index, 25-30 kg/m2) and obese (BMI, 30 mg/m2 or greater) individuals to that of individuals of normal weight (BMI, 18.5-25 kg/m2).
For colon cancer, the authors observed a stepwise increase in the proportion of diagnoses, from 0.5% and 0.64% in normal weight women and men, respectively, to 0.71% and 0.91% in obese women and men, respectively. In multivariable regression models, that translated to a significantly increased risk of colon cancer in obese women (odds ratio, 1.23; 95% confidence interval, 1.03-1.48) and obese men (OR, 1.43; 95% CI, 1.17-1.74).
However, multivariable regression models showed that associations between obesity and rectal and liver cancers occurred only in men (OR, 1.36 and 1.79, respectively).
Notably, the authors also observed a negative association between pre-obesity and stomach cancer in men (OR, 0.65) and obesity and pancreatic cancer in women (OR, 0.61).
In other words, women and men with excess body fat may be “protected” from developing these conditions, “highlighting the complexity of the association between BMI and cancer in the different sexes,” the authors write.
These findings could have implications for prevention and lifestyle programs, the authors say.
“Since pre-obesity and obesity are modifiable risk factors, the current results may help to establish appropriate prevention and lifestyle programs to reduce the high morbidity and mortality of GI tumors in the future,” they conclude. They suggest that some “overweight patients might be presented in a specific interdisciplinary ‘metabolic board’ comprising oncologists and physicians specialized in preventive medicine.”
No specific funding related to this study has been disclosed. The authors have disclosed no relevant financial relationships.
A version of this article first appeared on Medscape.com.
FROM CANCERS
Oral Lichen Planus Treated With Plasma Rich in Growth Factors
Lichen planus is a chronic inflammatory mucocutaneous disease that usually affects the skin and/or the genital and oral mucosae.1,2 This disease classically presents with clinical relapses or outbreaks that alternate with periods of remission or latency. Oral lichen planus (OLP) can present with or without extraoral manifestation. It sometimes is difficult to differentiate OLP from oral lichenoid reactions, which can be related to dental materials, some drugs, and systemic conditions or can be idiopathic.1,2
Oral lichen planus is one of the most common noninfectious diseases of the oral cavity, with a reported prevalence of 1% worldwide and marked geographical differences. In Europe, the prevalence of OLP ranges from 1% to 2%.3,4 It is more frequent in women (1.5:1 to 2:1) and usually appears in the fourth and fifth decades of life.1-4
The causes of OLP have not been entirely elucidated, but it is broadly accepted that there is a deregulation on different T lymphocytes that in turn causes effects on CD8 lymphocytes in response to an external noxa. This unknown “trigger” or starting factor also produces an impact on basal keratinocytes. Therefore, the pathogenesis of lichen planus is influenced by a series of cellular events mediated by different cytokines.2,5,6 Among these, tumor necrosis factor α and IL-1 are known to have important roles in the disease. More recently, other cytokines, such as IL-4, secreted by type 2 helper T cells, also have been related to the development and progression of the oral lesions.5,6 In addition to the factors that generate the onset of the disease, there are others that may precipitate clinical outbreaks. Different factors have been related to the progression of the disease, influencing the initiation, perpetuation, and/or worsening of OLP lesions.1,2 Exactly how these factors affect disease progression is another challenging question. The list of possible or potential factors related to disease progression is long; nonetheless, in the vast majority, a clear explanation at a molecular level has not been clearly demonstrated.2,5
Conventionally, 6 clinical presentations of OLP lesions divided into 2 main groups have been described in the oral cavity: white forms (reticular, papular, and plaquelike) and red forms (erythematous, atrophic-erosive, and bullous).1,7-9
Oral lichen planus mainly is treated with topically or systemically administered steroids based on the presence of symptoms such as pain and inability to perform daily activities (eg, eating, talking).5,10 The treatment of choice often is based on the professional’s experience, as there are no broadly accepted national or international clinical practice guidelines on steroid type, administration route, dose, vehicle for administration, or maintenance.11 Despite this lack of unified criteria, different topical and systemic steroid administration protocols allow a reduction in the symptoms or even the disappearance of the red lesions to be achieved in many cases. Unfortunately, there are many patients with lesions refractory to standard treatments for OLP.12 Several alternatives for these patients have been described in the literature, though on many occasions these alternatives present substantial side effects for the patient.13 The search for an effective treatment without side effects is still challenging. One of the treatments tested under this premise has been the application of plasma rich in growth factors (PRGF) by means of infiltration or topical application, in both cases obtaining good results without side effects.14
We sought to analyze the information from a case series of patients treated at the Eduardo Anitua Clinic (Vitoria-Gasteiz, Spain) and describe the results and follow-up of patients with erosive OLP refractory to standard therapy who have been successfully treated by local infiltration of PRGF as the only treatment.
Material and Methods
Patients—We included data from the database of the clinical center with de-identified information of patients with erosive OLP diagnosed clinically and histopathologically who did not respond to conventional treatment (ie, topical and/or systemic corticosteroids [depending on the case]) as well as patients who presented with extensive erosive OLP with systemic involvement and whose systemic treatment was not effective in resolving oral manifestations.
Therapies Administered and Evaluations—Lesions refractory to conventional corticosteroid protocols had been previously treated for 30 days with 0.5% triamcinolone acetonide mouth rinse followed by a cycle of 1% triamcinolone acetonide mouth rinse. Subsequently, a cycle of oral corticosteroids (prednisone for 30 days: 1 mg/kg/d in a single morning dose with staged reduction after the first week) had been administered. One dayafter the corticosteroid treatment was suspended, the patients were treated by PRGF-Endoret (BTI Biotechnology Institute) infiltration following the protocol described by Anitua et al.15,16
Before starting the infiltrations with PRGF, the patient had been asked to rate the pain level on a visual analog scale (VAS) of 1 to 10, with 10 being the most intense imaginable pain. Pain score was subsequently rated and registered during every visit. An initial photograph of the lesion also was obtained to establish a starting point for further comparisons of clinical evolution of the lesions.
Prior to each infiltration, the plasma was separated into 2 fractions. The second fraction was the one that corresponded to the highest number of platelets and included the 2 mL of plasma just above the white series (or buffy coat). This fraction of plasma was the one used to infiltrate the lesions.
Plasma rich in growth factors was activated just before infiltration. The activation was done by adding 10% calcium chloride. Once activated, it was infiltrated into the active lesion using a 31-G × 1/6-in hypodermic needle and a 2-mL Luer-lock syringe. Infiltrations were performed without anesthesia. Four punctures were made for each ulcerative lesion, dividing the lesion into 4 points: upper, lower, right, and left. Plasma rich in growth factors was infiltrated until a slight blanching was observed in the surrounding tissue. At that moment, the infiltration was stopped and was carried out in the next infiltration site.
One treatment session was performed per week, with follow-up 1 week after treatment. In the control visit, the state of the lesions was re-evaluated, and it was decided whether new infiltrations were needed. The treatment was finished when complete epithelialization of the lesion was visualized or the associated symptoms disappeared. At each visit, photographs were taken, and the patient assessed the severity of pain on the VAS.
Statistical Analysis—A Shapiro-Wilk test was carried out with the obtained data to check the normal distribution of the sample. The evolution of pain during the study was compared by paired t test. The qualitative variables were described by means of a frequency analysis. Quantitative variables were described by the mean and the SD. The data were analyzed with SPSS V15.0 for Windows (SPSS Inc). P<.05 showed statistical significance.
Results
A total of 15 patients were included in the study, all with atrophic-erosive lichen planus. Two patients were male, and 13 were female. The mean age (SD) of the patients included in the study was 55.27 (14.19) years. The mean number of outbreaks per year (SD) was 3.2 (1.7), with a range of 1 to 8 outbreaks.
Healing of OLP Lesions—The number of treatment sessions to achieve complete healing varied among the patients (Figures 1 and 2). Ten patients (66.7%) required a single session, 2 patients (13.3%) required 2 sessions, and 3 patients (20%) required 3 sessions. The mean time (SD) without lesions for the patients who required a single session was 10.9 (5.2) months (range, 6–24 months).

Pain Assessment—The mean (SD) score obtained on the VAS before treatment with PRGF was 8.27 (1.16); this score dropped to 1.27 (1.53) after the first treatment session and was a statistically significant difference (P=.006).

For those patients requiring more than 1 session, the mean (SD) pain scores decreased by 0.75 (0.97) points and 0 points after the first and second sessions of treatment, respectively. The mean (SD) amount of PRGF infiltrated in each patient in the first session was 2.60 (0.63) mL. In the second session, the mean (SD) amount was 1.2 (0.33) mL; these differences were statistically significant (P=.008). In the last session, the mean (SD) amount was 1.1 (0.22) mL.
Follow-up and Adverse Effects—The mean (SD) follow-up time was 47.16 (15.78) months. The patients were free of symptoms, and there were no adverse effects derived from the treatment during follow-up.
Comment
The primary goal of OLP treatment is to stop the outbreaks.1,9,13 The lack of potency of corticosteroids in some patients with OLP could be due in part to the inadequate selection of the vehicle (ointment/oral rinse) for the extension and characteristics of the lesion or because of an inappropriate prescription dose, time, and/or frequency, as described by González-Moles.17 However, even when using an appropriate protocol, some lesions are resistant to topical treatment and require other therapeutic modalities.1,9,13 Previously proposed topical treatments include different immunosuppressants, such as the mammalian target of rapamycin, tacrolimus ointment 0.1%, pimecrolimus cream 1%, or cyclosporine A (50–100 mg/mL) formulations.18 Nevertheless, these drugs seem to have a greater number of side effects than topical steroids, and tacrolimus has been associated with cases of oral malignancy after continuing treatment.15
Severe and/or recalcitrant lesions and extraoral involvement have been successfully treated with systemic prednisone (40–80 mg/d).1,9,13 Nevertheless, systemic corticosteroid toxicity requires that these treatments should be used only when necessary at the lowest possible dose and for the shortest possible duration.19 Other nonpharmacologic options for treatment are photodynamic, UV, and low-level laser therapy.20,21 They have been accepted as supplementary modalities in different inflammatory skin conditions but present important technical requirements. Their effectiveness in corticosteroid-resistant cases have not been definitively assessed. Interestingly, promising results recently have been reported by Bennardo et al22 when comparing the efficacy of autologous platelet concentrates with triamcinolone injection.
In our study, the use of PRGF stopped the lesions’ evolution since the first treatment session, reducing them by 6.5-fold. The positive effects observed may have been promoted by the activity of different proteins present in PRGF (eg, platelet-derived growth factor, vascular endothelial growth factor, transforming growth factor, epidermal growth factor, fibroblast growth factor, fibronectin). These molecules contribute to collagen synthesis; angiogenesis; endothelial cell migration and proliferation; or keratinocyte cell migration, proliferation, differentiation, growth, and migration—phenomena that are essential for healing and re-epithelialization.23-25
Different studies also have supported an anti-inflammatory effect of PRGF mediated by an inhibition of the transcription of nuclear factor–κB and the expression of cyclooxygenase-2 and chemokine receptor type 4 produced by its high content of hepatocyte growth factor or the reduction of inflammatory marker expression, such as intercellular adhesion molecule 1. The development of an efficient 3-dimensional fibrin scaffold formation that occurs after PRGF administration also could facilitate healing, helping some cell populations to guide their position and function.23-25
Limitations of our study include the small number of patients and the absence of a control group. The higher number of female patients in the study did not seem to affect the results, as differences related to gender have not been reported when treating patients with OLP with autologous platelet concentrates or other modalities of treatment.
Conclusion
Results from our study indicate that the use of PRGF could be a new treatment option for OLP cases refractory to conventional therapy. No complications were observed during the treatment procedure or during the complete follow-up period. Nonetheless, new prospective studies with a greater number of patients and longer follow-up periods are needed to confirm these preliminary results.
- Al-Hashimi I, Schifter M, Lockhart PB, et al. Oral lichen planus and oral lichenoid lesions: diagnostic and therapeutic considerations. Oral Surg Oral Med Oral Pathol Oral Radiol Endod. 2007;103:1-12.
- Kurago ZB. Etiology and pathogenesis of oral lichen planus: an overview. Oral Surg Oral Med Oral Pathol Oral Radiol. 2016;122:72-80.
- McCartan BE, Healy CM. The reported prevalence of oral lichen planus: a review and critique. J Oral Pathol Med. 2008;37:447-453.
- González-Moles MÁ, Warnakulasuriya S, González-Ruiz I, et al. Worldwide prevalence of oral lichen planus: a systematic review and meta-analysis. Oral Dis. 2021;27:813-828.
- Nosratzehi T. Oral lichen planus: an overview of potential risk factors, biomarkers and treatments. Asian Pac J Cancer Prev. 2018;19:1161-1167.
- Mehrbani SP, Motahari P, Azar FP, et al. Role of interleukin-4 in pathogenesis of oral lichen planus: a systematic review. Med Oral Patol Oral Cir Bucal. 2020;25:E410-E415.
- Edwards PC, Kelsch R. Oral lichen planus: clinical presentation and management. J Can Dent Assoc. 2002;68:494-499.
- Gorouhi F, Davari P, Fazel N. Cutaneous and mucosal lichen planus: a comprehensive review of clinical subtypes, risk factors, diagnosis, and prognosis. ScientificWorldJournal. 2014;2014:742826.
- Babu A, Chellaswamy S, Muthukumar S, et al. Bullous lichen planus: case report and review. J Pharm Bioallied Sci. 2019;11(suppl 2):S499-S506.
- Thongprasom K, Carrozzo M, Furness S, et al. Interventions for treating oral lichen planus. Cochrane Database Syst Rev. 2011;7:CD001168.
- López-Jornet P, Martínez-Beneyto Y, Nicolás AV, et al. Professional attitudes toward oral lichen planus: need for national and international guidelines. J Eval Clin Pract. 2009;15:541-542.
- Yang H, Wu Y, Jiang L, et al. Possible alternative therapies for oral lichen planus cases refractory to steroid therapies. Oral Surg Oral Med Oral Pathol Oral Radiol. 2016;121:496-509.
- Ribero S, Borradori L. Re: risk of malignancy and systemic absorption after application of topical tacrolimus in oral lichen planus. J Eur Acad Dermatol Venereol. 2017;31:E85-E86.
- Piñas L, Alkhraisat MH, Fernández RS, et al. Biological therapy of refractory ulcerative oral lichen planus with plasma rich in growth factors. Am J Clin Dermatol. 2017;18:429-433.
- Anitua E, Zalduendo MM, Prado R, et al. Morphogen and proinflammatory cytokine release kinetics from PRGF-Endoret fibrin scaffolds: evaluation of the effect of leukocyte inclusion. J Biomed Mater Res A. 2015;103:1011-1020.
- Anitua E, Prado R, Sánchez M, et al. Platelet-rich plasma: preparation and formulation. Oper Tech Orthop. 2012;22:25-32.
- González-Moles MA. The use of topical corticoids in oral pathology. Med Oral Pathol Oral Cir Bucal. 2010;15:E827-E831.
- Siponen M, Huuskonen L, Kallio-Pulkkinen S, et al. Topical tacrolimus, triamcinolone acetonide, and placebo in oral lichen planus: a pilot randomized controlled trial. Oral Dis. 2017;23:660-668.
- Adami G, Saag KG. Glucocorticoid-induced osteoporosis update. Curr Opin Rheumatol. 2019;31:388-393.
- Lavaee F, Shadmanpour M. Comparison of the effect of photodynamic therapy and topical corticosteroid on oral lichen planus lesions. Oral Dis. 2019;25:1954-1963.
- Derikvand N, Ghasemi SS, Moharami M, et al. Management of oral lichen planus by 980 nm diode laser. J Lasers Med Sci. 2017;8:150-154.
- Bennardo F, Liborio F, Barone S, et al. Efficacy of platelet-rich fibrin compared with triamcinolone acetonide as injective therapy in the treatment of symptomatic oral lichen planus: a pilot study. Clin Oral Investig. 2021;25:3747-3755.
- Anitua E, Andia I, Ardanza B, et al. Autologous platelets as a source of proteins for healing and tissue regeneration. Thromb Haemost. 2004;91:4-15.
- Barrientos S, Brem H, Stojadinovic O, et al. Clinical application of growth factors and cytokines in wound healing. Wound Repair Regen. 2014;22:569-578.
- Anitua E. Plasma rich in growth factors: preliminary results of use in the preparation of future sites for implants. Int J Oral Maxillofac Implants. 1999;14:529-535.
Lichen planus is a chronic inflammatory mucocutaneous disease that usually affects the skin and/or the genital and oral mucosae.1,2 This disease classically presents with clinical relapses or outbreaks that alternate with periods of remission or latency. Oral lichen planus (OLP) can present with or without extraoral manifestation. It sometimes is difficult to differentiate OLP from oral lichenoid reactions, which can be related to dental materials, some drugs, and systemic conditions or can be idiopathic.1,2
Oral lichen planus is one of the most common noninfectious diseases of the oral cavity, with a reported prevalence of 1% worldwide and marked geographical differences. In Europe, the prevalence of OLP ranges from 1% to 2%.3,4 It is more frequent in women (1.5:1 to 2:1) and usually appears in the fourth and fifth decades of life.1-4
The causes of OLP have not been entirely elucidated, but it is broadly accepted that there is a deregulation on different T lymphocytes that in turn causes effects on CD8 lymphocytes in response to an external noxa. This unknown “trigger” or starting factor also produces an impact on basal keratinocytes. Therefore, the pathogenesis of lichen planus is influenced by a series of cellular events mediated by different cytokines.2,5,6 Among these, tumor necrosis factor α and IL-1 are known to have important roles in the disease. More recently, other cytokines, such as IL-4, secreted by type 2 helper T cells, also have been related to the development and progression of the oral lesions.5,6 In addition to the factors that generate the onset of the disease, there are others that may precipitate clinical outbreaks. Different factors have been related to the progression of the disease, influencing the initiation, perpetuation, and/or worsening of OLP lesions.1,2 Exactly how these factors affect disease progression is another challenging question. The list of possible or potential factors related to disease progression is long; nonetheless, in the vast majority, a clear explanation at a molecular level has not been clearly demonstrated.2,5
Conventionally, 6 clinical presentations of OLP lesions divided into 2 main groups have been described in the oral cavity: white forms (reticular, papular, and plaquelike) and red forms (erythematous, atrophic-erosive, and bullous).1,7-9
Oral lichen planus mainly is treated with topically or systemically administered steroids based on the presence of symptoms such as pain and inability to perform daily activities (eg, eating, talking).5,10 The treatment of choice often is based on the professional’s experience, as there are no broadly accepted national or international clinical practice guidelines on steroid type, administration route, dose, vehicle for administration, or maintenance.11 Despite this lack of unified criteria, different topical and systemic steroid administration protocols allow a reduction in the symptoms or even the disappearance of the red lesions to be achieved in many cases. Unfortunately, there are many patients with lesions refractory to standard treatments for OLP.12 Several alternatives for these patients have been described in the literature, though on many occasions these alternatives present substantial side effects for the patient.13 The search for an effective treatment without side effects is still challenging. One of the treatments tested under this premise has been the application of plasma rich in growth factors (PRGF) by means of infiltration or topical application, in both cases obtaining good results without side effects.14
We sought to analyze the information from a case series of patients treated at the Eduardo Anitua Clinic (Vitoria-Gasteiz, Spain) and describe the results and follow-up of patients with erosive OLP refractory to standard therapy who have been successfully treated by local infiltration of PRGF as the only treatment.
Material and Methods
Patients—We included data from the database of the clinical center with de-identified information of patients with erosive OLP diagnosed clinically and histopathologically who did not respond to conventional treatment (ie, topical and/or systemic corticosteroids [depending on the case]) as well as patients who presented with extensive erosive OLP with systemic involvement and whose systemic treatment was not effective in resolving oral manifestations.
Therapies Administered and Evaluations—Lesions refractory to conventional corticosteroid protocols had been previously treated for 30 days with 0.5% triamcinolone acetonide mouth rinse followed by a cycle of 1% triamcinolone acetonide mouth rinse. Subsequently, a cycle of oral corticosteroids (prednisone for 30 days: 1 mg/kg/d in a single morning dose with staged reduction after the first week) had been administered. One dayafter the corticosteroid treatment was suspended, the patients were treated by PRGF-Endoret (BTI Biotechnology Institute) infiltration following the protocol described by Anitua et al.15,16
Before starting the infiltrations with PRGF, the patient had been asked to rate the pain level on a visual analog scale (VAS) of 1 to 10, with 10 being the most intense imaginable pain. Pain score was subsequently rated and registered during every visit. An initial photograph of the lesion also was obtained to establish a starting point for further comparisons of clinical evolution of the lesions.
Prior to each infiltration, the plasma was separated into 2 fractions. The second fraction was the one that corresponded to the highest number of platelets and included the 2 mL of plasma just above the white series (or buffy coat). This fraction of plasma was the one used to infiltrate the lesions.
Plasma rich in growth factors was activated just before infiltration. The activation was done by adding 10% calcium chloride. Once activated, it was infiltrated into the active lesion using a 31-G × 1/6-in hypodermic needle and a 2-mL Luer-lock syringe. Infiltrations were performed without anesthesia. Four punctures were made for each ulcerative lesion, dividing the lesion into 4 points: upper, lower, right, and left. Plasma rich in growth factors was infiltrated until a slight blanching was observed in the surrounding tissue. At that moment, the infiltration was stopped and was carried out in the next infiltration site.
One treatment session was performed per week, with follow-up 1 week after treatment. In the control visit, the state of the lesions was re-evaluated, and it was decided whether new infiltrations were needed. The treatment was finished when complete epithelialization of the lesion was visualized or the associated symptoms disappeared. At each visit, photographs were taken, and the patient assessed the severity of pain on the VAS.
Statistical Analysis—A Shapiro-Wilk test was carried out with the obtained data to check the normal distribution of the sample. The evolution of pain during the study was compared by paired t test. The qualitative variables were described by means of a frequency analysis. Quantitative variables were described by the mean and the SD. The data were analyzed with SPSS V15.0 for Windows (SPSS Inc). P<.05 showed statistical significance.
Results
A total of 15 patients were included in the study, all with atrophic-erosive lichen planus. Two patients were male, and 13 were female. The mean age (SD) of the patients included in the study was 55.27 (14.19) years. The mean number of outbreaks per year (SD) was 3.2 (1.7), with a range of 1 to 8 outbreaks.
Healing of OLP Lesions—The number of treatment sessions to achieve complete healing varied among the patients (Figures 1 and 2). Ten patients (66.7%) required a single session, 2 patients (13.3%) required 2 sessions, and 3 patients (20%) required 3 sessions. The mean time (SD) without lesions for the patients who required a single session was 10.9 (5.2) months (range, 6–24 months).
Pain Assessment—The mean (SD) score obtained on the VAS before treatment with PRGF was 8.27 (1.16); this score dropped to 1.27 (1.53) after the first treatment session and was a statistically significant difference (P=.006).
For those patients requiring more than 1 session, the mean (SD) pain scores decreased by 0.75 (0.97) points and 0 points after the first and second sessions of treatment, respectively. The mean (SD) amount of PRGF infiltrated in each patient in the first session was 2.60 (0.63) mL. In the second session, the mean (SD) amount was 1.2 (0.33) mL; these differences were statistically significant (P=.008). In the last session, the mean (SD) amount was 1.1 (0.22) mL.
Follow-up and Adverse Effects—The mean (SD) follow-up time was 47.16 (15.78) months. The patients were free of symptoms, and there were no adverse effects derived from the treatment during follow-up.
Comment
The primary goal of OLP treatment is to stop the outbreaks.1,9,13 The lack of potency of corticosteroids in some patients with OLP could be due in part to the inadequate selection of the vehicle (ointment/oral rinse) for the extension and characteristics of the lesion or because of an inappropriate prescription dose, time, and/or frequency, as described by González-Moles.17 However, even when using an appropriate protocol, some lesions are resistant to topical treatment and require other therapeutic modalities.1,9,13 Previously proposed topical treatments include different immunosuppressants, such as the mammalian target of rapamycin, tacrolimus ointment 0.1%, pimecrolimus cream 1%, or cyclosporine A (50–100 mg/mL) formulations.18 Nevertheless, these drugs seem to have a greater number of side effects than topical steroids, and tacrolimus has been associated with cases of oral malignancy after continuing treatment.15
Severe and/or recalcitrant lesions and extraoral involvement have been successfully treated with systemic prednisone (40–80 mg/d).1,9,13 Nevertheless, systemic corticosteroid toxicity requires that these treatments should be used only when necessary at the lowest possible dose and for the shortest possible duration.19 Other nonpharmacologic options for treatment are photodynamic, UV, and low-level laser therapy.20,21 They have been accepted as supplementary modalities in different inflammatory skin conditions but present important technical requirements. Their effectiveness in corticosteroid-resistant cases have not been definitively assessed. Interestingly, promising results recently have been reported by Bennardo et al22 when comparing the efficacy of autologous platelet concentrates with triamcinolone injection.
In our study, the use of PRGF stopped the lesions’ evolution since the first treatment session, reducing them by 6.5-fold. The positive effects observed may have been promoted by the activity of different proteins present in PRGF (eg, platelet-derived growth factor, vascular endothelial growth factor, transforming growth factor, epidermal growth factor, fibroblast growth factor, fibronectin). These molecules contribute to collagen synthesis; angiogenesis; endothelial cell migration and proliferation; or keratinocyte cell migration, proliferation, differentiation, growth, and migration—phenomena that are essential for healing and re-epithelialization.23-25
Different studies also have supported an anti-inflammatory effect of PRGF mediated by an inhibition of the transcription of nuclear factor–κB and the expression of cyclooxygenase-2 and chemokine receptor type 4 produced by its high content of hepatocyte growth factor or the reduction of inflammatory marker expression, such as intercellular adhesion molecule 1. The development of an efficient 3-dimensional fibrin scaffold formation that occurs after PRGF administration also could facilitate healing, helping some cell populations to guide their position and function.23-25
Limitations of our study include the small number of patients and the absence of a control group. The higher number of female patients in the study did not seem to affect the results, as differences related to gender have not been reported when treating patients with OLP with autologous platelet concentrates or other modalities of treatment.
Conclusion
Results from our study indicate that the use of PRGF could be a new treatment option for OLP cases refractory to conventional therapy. No complications were observed during the treatment procedure or during the complete follow-up period. Nonetheless, new prospective studies with a greater number of patients and longer follow-up periods are needed to confirm these preliminary results.
- Al-Hashimi I, Schifter M, Lockhart PB, et al. Oral lichen planus and oral lichenoid lesions: diagnostic and therapeutic considerations. Oral Surg Oral Med Oral Pathol Oral Radiol Endod. 2007;103:1-12.
- Kurago ZB. Etiology and pathogenesis of oral lichen planus: an overview. Oral Surg Oral Med Oral Pathol Oral Radiol. 2016;122:72-80.
- McCartan BE, Healy CM. The reported prevalence of oral lichen planus: a review and critique. J Oral Pathol Med. 2008;37:447-453.
- González-Moles MÁ, Warnakulasuriya S, González-Ruiz I, et al. Worldwide prevalence of oral lichen planus: a systematic review and meta-analysis. Oral Dis. 2021;27:813-828.
- Nosratzehi T. Oral lichen planus: an overview of potential risk factors, biomarkers and treatments. Asian Pac J Cancer Prev. 2018;19:1161-1167.
- Mehrbani SP, Motahari P, Azar FP, et al. Role of interleukin-4 in pathogenesis of oral lichen planus: a systematic review. Med Oral Patol Oral Cir Bucal. 2020;25:E410-E415.
- Edwards PC, Kelsch R. Oral lichen planus: clinical presentation and management. J Can Dent Assoc. 2002;68:494-499.
- Gorouhi F, Davari P, Fazel N. Cutaneous and mucosal lichen planus: a comprehensive review of clinical subtypes, risk factors, diagnosis, and prognosis. ScientificWorldJournal. 2014;2014:742826.
- Babu A, Chellaswamy S, Muthukumar S, et al. Bullous lichen planus: case report and review. J Pharm Bioallied Sci. 2019;11(suppl 2):S499-S506.
- Thongprasom K, Carrozzo M, Furness S, et al. Interventions for treating oral lichen planus. Cochrane Database Syst Rev. 2011;7:CD001168.
- López-Jornet P, Martínez-Beneyto Y, Nicolás AV, et al. Professional attitudes toward oral lichen planus: need for national and international guidelines. J Eval Clin Pract. 2009;15:541-542.
- Yang H, Wu Y, Jiang L, et al. Possible alternative therapies for oral lichen planus cases refractory to steroid therapies. Oral Surg Oral Med Oral Pathol Oral Radiol. 2016;121:496-509.
- Ribero S, Borradori L. Re: risk of malignancy and systemic absorption after application of topical tacrolimus in oral lichen planus. J Eur Acad Dermatol Venereol. 2017;31:E85-E86.
- Piñas L, Alkhraisat MH, Fernández RS, et al. Biological therapy of refractory ulcerative oral lichen planus with plasma rich in growth factors. Am J Clin Dermatol. 2017;18:429-433.
- Anitua E, Zalduendo MM, Prado R, et al. Morphogen and proinflammatory cytokine release kinetics from PRGF-Endoret fibrin scaffolds: evaluation of the effect of leukocyte inclusion. J Biomed Mater Res A. 2015;103:1011-1020.
- Anitua E, Prado R, Sánchez M, et al. Platelet-rich plasma: preparation and formulation. Oper Tech Orthop. 2012;22:25-32.
- González-Moles MA. The use of topical corticoids in oral pathology. Med Oral Pathol Oral Cir Bucal. 2010;15:E827-E831.
- Siponen M, Huuskonen L, Kallio-Pulkkinen S, et al. Topical tacrolimus, triamcinolone acetonide, and placebo in oral lichen planus: a pilot randomized controlled trial. Oral Dis. 2017;23:660-668.
- Adami G, Saag KG. Glucocorticoid-induced osteoporosis update. Curr Opin Rheumatol. 2019;31:388-393.
- Lavaee F, Shadmanpour M. Comparison of the effect of photodynamic therapy and topical corticosteroid on oral lichen planus lesions. Oral Dis. 2019;25:1954-1963.
- Derikvand N, Ghasemi SS, Moharami M, et al. Management of oral lichen planus by 980 nm diode laser. J Lasers Med Sci. 2017;8:150-154.
- Bennardo F, Liborio F, Barone S, et al. Efficacy of platelet-rich fibrin compared with triamcinolone acetonide as injective therapy in the treatment of symptomatic oral lichen planus: a pilot study. Clin Oral Investig. 2021;25:3747-3755.
- Anitua E, Andia I, Ardanza B, et al. Autologous platelets as a source of proteins for healing and tissue regeneration. Thromb Haemost. 2004;91:4-15.
- Barrientos S, Brem H, Stojadinovic O, et al. Clinical application of growth factors and cytokines in wound healing. Wound Repair Regen. 2014;22:569-578.
- Anitua E. Plasma rich in growth factors: preliminary results of use in the preparation of future sites for implants. Int J Oral Maxillofac Implants. 1999;14:529-535.
Practice Points
- Treating erosive oral lichen planus lesions refractory to conventional steroid treatments can be challenging for clinicians.
- Complete re-epithelialization and total pain relief could be observed after 1 to 3 weekly perilesional infiltrations with plasma rich in growth factors.
- No relapse of the lesions in the same area or other complications could be observed during the follow-up time.

Interstitial Granulomatous Dermatitis as an Adverse Reaction to Vedolizumab
The number of monoclonal antibodies developed for therapeutic use has rapidly expanded over the last decade due to their generally favorable adverse effect (AE) profiles and efficacy.1 Tumor necrosis factor α inhibitors and general integrin antagonists are well-known examples of such monoclonal antibodies. Common conditions utilizing immunotherapy include inflammatory bowel diseases (IBDs), such as Crohn disease and ulcerative colitis (UC).2
The monoclonal antibody vedolizumab, approved in 2014 for moderate to severe UC and Crohn disease, selectively antagonizes α4β7 integrin to target a specific population of gastrointestinal T lymphocytes, preventing their mobilization to areas of inflammation.3 Adverse effects in patients treated with vedolizumab occur at a rate comparable to placebo and largely are considered nonserious4,5; the most commonly reported AE is disease exacerbation (13%–17% of patients).5,6 Published reports of cutaneous AEs at administration of vedolizumab include urticaria during infusion, appearance of cutaneous manifestations characteristic of IBD, psoriasis, Henoch-Schönlein purpura, and Sweet syndrome.7-10
We present the case of a 61-year-old woman with UC who developed reactive granulomatous dermatitis (RGD), interstitial granulomatous dermatitis (IGD) type secondary to vedolizumab. This adverse reaction has not, to our knowledge, been previously reported.
Case Report
A 61-year-old woman with a medical history of UC treated with vedolizumab and myelodysplastic syndrome treated with intravenous immunoglobulin (due to hypogammaglobulinemia following allogeneic stem cell transplantation 14 months prior) presented with a concern of a rash. The patient had been in a baseline state of health until 1 week after receiving her second dose of vedolizumab, at which time she developed a mildly pruritic maculopapular rash on the back and chest. Triamcinolone ointment and hydroxyzine were recommended during an initial telehealth consultation with an oncologist with minimal improvement. The rash continued to spread distally with worsening pruritus.
The patient returned to her oncologist for a routine follow-up appointment 5 days after initial teleconsultation. She reported poor oral intake due to oropharyngeal pain and a worsening rash; her husband added a report of recent onset of somnolence. She was admitted to the hospital, and intravenous fluids were administered.
At admission, the patient was hypotensive; vital signs were otherwise normal. Physical examination revealed the oropharynx was erythematous. Pink lichenoid papules coalescing into plaques were present diffusely across the trunk, arms, and legs; the hands, feet, and face were spared (Figure 1).
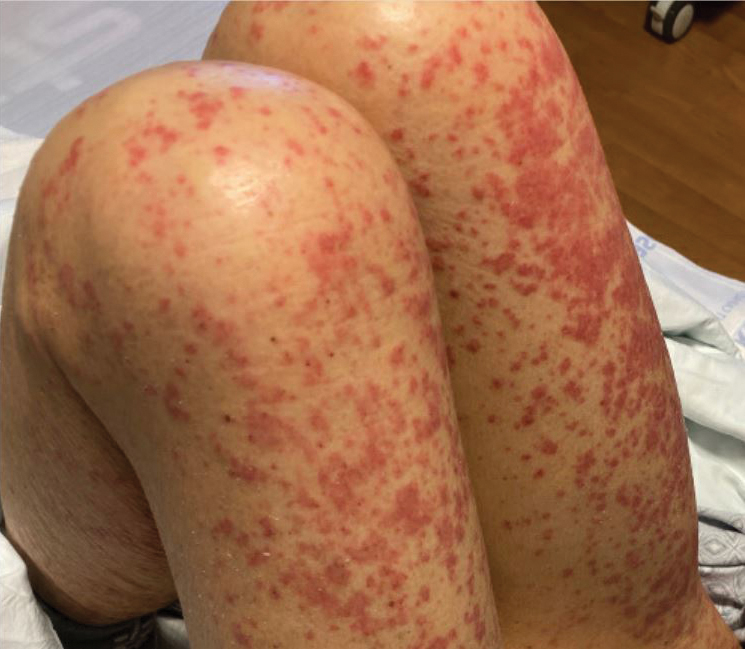
A complete blood cell count and comprehensive metabolic panel were unremarkable. A lumbar puncture, chest radiograph, blood cultures, urinalysis, and urine cultures did not identify a clear infectious cause for the rash, though the workup for infection did raise concern about active cytomegalovirus (CMV) infection with colitis and pneumonitis. Computed tomography of the head showed no acute hemorrhage.
Dermatology was consulted and determined that the appearance of the rash was most consistent with a lichenoid drug eruption, likely secondary to vedolizumab that was administered 1 week before the rash onset. Analysis of a skin biopsy revealed a dense dermal histiocytic and lymphocytic infiltrate in close approximation to blood vessels, confirmed by immunohistochemical staining for CD45, CD43, CD68, CD34, c-KIT, and myeloperoxidase (Figures 2A and 2B). Colloidal iron staining of the specimen revealed no mucin (Figure 2C).
Taken together, the clinical presentation and histopathologic findings were determined to be most consistent with RGD, IGD type, with secondary vasculitis due to vedolizumab. The patient was treated with triamcinolone ointment and low-dose prednisone. Vedolizumab was discontinued. The rash resolved several weeks after cessation of vedolizumab.
Comment
This case describes the development of RGD, IGD type, as an AE of vedolizumab for the treatment of IBD. Reactive granulomatous dermatitis encompasses a spectrum of cutaneous reactions that includes the diagnosis formerly distinctly identified as IGD.11 This variety of RGD is characterized by histologic findings of heavy histiocytic inflammation in the reticular layer of the dermis with interstitial and perivascular neutrophils, lymphocytes, and histiocytes, as well as the absence of mucin. Interstitial granulomatous dermatitis–type reactions commonly are associated with autoimmune conditions and medications, with accumulating examples occurring in the setting of other biologic therapies, including the IL-6 receptor inhibitor tocilizumab; the programmed death receptor-1 inhibitor nivolumab; and the tumor necrosis factor α inhibitors infliximab, etanercept, and adalimumab.12-15
Although our patient represents CMV infection while being treated with vedolizumab, the relationship between the two is unclear. Development of CMV infection while receiving vedolizumab has been reported in the literature in a patient who was concurrently immunosuppressed with azathioprine.16 In contrast, vedolizumab administration has been utilized as a treatment of CMV infection in IBD patients, either alone or in combination with antiviral agents, with successful resolution of infection.17,18 Additional observations of the interaction between CMV infection and vedolizumab would be required to determine if the onset of CMV infection in this patient represents an additional risk of the medication.
Identifying a relationship between a monoclonal antibody therapy, such as vedolizumab, and RGD, IGD type, might be difficult in clinical practice, particularly if this type of reaction has not been previously associated with the culprit medication. In our patient, onset of cutaneous findings in relation to dosing of vedolizumab and exclusion of other possible causes of the rash supported the decision to stop vedolizumab. However, this decision often is challenging in patients with multiple concurrent medical conditions and those whose therapeutic options are limited.
Conclusion
Ulcerative colitis is not an uncommon condition; utilization of targeted monoclonal antibodies as a treatment strategy is expanding.2,19 As implementation of vedolizumab as a targeted biologic therapy for this disease increases, additional cases of IGD might emerge with greater frequency. Because IBD and autoimmune conditions have a tendency to coincide, awareness of the reaction presented here might be particularly important for dermatologists managing cutaneous manifestations of autoimmune conditions, as patients might present with a clinical picture complicated by preexisting skin findings.20 Furthermore, as reports of RGD, IGD type, in response to several monoclonal antibodies accumulate, it is prudent for all physicians to be aware of this potential complication of this class of medication so that they can make educated decisions about continuing monoclonal antibody therapy.
- Grilo AL, Mantalaris A. The increasingly human and profitable monoclonal antibody market. Trends Biotechnol. 2019;37:9-16. doi:10.1016/j.tibtech.2018.05.014
- Yu H, MacIsaac D, Wong JJ, et al. Market share and costs of biologic therapies for inflammatory bowel disease in the USA. Aliment Pharmacol Ther. 2018;47:364-370. doi:10.1111/apt.14430
- Wyant T, Fedyk E, Abhyankar B. An overview of the mechanism of action of the monoclonal antibody vedolizumab. J Crohns Colitis. 2016;10:1437-1444. doi:10.1093/ecco-jcc/jjw092
- Mosli MH, MacDonald JK, Bickston SJ, et al. Vedolizumab for induction and maintenance of remission in ulcerative colitis: a Cochrane systematic review and meta-analysis. Inflamm Bowel Dis. 2015;21:1151-1159. doi:10.1097/MIB.0000000000000396
- Cohen RD, Bhayat F, Blake A, et al. The safety profile of vedolizumab in ulcerative colitis and Crohn’s disease: 4 years of global post-marketing data. J Crohns Colitis. 2020;14:192-204. doi:10.1093/ecco-jcc/jjz137
- Sands BE, Feagan BG, Rutgeerts P, et al. Effects of vedolizumab induction therapy for patients with Crohn’s disease in whom tumor necrosis factor antagonist treatment failed. Gastroenterology. 2014;147:618-627.e3. doi:10.1053/j.gastro.2014.05.008
- Tadbiri S, Peyrin-Biroulet L, Serrero M, et al; . Impact of vedolizumab therapy on extra-intestinal manifestations in patients with inflammatory bowel disease: a multicentre cohort study nested in the OBSERV-IBD cohort. Aliment Pharmacol Ther. 2018;47:485-493. doi:10.1111/apt.14419
- Pereira Guedes T, Pedroto I, Lago P. Vedolizumab-associated psoriasis: until where does gut selectivity go? Rev Esp Enferm Dig. 2020;112:580-581. doi:10.17235/reed.2020.6817/2019
- Gold SL, Magro C, Scherl E. A unique infusion reaction to vedolizumab in a patient with Crohn’s disease. Gastroenterology. 2018;155:981-982. doi:10.1053/j.gastro.2018.03.048
- Martínez Andrés B, Sastre Lozano V, Sánchez Melgarejo JF. Sweet syndrome after treatment with vedolizumab in a patient with Crohn’s disease. Rev Esp Enferm Dig. 2018;110:530. doi:10.17235/reed.2018.5603/2018
- Rosenbach M, English JC 3rd. Reactive granulomatous dermatitis: a review of palisaded neutrophilic and granulomatous dermatitis, interstitial granulomatous dermatitis, interstitial granulomatous drug reaction, and a proposed reclassification. Dermatol Clin. 2015;33:373-387. doi:10.1016/j.det.2015.03.005
- Crowson AN, Magro C. Interstitial granulomatous dermatitis with arthritis. Hum Pathol. 2004;35:779-780. doi:10.1016/j.humpath.2004.05.001
- Altemir A, Iglesias-Sancho M, Sola-Casas MdeLA, et al. Interstitial granulomatous dermatitis following tocilizumab, a paradoxical reaction? Dermatol Ther. 2020;33:e14207. doi:10.1111/dth.14207
- Singh P, Wolfe SP, Alloo A, et al. Interstitial granulomatous dermatitis and granulomatous arteritis in the setting of PD-1 inhibitor therapy for metastatic melanoma. J Cutan Pathol. 2020;47:65-69. doi:10.1111/cup.13562
- Deng A, Harvey V, Sina B, et al. Interstitial granulomatous dermatitis associated with the use of tumor necrosis factor alpha inhibitors. Arch Dermatol. 2006;142:198-202. doi:10.1001/archderm.142.2.198
- Bonfanti E, Bracco C, Biancheri P, et al. Fever during anti-integrin therapy: new immunodeficiency. Eur J Case Rep Intern Med. 2020;7:001288. doi:10.12890/2020_001288
- A, Lenarcik M, E. Resolution of CMV infection in the bowel on vedolizumab therapy. J Crohns Colitis. 2019;13:1234-1235. doi:10.1093/ecco-jcc/jjz033
- Hommel C, Pillet S, Rahier J-F. Comment on: ‘Resolution of CMV infection in the bowel on vedolizumab therapy’. J Crohns Colitis. 2020;14:148-149. doi:10.1093/ecco-jcc/jjz108
- Ng SC, Shi HY, Hamidi N, et al. Worldwide incidence and prevalence of inflammatory bowel disease in the 21st century: a systematic review of population-based studies. Lancet. 2017;390:2769-2778. doi:10.1016/S0140-6736(17)32448-0
- Halling ML, Kjeldsen J, Knudsen T, et al. Patients with inflammatory bowel disease have increased risk of autoimmune and inflammatory diseases. World J Gastroenterol. 2017;23:6137-6146. doi:10.3748/wjg.v23.i33.6137
The number of monoclonal antibodies developed for therapeutic use has rapidly expanded over the last decade due to their generally favorable adverse effect (AE) profiles and efficacy.1 Tumor necrosis factor α inhibitors and general integrin antagonists are well-known examples of such monoclonal antibodies. Common conditions utilizing immunotherapy include inflammatory bowel diseases (IBDs), such as Crohn disease and ulcerative colitis (UC).2
The monoclonal antibody vedolizumab, approved in 2014 for moderate to severe UC and Crohn disease, selectively antagonizes α4β7 integrin to target a specific population of gastrointestinal T lymphocytes, preventing their mobilization to areas of inflammation.3 Adverse effects in patients treated with vedolizumab occur at a rate comparable to placebo and largely are considered nonserious4,5; the most commonly reported AE is disease exacerbation (13%–17% of patients).5,6 Published reports of cutaneous AEs at administration of vedolizumab include urticaria during infusion, appearance of cutaneous manifestations characteristic of IBD, psoriasis, Henoch-Schönlein purpura, and Sweet syndrome.7-10
We present the case of a 61-year-old woman with UC who developed reactive granulomatous dermatitis (RGD), interstitial granulomatous dermatitis (IGD) type secondary to vedolizumab. This adverse reaction has not, to our knowledge, been previously reported.
Case Report
A 61-year-old woman with a medical history of UC treated with vedolizumab and myelodysplastic syndrome treated with intravenous immunoglobulin (due to hypogammaglobulinemia following allogeneic stem cell transplantation 14 months prior) presented with a concern of a rash. The patient had been in a baseline state of health until 1 week after receiving her second dose of vedolizumab, at which time she developed a mildly pruritic maculopapular rash on the back and chest. Triamcinolone ointment and hydroxyzine were recommended during an initial telehealth consultation with an oncologist with minimal improvement. The rash continued to spread distally with worsening pruritus.
The patient returned to her oncologist for a routine follow-up appointment 5 days after initial teleconsultation. She reported poor oral intake due to oropharyngeal pain and a worsening rash; her husband added a report of recent onset of somnolence. She was admitted to the hospital, and intravenous fluids were administered.
At admission, the patient was hypotensive; vital signs were otherwise normal. Physical examination revealed the oropharynx was erythematous. Pink lichenoid papules coalescing into plaques were present diffusely across the trunk, arms, and legs; the hands, feet, and face were spared (Figure 1).
A complete blood cell count and comprehensive metabolic panel were unremarkable. A lumbar puncture, chest radiograph, blood cultures, urinalysis, and urine cultures did not identify a clear infectious cause for the rash, though the workup for infection did raise concern about active cytomegalovirus (CMV) infection with colitis and pneumonitis. Computed tomography of the head showed no acute hemorrhage.
Dermatology was consulted and determined that the appearance of the rash was most consistent with a lichenoid drug eruption, likely secondary to vedolizumab that was administered 1 week before the rash onset. Analysis of a skin biopsy revealed a dense dermal histiocytic and lymphocytic infiltrate in close approximation to blood vessels, confirmed by immunohistochemical staining for CD45, CD43, CD68, CD34, c-KIT, and myeloperoxidase (Figures 2A and 2B). Colloidal iron staining of the specimen revealed no mucin (Figure 2C).
Taken together, the clinical presentation and histopathologic findings were determined to be most consistent with RGD, IGD type, with secondary vasculitis due to vedolizumab. The patient was treated with triamcinolone ointment and low-dose prednisone. Vedolizumab was discontinued. The rash resolved several weeks after cessation of vedolizumab.
Comment
This case describes the development of RGD, IGD type, as an AE of vedolizumab for the treatment of IBD. Reactive granulomatous dermatitis encompasses a spectrum of cutaneous reactions that includes the diagnosis formerly distinctly identified as IGD.11 This variety of RGD is characterized by histologic findings of heavy histiocytic inflammation in the reticular layer of the dermis with interstitial and perivascular neutrophils, lymphocytes, and histiocytes, as well as the absence of mucin. Interstitial granulomatous dermatitis–type reactions commonly are associated with autoimmune conditions and medications, with accumulating examples occurring in the setting of other biologic therapies, including the IL-6 receptor inhibitor tocilizumab; the programmed death receptor-1 inhibitor nivolumab; and the tumor necrosis factor α inhibitors infliximab, etanercept, and adalimumab.12-15
Although our patient represents CMV infection while being treated with vedolizumab, the relationship between the two is unclear. Development of CMV infection while receiving vedolizumab has been reported in the literature in a patient who was concurrently immunosuppressed with azathioprine.16 In contrast, vedolizumab administration has been utilized as a treatment of CMV infection in IBD patients, either alone or in combination with antiviral agents, with successful resolution of infection.17,18 Additional observations of the interaction between CMV infection and vedolizumab would be required to determine if the onset of CMV infection in this patient represents an additional risk of the medication.
Identifying a relationship between a monoclonal antibody therapy, such as vedolizumab, and RGD, IGD type, might be difficult in clinical practice, particularly if this type of reaction has not been previously associated with the culprit medication. In our patient, onset of cutaneous findings in relation to dosing of vedolizumab and exclusion of other possible causes of the rash supported the decision to stop vedolizumab. However, this decision often is challenging in patients with multiple concurrent medical conditions and those whose therapeutic options are limited.
Conclusion
Ulcerative colitis is not an uncommon condition; utilization of targeted monoclonal antibodies as a treatment strategy is expanding.2,19 As implementation of vedolizumab as a targeted biologic therapy for this disease increases, additional cases of IGD might emerge with greater frequency. Because IBD and autoimmune conditions have a tendency to coincide, awareness of the reaction presented here might be particularly important for dermatologists managing cutaneous manifestations of autoimmune conditions, as patients might present with a clinical picture complicated by preexisting skin findings.20 Furthermore, as reports of RGD, IGD type, in response to several monoclonal antibodies accumulate, it is prudent for all physicians to be aware of this potential complication of this class of medication so that they can make educated decisions about continuing monoclonal antibody therapy.
- Grilo AL, Mantalaris A. The increasingly human and profitable monoclonal antibody market. Trends Biotechnol. 2019;37:9-16. doi:10.1016/j.tibtech.2018.05.014
- Yu H, MacIsaac D, Wong JJ, et al. Market share and costs of biologic therapies for inflammatory bowel disease in the USA. Aliment Pharmacol Ther. 2018;47:364-370. doi:10.1111/apt.14430
- Wyant T, Fedyk E, Abhyankar B. An overview of the mechanism of action of the monoclonal antibody vedolizumab. J Crohns Colitis. 2016;10:1437-1444. doi:10.1093/ecco-jcc/jjw092
- Mosli MH, MacDonald JK, Bickston SJ, et al. Vedolizumab for induction and maintenance of remission in ulcerative colitis: a Cochrane systematic review and meta-analysis. Inflamm Bowel Dis. 2015;21:1151-1159. doi:10.1097/MIB.0000000000000396
- Cohen RD, Bhayat F, Blake A, et al. The safety profile of vedolizumab in ulcerative colitis and Crohn’s disease: 4 years of global post-marketing data. J Crohns Colitis. 2020;14:192-204. doi:10.1093/ecco-jcc/jjz137
- Sands BE, Feagan BG, Rutgeerts P, et al. Effects of vedolizumab induction therapy for patients with Crohn’s disease in whom tumor necrosis factor antagonist treatment failed. Gastroenterology. 2014;147:618-627.e3. doi:10.1053/j.gastro.2014.05.008
- Tadbiri S, Peyrin-Biroulet L, Serrero M, et al; . Impact of vedolizumab therapy on extra-intestinal manifestations in patients with inflammatory bowel disease: a multicentre cohort study nested in the OBSERV-IBD cohort. Aliment Pharmacol Ther. 2018;47:485-493. doi:10.1111/apt.14419
- Pereira Guedes T, Pedroto I, Lago P. Vedolizumab-associated psoriasis: until where does gut selectivity go? Rev Esp Enferm Dig. 2020;112:580-581. doi:10.17235/reed.2020.6817/2019
- Gold SL, Magro C, Scherl E. A unique infusion reaction to vedolizumab in a patient with Crohn’s disease. Gastroenterology. 2018;155:981-982. doi:10.1053/j.gastro.2018.03.048
- Martínez Andrés B, Sastre Lozano V, Sánchez Melgarejo JF. Sweet syndrome after treatment with vedolizumab in a patient with Crohn’s disease. Rev Esp Enferm Dig. 2018;110:530. doi:10.17235/reed.2018.5603/2018
- Rosenbach M, English JC 3rd. Reactive granulomatous dermatitis: a review of palisaded neutrophilic and granulomatous dermatitis, interstitial granulomatous dermatitis, interstitial granulomatous drug reaction, and a proposed reclassification. Dermatol Clin. 2015;33:373-387. doi:10.1016/j.det.2015.03.005
- Crowson AN, Magro C. Interstitial granulomatous dermatitis with arthritis. Hum Pathol. 2004;35:779-780. doi:10.1016/j.humpath.2004.05.001
- Altemir A, Iglesias-Sancho M, Sola-Casas MdeLA, et al. Interstitial granulomatous dermatitis following tocilizumab, a paradoxical reaction? Dermatol Ther. 2020;33:e14207. doi:10.1111/dth.14207
- Singh P, Wolfe SP, Alloo A, et al. Interstitial granulomatous dermatitis and granulomatous arteritis in the setting of PD-1 inhibitor therapy for metastatic melanoma. J Cutan Pathol. 2020;47:65-69. doi:10.1111/cup.13562
- Deng A, Harvey V, Sina B, et al. Interstitial granulomatous dermatitis associated with the use of tumor necrosis factor alpha inhibitors. Arch Dermatol. 2006;142:198-202. doi:10.1001/archderm.142.2.198
- Bonfanti E, Bracco C, Biancheri P, et al. Fever during anti-integrin therapy: new immunodeficiency. Eur J Case Rep Intern Med. 2020;7:001288. doi:10.12890/2020_001288
- A, Lenarcik M, E. Resolution of CMV infection in the bowel on vedolizumab therapy. J Crohns Colitis. 2019;13:1234-1235. doi:10.1093/ecco-jcc/jjz033
- Hommel C, Pillet S, Rahier J-F. Comment on: ‘Resolution of CMV infection in the bowel on vedolizumab therapy’. J Crohns Colitis. 2020;14:148-149. doi:10.1093/ecco-jcc/jjz108
- Ng SC, Shi HY, Hamidi N, et al. Worldwide incidence and prevalence of inflammatory bowel disease in the 21st century: a systematic review of population-based studies. Lancet. 2017;390:2769-2778. doi:10.1016/S0140-6736(17)32448-0
- Halling ML, Kjeldsen J, Knudsen T, et al. Patients with inflammatory bowel disease have increased risk of autoimmune and inflammatory diseases. World J Gastroenterol. 2017;23:6137-6146. doi:10.3748/wjg.v23.i33.6137
Practice Points
- Reactive granulomatous dermatitis, interstitial granulomatous dermatitis (IGD) type, can occur as an adverse reaction to vedolizumab despite the minimal adverse effect profile of the medication.
- Evidence of IGD type reactions to monoclonal antibodies is accumulating; this disorder can be considered in the differential diagnosis for patients who develop a new rash when treated with an agent of this therapeutic class.

An Update on JAK Inhibitors in Skin Disease
Atopic dermatitis (AD) is a chronic inflammatory skin disorder affecting 7% of adults and 13% of children in the United States.1,2 Atopic dermatitis is characterized by pruritus, dry skin, and pain, all of which can negatively impact quality of life and put patients at higher risk for psychiatric comorbidities such as anxiety and depression.3 The pathogenesis of AD is multifactorial, involving genetics, epidermal barrier dysfunction, and immune dysregulation. Overactivation of helper T cell (TH2) pathway cytokines, including IL-4, IL-13, and IL-31, is thought to propagate both inflammation and pruritus, which are central to AD. The JAK-STAT signaling pathway plays a pivotal role in the immune system dysregulation and exaggeration of TH2 cell response, making JAK-STAT inhibitors (or JAK inhibitors) strong theoretical candidates for the treatment of AD.4 In humans, the Janus kinases are composed of 4 different members—JAK1, JAK2, JAK3, and tyrosine kinase 2—all of which can be targeted by JAK inhibitors.5
JAK inhibitors such as tofacitinib have already been approved by the US Food and Drug Administration (FDA) to treat various inflammatory conditions, including rheumatoid arthritis, ulcerative colitis, and psoriatic arthritis; other JAK inhibitors such as baricitinib are only approved for patients with rheumatoid arthritis.6,7 The success of these small molecule inhibitors in these immune-mediated conditions make them attractive candidates for the treatment of AD. Several JAK inhibitors are in phase 2 and phase 3 clinical trials as oral therapies (moderate to severe AD) or as topical treatments (mild to moderate AD). Currently, ruxolitinib (RUX) is the only topical JAK inhibitor that is FDA approved for the treatment of AD in the United States.8 In this editorial, we focus on recent trials of JAK inhibitors tested in patients with AD, including topical RUX, as well as oral abrocitinib, upadacitinib, and baricitinib.
Topical RUX in AD
Ruxolitinib is a topical JAK1/2 small molecule inhibitor approved by the FDA for the treatment of AD in 2021. In a randomized trial by Kim et al9 in 2020, all tested regimens of RUX demonstrated significant improvement in eczema area and severity index (EASI) scores vs vehicle; notably, RUX cream 1.5% applied twice daily achieved the greatest mean percentage change in baseline EASI score vs vehicle at 4 weeks (76.1% vs 15.5%; P<.0001). Ruxolitinib cream was well tolerated through week 8 of the trial, and all adverse events (AEs) were mild to moderate in severity and comparable to those in the vehicle group.9
Topical JAK inhibitors appear to be effective for mild to moderate AD and have had an acceptable safety profile in clinical trials thus far. Although topical corticosteroids and calcineurin inhibitors can have great clinical benefit in AD, they are recommended for short-term use given side effects such as thinning of the skin, burning, or telangiectasia formation.10,11 The hope is that topical JAK inhibitors may be an alternative to standard topical treatments for AD, as they can be used for longer periods due to a safer side-effect profile.
Oral JAK Inhibitors in AD
Several oral JAK inhibitors are undergoing investigation for the systemic treatment of moderate to severe AD. Abrocitinib is an oral JAK1 inhibitor that has demonstrated efficacy in several phase 3 trials in patients with moderate to severe AD. In a 2021 trial, patients were randomized in a 2:2:2:1 ratio to receive abrocitinib 200 mg daily, abrocitinib 100 mg daily, subcutaneous dupilumab 300 mg every other week, or placebo, respectively.12 Patients in both abrocitinib groups showed significant improvement in AD vs placebo, and EASI-75 response was achieved in 70.3%, 58.7%, 58.1%, and 27.1% of patients, respectively (P<.001 for both abrocitinib doses vs placebo). Adverse events occurred more frequently in the abrocitinib 200-mg group vs placebo. Nausea, acne, nasopharyngitis, and headache were the most frequently reported AEs with abrocitinib.12 Another phase 3 trial by Silverberg et al13 (N=391) had similar treatment results, with 38.1% of participants receiving abrocitinib 200 mg and 28.4% of participants receiving abrocitinib 100 mg achieving investigator global assessment scores of 0 (clear) or 1 (almost clear) vs 9.1% of participants receiving placebo (P<.001). Abrocitinib was well tolerated in this trial with few serious AEs (ie, herpangina [0.6%], pneumonia [0.6%]).13 In both trials, there were rare instances of laboratory values indicating thrombocytopenia with the 200-mg dose (0.9%12 and 3.2%13) without any clinical manifestations. Although a decrease in platelets was observed, no thrombocytopenia occurred in the abrocitinib 100-mg group in the latter trial.13
Baricitinib is another oral inhibitor of JAK1 and JAK2 with potential for the treatment of AD. One randomized trial (N=329) demonstrated its efficacy in combination with a topical corticosteroid (TCS). At 16 weeks, a higher number of participants treated with baricitinib and TCS achieved investigator global assessment scores of 0 (clear) or 1 (almost clear) compared to those who received placebo and TCS (31% with baricitinib 4 mg + TCS, 24% with baricitinib 2 mg + TCS, and 15% with placebo + TCS).14 Similarly, in BREEZE-AD5,another phase 3 trial (N=440), baricitinib monotherapy demonstrated a higher rate of treatment success vs placebo.15 Specifically, 13% of patients treated with baricitinib 1 mg and 30% of those treated with baricitinib 2 mg achieved 75% or greater reduction in EASI scores compared to 8% in the placebo group. The most common AEs associated with baricitinib were nasopharyngitis and headache. Adverse events occurred with similar frequency across both experimental and control groups.15 Reich et al14 demonstrated a higher overall rate of AEs—most commonly nasopharyngitis, upper respiratory tract infections, and folliculitis—in baricitinib-treated patients; however, serious AEs occurred with similar frequency across all groups, including the control group.
The selective JAK1 inhibitor upadacitinib also is undergoing testing in treating moderate to severe AD. In one trial, 167 patients were randomized to once daily oral upadacitinib 7.5 mg, 15 mg, or 30 mg or placebo.16 All doses of upadacitinib demonstrated considerably higher percentage improvements from baseline in EASI scores compared to placebo at 16 weeks with a clear dose-response relationship (39%, 62%, and 74% vs 23%, respectively). In this trial, there were no dose-limiting safety events. Serious AEs were infrequent, occurring in 4.8%, 2.4%, and 0% of upadacitinib groups vs 2.5% for placebo. The serious AEs observed with upadacitinib were 1 case of appendicitis, lower jaw pericoronitis in a patient with a history of repeated tooth infections, and an exacerbation of AD.16
Tofacitinib, another JAK inhibitor, has been shown to increase the risk for blood clots and death in a large trial in the treatment of rheumatoid arthritis. Following this study, the FDA is requiring black box warnings for tofacitinib and also for the 2 JAK inhibitors baricitinib and upadacitinib regarding the risks for heart-related events, cancer, blood clots, and death. Given that these medications share a similar mechanism of action to tofacitinib, they may have similar risks, though they have not yet been fully evaluated in large safety trials.17
With more recent investigation into novel therapeutics for AD, oral JAK inhibitors may play an important role in the future to treat patients with moderate to severe AD with inadequate response or contraindications to other systemic therapies. In trials thus far, oral JAK inhibitors have exhibited acceptable safety profiles and have demonstrated treatment success in AD. More randomized, controlled, phase 3 studies with larger patient populations are required to confirm their potential as effective treatments and elucidate their long-term safety.
Deucravacitinib in Psoriasis
Deucravacitinib is a first-in-class, oral, selective TYK2 inhibitor currently undergoing testing for the treatment of psoriasis. A randomized phase 2 trial (N=267) found that deucravacitinib was more effective than placebo in treating chronic plaque psoriasis at doses of 3 to 12 mg daily.18 The percentage of participants with a 75% or greater reduction from baseline in the psoriasis area and severity index score was 7% with placebo, 9% with deucravacitinib 3 mg every other day (P=.49 vs placebo), 39% with 3 mg once daily (P<.001 vs placebo), 69% with 3 mg twice daily (P<.001 vs placebo), 67% with 6 mg twice daily (P<.001 vs placebo), and 75% with 12 mg once daily (P<.001 vs placebo). The most commonly reported AEs were nasopharyngitis, headache, diarrhea, nausea, and upper respiratory tract infection. Adverse events occurred in 51% of participants in the control group and in 55% to 80% of those in the experimental groups. Additionally, there was 1 reported case of melanoma (stage 0) 96 days after the start of treatment in a patient in the 3-mg once-daily group. Serious AEs occurred in only 0% to 2% of participants who received deucravacitinib.18
Two phase 3 trials—POETYK PSO-1 and POETYK PSO-2 (N=1686)—found deucravacitinib to be notably more effective than both placebo and apremilast in treating psoriasis.19 Among participants receiving deucravacitinib 6 mg daily, 58.7% and 53.6% in the 2 respective trials achieved psoriasis area and severity index 75 response vs 12.7% and 9.4% receiving placebo and 35.1% and 40.2% receiving apremilast. Overall, the treatment was well tolerated, with a low rate of discontinuation of deucravacitinib due to AEs (2.4% of patients on deucravacitinib compared to 3.8% on placebo and 5.2% on apremilast). The most frequently observed AEs with deucravacitinib were nasopharyngitis and upper respiratory tract infection. The full results of these trials are expected to be published soon.19,20
Final Thoughts
Overall, JAK inhibitors are a novel class of therapeutics that may have further success in the treatment of other dermatologic conditions that negatively affect patients’ quality of life and productivity. We should look forward to additional successful trials with these promising medications.
- Chiesa Fuxench ZC, Block JK, Boguniewicz M, et al. Atopic dermatitis in America study: a cross-sectional study examining the prevalence and disease burden of atopic dermatitis in the US adult population. J Invest Dermatol. 2019;139:583-590.
- Silverberg JI , Simpson EL. Associations of childhood eczema severity: a US population-based study. Dermatitis. 2014;25:107-114.
- Schonmann Y, Mansfield KE, Hayes JF, et al. Atopic eczema in adulthood and risk of depression and anxiety: a population-based cohort study. J Allergy Clin Immunol Pract. 2020;8:248-257.e16.
- Bao L, Zhang H, Chan LS. The involvement of the JAK-STAT signaling pathway in chronic inflammatory skin disease atopic dermatitis. JAKSTAT. 2013;2:e24137.
- Villarino AV, Kanno Y, O’Shea JJ. Mechanisms and consequences of Jak-STAT signaling in the immune system. Nat Immunol. 2017;18:374-384.
- Xeljanz FDA approval history. Drugs.com website. Updated December 14, 2021. Accessed February 16, 2022. https://www.drugs.com/history/xeljanz.html
- Mullard A. FDA approves Eli Lilly’s baricitinib. Nat Rev Drug Discov. 2018;17:460.
- FDA approves Opzelura. Drugs.com website. Published September 2021. Accessed February 16, 2022. https://www.drugs.com/newdrugs/fda-approves-opzelura-ruxolitinib-cream-atopic-dermatitis-ad-5666.html
- Kim BS, Sun K, Papp K, et al. Effects of ruxolitinib cream on pruritus and quality of life in atopic dermatitis: results from a phase 2, randomized, dose-ranging, vehicle- and active-controlled study.J Am Acad Dermatol. 2020;82:1305-1313.
- Eichenfield LF, Tom WL, Berger TG, et al. Guidelines of care for the management of atopic dermatitis: section 2, management and treatment of atopic dermatitis with topical therapies. J Am Acad Dermatol. 2014;71:116-132.
- Wollenberg A, Barbarot S, Bieber T, et al. Consensus-based European guidelines for treatment of atopic eczema (atopic dermatitis) in adults and children: part I. J Eur Acad Dermatol Venereol. 2018;32:657-682.
- Bieber T, Simpson EL, Silverberg JI, et al. Abrocitinib versus placebo or dupilumab for atopic dermatitis. N Engl J Med. 2021;384:1101-1112.
- Silverberg JI, Simpson EL, Thyssen JP, et al. Efficacy and safety of abrocitinib in patients with moderate-to-severe atopic dermatitis: a randomized clinical trial. JAMA Dermatol. 2020;156:863-873.
- Reich K, Kabashima K, Peris K, et al. Efficacy and safety of baricitinib combined with topical corticosteroids for treatment of moderate to severe atopic dermatitis: a randomized clinical trial. JAMA Dermatol. 2020;156:1333-1343.
- Simpson EL, Forman S, Silverberg JI, et al. Baricitinib in patients with moderate-to-severe atopic dermatitis: results from a randomized monotherapy phase 3 trial in the United States and Canada (BREEZE-AD5). J Am Acad Dermatol. 2021;85:62-70.
- Guttman-Yassky E, Thaçi D, Pangan AL, et al. Upadacitinib in adults with moderate to severe atopic dermatitis: 16-week results from a randomized, placebo-controlled trial. J Allergy Clin Immunol. 2020;145:877-884.
- US Food and Drug Administration. FDA requires warnings about increased risk of serious heart-related events, cancer, blood clots, and death for JAK inhibitors that treat certain chronic inflammatory conditions. Published September 1, 2022. Accessed February 16, 2022. https://www.fda.gov/drugs/drug-safety-and-availability/fda-requires-warnings-about-increased-risk-serious-heart-related-events-cancer-blood-clots-and-death
- Papp K, Gordon K, Thaçi D, et al. Phase 2 trial of selective tyrosine kinase 2 inhibition in psoriasis. N Engl J Med. 2018;379:1313-1321.
- Bristol Myers Squibb presents positive data from two pivotal phase 3 psoriasis studies demonstrating superiority of deucravacitinib compared to placebo and Otezla® (apremilast). Press release. Bristol Meyers Squibb. April 23, 2021. Accessed February 16, 2022. https://news.bms.com/news/details/2021/Bristol-Myers-Squibb-Presents-Positive-Data-from-Two-Pivotal-Phase-3-Psoriasis-Studies-Demonstrating-Superiority-of-Deucravacitinib-Compared-to-Placebo-and-Otezla-apremilast/default.aspx
- Armstrong A, Gooderham M, Warren R, et al. Efficacy and safety of deucravacitinib, an oral, selective tyrosine kinase 2 (TYK2) inhibitor, compared with placebo and apremilast in moderate to severe plaque psoriasis: results from the POETYK PSO-1 study [abstract]. Abstract presented at: 2021 American Academy of Dermatology annual meeting; April 23-25, 2021; San Francisco, California.
Atopic dermatitis (AD) is a chronic inflammatory skin disorder affecting 7% of adults and 13% of children in the United States.1,2 Atopic dermatitis is characterized by pruritus, dry skin, and pain, all of which can negatively impact quality of life and put patients at higher risk for psychiatric comorbidities such as anxiety and depression.3 The pathogenesis of AD is multifactorial, involving genetics, epidermal barrier dysfunction, and immune dysregulation. Overactivation of helper T cell (TH2) pathway cytokines, including IL-4, IL-13, and IL-31, is thought to propagate both inflammation and pruritus, which are central to AD. The JAK-STAT signaling pathway plays a pivotal role in the immune system dysregulation and exaggeration of TH2 cell response, making JAK-STAT inhibitors (or JAK inhibitors) strong theoretical candidates for the treatment of AD.4 In humans, the Janus kinases are composed of 4 different members—JAK1, JAK2, JAK3, and tyrosine kinase 2—all of which can be targeted by JAK inhibitors.5
JAK inhibitors such as tofacitinib have already been approved by the US Food and Drug Administration (FDA) to treat various inflammatory conditions, including rheumatoid arthritis, ulcerative colitis, and psoriatic arthritis; other JAK inhibitors such as baricitinib are only approved for patients with rheumatoid arthritis.6,7 The success of these small molecule inhibitors in these immune-mediated conditions make them attractive candidates for the treatment of AD. Several JAK inhibitors are in phase 2 and phase 3 clinical trials as oral therapies (moderate to severe AD) or as topical treatments (mild to moderate AD). Currently, ruxolitinib (RUX) is the only topical JAK inhibitor that is FDA approved for the treatment of AD in the United States.8 In this editorial, we focus on recent trials of JAK inhibitors tested in patients with AD, including topical RUX, as well as oral abrocitinib, upadacitinib, and baricitinib.
Topical RUX in AD
Ruxolitinib is a topical JAK1/2 small molecule inhibitor approved by the FDA for the treatment of AD in 2021. In a randomized trial by Kim et al9 in 2020, all tested regimens of RUX demonstrated significant improvement in eczema area and severity index (EASI) scores vs vehicle; notably, RUX cream 1.5% applied twice daily achieved the greatest mean percentage change in baseline EASI score vs vehicle at 4 weeks (76.1% vs 15.5%; P<.0001). Ruxolitinib cream was well tolerated through week 8 of the trial, and all adverse events (AEs) were mild to moderate in severity and comparable to those in the vehicle group.9
Topical JAK inhibitors appear to be effective for mild to moderate AD and have had an acceptable safety profile in clinical trials thus far. Although topical corticosteroids and calcineurin inhibitors can have great clinical benefit in AD, they are recommended for short-term use given side effects such as thinning of the skin, burning, or telangiectasia formation.10,11 The hope is that topical JAK inhibitors may be an alternative to standard topical treatments for AD, as they can be used for longer periods due to a safer side-effect profile.
Oral JAK Inhibitors in AD
Several oral JAK inhibitors are undergoing investigation for the systemic treatment of moderate to severe AD. Abrocitinib is an oral JAK1 inhibitor that has demonstrated efficacy in several phase 3 trials in patients with moderate to severe AD. In a 2021 trial, patients were randomized in a 2:2:2:1 ratio to receive abrocitinib 200 mg daily, abrocitinib 100 mg daily, subcutaneous dupilumab 300 mg every other week, or placebo, respectively.12 Patients in both abrocitinib groups showed significant improvement in AD vs placebo, and EASI-75 response was achieved in 70.3%, 58.7%, 58.1%, and 27.1% of patients, respectively (P<.001 for both abrocitinib doses vs placebo). Adverse events occurred more frequently in the abrocitinib 200-mg group vs placebo. Nausea, acne, nasopharyngitis, and headache were the most frequently reported AEs with abrocitinib.12 Another phase 3 trial by Silverberg et al13 (N=391) had similar treatment results, with 38.1% of participants receiving abrocitinib 200 mg and 28.4% of participants receiving abrocitinib 100 mg achieving investigator global assessment scores of 0 (clear) or 1 (almost clear) vs 9.1% of participants receiving placebo (P<.001). Abrocitinib was well tolerated in this trial with few serious AEs (ie, herpangina [0.6%], pneumonia [0.6%]).13 In both trials, there were rare instances of laboratory values indicating thrombocytopenia with the 200-mg dose (0.9%12 and 3.2%13) without any clinical manifestations. Although a decrease in platelets was observed, no thrombocytopenia occurred in the abrocitinib 100-mg group in the latter trial.13
Baricitinib is another oral inhibitor of JAK1 and JAK2 with potential for the treatment of AD. One randomized trial (N=329) demonstrated its efficacy in combination with a topical corticosteroid (TCS). At 16 weeks, a higher number of participants treated with baricitinib and TCS achieved investigator global assessment scores of 0 (clear) or 1 (almost clear) compared to those who received placebo and TCS (31% with baricitinib 4 mg + TCS, 24% with baricitinib 2 mg + TCS, and 15% with placebo + TCS).14 Similarly, in BREEZE-AD5,another phase 3 trial (N=440), baricitinib monotherapy demonstrated a higher rate of treatment success vs placebo.15 Specifically, 13% of patients treated with baricitinib 1 mg and 30% of those treated with baricitinib 2 mg achieved 75% or greater reduction in EASI scores compared to 8% in the placebo group. The most common AEs associated with baricitinib were nasopharyngitis and headache. Adverse events occurred with similar frequency across both experimental and control groups.15 Reich et al14 demonstrated a higher overall rate of AEs—most commonly nasopharyngitis, upper respiratory tract infections, and folliculitis—in baricitinib-treated patients; however, serious AEs occurred with similar frequency across all groups, including the control group.
The selective JAK1 inhibitor upadacitinib also is undergoing testing in treating moderate to severe AD. In one trial, 167 patients were randomized to once daily oral upadacitinib 7.5 mg, 15 mg, or 30 mg or placebo.16 All doses of upadacitinib demonstrated considerably higher percentage improvements from baseline in EASI scores compared to placebo at 16 weeks with a clear dose-response relationship (39%, 62%, and 74% vs 23%, respectively). In this trial, there were no dose-limiting safety events. Serious AEs were infrequent, occurring in 4.8%, 2.4%, and 0% of upadacitinib groups vs 2.5% for placebo. The serious AEs observed with upadacitinib were 1 case of appendicitis, lower jaw pericoronitis in a patient with a history of repeated tooth infections, and an exacerbation of AD.16
Tofacitinib, another JAK inhibitor, has been shown to increase the risk for blood clots and death in a large trial in the treatment of rheumatoid arthritis. Following this study, the FDA is requiring black box warnings for tofacitinib and also for the 2 JAK inhibitors baricitinib and upadacitinib regarding the risks for heart-related events, cancer, blood clots, and death. Given that these medications share a similar mechanism of action to tofacitinib, they may have similar risks, though they have not yet been fully evaluated in large safety trials.17
With more recent investigation into novel therapeutics for AD, oral JAK inhibitors may play an important role in the future to treat patients with moderate to severe AD with inadequate response or contraindications to other systemic therapies. In trials thus far, oral JAK inhibitors have exhibited acceptable safety profiles and have demonstrated treatment success in AD. More randomized, controlled, phase 3 studies with larger patient populations are required to confirm their potential as effective treatments and elucidate their long-term safety.
Deucravacitinib in Psoriasis
Deucravacitinib is a first-in-class, oral, selective TYK2 inhibitor currently undergoing testing for the treatment of psoriasis. A randomized phase 2 trial (N=267) found that deucravacitinib was more effective than placebo in treating chronic plaque psoriasis at doses of 3 to 12 mg daily.18 The percentage of participants with a 75% or greater reduction from baseline in the psoriasis area and severity index score was 7% with placebo, 9% with deucravacitinib 3 mg every other day (P=.49 vs placebo), 39% with 3 mg once daily (P<.001 vs placebo), 69% with 3 mg twice daily (P<.001 vs placebo), 67% with 6 mg twice daily (P<.001 vs placebo), and 75% with 12 mg once daily (P<.001 vs placebo). The most commonly reported AEs were nasopharyngitis, headache, diarrhea, nausea, and upper respiratory tract infection. Adverse events occurred in 51% of participants in the control group and in 55% to 80% of those in the experimental groups. Additionally, there was 1 reported case of melanoma (stage 0) 96 days after the start of treatment in a patient in the 3-mg once-daily group. Serious AEs occurred in only 0% to 2% of participants who received deucravacitinib.18
Two phase 3 trials—POETYK PSO-1 and POETYK PSO-2 (N=1686)—found deucravacitinib to be notably more effective than both placebo and apremilast in treating psoriasis.19 Among participants receiving deucravacitinib 6 mg daily, 58.7% and 53.6% in the 2 respective trials achieved psoriasis area and severity index 75 response vs 12.7% and 9.4% receiving placebo and 35.1% and 40.2% receiving apremilast. Overall, the treatment was well tolerated, with a low rate of discontinuation of deucravacitinib due to AEs (2.4% of patients on deucravacitinib compared to 3.8% on placebo and 5.2% on apremilast). The most frequently observed AEs with deucravacitinib were nasopharyngitis and upper respiratory tract infection. The full results of these trials are expected to be published soon.19,20
Final Thoughts
Overall, JAK inhibitors are a novel class of therapeutics that may have further success in the treatment of other dermatologic conditions that negatively affect patients’ quality of life and productivity. We should look forward to additional successful trials with these promising medications.
- Chiesa Fuxench ZC, Block JK, Boguniewicz M, et al. Atopic dermatitis in America study: a cross-sectional study examining the prevalence and disease burden of atopic dermatitis in the US adult population. J Invest Dermatol. 2019;139:583-590.
- Silverberg JI , Simpson EL. Associations of childhood eczema severity: a US population-based study. Dermatitis. 2014;25:107-114.
- Schonmann Y, Mansfield KE, Hayes JF, et al. Atopic eczema in adulthood and risk of depression and anxiety: a population-based cohort study. J Allergy Clin Immunol Pract. 2020;8:248-257.e16.
- Bao L, Zhang H, Chan LS. The involvement of the JAK-STAT signaling pathway in chronic inflammatory skin disease atopic dermatitis. JAKSTAT. 2013;2:e24137.
- Villarino AV, Kanno Y, O’Shea JJ. Mechanisms and consequences of Jak-STAT signaling in the immune system. Nat Immunol. 2017;18:374-384.
- Xeljanz FDA approval history. Drugs.com website. Updated December 14, 2021. Accessed February 16, 2022. https://www.drugs.com/history/xeljanz.html
- Mullard A. FDA approves Eli Lilly’s baricitinib. Nat Rev Drug Discov. 2018;17:460.
- FDA approves Opzelura. Drugs.com website. Published September 2021. Accessed February 16, 2022. https://www.drugs.com/newdrugs/fda-approves-opzelura-ruxolitinib-cream-atopic-dermatitis-ad-5666.html
- Kim BS, Sun K, Papp K, et al. Effects of ruxolitinib cream on pruritus and quality of life in atopic dermatitis: results from a phase 2, randomized, dose-ranging, vehicle- and active-controlled study.J Am Acad Dermatol. 2020;82:1305-1313.
- Eichenfield LF, Tom WL, Berger TG, et al. Guidelines of care for the management of atopic dermatitis: section 2, management and treatment of atopic dermatitis with topical therapies. J Am Acad Dermatol. 2014;71:116-132.
- Wollenberg A, Barbarot S, Bieber T, et al. Consensus-based European guidelines for treatment of atopic eczema (atopic dermatitis) in adults and children: part I. J Eur Acad Dermatol Venereol. 2018;32:657-682.
- Bieber T, Simpson EL, Silverberg JI, et al. Abrocitinib versus placebo or dupilumab for atopic dermatitis. N Engl J Med. 2021;384:1101-1112.
- Silverberg JI, Simpson EL, Thyssen JP, et al. Efficacy and safety of abrocitinib in patients with moderate-to-severe atopic dermatitis: a randomized clinical trial. JAMA Dermatol. 2020;156:863-873.
- Reich K, Kabashima K, Peris K, et al. Efficacy and safety of baricitinib combined with topical corticosteroids for treatment of moderate to severe atopic dermatitis: a randomized clinical trial. JAMA Dermatol. 2020;156:1333-1343.
- Simpson EL, Forman S, Silverberg JI, et al. Baricitinib in patients with moderate-to-severe atopic dermatitis: results from a randomized monotherapy phase 3 trial in the United States and Canada (BREEZE-AD5). J Am Acad Dermatol. 2021;85:62-70.
- Guttman-Yassky E, Thaçi D, Pangan AL, et al. Upadacitinib in adults with moderate to severe atopic dermatitis: 16-week results from a randomized, placebo-controlled trial. J Allergy Clin Immunol. 2020;145:877-884.
- US Food and Drug Administration. FDA requires warnings about increased risk of serious heart-related events, cancer, blood clots, and death for JAK inhibitors that treat certain chronic inflammatory conditions. Published September 1, 2022. Accessed February 16, 2022. https://www.fda.gov/drugs/drug-safety-and-availability/fda-requires-warnings-about-increased-risk-serious-heart-related-events-cancer-blood-clots-and-death
- Papp K, Gordon K, Thaçi D, et al. Phase 2 trial of selective tyrosine kinase 2 inhibition in psoriasis. N Engl J Med. 2018;379:1313-1321.
- Bristol Myers Squibb presents positive data from two pivotal phase 3 psoriasis studies demonstrating superiority of deucravacitinib compared to placebo and Otezla® (apremilast). Press release. Bristol Meyers Squibb. April 23, 2021. Accessed February 16, 2022. https://news.bms.com/news/details/2021/Bristol-Myers-Squibb-Presents-Positive-Data-from-Two-Pivotal-Phase-3-Psoriasis-Studies-Demonstrating-Superiority-of-Deucravacitinib-Compared-to-Placebo-and-Otezla-apremilast/default.aspx
- Armstrong A, Gooderham M, Warren R, et al. Efficacy and safety of deucravacitinib, an oral, selective tyrosine kinase 2 (TYK2) inhibitor, compared with placebo and apremilast in moderate to severe plaque psoriasis: results from the POETYK PSO-1 study [abstract]. Abstract presented at: 2021 American Academy of Dermatology annual meeting; April 23-25, 2021; San Francisco, California.
Discoid Lupus

THE COMPARISON
A Multicolored (pink, brown, and white) indurated plaques in a butterfly distribution on the face of a 30-year-old woman with a darker skin tone.
B Pink, elevated, indurated plaques with hypopigmentation in a butterfly distribution on the face of a 19-year-old woman with a lighter skin tone.
Cutaneous lupus erythematosus may occur with or without systemic lupus erythematosus. Discoid lupus erythematosus (DLE), a form of chronic cutaneous lupus, is most commonly found on the scalp, face, and ears.1
Epidemiology
Discoid lupus erythematosus is most common in adult women (age range, 20–40 years).2 It occurs more frequently in women of African descent.3,4
Key clinical features in people with darker skin tones:
Clinical features of DLE lesions include erythema, induration, follicular plugging, dyspigmentation, and scarring alopecia.1 In patients of African descent, lesions may be annular and hypopigmented to depigmented centrally with a border of hyperpigmentation. Active lesions may be painful and/or pruritic.2
Discoid lupus erythematosus lesions occur in photodistributed areas, although not exclusively. Photoprotective clothing and sunscreen are an important part of the treatment plan.1 Although sunscreen is recommended for patients with DLE, those with darker skin tones may find some sunscreens cosmetically unappealing due to a mismatch with their normal skin color.5 Tinted sunscreens may be beneficial additions.
Worth noting
Approximately 5% to 25% of patients with cutaneous lupus go on to develop systemic lupus erythematosus.6
Health disparity highlight
Discoid lesions may cause cutaneous scars that are quite disfiguring and may negatively impact quality of life. Some patients may have a few scattered lesions, whereas others have extensive disease covering most of the scalp. Discoid lupus erythematosus lesions of the scalp have classic clinical features including hair loss, erythema, hypopigmentation, and hyperpigmentation. The clinician’s comfort with performing a scalp examination with cultural humility is an important acquired skill and is especially important when the examination is performed on patients with more tightly coiled hair.7 For example, physicians may adopt the “compliment, discuss, and suggest” method when counseling patients.8
- Bolognia JL, Jorizzo JJ, Schaffer JV, et al. Dermatology. 3rd ed. Elsevier; 2012.
- Otberg N, Wu W-Y, McElwee KJ, et al. Diagnosis and management of primary cicatricial alopecia: part I. Skinmed. 2008;7:19-26. doi:10.1111/j.1540-9740.2007.07163.x
- Callen JP. Chronic cutaneous lupus erythematosus. clinical, laboratory, therapeutic, and prognostic examination of 62 patients. Arch Dermatol. 1982;118:412-416. doi:10.1001/archderm.118.6.412
- McCarty DJ, Manzi S, Medsger TA Jr, et al. Incidence of systemic lupus erythematosus. race and gender differences. Arthritis Rheum. 1995;38:1260-1270. doi:10.1002/art.1780380914
- Morquette AJ, Waples ER, Heath CR. The importance of cosmetically elegant sunscreen in skin of color populations. J Cosmet Dermatol. In press.
- Zhou W, Wu H, Zhao M, et al. New insights into the progression from cutaneous lupus to systemic lupus erythematosus. Expert Rev Clin Immunol. 2020;16:829-837. doi:10.1080/17446 66X.2020.1805316
- Grayson C, Heath C. An approach to examining tightly coiled hair among patients with hair loss in race-discordant patientphysician interactions. JAMA Dermatol. 2021;157:505-506. doi:10.1001/jamadermatol.2021.0338
- Grayson C, Heath CR. Counseling about traction alopecia: a “compliment, discuss, and suggest” method. Cutis. 2021;108:20-22.
THE COMPARISON
A Multicolored (pink, brown, and white) indurated plaques in a butterfly distribution on the face of a 30-year-old woman with a darker skin tone.
B Pink, elevated, indurated plaques with hypopigmentation in a butterfly distribution on the face of a 19-year-old woman with a lighter skin tone.
Cutaneous lupus erythematosus may occur with or without systemic lupus erythematosus. Discoid lupus erythematosus (DLE), a form of chronic cutaneous lupus, is most commonly found on the scalp, face, and ears.1
Epidemiology
Discoid lupus erythematosus is most common in adult women (age range, 20–40 years).2 It occurs more frequently in women of African descent.3,4
Key clinical features in people with darker skin tones:
Clinical features of DLE lesions include erythema, induration, follicular plugging, dyspigmentation, and scarring alopecia.1 In patients of African descent, lesions may be annular and hypopigmented to depigmented centrally with a border of hyperpigmentation. Active lesions may be painful and/or pruritic.2
Discoid lupus erythematosus lesions occur in photodistributed areas, although not exclusively. Photoprotective clothing and sunscreen are an important part of the treatment plan.1 Although sunscreen is recommended for patients with DLE, those with darker skin tones may find some sunscreens cosmetically unappealing due to a mismatch with their normal skin color.5 Tinted sunscreens may be beneficial additions.
Worth noting
Approximately 5% to 25% of patients with cutaneous lupus go on to develop systemic lupus erythematosus.6
Health disparity highlight
Discoid lesions may cause cutaneous scars that are quite disfiguring and may negatively impact quality of life. Some patients may have a few scattered lesions, whereas others have extensive disease covering most of the scalp. Discoid lupus erythematosus lesions of the scalp have classic clinical features including hair loss, erythema, hypopigmentation, and hyperpigmentation. The clinician’s comfort with performing a scalp examination with cultural humility is an important acquired skill and is especially important when the examination is performed on patients with more tightly coiled hair.7 For example, physicians may adopt the “compliment, discuss, and suggest” method when counseling patients.8
- Bolognia JL, Jorizzo JJ, Schaffer JV, et al. Dermatology. 3rd ed. Elsevier; 2012.
- Otberg N, Wu W-Y, McElwee KJ, et al. Diagnosis and management of primary cicatricial alopecia: part I. Skinmed. 2008;7:19-26. doi:10.1111/j.1540-9740.2007.07163.x
- Callen JP. Chronic cutaneous lupus erythematosus. clinical, laboratory, therapeutic, and prognostic examination of 62 patients. Arch Dermatol. 1982;118:412-416. doi:10.1001/archderm.118.6.412
- McCarty DJ, Manzi S, Medsger TA Jr, et al. Incidence of systemic lupus erythematosus. race and gender differences. Arthritis Rheum. 1995;38:1260-1270. doi:10.1002/art.1780380914
- Morquette AJ, Waples ER, Heath CR. The importance of cosmetically elegant sunscreen in skin of color populations. J Cosmet Dermatol. In press.
- Zhou W, Wu H, Zhao M, et al. New insights into the progression from cutaneous lupus to systemic lupus erythematosus. Expert Rev Clin Immunol. 2020;16:829-837. doi:10.1080/17446 66X.2020.1805316
- Grayson C, Heath C. An approach to examining tightly coiled hair among patients with hair loss in race-discordant patientphysician interactions. JAMA Dermatol. 2021;157:505-506. doi:10.1001/jamadermatol.2021.0338
- Grayson C, Heath CR. Counseling about traction alopecia: a “compliment, discuss, and suggest” method. Cutis. 2021;108:20-22.
 indurated plaques in a butterfly distribution on the face of a 30-year-old woman with a darker skin tone")
Unusual tongue markings

Well-demarcated, map-like tongue markings are consistent with migratory glossitis, also called geographic tongue, and can be recognized by its distinct clinical appearance. If performed, a biopsy would show psoriasiform mucositis.
Migratory glossitis is an uncommon condition found mostly in adults and occasionally in children. The prevalence may be as high as 2.5% globally and it may occur in conjunction with psoriasis, sharing some histologic features.1 (On close inspection, this patient was noted to have plaques on his elbows that were consistent with psoriasis.) While an immunogenic cause is suspected, the exact etiology is unknown.
Patients may develop these clinical findings quickly and just as quickly they may resolve. Discomfort and taste disturbances rarely occur. Hot, spicy, or acidic foods may be a contributing trigger. Tobacco-use appears to be protective. The presence of ulceration should prompt evaluation for a different diagnosis, such as erosive lichen planus, leukoplakia, candidiasis, or Behçet syndrome.
With minimal symptoms, treatment is rarely needed. Patients with any discomfort can be treated with topical lidocaine 2% swish and spit mouthwash, topical tacrolimus, or topical steroids.
The patient in this case was reassured that the diagnosis was not concerning and he was observed without active treatment. His psoriasis was treated with topical clobetasol ointment 0.05%. He has continued to have intermittent flares that he has yet to associate with any specific dietary causes.
Text courtesy of Jonathan Karnes, MD, medical director, MDFMR Dermatology Services, Augusta, ME. Photos courtesy of Jonathan Karnes, MD (copyright retained).
1. Shareef S, Ettefagh L. Geographic tongue. StatPearls [Internet]. Updated August 3, 2021. Accessed February 25, 2022. https://www.ncbi.nlm.nih.gov/books/NBK554466/
Well-demarcated, map-like tongue markings are consistent with migratory glossitis, also called geographic tongue, and can be recognized by its distinct clinical appearance. If performed, a biopsy would show psoriasiform mucositis.
Migratory glossitis is an uncommon condition found mostly in adults and occasionally in children. The prevalence may be as high as 2.5% globally and it may occur in conjunction with psoriasis, sharing some histologic features.1 (On close inspection, this patient was noted to have plaques on his elbows that were consistent with psoriasis.) While an immunogenic cause is suspected, the exact etiology is unknown.
Patients may develop these clinical findings quickly and just as quickly they may resolve. Discomfort and taste disturbances rarely occur. Hot, spicy, or acidic foods may be a contributing trigger. Tobacco-use appears to be protective. The presence of ulceration should prompt evaluation for a different diagnosis, such as erosive lichen planus, leukoplakia, candidiasis, or Behçet syndrome.
With minimal symptoms, treatment is rarely needed. Patients with any discomfort can be treated with topical lidocaine 2% swish and spit mouthwash, topical tacrolimus, or topical steroids.
The patient in this case was reassured that the diagnosis was not concerning and he was observed without active treatment. His psoriasis was treated with topical clobetasol ointment 0.05%. He has continued to have intermittent flares that he has yet to associate with any specific dietary causes.
Text courtesy of Jonathan Karnes, MD, medical director, MDFMR Dermatology Services, Augusta, ME. Photos courtesy of Jonathan Karnes, MD (copyright retained).
1. Shareef S, Ettefagh L. Geographic tongue. StatPearls [Internet]. Updated August 3, 2021. Accessed February 25, 2022. https://www.ncbi.nlm.nih.gov/books/NBK554466/
1. Shareef S, Ettefagh L. Geographic tongue. StatPearls [Internet]. Updated August 3, 2021. Accessed February 25, 2022. https://www.ncbi.nlm.nih.gov/books/NBK554466/

Osteoarthritis burden grows worldwide, Global Burden of Disease study finds
Prevalent cases of osteoarthritis increased significantly worldwide from 1990 to 2019, based on data from the Global Burden of Disease Study 2019.
OA remains a highly prevalent condition worldwide, with no nonsurgical interventions to prevent progression, wrote Huibin Long, MD, of Capital Medical University, Beijing, and colleagues.
Data from previous studies show that the prevalence of OA varies depending on the joints involved, with the knee being most frequently affected. However, site-specific data on OA trends and disease burden across regions or territories has not been well documented, they said.
In a study published in Arthritis & Rheumatology, the researchers analyzed data from the Global Burden of Disease Study, an ongoing project involving researchers in approximately 200 countries and territories to provide up-to-date information on the disease burdens of more than 350 types of diseases and injuries.
The Global Burden of Disease study for 2019 (GBD 2019) included data on age- and sex-specific incidence, prevalence, mortality, years of life lost, and disability-adjusted life-years for 369 diseases and injuries in 204 countries and territories. Countries were divided into five groups based on a composite sociodemographic index (SDI) of factors including fertility, income, and educational attainment; the SDI represents the quality and availability of health care, the researchers wrote.
OA was defined as radiologically confirmed Kellgren-Lawrence grade 2-4 and pain for at least 1 month during the past 12 months.
Overall, prevalent OA cases increased by 113.25% worldwide, from 247.51 million in 1990 to 527.81 million in 2019. China had the highest number of cases in 2019 (132.81 million), followed by India (62.36 million), and the United States (51.87 million). The percentage increases for these three countries from 1990 to 2019 were 156.58%, 165.75%, and 79.63%, respectively.
To further calculate trends in OA, the researchers used age-standardized prevalence rates (ASRs). The overall ASRs increased from 6,173.38 per 100,000 individuals in 1990 to 6,348.25 per 100,000 individuals in 2019, for an estimated annual percentage change of 0.12%. The ASR of OA varied substantially across countries in 2019, with the highest level observed in the United States (9,960.88 per 100,000) and the lowest in Timor-Leste (3,768.44 per 100,000). The prevalence of OA was higher in countries with higher SDI levels, such as the United States and the Republic of Korea, and increased life expectancy may play a role, they said.
OA prevalence increased with age; the prevalence of OA among adults peaked at 60-64 years in both 1990 and 2019. The absolute number of cases rose most sharply among individuals aged 95 years and older, increasing nearly fourfold during the 30-year period. The ASR of OA was also highest for people aged 95 years or older.
As for site-specific prevalence in 2019, OA of the knee was the most common site worldwide (60.6% of cases), followed by OA of the hand (23.7%), other joint sites (10.2%), and the hip (5.5%).
The ASR of OA increased for knee, hip, and other joints, with estimated annual percentage changes of 0.32%, 0.28%, and 0.18%, respectively, but decreased by 0.36% for the hand.
OA in large joints, such as the knee and hip, is often associated with higher disease burden, the researchers said. However, this held true for only knee OA because in this study, “globally as well as in most regions and countries, joints with the main disease burden were the knee, followed by the hand, [and] other joints except spine, while OA [of the] hip contributed the least,” they noted.
The study findings were limited by several factors including the adjustments from individual studies in the GBD and the exclusion of spinal symptoms, which might have contributed to an underestimation of disease burden, the researchers noted. Other limitations included the lack of assessment of the effect of health systems as part of the SDI, they said.
Overall, the results support a trend of increasing OA worldwide that is expected to continue in part because of the aging global population and the ongoing epidemic of obesity, the researchers said.
“Public awareness of the modifiable risk factors, and potential education programs of prevention of disease occurrence are essential to alleviate the enormous burden of OA,” they concluded.
The study was supported by the Beijing Postdoctoral Research Foundation and National Natural Science Foundation of China. The researchers had no financial conflicts to disclose.
FROM ARTHRITIS & RHEUMATOLOGY