User login
Ramucirumab-mediated survival benefit in advanced HCC unperturbed by baseline prognostic covariates
Key clinical point: Patients with advanced hepatocellular carcinoma (aHCC) and alpha-fetoprotein (AFP) levels ≥400 ng/mL experience a consistent survival benefit with ramucirumab therapy irrespective of baseline prognostic covariates.
Major finding: Ramucirumab vs. placebo improved overall survival in patients with viral (hazard ratio [HR] 0.76; 95% CI 0.60-0.97) and nonviral (HR 0.56; 95% CI 0.49-0.79) etiologies and in those with above-median AFP levels (≥4,081.5 ng/mL; HR 0.71; 95% CI 0.54-0.95).
Study details: Findings are from a post hoc meta-analysis of the phase 3 REACH and REACH-2 trials involving 542 patients with aHCC and AFP levels ≥400 ng/mL who were randomly assigned to receive ramucirumab (n = 316) or placebo (n = 226).
Disclosures: The study was sponsored by Eli Lilly and Company. JM Llovet, A Singal, A Villanueva, R Finn, M Kudo, P Galle, M Ikeda, and A Zhu reported receiving grants, personal/advisory board/consulting fees, or honoraria from various sources, including Eli Lilly. The other authors are employees or shareholders of Eli Lilly.
Source: Llovet JM et al. Prognostic and predictive factors in patients with advanced HCC and elevated alpha-fetoprotein treated with ramucirumab in two randomized phase III trial. Clin Cancer Res. 2022 (Mar 4). Doi: 10.1158/1078-0432.CCR-21-4000
Evaluation of the Empower Veterans Program for Military Veterans With Chronic Pain
From Neurology/Chronic Pain Management Services, Department of Veterans Affairs (VA) Maryland Health Care System, Baltimore VA Medical Center, Baltimore, MD (Dr. Uche), and School of Nursing, Washburn University, Topeka, KS (Drs. Jamison and Waugh).
Abstract
Objective: The purpose of this quality improvement project was to abstract and analyze previously collected data from veterans with high-impact chronic pain who attended the Empower Veterans Program (EVP) offered by a Veterans Administration facility in the northeastern United States.
Methods: This quality improvement project used data collected from veterans with chronic pain who completed the veterans health care facility’s EVP between August 2017 and August 2019. Pre- and post-intervention data on pain intensity, pain interference, quality of life, and pain catastrophizing were compared using paired t-tests.
Results: Although data were abstracted from 115 patients, the final sample included
Conclusion: Veterans with chronic high-impact noncancer pain who completed the EVP had reduced pain intensity, pain interference, pain catastrophizing as well as improved quality of life and satisfaction with their health.
Keywords: musculoskeletal pain, Veterans Affairs, complementary and integrative health, acceptance and commitment therapy, mind-body therapies, whole health, multidisciplinary pain management.
More than 100 million American adults suffer from chronic pain; costs associated with managing chronic pain are approximately $635 billion
One such program is the Empower Veterans Program (EVP). Originally developed at the Atlanta Veterans Affairs Health Care System, the EVP is a CIH modality based on the biopsychosocial model of pain developed by psychiatrist George Engel in 1977.3 The biopsychosocial model of pain recognizes that pain is a complex, multidimensional, biopsychosocial experience. Under this model, the mind and body work in unison as interconnected entities. Because the model acknowledges biological, psychological, and social components of pain and illness,4 treatment focuses on all aspects of a person’s health, life, and relationships.
The EVP fits into the VHA Pain Management Stepped Care Model and is an adjunctive complement for that model.5-7 The EVP complements care at the first step, where patient/family provide self-care and where care is provided by patient-aligned primary care teams, at the second step, which includes secondary consultation with multidisciplinary pain medicine specialty teams and other specialists, and at the third step, with the addition of tertiary interdisciplinary pain centers.
The VA Maryland Health Care System (VAMHCS) implemented the EVP as part of a quality improvement project for the management of chronic pain. The objectives of the program were to reduce pain intensity, pain catastrophizing, and pain interference, as well as improve functionality and quality of life among veterans with chronic high-impact noncancer pain. More than 2 years after the program was implemented, collected data had not been analyzed. The purpose of this quality improvement project was to abstract and analyze the previously collected data from veterans with high-impact chronic pain who attended an EVP offered by the VAMHCS. The results of the data analysis were used to inform decisions regarding the future of the program.
Methods
This quality improvement project used the Plan-Do-Study-Act (PDSA) process.8 The first 2 phases of the PDSA cycle (Plan and Do) were completed by a team of VA employees from the VAMHCS, who donated their time to establish and implement the program at the project site. This team consisted of psychologists, a physical therapist, a social worker, and a chaplain, and included support from medical administrative staff. This team planned and implemented the EVP at the VA facility based on the model developed at the Atlanta VA Health Care System. During the “Do” phase, the team collected data on pain intensity, pain interference, quality of life, and pain negative cognition (catastrophizing) before the intervention and post intervention. They also collected data on program outcome (patient treatment satisfaction) post intervention. Because these employees did not have time to retrieve and analyze the data, they welcomed the opportunity to have the data analyzed by the investigators during the Study phase of the PDSA cycle. Based on the results of the analysis, recommendations for program changes were made during the Act phase of the cycle.
Intervention
The EVP was developed as a 10-week (30 hours) interdisciplinary CIH approach that coached veterans with chronic pain to live fuller lives based on their individual values and what matters to them. EVP is the “What Else” management modality for the 5% of veterans with high-impact chronic pain.9 The EVP provided functional restoration through its components of whole health, mindfulness training, coaching calls, acceptance and commitment therapy, and mindful movement. It used the Wheel of Health with the 4 key components of me, self-care, professional care, and community.10,11
Veterans who had a diagnosis of chronic nonmalignant pain for 3 months or more and who agreed to participate in the EVP at this facility attended 3-hour classes every Tuesday with a cohort of 8 to 12 peers and engaged in one-on-one coaching with interdisciplinary team members. During the class sessions, veterans were coached to understand and accept their pain and commit to maintaining function despite their pain. Mindful movement by the physical therapist emphasized the pivotal place of exercise in pain management. The therapist used the mantra “Motion is Lotion.”9 The guiding principle of the EVP was that small incremental changes can have a big impact on the individual’s whole life. Emphasis was placed on increasing self-efficacy and mindful awareness for veterans with high-impact pain by giving them “Skills before Pills.”9
Outcome Measures
Outcome measures included the Numerical Pain Rating Scale (NPRS), the Multidimensional Pain Inventory (MPI), the World Health Organization Quality of Life assessment (WHOQOL-BREF), the Pain Catastrophizing Scale (PCS), and the Pain Treatment Satisfaction Scale (PTSS). Cronbach alpha coefficients were calculated to assess internal consistency reliability of these measures in the sample of veterans who completed the EVP.
NPRS. The NPRS is ubiquitous as a screening tool in many health care environments and its use is mandated by the VA health care system.12 The choice of the NPRS as the tool for pain screening in the VA health care system was based on a large body of research that supports the reliability and validity of the NPRS as a single index of pain intensity or severity. Studies suggest that the NPRS is valid for use in the assessment of acute, cancer, or chronic nonmalignant pain and in varied clinical settings.13 The NPRS has 4 items, each on a scale of 0 to 10. For the purpose of this project, only 3 items were used. The 3 items assessed the worst pain, usual pain, and the current pain (right now). The higher the score, the higher the pain intensity. Cronbach alpha coefficients on the NPRS obtained from the current sample of veterans were 0.85 on both pre- and postintervention assessments.
MPI. The MPI is an easily accessible, reliable, and valid self-report questionnaire that measures the impact of pain on an individual’s life, quality of social support, and general activity.14 This instrument is a short version of the West Haven-Yale MPI.15 The MPI contains 9 items rated on a scale from 0 to 6. The higher the score, the greater pain interference a person is experiencing. The MPI produces reliable, valid information for diagnostic purposes and for therapy outcome studies.16 The MPI had a Cronbach alpha of 0.90 on pre-intervention and 0.92 on postintervention assessments in the current sample.
WHOQOL-BREF. The WHOQOL-BREF is a measure of quality of life and is an abbreviated version of the WHOQOL-100. Quality of life is defined by the World Health Organization17 “as an individuals’ perception of their position in life in the context of the culture and value systems in which they live and in relation to their goals, expectations, standards and concerns.” The WHOQOL-BREF contains 26 items. The first 2 items were examined separately; the first item asks individuals to rate their overall quality of life and the second asks individuals how satisfied they are with their health. The remaining 24 items were used to calculate the following 4 domain scores: physical health, psychological health, social relationship, and environment.18 Each item is measured on a scale of 1 to 5. Higher scores denote higher or better quality of life. Domain scores have demonstrated good reliability and validity.19-21 Cronbach alpha coefficients for the domain subscales ranged from 0.63 to 0.84 in the current sample, with the lowest alphas for the 3-item Social Relationships Domain.
PCS. The PCS is a widely used measure of catastrophic thinking related to pain. Catastrophizing has been conceived by Sullivan and colleagues as “an exaggerated negative mental set brought to bear during actual or anticipated painful experience.”22 The PCS provides a total score and scores for the following subscales: rumination, magnification, and helplessness.23 It has been used in a variety of chronic pain populations and has demonstrated good reliability and validity in clinical as well as nonclinical samples.24-26 The PCS has 13 items rated on a scale of 0 to 4. Higher scores mean greater negative pain cognition (catastrophizing). In the current sample, the PCS total scale had a Cronbach alpha coefficient of 0.95 and 0.94 on the 2 assessments. The coefficients for the subscales ranged from 0.81 to 0.90.
PTSS. The PTSS is a 5-item tool that measures patient satisfaction with pain treatment. It includes items that address overall satisfaction, staff warmth, staff skill level, ease of scheduling appointments, and recommendation of the program to other veterans. It was derived from the post-treatment version of The Pain Outcome Questionnaire-VA and has demonstrated reliability and validity.27 The questions are scaled from 0 to 10. High scores on the PTSS denote high patient satisfaction with the EVP. The Cronbach alpha coefficient on the PTSS obtained from the current sample was 0.80.
Data Gathering and Analysis
Prior to starting the Study phase, Washburn University’s Institutional Review Board (IRB) and the VA IRB approved the project. The VA IRB, through its affiliate, gave a Not Human Research Determination and granted a waiver of informed consent and the Health Insurance Portability and Accountability Act authorization. The VA facility’s Research and Development department also approved the quality improvement project.
Once these approvals were obtained, the Study phase began with the abstraction of retrospective data obtained from veterans who participated in the VA health care facility’s EVP between
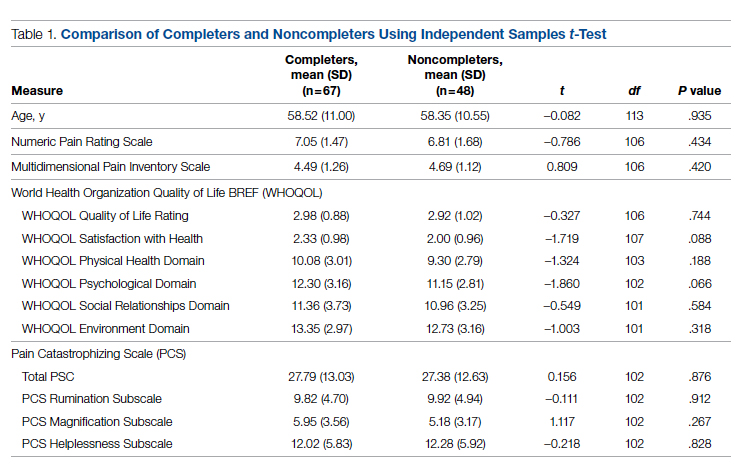
Veterans who completed the program were compared to veterans who did not complete the program on age, gender, and baseline measures. The investigators used independent samples t-tests to compare completers and noncompleters on age, pain intensity, pain interference, quality of life, and pain catastrophizing. They used the chi-square test of independence to analyze the association between gender and program completion.
Data were included in the pre- and postintervention analysis if the veteran completed the NPRS, MPI, WHOQOL-BREF, and PCS pre and post intervention. This became an important eligibility requirement as some of the tools/measures were changed towards the end of the review period in 2019. Pre- and postintervention data on pain intensity, pain interference, quality of life, pain catastrophizing, and patient satisfaction were compared using paired samples t-test at .004 level of significance based on the Bonferroni correction.28 Data on patient satisfaction with pain treatment were collected at program completion (week 8 or 10) and were analyzed using descriptive statistics.
Effect sizes (Cohen’s d) were calculated to determine the substantive significance or magnitude of the mean differences in scores. Effect sizes (expressed as absolute values of Cohen’s d) were calculated as the mean difference divided by the standard deviation. Values of 0.2 were considered a small effect size, 0.5 a medium effect size, and 0.8 a large effect size.29
Results
Data were abstracted for 115 veterans who started the EVP. Of these, 48 left the program, leaving 67 veterans (58%) who completed the program. Completers and noncompleters were similar in age, gender, and baseline measures (Table 1). Fifty-three (79%) completers and 35 (73%) noncompleters were male. A chi-square test of independence showed no significant association between gender and program completion (χ21 [N = 115] = .595, P = .440).
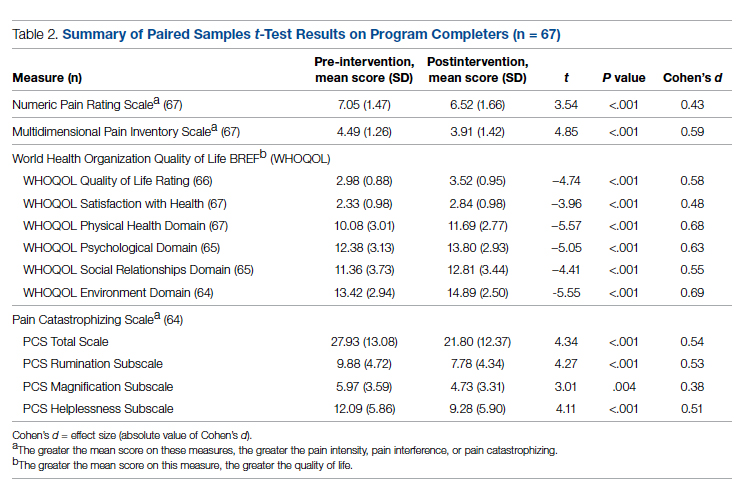
Comparison of pre-and postintervention mean scale scores resulted in statistically significant
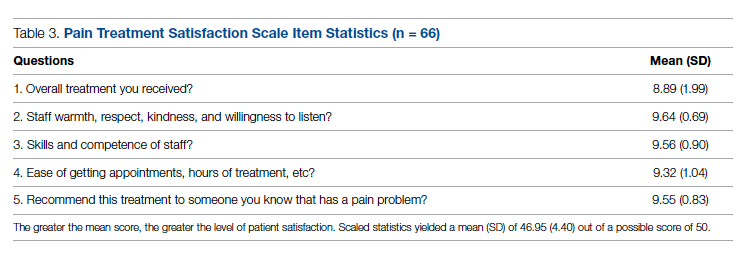
Analysis of data obtained using the PTSS yielded high mean scores for items that focused on patient satisfaction with treatment (Table 3). Scaled statistics yielded a mean (SD) of 46.95 (4.40). These results denoted overall patient satisfaction with the EVP.
Discussion
The purpose of this quality improvement project was to abstract and analyze previously collected data from veterans with high-impact chronic pain who attended the EVP. Comparison of pre-intervention and postintervention data obtained from 67 veterans who completed the program revealed improvements in pain intensity, pain interference, negative cognition (catastrophizing), and quality of life. The differences were statistically significant and clinically meaningful, with medium and large effect sizes. In addition, veterans reported high satisfaction with the EVP.
The EVP includes CIH approaches that have demonstrated effectiveness among veterans and other populations with chronic pain. A wealth of studies, for example, support the effectiveness of CIH approaches among veterans.30-34 Other studies focus on specific CIH approaches that are components of the EVP. Evidence supports, for example, the efficacy of mindfulness-based stress reduction,35-39 acceptance and commitment therapy,40-43 brief peer support intervention,44 and interdisciplinary biopsychosocial rehabilitation.45,46
While empirical evidence supports components of the EVP, only one study focused on the outcomes of the Atlanta VA EVP among veterans with chronic pain. Results of a qualitative study conducted by Penney and Haro47 described the experience of veterans with the EVP. Those veterans reported adopting new self-care or lifestyle practices for pain management and health, accepting pain, being better able to adjust and set boundaries, feeling more in control, participating in life, and changing their medication use.
The mean baseline scores from the current sample were similar to samples of patients with chronic pain in other studies (NPRS,48 MPI,48 and PCS48-51). After converting scores on the WHOQOL-BREF from those that ranged from 4 to 20 to those that ranged from 0 to 100,18 the scores from the current sample were similar to those of other studies of patients with chronic pain.48,52,53Several strengths of the project should be noted. Data were collected using well established measurement tools that had previously demonstrated reliability and validity. All the tools used in data collection demonstrated good internal consistency reliabilities in the current sample of veterans. Weaknesses of the project include the use of a convenience sample of veterans and small sample size. Data were not available on the number of veterans who were offered participation or on how many veterans declined enrollment. The sample of veterans who chose to participate in the EVP may or may not have been representative of the population of veterans with high-impact chronic pain. As a pre- and postintervention design with no comparison group, the results are subject to multiple threats to internal validity, including the Hawthorne effect, maturation in the form of healing, and attrition. Reasons for leaving the program had not been recorded, so the investigators had no way of knowing factors that may have contributed to attrition. Also, data on when veterans left the program were unavailable. Research is needed with a control group to reduce the effect of confounding variables on the outcome measures. This project used data collected at a single VA facility, which limits its generalizability.
While completers and noncompleters of the EVP were similar on age, gender, and baseline measures, there may have been unidentified characteristics that influenced program completion. The investigators noticed the presence of more missing data among noncompleters compared to completers on the pre-intervention PCS; thus, noncompleters may have scored lower than completers on this instrument simply because there were more individual items that were unanswered/missing among this group of noncompleters.
Data were analyzed using a limited number of outcome measures that had previously been collected. Other outcome measures might include whether EVP participants reduced their use of medications, clinical resources, and personnel. Future projects, for example, could determine whether the EVP is effective in reducing opioid analgesic medication use and decreasing primary care and emergency department visits. Cost-benefit analyses could be completed to determine whether EVP is associated with financial savings.
Because no follow-up assessments were made to determine whether improvements were maintained over time, the project focus was limited to an evaluation of the short-term changes in the outcome measures. Future projects could include a follow-up assessment of the veterans 1- or 2-years post completion of the EVP.
Data for the project were collected prior to the COVID-19 pandemic, when the EVP was implemented through face-to-face meetings with participants and their peers. It is not clear how changes to the delivery of the program (such as offering it through telehealth) might impact veterans’ satisfaction with the program, willingness to complete it, and other variables of interest.
The results of this project were made available to stakeholders with recommendations for program expansion both at the current location and at other VA facilities, including the recommendation to hire additional personnel that would implement the program. As the VA network of facilities expand the EVP program and adapt it for telehealth delivery, the investigators recommended a similar analysis of data be performed following telehealth delivery. If delivery through telehealth is shown to improve outcome measures, the EVP could provide pain management treatment options for patients challenged by transportation barriers, including rural veterans.
Conclusion
This quality improvement project provided evidence of improvement in measures of pain severity, pain interference, negative cognition (catastrophizing), quality of life, and patient treatment satisfaction among veterans with chronic high-impact pain. Findings have been well received by the northeastern VA as well as the Veterans Integrated Systems Network 5. The results of the analyses were used to inform decisions regarding the future of the program.
Disclaimer: This material is the result of work supported with resources and the use of facilities at the VA Maryland Health Care System, Baltimore, Maryland. The views expressed are those of the authors and do not necessarily represent the views of the Department of Veterans Affairs or the United States Government.
Acknowledgments: The authors thank Dr. Arianna Perra, the recent past coordinator of the Empower Veterans Program (EVP), who provided initial insights and support that motivated the decision to evaluate the program. We also thank the veterans and VA EVP clinicians who contributed data for the evaluation, and Dr. Michael Saenger (Director, TelePain-EVP: EVP) and Dr. Robert Lavin for their ongoing support, care, and concern for veteran patients. We also thank Dr. Beverly Bradley and the neurology service administrative team for their guidance in the process of obtaining necessary VA approvals for this project.
Corresponding author: Jessica U. Uche, DNP, CRNP-Family; [email protected]
doi:10.12788/jcom.0089
1. Institute of Medicine (US) Committee on Advancing Pain Research, Care, and Education. Relieving Pain in America: A Blueprint for Transforming Prevention, Care, Education, and Research. The National Academies Press (US); 2011.
2. Bastian LA, Heapy A, Becker WC, et al. Understanding pain and pain treatment for veterans: responding to the federal pain research strategy. Pain Med. 2018;19(suppl_1); S1-S4. doi:10.1093/pm/pny1433
3. Engle GL. The need for a new medical model: a challenge for biomedicine. Science. 1977;196(4286):129-136. doi:10.1126/science.847460
4. Bevers K, Watts L, Kishino ND, et al. The biopsychosocial model of the assessment, prevention, and treatment of chronic pain. US Neurology. 2016;12(2):98-104. doi:10.17925/USN.2016.12.02.98
5. Bair MJ, Ang D, Wu J, et al. Evaluation of stepped care for chronic pain (ESCAPE) in veterans of the Iraq and Afghanistan conflicts: A randomized clinical trial. JAMA Intern Med. 2015;175(5):682-689. doi:10.1001/jamainternmed.2015.97
6. Veterans Health Administration. Pain Management. VHA Directive 2009-053. Washington, DC: Department of Veterans Affairs; 2009.https://www.va.gov/painmanagement/docs/vha09paindirective.pdf
7. Moore BA, Anderson D, Dorflinger L, et al. Stepped care model for pain management and quality of pain care in long-term opioid therapy. J Rehabil Res Dev. 2016;53(1):137-146. doi:10.1682/JRRD.2014.10.0254
8. Institute for Healthcare Improvement. How to improve. Accessed March 14, 2022. http://www.ihi.org/resources/Pages/HowtoImprove/default.aspx
9. Saenger M. Empower Veterans Program. APA PCSS-O Webinars. Evidence CAM LBP 2016.
10. Gaudet T, Kligler B. Whole health in the whole system of the Veterans Administration: How will we know we have reached this future state? J Altern Complement Med. 2019;25(S1):S7-S11. doi:10.1089/acm.2018.29061.gau
11. Veterans Health Administration. Whole health: Circle of health. Updated April 1, 2021. Accessed March 14, 2022. https://www.va.gov/WHOLEHEALTH/circle-of-health/index.asp
12. Krebs EE, Carey TS, Weinberger M. Accuracy of the pain numeric rating scale as a screening test in primary care. J Gen Intern Med. 2007;22(10):1453-1458. doi:10.1007/s11606-007-0321-2
13. Veterans Health Administration. Pain as the 5th vital sign toolkit. October 2000, revised edition. Geriatrics and Extended Care Strategic Healthcare Group, National Pain Management Coordinating Committee. https://www.va.gov/PAINMANAGEMENT/docs/Pain_As_the_5th_Vital_Sign_Toolkit.pdf
14. McKillop JM, Nielson WR. Improving the usefulness of the Multidimensional Pain Inventory. Pain Res Manag. 2011;16(4):239-244. doi:10.1155/2011/873424
15. Kerns RD, Turk DC, Rudy TE. The West Haven-Yale Multidimensional Pain Inventory (WHYMPI). Pain.1985;23(4):345-356. doi:10.1016/0304-3959(85)90004-1
16. Verra ML, Angst F, Staal JB, et al. Reliability of the multidimensional pain inventory and stability of the MPI classification system in chronic back pain. BMC Musculoskelet Disord. 2012;13:155. doi:10.1186/1471-2474-13-155
17. Development of the World Health Organization WHOQOL-BREF quality of life assessment. The WHOQOL Group. Psychol Med. 1998;28(3):551-558. doi:10.1017/s0033291798006667
18. World Health Organization. Division of Mental Health. WHOQOL-BREF: introduction, administration, scoring and generic version of the assessment: field trial version, December 1996. Accessed March 14, 2022. https://apps.who.int/iris/handle/10665/63529
19. Guay S, Fortin C, Fikretoglu D, et al. Validation of the WHOQOL-BREF in a sample of male treatment-seeking veterans. Mil Psychol. 2015;27(2):85-92. doi:10.1037/mil0000065
20. Skevington S, Lotfy M, O’Connell K, WHOQOL Group. The World Health Organization’s WHOQOL-BREF quality of life assessment: Psychometric properties and results of the international field trial. A Report from the WHOQOL Group. Qual Life Res. 2004;13(2):299-310. doi:10.1023/B:QURE.0000018486.91360.00
21. Stratton KJ, Bender MC, Cameron JJ, Pickett TC. Development and evaluation of a behavioral pain management treatment program in a Veterans Affairs Medical Center. Mil Med. 2015;180(3):263-268. doi:10.7205/MILMED-D-14-00281.
22. Sullivan MJ, Thorn B, Haythornthwaite JA, et al. Theoretical perspectives on the relation between catastrophizing and pain. Clin J Pain. 2001;17(1):52-64. doi:10.1097/00002508-200103000-00008
23. Sullivan JL. The Pain Catastrophizing Scale: User manual. Accessed March 14, 2022. https://studylib.net/doc/8330191/the-pain-catastrophizing-scale---dr.-michael-sullivan
24. Darnall BD, Sturgeon JA, Cook KF, et al. Development and validation of a daily pain catastrophizing scale. J Pain. 2017;18(9):1139-1149. doi:10.1016/j.jpain.2017.05.003
25. Osman A, Barrios FX, Kopper BA, et al. Factor structure, reliability, and validity of the Pain Catastrophizing Scale. J Behav Med. 1997;20(6):589-605. doi:10.1023/a:1025570508954
26. Sullivan MJL, Bishop S, Pivik J. The Pain Catastrophizing Scale: development and validation. Psychol Assessment. 1995;7(4):524-532. doi:10.1037/1040-3590.7.4.524
27. Walker R, Clark M, Gironda R. Psychometric characteristics of the Pain Treatment Satisfaction Scale. J Pain. 2015;6(3Suppl.):S76.
28. Emerson RW. Bonferroni correction and type I error. J Vis Impair Blind. 2020;114(1):77-78. doi:10.1177/0145482X20901378
29. Cohen J. Statistical power analysis for the behavioral sciences. 2nd ed. Routledge; 1988. doi:10.4324/9780203771587
30. Craner JR, Lake ES, Bancroft KA, George LL. Treatment outcomes and mechanisms for an ACT-based 10-week interdisciplinary chronic pain rehabilitation program. Pain Pract. 2020;20(1):44-54. doi:10.1111/papr.12824
31. Han L, Goulet JL, Skanderson M, et al. Evaluation of complementary and integrative health approaches among US veterans with musculoskeletal pain using propensity score methods. Pain Med. 2019;20(1):90-102. doi:10.1093/pm/pny027
32. Herman PM, Yuan AH, Cefalu MS, et al. The use of complementary and integrative health approaches for chronic musculoskeletal pain in younger US veterans: an economic evaluation. PLoS One. 2019;14(6):e0217831. doi:10.1371/journal.pone.0217831
33. National Academies of Sciences, Engineering, and Medicine; Health and Medicine Division; Board on Global Health; Board on Health Sciences Policy; Global Forum on Innovation in Health Professional Education; Forum on Neuroscience and Nervous System Disorders; Stroud C, Posey Norris SM, Bain L, eds. The Role of Nonpharmacological Approaches to Pain Management: Proceedings of a Workshop. National Academies Press (US); April 12, 2019.
34. Richmond H, Hall AM, Copsey B, et al. The effectiveness of cognitive behavioural treatment for non-specific low back pain: a systematic review and meta-analysis. PLoS One. 2015;10(8):e0134192. doi:10.1371/journal.pone.0134192

35. Kearney DJ, Simpson TL, Malte CA, et al. Mindfulness-based stress reduction in addition to usual care is associated with improvements in pain, fatigue, and cognitive failures among veterans with Gulf War illness. Am J Med. 2016;129(2):204-214. doi:10.1016/j.amjmed.2015.09.015
36. Khoo E, Small R, Cheng W, et al. Comparative evaluation of group-based mindfulness-based stress reduction and cognitive behavioral therapy for the treatment and management of chronic pain: a systematic review and network meta-analysis. Evid Based Ment Health. 2019;22(1):26-35. doi:10.1136/ebmental-2018-300062
37. Khusid MA, Vythilingam M. The emerging role of mindfulness meditation as effective self-management strategy, Part 2: clinical implications for chronic pain, substance misuse, and insomnia. Mil Med. 2016;181(9):969-975. doi:10.7205/MILMED-D-14-00678
38. la Cour P, Petersen M. Effects of mindfulness meditation on chronic pain: A randomized controlled trial. Pain Med. 2015;16(4):641-652. doi:10.1111/pme.12605
39. Zou L, Zhang Y, Yang L, et al. Are mindful exercises safe and beneficial for treating chronic lower back pain? A systematic review and meta-analysis of randomized controlled trials. J Clin Med. 2019;8(5):628. doi:10.3390/jcm8050628
40. Hughes LS, Clark J, Colclough JA, et al. Acceptance and commitment therapy (ACT) for chronic pain: a systematic review and meta-analyses. Clin J Pain. 2017;33(6):552-568. doi:10.1097/AJP.0000000000000425
41. Kemani MK, Olsson GL, Lekander M, et al. Efficacy and cost-effectiveness of acceptance and commitment therapy and applied relaxation for longstanding pain: a randomized controlled trial. Clin J Pain. 2015;31(11):1004-1016. doi:10.1097/AJP.0000000000000203
42. Scott W, Daly A, Yu L, McCracken LM. Treatment of chronic pain for adults 65 and over: analyses of outcomes and changes in psychological flexibility following interdisciplinary acceptance and commitment therapy (ACT). Pain Med. 2017;18(2):252. doi:10.1093/pm/pnw073
43. Veehof MM, Trompetter HR, Bohlmeijer ET, Schreurs KMG. Acceptance- and mindfulness-based interventions for the treatment of chronic pain: a meta-analytic review. Cogn Behav Ther. 2016;45(1):5-31. doi:10.1080/16506073.2015.1098724
44. Matthias MS, McGuire AB, Kukla M, et al. A brief peer support intervention for veterans with chronic musculoskeletal pain: a pilot study of feasibility and effectiveness. Pain Med. 2015;16(1):81-87. doi:10.1111/pme.12571
45. Anamkath NS, Palyo SA, Jacobs SC, et al. An interdisciplinary pain rehabilitation program for veterans with chronic pain: description and initial evaluation of outcomes. Pain Res Manag. 2018;2018(3941682):1-9. doi:10.1155/2018/3941682
46. Kamper SJ, Apeldoorn AT, Chiarotto A, et al. Multidisciplinary biopsychosocial rehabilitation for chronic low back pain. Cochrane Database Syst Rev. 2014;9: CD000963. doi:10.1002/14651858.CD000963.pub3
47. Penney LS, Haro E. Qualitative evaluation of an interdisciplinary chronic pain intervention: Outcomes and barriers and facilitators to ongoing pain management. J Pain Res. 2019;12:865-878. doi:10.2147/JPR.S185652
48. Murphy JL, Cordova MJ, Dedert EA. Cognitive behavioral therapy for chronic pain in veterans; Evidence for clinical effectiveness in a model program. Psychol Serv. 2022;19(1):95-102. doi:10.1037/ser0000506
49. Katz L, Patterson L, Zacharias R. Evaluation of an interdisciplinary chronic pain program and predictors of readiness for change. Can J Pain. 2019;3(1):70-78. doi:10.1080/24740527.2019.1582296
50. Majumder SMM, Ahmed S, Shazzad N, et al. Translation, cross-cultural adaptation and validation of the Pain Catastrophizing Scale (PCS) into Bengali I patients with chronic non-malignant musculoskeletal pain. Int J Rheum Dis. 2020;23:1481-1487. doi:10.1111/1756-185X.13954
51. Margiotta F, Hannigan A, Imran A, et al. Pain, perceived injustice, and pain catastrophizing in chronic pain patients in Ireland. Pain Pract. 2016;17(5):663-668. doi:10.1111/papr.12
52. Bras M, Milunovic V, Boban M, et al. Quality of live in Croatian Homeland war (1991-1995) veterans who suffer from post-traumatic stress disorder and chronic pain. Health Qual Life Out. 2011;9:56. doi:10.1186/1477-7525-9-56
53. Liu C-H, Kung Y-Y, Lin C-L, et al. Therapeutic efficacy and the impact of the “dose” effect of acupuncture to treat sciatica: A randomized controlled pilot study. J Pain Res. 2019;12:3511-3520. doi:10.2147/JPR.S210672
From Neurology/Chronic Pain Management Services, Department of Veterans Affairs (VA) Maryland Health Care System, Baltimore VA Medical Center, Baltimore, MD (Dr. Uche), and School of Nursing, Washburn University, Topeka, KS (Drs. Jamison and Waugh).
Abstract
Objective: The purpose of this quality improvement project was to abstract and analyze previously collected data from veterans with high-impact chronic pain who attended the Empower Veterans Program (EVP) offered by a Veterans Administration facility in the northeastern United States.
Methods: This quality improvement project used data collected from veterans with chronic pain who completed the veterans health care facility’s EVP between August 2017 and August 2019. Pre- and post-intervention data on pain intensity, pain interference, quality of life, and pain catastrophizing were compared using paired t-tests.
Results: Although data were abstracted from 115 patients, the final sample included
Conclusion: Veterans with chronic high-impact noncancer pain who completed the EVP had reduced pain intensity, pain interference, pain catastrophizing as well as improved quality of life and satisfaction with their health.
Keywords: musculoskeletal pain, Veterans Affairs, complementary and integrative health, acceptance and commitment therapy, mind-body therapies, whole health, multidisciplinary pain management.
More than 100 million American adults suffer from chronic pain; costs associated with managing chronic pain are approximately $635 billion
One such program is the Empower Veterans Program (EVP). Originally developed at the Atlanta Veterans Affairs Health Care System, the EVP is a CIH modality based on the biopsychosocial model of pain developed by psychiatrist George Engel in 1977.3 The biopsychosocial model of pain recognizes that pain is a complex, multidimensional, biopsychosocial experience. Under this model, the mind and body work in unison as interconnected entities. Because the model acknowledges biological, psychological, and social components of pain and illness,4 treatment focuses on all aspects of a person’s health, life, and relationships.
The EVP fits into the VHA Pain Management Stepped Care Model and is an adjunctive complement for that model.5-7 The EVP complements care at the first step, where patient/family provide self-care and where care is provided by patient-aligned primary care teams, at the second step, which includes secondary consultation with multidisciplinary pain medicine specialty teams and other specialists, and at the third step, with the addition of tertiary interdisciplinary pain centers.
The VA Maryland Health Care System (VAMHCS) implemented the EVP as part of a quality improvement project for the management of chronic pain. The objectives of the program were to reduce pain intensity, pain catastrophizing, and pain interference, as well as improve functionality and quality of life among veterans with chronic high-impact noncancer pain. More than 2 years after the program was implemented, collected data had not been analyzed. The purpose of this quality improvement project was to abstract and analyze the previously collected data from veterans with high-impact chronic pain who attended an EVP offered by the VAMHCS. The results of the data analysis were used to inform decisions regarding the future of the program.
Methods
This quality improvement project used the Plan-Do-Study-Act (PDSA) process.8 The first 2 phases of the PDSA cycle (Plan and Do) were completed by a team of VA employees from the VAMHCS, who donated their time to establish and implement the program at the project site. This team consisted of psychologists, a physical therapist, a social worker, and a chaplain, and included support from medical administrative staff. This team planned and implemented the EVP at the VA facility based on the model developed at the Atlanta VA Health Care System. During the “Do” phase, the team collected data on pain intensity, pain interference, quality of life, and pain negative cognition (catastrophizing) before the intervention and post intervention. They also collected data on program outcome (patient treatment satisfaction) post intervention. Because these employees did not have time to retrieve and analyze the data, they welcomed the opportunity to have the data analyzed by the investigators during the Study phase of the PDSA cycle. Based on the results of the analysis, recommendations for program changes were made during the Act phase of the cycle.
Intervention
The EVP was developed as a 10-week (30 hours) interdisciplinary CIH approach that coached veterans with chronic pain to live fuller lives based on their individual values and what matters to them. EVP is the “What Else” management modality for the 5% of veterans with high-impact chronic pain.9 The EVP provided functional restoration through its components of whole health, mindfulness training, coaching calls, acceptance and commitment therapy, and mindful movement. It used the Wheel of Health with the 4 key components of me, self-care, professional care, and community.10,11
Veterans who had a diagnosis of chronic nonmalignant pain for 3 months or more and who agreed to participate in the EVP at this facility attended 3-hour classes every Tuesday with a cohort of 8 to 12 peers and engaged in one-on-one coaching with interdisciplinary team members. During the class sessions, veterans were coached to understand and accept their pain and commit to maintaining function despite their pain. Mindful movement by the physical therapist emphasized the pivotal place of exercise in pain management. The therapist used the mantra “Motion is Lotion.”9 The guiding principle of the EVP was that small incremental changes can have a big impact on the individual’s whole life. Emphasis was placed on increasing self-efficacy and mindful awareness for veterans with high-impact pain by giving them “Skills before Pills.”9
Outcome Measures
Outcome measures included the Numerical Pain Rating Scale (NPRS), the Multidimensional Pain Inventory (MPI), the World Health Organization Quality of Life assessment (WHOQOL-BREF), the Pain Catastrophizing Scale (PCS), and the Pain Treatment Satisfaction Scale (PTSS). Cronbach alpha coefficients were calculated to assess internal consistency reliability of these measures in the sample of veterans who completed the EVP.
NPRS. The NPRS is ubiquitous as a screening tool in many health care environments and its use is mandated by the VA health care system.12 The choice of the NPRS as the tool for pain screening in the VA health care system was based on a large body of research that supports the reliability and validity of the NPRS as a single index of pain intensity or severity. Studies suggest that the NPRS is valid for use in the assessment of acute, cancer, or chronic nonmalignant pain and in varied clinical settings.13 The NPRS has 4 items, each on a scale of 0 to 10. For the purpose of this project, only 3 items were used. The 3 items assessed the worst pain, usual pain, and the current pain (right now). The higher the score, the higher the pain intensity. Cronbach alpha coefficients on the NPRS obtained from the current sample of veterans were 0.85 on both pre- and postintervention assessments.
MPI. The MPI is an easily accessible, reliable, and valid self-report questionnaire that measures the impact of pain on an individual’s life, quality of social support, and general activity.14 This instrument is a short version of the West Haven-Yale MPI.15 The MPI contains 9 items rated on a scale from 0 to 6. The higher the score, the greater pain interference a person is experiencing. The MPI produces reliable, valid information for diagnostic purposes and for therapy outcome studies.16 The MPI had a Cronbach alpha of 0.90 on pre-intervention and 0.92 on postintervention assessments in the current sample.
WHOQOL-BREF. The WHOQOL-BREF is a measure of quality of life and is an abbreviated version of the WHOQOL-100. Quality of life is defined by the World Health Organization17 “as an individuals’ perception of their position in life in the context of the culture and value systems in which they live and in relation to their goals, expectations, standards and concerns.” The WHOQOL-BREF contains 26 items. The first 2 items were examined separately; the first item asks individuals to rate their overall quality of life and the second asks individuals how satisfied they are with their health. The remaining 24 items were used to calculate the following 4 domain scores: physical health, psychological health, social relationship, and environment.18 Each item is measured on a scale of 1 to 5. Higher scores denote higher or better quality of life. Domain scores have demonstrated good reliability and validity.19-21 Cronbach alpha coefficients for the domain subscales ranged from 0.63 to 0.84 in the current sample, with the lowest alphas for the 3-item Social Relationships Domain.
PCS. The PCS is a widely used measure of catastrophic thinking related to pain. Catastrophizing has been conceived by Sullivan and colleagues as “an exaggerated negative mental set brought to bear during actual or anticipated painful experience.”22 The PCS provides a total score and scores for the following subscales: rumination, magnification, and helplessness.23 It has been used in a variety of chronic pain populations and has demonstrated good reliability and validity in clinical as well as nonclinical samples.24-26 The PCS has 13 items rated on a scale of 0 to 4. Higher scores mean greater negative pain cognition (catastrophizing). In the current sample, the PCS total scale had a Cronbach alpha coefficient of 0.95 and 0.94 on the 2 assessments. The coefficients for the subscales ranged from 0.81 to 0.90.
PTSS. The PTSS is a 5-item tool that measures patient satisfaction with pain treatment. It includes items that address overall satisfaction, staff warmth, staff skill level, ease of scheduling appointments, and recommendation of the program to other veterans. It was derived from the post-treatment version of The Pain Outcome Questionnaire-VA and has demonstrated reliability and validity.27 The questions are scaled from 0 to 10. High scores on the PTSS denote high patient satisfaction with the EVP. The Cronbach alpha coefficient on the PTSS obtained from the current sample was 0.80.
Data Gathering and Analysis
Prior to starting the Study phase, Washburn University’s Institutional Review Board (IRB) and the VA IRB approved the project. The VA IRB, through its affiliate, gave a Not Human Research Determination and granted a waiver of informed consent and the Health Insurance Portability and Accountability Act authorization. The VA facility’s Research and Development department also approved the quality improvement project.
Once these approvals were obtained, the Study phase began with the abstraction of retrospective data obtained from veterans who participated in the VA health care facility’s EVP between
Veterans who completed the program were compared to veterans who did not complete the program on age, gender, and baseline measures. The investigators used independent samples t-tests to compare completers and noncompleters on age, pain intensity, pain interference, quality of life, and pain catastrophizing. They used the chi-square test of independence to analyze the association between gender and program completion.
Data were included in the pre- and postintervention analysis if the veteran completed the NPRS, MPI, WHOQOL-BREF, and PCS pre and post intervention. This became an important eligibility requirement as some of the tools/measures were changed towards the end of the review period in 2019. Pre- and postintervention data on pain intensity, pain interference, quality of life, pain catastrophizing, and patient satisfaction were compared using paired samples t-test at .004 level of significance based on the Bonferroni correction.28 Data on patient satisfaction with pain treatment were collected at program completion (week 8 or 10) and were analyzed using descriptive statistics.
Effect sizes (Cohen’s d) were calculated to determine the substantive significance or magnitude of the mean differences in scores. Effect sizes (expressed as absolute values of Cohen’s d) were calculated as the mean difference divided by the standard deviation. Values of 0.2 were considered a small effect size, 0.5 a medium effect size, and 0.8 a large effect size.29
Results
Data were abstracted for 115 veterans who started the EVP. Of these, 48 left the program, leaving 67 veterans (58%) who completed the program. Completers and noncompleters were similar in age, gender, and baseline measures (Table 1). Fifty-three (79%) completers and 35 (73%) noncompleters were male. A chi-square test of independence showed no significant association between gender and program completion (χ21 [N = 115] = .595, P = .440).
Comparison of pre-and postintervention mean scale scores resulted in statistically significant
Analysis of data obtained using the PTSS yielded high mean scores for items that focused on patient satisfaction with treatment (Table 3). Scaled statistics yielded a mean (SD) of 46.95 (4.40). These results denoted overall patient satisfaction with the EVP.
Discussion
The purpose of this quality improvement project was to abstract and analyze previously collected data from veterans with high-impact chronic pain who attended the EVP. Comparison of pre-intervention and postintervention data obtained from 67 veterans who completed the program revealed improvements in pain intensity, pain interference, negative cognition (catastrophizing), and quality of life. The differences were statistically significant and clinically meaningful, with medium and large effect sizes. In addition, veterans reported high satisfaction with the EVP.
The EVP includes CIH approaches that have demonstrated effectiveness among veterans and other populations with chronic pain. A wealth of studies, for example, support the effectiveness of CIH approaches among veterans.30-34 Other studies focus on specific CIH approaches that are components of the EVP. Evidence supports, for example, the efficacy of mindfulness-based stress reduction,35-39 acceptance and commitment therapy,40-43 brief peer support intervention,44 and interdisciplinary biopsychosocial rehabilitation.45,46
While empirical evidence supports components of the EVP, only one study focused on the outcomes of the Atlanta VA EVP among veterans with chronic pain. Results of a qualitative study conducted by Penney and Haro47 described the experience of veterans with the EVP. Those veterans reported adopting new self-care or lifestyle practices for pain management and health, accepting pain, being better able to adjust and set boundaries, feeling more in control, participating in life, and changing their medication use.
The mean baseline scores from the current sample were similar to samples of patients with chronic pain in other studies (NPRS,48 MPI,48 and PCS48-51). After converting scores on the WHOQOL-BREF from those that ranged from 4 to 20 to those that ranged from 0 to 100,18 the scores from the current sample were similar to those of other studies of patients with chronic pain.48,52,53Several strengths of the project should be noted. Data were collected using well established measurement tools that had previously demonstrated reliability and validity. All the tools used in data collection demonstrated good internal consistency reliabilities in the current sample of veterans. Weaknesses of the project include the use of a convenience sample of veterans and small sample size. Data were not available on the number of veterans who were offered participation or on how many veterans declined enrollment. The sample of veterans who chose to participate in the EVP may or may not have been representative of the population of veterans with high-impact chronic pain. As a pre- and postintervention design with no comparison group, the results are subject to multiple threats to internal validity, including the Hawthorne effect, maturation in the form of healing, and attrition. Reasons for leaving the program had not been recorded, so the investigators had no way of knowing factors that may have contributed to attrition. Also, data on when veterans left the program were unavailable. Research is needed with a control group to reduce the effect of confounding variables on the outcome measures. This project used data collected at a single VA facility, which limits its generalizability.
While completers and noncompleters of the EVP were similar on age, gender, and baseline measures, there may have been unidentified characteristics that influenced program completion. The investigators noticed the presence of more missing data among noncompleters compared to completers on the pre-intervention PCS; thus, noncompleters may have scored lower than completers on this instrument simply because there were more individual items that were unanswered/missing among this group of noncompleters.
Data were analyzed using a limited number of outcome measures that had previously been collected. Other outcome measures might include whether EVP participants reduced their use of medications, clinical resources, and personnel. Future projects, for example, could determine whether the EVP is effective in reducing opioid analgesic medication use and decreasing primary care and emergency department visits. Cost-benefit analyses could be completed to determine whether EVP is associated with financial savings.
Because no follow-up assessments were made to determine whether improvements were maintained over time, the project focus was limited to an evaluation of the short-term changes in the outcome measures. Future projects could include a follow-up assessment of the veterans 1- or 2-years post completion of the EVP.
Data for the project were collected prior to the COVID-19 pandemic, when the EVP was implemented through face-to-face meetings with participants and their peers. It is not clear how changes to the delivery of the program (such as offering it through telehealth) might impact veterans’ satisfaction with the program, willingness to complete it, and other variables of interest.
The results of this project were made available to stakeholders with recommendations for program expansion both at the current location and at other VA facilities, including the recommendation to hire additional personnel that would implement the program. As the VA network of facilities expand the EVP program and adapt it for telehealth delivery, the investigators recommended a similar analysis of data be performed following telehealth delivery. If delivery through telehealth is shown to improve outcome measures, the EVP could provide pain management treatment options for patients challenged by transportation barriers, including rural veterans.
Conclusion
This quality improvement project provided evidence of improvement in measures of pain severity, pain interference, negative cognition (catastrophizing), quality of life, and patient treatment satisfaction among veterans with chronic high-impact pain. Findings have been well received by the northeastern VA as well as the Veterans Integrated Systems Network 5. The results of the analyses were used to inform decisions regarding the future of the program.
Disclaimer: This material is the result of work supported with resources and the use of facilities at the VA Maryland Health Care System, Baltimore, Maryland. The views expressed are those of the authors and do not necessarily represent the views of the Department of Veterans Affairs or the United States Government.
Acknowledgments: The authors thank Dr. Arianna Perra, the recent past coordinator of the Empower Veterans Program (EVP), who provided initial insights and support that motivated the decision to evaluate the program. We also thank the veterans and VA EVP clinicians who contributed data for the evaluation, and Dr. Michael Saenger (Director, TelePain-EVP: EVP) and Dr. Robert Lavin for their ongoing support, care, and concern for veteran patients. We also thank Dr. Beverly Bradley and the neurology service administrative team for their guidance in the process of obtaining necessary VA approvals for this project.
Corresponding author: Jessica U. Uche, DNP, CRNP-Family; [email protected]
doi:10.12788/jcom.0089
1. Institute of Medicine (US) Committee on Advancing Pain Research, Care, and Education. Relieving Pain in America: A Blueprint for Transforming Prevention, Care, Education, and Research. The National Academies Press (US); 2011.
2. Bastian LA, Heapy A, Becker WC, et al. Understanding pain and pain treatment for veterans: responding to the federal pain research strategy. Pain Med. 2018;19(suppl_1); S1-S4. doi:10.1093/pm/pny1433
3. Engle GL. The need for a new medical model: a challenge for biomedicine. Science. 1977;196(4286):129-136. doi:10.1126/science.847460
4. Bevers K, Watts L, Kishino ND, et al. The biopsychosocial model of the assessment, prevention, and treatment of chronic pain. US Neurology. 2016;12(2):98-104. doi:10.17925/USN.2016.12.02.98
5. Bair MJ, Ang D, Wu J, et al. Evaluation of stepped care for chronic pain (ESCAPE) in veterans of the Iraq and Afghanistan conflicts: A randomized clinical trial. JAMA Intern Med. 2015;175(5):682-689. doi:10.1001/jamainternmed.2015.97
6. Veterans Health Administration. Pain Management. VHA Directive 2009-053. Washington, DC: Department of Veterans Affairs; 2009.https://www.va.gov/painmanagement/docs/vha09paindirective.pdf
7. Moore BA, Anderson D, Dorflinger L, et al. Stepped care model for pain management and quality of pain care in long-term opioid therapy. J Rehabil Res Dev. 2016;53(1):137-146. doi:10.1682/JRRD.2014.10.0254
8. Institute for Healthcare Improvement. How to improve. Accessed March 14, 2022. http://www.ihi.org/resources/Pages/HowtoImprove/default.aspx
9. Saenger M. Empower Veterans Program. APA PCSS-O Webinars. Evidence CAM LBP 2016.
10. Gaudet T, Kligler B. Whole health in the whole system of the Veterans Administration: How will we know we have reached this future state? J Altern Complement Med. 2019;25(S1):S7-S11. doi:10.1089/acm.2018.29061.gau
11. Veterans Health Administration. Whole health: Circle of health. Updated April 1, 2021. Accessed March 14, 2022. https://www.va.gov/WHOLEHEALTH/circle-of-health/index.asp
12. Krebs EE, Carey TS, Weinberger M. Accuracy of the pain numeric rating scale as a screening test in primary care. J Gen Intern Med. 2007;22(10):1453-1458. doi:10.1007/s11606-007-0321-2
13. Veterans Health Administration. Pain as the 5th vital sign toolkit. October 2000, revised edition. Geriatrics and Extended Care Strategic Healthcare Group, National Pain Management Coordinating Committee. https://www.va.gov/PAINMANAGEMENT/docs/Pain_As_the_5th_Vital_Sign_Toolkit.pdf
14. McKillop JM, Nielson WR. Improving the usefulness of the Multidimensional Pain Inventory. Pain Res Manag. 2011;16(4):239-244. doi:10.1155/2011/873424
15. Kerns RD, Turk DC, Rudy TE. The West Haven-Yale Multidimensional Pain Inventory (WHYMPI). Pain.1985;23(4):345-356. doi:10.1016/0304-3959(85)90004-1
16. Verra ML, Angst F, Staal JB, et al. Reliability of the multidimensional pain inventory and stability of the MPI classification system in chronic back pain. BMC Musculoskelet Disord. 2012;13:155. doi:10.1186/1471-2474-13-155
17. Development of the World Health Organization WHOQOL-BREF quality of life assessment. The WHOQOL Group. Psychol Med. 1998;28(3):551-558. doi:10.1017/s0033291798006667
18. World Health Organization. Division of Mental Health. WHOQOL-BREF: introduction, administration, scoring and generic version of the assessment: field trial version, December 1996. Accessed March 14, 2022. https://apps.who.int/iris/handle/10665/63529
19. Guay S, Fortin C, Fikretoglu D, et al. Validation of the WHOQOL-BREF in a sample of male treatment-seeking veterans. Mil Psychol. 2015;27(2):85-92. doi:10.1037/mil0000065
20. Skevington S, Lotfy M, O’Connell K, WHOQOL Group. The World Health Organization’s WHOQOL-BREF quality of life assessment: Psychometric properties and results of the international field trial. A Report from the WHOQOL Group. Qual Life Res. 2004;13(2):299-310. doi:10.1023/B:QURE.0000018486.91360.00
21. Stratton KJ, Bender MC, Cameron JJ, Pickett TC. Development and evaluation of a behavioral pain management treatment program in a Veterans Affairs Medical Center. Mil Med. 2015;180(3):263-268. doi:10.7205/MILMED-D-14-00281.
22. Sullivan MJ, Thorn B, Haythornthwaite JA, et al. Theoretical perspectives on the relation between catastrophizing and pain. Clin J Pain. 2001;17(1):52-64. doi:10.1097/00002508-200103000-00008
23. Sullivan JL. The Pain Catastrophizing Scale: User manual. Accessed March 14, 2022. https://studylib.net/doc/8330191/the-pain-catastrophizing-scale---dr.-michael-sullivan
24. Darnall BD, Sturgeon JA, Cook KF, et al. Development and validation of a daily pain catastrophizing scale. J Pain. 2017;18(9):1139-1149. doi:10.1016/j.jpain.2017.05.003
25. Osman A, Barrios FX, Kopper BA, et al. Factor structure, reliability, and validity of the Pain Catastrophizing Scale. J Behav Med. 1997;20(6):589-605. doi:10.1023/a:1025570508954
26. Sullivan MJL, Bishop S, Pivik J. The Pain Catastrophizing Scale: development and validation. Psychol Assessment. 1995;7(4):524-532. doi:10.1037/1040-3590.7.4.524
27. Walker R, Clark M, Gironda R. Psychometric characteristics of the Pain Treatment Satisfaction Scale. J Pain. 2015;6(3Suppl.):S76.
28. Emerson RW. Bonferroni correction and type I error. J Vis Impair Blind. 2020;114(1):77-78. doi:10.1177/0145482X20901378
29. Cohen J. Statistical power analysis for the behavioral sciences. 2nd ed. Routledge; 1988. doi:10.4324/9780203771587
30. Craner JR, Lake ES, Bancroft KA, George LL. Treatment outcomes and mechanisms for an ACT-based 10-week interdisciplinary chronic pain rehabilitation program. Pain Pract. 2020;20(1):44-54. doi:10.1111/papr.12824
31. Han L, Goulet JL, Skanderson M, et al. Evaluation of complementary and integrative health approaches among US veterans with musculoskeletal pain using propensity score methods. Pain Med. 2019;20(1):90-102. doi:10.1093/pm/pny027
32. Herman PM, Yuan AH, Cefalu MS, et al. The use of complementary and integrative health approaches for chronic musculoskeletal pain in younger US veterans: an economic evaluation. PLoS One. 2019;14(6):e0217831. doi:10.1371/journal.pone.0217831
33. National Academies of Sciences, Engineering, and Medicine; Health and Medicine Division; Board on Global Health; Board on Health Sciences Policy; Global Forum on Innovation in Health Professional Education; Forum on Neuroscience and Nervous System Disorders; Stroud C, Posey Norris SM, Bain L, eds. The Role of Nonpharmacological Approaches to Pain Management: Proceedings of a Workshop. National Academies Press (US); April 12, 2019.
34. Richmond H, Hall AM, Copsey B, et al. The effectiveness of cognitive behavioural treatment for non-specific low back pain: a systematic review and meta-analysis. PLoS One. 2015;10(8):e0134192. doi:10.1371/journal.pone.0134192
35. Kearney DJ, Simpson TL, Malte CA, et al. Mindfulness-based stress reduction in addition to usual care is associated with improvements in pain, fatigue, and cognitive failures among veterans with Gulf War illness. Am J Med. 2016;129(2):204-214. doi:10.1016/j.amjmed.2015.09.015
36. Khoo E, Small R, Cheng W, et al. Comparative evaluation of group-based mindfulness-based stress reduction and cognitive behavioral therapy for the treatment and management of chronic pain: a systematic review and network meta-analysis. Evid Based Ment Health. 2019;22(1):26-35. doi:10.1136/ebmental-2018-300062
37. Khusid MA, Vythilingam M. The emerging role of mindfulness meditation as effective self-management strategy, Part 2: clinical implications for chronic pain, substance misuse, and insomnia. Mil Med. 2016;181(9):969-975. doi:10.7205/MILMED-D-14-00678
38. la Cour P, Petersen M. Effects of mindfulness meditation on chronic pain: A randomized controlled trial. Pain Med. 2015;16(4):641-652. doi:10.1111/pme.12605
39. Zou L, Zhang Y, Yang L, et al. Are mindful exercises safe and beneficial for treating chronic lower back pain? A systematic review and meta-analysis of randomized controlled trials. J Clin Med. 2019;8(5):628. doi:10.3390/jcm8050628
40. Hughes LS, Clark J, Colclough JA, et al. Acceptance and commitment therapy (ACT) for chronic pain: a systematic review and meta-analyses. Clin J Pain. 2017;33(6):552-568. doi:10.1097/AJP.0000000000000425
41. Kemani MK, Olsson GL, Lekander M, et al. Efficacy and cost-effectiveness of acceptance and commitment therapy and applied relaxation for longstanding pain: a randomized controlled trial. Clin J Pain. 2015;31(11):1004-1016. doi:10.1097/AJP.0000000000000203
42. Scott W, Daly A, Yu L, McCracken LM. Treatment of chronic pain for adults 65 and over: analyses of outcomes and changes in psychological flexibility following interdisciplinary acceptance and commitment therapy (ACT). Pain Med. 2017;18(2):252. doi:10.1093/pm/pnw073
43. Veehof MM, Trompetter HR, Bohlmeijer ET, Schreurs KMG. Acceptance- and mindfulness-based interventions for the treatment of chronic pain: a meta-analytic review. Cogn Behav Ther. 2016;45(1):5-31. doi:10.1080/16506073.2015.1098724
44. Matthias MS, McGuire AB, Kukla M, et al. A brief peer support intervention for veterans with chronic musculoskeletal pain: a pilot study of feasibility and effectiveness. Pain Med. 2015;16(1):81-87. doi:10.1111/pme.12571
45. Anamkath NS, Palyo SA, Jacobs SC, et al. An interdisciplinary pain rehabilitation program for veterans with chronic pain: description and initial evaluation of outcomes. Pain Res Manag. 2018;2018(3941682):1-9. doi:10.1155/2018/3941682
46. Kamper SJ, Apeldoorn AT, Chiarotto A, et al. Multidisciplinary biopsychosocial rehabilitation for chronic low back pain. Cochrane Database Syst Rev. 2014;9: CD000963. doi:10.1002/14651858.CD000963.pub3
47. Penney LS, Haro E. Qualitative evaluation of an interdisciplinary chronic pain intervention: Outcomes and barriers and facilitators to ongoing pain management. J Pain Res. 2019;12:865-878. doi:10.2147/JPR.S185652
48. Murphy JL, Cordova MJ, Dedert EA. Cognitive behavioral therapy for chronic pain in veterans; Evidence for clinical effectiveness in a model program. Psychol Serv. 2022;19(1):95-102. doi:10.1037/ser0000506
49. Katz L, Patterson L, Zacharias R. Evaluation of an interdisciplinary chronic pain program and predictors of readiness for change. Can J Pain. 2019;3(1):70-78. doi:10.1080/24740527.2019.1582296
50. Majumder SMM, Ahmed S, Shazzad N, et al. Translation, cross-cultural adaptation and validation of the Pain Catastrophizing Scale (PCS) into Bengali I patients with chronic non-malignant musculoskeletal pain. Int J Rheum Dis. 2020;23:1481-1487. doi:10.1111/1756-185X.13954
51. Margiotta F, Hannigan A, Imran A, et al. Pain, perceived injustice, and pain catastrophizing in chronic pain patients in Ireland. Pain Pract. 2016;17(5):663-668. doi:10.1111/papr.12
52. Bras M, Milunovic V, Boban M, et al. Quality of live in Croatian Homeland war (1991-1995) veterans who suffer from post-traumatic stress disorder and chronic pain. Health Qual Life Out. 2011;9:56. doi:10.1186/1477-7525-9-56
53. Liu C-H, Kung Y-Y, Lin C-L, et al. Therapeutic efficacy and the impact of the “dose” effect of acupuncture to treat sciatica: A randomized controlled pilot study. J Pain Res. 2019;12:3511-3520. doi:10.2147/JPR.S210672
Meta-analysis underscores the need for improved HCC surveillance in NAFLD without cirrhosis
Key clinical point: Compared with patients with hepatocellular carcinoma (HCC) due to other causes, a higher proportion of those with nonalcoholic fatty liver disease (NAFLD)-related HCC do not have cirrhosis and lack an indication for HCC surveillance, thus calling for surveillance strategies for patients with NAFLD without cirrhosis but at high risk for HCC.
Major finding: The proportion of patients without cirrhosis was higher among those with NAFLD-related HCC vs. HCC due to other causes (38.5% vs. 14.6%; P < .0001). Before cancer diagnosis, only 32.8% of patients with NAFLD-related HCC underwent HCC surveillance relative to 55.7% of those with HCC due to other causes (odds ratio 0.36; P < .0001).
Study details: This was a meta-analysis of 61 studies including 94,636 patients with HCC related to either NAFLD (n = 15,377) or other causes (n = 79,259).
Disclosures: No funding was received for the study. Some authors declared having stock options from, serving as paid/unpaid consultants or advisory board members for, and receiving royalties or research grants from various organizations.
Source: Tan DJH et al. Clinical characteristics, surveillance, treatment allocation, and outcomes of non-alcoholic fatty liver disease-related hepatocellular carcinoma: a systematic review and meta-analysis. Lancet Oncol. 2022 (Mar 4). Doi: 10.1016/S1470-2045(22)00078-X
LEN-TACE sequential therapy tops LEN monotherapy in unresectable HCC responsive to initial LEN treatment
Key clinical point: Lenvatinib (LEN)-transcatheter arterial chemoembolization (LEN-TACE) sequential therapy may be more clinically beneficial than LEN monotherapy in patients with unresectable hepatocellular carcinoma (HCC) responsive to initial LEN treatment without exerting any additional adverse effects.
Major finding: The LEN-TACE vs. LEN monotherapy group showed a significantly higher median overall survival (31.2 months vs. 13.9 months; P = .002) and progression-free survival (12.2 months vs. 7.1 months; P = .037). The LEN-TACE group had an acceptable safety profile, with only liver dysfunction being significantly higher (P = .04).
Study details: Findings are from a retrospective, multicenter cohort study on patients with intermediate- or advanced-stage unresectable HCC who responded to initial LEN treatment. Among these, 63 patients receiving LEN-TACE sequential therapy were propensity-score matched to those receiving LEN monotherapy.
Disclosures: The authors declared no source of funding or conflict of interests.
Source: Kuroda H et al. Objective response by mRECIST to initial lenvatinib therapy is an independent factor contributing to deep response in hepatocellular carcinoma treated with lenvatinib-transcatheter arterial chemoembolization sequential therapy. Liver Cancer. 2022 (Feb 15). Doi: 10.1159/000522424
Improving Hospital Metrics Through the Implementation of a Comorbidity Capture Tool and Other Quality Initiatives
From the University of Miami Miller School of Medicine (Drs. Sosa, Ferreira, Gershengorn, Soto, Parekh, and Suarez), and the Quality Department of the University of Miami Hospital and Clinics (Estin Kelly, Ameena Shrestha, Julianne Burgos, and Sandeep Devabhaktuni), Miami, FL.
Abstract
Background: Case mix index (CMI) and expected mortality are determined based on comorbidities. Improving documentation and coding can impact performance indicators. During and prior to 2018, our patient acuity was under-represented, with low expected mortality and CMI. Those metrics motivated our quality team to develop the quality initiatives reported here.
Objectives: We sought to assess the impact of quality initiatives on number of comorbidities, diagnoses, CMI, and expected mortality at the University of Miami Health System.
Design: We conducted an observational study of a series of quality initiatives: (1) education of clinical documentation specialists (CDS) to capture comorbidities (10/2019); (2) facilitating the process for physician query response (2/2020); (3) implementation of computer logic to capture electrolyte disturbances and renal dysfunction (8/2020); (4) development of a tool to capture Elixhauser comorbidities (11/2020); and (5) provider education and electronic health record reviews by the quality team.
Setting and participants: All admissions during 2019 and 2020 at University of Miami Health System. The health system includes 2 academic inpatient facilities, a 560-bed tertiary hospital, and a 40-bed cancer facility. Our hospital is 1 of the 11 PPS-Exempt Cancer Hospitals and is the South Florida’s only NCI-Designated Cancer Center.
Conclusion:
Keywords: PS/QI, coding, case mix index, comorbidities, mortality.
Adoption of comprehensive electronic health record (EHR) systems by US hospitals, defined as an EHR capable of meeting all core meaningful-use metrics including evaluation and tracking of quality metrics, has been steadily increasing.3,4 Many institutions have looked to EHR system transitions as an inflection point to expand clinical documentation improvement (CDI) efforts. Over the past several years, our institution, an academic medical center, has endeavored to fully transition to a comprehensive EHR system (Epic from Epic Systems Corporation). Part of the purpose of this transition was to help study and improve outcomes, reduce readmissions, improve quality of care, and meet performance indicators.
Prior to 2019, our hospital’s patient acuity was low, with a CMI consistently below 2, ranging from 1.81 to 1.99, and an expected mortality consistently below 1.9%, ranging from 1.65% to 1.85%. Our concern that these values underestimated the real severity of illness of our patient population prompted the development of a quality improvement plan. In this report, we describe the processes we undertook to improve documentation and coding of comorbid illness, and report on the impact of these initiatives on performance indicators. We hypothesized that our initiatives would have a significant impact on our ability to capture patient complexity, and thus impact our CMI and expected mortality.
Methods
In the fall of 2019, we embarked on a multifaceted quality improvement project aimed at improving comorbidity capture for patients hospitalized at our institution. The health system includes 2 academic inpatient facilities, a 560-bed tertiary hospital and a 40-bed cancer facility. Since September 2017, we have used Epic as our EHR. In August 2019, we started working with Vizient Clinical Data Base5 to allow benchmarking with peer institutions. We assessed the impact of this initiative with a pre/post study design.
Quality Initiatives
This quality improvement project consisted of a series of 5 targeted interventions coupled with continuous monitoring and education.
1. Comorbidity coding. In October 2019, we met with the clinical documentation specialists (CDS) and the coding team to educate them on the value of coding all comorbidities that have an impact on
2. Physician query. In October 2019, we modified the process for physician query response, allowing physicians to answer queries in the EHR through a reply tool incorporated into the query and accept answers in the body of the Epic message as an active part of the EHR.
3. EHR logic. In August 2020, we developed an EHR smart logic to automatically capture fluid and electrolyte disturbances and renal dysfunction, based on the most recent laboratory values. The logic automatically populated potentially appropriate diagnoses in the assessment and plan of provider notes, which require provider acknowledgment and which providers are able to modify
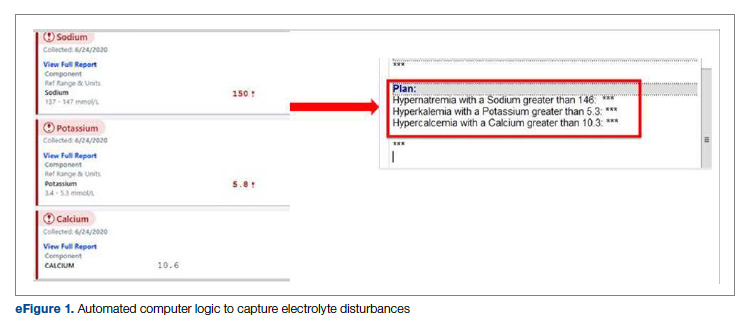
4. Comorbidity capture tool. In November 2020, we developed a standardized tool to allow providers to easily capture Elixhauser comorbidities (eFigure 2). The Elixhauser index is a method for measuring comorbidities based on International Classification of Diseases, Ninth Revision, Clinical Modification and International Classification of Disease, Tenth Revision diagnosis codes found in administrative data1-6 and is used by US News & World Report and Vizient to assess comorbidity burden. Our tool automatically captures diagnoses recorded in previous documentation and allows providers to easily provide the management plan for each; this information is automatically pulled into the provider note.
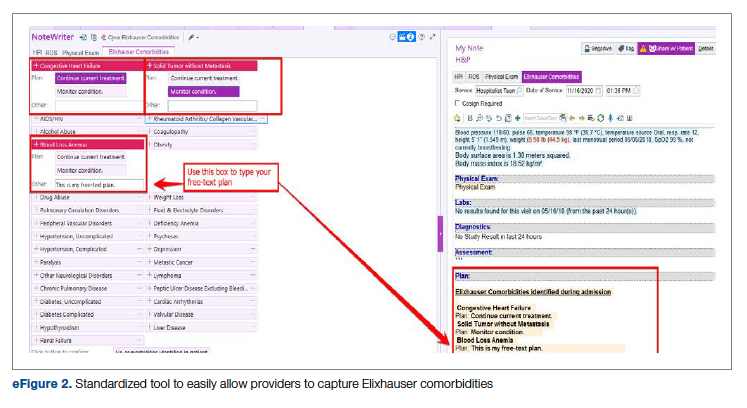
The development of this tool used an existing functionality within the Epic EHR called SmartForms, SmartData Elements, and SmartLinks. The only cost of tool development was the time invested—124 hours inclusive of 4 hours of staff education. Specifically, a panel of experts (including physicians of different specialties, an analyst, and representatives from the quality office) met weekly for 30 minutes per week over 5 weeks to agree on specific clinical criteria and guide the EHR build analyst. Individual panel members confirmed and validated design requirements (in 15 hours over 5 weeks). Our senior clinical analyst II dedicated 80 hours to actual build time, 15 hours to design time, and 25 hours to tailor the function to our institution’s workflow. This tool was introduced in November 2020; completion was optional at the time of hospital admission but mandatory at discharge to ensure compliance.
5. Quality team
Assessment of Quality Initiatives’ Impact
Data on the number of comorbidities and performance indicators were obtained retrospectively. The data included all hospital admissions from 2019 and 2020 divided into 2 periods: pre-intervention from January 1, 2019 through September 30, 2019, and intervention from October 1, 2019 through December 31, 2020. The primary outcome of this observational study was the rate of comorbidity capture during the intervention period. Comorbidity capture was assessed using the Vizient Clinical Data Base (CDB) health care performance tool.5 Vizient CDB uses the Agency for Healthcare Research and Quality Elixhauser index, which includes 29 of the initial 31 comorbidities described by Elixhauser,6 as it combines hypertension with and without complications into one. We secondarily aimed to examine the impact of the quality improvement initiatives on several institutional-level performance indicators, including total number of diagnoses, comorbidities or complications (CC), major comorbidities or complications (MCC), CMI, and expected mortality.
Case mix index is the average Medicare Severity-DRG (MS-DRG) weighted across all hospital discharges (appropriate to their discharge date). The expected mortality represents the average expected number of deaths based on diagnosed conditions, age, and gender within the same time frame, and it is based on coded diagnosis; we obtained the mortality index by dividing the observed mortality by the expected mortality. The Vizient CDB Mortality Risk Adjustment Model was used to assign an expected mortality (0%-100%) to each case based on factors such as demographics, admission type, diagnoses, and procedures.
Standard statistics were used to measure the outcomes. We used Excel to compare pre-intervention and intervention period characteristics and outcomes, using t-testing for continuous variables and Chi-square testing for categorial outcomes. P values <0.05 were considered statistically significant.
The study was reviewed by the institutional review board (IRB) of our institution (IRB ID: 20210070). The IRB determined that the proposed activity was not research involving human subjects, as defined by the Department of Health and Human Services and US Food and Drug Administration regulations, and that IRB review and approval by the organization were not required.
Results
The health system had a total of 33 066 admissions during the study period—13 689 pre-intervention (January 1, 2019 through September 30, 2019) and 19,377 during the intervention period (October 1, 2019 to December 31, 2020). Demographics were similar among the pre-intervention and intervention periods: mean age was 60 years and 61 years, 52% and 51% of patients were male, 72% and 71% were White, and 20% and 19% were Black, respectively (Table 1).
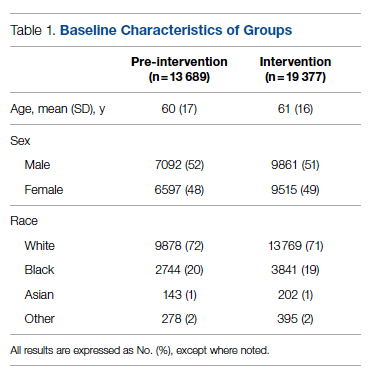
The multifaceted intervention resulted in a significant improvement in the primary outcome: mean comorbidity capture increased from 2.5 (SD, 1.7) before the intervention to 3.1 (SD, 2.0) during the intervention (P < .00001). Secondary outcomes also improved. The mean number of secondary diagnoses for admissions increased from 11.3 (SD, 7.3) prior to the intervention to 18.5 (SD, 10.4) (P < .00001) during the intervention period. The mean CMI increased from 2.1 (SD, 1.9) to 2.4 (SD, 2.2) post intervention (P < .00001), an increase during the intervention period of 14%. The expected mortality increased from 1.8% (SD, 6.1%) to 3.1% (SD, 9.2%) after the intervention (P < .00001) (Table 2).
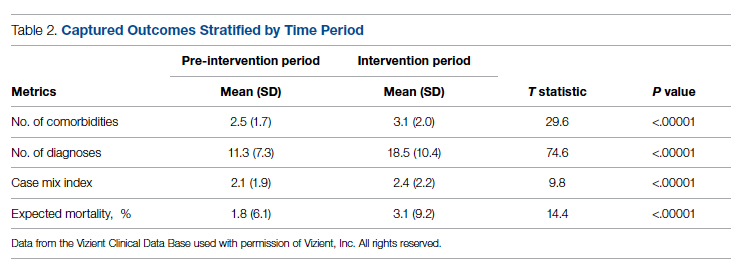
There was an overall observed improvement in percentage of discharges with documented CC and MCC for both surgical and medical specialties. Both CC and MCC increased for surgical specialties, from 54.4% to 68.5%, and for medical specialties, from 68.9% to 76.4%. (Figure 1). The diagnoses that were captured more consistently included deficiency anemia, obesity, diabetes with complications, fluid and electrolyte disorders and renal failure, hypertension, weight loss, depression, and hypothyroidism (Figure 2).
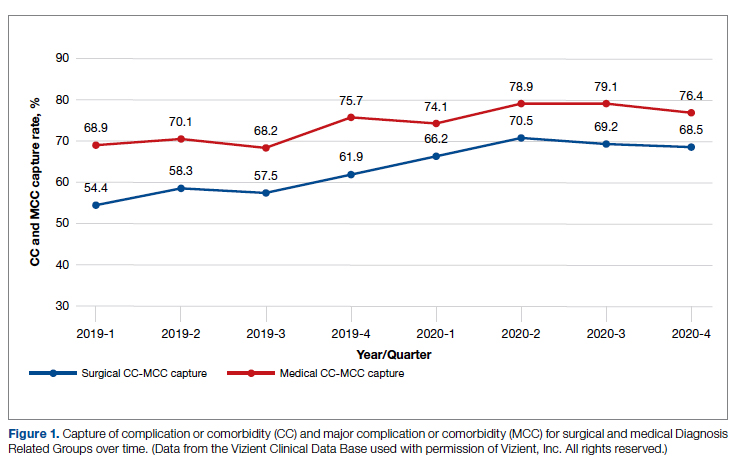
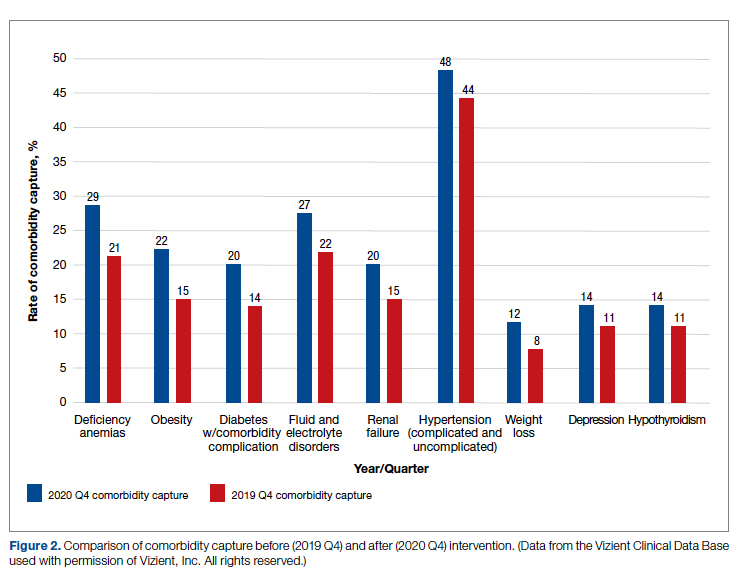
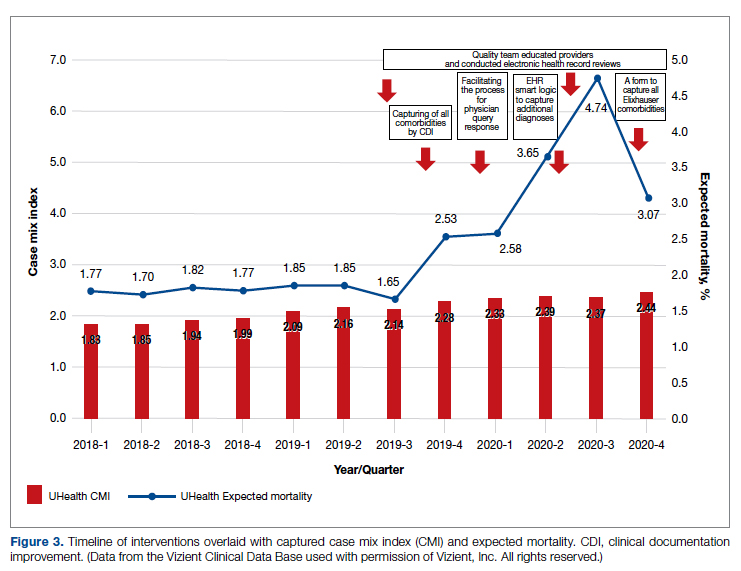
During the 9-month pre-intervention period (January 1 through September 30, 2019), there were 2795 queries, with an agreed volume of 1823; the agreement rate was 65% and the average provider turnaround time was 12.53 days. In the 15-month postintervention period, there were 10 216 queries, with an agreed volume of 6802 at 66%. We created a policy to encourage responses no later than 10 days after the query, and our average turnaround time decreased by more than 50% to 5.86 days. The average number of monthly queries increased by 55%, from an average of 311 monthly queries in the pre-intervention period to an average of 681 per month in the postintervention period. The more common queries that had an impact on CMI included sepsis, antineoplastic chemotherapy–induced pancytopenia, acute posthemorrhagic anemia, malnutrition, hyponatremia, and metabolic encephalopathy.
Discussion
The need for accurate documentation by physicians has been recognized for many years.7
With the growing complexity of the documentation and coding process, it is difficult for clinicians to keep up with the terminology required by the Centers for Medicare and Medicaid Services (CMS). Several different methods to improve documentation have been proposed. Prior interventions to standardize documentation templates in the trauma service have shown improvement in CMI.8 An educational program on coding for internal medicine that included a lecture series and creation of a laminated pocket card listing common CMS diagnoses, CC, and MCC has been implemented, with an improvement in the capture rate of CC and MCC from 42% to 48% and an impact on expected mortality.9 This program resulted in a 30% decrease in the median quarterly mortality index and an increase in CMI from 1.27 to 1.36.
Our results show that there was an increase in comorbidities documentation of admitted patients after all interventions were implemented, more accurately reflecting the complexity of our patient population in a tertiary care academic medical center. Our CMI increased by 14% during the intervention period. The estimated CMI dollar impact increased by 75% from the pre-intervention period (adjusted for PPS-exempt hospital). The hospital-expected mortality increased from 1.77 to 3.07 (peak at 4.74 during third quarter of 2020) during the implementation period, which is a key driver of quality rankings for national outcomes reporting services such as US News & World Report.
There was increased physician satisfaction as a result of the change of functionality of the query response system, and no additional monetary provider incentive for complete documentation was allocated, apart from education and 1:1 support that improved physician engagement. Our next steps include the implementation of an advanced program to concurrently and automatically capture and nudge providers to respond and complete their documentation in real time.
Limitations
The limitations of our study include those inherent to a retrospective review and are associative and observational in nature. Although we used expected mortality and CMI as a surrogate for patient acuity for comparison, there was no way to control for actual changes in patient acuity that contributed to the increase in CMI, although we believe that the population we served and the services provided and their structure did not change significantly during the intervention period. Additionally, the observed increase in CMI during the implementation period may be a result of described variabilities in CMI and would be better studied over a longer period. Also, during the year of our interventions, 2020, we were affected by the COVID-19 pandemic. Patients with COVID-19 are known to carry a lower-than-expected mortality, and that could have had a negative impact on our results. In fact, we did observe a decrease in our expected mortality during the last quarter of 2020, which correlated with one of our regional peaks for COVID-19, and that could be a confounding factor. While the described intervention process is potentially applicable to multiple EHR systems, the exact form to capture the Elixhauser comorbidities was built into the Epic EHR, limiting external applicability of this tool to other EHR software.
Conclusion
A continuous comprehensive series of interventions substantially increased our patient acuity scores. The increased scores have implications for reimbursement and quality comparisons for hospitals and physicians. Our institution can now be stratified more accurately with our peers and other hospitals. Accurate medical record documentation has become increasingly important, but also increasingly complex. Leveraging the EHR through quality initiatives that facilitate the workflow for providers can have an impact on documentation, coding, and ultimately risk-adjusted outcomes data that influence institutional reputation.
Corresponding author: Marie Anne Sosa, MD; 1120 NW 14th St., Suite 809, Miami, FL, 33134; [email protected]
Disclosures: None reported.
doi:10.12788/jcom.0088
1. Elixhauser A, Steiner C, Harris DR, Coffey RM. Comorbidity measures for use with administrative data. Med Care. 1998;36(1):8-27. doi:10.1097/00005650-199801000-00004.
2. Sehgal AR. The role of reputation in U.S. News & World Report’s rankings of the top 50 American hospitals. Ann Intern Med. 2010;152(8):521-525. doi:10.7326/0003-4819-152-8-201004200-00009
3. Jha AK, DesRoches CM, Campbell EG, et al. Use of electronic health records in U.S. hospitals. N Engl J Med. 2009;360(16):1628-1638. doi:10.1056/NEJMsa0900592.
4. Adler-Milstein J, DesRoches CM, Kralovec, et al. Electronic health record adoption in US hospitals: progress continues, but challenges persist. Health Aff (Millwood). 2015;34(12):2174-2180. doi:10.1377/hlthaff.2015.0992
5. Vizient Clinical Data Base/Resource ManagerTM. Irving, TX: Vizient, Inc.; 2019. Accessed March 10, 2022. https://www.vizientinc.com
6. Moore BJ, White S, Washington R, Coenen N, Elixhauser A. Identifying increased risk of readmission and in-hospital mortality using hospital administrative data: the AHRQ Elixhauser Comorbidity Index. Med Care. 2017;55(7):698-705. doi:10.1097/MLR.0000000000000735
7. Payne T. Improving clinical documentation in an EMR world. Healthc Financ Manage. 2010;64(2):70-74.
8. Barnes SL, Waterman M, Macintyre D, Coughenour J, Kessel J. Impact of standardized trauma documentation to the hospital’s bottom line. Surgery. 2010;148(4):793-797. doi:10.1016/j.surg.2010.07.040
9. Spellberg B, Harrington D, Black S, Sue D, Stringer W, Witt M. Capturing the diagnosis: an internal medicine education program to improve documentation. Am J Med. 2013;126(8):739-743.e1. doi:10.1016/j.amjmed.2012.11.035
From the University of Miami Miller School of Medicine (Drs. Sosa, Ferreira, Gershengorn, Soto, Parekh, and Suarez), and the Quality Department of the University of Miami Hospital and Clinics (Estin Kelly, Ameena Shrestha, Julianne Burgos, and Sandeep Devabhaktuni), Miami, FL.
Abstract
Background: Case mix index (CMI) and expected mortality are determined based on comorbidities. Improving documentation and coding can impact performance indicators. During and prior to 2018, our patient acuity was under-represented, with low expected mortality and CMI. Those metrics motivated our quality team to develop the quality initiatives reported here.
Objectives: We sought to assess the impact of quality initiatives on number of comorbidities, diagnoses, CMI, and expected mortality at the University of Miami Health System.
Design: We conducted an observational study of a series of quality initiatives: (1) education of clinical documentation specialists (CDS) to capture comorbidities (10/2019); (2) facilitating the process for physician query response (2/2020); (3) implementation of computer logic to capture electrolyte disturbances and renal dysfunction (8/2020); (4) development of a tool to capture Elixhauser comorbidities (11/2020); and (5) provider education and electronic health record reviews by the quality team.
Setting and participants: All admissions during 2019 and 2020 at University of Miami Health System. The health system includes 2 academic inpatient facilities, a 560-bed tertiary hospital, and a 40-bed cancer facility. Our hospital is 1 of the 11 PPS-Exempt Cancer Hospitals and is the South Florida’s only NCI-Designated Cancer Center.
Conclusion:
Keywords: PS/QI, coding, case mix index, comorbidities, mortality.
Adoption of comprehensive electronic health record (EHR) systems by US hospitals, defined as an EHR capable of meeting all core meaningful-use metrics including evaluation and tracking of quality metrics, has been steadily increasing.3,4 Many institutions have looked to EHR system transitions as an inflection point to expand clinical documentation improvement (CDI) efforts. Over the past several years, our institution, an academic medical center, has endeavored to fully transition to a comprehensive EHR system (Epic from Epic Systems Corporation). Part of the purpose of this transition was to help study and improve outcomes, reduce readmissions, improve quality of care, and meet performance indicators.
Prior to 2019, our hospital’s patient acuity was low, with a CMI consistently below 2, ranging from 1.81 to 1.99, and an expected mortality consistently below 1.9%, ranging from 1.65% to 1.85%. Our concern that these values underestimated the real severity of illness of our patient population prompted the development of a quality improvement plan. In this report, we describe the processes we undertook to improve documentation and coding of comorbid illness, and report on the impact of these initiatives on performance indicators. We hypothesized that our initiatives would have a significant impact on our ability to capture patient complexity, and thus impact our CMI and expected mortality.
Methods
In the fall of 2019, we embarked on a multifaceted quality improvement project aimed at improving comorbidity capture for patients hospitalized at our institution. The health system includes 2 academic inpatient facilities, a 560-bed tertiary hospital and a 40-bed cancer facility. Since September 2017, we have used Epic as our EHR. In August 2019, we started working with Vizient Clinical Data Base5 to allow benchmarking with peer institutions. We assessed the impact of this initiative with a pre/post study design.
Quality Initiatives
This quality improvement project consisted of a series of 5 targeted interventions coupled with continuous monitoring and education.
1. Comorbidity coding. In October 2019, we met with the clinical documentation specialists (CDS) and the coding team to educate them on the value of coding all comorbidities that have an impact on
2. Physician query. In October 2019, we modified the process for physician query response, allowing physicians to answer queries in the EHR through a reply tool incorporated into the query and accept answers in the body of the Epic message as an active part of the EHR.
3. EHR logic. In August 2020, we developed an EHR smart logic to automatically capture fluid and electrolyte disturbances and renal dysfunction, based on the most recent laboratory values. The logic automatically populated potentially appropriate diagnoses in the assessment and plan of provider notes, which require provider acknowledgment and which providers are able to modify
4. Comorbidity capture tool. In November 2020, we developed a standardized tool to allow providers to easily capture Elixhauser comorbidities (eFigure 2). The Elixhauser index is a method for measuring comorbidities based on International Classification of Diseases, Ninth Revision, Clinical Modification and International Classification of Disease, Tenth Revision diagnosis codes found in administrative data1-6 and is used by US News & World Report and Vizient to assess comorbidity burden. Our tool automatically captures diagnoses recorded in previous documentation and allows providers to easily provide the management plan for each; this information is automatically pulled into the provider note.
The development of this tool used an existing functionality within the Epic EHR called SmartForms, SmartData Elements, and SmartLinks. The only cost of tool development was the time invested—124 hours inclusive of 4 hours of staff education. Specifically, a panel of experts (including physicians of different specialties, an analyst, and representatives from the quality office) met weekly for 30 minutes per week over 5 weeks to agree on specific clinical criteria and guide the EHR build analyst. Individual panel members confirmed and validated design requirements (in 15 hours over 5 weeks). Our senior clinical analyst II dedicated 80 hours to actual build time, 15 hours to design time, and 25 hours to tailor the function to our institution’s workflow. This tool was introduced in November 2020; completion was optional at the time of hospital admission but mandatory at discharge to ensure compliance.
5. Quality team
Assessment of Quality Initiatives’ Impact
Data on the number of comorbidities and performance indicators were obtained retrospectively. The data included all hospital admissions from 2019 and 2020 divided into 2 periods: pre-intervention from January 1, 2019 through September 30, 2019, and intervention from October 1, 2019 through December 31, 2020. The primary outcome of this observational study was the rate of comorbidity capture during the intervention period. Comorbidity capture was assessed using the Vizient Clinical Data Base (CDB) health care performance tool.5 Vizient CDB uses the Agency for Healthcare Research and Quality Elixhauser index, which includes 29 of the initial 31 comorbidities described by Elixhauser,6 as it combines hypertension with and without complications into one. We secondarily aimed to examine the impact of the quality improvement initiatives on several institutional-level performance indicators, including total number of diagnoses, comorbidities or complications (CC), major comorbidities or complications (MCC), CMI, and expected mortality.
Case mix index is the average Medicare Severity-DRG (MS-DRG) weighted across all hospital discharges (appropriate to their discharge date). The expected mortality represents the average expected number of deaths based on diagnosed conditions, age, and gender within the same time frame, and it is based on coded diagnosis; we obtained the mortality index by dividing the observed mortality by the expected mortality. The Vizient CDB Mortality Risk Adjustment Model was used to assign an expected mortality (0%-100%) to each case based on factors such as demographics, admission type, diagnoses, and procedures.
Standard statistics were used to measure the outcomes. We used Excel to compare pre-intervention and intervention period characteristics and outcomes, using t-testing for continuous variables and Chi-square testing for categorial outcomes. P values <0.05 were considered statistically significant.
The study was reviewed by the institutional review board (IRB) of our institution (IRB ID: 20210070). The IRB determined that the proposed activity was not research involving human subjects, as defined by the Department of Health and Human Services and US Food and Drug Administration regulations, and that IRB review and approval by the organization were not required.
Results
The health system had a total of 33 066 admissions during the study period—13 689 pre-intervention (January 1, 2019 through September 30, 2019) and 19,377 during the intervention period (October 1, 2019 to December 31, 2020). Demographics were similar among the pre-intervention and intervention periods: mean age was 60 years and 61 years, 52% and 51% of patients were male, 72% and 71% were White, and 20% and 19% were Black, respectively (Table 1).
The multifaceted intervention resulted in a significant improvement in the primary outcome: mean comorbidity capture increased from 2.5 (SD, 1.7) before the intervention to 3.1 (SD, 2.0) during the intervention (P < .00001). Secondary outcomes also improved. The mean number of secondary diagnoses for admissions increased from 11.3 (SD, 7.3) prior to the intervention to 18.5 (SD, 10.4) (P < .00001) during the intervention period. The mean CMI increased from 2.1 (SD, 1.9) to 2.4 (SD, 2.2) post intervention (P < .00001), an increase during the intervention period of 14%. The expected mortality increased from 1.8% (SD, 6.1%) to 3.1% (SD, 9.2%) after the intervention (P < .00001) (Table 2).
There was an overall observed improvement in percentage of discharges with documented CC and MCC for both surgical and medical specialties. Both CC and MCC increased for surgical specialties, from 54.4% to 68.5%, and for medical specialties, from 68.9% to 76.4%. (Figure 1). The diagnoses that were captured more consistently included deficiency anemia, obesity, diabetes with complications, fluid and electrolyte disorders and renal failure, hypertension, weight loss, depression, and hypothyroidism (Figure 2).
During the 9-month pre-intervention period (January 1 through September 30, 2019), there were 2795 queries, with an agreed volume of 1823; the agreement rate was 65% and the average provider turnaround time was 12.53 days. In the 15-month postintervention period, there were 10 216 queries, with an agreed volume of 6802 at 66%. We created a policy to encourage responses no later than 10 days after the query, and our average turnaround time decreased by more than 50% to 5.86 days. The average number of monthly queries increased by 55%, from an average of 311 monthly queries in the pre-intervention period to an average of 681 per month in the postintervention period. The more common queries that had an impact on CMI included sepsis, antineoplastic chemotherapy–induced pancytopenia, acute posthemorrhagic anemia, malnutrition, hyponatremia, and metabolic encephalopathy.
Discussion
The need for accurate documentation by physicians has been recognized for many years.7
With the growing complexity of the documentation and coding process, it is difficult for clinicians to keep up with the terminology required by the Centers for Medicare and Medicaid Services (CMS). Several different methods to improve documentation have been proposed. Prior interventions to standardize documentation templates in the trauma service have shown improvement in CMI.8 An educational program on coding for internal medicine that included a lecture series and creation of a laminated pocket card listing common CMS diagnoses, CC, and MCC has been implemented, with an improvement in the capture rate of CC and MCC from 42% to 48% and an impact on expected mortality.9 This program resulted in a 30% decrease in the median quarterly mortality index and an increase in CMI from 1.27 to 1.36.
Our results show that there was an increase in comorbidities documentation of admitted patients after all interventions were implemented, more accurately reflecting the complexity of our patient population in a tertiary care academic medical center. Our CMI increased by 14% during the intervention period. The estimated CMI dollar impact increased by 75% from the pre-intervention period (adjusted for PPS-exempt hospital). The hospital-expected mortality increased from 1.77 to 3.07 (peak at 4.74 during third quarter of 2020) during the implementation period, which is a key driver of quality rankings for national outcomes reporting services such as US News & World Report.
There was increased physician satisfaction as a result of the change of functionality of the query response system, and no additional monetary provider incentive for complete documentation was allocated, apart from education and 1:1 support that improved physician engagement. Our next steps include the implementation of an advanced program to concurrently and automatically capture and nudge providers to respond and complete their documentation in real time.
Limitations
The limitations of our study include those inherent to a retrospective review and are associative and observational in nature. Although we used expected mortality and CMI as a surrogate for patient acuity for comparison, there was no way to control for actual changes in patient acuity that contributed to the increase in CMI, although we believe that the population we served and the services provided and their structure did not change significantly during the intervention period. Additionally, the observed increase in CMI during the implementation period may be a result of described variabilities in CMI and would be better studied over a longer period. Also, during the year of our interventions, 2020, we were affected by the COVID-19 pandemic. Patients with COVID-19 are known to carry a lower-than-expected mortality, and that could have had a negative impact on our results. In fact, we did observe a decrease in our expected mortality during the last quarter of 2020, which correlated with one of our regional peaks for COVID-19, and that could be a confounding factor. While the described intervention process is potentially applicable to multiple EHR systems, the exact form to capture the Elixhauser comorbidities was built into the Epic EHR, limiting external applicability of this tool to other EHR software.
Conclusion
A continuous comprehensive series of interventions substantially increased our patient acuity scores. The increased scores have implications for reimbursement and quality comparisons for hospitals and physicians. Our institution can now be stratified more accurately with our peers and other hospitals. Accurate medical record documentation has become increasingly important, but also increasingly complex. Leveraging the EHR through quality initiatives that facilitate the workflow for providers can have an impact on documentation, coding, and ultimately risk-adjusted outcomes data that influence institutional reputation.
Corresponding author: Marie Anne Sosa, MD; 1120 NW 14th St., Suite 809, Miami, FL, 33134; [email protected]
Disclosures: None reported.
doi:10.12788/jcom.0088
1. Elixhauser A, Steiner C, Harris DR, Coffey RM. Comorbidity measures for use with administrative data. Med Care. 1998;36(1):8-27. doi:10.1097/00005650-199801000-00004.
2. Sehgal AR. The role of reputation in U.S. News & World Report’s rankings of the top 50 American hospitals. Ann Intern Med. 2010;152(8):521-525. doi:10.7326/0003-4819-152-8-201004200-00009
3. Jha AK, DesRoches CM, Campbell EG, et al. Use of electronic health records in U.S. hospitals. N Engl J Med. 2009;360(16):1628-1638. doi:10.1056/NEJMsa0900592.
4. Adler-Milstein J, DesRoches CM, Kralovec, et al. Electronic health record adoption in US hospitals: progress continues, but challenges persist. Health Aff (Millwood). 2015;34(12):2174-2180. doi:10.1377/hlthaff.2015.0992
5. Vizient Clinical Data Base/Resource ManagerTM. Irving, TX: Vizient, Inc.; 2019. Accessed March 10, 2022. https://www.vizientinc.com
6. Moore BJ, White S, Washington R, Coenen N, Elixhauser A. Identifying increased risk of readmission and in-hospital mortality using hospital administrative data: the AHRQ Elixhauser Comorbidity Index. Med Care. 2017;55(7):698-705. doi:10.1097/MLR.0000000000000735
7. Payne T. Improving clinical documentation in an EMR world. Healthc Financ Manage. 2010;64(2):70-74.
8. Barnes SL, Waterman M, Macintyre D, Coughenour J, Kessel J. Impact of standardized trauma documentation to the hospital’s bottom line. Surgery. 2010;148(4):793-797. doi:10.1016/j.surg.2010.07.040
9. Spellberg B, Harrington D, Black S, Sue D, Stringer W, Witt M. Capturing the diagnosis: an internal medicine education program to improve documentation. Am J Med. 2013;126(8):739-743.e1. doi:10.1016/j.amjmed.2012.11.035
Final phase 2 results testify to the clinical advantage of TACE plus sorafenib in unresectable HCC
Key clinical point: Although treatment with transarterial chemoembolization (TACE) plus sorafenib does not significantly increase overall survival (OS) in patients with unresectable hepatocellular carcinoma (HCC) relative to TACE alone, it does offer a clinically meaningful OS prolongation.
Major finding: Patients receiving TACE plus sorafenib vs. TACE monotherapy showed a median OS of 36.2 months vs. 30.8 months (hazard ratio 0.861; P = .40). Despite being nonsignificant, the benefit (ΔOS 5.4 months) was clinically meaningful.
Study details: The data represent the final results of the multicenter, prospective phase 2 TACTICS trial including 156 patients aged >20 years with unresectable HCC having a life expectancy of ≥12 weeks who were randomly assigned to TACE plus sorafenib (n = 80) or TACE alone (n = 76).
Disclosures: The study was sponsored by Bayer Yakuhin Ltd., Japan. Some authors reported serving as speakers/advisory consultants for and receiving grants, personal fees, and consulting/advisory fees from various sources including Bayer. M Kudo is the Editor-in-Chief of Liver Cancer, and some others are its editorial board members.
Source: Kudo M et al. Final results of TACTICS: A randomized, prospective trial comparing transarterial chemoembolization plus sorafenib to transarterial chemoembolization alone in patients with unresectable hepatocellular carcinoma. Liver Cancer. 2022 (Feb 10). Doi: 10.1159/000522547
Overall survival after curative resection for HBV-related HCC is better with tenofovir vs. entecavir
Key clinical point: Patients receiving tenofovir disoproxil fumarate (TDF) vs. entecavir (ETV) after curative liver resection for hepatitis B virus (HBV)-related hepatocellular carcinoma (HCC) showed significantly better overall survival and protection of liver function but no significant difference in the cumulative incidences of HCC recurrence.
Major finding: Although patients receiving TDF vs. ETV showed no significant difference in recurrence-free survival after propensity-score matching (hazard ratio [HR] 0.91; P = .45), they had significantly better overall survival (HR 0.37; P = .002) and liver function (P = .001).
Study details: This retrospective, single-center study reviewed data on 1,173 adult patients with HBV-related HCC who had undergone liver resection and were initially treated with either TDF or ETV for chronic HBV infection.
Disclosures: The study was funded by Sun Yat-sen University Cancer Center physician-scientist funding and National Science and Technology Major Project of China. The authors reported having no conflict of interests.
Source: Wang XH et al. Tenofovir vs. entecavir on prognosis of hepatitis B virus-related hepatocellular carcinoma after curative resection. J Gastroenterol. 2022;57:185-198 (Feb 13). Doi: 10.1007/s00535-022-01855-x
A Practical and Cost-Effective Approach to the Diagnosis of Heparin-Induced Thrombocytopenia: A Single-Center Quality Improvement Study
From the Veterans Affairs Ann Arbor Healthcare System Medicine Service (Dr. Cusick), University of Michigan College of Pharmacy, Clinical Pharmacy Service, Michigan Medicine (Dr. Hanigan), Department of Internal Medicine Clinical Experience and Quality, Michigan Medicine (Linda Bashaw), Department of Internal Medicine, University of Michigan Medical School, Ann Arbor, MI (Dr. Heidemann), and the Operational Excellence Department, Sparrow Health System, Lansing, MI (Matthew Johnson).
Abstract
Background: Diagnosis of heparin-induced thrombocytopenia (HIT) requires completion of an enzyme-linked immunosorbent assay (ELISA)–based heparin-platelet factor 4 (PF4) antibody test. If this test is negative, HIT is excluded. If positive, a serotonin-release assay (SRA) test is indicated. The SRA is expensive and sometimes inappropriately ordered despite negative PF4 results, leading to unnecessary treatment with argatroban while awaiting SRA results.
Objectives: The primary objectives of this project were to reduce unnecessary SRA testing and argatroban utilization in patients with suspected HIT.
Methods: The authors implemented an intervention at a tertiary care academic hospital in November 2017 targeting patients hospitalized with suspected HIT. The intervention was controlled at the level of the laboratory and prevented ordering of SRA tests in the absence of a positive PF4 test. The number of SRA tests performed and argatroban bags administered were identified retrospectively via chart review before the intervention (January 2016 to November 2017) and post intervention (December 2017 to March 2020). Associated costs were calculated based on institutional SRA testing cost as well as the average wholesale price of argatroban.
Results: SRA testing decreased from an average of 3.7 SRA results per 1000 admissions before the intervention to an average of 0.6 results per 1000 admissions post intervention. The number of 50-mL argatroban bags used per 1000 admissions decreased from 18.8 prior to the intervention to 14.3 post intervention. Total estimated cost savings per 1000 admissions was $2361.20.
Conclusion: An evidence-based testing strategy for HIT can be effectively implemented at the level of the laboratory. This approach led to reductions in SRA testing and argatroban utilization with resultant cost savings.
Keywords: HIT, argatroban, anticoagulation, serotonin-release assay.
Thrombocytopenia is a common finding in hospitalized patients.1,2 Heparin-induced thrombocytopenia (HIT) is one of the many potential causes of thrombocytopenia in hospitalized patients and occurs when antibodies to the heparin-platelet factor 4 (PF4) complex develop after heparin exposure. This triggers a cascade of events, leading to platelet activation, platelet consumption, and thrombosis. While HIT is relatively rare, occurring in 0.3% to 0.5% of critically ill patients, many patients will be tested to rule out this potentially life-threatening cause of thrombocytopenia.3
The diagnosis of HIT utilizes a combination of both clinical suspicion and laboratory testing.4 The 4T score (Table) was developed to evaluate the clinical probability of HIT and involves assessing the degree and timing of thrombocytopenia, the presence or absence of thrombosis, and other potential causes of the thrombocytopenia.5 The 4T score is designed to be utilized to identify patients who require laboratory testing for HIT; however, it has low inter-rater agreement in patients undergoing evaluation for HIT,6 and, in our experience, completion of this scoring is time-consuming.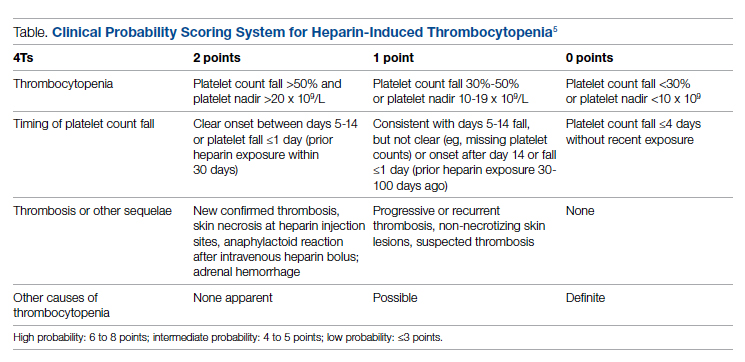
The enzyme-linked immunosorbent assay (ELISA) is a commonly used laboratory test to diagnose HIT that detects antibodies to the heparin-PF4 complex utilizing optical density (OD) units. When using an OD cutoff of 0.400, ELISA PF4 (PF4) tests have a sensitivity of 99.6%, but poor specificity at 69.3%.7 When the PF4 antibody test is positive with an OD ≥0.400, then a functional test is used to determine whether the antibodies detected will activate platelets. The serotonin-release assay (SRA) is a functional test that measures 14C-labeled serotonin release from donor platelets when mixed with patient serum or plasma containing HIT antibodies. In the correct clinical context, a positive ELISA PF4 antibody test along with a positive SRA is diagnostic of HIT.8
The process of diagnosing HIT in a timely and cost-effective manner is dependent on the clinician’s experience in diagnosing HIT as well as access to the laboratory testing necessary to confirm the diagnosis. PF4 antibody tests are time-consuming and not always available daily and/or are not available onsite. The SRA requires access to donor platelets and specialized radioactivity counting equipment, making it available only at particular centers.
The treatment of HIT is more straightforward and involves stopping all heparin products and starting a nonheparin anticoagulant. The direct thrombin inhibitor argatroban is one of the standard nonheparin anticoagulants used in patients with suspected HIT.4 While it is expensive, its short half-life and lack of renal clearance make it ideal for treatment of hospitalized patients with suspected HIT, many of whom need frequent procedures and/or have renal disease.
At our academic tertiary care center, we performed a retrospective analysis that showed inappropriate ordering of diagnostic HIT testing as well as unnecessary use of argatroban even when there was low suspicion for HIT based on laboratory findings. The aim of our project was to reduce unnecessary HIT testing and argatroban utilization without overburdening providers or interfering with established workflows.
Methods
Setting
The University of Michigan (UM) hospital is a 1000-bed tertiary care center in Ann Arbor, Michigan. The UM guidelines reflect evidence-based guidelines for the diagnosis and treatment of HIT.4 In 2016 the UM guidelines for laboratory testing included sending the PF4 antibody test first when there was clinical suspicion of HIT. The SRA was to be sent separately only when the PF4 returned positive (OD ≥ 0.400). Standard guidelines at UM also included switching patients with suspected HIT from heparin to a nonheparin anticoagulant and stopping all heparin products while awaiting the SRA results. The direct thrombin inhibitor argatroban is utilized at UM and monitored with anti-IIa levels. University of Michigan Hospital utilizes the Immucor PF4 IgG ELISA for detecting heparin-associated antibodies.9 In 2016, this PF4 test was performed in the UM onsite laboratory Monday through Friday. At UM the SRA is performed off site, with a turnaround time of 3 to 5 business days.
Baseline Data
We retrospectively reviewed PF4 and SRA testing as well as argatroban usage from December 2016 to May 2017. Despite the institutional guidelines, providers were sending PF4 and SRA simultaneously as soon as HIT was suspected; 62% of PF4 tests were ordered simultaneously with the SRA, but only 8% of these PF4 tests were positive with an OD ≥0.400. Of those patients with negative PF4 testing, argatroban was continued until the SRA returned negative, leading to many days of unnecessary argatroban usage. An informal survey of the anticoagulation pharmacists revealed that many recommended discontinuing argatroban when the PF4 test was negative, but providers routinely did not feel comfortable with this approach. This suggested many providers misunderstood the performance characteristics of the PF4 test.
Intervention
Our team consisted of hematology and internal medicine faculty, pharmacists, coagulation laboratory personnel, and quality improvement specialists. We designed and implemented an intervention in November 2017 focused on controlling the ordering of the SRA test. We chose to focus on this step due to the excellent sensitivity of the PF4 test with a cutoff of OD <0.400 and the significant expense of the SRA test. Under direction of the Coagulation Laboratory Director, a standard operating procedure was developed where the coagulation laboratory personnel did not send out the SRA until a positive PF4 test (OD ≥ 0.400) was reported. If the PF4 was negative, the SRA was canceled and the ordering provider received notification of the cancelled test via the electronic medical record, accompanied by education about HIT testing (Figure 1). In addition, the lab increased the availability of PF4 testing from 5 days to 7 days a week so there were no delays in tests ordered on Fridays or weekends.
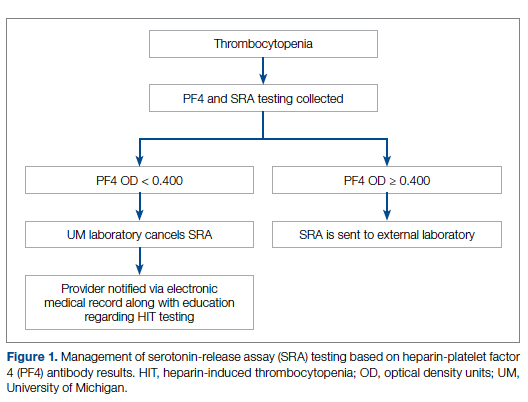
Outcomes
Our primary goals were to decrease both SRA testing and argatroban use. Secondarily, we examined the cost-effectiveness of this intervention. We hypothesized that controlling the SRA testing at the laboratory level would decrease both SRA testing and argatroban use.
Data Collection
Pre- and postintervention data were collected retrospectively. Pre-intervention data were from January 2016 through November 2017, and postintervention data were from December 2017 through March 2020. The number of SRA tests performed were identified retrospectively via review of electronic ordering records. All patients who had a hospital admission after January 1, 2016, were included. These patients were filtered to include only those who had a result for an SRA test. In order to calculate cost-savings, we identified both the number of SRA tests ordered retrospectively as well as patients who had both an SRA resulted and had been administered argatroban. Cost-savings were calculated based on our institutional cost of $357 per SRA test.
At our institution, argatroban is supplied in 50-mL bags; therefore, we utilized the number of bags to identify argatroban usage. Savings were calculated using the average wholesale price (AWP) of $292.50 per 50-mL bag. The amounts billed or collected for the SRA testing or argatroban treatment were not collected. Costs were estimated using only direct costs to the institution. Safety data were not collected. As the intent of our project was a quality improvement activity, this project did not require institutional review board regulation per our institutional guidance.
Results
During the pre-intervention period, the average number of admissions (adults and children) at UM was 5863 per month. Post intervention there was an average of 5842 admissions per month. A total of 1192 PF4 tests were ordered before the intervention and 1148 were ordered post intervention. Prior to the intervention, 481 SRA tests were completed, while post intervention 105 were completed. Serotonin-release testing decreased from an average of 3.7 SRA results per 1000 admissions during the pre-intervention period to an average of 0.6 per 1000 admissions post intervention (Figure 2). Cost-savings were $1045 per 1000 admissions.
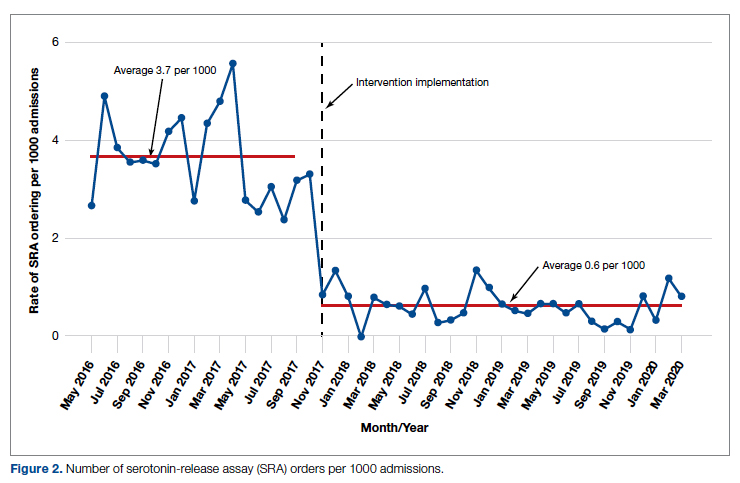
During the pre-intervention period, 2539 bags of argatroban were used, while 2337 bags were used post intervention. The number of 50-mL argatroban bags used per 1000 admissions decreased from 18.8 before the intervention to 14.3 post intervention. Cost-savings were $1316.20 per 1000 admissions. Figure 3 illustrates the monthly argatroban utilization per 1000 admissions during each quarter from January 2016 through March 2020.
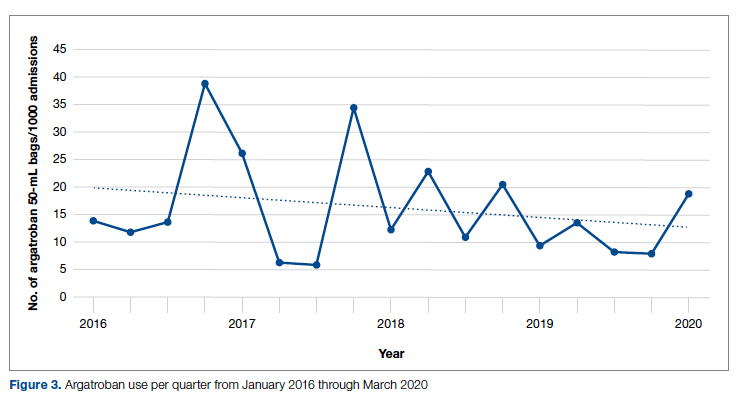
Discussion
We designed and implemented an evidence-based strategy for HIT at our academic institution which led to a decrease in unnecessary SRA testing and argatroban utilization, with associated cost savings. By focusing on a single point of intervention at the laboratory level where SRA tests were held and canceled if the PF4 test was negative, we helped offload the decision-making from the provider while simultaneously providing just-in-time education to the provider. This intervention was designed with input from multiple stakeholders, including physicians, quality improvement specialists, pharmacists, and coagulation laboratory personnel.
Serotonin-release testing dramatically decreased post intervention even though a similar number of PF4 tests were performed before and after the intervention. This suggests that the decrease in SRA testing was a direct consequence of our intervention. Post intervention the number of completed SRA tests was 9% of the number of PF4 tests sent. This is consistent with our baseline pre-intervention data showing that only 8% of all PF4 tests sent were positive.
While the absolute number of argatroban bags utilized did not dramatically decrease after the intervention, the quarterly rate did, particularly after 2018. Given that argatroban data were only drawn from patients with a concurrent SRA test, this decrease is clearly from decreased usage in patients with suspected HIT. We suspect the decrease occurred because argatroban was not being continued while awaiting an SRA test in patients with a negative PF4 test. Decreasing the utilization of argatroban not only saved money but also reduced days of exposure to argatroban. While we do not have data regarding adverse events related to argatroban prior to the intervention, it is logical to conclude that reducing unnecessary exposure to argatroban reduces the risk of adverse events related to bleeding. Future studies would ideally address specific safety outcome metrics such as adverse events, bleeding risk, or missed diagnoses of HIT.
Our institutional guidelines for the diagnosis of HIT are evidence-based and helpful but are rarely followed by busy inpatient providers. Controlling the utilization of the SRA at the laboratory level had several advantages. First, removing SRA decision-making from providers who are not experts in the diagnosis of HIT guaranteed adherence to evidence-based guidelines. Second, pharmacists could safely recommend discontinuing argatroban when the PF4 test was negative as there was no SRA pending. Third, with cancellation at the laboratory level there was no need to further burden providers with yet another alert in the electronic health record. Fourth, just-in-time education was provided to the providers with justification for why the SRA test was canceled. Last, ruling out HIT within 24 hours with the PF4 test alone allowed providers to evaluate patients for other causes of thrombocytopenia much earlier than the 3 to 5 business days before the SRA results returned.
A limitation of this study is that it was conducted at a single center. Our approach is also limited by the lack of universal applicability. At our institution we are fortunate to have PF4 testing available in our coagulation laboratory 7 days a week. In addition, the coagulation laboratory controls sending the SRA to the reference laboratory. The specific intervention of controlling the SRA testing is therefore applicable only to institutions similar to ours; however, the concept of removing control of specialized testing from the provider is not unique. Inpatient thrombophilia testing has been a successful target of this approach.11-13 While electronic alerts and education of individual providers can also be effective initially, the effectiveness of these interventions has been repeatedly shown to wane over time.14-16
Conclusion
At our institution we were able to implement practical, evidence-based testing for HIT by implementing control over SRA testing at the level of the laboratory. This approach led to decreased argatroban utilization and cost savings.
Corresponding author: Alice Cusick, MD; LTC Charles S Kettles VA Medical Center, 2215 Fuller Road, Ann Arbor, MI 48105; [email protected]
Disclosures: None reported.
doi: 10.12788/jcom.0087
1. Fountain E, Arepally GM. Thrombocytopenia in hospitalized non-ICU patients. Blood. 2015;126(23):1060. doi:10.1182/blood.v126.23.1060.1060
2. Hui P, Cook DJ, Lim W, Fraser GA, Arnold DM. The frequency and clinical significance of thrombocytopenia complicating critical illness: a systematic review. Chest. 2011;139(2):271-278. doi:10.1378/chest.10-2243
3. Warkentin TE. Heparin-induced thrombocytopenia. Curr Opin Crit Care. 2015;21(6):576-585. doi:10.1097/MCC.0000000000000259
4. Cuker A, Arepally GM, Chong BH, et al. American Society of Hematology 2018 guidelines for management of venous thromboembolism: heparin-induced thrombocytopenia. Blood Adv. 2018;2(22):3360-3392. doi:10.1182/bloodadvances.2018024489
5. Cuker A, Gimotty PA, Crowther MA, Warkentin TE. Predictive value of the 4Ts scoring system for heparin-induced thrombocytopenia: a systematic review and meta-analysis. Blood. 2012;120(20):4160-4167. doi:10.1182/blood-2012-07-443051
6. Northam KA, Parker WF, Chen S-L, et al. Evaluation of 4Ts score inter-rater agreement in patients undergoing evaluation for heparin-induced thrombocytopenia. Blood Coagul Fibrinolysis. 2021;32(5):328-334. doi:10.1097/MBC.0000000000001042
7. Raschke RA, Curry SC, Warkentin TE, Gerkin RD. Improving clinical interpretation of the anti-platelet factor 4/heparin enzyme-linked immunosorbent assay for the diagnosis of heparin-induced thrombocytopenia through the use of receiver operating characteristic analysis, stratum-specific likelihood ratios, and Bayes theorem. Chest. 2013;144(4):1269-1275. doi:10.1378/chest.12-2712
8. Warkentin TE, Arnold DM, Nazi I, Kelton JG. The platelet serotonin-release assay. Am J Hematol. 2015;90(6):564-572. doi:10.1002/ajh.24006
9. Use IFOR, Contents TOF. LIFECODES ® PF4 IgG assay:1-9.
10. Ancker JS, Edwards A, Nosal S, Hauser D, Mauer E, Kaushal R. Effects of workload, work complexity, and repeated alerts on alert fatigue in a clinical decision support system. BMC Med Inform Decis Mak. 2017;17(1):1-9. doi:10.1186/s12911-017-0430-8
11. O’Connor N, Carter-Johnson R. Effective screening of pathology tests controls costs: thrombophilia testing. J Clin Pathol. 2006;59(5):556. doi:10.1136/jcp.2005.030700
12. Lim MY, Greenberg CS. Inpatient thrombophilia testing: Impact of healthcare system technology and targeted clinician education on changing practice patterns. Vasc Med (United Kingdom). 2018;23(1):78-79. doi:10.1177/1358863X17742509
13. Cox JL, Shunkwiler SM, Koepsell SA. Requirement for a pathologist’s second signature limits inappropriate inpatient thrombophilia testing. Lab Med. 2017;48(4):367-371. doi:10.1093/labmed/lmx040
14. Kwang H, Mou E, Richman I, et al. Thrombophilia testing in the inpatient setting: impact of an educational intervention. BMC Med Inform Decis Mak. 2019;19(1):167. doi:10.1186/s12911-019-0889-6
15. Shah T, Patel-Teague S, Kroupa L, Meyer AND, Singh H. Impact of a national QI programme on reducing electronic health record notifications to clinicians. BMJ Qual Saf. 2019;28(1):10-14. doi:10.1136/bmjqs-2017-007447
16. Singh H, Spitzmueller C, Petersen NJ, Sawhney MK, Sittig DF. Information overload and missed test results in electronic health record-based settings. JAMA Intern Med. 2013;173(8):702-704. doi:10.1001/2013.jamainternmed.61
From the Veterans Affairs Ann Arbor Healthcare System Medicine Service (Dr. Cusick), University of Michigan College of Pharmacy, Clinical Pharmacy Service, Michigan Medicine (Dr. Hanigan), Department of Internal Medicine Clinical Experience and Quality, Michigan Medicine (Linda Bashaw), Department of Internal Medicine, University of Michigan Medical School, Ann Arbor, MI (Dr. Heidemann), and the Operational Excellence Department, Sparrow Health System, Lansing, MI (Matthew Johnson).
Abstract
Background: Diagnosis of heparin-induced thrombocytopenia (HIT) requires completion of an enzyme-linked immunosorbent assay (ELISA)–based heparin-platelet factor 4 (PF4) antibody test. If this test is negative, HIT is excluded. If positive, a serotonin-release assay (SRA) test is indicated. The SRA is expensive and sometimes inappropriately ordered despite negative PF4 results, leading to unnecessary treatment with argatroban while awaiting SRA results.
Objectives: The primary objectives of this project were to reduce unnecessary SRA testing and argatroban utilization in patients with suspected HIT.
Methods: The authors implemented an intervention at a tertiary care academic hospital in November 2017 targeting patients hospitalized with suspected HIT. The intervention was controlled at the level of the laboratory and prevented ordering of SRA tests in the absence of a positive PF4 test. The number of SRA tests performed and argatroban bags administered were identified retrospectively via chart review before the intervention (January 2016 to November 2017) and post intervention (December 2017 to March 2020). Associated costs were calculated based on institutional SRA testing cost as well as the average wholesale price of argatroban.
Results: SRA testing decreased from an average of 3.7 SRA results per 1000 admissions before the intervention to an average of 0.6 results per 1000 admissions post intervention. The number of 50-mL argatroban bags used per 1000 admissions decreased from 18.8 prior to the intervention to 14.3 post intervention. Total estimated cost savings per 1000 admissions was $2361.20.
Conclusion: An evidence-based testing strategy for HIT can be effectively implemented at the level of the laboratory. This approach led to reductions in SRA testing and argatroban utilization with resultant cost savings.
Keywords: HIT, argatroban, anticoagulation, serotonin-release assay.
Thrombocytopenia is a common finding in hospitalized patients.1,2 Heparin-induced thrombocytopenia (HIT) is one of the many potential causes of thrombocytopenia in hospitalized patients and occurs when antibodies to the heparin-platelet factor 4 (PF4) complex develop after heparin exposure. This triggers a cascade of events, leading to platelet activation, platelet consumption, and thrombosis. While HIT is relatively rare, occurring in 0.3% to 0.5% of critically ill patients, many patients will be tested to rule out this potentially life-threatening cause of thrombocytopenia.3
The diagnosis of HIT utilizes a combination of both clinical suspicion and laboratory testing.4 The 4T score (Table) was developed to evaluate the clinical probability of HIT and involves assessing the degree and timing of thrombocytopenia, the presence or absence of thrombosis, and other potential causes of the thrombocytopenia.5 The 4T score is designed to be utilized to identify patients who require laboratory testing for HIT; however, it has low inter-rater agreement in patients undergoing evaluation for HIT,6 and, in our experience, completion of this scoring is time-consuming.
The enzyme-linked immunosorbent assay (ELISA) is a commonly used laboratory test to diagnose HIT that detects antibodies to the heparin-PF4 complex utilizing optical density (OD) units. When using an OD cutoff of 0.400, ELISA PF4 (PF4) tests have a sensitivity of 99.6%, but poor specificity at 69.3%.7 When the PF4 antibody test is positive with an OD ≥0.400, then a functional test is used to determine whether the antibodies detected will activate platelets. The serotonin-release assay (SRA) is a functional test that measures 14C-labeled serotonin release from donor platelets when mixed with patient serum or plasma containing HIT antibodies. In the correct clinical context, a positive ELISA PF4 antibody test along with a positive SRA is diagnostic of HIT.8
The process of diagnosing HIT in a timely and cost-effective manner is dependent on the clinician’s experience in diagnosing HIT as well as access to the laboratory testing necessary to confirm the diagnosis. PF4 antibody tests are time-consuming and not always available daily and/or are not available onsite. The SRA requires access to donor platelets and specialized radioactivity counting equipment, making it available only at particular centers.
The treatment of HIT is more straightforward and involves stopping all heparin products and starting a nonheparin anticoagulant. The direct thrombin inhibitor argatroban is one of the standard nonheparin anticoagulants used in patients with suspected HIT.4 While it is expensive, its short half-life and lack of renal clearance make it ideal for treatment of hospitalized patients with suspected HIT, many of whom need frequent procedures and/or have renal disease.
At our academic tertiary care center, we performed a retrospective analysis that showed inappropriate ordering of diagnostic HIT testing as well as unnecessary use of argatroban even when there was low suspicion for HIT based on laboratory findings. The aim of our project was to reduce unnecessary HIT testing and argatroban utilization without overburdening providers or interfering with established workflows.
Methods
Setting
The University of Michigan (UM) hospital is a 1000-bed tertiary care center in Ann Arbor, Michigan. The UM guidelines reflect evidence-based guidelines for the diagnosis and treatment of HIT.4 In 2016 the UM guidelines for laboratory testing included sending the PF4 antibody test first when there was clinical suspicion of HIT. The SRA was to be sent separately only when the PF4 returned positive (OD ≥ 0.400). Standard guidelines at UM also included switching patients with suspected HIT from heparin to a nonheparin anticoagulant and stopping all heparin products while awaiting the SRA results. The direct thrombin inhibitor argatroban is utilized at UM and monitored with anti-IIa levels. University of Michigan Hospital utilizes the Immucor PF4 IgG ELISA for detecting heparin-associated antibodies.9 In 2016, this PF4 test was performed in the UM onsite laboratory Monday through Friday. At UM the SRA is performed off site, with a turnaround time of 3 to 5 business days.
Baseline Data
We retrospectively reviewed PF4 and SRA testing as well as argatroban usage from December 2016 to May 2017. Despite the institutional guidelines, providers were sending PF4 and SRA simultaneously as soon as HIT was suspected; 62% of PF4 tests were ordered simultaneously with the SRA, but only 8% of these PF4 tests were positive with an OD ≥0.400. Of those patients with negative PF4 testing, argatroban was continued until the SRA returned negative, leading to many days of unnecessary argatroban usage. An informal survey of the anticoagulation pharmacists revealed that many recommended discontinuing argatroban when the PF4 test was negative, but providers routinely did not feel comfortable with this approach. This suggested many providers misunderstood the performance characteristics of the PF4 test.
Intervention
Our team consisted of hematology and internal medicine faculty, pharmacists, coagulation laboratory personnel, and quality improvement specialists. We designed and implemented an intervention in November 2017 focused on controlling the ordering of the SRA test. We chose to focus on this step due to the excellent sensitivity of the PF4 test with a cutoff of OD <0.400 and the significant expense of the SRA test. Under direction of the Coagulation Laboratory Director, a standard operating procedure was developed where the coagulation laboratory personnel did not send out the SRA until a positive PF4 test (OD ≥ 0.400) was reported. If the PF4 was negative, the SRA was canceled and the ordering provider received notification of the cancelled test via the electronic medical record, accompanied by education about HIT testing (Figure 1). In addition, the lab increased the availability of PF4 testing from 5 days to 7 days a week so there were no delays in tests ordered on Fridays or weekends.
Outcomes
Our primary goals were to decrease both SRA testing and argatroban use. Secondarily, we examined the cost-effectiveness of this intervention. We hypothesized that controlling the SRA testing at the laboratory level would decrease both SRA testing and argatroban use.
Data Collection
Pre- and postintervention data were collected retrospectively. Pre-intervention data were from January 2016 through November 2017, and postintervention data were from December 2017 through March 2020. The number of SRA tests performed were identified retrospectively via review of electronic ordering records. All patients who had a hospital admission after January 1, 2016, were included. These patients were filtered to include only those who had a result for an SRA test. In order to calculate cost-savings, we identified both the number of SRA tests ordered retrospectively as well as patients who had both an SRA resulted and had been administered argatroban. Cost-savings were calculated based on our institutional cost of $357 per SRA test.
At our institution, argatroban is supplied in 50-mL bags; therefore, we utilized the number of bags to identify argatroban usage. Savings were calculated using the average wholesale price (AWP) of $292.50 per 50-mL bag. The amounts billed or collected for the SRA testing or argatroban treatment were not collected. Costs were estimated using only direct costs to the institution. Safety data were not collected. As the intent of our project was a quality improvement activity, this project did not require institutional review board regulation per our institutional guidance.
Results
During the pre-intervention period, the average number of admissions (adults and children) at UM was 5863 per month. Post intervention there was an average of 5842 admissions per month. A total of 1192 PF4 tests were ordered before the intervention and 1148 were ordered post intervention. Prior to the intervention, 481 SRA tests were completed, while post intervention 105 were completed. Serotonin-release testing decreased from an average of 3.7 SRA results per 1000 admissions during the pre-intervention period to an average of 0.6 per 1000 admissions post intervention (Figure 2). Cost-savings were $1045 per 1000 admissions.
During the pre-intervention period, 2539 bags of argatroban were used, while 2337 bags were used post intervention. The number of 50-mL argatroban bags used per 1000 admissions decreased from 18.8 before the intervention to 14.3 post intervention. Cost-savings were $1316.20 per 1000 admissions. Figure 3 illustrates the monthly argatroban utilization per 1000 admissions during each quarter from January 2016 through March 2020.
Discussion
We designed and implemented an evidence-based strategy for HIT at our academic institution which led to a decrease in unnecessary SRA testing and argatroban utilization, with associated cost savings. By focusing on a single point of intervention at the laboratory level where SRA tests were held and canceled if the PF4 test was negative, we helped offload the decision-making from the provider while simultaneously providing just-in-time education to the provider. This intervention was designed with input from multiple stakeholders, including physicians, quality improvement specialists, pharmacists, and coagulation laboratory personnel.
Serotonin-release testing dramatically decreased post intervention even though a similar number of PF4 tests were performed before and after the intervention. This suggests that the decrease in SRA testing was a direct consequence of our intervention. Post intervention the number of completed SRA tests was 9% of the number of PF4 tests sent. This is consistent with our baseline pre-intervention data showing that only 8% of all PF4 tests sent were positive.
While the absolute number of argatroban bags utilized did not dramatically decrease after the intervention, the quarterly rate did, particularly after 2018. Given that argatroban data were only drawn from patients with a concurrent SRA test, this decrease is clearly from decreased usage in patients with suspected HIT. We suspect the decrease occurred because argatroban was not being continued while awaiting an SRA test in patients with a negative PF4 test. Decreasing the utilization of argatroban not only saved money but also reduced days of exposure to argatroban. While we do not have data regarding adverse events related to argatroban prior to the intervention, it is logical to conclude that reducing unnecessary exposure to argatroban reduces the risk of adverse events related to bleeding. Future studies would ideally address specific safety outcome metrics such as adverse events, bleeding risk, or missed diagnoses of HIT.
Our institutional guidelines for the diagnosis of HIT are evidence-based and helpful but are rarely followed by busy inpatient providers. Controlling the utilization of the SRA at the laboratory level had several advantages. First, removing SRA decision-making from providers who are not experts in the diagnosis of HIT guaranteed adherence to evidence-based guidelines. Second, pharmacists could safely recommend discontinuing argatroban when the PF4 test was negative as there was no SRA pending. Third, with cancellation at the laboratory level there was no need to further burden providers with yet another alert in the electronic health record. Fourth, just-in-time education was provided to the providers with justification for why the SRA test was canceled. Last, ruling out HIT within 24 hours with the PF4 test alone allowed providers to evaluate patients for other causes of thrombocytopenia much earlier than the 3 to 5 business days before the SRA results returned.
A limitation of this study is that it was conducted at a single center. Our approach is also limited by the lack of universal applicability. At our institution we are fortunate to have PF4 testing available in our coagulation laboratory 7 days a week. In addition, the coagulation laboratory controls sending the SRA to the reference laboratory. The specific intervention of controlling the SRA testing is therefore applicable only to institutions similar to ours; however, the concept of removing control of specialized testing from the provider is not unique. Inpatient thrombophilia testing has been a successful target of this approach.11-13 While electronic alerts and education of individual providers can also be effective initially, the effectiveness of these interventions has been repeatedly shown to wane over time.14-16
Conclusion
At our institution we were able to implement practical, evidence-based testing for HIT by implementing control over SRA testing at the level of the laboratory. This approach led to decreased argatroban utilization and cost savings.
Corresponding author: Alice Cusick, MD; LTC Charles S Kettles VA Medical Center, 2215 Fuller Road, Ann Arbor, MI 48105; [email protected]
Disclosures: None reported.
doi: 10.12788/jcom.0087
1. Fountain E, Arepally GM. Thrombocytopenia in hospitalized non-ICU patients. Blood. 2015;126(23):1060. doi:10.1182/blood.v126.23.1060.1060
2. Hui P, Cook DJ, Lim W, Fraser GA, Arnold DM. The frequency and clinical significance of thrombocytopenia complicating critical illness: a systematic review. Chest. 2011;139(2):271-278. doi:10.1378/chest.10-2243
3. Warkentin TE. Heparin-induced thrombocytopenia. Curr Opin Crit Care. 2015;21(6):576-585. doi:10.1097/MCC.0000000000000259
4. Cuker A, Arepally GM, Chong BH, et al. American Society of Hematology 2018 guidelines for management of venous thromboembolism: heparin-induced thrombocytopenia. Blood Adv. 2018;2(22):3360-3392. doi:10.1182/bloodadvances.2018024489
5. Cuker A, Gimotty PA, Crowther MA, Warkentin TE. Predictive value of the 4Ts scoring system for heparin-induced thrombocytopenia: a systematic review and meta-analysis. Blood. 2012;120(20):4160-4167. doi:10.1182/blood-2012-07-443051
6. Northam KA, Parker WF, Chen S-L, et al. Evaluation of 4Ts score inter-rater agreement in patients undergoing evaluation for heparin-induced thrombocytopenia. Blood Coagul Fibrinolysis. 2021;32(5):328-334. doi:10.1097/MBC.0000000000001042
7. Raschke RA, Curry SC, Warkentin TE, Gerkin RD. Improving clinical interpretation of the anti-platelet factor 4/heparin enzyme-linked immunosorbent assay for the diagnosis of heparin-induced thrombocytopenia through the use of receiver operating characteristic analysis, stratum-specific likelihood ratios, and Bayes theorem. Chest. 2013;144(4):1269-1275. doi:10.1378/chest.12-2712
8. Warkentin TE, Arnold DM, Nazi I, Kelton JG. The platelet serotonin-release assay. Am J Hematol. 2015;90(6):564-572. doi:10.1002/ajh.24006
9. Use IFOR, Contents TOF. LIFECODES ® PF4 IgG assay:1-9.
10. Ancker JS, Edwards A, Nosal S, Hauser D, Mauer E, Kaushal R. Effects of workload, work complexity, and repeated alerts on alert fatigue in a clinical decision support system. BMC Med Inform Decis Mak. 2017;17(1):1-9. doi:10.1186/s12911-017-0430-8
11. O’Connor N, Carter-Johnson R. Effective screening of pathology tests controls costs: thrombophilia testing. J Clin Pathol. 2006;59(5):556. doi:10.1136/jcp.2005.030700
12. Lim MY, Greenberg CS. Inpatient thrombophilia testing: Impact of healthcare system technology and targeted clinician education on changing practice patterns. Vasc Med (United Kingdom). 2018;23(1):78-79. doi:10.1177/1358863X17742509
13. Cox JL, Shunkwiler SM, Koepsell SA. Requirement for a pathologist’s second signature limits inappropriate inpatient thrombophilia testing. Lab Med. 2017;48(4):367-371. doi:10.1093/labmed/lmx040
14. Kwang H, Mou E, Richman I, et al. Thrombophilia testing in the inpatient setting: impact of an educational intervention. BMC Med Inform Decis Mak. 2019;19(1):167. doi:10.1186/s12911-019-0889-6
15. Shah T, Patel-Teague S, Kroupa L, Meyer AND, Singh H. Impact of a national QI programme on reducing electronic health record notifications to clinicians. BMJ Qual Saf. 2019;28(1):10-14. doi:10.1136/bmjqs-2017-007447
16. Singh H, Spitzmueller C, Petersen NJ, Sawhney MK, Sittig DF. Information overload and missed test results in electronic health record-based settings. JAMA Intern Med. 2013;173(8):702-704. doi:10.1001/2013.jamainternmed.61
Acute STEMI During the COVID-19 Pandemic at a Regional Hospital: Incidence, Clinical Characteristics, and Outcomes
From the Department of Medicine, Medical College of Georgia at the Augusta University-University of Georgia Medical Partnership, Athens, GA (Syed H. Ali, Syed Hyder, and Dr. Murrow), and the Department of Cardiology, Piedmont Heart Institute, Piedmont Athens Regional, Athens, GA (Dr. Murrow and Mrs. Davis).
Abstract
Objectives: The aim of this study was to describe the characteristics and in-hospital outcomes of patients with acute ST-segment elevation myocardial infarction (STEMI) during the early COVID-19 pandemic at Piedmont Athens Regional (PAR), a 330-bed tertiary referral center in Northeast Georgia.
Methods: A retrospective study was conducted at PAR to evaluate patients with acute STEMI admitted over an 8-week period during the initial COVID-19 outbreak. This study group was compared to patients admitted during the corresponding period in 2019. The primary endpoint of this study was defined as a composite of sustained ventricular arrhythmia, congestive heart failure (CHF) with pulmonary congestion, and/or in-hospital mortality.
Results: This study cohort was composed of 64 patients with acute STEMI; 30 patients (46.9%) were hospitalized during the COVID-19 pandemic. Patients with STEMI in both the COVID-19 and control groups had similar comorbidities, Killip classification score, and clinical presentations. The median (interquartile range) time from symptom onset to reperfusion (total ischemic time) increased from 99.5 minutes (84.8-132) in 2019 to 149 minutes (96.3-231.8; P = .032) in 2020. Hospitalization during the COVID-19 period was associated with an increased risk for combined in-hospital outcome (odds ratio, 3.96; P = .046).
Conclusion: Patients with STEMI admitted during the first wave of the COVID-19 outbreak experienced longer total ischemic time and increased risk for combined in-hospital outcomes compared to patients admitted during the corresponding period in 2019.
Keywords: myocardial infarction, acute coronary syndrome, hospitalization, outcomes.

The emergence of the SARS-Cov-2 virus in December 2019 caused a worldwide shift in resource allocation and the restructuring of health care systems within the span of a few months. With the rapid spread of infection, the World Health Organization officially declared a pandemic in March 2020. The pandemic led to the deferral and cancellation of in-person patient visits, routine diagnostic studies, and nonessential surgeries and procedures. This response occurred secondary to a joint effort to reduce transmission via stay-at-home mandates and appropriate social distancing.1
Alongside the reduction in elective procedures and health care visits, significant reductions in hospitalization rates due to decreases in acute ST-segment elevation myocardial infarction (STEMI) and catheterization laboratory utilization have been reported in many studies from around the world.2-7 Comprehensive data demonstrating the impact of the COVID-19 pandemic on acute STEMI patient characteristics, clinical presentation, and in-hospital outcomes are lacking. Although patients with previously diagnosed cardiovascular disease are more likely to encounter worse outcomes in the setting of COVID-19, there may also be an indirect impact of the pandemic on high-risk patients, including those without the infection.8 Several theories have been hypothesized to explain this phenomenon. One theory postulates that the fear of contracting the virus during hospitalization is great enough to prevent patients from seeking care.2 Another theory suggests that the increased utilization of telemedicine prevents exacerbation of chronic conditions and the need for hospitalization.9 Contrary to this trend, previous studies have shown an increased incidence of acute STEMI following stressful events such as natural disasters.10
The aim of this study was to describe trends pertaining to clinical characteristics and in-hospital outcomes of patients with acute STEMI during the early COVID-19 pandemic at Piedmont Athens Regional (PAR), a 330-bed tertiary referral center in Northeast Georgia.
Methods
A retrospective cohort study was conducted at PAR to evaluate patients with STEMI admitted to the cardiovascular intensive care unit over an 8-week period (March 5 to May 5, 2020) during the COVID-19 outbreak. COVID-19 was declared a national emergency on March 13, 2020, in the United States. The institutional review board at PAR approved the study; the need for individual consent was waived under the condition that participant data would undergo de-identification and be strictly safeguarded.
Data Collection
Because there are seasonal variations in cardiovascular admissions, patient data from a control period (March 9 to May 9, 2019) were obtained to compare with data from the 2020 period. The number of patients with the diagnosis of acute STEMI during the COVID-19 period was recorded. Demographic data, clinical characteristics, and primary angiographic findings were gathered for all patients. Time from symptom onset to hospital admission and time from hospital admission to reperfusion (defined as door-to-balloon time) were documented for each patient. Killip classification was used to assess patients’ clinical status on admission. Length of stay was determined as days from hospital admission to discharge or death (if occurring during the same hospitalization).
Adverse in-hospital complications were also recorded. These were selected based on inclusion of the following categories of acute STEMI complications: ischemic, mechanical, arrhythmic, embolic, and inflammatory. The following complications occurred in our patient cohort: sustained ventricular arrhythmia, congestive heart failure (CHF) defined as congestion requiring intravenous diuretics, re-infarction, mechanical complications (free-wall rupture, ventricular septal defect, or mitral regurgitation), second- or third-degree atrioventricular block, atrial fibrillation, stroke, mechanical ventilation, major bleeding, pericarditis, cardiogenic shock, cardiac arrest, and in-hospital mortality. The primary outcome of this study was defined as a composite of sustained ventricular arrhythmia, CHF with congestion requiring intravenous diuretics, and/or in-hospital mortality. Ventricular arrythmia and CHF were included in the composite outcome because they are defined as the 2 most common causes of sudden cardiac death following acute STEMI.11,12
Statistical Analysis
Normally distributed continuous variables and categorical variables were compared using the paired t-test. A 2-sided P value <.05 was considered to be statistically significant. Mean admission rates for acute STEMI hospitalizations were determined by dividing the number of admissions by the number of days in each time period. The daily rate of COVID-19 cases per 100,000 individuals was obtained from the Centers for Disease Control and Prevention COVID-19 database. All data analyses were performed using Microsoft Excel.
Results
The study cohort consisted of 64 patients, of whom 30 (46.9%) were hospitalized between March 5 and May 5, 2020, and 34 (53.1%) who were admitted during the analogous time period in 2019. This reflected a 6% decrease in STEMI admissions at PAR in the COVID-19 cohort.
Acute STEMI Hospitalization Rates and COVID-19 Incidence
The mean daily acute STEMI admission rate was 0.50 during the study period compared to 0.57 during the control period. During the study period in 2020 in the state of Georgia, the daily rate of newly confirmed COVID-19 cases ranged from 0.194 per 100,000 on March 5 to 8.778 per 100,000 on May 5. Results of COVID-19 testing were available for 9 STEMI patients, and of these 0 tests were positive.
Baseline Characteristics
Baseline characteristics of the acute STEMI cohorts are presented in Table 1. Approximately 75% were male; median (interquartile range [IQR]) age was 60 (51-72) years. There were no significant differences in age and gender between the study periods. Three-quarters of patients had a history of hypertension, and 87.5% had a history of dyslipidemia. There was no significant difference in baseline comorbidity profiles between the 2 study periods; therefore, our sample populations shared similar characteristics.
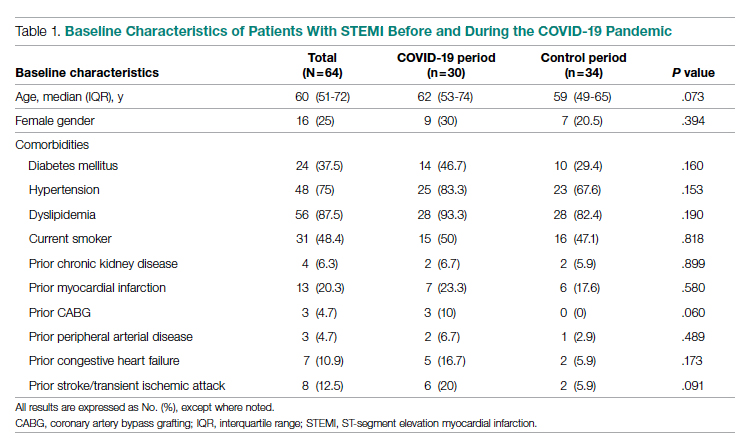
Clinical Presentation
Significant differences were observed regarding the time intervals of STEMI patients in the COVID-19 period and the control period (Table 2). Median time from symptom onset to hospital admission (patient delay) was extended from 57.5 minutes (IQR, 40.3-106) in 2019 to 93 minutes (IQR, 48.8-132) in 2020; however, this difference was not statistically significant (P = .697). Median time from hospital admission to reperfusion (system delay) was prolonged from 45 minutes (IQR, 28-61) in 2019 to 78 minutes (IQR, 50-110) in 2020 (P < .001). Overall time from symptom onset to reperfusion (total ischemic time) increased from 99.5 minutes (IQR, 84.8-132) in 2019 to 149 minutes (IQR, 96.3-231.8) in 2020 (P = .032).
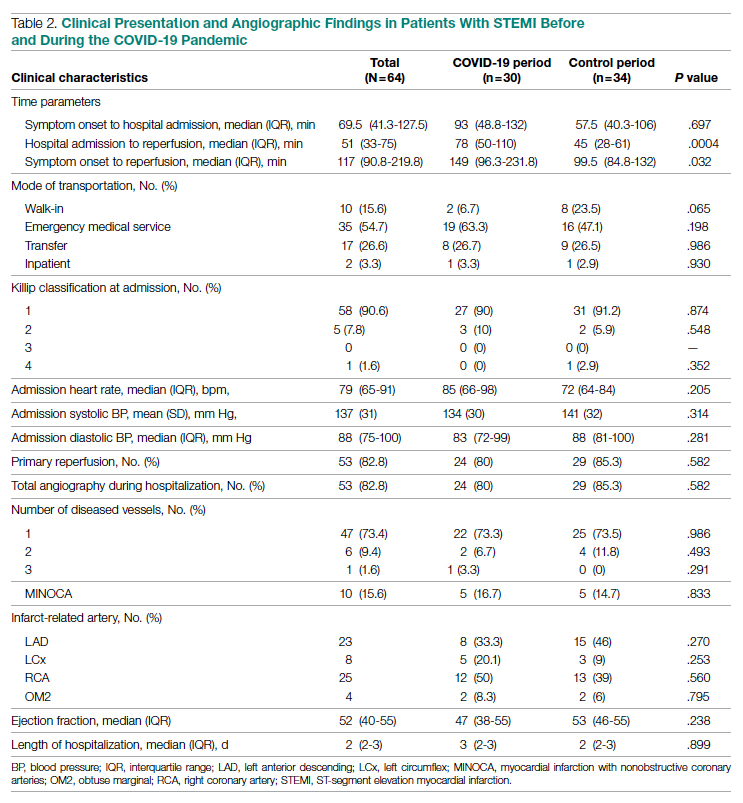
Regarding mode of transportation, 23.5% of patients in 2019 were walk-in admissions to the emergency department. During the COVID-19 period, walk-in admissions decreased to 6.7% (P = .065). There were no significant differences between emergency medical service, transfer, or in-patient admissions for STEMI cases between the 2 study periods.
Killip classification scores were calculated for all patients on admission; 90.6% of patients were classified as Killip Class 1. There was no significant difference between hemodynamic presentations during the COVID-19 period compared to the control period.
Angiographic Data
Overall, 53 (82.8%) patients admitted with acute STEMI underwent coronary angiography during their hospital stay. The proportion of patients who underwent primary reperfusion was greater in the control period than in the COVID-19 period (85.3% vs 80%; P = .582). Angiographic characteristics and findings were similar between the 2 study groups (Table 2).
In-Hospital Outcomes
In-hospital outcome data were available for all patients. As shown in Table 3, hospitalization during the COVID-19 period was independently associated with an increased risk for combined in-hospital outcome (odds ratio, 3.96; P = .046). The rate of in-hospital mortality was greater in the COVID-19 period (P = .013). We found no significant difference when comparing secondary outcomes from admissions during the COVID-19 period and the control period in 2019. For the 5 patients who died during the study period, the primary diagnosis at death was acute STEMI complicated by CHF (3 patients) or cardiogenic shock (2 patients).
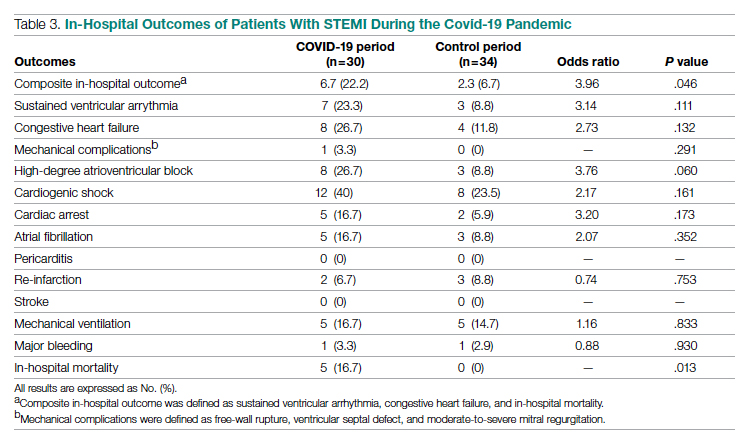
Discussion
This single-center retrospective study at PAR looks at the impact of COVID-19 on hospitalizations for acute STEMI during the initial peak of the pandemic. The key findings of this study show a significant increase in ischemic time parameters (symptom onset to reperfusion, hospital admission to reperfusion), in-hospital mortality, and combined in-hospital outcomes.
There was a 49.5-minute increase in total ischemic time noted in this study (P = .032). Though there was a numerical increase in time of symptom onset to hospital admission by 23.5 minutes, this difference was not statistically significant (P = .697). However, this study observed a statistically significant 33-minute increase in ischemic time from hospital admission to reperfusion (P < .001). Multiple studies globally have found a similar increase in total ischemic times, including those conducted in China and Europe.13-15 Every level of potential delay must be considered, including pre-hospital, triage and emergency department, and/or reperfusion team. Pre-hospital sources of delays that have been suggested include “stay-at-home” orders and apprehension to seek medical care due to concern about contracting the virus or overwhelming the health care facilities. There was a clinically significant 4-fold decrease in the number of walk-in acute STEMI cases in the study period. In 2019, there were 8 walk-in cases compared to 2 cases in 2020 (P = .065). However, this change was not statistically significant. In-hospital/systemic sources of delays have been mentioned in other studies; they include increased time taken to rule out COVID-19 (nasopharyngeal swab/chest x-ray) and increased time due to the need for intensive gowning and gloving procedures by staff. It was difficult to objectively determine the sources of system delay by the reperfusion team due to a lack of quantitative data.
In the current study, we found a significant increase in in-hospital mortality during the COVID-19 period compared to a parallel time frame in 2019. This finding is contrary to a multicenter study from Spain that reported no difference in in-hospital outcomes or mortality rates among all acute coronary syndrome cases.16 The worsening outcomes and prognosis may simply be a result of increased ischemic time; however, the virus that causes COVID-19 itself may play a role as well. Studies have found that SARS-Cov-2 infection places patients at greater risk for cardiovascular conditions such as hypercoagulability, myocarditis, and arrhythmias.17 In our study, however, there were no acute STEMI patients who tested positive for COVID-19. Therefore, we cannot discuss the impact of increased thrombus burden in patients with COVID-19. Piedmont Healthcare published a STEMI treatment protocol in May 2020 that advised increased use of tissue plasminogen activator (tPA) in COVID-19-positive cases; during the study period, however, there were no occasions when tPA use was deemed appropriate based on clinical judgment.
Our findings align with previous studies that describe an increase in combined in-hospital adverse outcomes during the COVID-19 era. Previous studies detected a higher rate of complications in the COVID-19 cohort, but in the current study, the adverse in-hospital course is unrelated to underlying infection.18,19 This study reports a higher incidence of major in-hospital outcomes, including a 65% increase in the rate of combined in-hospital outcomes, which is similar to a multicenter study conducted in Israel.19 There was a 2.3-fold numerical increase in sustained ventricular arrhythmias and a 2.5-fold numerical increase in the incidence of cardiac arrest in the study period. This phenomenon was observed despite a similar rate of reperfusion procedures in both groups.
Acute STEMI is a highly fatal condition with an incidence of 8.5 in 10,000 annually in the United States. While studies across the world have shown a 25% to 40% reduction in the rate of hospitalized acute coronary syndrome cases during the COVID-19 pandemic, the decrease from 34 to 30 STEMI admissions at PAR is not statistically significant.20 Possible reasons for the reduction globally include increased out-of-hospital mortality and decreased incidence of acute STEMI across the general population as a result of improved access to telemedicine or decreased levels of life stressors.20
In summary, there was an increase in ischemic time to reperfusion, in-hospital mortality, and combined in-hospital outcomes for acute STEMI patients at PAR during the COVID period.
Limitations
This study has several limitations. This is a single-center study, so the sample size is small and may not be generalizable to a larger population. This is a retrospective observational study, so causation cannot be inferred. This study analyzed ischemic time parameters as average rates over time rather than in an interrupted time series. Post-reperfusion outcomes were limited to hospital stay. Post-hospital follow-up would provide a better picture of the effects of STEMI intervention. There is no account of patients who died out-of-hospital secondary to acute STEMI. COVID-19 testing was not introduced until midway in our study period. Therefore, we cannot rule out the possibility of the SARS-Cov-2 virus inciting acute STEMI and subsequently leading to worse outcomes and poor prognosis.
Conclusions
This study provides an analysis of the incidence, characteristics, and clinical outcomes of patients presenting with acute STEMI during the early period of the COVID-19 pandemic. In-hospital mortality and ischemic time to reperfusion increased while combined in-hospital outcomes worsened.
Acknowledgment: The authors thank Piedmont Athens Regional IRB for approving this project and allowing access to patient data.
Corresponding author: Syed H. Ali; Department of Medicine, Medical College of Georgia at the Augusta University-University of Georgia Medical Partnership, 30606, Athens, GA; [email protected]
Disclosures: None reported.
doi:10.12788/jcom.0085
1. Bhatt AS, Moscone A, McElrath EE, et al. Fewer hospitalizations for acute cardiovascular conditions during the COVID-19 pandemic. J Am Coll Cardiol. 2020;76(3):280-288. doi:10.1016/j.jacc.2020.05.038
2. Metzler B, Siostrzonek P, Binder RK, Bauer A, Reinstadler SJR. Decline of acute coronary syndrome admissions in Austria since the outbreak of Covid-19: the pandemic response causes cardiac collateral damage. Eur Heart J. 2020;41:1852-1853. doi:10.1093/eurheartj/ehaa314
3. De Rosa S, Spaccarotella C, Basso C, et al. Reduction of hospitalizations for myocardial infarction in Italy in the Covid-19 era. Eur Heart J. 2020;41(22):2083-2088.
4. Wilson SJ, Connolly MJ, Elghamry Z, et al. Effect of the COVID-19 pandemic on ST-segment-elevation myocardial infarction presentations and in-hospital outcomes. Circ Cardiovasc Interv. 2020; 13(7):e009438. doi:10.1161/CIRCINTERVENTIONS.120.009438
5. Mafham MM, Spata E, Goldacre R, et al. Covid-19 pandemic and admission rates for and management of acute coronary syndromes in England. Lancet. 2020;396 (10248):381-389. doi:10.1016/S0140-6736(20)31356-8
6. Bhatt AS, Moscone A, McElrath EE, et al. Fewer Hospitalizations for acute cardiovascular conditions during the COVID-19 pandemic. J Am Coll Cardiol. 2020;76(3):280-288. doi:10.1016/j.jacc.2020.05.038
7. Tam CF, Cheung KS, Lam S, et al. Impact of Coronavirus disease 2019 (Covid-19) outbreak on ST-segment elevation myocardial infarction care in Hong Kong, China. Circ Cardiovasc Qual Outcomes. 2020;13(4):e006631. doi:10.1161/CIRCOUTCOMES.120.006631
8. Clerkin KJ, Fried JA, Raikhelkar J, et al. Coronavirus disease 2019 (COVID-19) and cardiovascular disease. Circulation. 2020;141:1648-1655. doi:10.1161/CIRCULATIONAHA.120.046941
9. Ebinger JE, Shah PK. Declining admissions for acute cardiovascular illness: The Covid-19 paradox. J Am Coll Cardiol. 2020;76(3):289-291. doi:10.1016/j.jacc.2020.05.039
10 Leor J, Poole WK, Kloner RA. Sudden cardiac death triggered by an earthquake. N Engl J Med. 1996;334(7):413-419. doi:10.1056/NEJM199602153340701
11. Hiramori K. Major causes of death from acute myocardial infarction in a coronary care unit. Jpn Circ J. 1987;51(9):1041-1047. doi:10.1253/jcj.51.1041
12. Bui AH, Waks JW. Risk stratification of sudden cardiac death after acute myocardial infarction. J Innov Card Rhythm Manag. 2018;9(2):3035-3049. doi:10.19102/icrm.2018.090201
13. Xiang D, Xiang X, Zhang W, et al. Management and outcomes of patients with STEMI during the COVID-19 pandemic in China. J Am Coll Cardiol. 2020;76(11):1318-1324. doi:10.1016/j.jacc.2020.06.039
14. Hakim R, Motreff P, Rangé G. COVID-19 and STEMI. [Article in French]. Ann Cardiol Angeiol (Paris). 2020;69(6):355-359. doi:10.1016/j.ancard.2020.09.034
15. Soylu K, Coksevim M, Yanık A, Bugra Cerik I, Aksan G. Effect of Covid-19 pandemic process on STEMI patients timeline. Int J Clin Pract. 2021;75(5):e14005. doi:10.1111/ijcp.14005
16. Salinas P, Travieso A, Vergara-Uzcategui C, et al. Clinical profile and 30-day mortality of invasively managed patients with suspected acute coronary syndrome during the COVID-19 outbreak. Int Heart J. 2021;62(2):274-281. doi:10.1536/ihj.20-574
17. Hu Y, Sun J, Dai Z, et al. Prevalence and severity of corona virus disease 2019 (Covid-19): a systematic review and meta-analysis. J Clin Virol. 2020;127:104371. doi:10.1016/j.jcv.2020.104371
18. Rodriguez-Leor O, Cid Alvarez AB, Perez de Prado A, et al. In-hospital outcomes of COVID-19 ST-elevation myocardial infarction patients. EuroIntervention. 2021;16(17):1426-1433. doi:10.4244/EIJ-D-20-00935
19. Fardman A, Zahger D, Orvin K, et al. Acute myocardial infarction in the Covid-19 era: incidence, clinical characteristics and in-hospital outcomes—A multicenter registry. PLoS ONE. 2021;16(6): e0253524. doi:10.1371/journal.pone.0253524
20. Pessoa-Amorim G, Camm CF, Gajendragadkar P, et al. Admission of patients with STEMI since the outbreak of the COVID-19 pandemic: a survey by the European Society of Cardiology. Eur Heart J Qual Care Clin Outcomes. 2020;6(3):210-216. doi:10.1093/ehjqcco/qcaa046
From the Department of Medicine, Medical College of Georgia at the Augusta University-University of Georgia Medical Partnership, Athens, GA (Syed H. Ali, Syed Hyder, and Dr. Murrow), and the Department of Cardiology, Piedmont Heart Institute, Piedmont Athens Regional, Athens, GA (Dr. Murrow and Mrs. Davis).
Abstract
Objectives: The aim of this study was to describe the characteristics and in-hospital outcomes of patients with acute ST-segment elevation myocardial infarction (STEMI) during the early COVID-19 pandemic at Piedmont Athens Regional (PAR), a 330-bed tertiary referral center in Northeast Georgia.
Methods: A retrospective study was conducted at PAR to evaluate patients with acute STEMI admitted over an 8-week period during the initial COVID-19 outbreak. This study group was compared to patients admitted during the corresponding period in 2019. The primary endpoint of this study was defined as a composite of sustained ventricular arrhythmia, congestive heart failure (CHF) with pulmonary congestion, and/or in-hospital mortality.
Results: This study cohort was composed of 64 patients with acute STEMI; 30 patients (46.9%) were hospitalized during the COVID-19 pandemic. Patients with STEMI in both the COVID-19 and control groups had similar comorbidities, Killip classification score, and clinical presentations. The median (interquartile range) time from symptom onset to reperfusion (total ischemic time) increased from 99.5 minutes (84.8-132) in 2019 to 149 minutes (96.3-231.8; P = .032) in 2020. Hospitalization during the COVID-19 period was associated with an increased risk for combined in-hospital outcome (odds ratio, 3.96; P = .046).
Conclusion: Patients with STEMI admitted during the first wave of the COVID-19 outbreak experienced longer total ischemic time and increased risk for combined in-hospital outcomes compared to patients admitted during the corresponding period in 2019.
Keywords: myocardial infarction, acute coronary syndrome, hospitalization, outcomes.
The emergence of the SARS-Cov-2 virus in December 2019 caused a worldwide shift in resource allocation and the restructuring of health care systems within the span of a few months. With the rapid spread of infection, the World Health Organization officially declared a pandemic in March 2020. The pandemic led to the deferral and cancellation of in-person patient visits, routine diagnostic studies, and nonessential surgeries and procedures. This response occurred secondary to a joint effort to reduce transmission via stay-at-home mandates and appropriate social distancing.1
Alongside the reduction in elective procedures and health care visits, significant reductions in hospitalization rates due to decreases in acute ST-segment elevation myocardial infarction (STEMI) and catheterization laboratory utilization have been reported in many studies from around the world.2-7 Comprehensive data demonstrating the impact of the COVID-19 pandemic on acute STEMI patient characteristics, clinical presentation, and in-hospital outcomes are lacking. Although patients with previously diagnosed cardiovascular disease are more likely to encounter worse outcomes in the setting of COVID-19, there may also be an indirect impact of the pandemic on high-risk patients, including those without the infection.8 Several theories have been hypothesized to explain this phenomenon. One theory postulates that the fear of contracting the virus during hospitalization is great enough to prevent patients from seeking care.2 Another theory suggests that the increased utilization of telemedicine prevents exacerbation of chronic conditions and the need for hospitalization.9 Contrary to this trend, previous studies have shown an increased incidence of acute STEMI following stressful events such as natural disasters.10
The aim of this study was to describe trends pertaining to clinical characteristics and in-hospital outcomes of patients with acute STEMI during the early COVID-19 pandemic at Piedmont Athens Regional (PAR), a 330-bed tertiary referral center in Northeast Georgia.
Methods
A retrospective cohort study was conducted at PAR to evaluate patients with STEMI admitted to the cardiovascular intensive care unit over an 8-week period (March 5 to May 5, 2020) during the COVID-19 outbreak. COVID-19 was declared a national emergency on March 13, 2020, in the United States. The institutional review board at PAR approved the study; the need for individual consent was waived under the condition that participant data would undergo de-identification and be strictly safeguarded.
Data Collection
Because there are seasonal variations in cardiovascular admissions, patient data from a control period (March 9 to May 9, 2019) were obtained to compare with data from the 2020 period. The number of patients with the diagnosis of acute STEMI during the COVID-19 period was recorded. Demographic data, clinical characteristics, and primary angiographic findings were gathered for all patients. Time from symptom onset to hospital admission and time from hospital admission to reperfusion (defined as door-to-balloon time) were documented for each patient. Killip classification was used to assess patients’ clinical status on admission. Length of stay was determined as days from hospital admission to discharge or death (if occurring during the same hospitalization).
Adverse in-hospital complications were also recorded. These were selected based on inclusion of the following categories of acute STEMI complications: ischemic, mechanical, arrhythmic, embolic, and inflammatory. The following complications occurred in our patient cohort: sustained ventricular arrhythmia, congestive heart failure (CHF) defined as congestion requiring intravenous diuretics, re-infarction, mechanical complications (free-wall rupture, ventricular septal defect, or mitral regurgitation), second- or third-degree atrioventricular block, atrial fibrillation, stroke, mechanical ventilation, major bleeding, pericarditis, cardiogenic shock, cardiac arrest, and in-hospital mortality. The primary outcome of this study was defined as a composite of sustained ventricular arrhythmia, CHF with congestion requiring intravenous diuretics, and/or in-hospital mortality. Ventricular arrythmia and CHF were included in the composite outcome because they are defined as the 2 most common causes of sudden cardiac death following acute STEMI.11,12
Statistical Analysis
Normally distributed continuous variables and categorical variables were compared using the paired t-test. A 2-sided P value <.05 was considered to be statistically significant. Mean admission rates for acute STEMI hospitalizations were determined by dividing the number of admissions by the number of days in each time period. The daily rate of COVID-19 cases per 100,000 individuals was obtained from the Centers for Disease Control and Prevention COVID-19 database. All data analyses were performed using Microsoft Excel.
Results
The study cohort consisted of 64 patients, of whom 30 (46.9%) were hospitalized between March 5 and May 5, 2020, and 34 (53.1%) who were admitted during the analogous time period in 2019. This reflected a 6% decrease in STEMI admissions at PAR in the COVID-19 cohort.
Acute STEMI Hospitalization Rates and COVID-19 Incidence
The mean daily acute STEMI admission rate was 0.50 during the study period compared to 0.57 during the control period. During the study period in 2020 in the state of Georgia, the daily rate of newly confirmed COVID-19 cases ranged from 0.194 per 100,000 on March 5 to 8.778 per 100,000 on May 5. Results of COVID-19 testing were available for 9 STEMI patients, and of these 0 tests were positive.
Baseline Characteristics
Baseline characteristics of the acute STEMI cohorts are presented in Table 1. Approximately 75% were male; median (interquartile range [IQR]) age was 60 (51-72) years. There were no significant differences in age and gender between the study periods. Three-quarters of patients had a history of hypertension, and 87.5% had a history of dyslipidemia. There was no significant difference in baseline comorbidity profiles between the 2 study periods; therefore, our sample populations shared similar characteristics.
Clinical Presentation
Significant differences were observed regarding the time intervals of STEMI patients in the COVID-19 period and the control period (Table 2). Median time from symptom onset to hospital admission (patient delay) was extended from 57.5 minutes (IQR, 40.3-106) in 2019 to 93 minutes (IQR, 48.8-132) in 2020; however, this difference was not statistically significant (P = .697). Median time from hospital admission to reperfusion (system delay) was prolonged from 45 minutes (IQR, 28-61) in 2019 to 78 minutes (IQR, 50-110) in 2020 (P < .001). Overall time from symptom onset to reperfusion (total ischemic time) increased from 99.5 minutes (IQR, 84.8-132) in 2019 to 149 minutes (IQR, 96.3-231.8) in 2020 (P = .032).
Regarding mode of transportation, 23.5% of patients in 2019 were walk-in admissions to the emergency department. During the COVID-19 period, walk-in admissions decreased to 6.7% (P = .065). There were no significant differences between emergency medical service, transfer, or in-patient admissions for STEMI cases between the 2 study periods.
Killip classification scores were calculated for all patients on admission; 90.6% of patients were classified as Killip Class 1. There was no significant difference between hemodynamic presentations during the COVID-19 period compared to the control period.
Angiographic Data
Overall, 53 (82.8%) patients admitted with acute STEMI underwent coronary angiography during their hospital stay. The proportion of patients who underwent primary reperfusion was greater in the control period than in the COVID-19 period (85.3% vs 80%; P = .582). Angiographic characteristics and findings were similar between the 2 study groups (Table 2).
In-Hospital Outcomes
In-hospital outcome data were available for all patients. As shown in Table 3, hospitalization during the COVID-19 period was independently associated with an increased risk for combined in-hospital outcome (odds ratio, 3.96; P = .046). The rate of in-hospital mortality was greater in the COVID-19 period (P = .013). We found no significant difference when comparing secondary outcomes from admissions during the COVID-19 period and the control period in 2019. For the 5 patients who died during the study period, the primary diagnosis at death was acute STEMI complicated by CHF (3 patients) or cardiogenic shock (2 patients).
Discussion
This single-center retrospective study at PAR looks at the impact of COVID-19 on hospitalizations for acute STEMI during the initial peak of the pandemic. The key findings of this study show a significant increase in ischemic time parameters (symptom onset to reperfusion, hospital admission to reperfusion), in-hospital mortality, and combined in-hospital outcomes.
There was a 49.5-minute increase in total ischemic time noted in this study (P = .032). Though there was a numerical increase in time of symptom onset to hospital admission by 23.5 minutes, this difference was not statistically significant (P = .697). However, this study observed a statistically significant 33-minute increase in ischemic time from hospital admission to reperfusion (P < .001). Multiple studies globally have found a similar increase in total ischemic times, including those conducted in China and Europe.13-15 Every level of potential delay must be considered, including pre-hospital, triage and emergency department, and/or reperfusion team. Pre-hospital sources of delays that have been suggested include “stay-at-home” orders and apprehension to seek medical care due to concern about contracting the virus or overwhelming the health care facilities. There was a clinically significant 4-fold decrease in the number of walk-in acute STEMI cases in the study period. In 2019, there were 8 walk-in cases compared to 2 cases in 2020 (P = .065). However, this change was not statistically significant. In-hospital/systemic sources of delays have been mentioned in other studies; they include increased time taken to rule out COVID-19 (nasopharyngeal swab/chest x-ray) and increased time due to the need for intensive gowning and gloving procedures by staff. It was difficult to objectively determine the sources of system delay by the reperfusion team due to a lack of quantitative data.
In the current study, we found a significant increase in in-hospital mortality during the COVID-19 period compared to a parallel time frame in 2019. This finding is contrary to a multicenter study from Spain that reported no difference in in-hospital outcomes or mortality rates among all acute coronary syndrome cases.16 The worsening outcomes and prognosis may simply be a result of increased ischemic time; however, the virus that causes COVID-19 itself may play a role as well. Studies have found that SARS-Cov-2 infection places patients at greater risk for cardiovascular conditions such as hypercoagulability, myocarditis, and arrhythmias.17 In our study, however, there were no acute STEMI patients who tested positive for COVID-19. Therefore, we cannot discuss the impact of increased thrombus burden in patients with COVID-19. Piedmont Healthcare published a STEMI treatment protocol in May 2020 that advised increased use of tissue plasminogen activator (tPA) in COVID-19-positive cases; during the study period, however, there were no occasions when tPA use was deemed appropriate based on clinical judgment.
Our findings align with previous studies that describe an increase in combined in-hospital adverse outcomes during the COVID-19 era. Previous studies detected a higher rate of complications in the COVID-19 cohort, but in the current study, the adverse in-hospital course is unrelated to underlying infection.18,19 This study reports a higher incidence of major in-hospital outcomes, including a 65% increase in the rate of combined in-hospital outcomes, which is similar to a multicenter study conducted in Israel.19 There was a 2.3-fold numerical increase in sustained ventricular arrhythmias and a 2.5-fold numerical increase in the incidence of cardiac arrest in the study period. This phenomenon was observed despite a similar rate of reperfusion procedures in both groups.
Acute STEMI is a highly fatal condition with an incidence of 8.5 in 10,000 annually in the United States. While studies across the world have shown a 25% to 40% reduction in the rate of hospitalized acute coronary syndrome cases during the COVID-19 pandemic, the decrease from 34 to 30 STEMI admissions at PAR is not statistically significant.20 Possible reasons for the reduction globally include increased out-of-hospital mortality and decreased incidence of acute STEMI across the general population as a result of improved access to telemedicine or decreased levels of life stressors.20
In summary, there was an increase in ischemic time to reperfusion, in-hospital mortality, and combined in-hospital outcomes for acute STEMI patients at PAR during the COVID period.
Limitations
This study has several limitations. This is a single-center study, so the sample size is small and may not be generalizable to a larger population. This is a retrospective observational study, so causation cannot be inferred. This study analyzed ischemic time parameters as average rates over time rather than in an interrupted time series. Post-reperfusion outcomes were limited to hospital stay. Post-hospital follow-up would provide a better picture of the effects of STEMI intervention. There is no account of patients who died out-of-hospital secondary to acute STEMI. COVID-19 testing was not introduced until midway in our study period. Therefore, we cannot rule out the possibility of the SARS-Cov-2 virus inciting acute STEMI and subsequently leading to worse outcomes and poor prognosis.
Conclusions
This study provides an analysis of the incidence, characteristics, and clinical outcomes of patients presenting with acute STEMI during the early period of the COVID-19 pandemic. In-hospital mortality and ischemic time to reperfusion increased while combined in-hospital outcomes worsened.
Acknowledgment: The authors thank Piedmont Athens Regional IRB for approving this project and allowing access to patient data.
Corresponding author: Syed H. Ali; Department of Medicine, Medical College of Georgia at the Augusta University-University of Georgia Medical Partnership, 30606, Athens, GA; [email protected]
Disclosures: None reported.
doi:10.12788/jcom.0085
1. Bhatt AS, Moscone A, McElrath EE, et al. Fewer hospitalizations for acute cardiovascular conditions during the COVID-19 pandemic. J Am Coll Cardiol. 2020;76(3):280-288. doi:10.1016/j.jacc.2020.05.038
2. Metzler B, Siostrzonek P, Binder RK, Bauer A, Reinstadler SJR. Decline of acute coronary syndrome admissions in Austria since the outbreak of Covid-19: the pandemic response causes cardiac collateral damage. Eur Heart J. 2020;41:1852-1853. doi:10.1093/eurheartj/ehaa314
3. De Rosa S, Spaccarotella C, Basso C, et al. Reduction of hospitalizations for myocardial infarction in Italy in the Covid-19 era. Eur Heart J. 2020;41(22):2083-2088.
4. Wilson SJ, Connolly MJ, Elghamry Z, et al. Effect of the COVID-19 pandemic on ST-segment-elevation myocardial infarction presentations and in-hospital outcomes. Circ Cardiovasc Interv. 2020; 13(7):e009438. doi:10.1161/CIRCINTERVENTIONS.120.009438
5. Mafham MM, Spata E, Goldacre R, et al. Covid-19 pandemic and admission rates for and management of acute coronary syndromes in England. Lancet. 2020;396 (10248):381-389. doi:10.1016/S0140-6736(20)31356-8
6. Bhatt AS, Moscone A, McElrath EE, et al. Fewer Hospitalizations for acute cardiovascular conditions during the COVID-19 pandemic. J Am Coll Cardiol. 2020;76(3):280-288. doi:10.1016/j.jacc.2020.05.038
7. Tam CF, Cheung KS, Lam S, et al. Impact of Coronavirus disease 2019 (Covid-19) outbreak on ST-segment elevation myocardial infarction care in Hong Kong, China. Circ Cardiovasc Qual Outcomes. 2020;13(4):e006631. doi:10.1161/CIRCOUTCOMES.120.006631
8. Clerkin KJ, Fried JA, Raikhelkar J, et al. Coronavirus disease 2019 (COVID-19) and cardiovascular disease. Circulation. 2020;141:1648-1655. doi:10.1161/CIRCULATIONAHA.120.046941
9. Ebinger JE, Shah PK. Declining admissions for acute cardiovascular illness: The Covid-19 paradox. J Am Coll Cardiol. 2020;76(3):289-291. doi:10.1016/j.jacc.2020.05.039
10 Leor J, Poole WK, Kloner RA. Sudden cardiac death triggered by an earthquake. N Engl J Med. 1996;334(7):413-419. doi:10.1056/NEJM199602153340701
11. Hiramori K. Major causes of death from acute myocardial infarction in a coronary care unit. Jpn Circ J. 1987;51(9):1041-1047. doi:10.1253/jcj.51.1041
12. Bui AH, Waks JW. Risk stratification of sudden cardiac death after acute myocardial infarction. J Innov Card Rhythm Manag. 2018;9(2):3035-3049. doi:10.19102/icrm.2018.090201
13. Xiang D, Xiang X, Zhang W, et al. Management and outcomes of patients with STEMI during the COVID-19 pandemic in China. J Am Coll Cardiol. 2020;76(11):1318-1324. doi:10.1016/j.jacc.2020.06.039
14. Hakim R, Motreff P, Rangé G. COVID-19 and STEMI. [Article in French]. Ann Cardiol Angeiol (Paris). 2020;69(6):355-359. doi:10.1016/j.ancard.2020.09.034
15. Soylu K, Coksevim M, Yanık A, Bugra Cerik I, Aksan G. Effect of Covid-19 pandemic process on STEMI patients timeline. Int J Clin Pract. 2021;75(5):e14005. doi:10.1111/ijcp.14005
16. Salinas P, Travieso A, Vergara-Uzcategui C, et al. Clinical profile and 30-day mortality of invasively managed patients with suspected acute coronary syndrome during the COVID-19 outbreak. Int Heart J. 2021;62(2):274-281. doi:10.1536/ihj.20-574
17. Hu Y, Sun J, Dai Z, et al. Prevalence and severity of corona virus disease 2019 (Covid-19): a systematic review and meta-analysis. J Clin Virol. 2020;127:104371. doi:10.1016/j.jcv.2020.104371
18. Rodriguez-Leor O, Cid Alvarez AB, Perez de Prado A, et al. In-hospital outcomes of COVID-19 ST-elevation myocardial infarction patients. EuroIntervention. 2021;16(17):1426-1433. doi:10.4244/EIJ-D-20-00935
19. Fardman A, Zahger D, Orvin K, et al. Acute myocardial infarction in the Covid-19 era: incidence, clinical characteristics and in-hospital outcomes—A multicenter registry. PLoS ONE. 2021;16(6): e0253524. doi:10.1371/journal.pone.0253524
20. Pessoa-Amorim G, Camm CF, Gajendragadkar P, et al. Admission of patients with STEMI since the outbreak of the COVID-19 pandemic: a survey by the European Society of Cardiology. Eur Heart J Qual Care Clin Outcomes. 2020;6(3):210-216. doi:10.1093/ehjqcco/qcaa046
A Fixed Drug Eruption to Medroxyprogesterone Acetate Injectable Suspension
To the Editor:
A fixed drug eruption (FDE) is a well-documented form of cutaneous hypersensitivity that typically manifests as a sharply demarcated, dusky, round to oval, edematous, red-violaceous macule or patch on the skin and mucous membranes. The lesion often resolves with residual postinflammatory hyperpigmentation, most commonly as a reaction to ingested drugs or drug components.1 Lesions generally occur at the same anatomic site with repeated exposure to the offending drug. Typically, a single site is affected, but additional sites with more generalized involvement have been reported to occur with subsequent exposure to the offending medication. The diagnosis usually is clinical, but histopathologic findings can help confirm the diagnosis in unusual presentations. We present a novel case of a patient with an FDE from medroxyprogesterone acetate, a contraceptive injection that contains the hormone progestin.
A 35-year-old woman presented to the dermatology clinic for evaluation of a lesion on the left lower buttock of 1 year’s duration. She reported periodic swelling and associated pruritus of the lesion. She denied any growth in size, and no other similar lesions were present. The patient reported a medication history of medroxyprogesterone acetate for birth control, but she denied any other prescription or over-the-counter medication, oral supplements, or recreational drug use. Upon further inquiry, she reported that the recurrence of symptoms appeared to coincide with each administration of medroxyprogesterone acetate, which occurred approximately every 3 months. The eruption cleared between injections and recurred in the same location following subsequent injections. The lesion appeared approximately 2 weeks after the first injection (approximately 1 year prior to presentation to dermatology) and within 2 to 3 days after each subsequent injection. Physical examination revealed a 2×2-cm, circular, slightly violaceous patch on the left buttock (Figure 1). A biopsy was recommended to aid in diagnosis, and the patient was offered a topical steroid for symptomatic relief. A punch biopsy revealed subtle interface dermatitis with superficial perivascular lymphoid infiltrate and marked pigmentary incontinence consistent with an FDE (Figure 2).

An FDE was first reported in 1889 by Bourns,2 and over time more implicated agents and varying clinical presentations have been linked to the disease. The FDE can be accompanied by symptoms of pruritus or paresthesia. Most cases are devoid of systemic symptoms. An FDE can be located anywhere on the body, but it most frequently manifests on the lips, face, hands, feet, and genitalia. Although the eruption often heals with residual postinflammatory hyperpigmentation, a nonpigmenting FDE due to pseudoephedrine has been reported.3

Common culprits include antibiotics (eg, sulfonamides, trimethoprim, fluoroquinolones, tetracyclines), nonsteroidal anti-inflammatory medications (eg, naproxen sodium, ibuprofen, celecoxib), barbiturates, antimalarials, and anticonvulsants. Rare cases of FDE induced by foods and food additives also have been reported.4 Oral fluconazole, levocetirizine dihydrochloride, loperamide, and multivitamin-mineral preparations are other rare inducers of FDE.5-8 In 2004, Ritter and Meffert9 described an FDE to the green dye used in inactive oral contraceptive pills. A similar case was reported by Rea et al10 that described an FDE from the inactive sugar pills in ethinyl estradiol and levonorgestrel, which is another combined oral contraceptive.
The time between ingestion of the offending agent and the manifestation of the disease usually is 1 to 2 weeks; however, upon subsequent exposure, the disease has been reported to manifest within hours.1 CD8+ memory T cells have been shown to be major players in the development of FDE and can be found along the dermoepidermal junction as part of a delayed type IV hypersensitivity reaction.11 Histopathology reveals superficial and deep interstitial and perivascular infiltrates consisting of lymphocytes with admixed eosinophils and possibly neutrophils in the dermis. In the epidermis, necrotic keratinocytes can be present. In rare cases, FDE may have atypical features, such as in generalized bullous FDE and nonpigmenting FDE, the latter of which more commonly is associated with pseudoephedrine.1
The differential diagnosis for FDE includes erythema multiforme, Stevens-Johnson syndrome/toxic epidermal necrolysis, autoimmune progesterone dermatitis, and large plaque parapsoriasis. The number and morphology of lesions in erythema multiforme help differentiate it from FDE, as erythema multiforme presents with multiple targetoid lesions. The lesions of generalized bullous FDE can be similar to those of Stevens-Johnson syndrome/toxic epidermal necrolysis, and the pigmented patches of FDE can resemble large plaque parapsoriasis.
It is important to consider any medication ingested in the 1- to 2-week period before FDE onset, including over-the-counter medications, health food supplements, and prescription medications. Discontinuation of the implicated medication or any medication potentially cross-reacting with another medication is the most important step in management. Wound care may be needed for any bullous or eroded lesions. Lesions typically resolve within a few days to weeks of stopping the offending agent. Importantly, patients should be counseled on the secondary pigment alterations that may be persistent for several months. Other treatment for FDEs is aimed at symptomatic relief and may include topical corticosteroids and oral antihistamines.1
Medroxyprogesterone acetate is a highly effective contraceptive drug with low rates of failure.12 It is a weak androgenic progestin that is administered as a single 150-mg intramuscular injection every 3 months and inhibits gonadotropins. Common side effects include local injection-site reactions, unscheduled bleeding, amenorrhea, weight gain, headache, and mood changes. However, FDE has not been reported as an adverse effect to medroxyprogesterone acetate, both in official US Food and Drug Administration information and in the current literature.12
Autoimmune progesterone dermatitis (also known as progestin hypersensitivity) is a well-characterized cyclic hypersensitivity reaction to the hormone progesterone that occurs during the luteal phase of the menstrual cycle. It is known to have a variable clinical presentation including urticaria, erythema multiforme, eczema, and angioedema.13 Autoimmune progesterone dermatitis also has been reported to present as an FDE.14-16 The onset of the cutaneous manifestation often starts a few days before the onset of menses, with spontaneous resolution occurring after the onset of menstruation. The mechanism by which endogenous progesterone or other secretory products become antigenic is unknown. It has been suggested that there is an alteration in the properties of the hormone that would predispose it to be antigenic as it would not be considered self. In 2001, Warin17 proposed the following diagnostic criteria for autoimmune progesterone dermatitis: (1) skin lesions associated with menstrual cycle (premenstrual flare); (2) a positive response to the progesterone intradermal or intramuscular test; and (3) symptomatic improvement after inhibiting progesterone secretion by suppressing ovulation.17 The treatment includes antiallergy medications, progesterone desensitization, omalizumab injection, and leuprolide acetate injection.
Our case represents FDE from medroxyprogesterone acetate. Although we did not formally investigate the antigenicity of the exogenous progesterone, we postulate that the pathophysiology likely is similar to an FDE associated with endogenous progesterone. This reasoning is supported by the time course of the patient’s lesion as well as the worsening of symptoms in the days following the administration of the medication. Additionally, the patient had no history of skin lesions prior to the initiation of medroxyprogesterone acetate or similar lesions associated with her menstrual cycles.
A careful and detailed review of medication history is necessary to evaluate FDEs. Our case emphasizes that not only endogenous but also exogenous forms of progesterone may cause hypersensitivity, leading to an FDE. With more than 2 million prescriptions of medroxyprogesterone acetate written every year, dermatologists should be aware of the rare but potential risk for an FDE in patients using this medication.18
- Bolognia J, Jorizzo JL, Rapini RP. Dermatology. 2nd ed. Mosby; 2008.
- Bourns DCG. Unusual effects of antipyrine. Br Med J. 1889;2:818-820.
- Shelley WB, Shelley ED. Nonpigmenting fixed drug eruption as a distinctive reaction pattern: examples caused by sensitivity to pseudoephedrine hydrochloride and tetrahydrozoline. J Am Acad Dermatol. 1987;17:403-407.
- Sohn KH, Kim BK, Kim JY, et al. Fixed food eruption caused by Actinidia arguta (hardy kiwi): a case report and literature review. Allergy Asthma Immunol Res. 2017;9:182-184.
- Nakai N, Katoh N. Fixed drug eruption caused by fluconazole: a case report and mini-review of the literature. Allergol Int. 2013;6:139-141.
- An I, Demir V, Ibiloglu I, et al. Fixed drug eruption induced by levocetirizine. Indian Dermatol Online J. 2017;8:276-278.
- Matarredona J, Borrás Blasco J, Navarro-Ruiz A, et al. Fixed drug eruption associated to loperamide [in Spanish]. Med Clin (Barc). 2005;124:198-199.
- Gohel D. Fixed drug eruption due to multi-vitamin multi-mineral preparation. J Assoc Physicians India. 2000;48:268.
- Ritter SE, Meffert J. A refractory fixed drug reaction to a dye used in an oral contraceptive. Cutis. 2004;74:243-244.
- Rea S, McMeniman E, Darch K, et al. A fixed drug eruption to the sugar pills of a combined oral contraceptive. Poster presented at: The Australasian College of Dermatologists 51st Annual Scientific Meeting; May 22, 2018; Queensland, Australia.
- Shiohara T, Mizukawa Y. Fixed drug eruption: a disease mediated by self-inflicted responses of intraepidermal T cells. Eur J Dermatol. 2007;17:201-208.
- Depo-Provera CI. Prescribing information. Pfizer; 2020. Accessed March 10, 2022. https://labeling.pfizer.com/ShowLabeling.aspx?format=PDF&id=522
- George R, Badawy SZ. Autoimmune progesterone dermatitis: a case report. Case Rep Obstet Gynecol. 2012;2012:757854.
- Mokhtari R, Sepaskhah M, Aslani FS, et al. Autoimmune progesterone dermatitis presenting as fixed drug eruption: a case report. Dermatol Online J. 2017;23:13030/qt685685p4.
- Asai J, Katoh N, Nakano M, et al. Case of autoimmune progesterone dermatitis presenting as fixed drug eruption. J Dermatol. 2009;36:643-645.
- Bhardwaj N, Jindal R, Chauhan P. Autoimmune progesterone dermatitis presenting as fixed drug eruption. BMJ Case Rep. 2019;12:E231873.
- Warin AP. Case 2. diagnosis: erythema multiforme as a presentation of autoimmune progesterone dermatitis. Clin Exp Dermatol. 2001;26:107-108.
- Medroxyprogesterone Drug Usage Statistics, United States, 2013-2019. ClinCalc website. Updated September 15, 2021. Accessed March 17, 2022. https://clincalc.com/DrugStats/Drugs/Medroxyprogesterone
To the Editor:
A fixed drug eruption (FDE) is a well-documented form of cutaneous hypersensitivity that typically manifests as a sharply demarcated, dusky, round to oval, edematous, red-violaceous macule or patch on the skin and mucous membranes. The lesion often resolves with residual postinflammatory hyperpigmentation, most commonly as a reaction to ingested drugs or drug components.1 Lesions generally occur at the same anatomic site with repeated exposure to the offending drug. Typically, a single site is affected, but additional sites with more generalized involvement have been reported to occur with subsequent exposure to the offending medication. The diagnosis usually is clinical, but histopathologic findings can help confirm the diagnosis in unusual presentations. We present a novel case of a patient with an FDE from medroxyprogesterone acetate, a contraceptive injection that contains the hormone progestin.
A 35-year-old woman presented to the dermatology clinic for evaluation of a lesion on the left lower buttock of 1 year’s duration. She reported periodic swelling and associated pruritus of the lesion. She denied any growth in size, and no other similar lesions were present. The patient reported a medication history of medroxyprogesterone acetate for birth control, but she denied any other prescription or over-the-counter medication, oral supplements, or recreational drug use. Upon further inquiry, she reported that the recurrence of symptoms appeared to coincide with each administration of medroxyprogesterone acetate, which occurred approximately every 3 months. The eruption cleared between injections and recurred in the same location following subsequent injections. The lesion appeared approximately 2 weeks after the first injection (approximately 1 year prior to presentation to dermatology) and within 2 to 3 days after each subsequent injection. Physical examination revealed a 2×2-cm, circular, slightly violaceous patch on the left buttock (Figure 1). A biopsy was recommended to aid in diagnosis, and the patient was offered a topical steroid for symptomatic relief. A punch biopsy revealed subtle interface dermatitis with superficial perivascular lymphoid infiltrate and marked pigmentary incontinence consistent with an FDE (Figure 2).
An FDE was first reported in 1889 by Bourns,2 and over time more implicated agents and varying clinical presentations have been linked to the disease. The FDE can be accompanied by symptoms of pruritus or paresthesia. Most cases are devoid of systemic symptoms. An FDE can be located anywhere on the body, but it most frequently manifests on the lips, face, hands, feet, and genitalia. Although the eruption often heals with residual postinflammatory hyperpigmentation, a nonpigmenting FDE due to pseudoephedrine has been reported.3
Common culprits include antibiotics (eg, sulfonamides, trimethoprim, fluoroquinolones, tetracyclines), nonsteroidal anti-inflammatory medications (eg, naproxen sodium, ibuprofen, celecoxib), barbiturates, antimalarials, and anticonvulsants. Rare cases of FDE induced by foods and food additives also have been reported.4 Oral fluconazole, levocetirizine dihydrochloride, loperamide, and multivitamin-mineral preparations are other rare inducers of FDE.5-8 In 2004, Ritter and Meffert9 described an FDE to the green dye used in inactive oral contraceptive pills. A similar case was reported by Rea et al10 that described an FDE from the inactive sugar pills in ethinyl estradiol and levonorgestrel, which is another combined oral contraceptive.
The time between ingestion of the offending agent and the manifestation of the disease usually is 1 to 2 weeks; however, upon subsequent exposure, the disease has been reported to manifest within hours.1 CD8+ memory T cells have been shown to be major players in the development of FDE and can be found along the dermoepidermal junction as part of a delayed type IV hypersensitivity reaction.11 Histopathology reveals superficial and deep interstitial and perivascular infiltrates consisting of lymphocytes with admixed eosinophils and possibly neutrophils in the dermis. In the epidermis, necrotic keratinocytes can be present. In rare cases, FDE may have atypical features, such as in generalized bullous FDE and nonpigmenting FDE, the latter of which more commonly is associated with pseudoephedrine.1
The differential diagnosis for FDE includes erythema multiforme, Stevens-Johnson syndrome/toxic epidermal necrolysis, autoimmune progesterone dermatitis, and large plaque parapsoriasis. The number and morphology of lesions in erythema multiforme help differentiate it from FDE, as erythema multiforme presents with multiple targetoid lesions. The lesions of generalized bullous FDE can be similar to those of Stevens-Johnson syndrome/toxic epidermal necrolysis, and the pigmented patches of FDE can resemble large plaque parapsoriasis.
It is important to consider any medication ingested in the 1- to 2-week period before FDE onset, including over-the-counter medications, health food supplements, and prescription medications. Discontinuation of the implicated medication or any medication potentially cross-reacting with another medication is the most important step in management. Wound care may be needed for any bullous or eroded lesions. Lesions typically resolve within a few days to weeks of stopping the offending agent. Importantly, patients should be counseled on the secondary pigment alterations that may be persistent for several months. Other treatment for FDEs is aimed at symptomatic relief and may include topical corticosteroids and oral antihistamines.1
Medroxyprogesterone acetate is a highly effective contraceptive drug with low rates of failure.12 It is a weak androgenic progestin that is administered as a single 150-mg intramuscular injection every 3 months and inhibits gonadotropins. Common side effects include local injection-site reactions, unscheduled bleeding, amenorrhea, weight gain, headache, and mood changes. However, FDE has not been reported as an adverse effect to medroxyprogesterone acetate, both in official US Food and Drug Administration information and in the current literature.12
Autoimmune progesterone dermatitis (also known as progestin hypersensitivity) is a well-characterized cyclic hypersensitivity reaction to the hormone progesterone that occurs during the luteal phase of the menstrual cycle. It is known to have a variable clinical presentation including urticaria, erythema multiforme, eczema, and angioedema.13 Autoimmune progesterone dermatitis also has been reported to present as an FDE.14-16 The onset of the cutaneous manifestation often starts a few days before the onset of menses, with spontaneous resolution occurring after the onset of menstruation. The mechanism by which endogenous progesterone or other secretory products become antigenic is unknown. It has been suggested that there is an alteration in the properties of the hormone that would predispose it to be antigenic as it would not be considered self. In 2001, Warin17 proposed the following diagnostic criteria for autoimmune progesterone dermatitis: (1) skin lesions associated with menstrual cycle (premenstrual flare); (2) a positive response to the progesterone intradermal or intramuscular test; and (3) symptomatic improvement after inhibiting progesterone secretion by suppressing ovulation.17 The treatment includes antiallergy medications, progesterone desensitization, omalizumab injection, and leuprolide acetate injection.
Our case represents FDE from medroxyprogesterone acetate. Although we did not formally investigate the antigenicity of the exogenous progesterone, we postulate that the pathophysiology likely is similar to an FDE associated with endogenous progesterone. This reasoning is supported by the time course of the patient’s lesion as well as the worsening of symptoms in the days following the administration of the medication. Additionally, the patient had no history of skin lesions prior to the initiation of medroxyprogesterone acetate or similar lesions associated with her menstrual cycles.
A careful and detailed review of medication history is necessary to evaluate FDEs. Our case emphasizes that not only endogenous but also exogenous forms of progesterone may cause hypersensitivity, leading to an FDE. With more than 2 million prescriptions of medroxyprogesterone acetate written every year, dermatologists should be aware of the rare but potential risk for an FDE in patients using this medication.18
- Bolognia J, Jorizzo JL, Rapini RP. Dermatology. 2nd ed. Mosby; 2008.
- Bourns DCG. Unusual effects of antipyrine. Br Med J. 1889;2:818-820.
- Shelley WB, Shelley ED. Nonpigmenting fixed drug eruption as a distinctive reaction pattern: examples caused by sensitivity to pseudoephedrine hydrochloride and tetrahydrozoline. J Am Acad Dermatol. 1987;17:403-407.
- Sohn KH, Kim BK, Kim JY, et al. Fixed food eruption caused by Actinidia arguta (hardy kiwi): a case report and literature review. Allergy Asthma Immunol Res. 2017;9:182-184.
- Nakai N, Katoh N. Fixed drug eruption caused by fluconazole: a case report and mini-review of the literature. Allergol Int. 2013;6:139-141.
- An I, Demir V, Ibiloglu I, et al. Fixed drug eruption induced by levocetirizine. Indian Dermatol Online J. 2017;8:276-278.
- Matarredona J, Borrás Blasco J, Navarro-Ruiz A, et al. Fixed drug eruption associated to loperamide [in Spanish]. Med Clin (Barc). 2005;124:198-199.
- Gohel D. Fixed drug eruption due to multi-vitamin multi-mineral preparation. J Assoc Physicians India. 2000;48:268.
- Ritter SE, Meffert J. A refractory fixed drug reaction to a dye used in an oral contraceptive. Cutis. 2004;74:243-244.
- Rea S, McMeniman E, Darch K, et al. A fixed drug eruption to the sugar pills of a combined oral contraceptive. Poster presented at: The Australasian College of Dermatologists 51st Annual Scientific Meeting; May 22, 2018; Queensland, Australia.
- Shiohara T, Mizukawa Y. Fixed drug eruption: a disease mediated by self-inflicted responses of intraepidermal T cells. Eur J Dermatol. 2007;17:201-208.
- Depo-Provera CI. Prescribing information. Pfizer; 2020. Accessed March 10, 2022. https://labeling.pfizer.com/ShowLabeling.aspx?format=PDF&id=522
- George R, Badawy SZ. Autoimmune progesterone dermatitis: a case report. Case Rep Obstet Gynecol. 2012;2012:757854.
- Mokhtari R, Sepaskhah M, Aslani FS, et al. Autoimmune progesterone dermatitis presenting as fixed drug eruption: a case report. Dermatol Online J. 2017;23:13030/qt685685p4.
- Asai J, Katoh N, Nakano M, et al. Case of autoimmune progesterone dermatitis presenting as fixed drug eruption. J Dermatol. 2009;36:643-645.
- Bhardwaj N, Jindal R, Chauhan P. Autoimmune progesterone dermatitis presenting as fixed drug eruption. BMJ Case Rep. 2019;12:E231873.
- Warin AP. Case 2. diagnosis: erythema multiforme as a presentation of autoimmune progesterone dermatitis. Clin Exp Dermatol. 2001;26:107-108.
- Medroxyprogesterone Drug Usage Statistics, United States, 2013-2019. ClinCalc website. Updated September 15, 2021. Accessed March 17, 2022. https://clincalc.com/DrugStats/Drugs/Medroxyprogesterone
Practice Points
- Exogenous progesterone from the administration of the contraceptive injectable medroxyprogesterone acetate has the potential to cause a cutaneous hypersensitivity reaction in the form of a fixed drug eruption (FDE).
- Dermatologists should perform a careful and detailed review of medication history to evaluate drug eruptions.
