User login
Developing and Measuring Effectiveness of a Distance Learning Dermatology Course: A Prospective Observational Study
Medical education has seen major changes over the last decade. The allotted time for preclinical education has decreased from 24 months to 18 months or less at most institutions, with an increased focus on content associated with health care delivery and health system science.1,2 Many schools now include at least some blended learning with online delivery of preclinical education.3 On the other hand, the clinical portion of medical education has remained largely unchanged prior to the COVID-19 pandemic, with the apprenticeship framework allowing the experienced physician to observe, mentor, and pass on practical knowledge so that the apprentice can one day gain independence after demonstrating adequate proficiency.4
With respect to dermatology education, skin disorders are in the top 5 reported reasons for visits to primary care5; however, a 2009 survey found that only 0.24% to 0.30% of medical schools’ curricula are spent on dermatology.6 Moreover, one institution found that fourth-year medical students received an average of 46.6% on a 15-item quiz designed to assess the ability to diagnose and treat common dermatologic conditions, and within that same cohort, 87.6% of students felt that they received inadequate training in dermatology during medical school.7
COVID-19 caused an unprecedented paradigm shift when medical schools throughout the country, including our own, canceled clinical rotations at the end of March 2020 to protect students and control the spread of infection. To enable clinical and preclinical learning to continue, institutions around the globe turned to either online learning or participation in telehealth as a substitute for clinical rotations.8-10 At the Uniformed Services University of the Health Sciences (Bethesda, Maryland), one of the many online clinical courses offered included a distance learning (DL) dermatology course. Herein, we describe the results of a prospective study evaluating short-term information recall and comprehension as well as students’ confidence in their ability to apply course objectives over 3 months of an online DL dermatology course.
Methods
Between April and July 2020, 14 students at the Uniformed Services University of the Health Sciences (Table 1) enrolled in 1 of 3 four-week DL dermatology classes. The students independently completed the Basic Dermatology Curriculum, a set of online modules with demonstrated efficacy from the American Academy of Dermatology, over 4 weeks.11 Additionally, students were instructed to review an hour of clinical dermatology images daily from online dermatology atlases and e-books accessed through our medical school’s virtual library. Optional Free Open Access Meducation resources also were provided. The course syllabus provided the students with clear expectations, links to the resources, and a recommended daily schedule.

An online video conferencing platform was utilized for an orientation session and 4 subsequent weekly 1.5-hour virtual meetings. The weekly DL meetings focused on a discussion of clinical images pertinent to the American Academy of Dermatology modules covered for the week. These interactive analytic sessions were referred to as Clinpic sessions. With instructor guidance, the students learned to describe images, and they provided differential diagnoses, workup, and treatments for various skin diseases. The virtual meetings included supplemental lectures detailing the use of teledermatology and laser therapy in the Military Health System and a journal review on the cutaneous manifestations of COVID-19.
A 40-question, image-based pretest and posttest utilized during clinical rotations evaluated knowledge recall and comprehension. A precourse and postcourse survey using a 5-point Likert scale (1=not confident; 5=extremely confident) assessed students’ confidence levels across course objectives: general knowledge of dermatology, working knowledge of teledermatology, ability to accurately describe skin lesions, generate sound differential diagnoses, and formulate a reasonable treatment plan. Statistical analysis was performed using free online statistical software at statskingdom.com.12
Results
All 14 student enrollees completed the precourse and postcourse tests and surveys. Pretest and posttest scores followed a normal distribution and therefore met criteria for utilization of a parametric test. The precourse test average of 67% (range, 40%–90%) improved to 84% postcourse (range, 70%–98%; P<.001; 95% CI, 11-23 by paired t test). Not surprisingly, the 2 students who had completed a dermatology rotation had higher average pretest and posttest scores (pretest, 87%; posttest, 94%). Students’ confidence with the course objectives were mostly at the somewhat confident level on the 5-point Likert scale precourse survey. By the end of the course, student survey responses increased to confident and very confident levels, corresponding to an overall improvement of 1.3 points (P<.001 by paired t test)(Table 2) when the mean of the survey results was aggregated across every question. Instructor evaluation of student performance mirrored student assessments.

Comment
The DL dermatology course succeeded in helping the enrolled students attain course objectives and offered a reasonable solution when in-person interaction was restricted. The students in the DL course made notable improvements in their dermatology knowledge and improved their communication, diagnosis, and management skills. Although a blended dermatology curriculum with e-learning combined with clinical experience has been shown to increase knowledge acquisition,13,14 our results suggest that an online-only program also can increase comprehension as well as students’ confidence in their abilities.
A major challenge for the DL course was the lack of opportunity to perform common dermatology procedures. The addition of a hands-on skin procedure module would have been a great supplement to the course but was not possible due to social distancing guidelines during the COVID-19 pandemic. The small sample size and voluntary enrollment were limitations to this study.
Conclusion
Although the traditional dermatology rotation remains the gold standard for clinical instruction, a well-organized DL teaching environment allowed for a more controlled learning experience with a broader coverage of topics to include potentially greater exposure to rare skin disorders not typically encountered in everyday practice. A DL dermatology course may serve as an enduring curriculum for those who wish to learn dermatology more broadly and are not interested in performing skin procedures or direct patient exposure (eg, those pursuing non–primary care specialties, pathology, or radiology). It also may be attractive to students who have had a prior clinical dermatology rotation and desire a different learning experience with a wide coverage of topics.
Acknowledgments—The authors thank Thomas Darling, MD, PhD (Bethesda, Maryland), for coining the term Clinpic and providing critical feedback throughout the course. The authors also thank Sorana Raiciulescu, MS (Bethesda, Maryland), for assistance with the statistical analysis.
- Emanuel EJ. The inevitable reimagining of medical education. JAMA. 2020;323:1127-1128.
- Skochelak SE, Stack SJ. Creating the medical schools of the future. Acad Med. 2017;92:16-19.
- Vallée A, Blacher J, Cariou A, et al. Blended learning compared to traditional learning in medical education: systematic review and meta-analysis. J Med Internet Res. 2020;22:E16504.
- Rangachari D, Brown LE, Kern DE, et al. Clinical coaching: evolving the apprenticeship model for modern housestaff. Med Teach. 2017;39:780-782.
- Finley CR, Chan DS, Garrison S, et al. What are the most common conditions in primary care? Can Fam Physician. 2018;64:832-840.
- McCleskey PE, Gilson RT, DeVillez RL. Medical student core curriculum in dermatology survey. J Am Acad Dermatol. 2009;61:30-35.e4.
- Ulman CA, Binder SB, Borges NJ. Assessment of medical students’ proficiency in dermatology: are medical students adequately prepared to diagnose and treat common dermatologic conditions in the United States? J Educ Eval Health Prof. 2015;12:18.
- Loh TY, Hsiao JL, Shi VY. COVID-19 and its effect on medical student education in dermatology. J Am Acad Dermatol. 2020;83:E163-E164.
- Hilburg R, Patel N, Ambruso S, et al. Medical education during the coronavirus disease-2019 pandemic: learning from a distance. Adv Chronic Kidney Dis. 2020;27:412-417.
- Rose S. Medical student education in the time of COVID-19. JAMA. 2020;323:2131-2132.
- McCleskey PE. Clinic teaching made easy: a prospective study of the American Academy of Dermatology core curriculum in primary care learners. J Am Acad Dermatol. 2013;69:273-279.e1.
- Paired T Test calculator. Statistics Kingdom website. Accessed February 7, 2022. http://www.statskingdom.com/160MeanT2pair.html
- Fransen F, Martens H, Nagtzaam I, et al. Use of e-learning in clinical clerkships: effects on acquisition of dermatological knowledge and learning processes. Int J Med Educ. 2018;9:11-17.
- Silva CS, Souza MB, Silva Filho RS, et al. E-learning program for medical students in dermatology. Clinics. 2011;66:619-622.
Medical education has seen major changes over the last decade. The allotted time for preclinical education has decreased from 24 months to 18 months or less at most institutions, with an increased focus on content associated with health care delivery and health system science.1,2 Many schools now include at least some blended learning with online delivery of preclinical education.3 On the other hand, the clinical portion of medical education has remained largely unchanged prior to the COVID-19 pandemic, with the apprenticeship framework allowing the experienced physician to observe, mentor, and pass on practical knowledge so that the apprentice can one day gain independence after demonstrating adequate proficiency.4
With respect to dermatology education, skin disorders are in the top 5 reported reasons for visits to primary care5; however, a 2009 survey found that only 0.24% to 0.30% of medical schools’ curricula are spent on dermatology.6 Moreover, one institution found that fourth-year medical students received an average of 46.6% on a 15-item quiz designed to assess the ability to diagnose and treat common dermatologic conditions, and within that same cohort, 87.6% of students felt that they received inadequate training in dermatology during medical school.7
COVID-19 caused an unprecedented paradigm shift when medical schools throughout the country, including our own, canceled clinical rotations at the end of March 2020 to protect students and control the spread of infection. To enable clinical and preclinical learning to continue, institutions around the globe turned to either online learning or participation in telehealth as a substitute for clinical rotations.8-10 At the Uniformed Services University of the Health Sciences (Bethesda, Maryland), one of the many online clinical courses offered included a distance learning (DL) dermatology course. Herein, we describe the results of a prospective study evaluating short-term information recall and comprehension as well as students’ confidence in their ability to apply course objectives over 3 months of an online DL dermatology course.
Methods
Between April and July 2020, 14 students at the Uniformed Services University of the Health Sciences (Table 1) enrolled in 1 of 3 four-week DL dermatology classes. The students independently completed the Basic Dermatology Curriculum, a set of online modules with demonstrated efficacy from the American Academy of Dermatology, over 4 weeks.11 Additionally, students were instructed to review an hour of clinical dermatology images daily from online dermatology atlases and e-books accessed through our medical school’s virtual library. Optional Free Open Access Meducation resources also were provided. The course syllabus provided the students with clear expectations, links to the resources, and a recommended daily schedule.
An online video conferencing platform was utilized for an orientation session and 4 subsequent weekly 1.5-hour virtual meetings. The weekly DL meetings focused on a discussion of clinical images pertinent to the American Academy of Dermatology modules covered for the week. These interactive analytic sessions were referred to as Clinpic sessions. With instructor guidance, the students learned to describe images, and they provided differential diagnoses, workup, and treatments for various skin diseases. The virtual meetings included supplemental lectures detailing the use of teledermatology and laser therapy in the Military Health System and a journal review on the cutaneous manifestations of COVID-19.
A 40-question, image-based pretest and posttest utilized during clinical rotations evaluated knowledge recall and comprehension. A precourse and postcourse survey using a 5-point Likert scale (1=not confident; 5=extremely confident) assessed students’ confidence levels across course objectives: general knowledge of dermatology, working knowledge of teledermatology, ability to accurately describe skin lesions, generate sound differential diagnoses, and formulate a reasonable treatment plan. Statistical analysis was performed using free online statistical software at statskingdom.com.12
Results
All 14 student enrollees completed the precourse and postcourse tests and surveys. Pretest and posttest scores followed a normal distribution and therefore met criteria for utilization of a parametric test. The precourse test average of 67% (range, 40%–90%) improved to 84% postcourse (range, 70%–98%; P<.001; 95% CI, 11-23 by paired t test). Not surprisingly, the 2 students who had completed a dermatology rotation had higher average pretest and posttest scores (pretest, 87%; posttest, 94%). Students’ confidence with the course objectives were mostly at the somewhat confident level on the 5-point Likert scale precourse survey. By the end of the course, student survey responses increased to confident and very confident levels, corresponding to an overall improvement of 1.3 points (P<.001 by paired t test)(Table 2) when the mean of the survey results was aggregated across every question. Instructor evaluation of student performance mirrored student assessments.
Comment
The DL dermatology course succeeded in helping the enrolled students attain course objectives and offered a reasonable solution when in-person interaction was restricted. The students in the DL course made notable improvements in their dermatology knowledge and improved their communication, diagnosis, and management skills. Although a blended dermatology curriculum with e-learning combined with clinical experience has been shown to increase knowledge acquisition,13,14 our results suggest that an online-only program also can increase comprehension as well as students’ confidence in their abilities.
A major challenge for the DL course was the lack of opportunity to perform common dermatology procedures. The addition of a hands-on skin procedure module would have been a great supplement to the course but was not possible due to social distancing guidelines during the COVID-19 pandemic. The small sample size and voluntary enrollment were limitations to this study.
Conclusion
Although the traditional dermatology rotation remains the gold standard for clinical instruction, a well-organized DL teaching environment allowed for a more controlled learning experience with a broader coverage of topics to include potentially greater exposure to rare skin disorders not typically encountered in everyday practice. A DL dermatology course may serve as an enduring curriculum for those who wish to learn dermatology more broadly and are not interested in performing skin procedures or direct patient exposure (eg, those pursuing non–primary care specialties, pathology, or radiology). It also may be attractive to students who have had a prior clinical dermatology rotation and desire a different learning experience with a wide coverage of topics.
Acknowledgments—The authors thank Thomas Darling, MD, PhD (Bethesda, Maryland), for coining the term Clinpic and providing critical feedback throughout the course. The authors also thank Sorana Raiciulescu, MS (Bethesda, Maryland), for assistance with the statistical analysis.
- Emanuel EJ. The inevitable reimagining of medical education. JAMA. 2020;323:1127-1128.
- Skochelak SE, Stack SJ. Creating the medical schools of the future. Acad Med. 2017;92:16-19.
- Vallée A, Blacher J, Cariou A, et al. Blended learning compared to traditional learning in medical education: systematic review and meta-analysis. J Med Internet Res. 2020;22:E16504.
- Rangachari D, Brown LE, Kern DE, et al. Clinical coaching: evolving the apprenticeship model for modern housestaff. Med Teach. 2017;39:780-782.
- Finley CR, Chan DS, Garrison S, et al. What are the most common conditions in primary care? Can Fam Physician. 2018;64:832-840.
- McCleskey PE, Gilson RT, DeVillez RL. Medical student core curriculum in dermatology survey. J Am Acad Dermatol. 2009;61:30-35.e4.
- Ulman CA, Binder SB, Borges NJ. Assessment of medical students’ proficiency in dermatology: are medical students adequately prepared to diagnose and treat common dermatologic conditions in the United States? J Educ Eval Health Prof. 2015;12:18.
- Loh TY, Hsiao JL, Shi VY. COVID-19 and its effect on medical student education in dermatology. J Am Acad Dermatol. 2020;83:E163-E164.
- Hilburg R, Patel N, Ambruso S, et al. Medical education during the coronavirus disease-2019 pandemic: learning from a distance. Adv Chronic Kidney Dis. 2020;27:412-417.
- Rose S. Medical student education in the time of COVID-19. JAMA. 2020;323:2131-2132.
- McCleskey PE. Clinic teaching made easy: a prospective study of the American Academy of Dermatology core curriculum in primary care learners. J Am Acad Dermatol. 2013;69:273-279.e1.
- Paired T Test calculator. Statistics Kingdom website. Accessed February 7, 2022. http://www.statskingdom.com/160MeanT2pair.html
- Fransen F, Martens H, Nagtzaam I, et al. Use of e-learning in clinical clerkships: effects on acquisition of dermatological knowledge and learning processes. Int J Med Educ. 2018;9:11-17.
- Silva CS, Souza MB, Silva Filho RS, et al. E-learning program for medical students in dermatology. Clinics. 2011;66:619-622.
Practice Points
- An e-learning distance learning (DL) dermatology course can substantially improve clinically relevant skills and knowledge in dermatology.
- A DL dermatology course may serve as an alternative to clinical rotations for those who wish to learn dermatology more broadly and are not interested in performing skin procedures or direct patient exposure.
Study: Physical fitness in children linked with concentration, quality of life
The findings of the German study involving more than 6,500 kids emphasize the importance of cardiorespiratory health in childhood, and support physical fitness initiatives in schools, according to lead author Katharina Köble, MSc, of the Technical University of Munich (Germany), and colleagues.
“Recent studies show that only a few children meet the recommendations of physical activity,” the investigators wrote in Journal of Clinical Medicine.
While the health benefits of physical activity are clearly documented, Ms. Köble and colleagues noted that typical measures of activity, such as accelerometers or self-reported questionnaires, are suboptimal research tools.
“Physical fitness is a more objective parameter to quantify when evaluating health promotion,” the investigators wrote. “Furthermore, cardiorespiratory fitness as part of physical fitness is more strongly related to risk factors of cardiovascular disease than physical activity.”
According to the investigators, physical fitness has also been linked with better concentration and HRQOL, but never in the same population of children.
The new study aimed to address this knowledge gap by assessing 6,533 healthy children aged 6-10 years, approximately half boys and half girls. Associations between physical fitness, concentration, and HRQOL were evaluated using multiple linear regression analysis in participants aged 9-10 years.
Physical fitness was measured using a series of challenges, including curl-ups (pull-ups with palms facing body), push-ups, standing long jump, handgrip strength measurement, and Progressive Aerobic Cardiovascular Endurance Run (PACER). Performing the multistage shuttle run, PACER, “requires participants to maintain the pace set by an audio signal, which progressively increases the intensity every minute.” Results of the PACER test were used to estimate VO2max.
Concentration was measured using the d2-R test, “a paper-pencil cancellation test, where subjects have to cross out all ‘d’ letters with two dashes under a time limit.”
HRQOL was evaluated with the KINDL questionnaire, which covers emotional well-being, physical well-being, everyday functioning (school), friends, family, and self-esteem.
Analysis showed that physical fitness improved with age (P < .001), except for VO2max in girls (P = .129). Concentration also improved with age (P < .001), while HRQOL did not (P = .179).
Among children aged 9-10 years, VO2max scores were strongly associated with both HRQOL (P < .001) and concentration (P < .001).
“VO2max was found to be one of the main factors influencing concentration levels and HRQOL dimensions in primary school children,” the investigators wrote. “Physical fitness, especially cardiorespiratory performance, should therefore be promoted more specifically in school settings to support the promotion of an overall healthy lifestyle in children and adolescents.”
Findings are having a real-word impact, according to researcher
In an interview, Ms. Köble noted that the findings are already having a real-world impact.
“We continued data assessment in the long-term and specifically adapted prevention programs in school to the needs of the school children we identified in our study,” she said. “Schools are partially offering specific movement and nutrition classes now.”
In addition, Ms. Köble and colleagues plan on educating teachers about the “urgent need for sufficient physical activity.”
“Academic performance should be considered as an additional health factor in future studies, as well as screen time and eating patterns, as all those variables showed interactions with physical fitness and concentration. In a subanalysis, we showed that children with better physical fitness and concentration values were those who usually went to higher education secondary schools,” they wrote.
VO2max did not correlate with BMI
Gregory Weaver, MD, a pediatrician at Cleveland Clinic Children’s, voiced some concerns about the reliability of the findings. He noted that VO2max did not correlate with body mass index or other measures of physical fitness, and that using the PACER test to estimate VO2max may have skewed the association between physical fitness and concentration.
“It is quite conceivable that children who can maintain the focus to perform maximally on this test will also do well on other tests of attention/concentration,” Dr. Weaver said. “Most children I know would have a very difficult time performing a physical fitness test which requires them to match a recorded pace that slowly increases overtime. I’m not an expert in the area, but it is my understanding that usually VO2max tests involve a treadmill which allows investigators to have complete control over pace.”
Dr. Weaver concluded that more work is needed to determine if physical fitness interventions can have a positive impact on HRQOL and concentration.
“I think the authors of this study attempted to ask an important question about the possible association between physical fitness and concentration among school aged children,” Dr. Weaver said in an interview. “But what is even more vital are studies demonstrating that a change in modifiable health factors like nutrition, physical fitness, or the built environment can improve quality of life. I was hoping the authors would show that an improvement in VO2max over time resulted in an improvement in concentration. Frustratingly, that is not what this article demonstrates.”
The investigators and Dr. Weaver reported no conflicts of interest.
FROM THE JOURNAL OF CLINICAL MEDICINE
Lung cancer in 2030: Expand genotyping
In recent years, –both of which have led to improved survival rates. But what will lung cancer look like in 2030?
Pasi A. Janne, MD, PhD, of the Dana-Farber Cancer Institute, Boston, hopes to see improved access to tumor and blood-based genotyping.
Dr. Janne, who serves as director of the Lowe Center for Thoracic Oncology at Dana-Farber, gave a keynote presentation at the 2022 European Lung Cancer Congress, where he highlighted the need to broaden the scope of targeted therapies, make “great drugs work even better,” improve the ability to treat patients based on risk level, and expand the use of targeted therapies in the adjuvant and neoadjuvant setting to make significant progress in the treatment lung cancer treatment in coming years.
Genotyping is underutilized, he said. A 2019 multicenter study reported at the annual meeting of the American Society of Clinical Oncology showed that only 54% of 1,203 patients underwent testing for EGFR mutations, 22% were tested for EGFR, ALK, ROS1, and BRAF mutations, and only 7% were tested for all biomarkers recommended by National Comprehensive Cancer Network guidelines at the time.
That study also showed that only 45% of patients received biomarker-driven treatment, even when driver mutations were detected.
“Immunotherapy was often prescribed instead of targeted therapy, even when molecular results were available,” Dr. Janne said.
Another study, reported at the 2021 ASCO annual meeting, showed some improvement in testing rates, but still, only 37% of patients were tested for all biomarkers as recommended.
Racial disparities in testing have also been observed. Bruno and colleagues found that any next-generation sequencing was performed in 50.1% of White patients, compared with 39.8% of black patients, and NGS prior to first-line therapy was performed in 35.5% and 25.8%, respectively.
The study, also reported at ASCO in 2021, showed that trial participation was observed among 3.9% of White patients and 1.9% of Black patients.
“The studies really highlight the need for increased testing rates and appropriate utilization of testing results to deliver optimal care to our patients with advanced lung cancer. We have a long way to go. To live the promise and appreciate the promise of precision therapy ... we need to be able to offer this testing to all of our patients with lung cancer,” he said.
Dr. Janne reported relationships with numerous pharmaceutical companies, including consulting, research support and stock ownership. He also receives postmarketing royalties from Dana-Farber Cancer Institute–owned intellectual property on EGFR mutations.
FROM ELCC 2022
Weighing the complexity of pathological response in lung cancer
studies, but much work remains to be done, said William D. Travis, MD, director of thoracic pathology at Memorial Sloan Kettering Cancer Center, New York.
In a keynote address at the 2022 European Lung Cancer Conference, Dr. Travis highlighted advances in the use of pathological response in this setting and outlined areas that need refinement. “Pathologic response after preoperative therapy is important because the extent of pathologic response strongly correlates with improved overall survival, and it is reflective of neoadjuvant therapy. The degree of response is associated with the degree of benefit in survival, and it’s being used as a surrogate for survival in phase 2 and 3 neoadjuvant clinical trials.”
In fact, multiple studies have demonstrated that non–small cell lung cancer patients with 10% or less viable residual tumor after treatment have improved overall survival and disease-free survival, compared with patients who have more residual tumor, he explained.
Recent studies have demonstrated the value of pathological response as an endpoint in the neoadjuvant therapy and molecular targeted therapy setting, he said, citing a study published in the Journal of Clinical Oncology that showed major pathological response rates of 14%-45% and pathological complete response rates up to 29% in patients treated with single-agent checkpoint inhibition.
In the CheckMate 816 trial, both major pathologic response and pathological complete response were significantly higher in patients treated with combination nivolumab and chemotherapy, compared with those treated with chemotherapy alone (37% vs. 8.9% and 24% vs. 2%, respectively).
“This high rate of responses with combined immunotherapy and chemotherapy is quite exciting,” he said.
Dr. Travis also stressed the importance of consulting the current International Association for the Study of Lung Cancer Recommendations for Pathologic Assessment of Lung Cancer Resection Specimens After Neoadjuvant Therapy.
He highlighted several key points regarding pathological response in lung cancer:
- Major pathological response (MPR) is calculated as the estimated size of viable tumor divided by the size of the tumor bed.
- Optimal cutoffs for determining MPR is currently 10%, but recent data suggest that in the conventional chemotherapy setting this may vary by tumor histology, with much higher cutoffs of about 65% for adenocarcinoma.
- Estimating the amount of viable tumor is “quite complicated and requires quite a number of steps,” and one the most important steps is “for the surgeon to the pathologist know that given specimen is from a patient who received neoadjuvant therapy.”
- Determining the border of the tumor bed can be challenging, therefore “resection specimens after neoadjuvant therapy should be sampled to optimize comprehensive gross and histologic assessment of the lung tumor bed for pathologic response ... as outlined in the guidelines.”
- The IASLC panel determined that having a single approach for estimating treatment effect would be best, despite the different therapy types and combinations used, but “it is recognized that there may be certain types of features that need to be addressed,” such as immune cell infiltrates in pats who received immunotherapy.
- The recommendations provide specific guidance for measuring tumor size for staging, including for special circumstances.
As for future direction, Dr. Travis said, “one question is how to assess treatment effect in lymph node samples.
“This is done for lymph nodes in breast cancer but not in lung cancer. We need system[s] for lung cancer.”
Good “infrastructure for pathology departments” is needed to support clinical trials, he said, noting that the team at Memorial Sloan Kettering Cancer Center includes physician assistants, tissue procurement staff, frozen section techs, research fellows, and research assistants.
Future work should also aim to standardize pathology assessment for clinical trials, improve the current recommendations, make use of new technology like artificial intelligence, optimize banking protocols and special techniques, and identify radiologic-pathological correlations, he said.
He added that “IASLC is promoting the design and implementation of an international database to collect uniformly clinical and pathologic information with the ultimate goal of fostering collaboration and to facilitate the identification of surrogate endpoints of long-term survival.”
Dr. Travis is a nonpaid pathology consultant for the LCMC3 and LCMC4 trials.
FROM ELCC 2022
FDA: Switch to disposable duodenoscope models
Health care facilities and providers should complete the transition to fully disposable duodenoscopes and those with disposable components, the U.S. Food and Drug Administration announced this week after an analysis of postmarket surveillance studies was completed.
The FDA’s directive updates its April 2020 recommendations on the subject. It cites concerns about cleaning fixed endcap duodenoscopes and the increasing availability of models that eliminate the need for reprocessing.
The announcement highlighted the potential for a dramatic difference in between-patient contamination risk, reducing it “by half or more as compared to reusable, or fixed endcaps.”
“Interim results from one duodenoscope model with a removable component show a contamination rate of just 0.5%, as compared to older duodenoscope models which had contamination rates as high as 6%,” the FDA writes.
Duodenoscopes are used in more than 500,000 procedures each year in the United States and are key in assessing and treating diseases and conditions of the pancreas and bile ducts.
Upgrade to new models to decrease infections
Manufacturers no longer market fixed endcap models in the United States, but some health care facilities continue to use them. The FDA recommends that all fixed endcap models be replaced.
The FDA says some manufacturers are offering replacement programs to upgrade to a model with a disposable component at no cost.
Two fully disposable models and five with disposable components have been cleared by the FDA. (One model is no longer marketed and thus not listed here.)
Fully Disposable:
Ambu Innovation GmbH, Duodenoscope model aScope Duodeno
Boston Scientific Corporation, EXALT Model D Single-Use Duodenoscope
Disposable Components:
Fujifilm Corporation, Duodenoscope model ED-580XT
Olympus Medical Systems, Evis Exera III Duodenovideoscope Olympus TJF-Q190V
Pentax Medical, Duodenoscope model ED34-i10T2
Pentax Medical, Duodenoscope model ED32-i10
Additionally, the failure to correctly reprocess a duodenoscope could result in tissue or fluid from one patient transferring to a subsequent patient.
“In rare cases, this can lead to patient-to-patient disease transmission,” the FDA says.
Postmarket surveillance studies
In 2015, the FDA ordered three manufacturers of reusable devices (Fujifilm, Olympus, and Pentax) to conduct postmarket surveillance studies to determine contamination rates after reprocessing.
In 2019, the FDA also ordered postmarket surveillance studies to the makers of duodenoscopes with disposable endcaps to verify that the new designs reduce the contamination rate.
The final results of the fixed endcap design indicate that contamination rates were as high as 6.6% with high-concern organisms after contamination. High-concern organisms are those more often associated with disease, such as E coli and Pseudomonas contamination.
“As a result, Pentax and Olympus are withdrawing their fixed endcap duodenoscopes from the market, and Fujifilm has completed withdrawal of its fixed endcap duodenoscope,” the FDA writes.
Studies are not yet complete for duodenoscopes with removable components. As of August 12, 2021, the Fujifilm ED-580XT duodenoscope with a removable cap had 57% of the samples required. Interim results indicate that no samples tested positive for enough low-concern organisms to indicate a reprocessing failure, and only 0.5% tested positive for high-concern organisms.
In addition to the contamination risk sampling, each manufacturer was ordered to do postmarket surveillance studies to evaluate whether staff could understand and follow the manufacturer’s reprocessing instructions in real-world health care settings.
According to the FDA, the results showed that users frequently had difficulty understanding and following the manufacturers’ instructions and were not able to successfully complete reprocessing with the older models.
However, the newer models had high user success rates for understanding instructions and correctly performing reprocessing tasks, the FDA says.
A version of this article first appeared on Medscape.com.
Hospitalists and PCPs crave greater communication
Hospitalists and PCPs want more dialogue while patients are in the hospital in order to coordinate and personalize care, according to data collected at Beth Israel Deaconess Medical Center, Boston. The results were presented at the annual meeting of the Society of General Internal Medicine.
“I think a major takeaway is that both hospitalists and primary care doctors agree that it’s important for primary care doctors to be involved in a patient’s hospitalization. They both identified a value that PCPs can bring to the table,” coresearcher Kristen Flint, MD, a primary care resident, told this news organization.
A majority in both camps reported that communication with the other party occurred in less than 25% of cases, whereas ideally it would happen half of the time. Dr. Flint noted that communication tools differ among hospitals, limiting the applicability of the findings.
The research team surveyed 39 hospitalists and 28 PCPs employed by the medical center during the first half of 2021. They also interviewed six hospitalists as they admitted and discharged patients.
The hospitalist movement, which took hold in response to cost and efficiency demands of managed care, led to the start of inpatient specialists, thereby reducing the need for PCPs to commute between their offices and the hospital to care for patients in both settings.
Primary care involvement is important during hospitalization
In the Beth Israel Deaconess survey, four out of five hospitalists and three-quarters of PCPs agreed that primary care involvement is still important during hospitalization, most critically during discharge and admission. Hospitalists reported that PCPs provide valuable data about a patient’s medical status, social supports, mental health, and goals for care. They also said having such data helps to boost patient trust and improve the quality of inpatient care.
“Most projects around communication between inpatient and outpatient doctors have really focused on the time of discharge,” when clinicians identify what care a patient will need after they leave the hospital, Dr. Flint said. “But we found that both sides felt increased communication at time of admission would also be beneficial.”
The biggest barrier for PCPs, cited by 82% of respondents, was lack of time. Hospitalists’ top impediment was being unable to find contact information for the other party, which was cited by 79% of these survey participants.
Hospitalists operate ‘in a very stressful environment’
The Beth Israel Deaconess research “documents what has largely been suspected,” said primary care general internist Allan Goroll, MD.
Dr. Goroll, a professor of medicine at Harvard Medical School, Boston, said in an interview that hospitalists operate “in a very stressful environment.”
“They [hospitalists] appreciate accurate information about a patient’s recent medical history, test results, and responses to treatment as well as a briefing on patient values and preferences, family dynamics, and priorities for the admission. It makes for a safer, more personalized, and more efficient hospital admission,” said Dr. Goroll, who was not involved in the research.
In a 2015 article in the New England Journal of Medicine, Dr. Goroll and Daniel Hunt, MD, director of hospital medicine at Emory University, Atlanta, proposed a collaborative model in which PCPs visit hospitalized patients and serve as consultants to inpatient staff. Dr. Goroll said Massachusetts General Hospital in Boston, where he practices, initiated a study of that approach, but it was interrupted by the pandemic.
“As limited time is the most often cited barrier to communication, future interventions such as asynchronous forms of communication between the two groups should be considered,” the researchers wrote in the NEJM perspective.
To narrow the gap, Beth Israel Deaconess will study converting an admission notification letter sent to PCPs into a two-way communication tool in which PCPs can insert patient information, Dr. Flint said.
Dr. Flint and Dr. Goroll have disclosed no relevant financial relationships.
A version of this article first appeared on Medscape.com.
FROM SGIM 2022
Strawberries, spinach, kale: high on the ‘Dirty Dozen’ list
Once again, of the foods.
The yearly report comes from the Environmental Working Group, a nonprofit organization dedicated to improving human health and the environment, and also includes a “Clean 15” list of produce.
An industry group for growers of organic and nonorganic produce, along with some dietitians, make strong objections to the report, saying it raises unnecessary alarm and could discourage people from eating enough fruits and vegetables.
The report gives people valuable information, says the Environmental Working Group’s Alexis Temkin, PhD, a toxicologist, so they can make informed choices about the fruits and vegetables they buy.
Environmental Working Group researchers get data from the U.S. Department of Agriculture’s samplings of pesticide residue on produce done yearly or every 2 years, and from the Food and Drug Administration for honeydew melon, which the USDA doesn’t test for.
2022 results: Dirty Dozen
More than 70% of the conventionally grown produce had detectable pesticide residue, the Environmental Working Group found. These fruits and vegetables were found to have the most pesticide residues this year:
- 1. Strawberries
- 2. Spinach
- 3. Kale and collard and mustard greens
- 4. Nectarines
- 5. Apples
- 6. Grapes
- 7. Bell and hot peppers
- 8. Cherries
- 9. Peaches
- 10. Pears
- 11. Celery
- 12. Tomatoes
2022 results: Clean 15
Almost 70% of the Clean Fifteen fruit and vegetable samples had no detectable residues of pesticides, the Environmental Working Group found. Avocados and sweet corn were the cleanest, with less than 2% of samples showing any detectable pesticides.
- 1. Avocados
- 2. Sweet corn
- 3. Pineapple
- 4. Onions
- 5. Papaya
- 6. Sweet peas (frozen)
- 7. Asparagus
- 8. Honeydew melon
- 9. Kiwi
- 10. Cabbage
- 11. Mushrooms
- 12. Cantaloupe
- 13. Mangoes
- 14. Watermelon
- 15. Sweet potatoes
More on methods
To produce the report, the Environmental Working Group analyzed more than 44,000 samples taken by the FDA and USDA, which tests a subset of produce each year.
Before testing, USDA scientists prepare each fruit or vegetable the way people tend to do themselves, such as peeling those with inedible peels and rinsing produce with edible peels.
The Environmental Working Group takes six measures of pesticide contamination into account:
- Percent of samples tested with detectable pesticides
- Percent with two or more detectable pesticides
- Average number of pesticides in a single sample
- Average amount of pesticides, expressed in parts per million
- Maximum number of pesticides on a single sample
- Total number of pesticides found
Next, the Environmental Working Group researchers ranked the 46 fruits and vegetables analyzed, calculated a total score, and drew up the lists.
Industry criticism
The Alliance for Food and Farming, an industry group that represents organic and nonorganic farmers, growers, and shippers, takes strong issue with the annual report, noting that pesticide residues on conventional produce are low, if present at all.
“Ignore or discount the list,” says Teresa Thorne, executive director of the alliance. Like others, she fears that if an organic fruit or vegetable costs more, as they often do, consumers will bypass produce altogether, especially low-income consumers. “Pick what’s best for you and your family,” she says.
Temkin of the Environmental Working Group acknowledges that all the residues found were within legal limits set by the Environmental Protection Agency. “Although the levels are legal, that doesn’t necessarily mean they are safe,” she says.
The point of the rankings, she says, is to give people information so they can choose whether to buy organic or nonorganic produce. “Our recommendation is to buy the ones on the ‘Dirty Dozen’ list organic when available, or focus on the ‘Clean 15’ list.”
The Environmental Working Group depends on a broad base of support overall, according to information on its website, including companies that produce organic products such as Stonyfield Farms, Earthbound Farms, and Organic Valley.
But according to Iris Myers, an Environmental Working Group spokesperson, the Shopper’s Guide with the clean and dirty produce rankings “isn’t funded by any companies – only grants and individual donors. We don’t allow companies to sponsor any of our research reports.”
In the report, the Environmental Working Group also notes that the EPA has taken action to prohibit the pesticide chlorpyrifos in food, after the group and others spent years asking for the ban.
Dietitians weigh in
The report uses “fear-branded messages to steer people away from eating conventionally grown fruits and veggies,” says Christine Rosenbloom, PhD, a retired Georgia State University professor and an Atlanta nutrition consultant.
She reminds people that “both organic and conventional agriculture use pesticides to protect the crop. Organic famers use different pesticides that are described as ‘natural,’ but natural doesn’t mean safer, better, or chemical-free,” she says.
She refers people to the Pesticide Residue Calculator from toxicologists at the University of California, Riverside, posted on the consumer site the Alliance for Food and Farming.
The calculator helps reassure people that trace amounts of chemicals on conventionally grown produce are not a hazard to your health, Dr. Rosenbloom says. “Using myself as an example, I could eat 850 apples or 13,225 servings of blueberries in one day without any effect, even in the worst-case scenario of the fruit having the highest pesticide residue recorded by the USDA.”
“It’s one more example of putting good and bad food labels on foods when it isn’t deserved,” says Connie Diekman, a food and nutrition consultant in St. Louis and a former president of the Academy of Nutrition and Dietetics. “The amounts they are measuring are so much below the tolerance level set by the EPA.”
The report shouldn’t scare people, including parents worried about serving their children conventional produce, she says.
As for how much produce to eat, “the best advice is to have half your plate be fruits and vegetables,” Ms. Diekman says. Under current Dietary Guidelines for Americans, an intake of 2½ “cups equivalent” of vegetables and 2 “cups equivalent” of fruits is recommended daily for adults.
Ms. Diekman is on the Bayer LEAD Network, Leaders Engaged in Advancing Dialogue. Dr. Rosenbloom reports an honorarium from a bean industry group for developing a webinar on healthy aging.
A version of this article first appeared on WebMD.com.
Incorporation of Clinical Staff Pharmacists in the Emergency Department Sepsis Response at a Single Institution
Sepsis is life-threatening organ dysfunction caused by dysregulated host response to an infection that can progress to shock. Sepsis is a major cause of death in the United States, with > 1 million people developing sepsis and > 250,000 people dying from sepsis annually.1 The Surviving Sepsis Campaign (SSC) guidelines recommend treating sepsis as an emergency with timely administration of fluids and antibiotics, as administering antibiotics within the first hour has been found to reduce mortality and disease progression. In addition, empiric antibiotic regimens should be chosen to target the most probable pathogens and dosing should be optimized. To achieve this, the SSC guidelines recommend that hospitals develop quality improvement (QI) programs developed by a multidisciplinary group to improve sepsis recognition and response using a protocolized approach.2
There are several studies describing efforts to improve the sepsis response at facilities, some of which have evaluated the addition of a pharmacist into the sepsis response, particularly in the emergency department (ED). Some studies found improved selection and decreased time to antibiotic administration with the addition of an ED pharmacist.3-7 Despite this, ED pharmacists are not present in all hospitals, with a 2015 national survey reporting the presence of an ED pharmacist in 68.7% of respondents at 187 facilities. Even facilities with ED pharmacists often have limited hours of coverage, with at least 8 hours of coverage in 49.4% of facilities with an ED pharmacist and no weekend coverage at 34.8% of these facilities.8
While many hospitals do not routinely employ ED pharmacists, most hospitals have clinical staff pharmacists (CSPs), and many inpatient hospital pharmacies are staffed with CSPs 24 hours per day, 7 days per week. A 2017 survey conducted by the American Society of Health-System Pharmacists (ASHP) found 43% of all hospital pharmacy departments were staffed by a CSP around the clock, with the prevalence increasing to 56.7 to 100% in hospitals with > 100 beds.9 As a result, CSPs may be a useful resource to assist with the management of patients with sepsis in hospitals without an ED pharmacist.
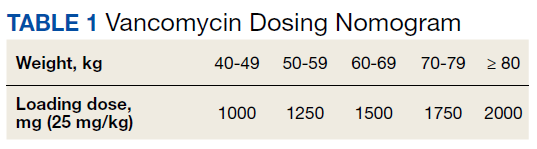
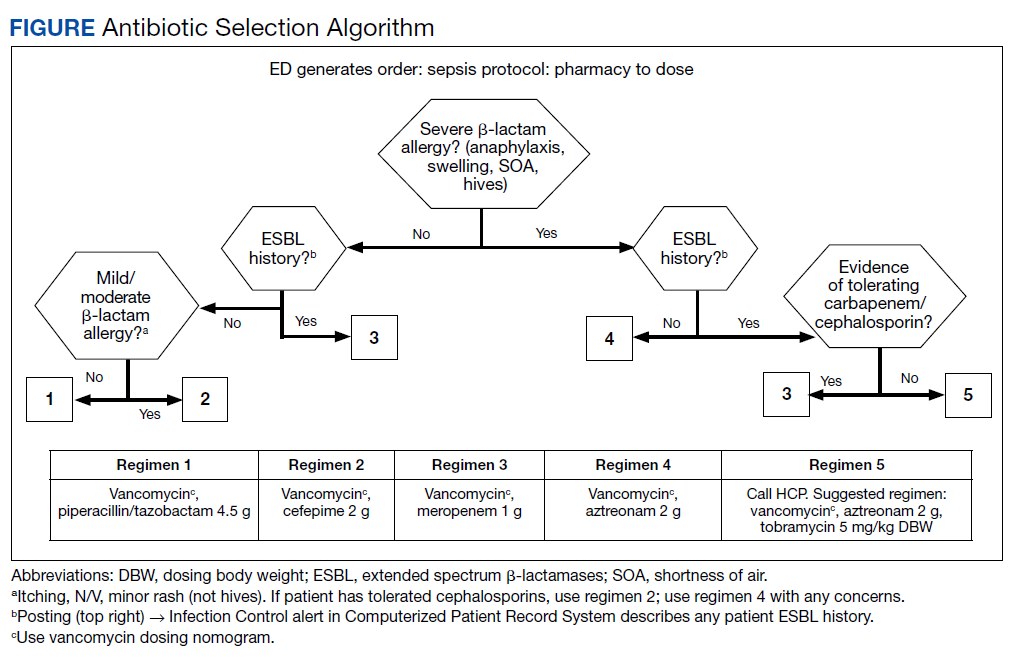
At the Lexington Veterans Affairs Health Care System (LVAHCS) in Kentucky, the inpatient pharmacy department is staffed with a CSP 24/7 but does not have an ED pharmacist. Therefore, when an interdisciplinary group developed an ED sepsis bundle as part of a QI initiative on sepsis recognition and response, the group took a unique approach of incorporating CSPs into the response team to assist with antimicrobial selection and dosing. An antibiotic selection algorithm and vancomycin dosing nomogram were developed to aid CSPs to select and dose antibiotics (Figure, Table 1). We describe the implementation of this process and evaluate CSPs’ accuracy in antimicrobial selection and vancomycin dosing.
Methods
Lexington VAHCS is a 94-bed hospital that provides services to veterans, including an ED, inpatient medical services, surgical services, acute mental health, progressive care, and intensive care units. This facility has 1 antimicrobial stewardship clinical pharmacy specialist, 2 critical care clinical pharmacy specialists, and 16 full-time CSPs with 24-hour CSP coverage. The annual ED volume at the time of this study was approximately 21,000 patients.
Consistent with the SSC guideline recommendation to develop multidisciplinary QI initiatives on sepsis recognition and response, an Interdisciplinary Sepsis Committee (ISC) was created in 2018 comprised of ED, pulmonary, critical care, and infectious diseases licensed independent practitioners (LIPs), ED nurses, and pharmacists. The ISC developed a comprehensive set of sepsis tools that included a sepsis screening tool used by ED triage nurses to provide early detection of sepsis and an updated electronic order set to decrease time to appropriate treatment. This order set included automatic orders for blood cultures and serum lactate, the initiation of IV crystalloids, as well as a Sepsis Alert order placed by ED LIPs which alerted CSPs to a patient with sepsis in the ED.
To ensure a protocol-based approach by the CSPs responding to the sepsis alert, an antibiotic algorithm and vancomycin dosing nomogram were developed by the ISC based on current guideline recommendations and the local antibiogram. These were subsequently approved by ED practitioners, the pharmacy and therapeutics committee, and the critical care committee. The antibiotic algorithm prompts CSPs to perform a chart review to identify β-lactam allergies, evaluate the severity of the allergy and which agents the patient has tolerated in the past, as well as determine whether the patient has a history of extended spectrum β-lactamase (ESBL)–producing organisms from previous cultures. A decision tree then guides CSPs toward the selection of 1 of 5 empiric antibiotic regimens to cover all likely pathogens. The medication orders are then entered by the CSPs as a telephone order from the ED LIP per protocol. Unless patients had a true vancomycin allergy, all patients received vancomycin as the empiric gram-positive backbone of the regimen. The vancomycin dosing nomogram was created to ensure an appropriate and consistent vancomycin weight-based loading dose was administered.
Prior to implementation, the antimicrobial stewardship pharmacist educated CSPs on the use of these tools, including simulated orders for mock sepsis alerts to ensure competency. A copy of the algorithm and nomogram were emailed to all CSPs and posted in a prominent location in the pharmacy.
As part of continuous performance improvement efforts of the ISC, a retrospective cohort study was conducted through chart review on patients at the Lexington VAHCS with an order for a sepsis alert in the ED from December 3, 2018 to May 31, 2020 to assess the accuracy of the CSPs’ antibiotic selection and dosing. Patients were excluded if they had a vancomycin allergy or if the ED practitioner ordered antibiotics prior to the CSPs placing orders. Patients could be included more than once in the study if they had sepsis alerts placed on different dates.
The primary outcomes were CSPs’ accuracy in antimicrobial selection with the antibiotic selection algorithm and vancomycin dosing nomogram. The antibiotic selection was deemed accurate if the appropriate antibiotic regimen was selected based on allergy status and previous cultures as directed in the algorithm. The vancomycin dose was considered accurate if the dose chosen was appropriate based on the patient’s weight at the time of ED presentation. Secondary outcomes included time to administration of antibiotics from ED presentation as well as time to antibiotics administration from sepsis alert initiation. Time of administration was considered the time the antibiotics were scanned in the bar code medication administration (BCMA) system.
Descriptive statistics were used with data presented as percentages for nominal data and median as IQR for continuous data. In accordance with our facility’s project assessment process, this project was determined not to constitute human subjects research; therefore, this QI project did not require review by the institutional review board.
Results
Between December 3, 2018 and May 31, 2020, 160 sepsis alerts were ordered by ED practitioners. Of the 160 patients, 157 were included in the final data analysis. Two patients were excluded due to vancomycin allergy, and 1 patient because the physician ordered antibiotics prior to pharmacist order entry. The population was largely composed of male patients (98%) with a median age of 72 years (Table 2).
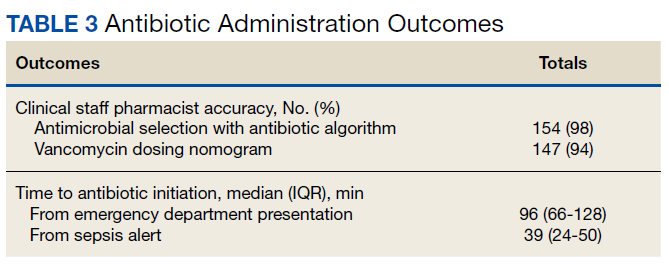
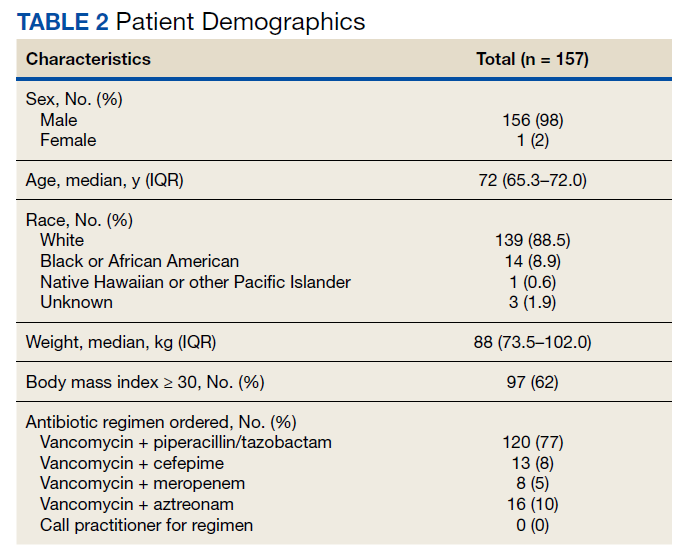
Of 157 sepsis alerts, the antibiotic selection algorithm was used appropriately in 154 (98%) instances (Table 3). Chart reviews were performed in instances of antimicrobial selection different from the algorithm. Of the 3 patients who received antibiotics not consistent with the algorithm, 1 patient without a history of ESBL-producing organisms in their culture history received meropenem instead of piperacillin/tazobactam. Another patient without a penicillin allergy received cefepime (plus metronidazole ordered separately from the ED practitioner) instead of piperacillin/tazobactam, and the third patient received piperacillin/tazobactam instead of meropenem despite a culture history of ESBL-producing organisms. Vancomycin dose was appropriate according to the weight-based nomogram in 147 cases (94%). The median time to administration of first dose antibiotics was 39 minutes after the sepsis alert order was placed and 96 minutes after initial ED presentation.
Discussion
This study found extremely high rates of accuracy among CSPs for both the antibiotic selection algorithm (98%) and the vancomycin dosing nomogram (94%). Moreover, analysis of the 3 patients who received antibiotics that were inconsistent with the algorithm revealed that 2 of these patients arguably still received adequate empiric coverage, increasing the percentage of patients receiving appropriate empiric antibiotics to 99.4%. Similarly, chart review of 10 patients who received vancomycin doses that deviated from the nomogram revealed that in at least 3 cases, patients were likely given correct vancomycin doses based on the patient’s last known weight. However, when actual current weights were recorded soon after admission, the updated weights rendered the initial vancomycin loading dose incorrect when this analysis was performed. Thus, the adherence to the vancomycin dosing nomogram is higher than it appears.
Median time to antibiotic administration from the sepsis alert was 39 minutes—well within SSC recommendations (60 minutes).2 Previous internal analyses at Lexington VAHCS demonstrated the mean time to first dose of antibiotics in the ED has been 39 minutes since about 2015. Thus, this initiative did not necessarily make this process quicker; however it did remove 1 responsibility from LIPs so that they could focus their efforts on other components of sepsis management.
Further studies are needed to evaluate the effects of this initiative on other aspects of the sepsis bundle, such as volume of fluid administered and appropriateness of laboratory tests. It was noted that while the time to first-dose antibiotic administration was < 1 hour from order placement, the median time from ED presentation to antibiotic administration was 96 minutes. This suggests that another focus of the sepsis workgroup should be on speeding recognition of sepsis, triggering the sepsis alert even sooner, and evaluating the feasibility of storing first doses of antibiotics in the automatic dispensing cabinets in the ED.
Limitations
This descriptive study evaluating CSPs’ ability to accurately use the newly developed antibiotic selection algorithm and vancomycin dosing nomogram had no control group for outcome comparison. This study was not designed to evaluate clinical outcomes, such as mortality, so the impact of these interventions need to be further studied. In addition, as veterans receive most of their care at our facility, with their allergies and previous cultures readily available in our electronic health record, this process may not be feasible at other facilities where patients' care is divided among multiple facilities/systems.
Moreover, as the veteran population studied was predominately male patients aged > 60 years, implementation at other hospitals may require the dosing nomograms and treatment algorithms to be adapted for a broader population, such as children and pregnant women. In particular, the ISC chose to implement an algorithm that did not differentiate between suspected source of infections and included anti-Pseudomonal coverage in all regimens based on the most encountered diseases among our veteran population and our local antibiogram; implementation at other facilities would require a thoughtful evaluation of the most appropriate site-specific regimen. Finally, many of the CSPs at our facility are board certified and/or residency trained, so more staff development may be required prior to implementation at other facilities, depending on the experience and comfort level of the CSPs.
Strengths
This study describes an example of a protocolized and multidisciplinary approach to improve sepsis recognition and standardize the response, consistent with SSC guideline recommendations. To the best of our knowledge, this is the first study to demonstrate the incorporation of CSPs into the interdisciplinary sepsis response. This allows for CSPs to practice at the top of their license and contributes to their professional development. Although it was not formally assessed, anecdotally CSPs reported that this process presented a negligible addition to their workload (< 5 minutes was the most reported time requirement), and they expressed satisfaction with their involvement in the sepsis response. Overall, this presents a possible solution to improve the sepsis response in hospitals without a dedicated ED pharmacist.
Conclusions
This study describes the successful incorporation of CSPs into the sepsis response in the ED. As CSPs are more likely than ED pharmacists to be present at a facility, they are arguably an underused resource whose clinical skills can be used to optimize the treatment of patients with sepsis.
1. Centers for Disease Control and Prevention. Sepsis. Accessed March 8, 2022. https://www.cdc.gov/sepsis/what-is-sepsis.html
2. Rhodes A, Evans LE, Alhazzani W, et al. Surviving Sepsis Campaign: international guidelines for management of sepsis and septic shock: 2016. Crit Care Med. 2017 Mar;45(3):486-552. doi:10.1097/CCM.0000000000002255
3. Denny KJ, Gartside JG, Alcorn K, et al. Appropriateness of antibiotic prescribing in the emergency department. J Antimicrob Chemother. 2019 Feb 1;74(2):515-520. doi:10.1093/jac/dky447
4. Laine ME, Flynn JD, Flannery AH. Impact of pharmacist intervention on selection and timing of appropriate antimicrobial therapy in septic shock. J Pharm Pract. 2018 Feb;31(1):46-51. doi:10.1177/0897190017696953
5. Weant KA, Baker SN. Emergency medicine pharmacists and sepsis management. J Pharm Pract. 2013 Aug;26(4):401-5. doi:10.1177/0897190012467211
6. Farmer BM, Hayes BD, Rao R, et al. The role of clinical pharmacists in the emergency department. J Med Toxicol. 2018 Mar;14(1):114-116. doi:10.1007/s13181-017-0634-4
7. Yarbrough N, Bloxam M, Priano J, Louzon Lynch P, Hunt LN, Elfman J. Pharmacist impact on sepsis bundle compliance through participation on an emergency department sepsis alert team. Am J Emerg Med. 2019;37(4):762-763. doi:10.1016/j.ajem.2018.08.00
8. Thomas MC, Acquisto NM, Shirk MB, et al. A national survey of emergency pharmacy practice in the United States. Am J Health Syst Pharm. 2016 Mar 15;73(6):386-94. doi:10.2146/ajhp150321
9. Schneider PJ, Pedersen CA, Scheckelhoff DJ. ASHP national survey of pharmacy practice in hospital settings: dispensing and administration-2017. Am J Health Syst Pharm. 2018;75(16):1203-1226. doi:10.2146/ajhp180151
Sepsis is life-threatening organ dysfunction caused by dysregulated host response to an infection that can progress to shock. Sepsis is a major cause of death in the United States, with > 1 million people developing sepsis and > 250,000 people dying from sepsis annually.1 The Surviving Sepsis Campaign (SSC) guidelines recommend treating sepsis as an emergency with timely administration of fluids and antibiotics, as administering antibiotics within the first hour has been found to reduce mortality and disease progression. In addition, empiric antibiotic regimens should be chosen to target the most probable pathogens and dosing should be optimized. To achieve this, the SSC guidelines recommend that hospitals develop quality improvement (QI) programs developed by a multidisciplinary group to improve sepsis recognition and response using a protocolized approach.2
There are several studies describing efforts to improve the sepsis response at facilities, some of which have evaluated the addition of a pharmacist into the sepsis response, particularly in the emergency department (ED). Some studies found improved selection and decreased time to antibiotic administration with the addition of an ED pharmacist.3-7 Despite this, ED pharmacists are not present in all hospitals, with a 2015 national survey reporting the presence of an ED pharmacist in 68.7% of respondents at 187 facilities. Even facilities with ED pharmacists often have limited hours of coverage, with at least 8 hours of coverage in 49.4% of facilities with an ED pharmacist and no weekend coverage at 34.8% of these facilities.8
While many hospitals do not routinely employ ED pharmacists, most hospitals have clinical staff pharmacists (CSPs), and many inpatient hospital pharmacies are staffed with CSPs 24 hours per day, 7 days per week. A 2017 survey conducted by the American Society of Health-System Pharmacists (ASHP) found 43% of all hospital pharmacy departments were staffed by a CSP around the clock, with the prevalence increasing to 56.7 to 100% in hospitals with > 100 beds.9 As a result, CSPs may be a useful resource to assist with the management of patients with sepsis in hospitals without an ED pharmacist.
At the Lexington Veterans Affairs Health Care System (LVAHCS) in Kentucky, the inpatient pharmacy department is staffed with a CSP 24/7 but does not have an ED pharmacist. Therefore, when an interdisciplinary group developed an ED sepsis bundle as part of a QI initiative on sepsis recognition and response, the group took a unique approach of incorporating CSPs into the response team to assist with antimicrobial selection and dosing. An antibiotic selection algorithm and vancomycin dosing nomogram were developed to aid CSPs to select and dose antibiotics (Figure, Table 1). We describe the implementation of this process and evaluate CSPs’ accuracy in antimicrobial selection and vancomycin dosing.
Methods
Lexington VAHCS is a 94-bed hospital that provides services to veterans, including an ED, inpatient medical services, surgical services, acute mental health, progressive care, and intensive care units. This facility has 1 antimicrobial stewardship clinical pharmacy specialist, 2 critical care clinical pharmacy specialists, and 16 full-time CSPs with 24-hour CSP coverage. The annual ED volume at the time of this study was approximately 21,000 patients.
Consistent with the SSC guideline recommendation to develop multidisciplinary QI initiatives on sepsis recognition and response, an Interdisciplinary Sepsis Committee (ISC) was created in 2018 comprised of ED, pulmonary, critical care, and infectious diseases licensed independent practitioners (LIPs), ED nurses, and pharmacists. The ISC developed a comprehensive set of sepsis tools that included a sepsis screening tool used by ED triage nurses to provide early detection of sepsis and an updated electronic order set to decrease time to appropriate treatment. This order set included automatic orders for blood cultures and serum lactate, the initiation of IV crystalloids, as well as a Sepsis Alert order placed by ED LIPs which alerted CSPs to a patient with sepsis in the ED.
To ensure a protocol-based approach by the CSPs responding to the sepsis alert, an antibiotic algorithm and vancomycin dosing nomogram were developed by the ISC based on current guideline recommendations and the local antibiogram. These were subsequently approved by ED practitioners, the pharmacy and therapeutics committee, and the critical care committee. The antibiotic algorithm prompts CSPs to perform a chart review to identify β-lactam allergies, evaluate the severity of the allergy and which agents the patient has tolerated in the past, as well as determine whether the patient has a history of extended spectrum β-lactamase (ESBL)–producing organisms from previous cultures. A decision tree then guides CSPs toward the selection of 1 of 5 empiric antibiotic regimens to cover all likely pathogens. The medication orders are then entered by the CSPs as a telephone order from the ED LIP per protocol. Unless patients had a true vancomycin allergy, all patients received vancomycin as the empiric gram-positive backbone of the regimen. The vancomycin dosing nomogram was created to ensure an appropriate and consistent vancomycin weight-based loading dose was administered.
Prior to implementation, the antimicrobial stewardship pharmacist educated CSPs on the use of these tools, including simulated orders for mock sepsis alerts to ensure competency. A copy of the algorithm and nomogram were emailed to all CSPs and posted in a prominent location in the pharmacy.
As part of continuous performance improvement efforts of the ISC, a retrospective cohort study was conducted through chart review on patients at the Lexington VAHCS with an order for a sepsis alert in the ED from December 3, 2018 to May 31, 2020 to assess the accuracy of the CSPs’ antibiotic selection and dosing. Patients were excluded if they had a vancomycin allergy or if the ED practitioner ordered antibiotics prior to the CSPs placing orders. Patients could be included more than once in the study if they had sepsis alerts placed on different dates.
The primary outcomes were CSPs’ accuracy in antimicrobial selection with the antibiotic selection algorithm and vancomycin dosing nomogram. The antibiotic selection was deemed accurate if the appropriate antibiotic regimen was selected based on allergy status and previous cultures as directed in the algorithm. The vancomycin dose was considered accurate if the dose chosen was appropriate based on the patient’s weight at the time of ED presentation. Secondary outcomes included time to administration of antibiotics from ED presentation as well as time to antibiotics administration from sepsis alert initiation. Time of administration was considered the time the antibiotics were scanned in the bar code medication administration (BCMA) system.
Descriptive statistics were used with data presented as percentages for nominal data and median as IQR for continuous data. In accordance with our facility’s project assessment process, this project was determined not to constitute human subjects research; therefore, this QI project did not require review by the institutional review board.
Results
Between December 3, 2018 and May 31, 2020, 160 sepsis alerts were ordered by ED practitioners. Of the 160 patients, 157 were included in the final data analysis. Two patients were excluded due to vancomycin allergy, and 1 patient because the physician ordered antibiotics prior to pharmacist order entry. The population was largely composed of male patients (98%) with a median age of 72 years (Table 2).
Of 157 sepsis alerts, the antibiotic selection algorithm was used appropriately in 154 (98%) instances (Table 3). Chart reviews were performed in instances of antimicrobial selection different from the algorithm. Of the 3 patients who received antibiotics not consistent with the algorithm, 1 patient without a history of ESBL-producing organisms in their culture history received meropenem instead of piperacillin/tazobactam. Another patient without a penicillin allergy received cefepime (plus metronidazole ordered separately from the ED practitioner) instead of piperacillin/tazobactam, and the third patient received piperacillin/tazobactam instead of meropenem despite a culture history of ESBL-producing organisms. Vancomycin dose was appropriate according to the weight-based nomogram in 147 cases (94%). The median time to administration of first dose antibiotics was 39 minutes after the sepsis alert order was placed and 96 minutes after initial ED presentation.
Discussion
This study found extremely high rates of accuracy among CSPs for both the antibiotic selection algorithm (98%) and the vancomycin dosing nomogram (94%). Moreover, analysis of the 3 patients who received antibiotics that were inconsistent with the algorithm revealed that 2 of these patients arguably still received adequate empiric coverage, increasing the percentage of patients receiving appropriate empiric antibiotics to 99.4%. Similarly, chart review of 10 patients who received vancomycin doses that deviated from the nomogram revealed that in at least 3 cases, patients were likely given correct vancomycin doses based on the patient’s last known weight. However, when actual current weights were recorded soon after admission, the updated weights rendered the initial vancomycin loading dose incorrect when this analysis was performed. Thus, the adherence to the vancomycin dosing nomogram is higher than it appears.
Median time to antibiotic administration from the sepsis alert was 39 minutes—well within SSC recommendations (60 minutes).2 Previous internal analyses at Lexington VAHCS demonstrated the mean time to first dose of antibiotics in the ED has been 39 minutes since about 2015. Thus, this initiative did not necessarily make this process quicker; however it did remove 1 responsibility from LIPs so that they could focus their efforts on other components of sepsis management.
Further studies are needed to evaluate the effects of this initiative on other aspects of the sepsis bundle, such as volume of fluid administered and appropriateness of laboratory tests. It was noted that while the time to first-dose antibiotic administration was < 1 hour from order placement, the median time from ED presentation to antibiotic administration was 96 minutes. This suggests that another focus of the sepsis workgroup should be on speeding recognition of sepsis, triggering the sepsis alert even sooner, and evaluating the feasibility of storing first doses of antibiotics in the automatic dispensing cabinets in the ED.
Limitations
This descriptive study evaluating CSPs’ ability to accurately use the newly developed antibiotic selection algorithm and vancomycin dosing nomogram had no control group for outcome comparison. This study was not designed to evaluate clinical outcomes, such as mortality, so the impact of these interventions need to be further studied. In addition, as veterans receive most of their care at our facility, with their allergies and previous cultures readily available in our electronic health record, this process may not be feasible at other facilities where patients' care is divided among multiple facilities/systems.
Moreover, as the veteran population studied was predominately male patients aged > 60 years, implementation at other hospitals may require the dosing nomograms and treatment algorithms to be adapted for a broader population, such as children and pregnant women. In particular, the ISC chose to implement an algorithm that did not differentiate between suspected source of infections and included anti-Pseudomonal coverage in all regimens based on the most encountered diseases among our veteran population and our local antibiogram; implementation at other facilities would require a thoughtful evaluation of the most appropriate site-specific regimen. Finally, many of the CSPs at our facility are board certified and/or residency trained, so more staff development may be required prior to implementation at other facilities, depending on the experience and comfort level of the CSPs.
Strengths
This study describes an example of a protocolized and multidisciplinary approach to improve sepsis recognition and standardize the response, consistent with SSC guideline recommendations. To the best of our knowledge, this is the first study to demonstrate the incorporation of CSPs into the interdisciplinary sepsis response. This allows for CSPs to practice at the top of their license and contributes to their professional development. Although it was not formally assessed, anecdotally CSPs reported that this process presented a negligible addition to their workload (< 5 minutes was the most reported time requirement), and they expressed satisfaction with their involvement in the sepsis response. Overall, this presents a possible solution to improve the sepsis response in hospitals without a dedicated ED pharmacist.
Conclusions
This study describes the successful incorporation of CSPs into the sepsis response in the ED. As CSPs are more likely than ED pharmacists to be present at a facility, they are arguably an underused resource whose clinical skills can be used to optimize the treatment of patients with sepsis.
1. Centers for Disease Control and Prevention. Sepsis. Accessed March 8, 2022. https://www.cdc.gov/sepsis/what-is-sepsis.html
2. Rhodes A, Evans LE, Alhazzani W, et al. Surviving Sepsis Campaign: international guidelines for management of sepsis and septic shock: 2016. Crit Care Med. 2017 Mar;45(3):486-552. doi:10.1097/CCM.0000000000002255
3. Denny KJ, Gartside JG, Alcorn K, et al. Appropriateness of antibiotic prescribing in the emergency department. J Antimicrob Chemother. 2019 Feb 1;74(2):515-520. doi:10.1093/jac/dky447
4. Laine ME, Flynn JD, Flannery AH. Impact of pharmacist intervention on selection and timing of appropriate antimicrobial therapy in septic shock. J Pharm Pract. 2018 Feb;31(1):46-51. doi:10.1177/0897190017696953
5. Weant KA, Baker SN. Emergency medicine pharmacists and sepsis management. J Pharm Pract. 2013 Aug;26(4):401-5. doi:10.1177/0897190012467211
6. Farmer BM, Hayes BD, Rao R, et al. The role of clinical pharmacists in the emergency department. J Med Toxicol. 2018 Mar;14(1):114-116. doi:10.1007/s13181-017-0634-4
7. Yarbrough N, Bloxam M, Priano J, Louzon Lynch P, Hunt LN, Elfman J. Pharmacist impact on sepsis bundle compliance through participation on an emergency department sepsis alert team. Am J Emerg Med. 2019;37(4):762-763. doi:10.1016/j.ajem.2018.08.00
8. Thomas MC, Acquisto NM, Shirk MB, et al. A national survey of emergency pharmacy practice in the United States. Am J Health Syst Pharm. 2016 Mar 15;73(6):386-94. doi:10.2146/ajhp150321
9. Schneider PJ, Pedersen CA, Scheckelhoff DJ. ASHP national survey of pharmacy practice in hospital settings: dispensing and administration-2017. Am J Health Syst Pharm. 2018;75(16):1203-1226. doi:10.2146/ajhp180151
Surgeons in China ‘are the executioners,’ procuring organs before brain death
In a deep dive into obscure Chinese language transplant journals, a pair of researchers from Australia and Israel have added a new layer of horror to what’s already known about forced organ harvesting in China.
Searching for documentation that vital organs are being harvested from nonconsenting executed prisoners, a practice that the China Tribunal confirmed “beyond any reasonable doubt” in 2020, Jacob Lavee, MD, an Israeli heart transplant surgeon, and Matthew Roberston, a PhD student at Australian National University, uncovered something even more shocking: that vital organs are being explanted from patients who are still alive.
“We have shown for the first time that the transplant surgeons are the executioners – that the mode of execution is organ procurement. These are self-admissions of executing the patient,” Dr. Lavee told this news organization. “Up until now, there has been what we call circumstantial evidence of this, but our paper is what you’d call the smoking gun, because it’s in the words of the physicians themselves that they are doing it. In the words of these surgeons, intubation was done only after the beginning of surgery, which means the patients were breathing spontaneously up until the moment the operation started ... meaning they were not brain dead.”
The research, published in the American Journal of Transplantation, involved intricate analysis of thousands of Chinese language transplant articles and identified 71 articles in which transplant surgeons describe starting organ procurement surgery before declaring their patients brain dead.
“What we found were improper, illegitimate, nonexistent, or false declarations of brain death,” Mr. Robertson said in an interview. He explained that this violates what’s known as the dead donor rule, which is fundamental in transplant ethics. “The surgeons wrote that the donor was brain dead, but according to everything we know about medical science, they could not possibly have been brain dead because there was no apnea test performed. Brain death is not just something you say, there’s this whole battery of tests, and the key is the apnea test, [in which] the patient is already intubated and ventilated, they turn the machine off, and they’re looking for carbon dioxide in the blood above a certain level.”
Mr. Robertson and Dr. Lavee have painstakingly documented “incriminating sentences” in each of the 71 articles proving that brain death had not occurred before the organ explantation procedure began. “There were two criteria by which we claimed a problematic brain death declaration,” said Mr. Robertson, who translated the Chinese. “One was where the patient was not ventilated and was only intubated after they were declared brain dead; the other was that the intubation took place immediately prior to the surgery beginning.”
“It was mind-boggling,” said Dr. Lavee, from Tel Aviv University. “When I first started reading, my initial reaction is, ‘This can’t be.’ I read it once, and again, and I insisted that Matt get another independent translation of the Chinese just to be sure. I told him, ‘There’s no way a physician, a surgeon could write this – it doesn’t make sense.’ But the more of these papers we read, we saw it was a pattern – and they didn’t come out of a single medical center, they are spread all over China.”
For the analysis, Mr. Robertson wrote code and customized an algorithm to examine 124,770 medical articles from official Chinese databases between 1980 and 2020. The 71 articles revealing cases involving problematic brain death came from 56 hospitals (of which 12 were military) in 33 cities across 15 provinces, they report. In total, 348 surgeons, nurses, anesthesiologists, and other medical workers or researchers were listed as authors of these publications.
Why would these medical personnel write such self-incriminating evidence? The researchers say it’s unclear. “They don’t think anyone’s reading this stuff,” Mr. Robertson suggests. “Sometimes it’s revealed in just five or six characters in a paper of eight pages.” Dr. Lavee wonders if it’s also ignorance. “If this has been a practice for 20 or 30 years in China, I guess nobody at that time was aware they were doing something wrong, although how to declare brain death is something that is known in China. They’ve published a lot about it.”
The article is “evidence that this barbarity continues and is a very valuable contribution that continues to bring attention to an enormous human rights violation,” said Arthur Caplan, PhD, head of the Division of Medical Ethics at New York University’s Grossman School of Medicine. “What they’ve reported has been going on for many, many years, the data are very clear that China’s doing many more transplants than they have cadaver organ donors,” he said, adding that the country’s well-documented and lucrative involvement in transplant tourism “means you have to have a donor ready when the would-be recipient appears; you have to have a matched organ available, and that’s hard to do waiting on a cadaver donor.”
Although the researchers found no incriminating publications after 2015, they speculate that this is likely due to growing awareness among Chinese surgeons that publishing the information would attract international condemnation. “We think these practices are continuing to go on,” said Dr. Lavee. He acknowledged that a voluntary organ donation program is slowly developing in parallel to this. He said, given China’s place as the world’s second largest transplant country behind the U.S., as well as its low rate of voluntary donation, it’s reasonable to conclude that the main source of organs remains prisoners on death row.
Dr. Caplan and the researchers have called for academic institutions and medical journals to resume their previous boycotts of Chinese transplant publications and speakers, but as long as China denies the practices, economic and political leaders will turn a blind eye. “In the past, I don’t think the question of China’s medical professional involvement in the execution of donors has been taken as seriously as it should have,” said Mr. Robertson. “I certainly hope that with the publication of this paper in the leading journal in the field, this will change.”
The study was supported by the Google Cloud Research Credits program, the Australian Government Research Training Program Scholarship, and the Victims of Communism Memorial Foundation. Mr. Robertson, Dr. Lavee, and Dr. Caplan have disclosed no relevant financial relationships.
A version of this article first appeared on Medscape.com.
Outcomes After Injection-Based Therapy: A Pain Outcomes Questionnaire for Veterans Univariate Analysis
Chronic pain is persistent or recurring pain lasting more than 3 months past normal healing time. Primary care professionals usually refer patients experiencing chronic pain to pain specialists to better identify, treat, and manage the pain. Chronic noncancer-related pain affects more Americans than diabetes mellitus, cardiac disease, and cancer combined.1 Veterans are no exception. The prevalence of severe pain was significantly higher in veterans compared with that of nonveterans who had back pain (21.6 vs 16.7%, respectively), jaw pain (37.5 vs 22.9%, respectively), severe headaches or migraine (26.4 vs 15.9%, respectively), and neck pain (27.7 vs 21.4%, respectively).2 At an individual level, those who experience chronic pain can expect impaired functional capacity, reduced ability to work, sleep disturbance, reduced social interactions, and considerable psychological distress. At a societal level, the cost of treating chronic pain is exorbitant, exceeding $600 billion annually, yet treatment outcomes remain variable at best.3 Greater efforts are needed to improve and standardize patient outcomes.
Interventional pain procedures performed under fluoroscopic or ultrasound guidance by specialist physicians have shown mixed responses in previous studies. Past systematic reviews demonstrate reductions in pain scores after lumbar or caudal epidural steroid injections (ESIs) and radiofrequency ablation of nerves supplying lumbar and thoracic facet joints.4-7 However, one review found insufficient evidence to support injection therapy for chronic low back pain.8 Unfortunately, the majority of the included studies evaluated outcomes using the visual analogue scale (VAS) or other limited factors, such as physical examination findings. Current biopsychosocial conceptualizations of chronic pain are beginning to recognize the complex nature of the experience of pain and highlighting the significance of multimodal management.9 It is vital that our assessment of chronic pain, like our treatment options, be multidimensional and reflect these underpinning principles.
The Pain Outcomes Questionnaire-For Veterans (POQ-VA) was developed within the Veterans Health Administration (VHA) by Clark and colleagues in 2003. It represents a brief but psychometrically sound pain outcomes instrument that assesses all key domains and meets accreditation body standards. The POQ-VA is valid and reliable for evaluating effectiveness of treatment of chronic noncancer pain in veterans in routine clinical practice.10 This review is the first study to use the POQ-VA to assess the impact of interventional pain procedures on veterans with chronic noncancer pain.
The aim of this study was to perform a retrospective review of POQ-VA scores before and after injection-based interventional treatment for chronic pain to determine whether the procedure affected patient outcomes. We hypothesized that POQ-VA scores would improve across multiple domains in the veteran population postprocedure. This study was approved by the Institutional Review Board (IRB-2018-053) at the Providence Veterans Affairs Medical Center (VAMC) in Rhode Island.
Methods
Using the Computerized Patient Record System, all adult veteran patients who had attended at least 2 appointments between April 1, 2009, and April 1, 2019 at the Providence VAMC interventional pain clinic were identified. POQ-VA reports were extracted provided the following criteria were met: (1) the veteran received an injection-based interventional treatment for chronic pain, including trigger point injections, ESIs, nerve blocks, and radiofrequency ablations; (2) the veteran completed POQ-VA both pre- and posttreatment; and (3) posttreatment POQ-VA reports were completed within 6 months of treatment. All patients who did not fit these criteria were excluded from the study.
After deidentification, 112 pre- and posttreatment POQ-VA reports were identified. All subsequent statistical analyses were conducted using Stata SE version 15. Descriptive statistics including mean, range, SD, and percent change were computed for POQ-VA domain—pain, mobility, activities of daily living (ADL), vitality, negative affect, fear, and total raw score—as well as for each POQ-VA question. Given that POQ-VA domain scores were found to be approximately normally distributed without outliers, domain scores were treated as continuous variables, and a paired samples t test was conducted to compare means among POQ-VA domains. Individual question responses were analyzed using nonparametric testing methods to account for the lack of normal distribution in each question, treating the range of 0 to 10 as an ordinal variable. A Wilcoxon matched-pairs signed-rank test was conducted to compare means among individual question responses before and after treatment.
Results
Of 112 included patients, 102 (91%) were male and 10 (9%) were female. The mean age was 62 years (range, 35-90). Diagnosis and procedures varied due to patient symptoms varying from muscle pain, nerve pain, degenerative disc disease, and osteoarthritis.


POQ-VA scores across all domains, including total raw score, showed statistically significant improvement after treatment (Table 1). Directionally, the POQ-VA scores for all 20 questions reflect a positive treatment response and 17 had statistically significant changes (P < .05) (Table 2). The changes in self-perceived energy level, safety, and feelings of tension were not statistically significant. Esteem had the greatest magnitude decrease, falling from 5.2 preprocedure to 3.8 postprocedure (P < .001). Other similarly significant magnitudes of improvement were seen from pre- to postprocedure in questions pertaining to grooming (2.2 to 1.6, P = .003) and the ability to use the bathroom (3.4 to 2.6, P < .001).
Discussion
The most important finding of this study was the ability of the POQ-VA to detect statistically significant positive responses to injection therapy across all domains. The largest improvements were in self-reported pain intensity, pain-related impairment in mobility and ADLs, and self-reported dysphoric effects. The single largest improvement posttreatment was a reduction in scores related to low self-esteem.
Chronic pain can be assessed in a variety of ways ranging from physical examination findings and subjective numerical ratings to extensive patient-reported questionnaires. The International Association for the Study of Pain acknowledges that pain is a complex experience and recommends assessment should be comprehensive.11 Many patient-reported questionnaires are available to clinicians, including some that address pain in a specific body part, such as the Oswestry Low Back Pain Disability Questionnaire, or those that focus on depression or quality-of-life measures, such as the SF-36.12,13
One major benefit of using the POQ-VA is its potential to demonstrate benefits across multiple domains, reflecting the complex nature of chronic pain. The POQ-VA also separates domain or scale scores, allowing clinicians to identify individuals with different patterns of dysfunction across domains.10 This separation also provides insight into which treatment options are best for chronic pain patients with predominant patterns or lower scores in certain domains. The use of a single summary score, as seen in other questionnaires such as the Roland-Morris Activity Scale, may conceal treatment-induced changes in specific outcome domains.14 Additionally, like many other similar instruments, the POQ-VA is easy to understand and use, requires no special training, takes little time to complete, and can be completed in person or over the phone.
As chronic pain has been studied further and its complexity recognized, more instruments have been developed and modified to reflect these new elements. There is no one scale applicable to all populations. A discussion about the strengths and weaknesses of each available assessment tool is outside the scope of this review. However, to date, the POQ-VA is the only instrument that has been validated to detect change following treatment of chronic pain in an exclusively veteran population.10 This validation emphasizes the importance of this study as it supports the use of this outcome measure to monitor treatment of pain in VA facilities.
One of the secondary findings indicated that injection therapy improved veterans’ physical activity levels and self-esteem and lowered pain scores as well as kinesiophobia and anxiety. The role of interventional procedures has been well established in the field of chronic pain, but their efficacy has been less clear. Injections are costly and not without risk, and these factors relegate them to fourth-line treatment options in most situations.15 Several meta-analyses have demonstrated small improvements in pain scores and patient-reported questionnaires after medial branch blocks, and lumbar or caudal ESIs for chronic back pain.5-7 However, an updated Cochrane Review concluded that there was insufficient evidence to support the use of injection therapy in subacute and chronic low back pain.8 The review acknowledged the limited methodologic quality of the trials and could not definitively report that injection therapy did not have benefits for certain subgroups of patients. The ability of researchers to detect benefit from an intervention is intrinsically linked to how outcomes are determined. The most interesting finding of our study was the patient-reported improved self-esteem scores. Many trials included in the systematic reviews discussed used outcome measures that did not have the multidimensional scope to demonstrate such a potential benefit.
Limitations
Our relatively small sample size represents the main shortcoming of this study. Because many posttreatment questionnaires were never collected, unfortunately, much potential data was lost. Most procedures performed were corticosteroid injections for the treatment of low back pain. This represented a combination of lumbar ESI, caudal ESI, medial branch blocks, and sacroiliac joint injections. The limited numbers meant that a further regression analysis of each injection type was not possible. Since few interventions treated pain in other areas of the body, it is difficult to determine whether procedures such as hip joint injections and ilioinguinal nerve blocks provided overall benefit. In the same vein, there is an inability to comment on which injection for chronic low back pain was the most efficacious.
The veteran population, while similar to the general population experiencing chronic pain, is more likely to experience PTSD and other mental health conditions.2 According to medical literature, no randomized controlled trials have been published examining pain interventions exclusively in veterans, so the applicability of these results needs further investigation. This study suggests there are potential benefits for the veteran population, not solely perhaps from receiving injection therapy, but to having access to an interventional pain clinic led by a pain physician within a network of other specialties. While limited by the inherent biases of a retrospective review, this study highlights the potential value in continuing to study this subgroup of patients, especially in the setting of an interdisciplinary approach.
Recent literature suggests interdisciplinary chronic pain management represents the best outcomes for patients’ physical, emotional, and social health, though these kinds of focused outpatient programs have not been studied on a large scale.16 The evolution of pain management in recent years to incorporating a biopsychosocial model has revolutionized how pain is treated and assessed, with multiple studies suggesting the greatest benefits lie in a multipronged approach.16,17 Past studies assessing individual interventions for chronic pain tend not to show strongly positive results, further reinforcing the idea that the answer does not lie in a specific treatment. Many veterans who were included in this study possibly had received or were receiving adjunct therapies such as physical therapy, cognitive behavioral therapy, and acupuncture for pain management, as well as oral and topical medications. Unfortunately, due to the selected methodology, it was not possible for us to gather those data. In turn, we were unable to determine how much these additional factors played a role in changing patient scores, alongside injection therapy. This inability to control variables in this type of research continues to present a challenge to data interpretation, even in the highest quality of research, as acknowledged by Staal and colleagues.8
Future research may be best focused by expanding our knowledge of outpatient interdisciplinary pain management programs. Some interventions may be more relevant for a particular group within a program, and this information can be useful to direct resources.18 Future prospects will require an appropriate multidimensional assessment tool, and the POQ-VA is an example of a valid and reliable option for monitoring progress in pain management in the veteran population.
Conclusions
The POQ-VA is the only instrument to date that has been validated to detect change following treatment of chronic pain in an exclusively veteran population. Our study is the first univariate analysis since the instrument’s validation in 2003. Our descriptive and inferential statistics suggest that the majority of veterans undergoing injection therapy for chronic pain had statistically significant improvements in POQ-VA measures within a 6-month period following treatment. In order to conduct more rigorous, multivariate studies, continued and more widespread use of the POQ-VA instrument is warranted.
1. Johannes CB, Le TK, Zhou X, Johnston JA, Dworkin RH. The prevalence of chronic pain in United States adults: results of an Internet-based survey. J Pain. 2010;11(11):1230-1239. doi:10.1016/j.jpain.2010.07.002
2. Nahin RL. Severe Pain in Veterans: The effect of age and sex, and comparisons with the general population. J Pain. 2017;18(3):247-254. doi:10.1016/j.jpain.2016.10.021
3. Witkin LR, Farrar JT, Ashburn MA. Can assessing chronic pain outcomes data improve outcomes?. Pain Med. 2013;14(6):779-791. doi:10.1111/pme.12075
4. Benyamin RM, Manchikanti L, Parr AT, et al. The effectiveness of lumbar interlaminar epidural injections in managing chronic low back and lower extremity pain. Pain Physician. 2012;15(4):E363-E404.
5. Zhai J, Zhang L, Li M, et al. Epidural injection with or without steroid in managing chronic low-back and lower extremity pain: a meta-analysis of 10 randomized controlled trials. Am J Ther. 2017;24(3):e259-e269. doi:10.1097/MJT.0000000000000265
6. Parr AT, Manchikanti L, Hameed H, et al. Caudal epidural injections in the management of chronic low back pain: a systematic appraisal of the literature. Pain Physician. 2012;15(3):E159-E198.
7. Lee CH, Chung CK, Kim CH. The efficacy of conventional radiofrequency denervation in patients with chronic low back pain originating from the facet joints: a meta-analysis of randomized controlled trials. Spine J. 2017;17(11):1770-1780. doi:10.1016/j.spinee.2017.05.006
8. Staal JB, de Bie R, de Vet HC, Hildebrandt J, Nelemans P. Injection therapy for subacute and chronic low-back pain. Cochrane Database Syst Rev. 2008;2008(3):CD001824. Published 2008 Jul 16. doi:10.1002/14651858.CD001824.pub3
9. Gironda RJ, Clark ME. Cluster analysis of the pain outcomes questionnaire. Pain Med. 2008;9(7):813-823. doi:10.1111/j.1526-4637.2007.00397.x
10. Clark ME, Gironda RJ, Young RW. Development and validation of the Pain Outcomes Questionnaire-VA. J Rehabil Res Dev. 2003;40(5):381-395. doi:10.1682/jrrd.2003.09.0381
11. Watt-Watson J, McGillion M, Lax L, et al. Evaluating an Innovative eLearning Pain Education Interprofessional Resource: A Pre-Post Study. Pain Med. 2019;20(1):37-49. doi:10.1093/pm/pny105
12. Fairbank JC, Couper J, Davies JB, O’Brien JP. The Oswestry low back pain disability questionnaire. Physiotherapy. 1980;66(8):271-273.
13. Ware JE Jr, Sherbourne CD. The MOS 36-item short-form health survey (SF-36). I. Conceptual framework and item selection. Med Care. 1992;30(6):473-483.
14. Jensen MP, Strom SE, Turner JA, Romano JM. Validity of the Sickness Impact Profile Roland scale as a measure of dysfunction in chronic pain patients. Pain. 1992;50(2):157-162. doi:10.1016/0304-3959(92)90156-6
15. Hylands-White N, Duarte RV, Raphael JH. An overview of treatment approaches for chronic pain management. Rheumatol Int. 2017;37(1):29-42. doi:10.1007/s00296-016-3481-8
16. Bujak BK, Regan E, Beattie PF, Harrington S. The effectiveness of interdisciplinary intensive outpatient programs in a population with diverse chronic pain conditions: a systematic review and meta-analysis. Pain Manag. 2019;9(4):417-429. doi:10.2217/pmt-2018-0087
17. Guzmán J, Esmail R, Karjalainen K, Malmivaara A, Irvin E, Bombardier C. Multidisciplinary bio-psycho-social rehabilitation for chronic low back pain. Cochrane Database Syst Rev. 2002;(1):CD000963. doi:10.1002/14651858.CD000963
18. Wilson IR. Management of chronic pain through pain management programmes. Br Med Bull. 2017;124(1):55-64. doi:10.1093/bmb/ldx032
Chronic pain is persistent or recurring pain lasting more than 3 months past normal healing time. Primary care professionals usually refer patients experiencing chronic pain to pain specialists to better identify, treat, and manage the pain. Chronic noncancer-related pain affects more Americans than diabetes mellitus, cardiac disease, and cancer combined.1 Veterans are no exception. The prevalence of severe pain was significantly higher in veterans compared with that of nonveterans who had back pain (21.6 vs 16.7%, respectively), jaw pain (37.5 vs 22.9%, respectively), severe headaches or migraine (26.4 vs 15.9%, respectively), and neck pain (27.7 vs 21.4%, respectively).2 At an individual level, those who experience chronic pain can expect impaired functional capacity, reduced ability to work, sleep disturbance, reduced social interactions, and considerable psychological distress. At a societal level, the cost of treating chronic pain is exorbitant, exceeding $600 billion annually, yet treatment outcomes remain variable at best.3 Greater efforts are needed to improve and standardize patient outcomes.
Interventional pain procedures performed under fluoroscopic or ultrasound guidance by specialist physicians have shown mixed responses in previous studies. Past systematic reviews demonstrate reductions in pain scores after lumbar or caudal epidural steroid injections (ESIs) and radiofrequency ablation of nerves supplying lumbar and thoracic facet joints.4-7 However, one review found insufficient evidence to support injection therapy for chronic low back pain.8 Unfortunately, the majority of the included studies evaluated outcomes using the visual analogue scale (VAS) or other limited factors, such as physical examination findings. Current biopsychosocial conceptualizations of chronic pain are beginning to recognize the complex nature of the experience of pain and highlighting the significance of multimodal management.9 It is vital that our assessment of chronic pain, like our treatment options, be multidimensional and reflect these underpinning principles.
The Pain Outcomes Questionnaire-For Veterans (POQ-VA) was developed within the Veterans Health Administration (VHA) by Clark and colleagues in 2003. It represents a brief but psychometrically sound pain outcomes instrument that assesses all key domains and meets accreditation body standards. The POQ-VA is valid and reliable for evaluating effectiveness of treatment of chronic noncancer pain in veterans in routine clinical practice.10 This review is the first study to use the POQ-VA to assess the impact of interventional pain procedures on veterans with chronic noncancer pain.
The aim of this study was to perform a retrospective review of POQ-VA scores before and after injection-based interventional treatment for chronic pain to determine whether the procedure affected patient outcomes. We hypothesized that POQ-VA scores would improve across multiple domains in the veteran population postprocedure. This study was approved by the Institutional Review Board (IRB-2018-053) at the Providence Veterans Affairs Medical Center (VAMC) in Rhode Island.
Methods
Using the Computerized Patient Record System, all adult veteran patients who had attended at least 2 appointments between April 1, 2009, and April 1, 2019 at the Providence VAMC interventional pain clinic were identified. POQ-VA reports were extracted provided the following criteria were met: (1) the veteran received an injection-based interventional treatment for chronic pain, including trigger point injections, ESIs, nerve blocks, and radiofrequency ablations; (2) the veteran completed POQ-VA both pre- and posttreatment; and (3) posttreatment POQ-VA reports were completed within 6 months of treatment. All patients who did not fit these criteria were excluded from the study.
After deidentification, 112 pre- and posttreatment POQ-VA reports were identified. All subsequent statistical analyses were conducted using Stata SE version 15. Descriptive statistics including mean, range, SD, and percent change were computed for POQ-VA domain—pain, mobility, activities of daily living (ADL), vitality, negative affect, fear, and total raw score—as well as for each POQ-VA question. Given that POQ-VA domain scores were found to be approximately normally distributed without outliers, domain scores were treated as continuous variables, and a paired samples t test was conducted to compare means among POQ-VA domains. Individual question responses were analyzed using nonparametric testing methods to account for the lack of normal distribution in each question, treating the range of 0 to 10 as an ordinal variable. A Wilcoxon matched-pairs signed-rank test was conducted to compare means among individual question responses before and after treatment.
Results
Of 112 included patients, 102 (91%) were male and 10 (9%) were female. The mean age was 62 years (range, 35-90). Diagnosis and procedures varied due to patient symptoms varying from muscle pain, nerve pain, degenerative disc disease, and osteoarthritis.
POQ-VA scores across all domains, including total raw score, showed statistically significant improvement after treatment (Table 1). Directionally, the POQ-VA scores for all 20 questions reflect a positive treatment response and 17 had statistically significant changes (P < .05) (Table 2). The changes in self-perceived energy level, safety, and feelings of tension were not statistically significant. Esteem had the greatest magnitude decrease, falling from 5.2 preprocedure to 3.8 postprocedure (P < .001). Other similarly significant magnitudes of improvement were seen from pre- to postprocedure in questions pertaining to grooming (2.2 to 1.6, P = .003) and the ability to use the bathroom (3.4 to 2.6, P < .001).
Discussion
The most important finding of this study was the ability of the POQ-VA to detect statistically significant positive responses to injection therapy across all domains. The largest improvements were in self-reported pain intensity, pain-related impairment in mobility and ADLs, and self-reported dysphoric effects. The single largest improvement posttreatment was a reduction in scores related to low self-esteem.
Chronic pain can be assessed in a variety of ways ranging from physical examination findings and subjective numerical ratings to extensive patient-reported questionnaires. The International Association for the Study of Pain acknowledges that pain is a complex experience and recommends assessment should be comprehensive.11 Many patient-reported questionnaires are available to clinicians, including some that address pain in a specific body part, such as the Oswestry Low Back Pain Disability Questionnaire, or those that focus on depression or quality-of-life measures, such as the SF-36.12,13
One major benefit of using the POQ-VA is its potential to demonstrate benefits across multiple domains, reflecting the complex nature of chronic pain. The POQ-VA also separates domain or scale scores, allowing clinicians to identify individuals with different patterns of dysfunction across domains.10 This separation also provides insight into which treatment options are best for chronic pain patients with predominant patterns or lower scores in certain domains. The use of a single summary score, as seen in other questionnaires such as the Roland-Morris Activity Scale, may conceal treatment-induced changes in specific outcome domains.14 Additionally, like many other similar instruments, the POQ-VA is easy to understand and use, requires no special training, takes little time to complete, and can be completed in person or over the phone.
As chronic pain has been studied further and its complexity recognized, more instruments have been developed and modified to reflect these new elements. There is no one scale applicable to all populations. A discussion about the strengths and weaknesses of each available assessment tool is outside the scope of this review. However, to date, the POQ-VA is the only instrument that has been validated to detect change following treatment of chronic pain in an exclusively veteran population.10 This validation emphasizes the importance of this study as it supports the use of this outcome measure to monitor treatment of pain in VA facilities.
One of the secondary findings indicated that injection therapy improved veterans’ physical activity levels and self-esteem and lowered pain scores as well as kinesiophobia and anxiety. The role of interventional procedures has been well established in the field of chronic pain, but their efficacy has been less clear. Injections are costly and not without risk, and these factors relegate them to fourth-line treatment options in most situations.15 Several meta-analyses have demonstrated small improvements in pain scores and patient-reported questionnaires after medial branch blocks, and lumbar or caudal ESIs for chronic back pain.5-7 However, an updated Cochrane Review concluded that there was insufficient evidence to support the use of injection therapy in subacute and chronic low back pain.8 The review acknowledged the limited methodologic quality of the trials and could not definitively report that injection therapy did not have benefits for certain subgroups of patients. The ability of researchers to detect benefit from an intervention is intrinsically linked to how outcomes are determined. The most interesting finding of our study was the patient-reported improved self-esteem scores. Many trials included in the systematic reviews discussed used outcome measures that did not have the multidimensional scope to demonstrate such a potential benefit.
Limitations
Our relatively small sample size represents the main shortcoming of this study. Because many posttreatment questionnaires were never collected, unfortunately, much potential data was lost. Most procedures performed were corticosteroid injections for the treatment of low back pain. This represented a combination of lumbar ESI, caudal ESI, medial branch blocks, and sacroiliac joint injections. The limited numbers meant that a further regression analysis of each injection type was not possible. Since few interventions treated pain in other areas of the body, it is difficult to determine whether procedures such as hip joint injections and ilioinguinal nerve blocks provided overall benefit. In the same vein, there is an inability to comment on which injection for chronic low back pain was the most efficacious.
The veteran population, while similar to the general population experiencing chronic pain, is more likely to experience PTSD and other mental health conditions.2 According to medical literature, no randomized controlled trials have been published examining pain interventions exclusively in veterans, so the applicability of these results needs further investigation. This study suggests there are potential benefits for the veteran population, not solely perhaps from receiving injection therapy, but to having access to an interventional pain clinic led by a pain physician within a network of other specialties. While limited by the inherent biases of a retrospective review, this study highlights the potential value in continuing to study this subgroup of patients, especially in the setting of an interdisciplinary approach.
Recent literature suggests interdisciplinary chronic pain management represents the best outcomes for patients’ physical, emotional, and social health, though these kinds of focused outpatient programs have not been studied on a large scale.16 The evolution of pain management in recent years to incorporating a biopsychosocial model has revolutionized how pain is treated and assessed, with multiple studies suggesting the greatest benefits lie in a multipronged approach.16,17 Past studies assessing individual interventions for chronic pain tend not to show strongly positive results, further reinforcing the idea that the answer does not lie in a specific treatment. Many veterans who were included in this study possibly had received or were receiving adjunct therapies such as physical therapy, cognitive behavioral therapy, and acupuncture for pain management, as well as oral and topical medications. Unfortunately, due to the selected methodology, it was not possible for us to gather those data. In turn, we were unable to determine how much these additional factors played a role in changing patient scores, alongside injection therapy. This inability to control variables in this type of research continues to present a challenge to data interpretation, even in the highest quality of research, as acknowledged by Staal and colleagues.8
Future research may be best focused by expanding our knowledge of outpatient interdisciplinary pain management programs. Some interventions may be more relevant for a particular group within a program, and this information can be useful to direct resources.18 Future prospects will require an appropriate multidimensional assessment tool, and the POQ-VA is an example of a valid and reliable option for monitoring progress in pain management in the veteran population.
Conclusions
The POQ-VA is the only instrument to date that has been validated to detect change following treatment of chronic pain in an exclusively veteran population. Our study is the first univariate analysis since the instrument’s validation in 2003. Our descriptive and inferential statistics suggest that the majority of veterans undergoing injection therapy for chronic pain had statistically significant improvements in POQ-VA measures within a 6-month period following treatment. In order to conduct more rigorous, multivariate studies, continued and more widespread use of the POQ-VA instrument is warranted.
1. Johannes CB, Le TK, Zhou X, Johnston JA, Dworkin RH. The prevalence of chronic pain in United States adults: results of an Internet-based survey. J Pain. 2010;11(11):1230-1239. doi:10.1016/j.jpain.2010.07.002
2. Nahin RL. Severe Pain in Veterans: The effect of age and sex, and comparisons with the general population. J Pain. 2017;18(3):247-254. doi:10.1016/j.jpain.2016.10.021
3. Witkin LR, Farrar JT, Ashburn MA. Can assessing chronic pain outcomes data improve outcomes?. Pain Med. 2013;14(6):779-791. doi:10.1111/pme.12075
4. Benyamin RM, Manchikanti L, Parr AT, et al. The effectiveness of lumbar interlaminar epidural injections in managing chronic low back and lower extremity pain. Pain Physician. 2012;15(4):E363-E404.
5. Zhai J, Zhang L, Li M, et al. Epidural injection with or without steroid in managing chronic low-back and lower extremity pain: a meta-analysis of 10 randomized controlled trials. Am J Ther. 2017;24(3):e259-e269. doi:10.1097/MJT.0000000000000265
6. Parr AT, Manchikanti L, Hameed H, et al. Caudal epidural injections in the management of chronic low back pain: a systematic appraisal of the literature. Pain Physician. 2012;15(3):E159-E198.
7. Lee CH, Chung CK, Kim CH. The efficacy of conventional radiofrequency denervation in patients with chronic low back pain originating from the facet joints: a meta-analysis of randomized controlled trials. Spine J. 2017;17(11):1770-1780. doi:10.1016/j.spinee.2017.05.006
8. Staal JB, de Bie R, de Vet HC, Hildebrandt J, Nelemans P. Injection therapy for subacute and chronic low-back pain. Cochrane Database Syst Rev. 2008;2008(3):CD001824. Published 2008 Jul 16. doi:10.1002/14651858.CD001824.pub3
9. Gironda RJ, Clark ME. Cluster analysis of the pain outcomes questionnaire. Pain Med. 2008;9(7):813-823. doi:10.1111/j.1526-4637.2007.00397.x
10. Clark ME, Gironda RJ, Young RW. Development and validation of the Pain Outcomes Questionnaire-VA. J Rehabil Res Dev. 2003;40(5):381-395. doi:10.1682/jrrd.2003.09.0381
11. Watt-Watson J, McGillion M, Lax L, et al. Evaluating an Innovative eLearning Pain Education Interprofessional Resource: A Pre-Post Study. Pain Med. 2019;20(1):37-49. doi:10.1093/pm/pny105
12. Fairbank JC, Couper J, Davies JB, O’Brien JP. The Oswestry low back pain disability questionnaire. Physiotherapy. 1980;66(8):271-273.
13. Ware JE Jr, Sherbourne CD. The MOS 36-item short-form health survey (SF-36). I. Conceptual framework and item selection. Med Care. 1992;30(6):473-483.
14. Jensen MP, Strom SE, Turner JA, Romano JM. Validity of the Sickness Impact Profile Roland scale as a measure of dysfunction in chronic pain patients. Pain. 1992;50(2):157-162. doi:10.1016/0304-3959(92)90156-6
15. Hylands-White N, Duarte RV, Raphael JH. An overview of treatment approaches for chronic pain management. Rheumatol Int. 2017;37(1):29-42. doi:10.1007/s00296-016-3481-8
16. Bujak BK, Regan E, Beattie PF, Harrington S. The effectiveness of interdisciplinary intensive outpatient programs in a population with diverse chronic pain conditions: a systematic review and meta-analysis. Pain Manag. 2019;9(4):417-429. doi:10.2217/pmt-2018-0087
17. Guzmán J, Esmail R, Karjalainen K, Malmivaara A, Irvin E, Bombardier C. Multidisciplinary bio-psycho-social rehabilitation for chronic low back pain. Cochrane Database Syst Rev. 2002;(1):CD000963. doi:10.1002/14651858.CD000963
18. Wilson IR. Management of chronic pain through pain management programmes. Br Med Bull. 2017;124(1):55-64. doi:10.1093/bmb/ldx032