User login
Eliminating the language of blame in lung cancer
“Do you smoke?” I asked the patient.
“Yes, and I got what I deserved,” he answered, clearly upset.
I ignored his reaction and continued with the exam, but in retrospect, I should have explained why doctors ask patients this question.
It was not my intention to be rude or blame the patient for his lung cancer diagnosis. Doctors ask patients if they smoke because a smoking history can change the type of treatment and it can be associated with other conditions that may interfere with treatment. It can also determine whether smoking cessation assistance should be offered to the patient. It is crucial that we as doctors know a patient’s medical history, but how we approach sensitive issues may determine if we even get the information we need. In this case, I didn’t explain why I asked the patient if he smoked. Had I taken the time to explain why I needed to know if and how long he smoked and that I was not blaming him for his lung cancer diagnosis, we may have had a more mutually respectful and beneficial relationship.
Almost all of my patients with lung cancer have been asked at one time or another – by a health care provider, friends, or acquaintances – “Do you smoke?” Whether or not they smoked, patients with lung cancer feel the weight of moral judgment being cast upon them by society.
It is common for people who smoke and who go on to develop lung cancer to be weighed down by guilt associated with their diagnosis. Patients with lung cancer face stigma-associated hurdles based on the “I did it to myself” mindset. This societal stigma is not without harm as it can result in emotional responses of guilt and self-blame. This internalized stigma may lead to psychosocial distress and decreased interactions with family, friends, and health care providers. The guilt may drive a patient to forgo lung cancer screening, minimize symptoms, delay seeking treatment, and not advocate for themselves with their physician. Some patients even decide to forgo all treatment.
What about patients who never smoked? They too feel tinged with blame. Many of these patients feel called upon to defend themselves by proclaiming loudly that they have never smoked.
Blame and shame also divides the lung cancer community, resulting in less advocacy. It may also impact research dollars for lung cancer. According to the Lung Cancer Research Foundation, “Despite being the leading cause of cancer mortality, lung cancer receives far less research funding than any other cancer.” By comparison, women with breast cancer are showered with far more resources, supportive services, fundraising events, and certainly more lobbying.
By making unintentional hurtful statements and using judgmental or denigrating language, the lung cancer community may unconsciously be playing a role in perpetuating stigmas associated with lung cancer. That kind of language can come across as blame.
The International Association for the Study of Lung Cancer has developed a language guide to help reduce stigma associated with lung cancer. The aim is to reduce and replace traditional medical language during our patient interactions, presentations, and publications with language that is more empathic and nonjudgmental.
For example, replace the term “cancer patient” with the term “the patient with cancer.” The patient is a person who happens to have been diagnosed with lung cancer, they are not “cancer.” Patients can be very sensitive to language and may misinterpret language that doctors commonly use. Language such as “the patient failed treatment” may be interpreted by patients as a personal failure. In reality, the treatment failed the patient, instead of the other way around. Instead, shift the blame from the patient to the cancer. Adopt terms like “the tumor did not respond to treatment.” Or, “the cancer progressed” instead of “the patient progressed.”
Language around smoking is particularly stigmatizing because it categorizes a person by a behavior. As health care providers, we should consider removing the term “smoker” from our interactions with patients and instead, use “patient who smokes” or ”patient with a smoking history.” Other ways health care providers can reduce stigma triggered by assessing smoking status include using supportive communication skills, providing a rationale for asking smoking related questions, offering help and tobacco cessation and other resources, and displaying empathic behavior, such as maintaining eye contact and a nonjudgmental body position orientated toward the patient.
Many of these common medical phrases were developed to enable efficient communication among health care professionals. Times have changed and patients should not be defined by an illness. They are people first. In addition to improving patient interactions in clinic, using nonjudgmental language whenever possible in presentations and publications is also extremely important, as patients are living longer and getting more involved in research and advocacy.
“Words have energy and power with the ability to help, to heal, to hinder, to hurt, to harm, to humiliate, and to humble,” says Yehuda Berg, author and codirector of the Kabbalah Centre International in Los Angeles.
Dr. Schiller is a medical oncologist and founding member of Oncologists United for Climate and Health. She is a former board member of the International Association for the Study of Lung Cancer and a current board member of the Lung Cancer Research Foundation.
Ask knee OA patients about stair climbing difficulty
Asking knee osteoarthritis patients a simple question – do you have difficulty climbing stairs? – may predict the risk of future functional limitation, according to research presented at the annual meeting of the American College of Rheumatology. Finding out that the patient has difficulty also opens avenues for further evaluation and intervention, said Jason Jakiela, a PhD candidate at the University of Delaware, Newark, who led the study. “We like to view it as a kind of yellow flag,” Mr. Jakiela said in an interview.
Another expert agreed. “I think this is useful for clinical rheumatologists,” said C. Kent Kwoh, MD, professor of medicine and medical imaging at the University of Arizona, Tucson, and director of the University of Arizona Arthritis Center. He commented on the study findings but was not involved in the study. Another common question asked of OA patients, about pain, may not be as useful as asking about difficulty climbing stairs, he said. “Their pain level can go up and down and can be quite varied.”

Osteoarthritis affects more than 32.5 million adults, according to the CDC, and the knee is a common site.
Study details, results
Mr. Jakiela and his team, including Daniel White, PT, ScD, MSC, associate professor of physical therapy at the University of Delaware, Newark, used data from the Osteoarthritis Initiative (OAI). They assessed stair climbing difficulty at baseline with the question: Does your health now limit you in climbing several flights of stairs? Respondents could answer that they were limited a lot, a little, or not at all.

The researchers evaluated functional limitation using two measures: Walking speed and Western Ontario and McMaster Universities Osteoarthritis Index physical function (WOMAC-PF) scores. A walking speed of < 1.22 m/s over 20 meters, the speed needed to safely cross a timed intersection, represented poor function. A WOMAC-PF score of 28/68 or more was also used to define low functioning.
The analyses included only people free of functional limitations at baseline. Each measure was conducted at the start and then at 12, 24, 36, 48, 72, and 96 months’ follow-up visits.
While 2,952 participants (mean age 60.1, 54% female, mean body mass index 27.9) were in the walking speed sample, 3,983 participants (mean age 61.2, 57% female, mean BMI 28.2) were in the WOMAC-PF sample.

When compared with people who had no limitations, those limited a little had a 47% greater risk of gait speed functional limitation and those limited a lot had a 61% greater risk at follow-up. There was a 70% greater risk for functional limitation defined by WOMAC-PF score at follow-up among people who were limited a little in stair climbing when compared with those not limited at all, and people with a lot of limitations had 161% greater risk. Slow gait speed has been linked with mortality.
Over the 8-year follow-up, 973 in the walking speed sample and 578 in the WOMAC-PF sample developed functional limitation.
Starting the conversation
The question about stair climbing difficulty is a good “jumping-off point,” Mr. Jakiela said. “It opens up a line of questioning.” With knee OA, stair climbing difficulty is often the first reported limitation. That difficulty could capture a variety of issues, he said. Patients could be struggling with strength issues, cardiovascular problems, or balance deficits, for instance.
It signals there may be a trajectory of slow decline coming in this patient, Mr. Jakiela said.
“It’s a signal that something is not right,” Dr. White said in an interview. “We don’t know what is wrong.” While questions about stairs have routinely been asked of OA patients, the study findings suggest the answer to the question about having difficulty could help predict a patient’s future course, he said.
After patients reported a little or a lot of difficulty with stair climbing, the average time to reach functional limitation status was about 3 years, Mr. Jakiela said. That gives health care providers time to ask more questions about the patient’s condition and potentially intervene, depending on the details of the difficulty. If it’s a balance issue, physical therapy might help, for example.
While gait speed is a tried-and-true indication, collecting answers about stair climbing difficulty is easier and quicker for clinicians than assessing gait speed, which requires more time as well as office space, Mr. Jakiela said. It’s also intuitive for the patients to recall, the researchers said.
More practical takeaways
Finding out whether functional limitation is likely, based on the stair question, can help health care providers consider nonpharmacologic interventions, Dr. Kwoh agreed, such as physical therapy or braces. “It doesn’t have to be drugs. We have limited drugs for OA at the moment. We don’t have a so-called DMARD drug [for OA].”

NSAIDs have side effects, and people are very familiar with the issues of opioids, he said. It’s important, he added, for the health care provider, if referring to a physical therapist, to find the right one. To help those dealing with knee OA, a PT in sports medicine might be a good choice, he said.
Mr. Jakiela has no disclosures. Dr. Kwoh and Dr. White have no relevant disclosures.
Asking knee osteoarthritis patients a simple question – do you have difficulty climbing stairs? – may predict the risk of future functional limitation, according to research presented at the annual meeting of the American College of Rheumatology. Finding out that the patient has difficulty also opens avenues for further evaluation and intervention, said Jason Jakiela, a PhD candidate at the University of Delaware, Newark, who led the study. “We like to view it as a kind of yellow flag,” Mr. Jakiela said in an interview.
Another expert agreed. “I think this is useful for clinical rheumatologists,” said C. Kent Kwoh, MD, professor of medicine and medical imaging at the University of Arizona, Tucson, and director of the University of Arizona Arthritis Center. He commented on the study findings but was not involved in the study. Another common question asked of OA patients, about pain, may not be as useful as asking about difficulty climbing stairs, he said. “Their pain level can go up and down and can be quite varied.”
Osteoarthritis affects more than 32.5 million adults, according to the CDC, and the knee is a common site.
Study details, results
Mr. Jakiela and his team, including Daniel White, PT, ScD, MSC, associate professor of physical therapy at the University of Delaware, Newark, used data from the Osteoarthritis Initiative (OAI). They assessed stair climbing difficulty at baseline with the question: Does your health now limit you in climbing several flights of stairs? Respondents could answer that they were limited a lot, a little, or not at all.
The researchers evaluated functional limitation using two measures: Walking speed and Western Ontario and McMaster Universities Osteoarthritis Index physical function (WOMAC-PF) scores. A walking speed of < 1.22 m/s over 20 meters, the speed needed to safely cross a timed intersection, represented poor function. A WOMAC-PF score of 28/68 or more was also used to define low functioning.
The analyses included only people free of functional limitations at baseline. Each measure was conducted at the start and then at 12, 24, 36, 48, 72, and 96 months’ follow-up visits.
While 2,952 participants (mean age 60.1, 54% female, mean body mass index 27.9) were in the walking speed sample, 3,983 participants (mean age 61.2, 57% female, mean BMI 28.2) were in the WOMAC-PF sample.
When compared with people who had no limitations, those limited a little had a 47% greater risk of gait speed functional limitation and those limited a lot had a 61% greater risk at follow-up. There was a 70% greater risk for functional limitation defined by WOMAC-PF score at follow-up among people who were limited a little in stair climbing when compared with those not limited at all, and people with a lot of limitations had 161% greater risk. Slow gait speed has been linked with mortality.
Over the 8-year follow-up, 973 in the walking speed sample and 578 in the WOMAC-PF sample developed functional limitation.
Starting the conversation
The question about stair climbing difficulty is a good “jumping-off point,” Mr. Jakiela said. “It opens up a line of questioning.” With knee OA, stair climbing difficulty is often the first reported limitation. That difficulty could capture a variety of issues, he said. Patients could be struggling with strength issues, cardiovascular problems, or balance deficits, for instance.
It signals there may be a trajectory of slow decline coming in this patient, Mr. Jakiela said.
“It’s a signal that something is not right,” Dr. White said in an interview. “We don’t know what is wrong.” While questions about stairs have routinely been asked of OA patients, the study findings suggest the answer to the question about having difficulty could help predict a patient’s future course, he said.
After patients reported a little or a lot of difficulty with stair climbing, the average time to reach functional limitation status was about 3 years, Mr. Jakiela said. That gives health care providers time to ask more questions about the patient’s condition and potentially intervene, depending on the details of the difficulty. If it’s a balance issue, physical therapy might help, for example.
While gait speed is a tried-and-true indication, collecting answers about stair climbing difficulty is easier and quicker for clinicians than assessing gait speed, which requires more time as well as office space, Mr. Jakiela said. It’s also intuitive for the patients to recall, the researchers said.
More practical takeaways
Finding out whether functional limitation is likely, based on the stair question, can help health care providers consider nonpharmacologic interventions, Dr. Kwoh agreed, such as physical therapy or braces. “It doesn’t have to be drugs. We have limited drugs for OA at the moment. We don’t have a so-called DMARD drug [for OA].”
NSAIDs have side effects, and people are very familiar with the issues of opioids, he said. It’s important, he added, for the health care provider, if referring to a physical therapist, to find the right one. To help those dealing with knee OA, a PT in sports medicine might be a good choice, he said.
Mr. Jakiela has no disclosures. Dr. Kwoh and Dr. White have no relevant disclosures.
FROM ACR 2022
Commentary: Prevention in AD, December 2022

We are in the golden age of atopic dermatitis (AD) drug development. We are fortunate to have numerous topicals, oral systemics, and biologics recently approved or in late-stage clinical development. Yet, we are still lacking effective strategies for primary prevention of incident AD and secondary prevention of AD exacerbations.
Kottner and colleagues published the results from the ADAPI study of 150 infants who were at an enhanced risk for AD. The children were randomly assigned to receive either a skincare regimen that was standardized or unstandardized skincare preferred by parents. They found that in the first year of life, the overall cumulative incidence rate of AD was similar between standardized skincare and skincare preferred by parents (P = .999).
Bradshaw and colleagues also published results from the BEEP study (a 5-year prospective study) of 1394 infants who were at high risk for AD. The children were randomly assigned to receive either emollient for the first year plus standard skincare or standard skincare alone. They found a similar proportion of children were clinically diagnosed with AD between 12 and 60 months in the emollient plus skincare group vs skincare alone group (31% vs 28%; adjusted relative risk 1.10; 95% CI 0.93-1.30). Unfortunately, the results from both studies are consistent with earlier results from BEEP, as well as other studies, and did not show that early application of emollients successfully prevent AD.
The use of applying emollients for primary prevention is unclear. However, proactive application of topical corticosteroids (TCS) and other topical nonsteroidal agents is well accepted in AD treatment guidelines for secondary prevention of AD exacerbations.1 Although, a recent study from Kamiya and colleagues suggested that proactive application of topical corticosteroids may not work as well as we think. They conducted an open-label, active-controlled, parallel-group study of 49 pediatric patients with moderate to severe AD who achieved remission with potent TCS. The children were then randomly assigned to receive proactive therapy with or discontinuation of TCS. The authors found no significant decrease in relapse rates with proactive vs no proactive treatment groups (8.33% vs 20.0%; P = .0859). I don't think these results will change our guidelines. But I do think these results raise important questions about the myriad aspects of proactive therapy that require appropriate counseling, including frequency of application per week (1-3 times), choice of therapies (corticosteroid or nonsteroidal agent), additional emollient use, bathing practice, etc. I personally would strongly recommend use of proactive therapy in clinical practice, but these results highlight that it is not a magic bullet for all patients either.
Additional Reference
- Boguniewicz M, Fonacier L, Guttman-Yassky E, et al. Atopic dermatitis yardstick: practical recommendations for an evolving therapeutic landscape. Ann Allergy Asthma Immunol. 2018;120:10-22.e2. Doi: 10.1016/j.anai.2017.10.039
Vaccination cuts long COVID risk for rheumatic disease patients
Patients with rheumatic disease are at least half as likely to develop long COVID after a SARS-CoV-2 infection if they have been fully vaccinated against COVID-19, according to research published in Annals of the Rheumatic Diseases (2022 Nov 28. doi: 10.1136/ard-2022-223439).
“Moreover, those who were vaccinated prior to getting COVID-19 had less pain and fatigue after their infection,” Zachary S. Wallace, MD, MSc, an assistant professor of medicine at Harvard Medical School, Boston, and a study author, said in an interview. “These findings reinforce the importance of vaccination in this population.”

Messaging around the value of COVID vaccination has been confusing for some with rheumatic disease “because our concern regarding a blunted response to vaccination has led many patients to think that they do not provide much benefit if they are on immunosuppression,” Dr. Wallace said. “In our cohort, which included many patients on immunosuppression of varying degrees, being vaccinated was quite beneficial.”
Leonard H. Calabrese, DO, director of the R.J. Fasenmyer Center for Clinical Immunology and a professor of medicine at the Cleveland Clinic, said in an interview that the study is an “extremely important contribution to our understanding of COVID-19 and its pattern of recovery in patients with immune-mediated inflammatory diseases [IMIDs].” Remaining unanswered questions are “whether patients with IMIDs develop more frequent PASC [post–acute sequelae of COVID-19] from COVID-19 and, if so, is it milder or more severe, and does it differ in its clinical phenotype?”
Long COVID risk assessed at 4 weeks and 3 months after infection
The researchers prospectively tracked 280 adult patients in the Mass General Brigham health care system in the greater Boston area who had systemic autoimmune rheumatic diseases and had an acute COVID-19 infection between March 2020 and July 2022. Patients were an average 53 years old, and most were White (82%) and female (80%). More than half (59%) had inflammatory arthritis, a quarter (24%) had connective tissue disease, and most others had a vasculitis condition or multiple conditions.

A total of 11% of patients were unvaccinated, 28% were partially vaccinated with one mRNA COVID-19 vaccine dose, and 41% were fully vaccinated with two mRNA vaccine doses or one Johnson & Johnson dose. The 116 fully vaccinated patients were considered to have a breakthrough infection while the other 164 were considered to have a nonbreakthrough infection. The breakthrough and nonbreakthrough groups were similar in terms of age, sex, race, ethnicity, smoking status, and type of rheumatic disease. Comorbidities were also similar, except obesity, which was more common in the non–breakthrough infection group (25%) than the breakthrough infection group (10%).
The researchers queried patients on their COVID-19 symptoms, how long symptoms lasted, treatments they received, and hospitalization details. COVID-19 symptoms assessed included fever, sore throat, new cough, nasal congestion/rhinorrhea, dyspnea, chest pain, rash, myalgia, fatigue/malaise, headache, nausea/vomiting, diarrhea, anosmia, dysgeusia, and joint pain.
Patients completed surveys about symptoms at 4 weeks and 3 months after infection. Long COVID, or PASC, was defined as any persistent symptom at the times assessed.
Vaccinated patients fared better across outcomes
At 4 weeks after infection, 41% of fully vaccinated patients had at least one persistent symptom, compared with 54% of unvaccinated or partially vaccinated patients (P = .04). At 3 months after infection, 21% of fully vaccinated patients had at least one persistent symptom, compared with 41% of unvaccinated or partially vaccinated patients (P < .0001).
Vaccinated patients were half as likely to have long COVID at 4 weeks after infection (adjusted odds ratio, 0.49) and 90% less likely to have long COVID 3 months after infection (aOR, 0.1), after adjustment for age, sex, race, comorbidities, and use of any of four immune-suppressing medications (anti-CD20 monoclonal antibodies, methotrexate, mycophenolate, or glucocorticoids).
Fully vaccinated patients with breakthrough infections had an average 21 additional days without symptoms during follow-up, compared with unvaccinated and partially vaccinated patients (P = .04).
Reduced risk of long COVID did not change for vaccinated patients after sensitivity analyses for those who did not receive nirmatrelvir/ritonavir (Paxlovid) or monoclonal antibodies, those who didn’t receive any COVID-19-related treatment, those who completed their questionnaires within 6 months after infection, and those who were not hospitalized.
“One important message is that among those who did get PASC, the severity appears similar among those with and without a breakthrough infection,” Dr. Wallace said. “This highlights the need for ongoing research to improve recognition, diagnosis, and treatment of PASC.”
Many more breakthrough infections (72%) than nonbreakthrough infections (2%) occurred during Omicron. The authors acknowledged that different variants might play a role in different long COVID risks but said such potential confounding is unlikely to fully explain the results.

“Even with data suggesting that the Omicron variants may be intrinsically less severe, vaccination still has an impact on severity of infection, rates of hospitalization, and other outcomes and thus may play a role in the risk of PASC,” lead author Naomi Patel, MD, an instructor at Harvard Medical School and a rheumatologist at Massachusetts General Hospital, said in an interview. “A study evaluating the proportions with PASC by vaccination status during the time in which a single variant is predominant, such as the early Omicron era, could help to better assess the more isolated impact of vaccination on PASC.”
Dr. Calabrese said he is convinced that Omicron infections are less likely to result in more severe forms of acute COVID than pre-Omicron infections, and he suspects Omicron infections are also less likely to result in long COVID, although less evidence currently supports this hypothesis.

Hospitalization was more common in unvaccinated/partly vaccinated patients than in vaccinated patients (27% vs. 5%; P = .001). Although pain and fatigue were lower in those with breakthrough infections, functional scores and health-related quality of life were similar in both groups.
Some symptoms significantly differed between vaccinated and unvaccinated/partly vaccinated groups, possibly caused partly by different variants. Nasal congestion was more common (73%) in those with breakthrough infections than in those with nonbreakthrough infections (46%; P < .0001). Those who were unvaccinated/partly vaccinated were significantly more likely to have loss of smell (46% vs. 22%) or taste (45% vs. 28%) or to have joint pain (11% vs. 4%).
Treatment with nirmatrelvir/ritonavir was also more common in vaccinated patients (12%) than in unvaccinated/partly vaccinated patients (1%; P < .0001), as was treatment with monoclonal antibodies (34% vs. 8%; P < .0001).

The study was limited by its low diversity and being at a single health care system, the authors said. Study coauthor Jeffrey A. Sparks, MD, MMSc, an assistant professor of medicine at Brigham and Women’s Hospital and Harvard Medical School, said in an interview that the group is planning additional studies as their cohort grows, including “investigating the relationships between COVID-19 and specific rheumatic diseases and immunomodulating medications, expansion of autoimmunity and systemic inflammation, and lung damage among specific patient populations.”
Dr. Calabrese said it will be important for follow-up study of the symptomatic patients to “determine how many of these patients will fit the clinical picture of long COVID or long-haul phenotypes over the months and years ahead, including documenting exertional malaise and quality of life.
This study only assessed patients who received zero, one, or two doses of a vaccine, but many patients with rheumatic disease today will likely have received booster doses. However, Dr. Calabrese said it would be difficult to quantify whether a third, fourth, or fifth dose offers additional protection from long-term COVID complications after full vaccination or hybrid vaccination.
The research was funded by the Rheumatology Research Foundation, the National Institutes of Health, the R. Bruce and Joan M. Mickey Research Scholar Fund, and the Llura Gund Award for Rheumatoid Arthritis Research and Care. Dr. Wallace has received research support from Bristol-Myers Squibb and Principia/Sanofi and consulting fees from Zenas BioPharma, Horizon, Sanofi, Shionogi, Viela Bio, and Medpace. Dr. Sparks has received research support from Bristol-Myers Squibb and consulting fees from AbbVie, Amgen, Boehringer Ingelheim, Bristol-Myers Squibb, Gilead, Inova Diagnostics, Janssen, Optum, and Pfizer. Dr. Patel has received consulting fees from FVC Health. Calabrese has consulted for Genentech, Sanofi-Regeneron, AstraZeneca, and GlaxoSmithKline.
A version of this article first appeared on Medscape.com.
Patients with rheumatic disease are at least half as likely to develop long COVID after a SARS-CoV-2 infection if they have been fully vaccinated against COVID-19, according to research published in Annals of the Rheumatic Diseases (2022 Nov 28. doi: 10.1136/ard-2022-223439).
“Moreover, those who were vaccinated prior to getting COVID-19 had less pain and fatigue after their infection,” Zachary S. Wallace, MD, MSc, an assistant professor of medicine at Harvard Medical School, Boston, and a study author, said in an interview. “These findings reinforce the importance of vaccination in this population.”
Messaging around the value of COVID vaccination has been confusing for some with rheumatic disease “because our concern regarding a blunted response to vaccination has led many patients to think that they do not provide much benefit if they are on immunosuppression,” Dr. Wallace said. “In our cohort, which included many patients on immunosuppression of varying degrees, being vaccinated was quite beneficial.”
Leonard H. Calabrese, DO, director of the R.J. Fasenmyer Center for Clinical Immunology and a professor of medicine at the Cleveland Clinic, said in an interview that the study is an “extremely important contribution to our understanding of COVID-19 and its pattern of recovery in patients with immune-mediated inflammatory diseases [IMIDs].” Remaining unanswered questions are “whether patients with IMIDs develop more frequent PASC [post–acute sequelae of COVID-19] from COVID-19 and, if so, is it milder or more severe, and does it differ in its clinical phenotype?”
Long COVID risk assessed at 4 weeks and 3 months after infection
The researchers prospectively tracked 280 adult patients in the Mass General Brigham health care system in the greater Boston area who had systemic autoimmune rheumatic diseases and had an acute COVID-19 infection between March 2020 and July 2022. Patients were an average 53 years old, and most were White (82%) and female (80%). More than half (59%) had inflammatory arthritis, a quarter (24%) had connective tissue disease, and most others had a vasculitis condition or multiple conditions.
A total of 11% of patients were unvaccinated, 28% were partially vaccinated with one mRNA COVID-19 vaccine dose, and 41% were fully vaccinated with two mRNA vaccine doses or one Johnson & Johnson dose. The 116 fully vaccinated patients were considered to have a breakthrough infection while the other 164 were considered to have a nonbreakthrough infection. The breakthrough and nonbreakthrough groups were similar in terms of age, sex, race, ethnicity, smoking status, and type of rheumatic disease. Comorbidities were also similar, except obesity, which was more common in the non–breakthrough infection group (25%) than the breakthrough infection group (10%).
The researchers queried patients on their COVID-19 symptoms, how long symptoms lasted, treatments they received, and hospitalization details. COVID-19 symptoms assessed included fever, sore throat, new cough, nasal congestion/rhinorrhea, dyspnea, chest pain, rash, myalgia, fatigue/malaise, headache, nausea/vomiting, diarrhea, anosmia, dysgeusia, and joint pain.
Patients completed surveys about symptoms at 4 weeks and 3 months after infection. Long COVID, or PASC, was defined as any persistent symptom at the times assessed.
Vaccinated patients fared better across outcomes
At 4 weeks after infection, 41% of fully vaccinated patients had at least one persistent symptom, compared with 54% of unvaccinated or partially vaccinated patients (P = .04). At 3 months after infection, 21% of fully vaccinated patients had at least one persistent symptom, compared with 41% of unvaccinated or partially vaccinated patients (P < .0001).
Vaccinated patients were half as likely to have long COVID at 4 weeks after infection (adjusted odds ratio, 0.49) and 90% less likely to have long COVID 3 months after infection (aOR, 0.1), after adjustment for age, sex, race, comorbidities, and use of any of four immune-suppressing medications (anti-CD20 monoclonal antibodies, methotrexate, mycophenolate, or glucocorticoids).
Fully vaccinated patients with breakthrough infections had an average 21 additional days without symptoms during follow-up, compared with unvaccinated and partially vaccinated patients (P = .04).
Reduced risk of long COVID did not change for vaccinated patients after sensitivity analyses for those who did not receive nirmatrelvir/ritonavir (Paxlovid) or monoclonal antibodies, those who didn’t receive any COVID-19-related treatment, those who completed their questionnaires within 6 months after infection, and those who were not hospitalized.
“One important message is that among those who did get PASC, the severity appears similar among those with and without a breakthrough infection,” Dr. Wallace said. “This highlights the need for ongoing research to improve recognition, diagnosis, and treatment of PASC.”
Many more breakthrough infections (72%) than nonbreakthrough infections (2%) occurred during Omicron. The authors acknowledged that different variants might play a role in different long COVID risks but said such potential confounding is unlikely to fully explain the results.
“Even with data suggesting that the Omicron variants may be intrinsically less severe, vaccination still has an impact on severity of infection, rates of hospitalization, and other outcomes and thus may play a role in the risk of PASC,” lead author Naomi Patel, MD, an instructor at Harvard Medical School and a rheumatologist at Massachusetts General Hospital, said in an interview. “A study evaluating the proportions with PASC by vaccination status during the time in which a single variant is predominant, such as the early Omicron era, could help to better assess the more isolated impact of vaccination on PASC.”
Dr. Calabrese said he is convinced that Omicron infections are less likely to result in more severe forms of acute COVID than pre-Omicron infections, and he suspects Omicron infections are also less likely to result in long COVID, although less evidence currently supports this hypothesis.
Hospitalization was more common in unvaccinated/partly vaccinated patients than in vaccinated patients (27% vs. 5%; P = .001). Although pain and fatigue were lower in those with breakthrough infections, functional scores and health-related quality of life were similar in both groups.
Some symptoms significantly differed between vaccinated and unvaccinated/partly vaccinated groups, possibly caused partly by different variants. Nasal congestion was more common (73%) in those with breakthrough infections than in those with nonbreakthrough infections (46%; P < .0001). Those who were unvaccinated/partly vaccinated were significantly more likely to have loss of smell (46% vs. 22%) or taste (45% vs. 28%) or to have joint pain (11% vs. 4%).
Treatment with nirmatrelvir/ritonavir was also more common in vaccinated patients (12%) than in unvaccinated/partly vaccinated patients (1%; P < .0001), as was treatment with monoclonal antibodies (34% vs. 8%; P < .0001).
The study was limited by its low diversity and being at a single health care system, the authors said. Study coauthor Jeffrey A. Sparks, MD, MMSc, an assistant professor of medicine at Brigham and Women’s Hospital and Harvard Medical School, said in an interview that the group is planning additional studies as their cohort grows, including “investigating the relationships between COVID-19 and specific rheumatic diseases and immunomodulating medications, expansion of autoimmunity and systemic inflammation, and lung damage among specific patient populations.”
Dr. Calabrese said it will be important for follow-up study of the symptomatic patients to “determine how many of these patients will fit the clinical picture of long COVID or long-haul phenotypes over the months and years ahead, including documenting exertional malaise and quality of life.
This study only assessed patients who received zero, one, or two doses of a vaccine, but many patients with rheumatic disease today will likely have received booster doses. However, Dr. Calabrese said it would be difficult to quantify whether a third, fourth, or fifth dose offers additional protection from long-term COVID complications after full vaccination or hybrid vaccination.
The research was funded by the Rheumatology Research Foundation, the National Institutes of Health, the R. Bruce and Joan M. Mickey Research Scholar Fund, and the Llura Gund Award for Rheumatoid Arthritis Research and Care. Dr. Wallace has received research support from Bristol-Myers Squibb and Principia/Sanofi and consulting fees from Zenas BioPharma, Horizon, Sanofi, Shionogi, Viela Bio, and Medpace. Dr. Sparks has received research support from Bristol-Myers Squibb and consulting fees from AbbVie, Amgen, Boehringer Ingelheim, Bristol-Myers Squibb, Gilead, Inova Diagnostics, Janssen, Optum, and Pfizer. Dr. Patel has received consulting fees from FVC Health. Calabrese has consulted for Genentech, Sanofi-Regeneron, AstraZeneca, and GlaxoSmithKline.
A version of this article first appeared on Medscape.com.
FROM ANNALS OF THE RHEUMATIC DISEASES
Immunity debt and the tripledemic
Respiratory syncytial virus (RSV) and influenza cases are surging to record numbers this winter in the wake of the COVID-19 pandemic when children were sheltering in the home, receiving virtual education, masking, and hand sanitizing, and when other precautionary health measures were in place.

RSV and flu illness in children now have hospital emergency rooms and pediatric ICUs and wards over capacity. As these respiratory infections increase and variants of SARS-CoV-2 come to dominate, we may expect the full impact of a tripledemic (RSV + flu + SARS-CoV-2).
It has been estimated that RSV causes 33 million lower respiratory infections and 3.6 million hospitalizations annually worldwide in children younger than 5 years old (Lancet. 2022 May 19. doi: 10.1016/S0140-6736(22)00478-0). RSV is typically a seasonal respiratory infection occurring in late fall through early winter, when it gives way to dominance by flu. Thus, we have experienced an out-of-season surge in RSV since it began in early fall 2022, and it persists. A likely explanation for the early and persisting surge in RSV is immunity debt (Infect Dis Now. 2021 Aug. doi: 10.1016/j.idnow.2021.05.004).
Immunity debt is an unintended consequence of prevention of infections that occurred because of public health measures to prevent spread of SARS-CoV-2 infections. The COVID-19 lockdown undoubtedly saved many lives. However, while we were sheltering from SARS-CoV-2 infections, we also were avoiding other infections, especially other respiratory infections such as RSV and flu.
Our group studied this in community-based pediatric practices in Rochester, N.Y. Physician-diagnosed, medically attended infectious disease illness visits were assessed in two child cohorts, age 6-36 months from March 15 to Dec. 31, 2020 (the pandemic period), compared with the same months in 2019 (prepandemic). One hundred forty-four children were included in the pandemic cohort and 215 in the prepandemic cohort. Visits for bronchiolitis were 7.4-fold lower (P = .04), acute otitis media 3.7-fold lower (P < .0001), viral upper respiratory infections (URI) 3.8-fold lower (P < .0001), and croup 27.5-fold lower (P < .0001) in the pandemic than the prepandemic cohort (Front Pediatr. 2021 Sep 13. doi: 10.3389/fped.2021.72248).
The significant reduction in respiratory illness during the COVID-19 epidemic we and others observed resulted in a large pool of children who did not experience RSV or flu infections for an entire year or more. Herd immunity dropped. The susceptible child population increased, including children older than typically seen. We had an immunity debt that had to be repaid, and the repayment is occurring now.
As a consequence of the surge in RSV, interest in prevention has gained more attention. In 1966, tragically, two infant deaths and hospitalization of 80% of the participating infants occurred during a clinical trial of an experimental candidate RSV vaccine, which contained an inactivated version of the entire virus. The severe side effect was later found to be caused by both an antibody and a T-cell problem. The antibody produced in response to the inactivated whole virus didn’t have very good functional activity at blocking or neutralizing the virus. That led to deposition of immune complexes and activation of complement that damaged the airways. The vaccine also triggered a T-cell response with inflammatory cytokine release that added to airway obstruction and lack of clearance of the virus. RSV vaccine development was halted and the bar for further studies was raised very high to ensure safety of any future RSV vaccines. Now, 55 years later, two RSV vaccines and a new preventive monoclonal antibody are nearing licensure.
GlaxoSmithKline (GSK) and Pfizer are in phase 3 clinical trials of a safer RSV vaccine that contains only the RSV surface protein known as protein F. Protein F changes its structure when the virus infects and fuses with human respiratory epithelial cells. The GSK and Pfizer vaccines use a molecular strategy developed at the National Institutes of Health to lock protein F into its original, prefusion configuration. A similar strategy was used by Pfizer/BioNTech and Moderna in their design of mRNA vaccines to the SARS-CoV-2 spike surface protein.
A vaccine with the F protein in its prefusion form takes care of the antibody problem that caused the severe side-effects from the 1966 version of inactivated whole virus vaccine because it induces very high-efficiency, high-potency antibodies that neutralize the RSV. The T-cell response is not as well understood and that is why studies are being done in adults first and then moving to young infants.
The new RSV vaccines are being developed for use in adults over age 60, adults with comorbidities, maternal immunization, and infants. Encouraging results were recently reported by GSK and Pfizer from adult trials. In an interim analysis, Pfizer also recently reported that maternal immunization in the late second or third trimester with their vaccine had an efficacy of 82% within a newborn’s first 90 days of life against severe lower respiratory tract illness. At age 6 months, the efficacy was sustained at 69%. So far, both the GSK and Pfizer RSV vaccines have shown a favorable safety profile.
Another strategy in the RSV prevention field has been a monoclonal antibody. Palivizumab (Synagis, AstraZeneca) is used to prevent severe RSV infections in prematurely born and other infants who are at higher risk of mortality and severe morbidity. Soon there will likely be another monoclonal antibody, called nirsevimab (Beyfortus, AstraZeneca and Sanofi). It is approved in Europe but not yet approved in the United States as I prepare this column. Nirsevimab may be even better than palivizumab – based on phase 3 trial data – and a single injection lasts through an entire normal RSV season while palivizumab requires monthly injections.
Similar to the situation with RSV, the flu season started earlier than usual in fall 2022 and has been picking up steam, likely also because of immunity debt. The WHO estimates that annual epidemics of influenza cause 1 billion infections, 3 million to 5 million severe cases, and 300,000-500,000 deaths. Seasonal flu vaccines provide modest protection. Current flu vaccine formulations consist of the hemagglutinin (H) and neuraminidase (N) proteins but those proteins change sufficiently (called antigenic drift) such that production of the vaccines based on a best guess each year often is not correct for the influenza A or influenza B strains that circulate in a given year (antigenic mismatch).
Public health authorities have long worried about a major change in the composition of the H and N proteins of the influenza virus (called antigenic shift). Preparedness and response to the COVID-19 pandemic was based on preparedness and response to an anticipated influenza pandemic similar to the 1918 flu pandemic. For flu, new “universal” vaccines are in development. Among the candidate vaccines are mRNA vaccines, building on the success of the SARS-CoV-2 mRNA vaccines (Science. 2022 Nov 24. doi: 10.1126/science.abm0271).
Dr. Pichichero is a specialist in pediatric infectious diseases, Center for Infectious Diseases and Immunology, and director of the Research Institute, at Rochester (N.Y.) General Hospital. He has no conflicts of interest to declare.
Respiratory syncytial virus (RSV) and influenza cases are surging to record numbers this winter in the wake of the COVID-19 pandemic when children were sheltering in the home, receiving virtual education, masking, and hand sanitizing, and when other precautionary health measures were in place.
RSV and flu illness in children now have hospital emergency rooms and pediatric ICUs and wards over capacity. As these respiratory infections increase and variants of SARS-CoV-2 come to dominate, we may expect the full impact of a tripledemic (RSV + flu + SARS-CoV-2).
It has been estimated that RSV causes 33 million lower respiratory infections and 3.6 million hospitalizations annually worldwide in children younger than 5 years old (Lancet. 2022 May 19. doi: 10.1016/S0140-6736(22)00478-0). RSV is typically a seasonal respiratory infection occurring in late fall through early winter, when it gives way to dominance by flu. Thus, we have experienced an out-of-season surge in RSV since it began in early fall 2022, and it persists. A likely explanation for the early and persisting surge in RSV is immunity debt (Infect Dis Now. 2021 Aug. doi: 10.1016/j.idnow.2021.05.004).
Immunity debt is an unintended consequence of prevention of infections that occurred because of public health measures to prevent spread of SARS-CoV-2 infections. The COVID-19 lockdown undoubtedly saved many lives. However, while we were sheltering from SARS-CoV-2 infections, we also were avoiding other infections, especially other respiratory infections such as RSV and flu.
Our group studied this in community-based pediatric practices in Rochester, N.Y. Physician-diagnosed, medically attended infectious disease illness visits were assessed in two child cohorts, age 6-36 months from March 15 to Dec. 31, 2020 (the pandemic period), compared with the same months in 2019 (prepandemic). One hundred forty-four children were included in the pandemic cohort and 215 in the prepandemic cohort. Visits for bronchiolitis were 7.4-fold lower (P = .04), acute otitis media 3.7-fold lower (P < .0001), viral upper respiratory infections (URI) 3.8-fold lower (P < .0001), and croup 27.5-fold lower (P < .0001) in the pandemic than the prepandemic cohort (Front Pediatr. 2021 Sep 13. doi: 10.3389/fped.2021.72248).
The significant reduction in respiratory illness during the COVID-19 epidemic we and others observed resulted in a large pool of children who did not experience RSV or flu infections for an entire year or more. Herd immunity dropped. The susceptible child population increased, including children older than typically seen. We had an immunity debt that had to be repaid, and the repayment is occurring now.
As a consequence of the surge in RSV, interest in prevention has gained more attention. In 1966, tragically, two infant deaths and hospitalization of 80% of the participating infants occurred during a clinical trial of an experimental candidate RSV vaccine, which contained an inactivated version of the entire virus. The severe side effect was later found to be caused by both an antibody and a T-cell problem. The antibody produced in response to the inactivated whole virus didn’t have very good functional activity at blocking or neutralizing the virus. That led to deposition of immune complexes and activation of complement that damaged the airways. The vaccine also triggered a T-cell response with inflammatory cytokine release that added to airway obstruction and lack of clearance of the virus. RSV vaccine development was halted and the bar for further studies was raised very high to ensure safety of any future RSV vaccines. Now, 55 years later, two RSV vaccines and a new preventive monoclonal antibody are nearing licensure.
GlaxoSmithKline (GSK) and Pfizer are in phase 3 clinical trials of a safer RSV vaccine that contains only the RSV surface protein known as protein F. Protein F changes its structure when the virus infects and fuses with human respiratory epithelial cells. The GSK and Pfizer vaccines use a molecular strategy developed at the National Institutes of Health to lock protein F into its original, prefusion configuration. A similar strategy was used by Pfizer/BioNTech and Moderna in their design of mRNA vaccines to the SARS-CoV-2 spike surface protein.
A vaccine with the F protein in its prefusion form takes care of the antibody problem that caused the severe side-effects from the 1966 version of inactivated whole virus vaccine because it induces very high-efficiency, high-potency antibodies that neutralize the RSV. The T-cell response is not as well understood and that is why studies are being done in adults first and then moving to young infants.
The new RSV vaccines are being developed for use in adults over age 60, adults with comorbidities, maternal immunization, and infants. Encouraging results were recently reported by GSK and Pfizer from adult trials. In an interim analysis, Pfizer also recently reported that maternal immunization in the late second or third trimester with their vaccine had an efficacy of 82% within a newborn’s first 90 days of life against severe lower respiratory tract illness. At age 6 months, the efficacy was sustained at 69%. So far, both the GSK and Pfizer RSV vaccines have shown a favorable safety profile.
Another strategy in the RSV prevention field has been a monoclonal antibody. Palivizumab (Synagis, AstraZeneca) is used to prevent severe RSV infections in prematurely born and other infants who are at higher risk of mortality and severe morbidity. Soon there will likely be another monoclonal antibody, called nirsevimab (Beyfortus, AstraZeneca and Sanofi). It is approved in Europe but not yet approved in the United States as I prepare this column. Nirsevimab may be even better than palivizumab – based on phase 3 trial data – and a single injection lasts through an entire normal RSV season while palivizumab requires monthly injections.
Similar to the situation with RSV, the flu season started earlier than usual in fall 2022 and has been picking up steam, likely also because of immunity debt. The WHO estimates that annual epidemics of influenza cause 1 billion infections, 3 million to 5 million severe cases, and 300,000-500,000 deaths. Seasonal flu vaccines provide modest protection. Current flu vaccine formulations consist of the hemagglutinin (H) and neuraminidase (N) proteins but those proteins change sufficiently (called antigenic drift) such that production of the vaccines based on a best guess each year often is not correct for the influenza A or influenza B strains that circulate in a given year (antigenic mismatch).
Public health authorities have long worried about a major change in the composition of the H and N proteins of the influenza virus (called antigenic shift). Preparedness and response to the COVID-19 pandemic was based on preparedness and response to an anticipated influenza pandemic similar to the 1918 flu pandemic. For flu, new “universal” vaccines are in development. Among the candidate vaccines are mRNA vaccines, building on the success of the SARS-CoV-2 mRNA vaccines (Science. 2022 Nov 24. doi: 10.1126/science.abm0271).
Dr. Pichichero is a specialist in pediatric infectious diseases, Center for Infectious Diseases and Immunology, and director of the Research Institute, at Rochester (N.Y.) General Hospital. He has no conflicts of interest to declare.
What is the diagnosis?
Syphilis
Although extremely rare, we checked a Venereal Disease Research Laboratory PCR, the results of which came back positive. A Treponema pallidum hemagglutination assay also returned positive with titers 1:5120 (ULN, < 1:80), confirming the diagnosis of syphilis. During his hospitalization, the patient developed a syphilitic skin rash on his back, chest, palms, feet, and soles (Figure C). The patient was started on penicillin G, 4 million units intravenously every 4 hours. The fever broke 36 hours after antibiotic initiation and 48 hours later, his bilirubin started to downtrend, followed by the alkaline phosphatase and GGT 3 days later. His rash completely disappeared 5 days after antibiotic initiation. He received a total of 2 weeks of penicillin G intravenously at 24 million units a day and his liver enzymes normalized 7 weeks later.
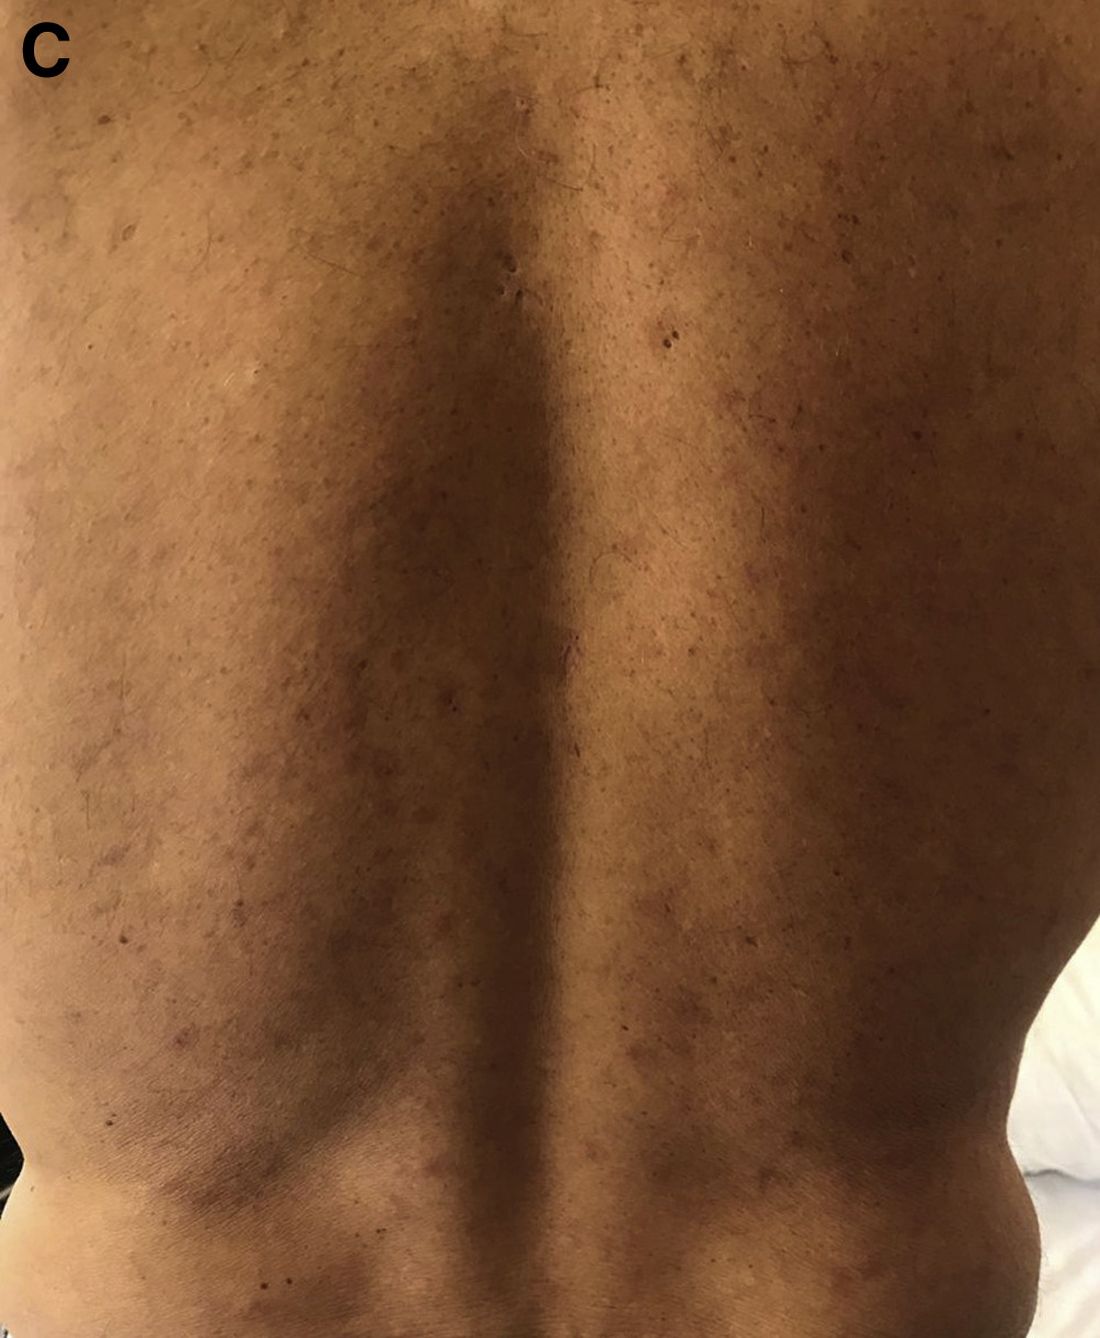
Syphilitic hepatitis is extremely rare and occurs in 0.2% of patients with secondary syphilis.1 There are few cases of syphilitic hepatitis in HIV carriers reported in the literature. Of the described cases, only two patients had an undetectable viral load.2,3 The clinical presentation of syphilitic hepatitis includes jaundice, pruritus, nausea, and vomiting, in addition to generalized symptoms of fatigue, malaise, and weight loss. Biochemically, alkaline phosphatase and GGT are predominantly elevated with mild elevation in the transaminases. Few cases describe an elevation in the bilirubin. Diagnosis is made based on treponemal testing and/or evaluation of tissue for spirochetes on liver biopsy. The majority of cases used penicillin G with excellent response. Doxycycline was also used in one case and ceftriaxone was used in another.
In our case, the patient had several other possible reasons for his liver enzyme elevation, including drug-induced liver injury, cocaine, and alcohol use, which could have contributed to his disturbed liver enzymes. The steady improvement in his cholestatic liver enzymes, fever, and rash, shortly after the initiation of penicillin G indicates that syphilis was the cause of his hepatitis. Given the improvement in his symptoms and biochemical markers, we refrained from obtaining a liver biopsy.
References
1. Lee M., Wang C., Dorer R. et al. A great masquerader: Acute syphilitic hepatitis. Dig Dis Sci. 2013;58:923-5.
2. Mullick CJ. Liappis A.P. Benator D.A. et al. Syphilitic hepatitis in HIV-infected patients: A report of 7 cases and review of the literature. Clin Infect Dis. 2004;39:e100-e105.
3. German MN. Matkowskyj K.A. Hoffman R.J. et al. A case of syphilitic hepatitis in an HIV-infected patient. Hum Pathol. 2018;79:184-7.
Syphilis
Although extremely rare, we checked a Venereal Disease Research Laboratory PCR, the results of which came back positive. A Treponema pallidum hemagglutination assay also returned positive with titers 1:5120 (ULN, < 1:80), confirming the diagnosis of syphilis. During his hospitalization, the patient developed a syphilitic skin rash on his back, chest, palms, feet, and soles (Figure C). The patient was started on penicillin G, 4 million units intravenously every 4 hours. The fever broke 36 hours after antibiotic initiation and 48 hours later, his bilirubin started to downtrend, followed by the alkaline phosphatase and GGT 3 days later. His rash completely disappeared 5 days after antibiotic initiation. He received a total of 2 weeks of penicillin G intravenously at 24 million units a day and his liver enzymes normalized 7 weeks later.
Syphilitic hepatitis is extremely rare and occurs in 0.2% of patients with secondary syphilis.1 There are few cases of syphilitic hepatitis in HIV carriers reported in the literature. Of the described cases, only two patients had an undetectable viral load.2,3 The clinical presentation of syphilitic hepatitis includes jaundice, pruritus, nausea, and vomiting, in addition to generalized symptoms of fatigue, malaise, and weight loss. Biochemically, alkaline phosphatase and GGT are predominantly elevated with mild elevation in the transaminases. Few cases describe an elevation in the bilirubin. Diagnosis is made based on treponemal testing and/or evaluation of tissue for spirochetes on liver biopsy. The majority of cases used penicillin G with excellent response. Doxycycline was also used in one case and ceftriaxone was used in another.
In our case, the patient had several other possible reasons for his liver enzyme elevation, including drug-induced liver injury, cocaine, and alcohol use, which could have contributed to his disturbed liver enzymes. The steady improvement in his cholestatic liver enzymes, fever, and rash, shortly after the initiation of penicillin G indicates that syphilis was the cause of his hepatitis. Given the improvement in his symptoms and biochemical markers, we refrained from obtaining a liver biopsy.
References
1. Lee M., Wang C., Dorer R. et al. A great masquerader: Acute syphilitic hepatitis. Dig Dis Sci. 2013;58:923-5.
2. Mullick CJ. Liappis A.P. Benator D.A. et al. Syphilitic hepatitis in HIV-infected patients: A report of 7 cases and review of the literature. Clin Infect Dis. 2004;39:e100-e105.
3. German MN. Matkowskyj K.A. Hoffman R.J. et al. A case of syphilitic hepatitis in an HIV-infected patient. Hum Pathol. 2018;79:184-7.
A 48-year-old man with HIV infection (PCR undetectable CD4 483) who used cocaine and was a heavy user of alcohol presented with jaundice, fever, and acute-onset left-upper quadrant abdominal pain. The pain was exacerbated by breathing. He had associated intermittent fevers and weight loss starting 3 weeks before presentation. He denied chest pain, nausea, vomiting, or a change in bowel habits. Home medications included dolutegravir, emtricitabine, tenofovir disoproxil fumarate, and recent intake of tamoxifen, clomiphene, and chorionic gonadotropin to counteract the effects of anabolic steroids that were used 4 months before presentation.
On examination, his temperature was 39°C, he was jaundiced, and he had icteric sclera. The abdomen was soft and nondistended with minimal left-upper quadrant tenderness. Blood work showed a white blood cell count of 7,800/mcL, hemoglobin of 12.2 g/dL, platelets of 378,000/mcL, alanine aminotransferase 236 IU/L (upper limit of normal [ULN], 65 IU/L), aspartate aminotransferase 166 IU/L (ULN, 50 IU/L), total bilirubin 3.4 mg/dL (ULN, 1.2 mg/dL), direct bilirubin 2.6 mg/dL (ULN, 0.3 mg/dL), alkaline phosphatase 1,064 IU/L (ULN, 120 IU/L), gamma-glutamyl transferase (GGT) of 655 (ULN, 50 IU/L), protein of 73 g/L, and albumin of 34 g/L. Lipase, lactate dehydrogenase, and international normalized ratio were normal. Blood smear was unrevealing. A contrasted computed tomography scan showed multiple subcentimetric mesenteric and multiple retroperitoneal lymph nodes, the largest of which was 1.3 cm in the aortocaval area. All medications were discontinued. Hepatitis A, B, and C serologies were negative, including hepatitis B and C PCR. Epstein-Barr virus IgM was negative and cytomegalovirus IgM was equivocal.
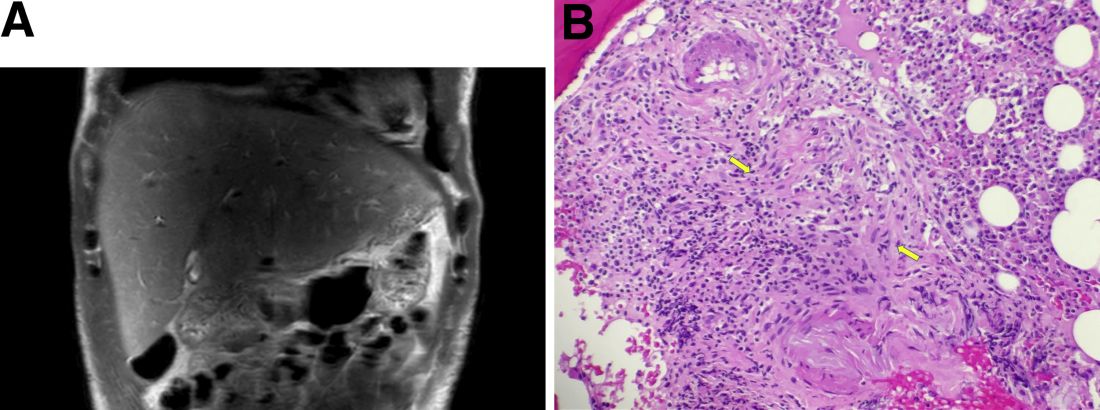
During this hospitalization, his cholestatic liver enzymes continued to rise, reaching a maximum value of total bilirubin of 7.8 mg/dL, direct bilirubin of 6.5 mg/dL, and 3 days later, alkaline phosphatase of 1,637 IU/L and GGT of 1,171 IU/L. Alanine aminotransferase and aspartate aminotransferase slowly downtrended during the hospitalization. Magnetic resonance cholangiopancreatography showed an edematous enlarged liver with minimal peripheral intrahepatic dilatation without an obstructing mass or extrahepatic biliary ductal dilatation (Figure A). Comprehensive autoimmune hepatic serology, iron studies, ceruloplasmin, and alpha-1 antitrypsin labs were negative. The patient remained febrile, so a positron emission tomography computed tomography scan was done and it showed active and enlarged (2.8-cm) portocaval and porta hepatis lymph nodes. Bone marrow biopsy showed no lymphoproliferative disorder, but there was a small poorly formed granuloma (Figure B, between the arrows).
What other testing would you obtain to evaluate this patient's fever and abnormal liver enzymes?
Previously published in Gastroenterology
Children and COVID: Hospitalizations provide a tale of two sources
New cases of COVID-19 in children largely held steady over the Thanksgiving holiday, but hospital admissions are telling a somewhat different story.
New pediatric COVID cases for the week ending on Thanksgiving (11/18-11/24) were up by 5.3% over the previous week, but in the most recent week (11/25-12/1) new cases dropped by 2.6%, according to state data collected by the American Academy of Pediatrics and the Children’s Hospital Association.
In both weeks, though, the total case count stayed below 30,000 – a streak that has now lasted 8 weeks – so the actual number of weekly cases remained fairly low, the AAP/CHA weekly report indicates.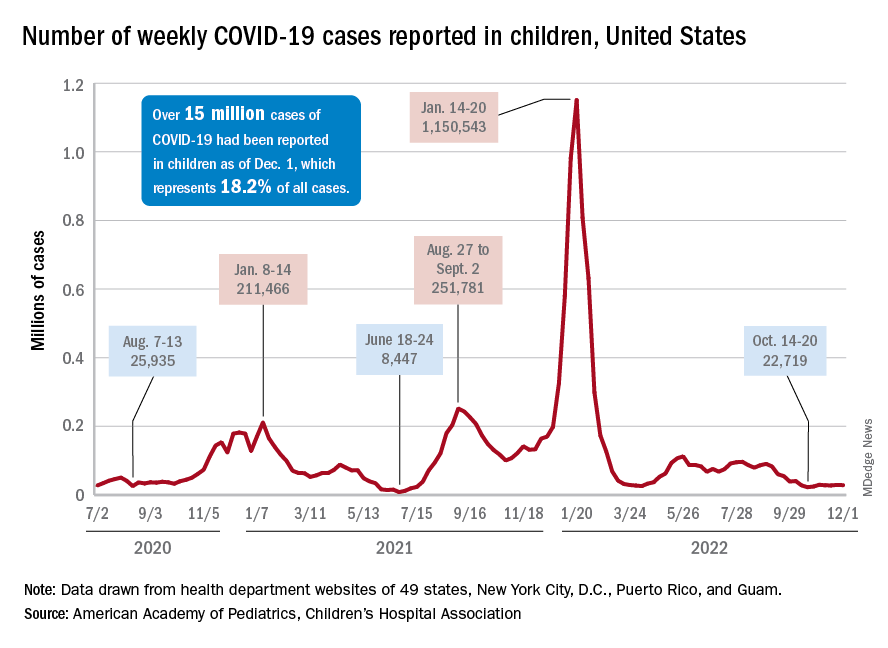
The nation’s emergency departments also experienced a small Thanksgiving bump, as the proportion of visits with diagnosed COVID went from 1.0% of all ED visits for children aged 0-11 years on Nov. 14 to 2.0% on Nov. 27, just 3 days after the official holiday, based on data from the Centers for Disease Control and Prevention. The rate was down to 1.5% on Dec. 1, and similar patterns can be seen for children aged 12-15 and 16-17 years.
New hospital admissions, on the other hand, seem to be following a different path, at least according to the CDC. The hospitalization rate for children aged 0-17 years bottomed out at 0.16 new admissions per 100,000 population back on Oct. 21 and has climbed fairly steadily since then. It was up to 0.20 per 100,000 by Nov. 14, had reached 0.22 per 100,000 on Thanksgiving day (11/24), and then continued to 0.26 per 100,000 by Dec. 2, the latest date for which CDC data are available.
The hospitalization story, however, offers yet another twist. The New York Times, using data from the U.S. Department of Health & Human Services, reports that new COVID-related admissions have held steady at 1.0 per 100,000 since Nov. 18. The rate is much higher than has been reported by the CDC, but no increase can be seen in recent weeks among children, which is not the case for Americans overall, Medscape recently reported.
Diagnosed too late
It had only been 3 weeks since I first met this patient. She presented with an advanced case of colon cancer, but instead of treatment,
Within the course of 2 weeks I saw another new patient, but this time with pancreatic cancer that metastasized to the liver. “When can we start treatment?” he asked. Like my female patient with colon cancer, he was diagnosed too late as he was already in an incurable stage. He was shocked to learn that his condition was in stage 4, that achieving remission would be difficult and a cure, not likely. Certainly, standard of care treatments and clinical trials offered him hope, but they were unlikely to change the outcome.
We take a course in this – that is, in giving bad news, but every doctor has his or her own approach. Some are so uncomfortable with the talk, they choose avoidance and adopt the “look like you gotta go approach.” Or, the doctor may schedule another treatment or another test with the intention of avoiding end-of-life discussions. Other doctors opt for straight talk: “I think you should get your affairs in order. You’ve got 3 months to live.” These are extreme behaviors I wouldn’t recommend.
In my practice, I sit with my patients and explain the diagnosis. After discussing all options and the advanced stage and diagnosis, it ultimately comes down to “Win or lose, I will be here to take care of you.” Sometimes there is therapy that may help, but either way, the patient understands that death is a real possibility.
I find that people just want to know if there is hope. A different treatment regimen or a clinical trial may (or may not) extend their life. And while we cannot predict outcomes, we can give them hope. You can’t shut down hope. True for some people the cup is always half empty, but most people want to live and are optimistic no matter how small the chances are.
These conversations are very difficult. I don’t like them, but then I don’t avoid them either. Fortunately, patients don’t usually come to my office for the first visit presenting with advanced disease. In the cases I described above, one patient had been experiencing unexplained weight loss, but didn’t share it with a physician. And, for the patient with pancreatic cancer, other than some discomfort in the last couple of weeks, the disease was not associated with other symptoms. But the absence of symptoms should not in any way rule out a malignant disease. A diagnosis should be based on a complete evaluation of signs and symptoms followed by testing.
We’ve got to be able to take the time to listen to our patients during these encounters. We may not spend as much time as we should because we’re so busy now and we’re slaves to EMRs. It helps if we take more time to probe symptoms a little longer, especially in the primary care setting.
It is possible for a patient with cancer to be asymptomatic up until the later stages of the disease. A study published in ESMO Open in 2020 found that fewer than half of patients with stage 4 non–small cell lung cancer have only one or two symptoms at diagnosis regardless of whether the patient was a smoker. In this study only 33% of patients reported having a cough and 25% had chest pain.
A study presented in October at the United European Gastroenterology Week found that of 600 pancreatic cancer cases, 46 of these were not detected by CT or MRI conducted 3-18 months prior to diagnosis. Of the 46 cases, 26% were not picked up by the radiologist and the rest were largely as a result of imaging changes over time. Radiology techniques are good, but they cannot pick up lesions that are too small. And some lesions, particularly in pancreatic cancer, can grow and metastasize rather quickly.
When a patient is diagnosed with advanced disease, it is most often simply because of the nature of the disease. But sometimes patients put off scheduling a doctor visit because of fear of the potential for bad news or fear of the doctor belittling their symptoms. Some tell me they were “just hoping the symptoms would disappear.” Waiting too long to see a doctor is never a good idea because timing is crucial. In many cases, there is a small window of opportunity to treat disease if remission is to be achieved.
Dr. Henry is a practicing clinical oncologist with PennMedicine in Philadelphia where he also serves as Vice Chair of the Department of Medicine at Pennsylvania Hospital.
This article was updated 12/7/22.
‘Game changer’: Thyroid cancer recurrence no higher with lobectomy
Patients with intermediate-risk papillary thyroid cancer and lymph node metastasis show no significant increase in tumor recurrence when undergoing lobectomy compared with a total thyroidectomy, new research shows.
“Results of this cohort study suggest that patients with ipsilateral clinical lateral neck metastasis (cN1b) papillary thyroid cancer who underwent lobectomy exhibited recurrence-free survival rates similar to those who underwent total thyroidectomy after controlling for major prognostic factors,” the authors conclude in the study published online in JAMA Surgery.
“These findings suggest that cN1b alone should not be an absolute indication for total thyroidectomy,” they note.
The study, involving the largest cohort to date to compare patients with intermediate-risk papillary thyroid cancer treated with lobectomy versus total thyroidectomy, “challenged the current guidelines and pushed the boundary of limited surgical treatment even further,” say Michelle B. Mulder, MD, and Quan-Yang Duh, MD, of the department of surgery, University of California, San Francisco, in an accompanying editorial.
“It can be a game changer if confirmed by future prospective and multicenter studies,” they add.
Guidelines still recommend total thyroidectomy with subsequent RAI
While lower-intensity treatment options, with a lower risk of complications, have gained favor in the treatment of low-risk papillary thyroid cancer, guidelines still recommend the consideration of total thyroidectomy and subsequent radioactive iodine ablation (RAI) for intermediate-risk cancers because of the higher chance of recurrence, particularly among those with clinically positive nodes.
However, data on the superiority of a total thyroidectomy, with or without RAI, versus lobectomy is inconsistent, prompting first author Siyuan Xu, MD, of the department of head and neck surgical oncology, National Cancer Center, Beijing, and colleagues to compare the risk of recurrence with the two approaches.
For the study, patients with intermediate-risk papillary thyroid cancer treated at the Chinese Academy of Medical Sciences Cancer Hospital in Beijing between January 2000 and December 2017, who had a lobectomy or total thyroidectomy, were paired 1:1 in a propensity score matching analysis.
Other than treatment type, the 265 pairs of patients were matched based on all other potential prognostic factors, including age, sex, primary tumor size, minor extrathyroidal extension, multifocality, number of lymph node metastases, and lymph node ratio.
Participants were a mean age of 37 years and 66% were female.
With a median follow-up of 60 months in the lobectomy group and 58 months in the total thyroidectomy group, structural recurrences occurred in 7.9% (21) and 6.4% (17) of patients, respectively, which was not significantly different.
The primary endpoint, 5-year rate of recurrence-free survival, was also not significantly different between the lobectomy (92.3%) and total thyroidectomy groups (93.7%) (adjusted hazard ratio, 1.10; P = .77).
In a further stratified analysis of patients treated with total thyroidectomy along with RAI (n = 75), the lack of a significant difference in recurrence-free survival versus lobectomy remained (aHR, 0.59; P = .46).
The results were similar in unadjusted as well as adjusted analyses, and a power analysis indicated that the study had a 90% power to detect a more than 4.9% difference in recurrence-free survival.
“Given the lower complication rate of lobectomy, a maximal 4.9% recurrence-free survival difference is acceptable, which enhances the reliability of the study results,” the authors say.
They conclude that “our findings call into question whether cN1b alone [ipsilateral clinical lateral neck metastasis papillary thyroid cancer] should be an absolute determinant for deciding the optimal extent of thyroid surgery for papillary thyroid cancer.”
With total thyroidectomy, RAI can be given
An important argument in favor of total thyroidectomy is that with the complete resection of thyroid tissue, RAI ablation can then be used for postoperative detection of residual or metastatic disease, as well as for treatment, the authors note.
Indeed, a study using the Surveillance, Epidemiology, and End Results (SEER) database showed RAI ablation is associated with a 29% reduction in the risk of death in patients with intermediate-risk papillary thyroid cancer, with a hazard risk of 0.71.
However, conflicting data from Memorial Sloan-Kettering Cancer Center, New York, suggests no significant benefit with total thyroidectomy and RAI ablation.
The current study’s analysis of patients treated with RAI, though limited in size, supports the latter study’s findings, the authors note.
“When we performed further stratified analyses in patients treated with total thyroidectomy plus RAI ablation and their counterparts, no significant difference was found, which conformed with [the] result from the whole cohort.”
“Certainly, the stratified comparison did not have enough power to examine the effect of RAI ablation on tumor recurrence subject to the limitation of sample size and case selection [and] further study is needed on this topic,” they write.
Some limitations warrant cautious interpretation
In their editorial, Dr. Mulder and Dr. Duh note that while some previous studies have shown similar outcomes relating to tumor size, thyroid hormone suppression therapy, and multifocality, “few have addressed lateral neck involvement.”
They suggest cautious interpretation, however, due to limitations, acknowledged by the authors, including the single-center nature of the study.
“Appropriate propensity matching may mitigate selection bias but cannot eliminate it entirely and their findings may not be replicated in other institutions by other surgeons,” they note.
Other limitations include that changes in clinical practice and patient selection were likely over the course of the study because of significant changes in American Thyroid Association (ATA) guidelines between 2009 and 2017, and characteristics including molecular genetic testing, which could have influenced final results, were not taken into consideration.
Furthermore, for patients with intermediate-risk cancer, modifications in postoperative follow-up are necessary following lobectomy versus total thyroidectomy; “the role of radioiodine is limited and the levels of thyroglobulin more complicated to interpret,” they note.
The study and editorial authors had no disclosures to report.
A version of this article first appeared on Medscape.com.
FROM JAMA SURGERY
Youths have strong opinions on language about body weight
With youth obesity on the rise – an estimated 1 in 5 youths are impacted by obesity, according to the Centers for Disease Control and Prevention – conversations about healthy weight are becoming more commonplace, not only in the pediatrician’s office, but at home, too. But the language we use around this sensitive topic is important, as youths are acutely aware that words have a direct impact on their mental health.
Sixteen-year-old Avery DiCocco of Northbrook, Ill., knows how vulnerable teenagers feel.
“I think it definitely matters the way that parents and doctors address weight,” she said. “You never know who may be insecure, and using negative words could go a lot further than they think with impacting self-esteem.”
A new study published in Pediatrics brings light to the words that parents (and providers) use when speaking to youths (ages 10-17) about their weight.
Researchers from the University of Connecticut Rudd Center for Food Policy & Health, Hartford, led an online survey of youths and their parents. Those who took part were asked about 27 terms related to body weight. Parents were asked to comment on their use of these words, while youths commented on the emotional response. The researchers said 1,936 parents and 2,032 adolescents were surveyed between September and December 2021.
Although results skewed toward the use of more positive words, such as “healthy weight,” over terms like “obese,” “fat” or “large,” there was variation across ethnicity, sexual orientation, and weight status. For example, it was noted in the study, funded by WW International, that preference for the word “curvy” was higher among Hispanic/Latino youths, sexual minority youths, and those with a body mass index in the 95th percentile, compared with their White, heterosexual, and lower-weight peers.
Words matter
In 2017, the American Academy of Pediatrics came out with a policy statement on weight stigma and the need for doctors to use more neutral language and less stigmatizing terms in practice when discussing weight among youths.
But one of the reasons this new study is important, said Gregory Germain, MD, associate chief of pediatrics at Yale New Haven (Conn.) Children’s Hospital, is that this study focuses on parents who interact with their kids much more often than a pediatrician who sees them a few times a year.
“Parental motivation, discussion, interaction on a consistent basis – that dialogue is so critical in kids with obesity,” said Germain, who stresses that all adults, coaches, and educators should consider this study as well.
“When we think about those detrimental impacts on mental health when more stigmatizing language is used, just us being more mindful in how we are talking to youth can make such a profound impact,” said Rebecca Kamody, PhD, a clinical psychologist at Yale University, with a research and clinical focus on eating and weight disorders.
“In essence, this is a low-hanging fruit intervention,” she said.
Dr. Kamody recommends we take a lesson from “cultural humility” in psychology to understand how to approach this with kids, calling for “the humbleness as parents or providers in asking someone what they want used to make it the safest place for a discussion with our youth.”
One piece of the puzzle
Dr. Germain and Dr. Kamody agreed that language in discussing this topic is important but that we need to recognize that this topic in general is extremely tricky.
For one, “there are these very real metabolic complications of having high weight at a young age,” said Kamody, who stresses the need for balance to make real change.
Dr. Germain agreed. “Finding a fine line between discussing obesity and not kicking your kid into disordered eating is important.”
The researchers also recognize the limits of an online study, where self-reporting parents may not want to admit using negative weight terminology, but certainly believe it’s a start in identifying some of the undesirable patterns that may be occurring when it comes to weight.
“The overarching message is a positive one, that with our preteens and teenage kids, we need to watch our language, to create a nonjudgmental and safe environment to discuss weight and any issue involved with taking care of themselves,” said Dr. Germain.
A version of this article first appeared on Medscape.com.
FROM PEDIATRICS