User login
The Journal of Clinical Outcomes Management® is an independent, peer-reviewed journal offering evidence-based, practical information for improving the quality, safety, and value of health care.
div[contains(@class, 'header__large-screen')]
div[contains(@class, 'read-next-article')]
div[contains(@class, 'nav-primary')]
nav[contains(@class, 'nav-primary')]
section[contains(@class, 'footer-nav-section-wrapper')]
footer[@id='footer']
div[contains(@class, 'main-prefix')]
section[contains(@class, 'nav-hidden')]
div[contains(@class, 'ce-card-content')]
nav[contains(@class, 'nav-ce-stack')]
Moderna needs more kids for COVID vaccine trials
according to the company CEO and a federal official.
The Moderna vaccine was authorized for use in December and is now being given to people 18 and over. But children would receive lower doses, so new clinical trials must be done, Moderna CEO Stephane Bancel said at the JPMorgan virtual Health Care Conference on Monday.
Clinical trials on children 11 and younger “will take much longer, because we have to age deescalate and start at a lower dose. So we should not anticipate clinical data in 2021, but more in 2022,” Ms. Bancel said, according to Business Insider.
Moderna’s clinical trials for 12- to 17-year-olds started 4 weeks ago, but the company is having trouble getting enough participants, said Moncef Slaoui, PhD, the scientific head of Operation Warp Speed, the U.S. government’s vaccine effort. That could delay Food and Drug Administration approval, he said.
“It’s really very important for all of us, for all the population in America, to realize that we can’t have that indication unless adolescents aged 12-18 decide to participate,” Dr. Slaoui said, according to USA Today.
He said the adolescent trials are getting only about 800 volunteers a month, but need at least 3,000 volunteers to complete the study, USA Today reported. Parents interested in having their child participate can check eligibility and sign at this website.
The Pfizer/BioNTech vaccine won authorization for use in 16- to 17-year-olds as well as adults.
The coronavirus doesn’t appear to have as serious complications for children as for adults.
“At this time, it appears that severe illness due to COVID-19 is rare among children,” the American Association of Pediatrics says. “However, there is an urgent need to collect more data on longer-term impacts of the pandemic on children, including ways the virus may harm the long-term physical health of infected children, as well as its emotional and mental health effects.”
The association says 179 children had died of COVID-related reasons in 43 states and New York City as of Dec. 31, 2020. That’s about 0.06% of total COVID deaths, it says.
But children do get sick. As of Jan. 7, 2021, nearly 2.3 million children had tested positive for COVID-19 since the start of the pandemic, the association says.
A version of this article first appeared on WebMD.com.
Nulliparity, not ART, likely raises risk of ovarian cancer
Women who receive ovarian stimulation for assisted reproductive technology (ART) procedures don’t have an increased risk of developing ovarian cancer when compared to subfertile women who don’t undergo ART, according to a new study.
The results suggest that nulliparity is likely responsible for the increased risk of ovarian cancer observed in patients treated with ART, the researchers said.
Earlier, shorter studies had only compared ART-treated women with women from the general population.
“Subfertile women differ from women in the general population according to several ovarian cancer risk factors. Therefore, to estimate the risk of ovarian cancer associated with ART, it was important to include a comparison group of women who were subfertile and not treated with ART,” said senior study author Flora E. van Leeuwen, PhD, of Netherlands Cancer Institute in Amsterdam.
She and her colleagues conducted a nationwide cohort study of 30,625 women who received ovarian stimulation for ART during 1983-2000 and 9,988 women who received fertility treatments other than ART.
Incident invasive and borderline ovarian tumors were ascertained through linkage with the Netherlands Cancer Registry and the Dutch Pathology Registry. Ovarian tumor risk in ART-treated women was compared with risks in the general population and the subfertile non-ART group.
The researchers reported the results in the Journal of the National Cancer Institute.
Risk of ovarian cancer
Women treated with ART were no more likely to develop ovarian cancer than subfertile women not treated with ART (adjusted hazard ratio, 1.02), but the ART group did have an increased risk of ovarian cancer when compared to the general population (standardized incidence ratio, 1.43).
“This, however, turned out to be due to the fact that the women who had received ART were less likely to have children. Not having children is a known risk factor for ovarian cancer,” Dr. van Leeuwen said.
Women with more ART procedures that resulted in the birth of a child were at lower risk of developing ovarian cancer, compared with women without any successful cycle (Ptrend = .001). However, women who had only cycles not resulting in a birth were not at higher risk of ovarian cancer when they had a greater number of cycles.
“These results indicate that parity decreases the risk of ovarian cancer, also in ART-treated women. But more unsuccessful ART cycles do not increase the risk of ovarian cancer,” Dr. van Leeuwen said.
Risk of borderline ovarian tumors
The risk of developing borderline ovarian tumors was roughly twice as high in women who had received ART, both compared with women who had received other fertility treatments (hazard ratio, 1.84) and women from the general population (standardized incidence ratio, 2.20).
However, the risk of developing borderline ovarian tumors did not increase in women who had received multiple ART procedures.
“If there was a causal association between ART and increased risk of borderline ovarian tumors, we would expect to see this risk increase with a greater number of ART procedures from more hormones and more stimulation of the ovaries. This makes the direct link between ART and increased risk of borderline tumors a bit uncertain. It might be caused by other factors, such as the severity of infertility,” Dr. van Leeuwen said.
Borderline ovarian tumors are rare in the general population in the Netherlands, and women who develop these tumors generally have a good prognosis, she said.
The risk of developing a borderline tumor before the age of 55 for women in the Netherlands is approximately 0.2%. After ART, the study found a risk of approximately 0.3%.
Causal associations with ART 'unlikely'
“Women who develop cancer and have undergone ART procedures in the past may wonder whether their cancer may be caused by ART. Based on the results from our study, that seems unlikely, and that is a very reassuring message from practicing oncologists to women diagnosed with ovarian cancer. Another important message is that, in ART-treated women, increasing parity reduces the risk of ovarian cancer,” Dr. van Leeuwen said.
She added that the risk of borderline ovarian tumors did not increase in women who received multiple ART procedures, “which makes it somewhat less likely that ART would have caused their borderline ovarian tumor.”
The study does not exclude the possibility that ART might increase the risk of ovarian tumors after age 60.
“Despite our long follow-up, the age of the women at the end of our study was still relatively young [average 56 years]. Because the incidence of ovarian cancer increases with older age, it is vital to continue to follow these women. Only then can we be sure that ART does not increase the risk of ovarian tumors in the very long run,” Dr. van Leeuwen said.
“This study offers confirmation of several previous studies and provides reassurance about the risk of ovarian cancer after ART procedures,” said Daniel Kenigsberg, MD, of RMA Long Island IVF in New York. Dr. Kenigsberg was not involved in this study but has performed more than 30,000 ART procedures over the past 32 years.
“Researchers have looked at whether fertility drugs cause ovarian cancer in different ways and in different countries, and there is no cause-and-effect relationship. There was no dose-response relationship between ART and ovarian tumors in this study. It’s more likely there is something wrong with the women’s ovaries that lead to borderline tumors and infertility more than any treatment,” Dr. Kenigsberg added.
“Perhaps both fertility and cancer relate to an underlying ovarian issue, but this would not explain the increased cancer incidence in those who never attempted pregnancy, that is, women who are voluntarily childless. Pregnancy is statistically protective: more pregnancies lead to less ovarian cancer, but this is far from absolute,” he explained.
Dr. Kenigsberg suggested that oncologists should be aware of a patient’s obstetrical history and fertility history as well as any related medical interventions.
“Borderline tumors look like cancer and have histologic features of cancer but do not meet the criteria for a cancer diagnosis,” he said. “They require close surveillance because their relationship to the development of full-fledged cancer is uncertain.”
This research was supported by grants from the Dutch Cancer Society. The authors and Dr. Kenigsberg have no conflicts of interest.
FROM JOURNAL OF THE NATIONAL CANCER INSTITUTE
Could an osteoporosis drug reduce need for hip revision surgery?
A single injection of denosumab (Prolia, Amgen), frequently used to treat osteoporosis, may reduce the need for revision surgery in patients with symptomatic osteolysis following total hip arthroplasty, a new proof-of-concept study suggests.
Aseptic loosening is the result of wear-induced osteolysis caused by the prosthetic hip and is a major contributor to the need for revision surgery in many parts of the world.
“The only established treatment for prosthesis-related osteolysis after joint replacement is revision surgery, which carries substantially greater morbidity and mortality than primary joint replacement,” Mohit M. Mahatma, MRes, of the University of Sheffield, England, and colleagues wrote in their article, published online Jan. 11 in The Lancet Rheumatology.
As well as an increased risk of infection and other complications, revision surgery is much more costly than a first-time operation, they added.
“The results of this proof-of-concept clinical trial indicate that denosumab is effective at reducing bone resorption activity within osteolytic lesion tissue and is well tolerated within the limitations of the single dose used here,” they concluded.
Commenting on the findings, Antonia Chen, MD, associate professor of orthopedic surgery, Harvard Medical School, Boston, emphasized that further studies are needed to assess the effectiveness of this strategy to reduce the need for hip revision surgery.
Nevertheless, “osteolysis is still unfortunately a problem we do have to deal with and we do not have any other way to prevent it,” she said in an interview. “So it’s a good start ... although further studies are definitely needed,” Dr. Chen added.
In an accompanying editorial, Hannu Aro, MD, Turku University Hospital in Finland, agreed: “Without a doubt, the trial is a breakthrough, but it represents only the first step in the development of pharmacological therapy aiming to slow, prevent, or even reverse the process of wear-induced periprosthetic osteolysis.”
Small single-center study
The phase 2, single-center, randomized, controlled trial involved 22 patients who had previously undergone hip replacement surgery at Sheffield Teaching Hospitals and were scheduled for revision surgery due to symptomatic osteolysis. They were randomized to a single subcutaneous injection of denosumab at a dose of 60 mg, or placebo, on their second hospital visit.
“The primary outcome was the between-group difference in the number of osteoclasts per mm of osteolytic membrane at the osteolytic membrane-bone interface at week 8,” the authors noted.
At this time point, there were 83% fewer osteoclasts at the interface in the denosumab group compared with placebo, at a median of 0.05 per mm in the treatment group compared with 0.30 per mm in the placebo group (P = .011).
Secondary histological outcomes were also significantly improved in favor of the denosumab group compared with placebo.
Potential to prevent half of all hip revision surgeries?
Patients who received denosumab also demonstrated an acute fall in serum and urinary markers of bone resorption following administration of the drug, reaching a nadir at week 4, which was maintained until revision surgery at week 8.
In contrast, “no change in these markers was observed in the placebo group [P < .0003 for all biomarkers],” the investigators noted. Rates of adverse events were comparable in both treatment groups.
As the authors explained, osteolysis occurs following joint replacement surgery when particles of plastic wear off from the prosthesis, triggering an immune reaction that attacks the bone around the implant, causing the joint to loosen.
“It is very clear from our bone biopsies and bone imaging that the [denosumab] injection stops the bone absorbing the microplastic particles from the replacement joint and therefore could prevent the bone from being eaten away and the need for revision surgery,” senior author Mark Wilkinson, MBChB, PhD, honorary consultant orthopedic surgeon, Sheffield Teaching Hospitals, said in a press release from his institution.
“This study is a significant breakthrough as we’ve demonstrated that there is a drug, already available and successful in the treatment of osteoporosis, that has the potential to prevent up to half of all revised replacement surgeries which are caused by osteolysis,” he added.
Dr. Wilkinson and coauthors said their results justify the need for future trials targeting earlier-stage disease to further test the use of denosumab to prevent or reduce the need for revision surgery.
In 2018, aseptic loosening accounted for over half of all revision procedures, as reported to the National Joint Registry in England and Wales.
Older polyethylene prostheses are the main culprit
Commenting further on the study, Dr. Chen noted that osteolysis still plagues orthopedic surgeons because the original polyethylene prostheses were not very good. A better prosthesis developed at Massachusetts General Hospital is made up of highly crossed-link polyethylene and still wears over time but to a much lesser extent than the older polyethylene prostheses.
Metal and ceramic prostheses also can induce osteolysis, but again to a much lesser extent than the older polyethylene implants.
“Any particle can technically cause osteolysis but plastic produces the most particles,” Dr. Chen explained. Although hip revision rates in the United States are low to begin with, aseptic loosening is still one of the main reasons that patients need to undergo revision surgery, she observed.
“A lot of patients are still living with the old plastic [implants] so there is still a need for something like this,” she stressed.
However, many questions about this potential new strategy remain to be answered, including when best to initiate treatment and how to manage patients at risk for osteolysis 20-30 years after they have received their original implant.
In his editorial, Dr. Aro said that serious adverse consequences often become evident 10-20 years after patients have undergone the original hip replacement procedures, when they are potentially less physically fit than they were at the time of the operation and thus less able to withstand the rigors of a difficult revision surgery.
“In this context, the concept of nonsurgical pharmacological treatment of periprosthetic osteolysis ... brings a new hope for the ever-increasing population of patients with total hip arthroplasty to avoid revision surgery,” Dr. Aro suggested.
However, Dr. Aro cautioned that reduction of bone turnover by antiresorptive agents such as denosumab has been associated with the development of atypical femoral fractures.
The study was funded by Amgen. Dr. Wilkinson has reported receiving a grant from Amgen. Dr. Chen has reported serving as a consultant for Striker and b-One Ortho. Dr. Aro has reported receiving a grant to his institution from Amgen Finland and the Academy of Finland. He has also served as a member of an advisory scientific board for Amgen Finland.
A version of this article first appeared on Medscape.com.
Long-haul COVID-19 cases rise as stigma of chronic fatigue taunts
When Margot Gage-Witvliet began feeling run down after her family returned from a trip to the Netherlands in late February 2020, she initially chalked up her symptoms to jet lag. Three days later, however, her situation went from concerning to alarming as she struggled to breathe. “It felt like there was an elephant sitting on my chest,” she said.
Her husband and daughters also became ill with COVID-19, but Ms. Gage-Witvliet was the only one in her family who didn’t get better. After an early improvement, a rare coronavirus-induced tonic-clonic seizure in early April sent her spiraling back down. Ms. Gage-Witvliet spent the next several weeks in bed with the curtains drawn, unable to tolerate light or sound.
Today, Ms. Gage-Witvliet’s life looks nothing like it did 6 months ago when she first got sick. As one of COVID-19’s so called long-haulers, she continues to struggle with crushing fatigue, brain fog, and headaches – symptoms that worsen when she pushes herself to do more. Across the country, as many as 1 in 10 COVID-19 patients are reporting illnesses that continue for weeks and months after their initial diagnosis. Nearly all report neurologic issues like Ms. Gage-Witvliet, as well as shortness of breath and psychiatric concerns.
For Avindra Nath, MD, a neurologist at the National Institutes of Health, the experience of these long-haul COVID-19 patients feels familiar and reminds him of myalgic encephalomyelitis, also known as chronic fatigue syndrome.
Dr. Nath has long been interested in the lingering neurologic issues connected to chronic fatigue. An estimated three-quarters of all patients with chronic fatigue syndrome report that their symptoms started after a viral infection, and they suffer unrelenting exhaustion, difficulties regulating pulse and blood pressure, aches and pains, and brain fog. When Dr. Nath first read about the novel coronavirus, he began to worry that the virus would trigger symptoms in a subset of those infected. Hearing about the experiences of long-haulers like Ms. Gage-Witvliet raised his suspicions even more.
Unlike COVID-19 long-haulers, however, many patients with chronic fatigue syndrome go at least a year with these symptoms before receiving a diagnosis, according to a British survey. That means researchers have had few opportunities to study the early stages of the syndrome. “When we see patients with myalgic encephalomyelitis, whatever infection they might have had occurred in the remote past, so there’s no way for us to know how they got infected with it, what the infection was, or what the effects of it were in that early phase. We’re seeing them 2 years afterward,” Dr. Nath said.
Dr. Nath quickly realized that studying patients like Ms. Gage-Witvliet would give physicians and scientists a unique opportunity to understand not only long-term outcomes of COVID-19 infections, but also other postviral syndromes, including chronic fatigue syndrome at their earliest stages. It’s why Dr. Nath has spent the past several months scrambling to launch two NIH studies to examine the phenomenon.
Although Dr. Nath said that the parallels between COVID-19 long-haulers and those with chronic fatigue syndrome are obvious, he cautions against assuming that they are the same phenomenon. Some long-haulers might simply be taking a much slower path to recovery, or they might have a condition that looks similar on the surface but differs from chronic fatigue syndrome on a molecular level. But even if Dr. Nath fails to see links to chronic fatigue syndrome, with more than 92.5 million documented cases of COVID-19 around the world, the work will be relevant to the substantial number of infected individuals who don’t recover quickly.
“With so many people having exposure to the same virus over a similar time period, we really have the opportunity to look at these manifestations and at the very least to understand postviral syndromes,” said Mady Hornig, MD, a psychiatrist at Columbia University, New York.
The origins of chronic fatigue syndrome date back to 1985, when the Centers for Disease Control and Prevention received a request from two physicians – Paul Cheney, MD, and Daniel Peterson, MD – to investigate a mysterious disease outbreak in Nevada. In November 1984, residents in and around the idyllic vacation spot of Incline Village, a small town tucked into the north shore of Lake Tahoe, had begun reporting flu-like symptoms that persisted for weeks, even months. The doctors had searched high and low for a cause, but they couldn’t figure out what was making their patients sick.
They reported a range of symptoms – including muscle aches and pains, low-grade fevers, sore throats, and headaches – but everyone said that crippling fatigue was the most debilitating issue. This wasn’t the kind of fatigue that could be cured by a nap or even a long holiday. No matter how much their patients slept – and some were almost completely bedbound – their fatigue didn’t abate. What’s more, the fatigue got worse whenever they tried to push themselves to do more. Puzzled, the CDC sent two epidemic intelligence service (EIS) officers to try to get to the bottom of what might be happening.
Muscle aches and pains with crippling fatigue
After their visit to Incline Village, however, the CDC was just as perplexed as Dr. Cheney and Dr. Peterson. Many of the people with the condition reported flu-like symptoms right around the time they first got sick, and the physicians’ leading hypothesis was that the outbreak and its lasting symptoms were caused by chronic Epstein-Barr virus infection. But neither the CDC nor anyone else could identify the infection or any other microbial cause. The two EIS officers duly wrote up a report for the CDC’s flagship publication, Morbidity and Mortality Weekly ReportI, titled “Chronic Fatigue Possibly Related to Epstein-Barr Virus – Nevada”.
That investigators focused on the fatigue aspect made sense, says Leonard A. Jason, PhD, professor of psychology at DePaul University and director of the Center for Community Research, both in Chicago, because it was one of the few symptoms shared by all the individuals studied and it was also the most debilitating. But that focus – and the name “chronic fatigue syndrome” – led to broad public dismissal of the condition’s severity, as did an editorial note in MMWR urging physicians to look for “more definable, and possibly treatable, conditions.” Subsequent research failed to confirm a specific link to the Epstein-Barr virus, which only added to the condition’s phony reputation. Rather than being considered a potentially disabling illness, it was disregarded as a “yuppie flu” or a fancy name for malingering.
“It’s not a surprise that patients are being dismissed because there’s already this sort of grandfathered-in sense that fatigue is not real,” said Jennifer Frankovich, MD, a pediatric rheumatologist at Stanford (Calif.) University’s Lucile Packard Children’s Hospital in Palo Alto. “I’m sure that’s frustrating for them to be tired and then to have the clinician not believe them or dismiss them or think they’re making it up. It would be more helpful to the families to say: ‘You know what, we don’t know, we do not have the answer, and we believe you.’ ”
A syndrome’s shame
As time passed, patient advocacy groups began pushing back against the negative way the condition was being perceived. This criticism came as organizations like the CDC worked to develop a set of diagnostic criteria that researchers and clinicians dealing with chronic fatigue syndrome could use. With such a heterogeneous group of patients and symptoms, the task was no small challenge. The discussions, which took place over nearly 2 decades, played a key role in helping scientists home in on the single factor that was central to chronic fatigue: postexertional malaise.
“This is quite unique for chronic fatigue syndrome. With other diseases, yes, you may have fatigue as one of the components of the disease, but postexertional fatigue is very specific,” said Alain Moreau, PhD, a molecular biologist at the University of Montreal.
Of course, plenty of people have pushed themselves too hard physically and paid the price the next day. But those with chronic fatigue syndrome weren’t running marathons. To them, exertion could be anything from getting the mail to reading a book. Nor could the resulting exhaustion be resolved by an afternoon on the couch or a long vacation.
“If they do these activities, they can crash for weeks, even months,” Dr. Moreau said. It was deep, persistent, and – for 40% of those with chronic fatigue syndrome – disabling. In 2015, a study group from the Institute of Medicine proposed renaming chronic fatigue to “systemic exercise intolerance disease” because of the centrality of this symptom. Although that effort mostly stalled, their report did bring the condition out of its historic place as a scientific backwater. What resulted was an uptick in research on chronic fatigue syndrome, which helped define some of the physiological issues that either contribute to or result from the condition.
Researchers had long known about the link between infection and fatigue, said Dr. Frankovich. Work included mysterious outbreaks like the one in Lake Tahoe and well-documented issues like the wave of encephalitis lethargica (a condition that leaves patients in an almost vegetative state) that followed the 1918 H1N1 influenza pandemic.
“As a clinician, when you see someone who comes in with a chronic infection, they’re tired. I think that’s why, in the chronic-fatigue world, people are desperately looking for the infection so we can treat it, and maybe these poor suffering people will feel better,” Dr. Frankovich added. Then the pandemic struck, giving him yet another opportunity to study postviral syndromes.
Immunologic symptoms
Given the close link between a nonspecific viral illness and the onset of symptoms in chronic fatigue syndrome, scientists like Dr. Hornig opted to focus on immunologic symptoms. In a 2015 analysis published in Science, Dr. Hornig and colleagues showed that immune problems can be found in the earliest stages of chronic fatigue syndrome, and that they change as the illness progresses. Patients who had been sick for less than 3 years showed significant increases in levels of both pro- and anti-inflammatory cytokines, and the factor most strongly correlated to this inability to regulate cytokine levels was the duration of symptoms, not their severity. A series of other studies also revealed problems with regulation of the immune system, although no one could show what might have set these problems in motion.
Other researchers found signs of mitochondrial dysfunction in those with chronic fatigue syndrome. Because mitochondria make energy for cells, it wasn’t an intellectual stretch to believe that glitches in this process could contribute to fatigue. As early as 1991, scientists had discovered signs of mitochondrial degeneration in muscle biopsies from people with chronic fatigue syndrome. Subsequent studies showed that those affected by chronic fatigue were missing segments of mitochondrial DNA and had significantly reduced levels of mitochondrial activity. Although exercise normally improves mitochondrial functioning, the opposite appears to happen in chronic fatigue.
To Dr. Nath, these dual hypotheses aren’t necessarily mutually exclusive. Some studies have hinted that infection with the common human herpesvirus–6 (HHV-6) can lead to an autoimmune condition in which the body makes antibodies against the mitochondria. Mitochondria also play a key role in the ability of the innate immune system to produce interferon and other proinflammatory cytokines. It might also be that the link between immune and mitochondrial problems is more convoluted than originally thought, or that the two systems are affected independent of one another, Dr. Nath said.
Finding answers, especially those that could lead to potential treatments, wouldn’t be easy, however. In 2016, the NIH launched an in-depth study of a small number of individuals with chronic fatigue, hoping to find clues about what the condition was and how it might be treated.
For scientists like Dr. Nath, the NIH study provided a way to get at the underlying biology of chronic fatigue syndrome. Then the pandemic struck, giving him yet another opportunity to study postviral syndromes.
Chronic post-SARS syndrome
In March 2020, retired physician Harvey Moldofsky, MD, began receiving inquiries about a 2011 study he and his colleague, John Patcai, MD, had published in BMC Neurology about something they dubbed “chronic post-SARS syndrome.” The small case-control study, which involved mainly health care workers in Toronto, received little attention when it was first published, but with COVID-19, it was suddenly relevant.
Early clusters of similar cases in Miami made local physicians desperate for Dr. Moldofsky’s expertise. Luckily, he was nearby; he had fled the frigid Canadian winter for the warmth of Sarasota, Fla.
“I had people from various countries around the world writing to me and asking what they should do. And of course I don’t have any answers,” he said. But the study contained one of the world’s only references to the syndrome.
In 2003, a woman arrived in Toronto from Hong Kong. She didn’t know it at the time, but her preairport stay at the Hotel Metropole had infected her with the first SARS (severe acute respiratory syndrome) coronavirus. Her subsequent hospitalization in Toronto sparked a city-wide outbreak of SARS in which 273 people became ill and 44 died. Many of those affected were health care workers, including nurses and respiratory therapists. Although most eventually returned to work, a subset couldn’t. They complained of energy-sapping fatigue, poor sleep, brain fog, and assorted body aches and pains that persisted for more than 18 months. The aches and pains brought them to the attention of Dr. Moldofsky, then director of the Centre for the Study of Pain at the University of Toronto.
His primary interest at the time was fibromyalgia, which caused symptoms similar to those reported by the original SARS long-haulers. Intrigued, Dr. Moldofsky agreed to take a look. Their chest x-rays were clear and the nurses showed no signs of lingering viral infection. Dr. Moldofsky could see that the nurses were ill and suffering, but no lab tests or anything else could identify what was causing their symptoms.
In 2011, Dr. Moldofsky and Dr. Patcai found a strong overlap between chronic SARS, fibromyalgia, and chronic fatigue syndrome when they compared 22 patients with long-term SARS issues with 21 who had fibromyalgia. “Their problems are exactly the same. They have strange symptoms and nobody can figure out what they’re about. And these symptoms are aches and pains, and they have trouble thinking and concentrating,” Dr. Moldofsky said. Reports of COVID-19 long-haulers didn’t surprise Dr. Moldofsky, and he immediately recognized that Nath’s intention to follow these patients could provide insights into both fibromyalgia and chronic fatigue syndrome.
That’s exactly what Dr. Nath is proposing with the two NIH studies. One will focus solely on the neurologic impacts of COVID-19, including stroke, loss of taste and smell, and brain fog. The other will bring patients who have had COVID-19 symptoms for at least 6 months to the NIH Clinical Center for an inpatient stay during which they will undergo detailed physiologic tests.
Scientists around the world are launching their own post–COVID-19 studies. Dr. Moreau’s group in Montreal has laid the groundwork for such an endeavor, and the CoroNerve group in the United Kingdom is monitoring neurologic complications from the coronavirus. Many of them have the same goals as the NIH studies: Leverage the large number of COVID-19 long-haulers to better understand the earliest stages of postviral syndrome.
“At this juncture, after all the reports that we’ve seen so far, I think it’s very unlikely that there will be no relationship whatsoever between COVID-19 and chronic fatigue syndrome,” Dr. Hornig said. “I think there certainly will be some, but again, what’s the scope, what’s the size? And then, of course, even more importantly, if it is happening, what is the mechanism and how is it happening?”
For people like Ms. Gage-Witvliet, the answers can’t come soon enough. For the first time in more than a decade, the full-time professor of epidemiology didn’t prepare to teach this year because she simply can’t. It’s too taxing for her brain to deal with impromptu student questions. Ms. Gage-Witvliet hopes that, by sharing her own experiences with post COVID-19, she can help others.
“In my work, I use data to give a voice to people who don’t have a voice,” she said. “Now, I am one of those people.”
A version of this article first appeared on Medscape.com.
Pressure builds on CDC to prioritize both diabetes types for vaccine
The American Diabetes Association, along with 18 other organizations, has sent a letter to the U.S. Centers for Disease Control and Prevention urging them to rank people with type 1 diabetes as equally high risk for COVID-19 severity, and therefore vaccination, as those with type 2 diabetes.
On Jan. 12, the CDC recommended states vaccinate all Americans over age 65 and those with underlying health conditions that make them more vulnerable to COVID-19.
Currently, type 2 diabetes is listed among 12 conditions that place adults “at increased risk of severe illness from the virus that causes COVID-19,” with the latter defined as “hospitalization, admission to the intensive care unit, intubation or mechanical ventilation, or death.”
On the other hand, the autoimmune condition type 1 diabetes is among 11 conditions the CDC says “might be at increased risk” for COVID-19, but limited data were available at the time of the last update on Dec. 23, 2020.
“States are utilizing the CDC risk classification when designing their vaccine distribution plans. This raises an obvious concern as it could result in the approximately 1.6 million with type 1 diabetes receiving the vaccination later than others with the same risk,” states the ADA letter, sent to the CDC on Jan. 13.
Representatives from the Endocrine Society, American Association of Clinical Endocrinology, Pediatric Endocrine Society, Association of Diabetes Care & Education Specialists, and JDRF, among others, cosigned the letter.
Newer data show those with type 1 diabetes at equally high risk
While acknowledging that “early data did not provide as much clarity about the extent to which those with type 1 diabetes are at high risk,” the ADA says newer evidence has emerged, as previously reported by this news organization, that “convincingly demonstrates that COVID-19 severity is more than tripled in individuals with type 1 diabetes.”
The letter also cites another study showing that people with type 1 diabetes “have a 3.3-fold greater risk of severe illness, are 3.9 times more likely to be hospitalized with COVID-19, and have a 3-fold increase in mortality compared to those without type 1 diabetes.”
Those risks, they note, are comparable to the increased risk established for those with type 2 diabetes, as shown in a third study from Scotland, published last month.
Asked for comment, CDC representative Kirsten Nordlund said in an interview, “This list is a living document that will be periodically updated by CDC, and it could rapidly change as the science evolves.”
In addition, Ms. Nordlund said, “Decisions about transitioning to subsequent phases should depend on supply; demand; equitable vaccine distribution; and local, state, or territorial context.”
“Phased vaccine recommendations are meant to be fluid and not restrictive for jurisdictions. It is not necessary to vaccinate all individuals in one phase before initiating the next phase; phases may overlap,” she noted. More information is available here.
Tennessee gives type 1 and type 2 diabetes equal priority for vaccination
Meanwhile, at least one state, Tennessee, has updated its guidance to include both types of diabetes as being priority for COVID-19 vaccination.
Vanderbilt University pediatric endocrinologist Justin M. Gregory, MD, said in an interview: “I was thrilled when our state modified its guidance on December 30th to include both type 1 and type 2 diabetes in the ‘high-risk category.’ Other states have not modified that guidance though.”
It’s unclear how this might play out on the ground, noted Dr. Gregory, who led one of the three studies demonstrating increased COVID-19 risk for people with type 1 diabetes.
“To tell you the truth, I don’t really know how individual organizations dispensing the vaccination [will handle] people who come to their facility saying they have ‘diabetes.’ Individual states set the vaccine-dispensing guidance and individual county health departments and health care systems mirror that guidance,” he said.
Thus, he added, “Although it’s possible an individual nurse may take the ‘I’ll ask you no questions, and you’ll tell me no lies’ approach if someone with type 1 diabetes says they have ‘diabetes’, websites and health department–recorded telephone messages are going to tell people with type 1 diabetes they have to wait further back in line if that is what their state’s guidance directs.”
A version of this article first appeared on Medscape.com.
COVID-19 symptoms persist months after acute infection
, according to a follow-up study involving 1,733 patients.
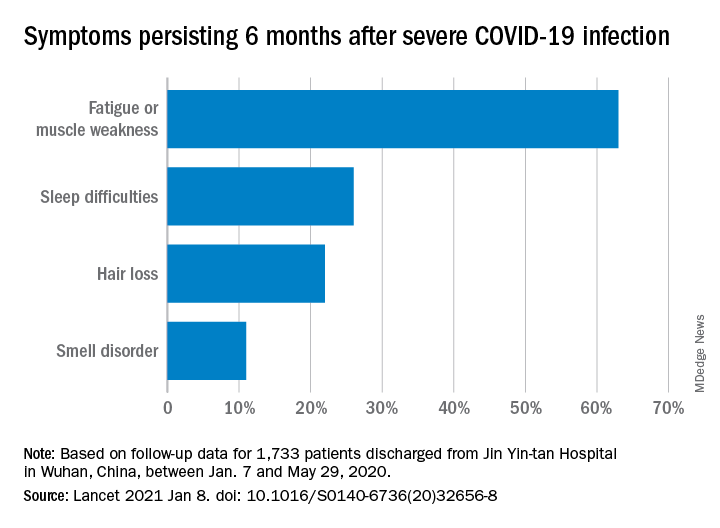
“Patients with COVID-19 had symptoms of fatigue or muscle weakness, sleep difficulties, and anxiety or depression,” and those with “more severe illness during their hospital stay had increasingly impaired pulmonary diffusion capacities and abnormal chest imaging manifestations,” Chaolin Huang, MD, of Jin Yin-tan Hospital in Wuhan, China, and associates wrote in the Lancet.
Fatigue or muscle weakness, reported by 63% of patients, was the most common symptom, followed by sleep difficulties, hair loss, and smell disorder. Altogether, 76% of those examined 6 months after discharge from Jin Yin-tan hospital – the first designated for patients with COVID-19 in Wuhan – reported at least one symptom, they said.
Symptoms were more common in women than men: 81% vs. 73% had at least one symptom, and 66% vs. 59% had fatigue or muscle weakness. Women were also more likely than men to report anxiety or depression at follow-up: 28% vs. 18% (23% overall), the investigators said.
Patients with the most severe COVID-19 were 2.4 times as likely to report any symptom later, compared with those who had the least severe levels of infection. Among the 349 participants who completed a lung function test at follow-up, lung diffusion impairment was seen in 56% of those with the most severe illness and 22% of those with the lowest level, Dr. Huang and associates reported.
In a different subset of 94 patients from whom plasma samples were collected, the “seropositivity and median titres of the neutralising antibodies were significantly lower than at the acute phase,” raising concern for reinfection, they said.
The results of the study, the investigators noted, “support that those with severe disease need post-discharge care. Longer follow-up studies in a larger population are necessary to understand the full spectrum of health consequences from COVID-19.”
, according to a follow-up study involving 1,733 patients.
“Patients with COVID-19 had symptoms of fatigue or muscle weakness, sleep difficulties, and anxiety or depression,” and those with “more severe illness during their hospital stay had increasingly impaired pulmonary diffusion capacities and abnormal chest imaging manifestations,” Chaolin Huang, MD, of Jin Yin-tan Hospital in Wuhan, China, and associates wrote in the Lancet.
Fatigue or muscle weakness, reported by 63% of patients, was the most common symptom, followed by sleep difficulties, hair loss, and smell disorder. Altogether, 76% of those examined 6 months after discharge from Jin Yin-tan hospital – the first designated for patients with COVID-19 in Wuhan – reported at least one symptom, they said.
Symptoms were more common in women than men: 81% vs. 73% had at least one symptom, and 66% vs. 59% had fatigue or muscle weakness. Women were also more likely than men to report anxiety or depression at follow-up: 28% vs. 18% (23% overall), the investigators said.
Patients with the most severe COVID-19 were 2.4 times as likely to report any symptom later, compared with those who had the least severe levels of infection. Among the 349 participants who completed a lung function test at follow-up, lung diffusion impairment was seen in 56% of those with the most severe illness and 22% of those with the lowest level, Dr. Huang and associates reported.
In a different subset of 94 patients from whom plasma samples were collected, the “seropositivity and median titres of the neutralising antibodies were significantly lower than at the acute phase,” raising concern for reinfection, they said.
The results of the study, the investigators noted, “support that those with severe disease need post-discharge care. Longer follow-up studies in a larger population are necessary to understand the full spectrum of health consequences from COVID-19.”
FROM THE LANCET
Sotagliflozin’s trial data receives FDA welcome for NDA filing
The Food and Drug Administration has determined that data collected on the dual SGLT1/2 inhibitor sotagliflozin (Zynquista) for treating patients with type 2 diabetes in the SOLOIST and SCORED pivotal trials can help support a New Drug Application (NDA) submission, according to a statement released on Jan. 14 by Lexicon Pharmaceuticals, the company developing this drug. Lexicon concurrently said that it hopes to potentially file this NDA later in 2021.
The statement said the FDA’s decision related to an NDA for “an indication to reduce the risk of cardiovascular death, hospitalization for heart failure, and urgent visits for heart failure in adult patients with type 2 diabetes with either worsening heart failure or additional risk factors for heart failure.”
Results from SOLOIST and SCORED, first reported in November 2020 at the American Heart Association scientific sessions, showed statistically significant benefits for their respective primary endpoints.
The findings also demonstrated several novel benefits from the first advanced clinical trials of an SGLT inhibitor that blocks both the SGLT2 protein in kidneys as well as the SGLT1 protein, which resides primarily in the gastrointestinal system and is the main route for glucose out of the gut.
In both SOLOIST and SCORED, patient outcomes on sotagliflozin tracked the benefits and adverse effects previously seen with several SGLT2 inhibitors (canagliflozin, dapagliflozin, empagliflozin, and ertugliflozin), but in addition showed several unprecedented benefits: An ability to lower hemoglobin A1c in patients with severely depressed renal function, safe initiation in patients recently hospitalized for heart failure, the first prospective data to show improvements in patients with heart failure with preserved ejection fraction, and a higher level of protection against MIs and strokes than the SGLT2 inhibitors.
The FDA’s willingness to consider data from both trials in an NDA was not a given, as the primary endpoints for both trials underwent tweaking while they were underway to compensate for an unexpectedly early end to patient enrollment and follow-up caused by changes in drug company sponsorship and challenges introduced by the COVID-19 pandemic.
In 2019, the FDA denied the NDA for sotagliflozin as a treatment for patients with type 1 diabetes, but this indication received approval in Europe.
SOLOIST and SCORED were sponsored initially by Sanofi, and more recently by Lexicon.
U.S. cancer death rates drop for second year in a row
The study was published online Jan. 12 in CA: A Cancer Journal for Clinicians.
“Mortality rates are a better indicator of progress against cancer than incidence or survival because they are less affected by biases resulting from changes in detection practices,” wrote the authors, led by Rebecca Siegel, MPH, American Cancer Society, Atlanta.
“The overall drop of 31% as of 2018 [since the early 1990s] translates to an estimated 3,188,500 fewer cancer deaths (2,170,700 in men and 1,017,800 in women) than what would have occurred if mortality rates had remained at their peak,” the researchers added.
Lung cancer accounted for 46% of the total decline in cancer mortality in the past 5 years, with a record, single-year drop of 2.4% between 2017 and 2018.
The recent and rapid reductions in lung cancer mortality reflect better treatments for NSCLC, the authors suggested. For example, survival rates at 2 years have increased from 34% for patients diagnosed with NSCLC between 2009 and 2010 to 42% for those diagnosed during 2015 and 2016 – an absolute gain of 5%-6% in survival odds for every stage of diagnosis.
On a more somber note, the authors warned that COVID-19 is predicted to have a negative impact on both the diagnosis and outcomes of patients with cancer in the near future.
“We anticipate that disruptions in access to cancer care in 2020 will lead to downstream increases in advanced stage diagnoses that may impede progress in reducing cancer mortality rates in the years to come,” Ms. Siegel said in a statement.
New cancer cases
The report provides an estimated number of new cancer cases and deaths in 2021 in the United States (nationally and state-by-state) based on the most current population-based data for cancer incidence through 2017 and for mortality through 2018. “An estimated 608,570 Americans will die from cancer in 2021, corresponding to more than 1600 deaths per day,” Ms. Siegel and colleagues reported.
The greatest number of deaths are predicted to be from the most common cancers: Lung, prostate, and colorectal cancer in men and lung, breast, and colorectal cancer in women, they added. However, the mortality rates for all four cancers are continuing to fall.
As of 2018, the death rate from lung cancer had dropped by 54% among males and by 30% among females over the past few decades, the investigators noted.
Mortality from female breast cancer has dropped by 41% since 1989; by 52% for prostate cancer since 1993; and by 53% and 59% for colorectal cancer for men (since 1980) and women (since 1969), respectively.
“However, in recent years, mortality declines have slowed for breast cancer and [colorectal cancer] and have halted for prostate cancer,” the researchers noted.
In contrast, the pace of the annual decline in lung cancer mortality doubled among men from 3.1% between 2009 and 2013 to 5.5% between 2014 and 2018, and from 1.8% to 4.4% among women during the same time intervals.
Increase in incidence at common sites
Despite the steady progress in mortality for most cancers, “rates continue to increase for some common sites,” Ms. Siegel and colleagues reported.
For example, death rates from uterine corpus cancer have accelerated from the late 1990s at twice the pace of the increase in its incidence. Death rates also have increased for cancers of the oral cavity and pharynx – although in this cancer, increases in mortality parallel an increase in its incidence.
“Pancreatic cancer death rates [in turn] continued to increase slowly in men ... but remained stable in women, despite incidence [rates] rising by about 1% per year in both sexes,” the authors observed.
Meanwhile, the incidence of cervical cancer, although declining for decades overall, is increasing for patients who present with more distant-stage disease as well as cervical adenocarcinoma, both of which are often undetected by cytology.
“These findings underscore the need for more targeted efforts to increase both HPV [human papillomavirus] vaccination among all individuals aged [26 and younger] and primary HPV testing or HPV/cytology co-testing every 5 years among women beginning at age 25,” the authors emphasized.
On a more positive note, the long-term increase in mortality from liver cancer has recently slowed among women and has stabilized among men, they added.
Once again, disparities in both cancer occurrence and outcomes varied considerably between racial and ethnic groups. For example, cancer is the leading cause of death in people who are Hispanic, Asian American, and Alaska Native. Survival rates at 5 years for almost all cancers are still higher for White patients than for Black patients, although the disparity in cancer mortality between Black persons and White persons has declined to 13% from a peak of 33% in 1993.
Geographic disparities in cancer mortality rates still prevail; the rates are largest for preventable cancers such as lung and cervical cancer, for which mortality varies by as much as fivefold across states.
And although cancer remains the second most common cause of death among children, death rates from cancer have continuously declined over time among both children and adolescents, largely the result of dramatic declines in death rates from leukemia in both age groups.
The study authors have disclosed no relevant financial relationships.
A version of this article first appeared on Medscape.com.
CVD deaths rose, imaging declined during pandemic
While the direct toll of the COVID-19 pandemic is being tallied and shared on the nightly news, the indirect effects will undoubtedly take years to fully measure.

In two papers published online Jan. 11 in the Journal of the American College of Cardiology, researchers have started the process of quantifying the impact of the pandemic on the care of patients with cardiovascular disease (CVD).
In the first study, Rishi Wadhera, MD, MPP, MPhil, and colleagues from the Beth Israel Deaconess Medical Center and Harvard Medical School in Boston examined population-level data to determine how deaths from cardiovascular causes changed in the United States in the early months of the pandemic relative to the same periods in 2019.
In a second paper, Andrew J. Einstein, MD, PhD, from Columbia University Irving Medical Center/New York–Presbyterian Hospital and colleagues looked at the pandemic’s international impact on the diagnosis of heart disease.
Using data from the National Center for Health Statistics, Dr. Wadhera and colleagues compared death rates from cardiovascular causes in the United States from March 18, 2020, to June 2, 2020, (the first wave of the pandemic) and from Jan. 1, 2020, to March 17, 2020, (the period just before the pandemic started) and compared them to the same periods in 2019. ICD codes were used to identify underlying causes of death.
Relative to 2019, they found a significant increase in deaths from ischemic heart disease nationally (1.11; 95% confidence interval, 1.04-1.18), as well as an increase in deaths caused by hypertensive disease (1.17; 95% CI, 1.09-1.26). There was no apparent increase in deaths from heart failure, cerebrovascular disease, or other diseases of the circulatory system.
When they looked just at New York City, the area hit hardest during the early part of the pandemic, the relative increases in deaths from ischemic heart disease were more pronounced.
Deaths from ischemic heart disease or hypertensive diseases jumped 139% and 164%, respectively, between March 18, 2020, and June 2, 2020.
More modest increases in deaths were seen in the remainder of New York state, New Jersey, Michigan and Illinois, while Massachusetts and Louisiana did not see a change in cardiovascular deaths.
Several studies from different parts of the world have indicated a 40%-50% drop in hospitalization for myocardial infarction in the initial months of the pandemic, said Dr. Wadhera in an interview.
“We wanted to understand where did all the heart attacks go? And we worried that patients with urgent heart conditions were not seeking the medical care they needed. I think our data suggest that this may have been the case,” reported Dr. Wadhera.
“This very much reflects the reality of what we’re seeing on the ground,” he told this news organization. “After the initial surge ended, when hospital volumes began to return to normal, we saw patients come into the hospital who clearly had a heart attack during the surge months – and were now experiencing complications of that event – because they had initially not come into the hospital due to concerns about exposure to the virus.”
A limitation of their data, he stressed, is whether some deaths coded as CVD deaths were really deaths from undiagnosed COVID-19. “It’s possible that some portion of the increased deaths we observed really reflect the cardiovascular complications of undiagnosed COVID-19, because we know that testing was quite limited during the early first surge of cases.”
“I think that basically three factors – patients avoiding the health care system because of fear of getting COVID, health care systems being strained and overwhelmed leading to the deferral of cardiovascular care and semi-elective procedures, and the cardiovascular complications of COVID-19 itself – all probably collectively contributed to the rise in cardiovascular deaths that we observed,” said Dr. Wadhera.
In an accompanying editorial, Michael N. Young, MD, Geisel School of Medicine at Dartmouth, Lebanon, N.H., and colleagues write that these data, taken together with an earlier study showing an increase in out-of-hospital cardiac arrests at the pandemic peak in New York City, “support the notion of excess fatalities due to unattended comorbid illnesses.” That said, attribution of death in the COVID era “remains problematic.”
In the second article, Andrew Einstein, MD, PhD, and the INCAPS COVID Investigators Group took a broader approach and looked at the impact of COVID-19 on cardiac diagnostic procedures in over 100 countries.
The INCAPS (International Atomic Energy Agency Noninvasive Cardiology Protocols Study) group has for the past decade conducted numerous studies addressing the use of best practices and worldwide practice variation in CVD diagnosis.
For this effort, they sent a survey link to INCAPS participants worldwide, ultimately including 909 survey responses from 108 countries in the final analysis.
Compared with March 2019, overall procedure volume decreased 42% in March 2020 and 64% in April 2020.
The greatest decreases were seen in stress testing (78%) and transesophageal echocardiography (76%), both procedures, noted Dr. Einstein, associated with a greater risk of aerosolization.
“Whether as we reset after COVID we return to the same place in terms of the use of cardiovascular diagnostic testing remains to be seen, but it certainly poses an opportunity to improve our utilization of various modes of testing,” said Dr. Einstein.
Using regression analysis, Dr. Einstein and colleagues were able to see that sites located in low-income and lower-middle-income countries saw an additional 22% reduction in cardiac procedures and less availability of personal protective equipment (PPE) and telehealth.
Fifty-two percent of survey respondents reported significant shortages of N95 masks early in the pandemic, with fewer issues in supplies of gloves, gowns, and face shields. Lower-income countries were more likely to face significant PPE shortages and less likely to be able to implement telehealth strategies to make up for reduced in-person care. PPE shortage itself, however, was not related to lower procedural volume on multivariable regression.
“It all really begs the question of whether there is more that the world can do to help out the developing world in terms of managing the pandemic in all its facets,” said Dr. Einstein in an interview, adding he was “shocked” to learn how difficult it was for some lower-income countries to get sufficient PPE.
Did shutdowns go too far?
Calling this a “remarkable study,” an editorial written by Darryl P. Leong, MBBS, PhD, John W. Eikelboom, MBBS, and Salim Yusuf, MBBS, DPhil, all from McMaster University, Hamilton, Ont., suggests that perhaps health systems in some places went too far in closing down during the first wave of the pandemic, naming specifically Canada, Eastern Europe, and Saudi Arabia as examples.
“Although these measures were taken to prepare for the worst, overwhelming numbers of patients with COVID-19 did not materialize during the first wave of the pandemic in these countries. It is possible that delaying so-called nonessential services may have been unnecessary and potentially harmful, because it likely led to delays in providing care for the treatment of serious non–COVID-19 illnesses.”
Since then, more experience and more data have largely allowed hospital systems to “tackle the ebb and flow” of COVID-19 cases in ways that limit shutdowns of important health services, they said.
Given the more pronounced effect in low- and middle-income countries, they stressed the need to focus resources on ways to promote prevention and treatment that do not rely on diagnostic procedures.
“This calls for more emphasis on developing efficient systems of telehealth, especially in poorer countries or in remote settings in all countries,” Dr. Leong and colleagues conclude.
Dr. Wadhera has reported research support from the National Heart, Lung, and Blood Institute, along with fellow senior author Robert W. Yeh, MD, MBA, who has also received personal fees and grants from several companies not related to the submitted work. Dr. Einstein, Dr. Leong, Dr. Eikelboom, and Dr. Yusuf have reported no relevant financial relationships.
A version of this article first appeared on Medscape.com.
While the direct toll of the COVID-19 pandemic is being tallied and shared on the nightly news, the indirect effects will undoubtedly take years to fully measure.
In two papers published online Jan. 11 in the Journal of the American College of Cardiology, researchers have started the process of quantifying the impact of the pandemic on the care of patients with cardiovascular disease (CVD).
In the first study, Rishi Wadhera, MD, MPP, MPhil, and colleagues from the Beth Israel Deaconess Medical Center and Harvard Medical School in Boston examined population-level data to determine how deaths from cardiovascular causes changed in the United States in the early months of the pandemic relative to the same periods in 2019.
In a second paper, Andrew J. Einstein, MD, PhD, from Columbia University Irving Medical Center/New York–Presbyterian Hospital and colleagues looked at the pandemic’s international impact on the diagnosis of heart disease.
Using data from the National Center for Health Statistics, Dr. Wadhera and colleagues compared death rates from cardiovascular causes in the United States from March 18, 2020, to June 2, 2020, (the first wave of the pandemic) and from Jan. 1, 2020, to March 17, 2020, (the period just before the pandemic started) and compared them to the same periods in 2019. ICD codes were used to identify underlying causes of death.
Relative to 2019, they found a significant increase in deaths from ischemic heart disease nationally (1.11; 95% confidence interval, 1.04-1.18), as well as an increase in deaths caused by hypertensive disease (1.17; 95% CI, 1.09-1.26). There was no apparent increase in deaths from heart failure, cerebrovascular disease, or other diseases of the circulatory system.
When they looked just at New York City, the area hit hardest during the early part of the pandemic, the relative increases in deaths from ischemic heart disease were more pronounced.
Deaths from ischemic heart disease or hypertensive diseases jumped 139% and 164%, respectively, between March 18, 2020, and June 2, 2020.
More modest increases in deaths were seen in the remainder of New York state, New Jersey, Michigan and Illinois, while Massachusetts and Louisiana did not see a change in cardiovascular deaths.
Several studies from different parts of the world have indicated a 40%-50% drop in hospitalization for myocardial infarction in the initial months of the pandemic, said Dr. Wadhera in an interview.
“We wanted to understand where did all the heart attacks go? And we worried that patients with urgent heart conditions were not seeking the medical care they needed. I think our data suggest that this may have been the case,” reported Dr. Wadhera.
“This very much reflects the reality of what we’re seeing on the ground,” he told this news organization. “After the initial surge ended, when hospital volumes began to return to normal, we saw patients come into the hospital who clearly had a heart attack during the surge months – and were now experiencing complications of that event – because they had initially not come into the hospital due to concerns about exposure to the virus.”
A limitation of their data, he stressed, is whether some deaths coded as CVD deaths were really deaths from undiagnosed COVID-19. “It’s possible that some portion of the increased deaths we observed really reflect the cardiovascular complications of undiagnosed COVID-19, because we know that testing was quite limited during the early first surge of cases.”
“I think that basically three factors – patients avoiding the health care system because of fear of getting COVID, health care systems being strained and overwhelmed leading to the deferral of cardiovascular care and semi-elective procedures, and the cardiovascular complications of COVID-19 itself – all probably collectively contributed to the rise in cardiovascular deaths that we observed,” said Dr. Wadhera.
In an accompanying editorial, Michael N. Young, MD, Geisel School of Medicine at Dartmouth, Lebanon, N.H., and colleagues write that these data, taken together with an earlier study showing an increase in out-of-hospital cardiac arrests at the pandemic peak in New York City, “support the notion of excess fatalities due to unattended comorbid illnesses.” That said, attribution of death in the COVID era “remains problematic.”
In the second article, Andrew Einstein, MD, PhD, and the INCAPS COVID Investigators Group took a broader approach and looked at the impact of COVID-19 on cardiac diagnostic procedures in over 100 countries.
The INCAPS (International Atomic Energy Agency Noninvasive Cardiology Protocols Study) group has for the past decade conducted numerous studies addressing the use of best practices and worldwide practice variation in CVD diagnosis.
For this effort, they sent a survey link to INCAPS participants worldwide, ultimately including 909 survey responses from 108 countries in the final analysis.
Compared with March 2019, overall procedure volume decreased 42% in March 2020 and 64% in April 2020.
The greatest decreases were seen in stress testing (78%) and transesophageal echocardiography (76%), both procedures, noted Dr. Einstein, associated with a greater risk of aerosolization.
“Whether as we reset after COVID we return to the same place in terms of the use of cardiovascular diagnostic testing remains to be seen, but it certainly poses an opportunity to improve our utilization of various modes of testing,” said Dr. Einstein.
Using regression analysis, Dr. Einstein and colleagues were able to see that sites located in low-income and lower-middle-income countries saw an additional 22% reduction in cardiac procedures and less availability of personal protective equipment (PPE) and telehealth.
Fifty-two percent of survey respondents reported significant shortages of N95 masks early in the pandemic, with fewer issues in supplies of gloves, gowns, and face shields. Lower-income countries were more likely to face significant PPE shortages and less likely to be able to implement telehealth strategies to make up for reduced in-person care. PPE shortage itself, however, was not related to lower procedural volume on multivariable regression.
“It all really begs the question of whether there is more that the world can do to help out the developing world in terms of managing the pandemic in all its facets,” said Dr. Einstein in an interview, adding he was “shocked” to learn how difficult it was for some lower-income countries to get sufficient PPE.
Did shutdowns go too far?
Calling this a “remarkable study,” an editorial written by Darryl P. Leong, MBBS, PhD, John W. Eikelboom, MBBS, and Salim Yusuf, MBBS, DPhil, all from McMaster University, Hamilton, Ont., suggests that perhaps health systems in some places went too far in closing down during the first wave of the pandemic, naming specifically Canada, Eastern Europe, and Saudi Arabia as examples.
“Although these measures were taken to prepare for the worst, overwhelming numbers of patients with COVID-19 did not materialize during the first wave of the pandemic in these countries. It is possible that delaying so-called nonessential services may have been unnecessary and potentially harmful, because it likely led to delays in providing care for the treatment of serious non–COVID-19 illnesses.”
Since then, more experience and more data have largely allowed hospital systems to “tackle the ebb and flow” of COVID-19 cases in ways that limit shutdowns of important health services, they said.
Given the more pronounced effect in low- and middle-income countries, they stressed the need to focus resources on ways to promote prevention and treatment that do not rely on diagnostic procedures.
“This calls for more emphasis on developing efficient systems of telehealth, especially in poorer countries or in remote settings in all countries,” Dr. Leong and colleagues conclude.
Dr. Wadhera has reported research support from the National Heart, Lung, and Blood Institute, along with fellow senior author Robert W. Yeh, MD, MBA, who has also received personal fees and grants from several companies not related to the submitted work. Dr. Einstein, Dr. Leong, Dr. Eikelboom, and Dr. Yusuf have reported no relevant financial relationships.
A version of this article first appeared on Medscape.com.
To fast or not? The new dieting dilemma
Cardiologist Ethan J. Weiss, MD, followed an intermittent-fasting diet for 7 years. He lost about 3.6 kg (8 lb) and began recommending the approach to friends and patients who wanted to lose weight.
“I liked the way the diet was so simple,” said Dr. Weiss, an associate professor at the Cardiovascular Research Institute, University of California, San Francisco. But he also felt “it was too good to be true because you can eat what you want as long as it’s within a narrow window.”
So when, last year, he conducted a randomized, controlled trial, TREAT, testing such an approach – eating during just 8 hours a day, fasting for the remaining 16 hours – versus an eating plan of three meals a day without restrictions, he was somewhat dismayed to find the group of people who fasted didn’t lose any more weight than the other group.
The approach used in this study is known as time-restricted eating. It involves designating periods of time within the day when people can consume whatever they want; they then “fast” at times outside those eating windows. Other methods include alternate-day fasting, or the well-known 5:2 diet. In the latter, people eat a “normal” amount of around 2,000 calories per day on 5 days of the week, but for the other 2 days, they restrict caloric intake to 500 calories per day.
Intermittent fasting is an umbrella term encompassing all of these different approaches.
Dr. Weiss’s work builds on more than a decade of research into this type of eating plan by scientists, including Krista Varady, PhD, professor of nutrition at the University of Illinois at Chicago, who presented an overview of her own studies last fall at the virtual annual meeting of the European Association for the Study of Diabetes.
Although much of the work has suggested that the shorter duration of eating period in this type of diet leads to lower calorie intake and weight loss while avoiding the need for the tedious calorie-counting of conventional diets, Dr. Weiss’s data – published last year – throws a spanner in the works and now complicates the evidence base.
A promise of simplicity: ‘All you have to do is watch the clock’
Dr. Varady said she, too, is intrigued by the simplicity of intermittent-fasting diets.
In 2018, Dr. Varady and colleagues tested the weight-loss efficacy of 12 weeks of time-restricted feeding in a pilot study of 23 people with obesity.
Participants were permitted an 8-hour eating window (10 a.m. to 6 p.m.) followed by water-only fasting of 16 hours (6 p.m. to 10 a.m.) the next day (sometimes referred to as the 16:8 diet). Researchers measured weight loss and fat mass, as well as metabolic parameters, and compared the active group with 23 matched-control participants who ate freely.
There were no restrictions on type or quantity of food consumed by the control group during the 8-hour period, but individuals in the time-restricted feeding group consumed around 350 calories less than the comparator group.
Dr. Varady thinks this is most likely because of the fact that people normally eat during a 14-hour window and time-restricted feeding cuts that down by 6 hours.
“One of the most beautiful things about time-restricted feeding is that it doesn’t require calorie monitoring,” she explained. “People get burnt out with having to constantly monitor calories. All you have to do is watch the clock.”
Adherence was quite high, she reported, although most people skipped 1 day, often a Saturday, likely because of social engagements.
Weight loss in the time-restricted feeding group was mild to moderate. After 3 months, mean body weight decreased by 2.6%, or approximately 3 kg (7-8 lb), relative to those who ate freely, but this was a significant difference (P < .05).
But the researchers observed little change in metabolic disease risk factors between the groups.
In the time-restricted feeding group, systolic blood pressure dropped from 128 mm Hg to 121 mm Hg over the 12-week period, which was significant relative to the control group (P < .05) but there were no significant changes in fasting glucose, fasting lipids, fasting insulin, or insulin resistance relative to the comparator group.
In contrast to Dr. Varady’s findings, Dr. Weiss’s randomized TREAT trial, which used a similar 16:8 period of time-restricted versus unrestricted eating in 116 individuals with overweight or obesity, did not find greater weight loss in the group restricted to eating within the 8-hour window.
As previously reported by this news organization, those who fasted for 16 hours of each day (n = 59) did lose some weight, compared with the control group (n = 57) over 12 weeks, but the difference in weight loss between the groups was not significant (−0.26 kg; P = .63).
And there were no significant differences in any of the secondary outcomes of fat mass, fasting insulin, fasting glucose, hemoglobin A1c levels, estimated energy intake, total energy expenditure, and resting energy expenditure between the time-restricted eating and regular feeding groups.
“I don’t claim time-restricted eating is dead,” Dr. Weiss said, “but the hope that you can eat for a limited time each day and solve metabolic disease is not there.”
Does the length of the eating window matter?
Following her pilot study of an 8-hour eating window, Dr. Varady conducted further research with 4- or 6-hour eating windows to see if even shorter periods would precipitate greater weight loss, ideally a clinically significant loss of 5% of body weight.
She ran a 2-month randomized, controlled study in people with obesity, published in 2020, which was the first to examine both a 4-hour (3 p.m. to 7 p.m.; n = 19) or 6-hour (1 p.m to 7 p.m.; n = 20) eating window versus a diet without any food restrictions as a control (n = 19) (Cell Metab. 2020;32:366-78.e3).
Dr. Varady explained that they decided to shift the eating window to later in the day for this trial (in contrast to the earlier 8-hour study) to allow people to eat dinner at a sociable time, and thereby hopefully reduce dropouts from the study.
“Unlike with alternate-day fasting, most people find time-restricted feeding easy to incorporate into their lifestyles,” she remarked.
Both the 4- and 6-hour eating window groups experienced a mean 3.2% body weight loss, compared with controls, and this correlated with a 550-calorie reduction in their daily consumption, compared with their baseline calorie intake.
In terms of other outcomes – and in contrast to the 8-hour window study which showed very little changed other than a minor decrease in blood pressure – researchers saw some changes in metabolic risk factors with the 4- and 6-hour eating windows, Dr. Varady reported.
Compared with the control group, fasting insulin decreased in both time-restricted feeding groups by a mean of 15% (P < .05). Insulin resistance also decreased by 25% in the 4-hour group and by 15% in the 6-hour group, compared with the control group. Fasting glucose did not change in either group, however.
The researchers did not observe any effect on blood pressure or plasma lipids in the 4- or 6-hour eating window groups, compared with controls. However, measures of oxidative stress and inflammation decreased in both groups versus controls by approximately 35% (P < .05).
“These findings suggest that this form of severe time-restricted feeding is achievable and can help adults with obesity lose weight, without having to count calories,” Dr. Varady and colleagues conclude.
Is intermittent fasting better for weight loss than calorie restriction?
Ultimately, if weight loss is the primary goal, many want to know how time-restricted feeding compares with conventional daily calorie restriction.
Back in 2017, Dr. Varady published a year-long randomized, controlled study that compared alternate-day fasting with a calorie-restriction diet and a conventional/usual diet among 100 participants with obesity who were otherwise healthy.
Participants on the alternate-day fasting plan (n = 34) consumed 500 calories on fasting days for the first 6 months for weight loss (approximately 25% of energy needs) followed by 125% of energy needs on alternating “feast days”. For an additional 6 months, they ate 1,000 calories on fasting days – aimed at weight maintenance.
Those following the calorie-restriction diet (n = 35) reduced energy intake by 25% (approximately 500 kcal) for the first 6 months for weight loss, followed by enough calories sufficient for weight maintenance (so no further loss nor gain).
However, the study showed alternate-day fasting did not produce better weight loss than conventional calorie counting.
“Over the first 6 months [during the weight-loss period] both groups lost an average of 6% body weight. After 12 months it crept back to 5% weight loss,” reported Dr. Varady.
“Realistically, if the study continued for 2 or 3 years, they probably would have regained much of their weight,” she admitted.
Dr. Varady suspects it might be better for the alternate-day fasting participants to continue eating only 500 calories on their fast day during the weight-loss maintenance period rather than increasing calorie intake during this phase.
Heart rate and blood pressure did not change in either group, while triglycerides decreased in the alternate-day fasting group, and LDL cholesterol decreased in the calorie-restriction group.
Glucose level decreased in the calorie-restriction group but not the alternate-day fasting group, and insulin and HOMA-IR were unaffected in both groups, reported Dr. Varady, noting that these findings were in healthy people with obesity.
In people with obesity and insulin resistance – evaluated as a subgroup in a separate study by Dr. Varady of alternate-day fasting versus daily calorie restriction published in 2019 – she noted that when insulin levels and HOMA-IR were measured, there was a greater reduction in both variables in the fasting group, compared with the calorie-restriction group.
“For people at risk of diabetes, maybe fasting produces more potent effects on glycemic control?” she ventured.
Who fares best with which fasting diets?
Summing up, Dr. Varady provided some practical pointers regarding who she feels is best suited to intermittent fasting and who should avoid it.
Those who binge eat, shift-workers, and frequent snackers do not do well with fasting, she said.
The first 10 days of intermittent fasting are rough, she pointed out, with the most common complaint being headaches.
“Eventually, people do feel an energy boost on fast days, and they say they concentrate better and have lots of energy. People won’t feel lethargic. Also, eating protein on fast days has been shown to keep hunger at bay.”
She cautiously concluded that weight loss with “alternate-day fasting” is quicker than some other methods, at 4.5-7 kg (10-15 lb) in 3 months, but is harder to follow and requires some calorie counting.
“In comparison, with time-restricted feeding, for which there have been very few ... studies to date, weight loss is slower at 2-4.5 kg (5-10 lb) in 3 months, but it is easier to follow and tolerable because you don’t need to count calories.”
Dr. Weiss has reported no relevant financial relationships. Dr. Varady has reported receiving author fees from Hachette for her book, “Every Other Day Diet.” (New York: Hachette, 2013)
A version of this article first appeared on Medscape.com.