User login
CagA-positive H. pylori patients at higher risk of osteoporosis, fracture
A new study has found that older patients who test positive for the cytotoxin associated gene-A (CagA) strain of Helicobacter pylori may be more at risk of both osteoporosis and fractures.

“Further studies will be required to replicate these findings in other cohorts and to better clarify the underlying pathogenetic mechanisms leading to increased bone fragility in subjects infected by CagA-positive H. pylori strains,” wrote Luigi Gennari, MD, PhD, of the University of Siena (Italy), and coauthors. The study was published in the Journal of Bone and Mineral Research.
To determine the effects of H. pylori on bone health and potential fracture risk, the researchers launched a population-based cohort study of 1,149 adults between the ages of 50 and 80 in Siena. The cohort comprised 174 males with an average (SD) age of 65.9 (plus or minus 6 years) and 975 females with an average age of 62.5 (plus or minus 6 years). All subjects were examined for H. pylori antibodies, and those who were infected were also examined for anti-CagA serum antibodies. As blood was sampled, bone mineral density (BMD) of the lumbar spine, femoral neck, total hip, and total body was measured via dual-energy x-ray absorptiometry.
In total, 53% of male participants and 49% of female participants tested positive for H. pylori, with CagA-positive strains found in 27% of males and 26% of females. No differences in infection rates were discovered in regard to socioeconomic status, age, weight, or height. Patients with normal BMD (45%), osteoporosis (51%), or osteopenia (49%) had similar prevalence of H. pylori infection, but CagA-positive strains were more frequently found in osteoporotic (30%) and osteopenic (26%) patients, compared to patients with normal BMD (21%, P < .01). CagA-positive female patients also had lower lumbar (0.950 g/cm2) and femoral (0.795 g/cm2) BMD, compared to CagA-negative (0.987 and 0.813 g/cm2) or H. pylori-negative women (0.997 and 0.821 g/cm2), respectively.
After an average follow-up period of 11.8 years, 199 nontraumatic fractures (72 vertebral and 127 nonvertebral) had occurred in 158 participants. Patients with CagA-positive strains of H. pylori had significantly increased risk of a clinical vertebral fracture (hazard ratio [HR], 5.27; 95% confidence interval, 2.23-12.63; P < .0001) or a nonvertebral incident fracture (HR, 2.09; 95% CI, 1.27-2.46; P < .01), compared to patients without H. pylori. After adjustment for age, sex, and body mass index, the risk among CagA-positive patients remained similarly significantly elevated for both vertebral (aHR, 4.78; 95% CI, 1.99-11.47; P < .0001) and nonvertebral fractures (aHR, 2.04; 95% CI, 1.22-3.41; P < .01).
The authors acknowledged their study’s limitations, including a cohort that was notably low in male participants, an inability to assess the effects of eradicating H. pylori on bone, and uncertainty as to which specific effects of H. pylori infection increase the risk of osteoporosis or fracture. Along those lines, they noted that an association between serum CagA antibody titer and gastric mucosal inflammation could lead to malabsorption of calcium, hypothesizing that antibody titer rather than antibody positivity “might be a more relevant marker for assessing the risk of bone fragility in patients affected by H. pylori infection.”
The study was supported in part by a grant from the Italian Association for Osteoporosis. The authors reported no potential conflicts of interest.
SOURCE: Gennari L et al. J Bone Miner Res. 2020 Aug 13. doi: 10.1002/jbmr.4162.
A new study has found that older patients who test positive for the cytotoxin associated gene-A (CagA) strain of Helicobacter pylori may be more at risk of both osteoporosis and fractures.
“Further studies will be required to replicate these findings in other cohorts and to better clarify the underlying pathogenetic mechanisms leading to increased bone fragility in subjects infected by CagA-positive H. pylori strains,” wrote Luigi Gennari, MD, PhD, of the University of Siena (Italy), and coauthors. The study was published in the Journal of Bone and Mineral Research.
To determine the effects of H. pylori on bone health and potential fracture risk, the researchers launched a population-based cohort study of 1,149 adults between the ages of 50 and 80 in Siena. The cohort comprised 174 males with an average (SD) age of 65.9 (plus or minus 6 years) and 975 females with an average age of 62.5 (plus or minus 6 years). All subjects were examined for H. pylori antibodies, and those who were infected were also examined for anti-CagA serum antibodies. As blood was sampled, bone mineral density (BMD) of the lumbar spine, femoral neck, total hip, and total body was measured via dual-energy x-ray absorptiometry.
In total, 53% of male participants and 49% of female participants tested positive for H. pylori, with CagA-positive strains found in 27% of males and 26% of females. No differences in infection rates were discovered in regard to socioeconomic status, age, weight, or height. Patients with normal BMD (45%), osteoporosis (51%), or osteopenia (49%) had similar prevalence of H. pylori infection, but CagA-positive strains were more frequently found in osteoporotic (30%) and osteopenic (26%) patients, compared to patients with normal BMD (21%, P < .01). CagA-positive female patients also had lower lumbar (0.950 g/cm2) and femoral (0.795 g/cm2) BMD, compared to CagA-negative (0.987 and 0.813 g/cm2) or H. pylori-negative women (0.997 and 0.821 g/cm2), respectively.
After an average follow-up period of 11.8 years, 199 nontraumatic fractures (72 vertebral and 127 nonvertebral) had occurred in 158 participants. Patients with CagA-positive strains of H. pylori had significantly increased risk of a clinical vertebral fracture (hazard ratio [HR], 5.27; 95% confidence interval, 2.23-12.63; P < .0001) or a nonvertebral incident fracture (HR, 2.09; 95% CI, 1.27-2.46; P < .01), compared to patients without H. pylori. After adjustment for age, sex, and body mass index, the risk among CagA-positive patients remained similarly significantly elevated for both vertebral (aHR, 4.78; 95% CI, 1.99-11.47; P < .0001) and nonvertebral fractures (aHR, 2.04; 95% CI, 1.22-3.41; P < .01).
The authors acknowledged their study’s limitations, including a cohort that was notably low in male participants, an inability to assess the effects of eradicating H. pylori on bone, and uncertainty as to which specific effects of H. pylori infection increase the risk of osteoporosis or fracture. Along those lines, they noted that an association between serum CagA antibody titer and gastric mucosal inflammation could lead to malabsorption of calcium, hypothesizing that antibody titer rather than antibody positivity “might be a more relevant marker for assessing the risk of bone fragility in patients affected by H. pylori infection.”
The study was supported in part by a grant from the Italian Association for Osteoporosis. The authors reported no potential conflicts of interest.
SOURCE: Gennari L et al. J Bone Miner Res. 2020 Aug 13. doi: 10.1002/jbmr.4162.
FROM THE JOURNAL OF BONE AND MINERAL RESEARCH
Gender gaps persist in academic rheumatology
They’re less likely to hold a higher-level professorship position, feature as a senior author on a paper, or receive a federal grant. Two recent studies underscore progress for and barriers to career advancement.

One cross-sectional analysis of practicing U.S. rheumatologists found that fewer women are professors compared with men (12.6% vs. 36.8%) or associate professors (17.5% vs. 28%). A larger proportion of women serve as assistant professors (55.5% vs. 31.5%). From a leadership perspective, women are making progress. Their odds are similar to men as far as holding a fellowship or division director position in a rheumatology division.
For this study, published in Arthritis & Rheumatology on Aug. 16, April Jorge, MD, and her colleagues at Massachusetts General Hospital and Harvard Medical School, both in Boston, identified 6,125 rheumatologists from a database of all licensed physicians and used multivariate logistic regression to assess gender differences in academic advancement. They arrived at their results after accounting for variables such as age, research and academic appointments, publications, achievements, and years since residency graduation.
Women rheumatologists are younger, completing their residency more recently than their male colleagues. Their numbers in academic rheumatology have gradually increased over the last few decades, recently outpacing men. In 2015, the American College of Rheumatology reported that women made up 41% of the workforce and 66% of rheumatology fellows. Dr. Jorge and associates stressed the importance of fostering women in leadership positions and ensuring gender equity in academic career advancement.
Women also had fewer publications and grants from the National Institutes of Health. Several factors could account for this, such as time spent in the workforce or on parental leave, work-life balance, and mentorship. “However, gender differences in academic promotion remained after adjusting for each of these typical promotion criteria, indicating that other unidentified factors also contribute to the gap in promotion for women academic rheumatologists,” the investigators noted.
The authors weren’t able to assess how parental leave and work effort affected results or why pay differences existed between men and women. They also weren’t able to determine how many physicians left academic practice. “If greater numbers of women than men left the academic rheumatology workforce – for one of many reasons, including that they were not promoted – our findings could underestimate sex differences in academic rank,” they acknowledged.
Lower authorship rate examined
Fewer women in full or associate professor positions might explain why female authorship on research papers is underrepresented, according to another study published Aug. 18 in Arthritis & Rheumatology. Ekta Bagga and colleagues at the University of Auckland (New Zealand) examined 7,651 original research articles from high-impact rheumatology and general medical journals published during 2015-2019 and reported that women were much less likely to achieve first or senior author positions in reports of randomized, controlled trials. This was especially true for studies initiated and funded by industry, compared with other research designs.
More gender parity existed for first authorship than senior authorship – women first authors and senior authors appeared in 51.5% and 35.3% of the papers, respectively. For all geographical regions, the proportion of women senior authors fell below 40%. Representation was especially low in regions other than Europe and North America. These observations likely reflect gender disparities in the medical workforce, Nicola Dalbeth, MD, the study’s senior author, said in an interview.
“We know that, although women make up almost half the rheumatology workforce in many countries around the world, we are less likely to be in positions of senior academic leadership,” added Dr. Dalbeth, a rheumatologist and professor at the University of Auckland’s Bone and Joint Research Group. Institutions and industry should take steps to ensure that women rheumatologists get equal representation, particularly in clinical trial development, she added.
The study had its limitations, one of which was that the researchers didn’t analyze individual author names. This means that one person may have authored multiple articles. “Given the relatively low number of women in academic rheumatology leadership positions, our method of analysis may have overrepresented the number of women authors of rheumatology publications, particularly in senior positions,” stated Dr. Dalbeth and colleagues.
Implicit bias in academia

The articles by Jorge et al. and Bagga et al. suggest that implicit bias is as prevalent in medicine as it is in general society, Jason Kolfenbach, MD, said in an interview. Dr. Kolfenbach is an associate professor of medicine and rheumatology and director of the rheumatology fellowship program at University of Colorado at Denver, Aurora.
“The study by Jorge et al. is eye opening because it demonstrates that academic promotion is lower among women even after adjustment for some of these measures of academic productivity,” Dr. Kolfenbach said. It’s likely that bias plays some role “since there is a human element behind promotions committees, as well as committees selecting faculty for the creation of guidelines and speaker panels at national conferences.”
The study by Bagga et al. “matches my personal perception of industry-sponsored studies and pharmaceutical-sponsored speakers bureaus, namely that they are overrepresented by male faculty,” Dr. Kolfenbach continued.
Prior to COVID-19, the department of medicine at the University of Colorado had begun participating in a formal program called the Bias Reduction in Internal Medicine Initiative, a National Institutes of Health–sponsored study. “I’m hopeful programs such as this can lead to a more equitable situation than described by the findings in these two studies,” he added.
Article type, country of origin play a role
Other research corroborates the findings in these two papers. Giovanni Adami, MD, and coauthors examined 366 rheumatology guidelines and recommendations and determined that only 32% featured a female first author. However, authorship did increase for women over time, achieving parity in 2017.
There are several points to consider when exploring gender disparity, Dr. Adami said in an interview. “Original articles, industry-sponsored articles, and recommendation articles explore different disparities,” he offered. Recommendations and industry-sponsored articles are usually authored by international experts such as division directors or full professors. Original articles, in comparison, aren’t as affected by the “opinion leader” effect, he added.
Country of origin is also a crucial aspect, Dr. Adami said. In his own search of guidelines and articles published by Japanese or Chinese researchers, he noticed that males made up the vast majority of authors. “The cultural aspects of the country where research develops is a vital thing to consider when analyzing gender disparity.”
Dr. Adami’s homeland of Italy is a case in point: most of the division chiefs and professors are male. “Here in Italy, there’s a common belief that a woman cannot pursue an academic career or aim for a leadership position,” he noted.
Italy’s public university system has seen some improvements in gender parity, he continued. “For example, in 2009 there were 61,000 new medical students in Italy, and the majority [57%] were female. Nonetheless, we still have more male professors of medicine and more male PhD candidates.”
Gender gap narrows for conference speakers

In another study, rheumatologists Jean Liew, MD, of the University of Washington, Seattle, and Kanika Monga, MD, of the University of Texas Health Science Center at Houston, found notable gender gaps in speakers at ACR conferences. Women represented under 50% of speakers at these meetings over a 2-year period. “Although the gender gap at recent ACR meetings was narrower as compared with other conferences, we must remain cognizant of its presence and continue to work towards equal representation,” the authors wrote in a correspondence letter in Annals of the Rheumatic Diseases.
Dr. Monga said she was excited to see so many studies on the topic of gender disparities in rheumatology. The Jorge et al. and Bagga et al. papers “delve deeper into quantifying the gender gap in rheumatology. These studies allow us to better identify where the discrepancies may be,” she said in an interview.
“I found it very interesting that women were less likely to be promoted in academic rank but as likely as men to hold leadership positions,” Dr. Monga said. She agreed with the authors that criteria for academic promotion should be reassessed to ensure that it values the diversity of scholarly work that rheumatologists pursue.
Men may still outnumber women speakers at ACR meetings, but the Liew and Monga study did report a 4.2% increase in female speaker representation from 2017 to 2018. “We were happy to note that that continued to be the case at The American College of Rheumatology’s Annual Meeting in 2019. I hope that this reflects a positive change in our specialty,” she said.
Dr. Dalbeth’s study received support from a University of Auckland Summer Studentship Award. She has received consulting fees, speaker fees, or grants from AstraZeneca, Horizon, Amgen, Janssen, and other companies outside of the submitted work. The other authors declared no competing interests.
Dr. Jorge receives funds from the Rheumatology Research Foundation. The senior author on her study receives funding from the National Institute of Arthritis and Musculoskeletal and Skin Diseases.
They’re less likely to hold a higher-level professorship position, feature as a senior author on a paper, or receive a federal grant. Two recent studies underscore progress for and barriers to career advancement.
One cross-sectional analysis of practicing U.S. rheumatologists found that fewer women are professors compared with men (12.6% vs. 36.8%) or associate professors (17.5% vs. 28%). A larger proportion of women serve as assistant professors (55.5% vs. 31.5%). From a leadership perspective, women are making progress. Their odds are similar to men as far as holding a fellowship or division director position in a rheumatology division.
For this study, published in Arthritis & Rheumatology on Aug. 16, April Jorge, MD, and her colleagues at Massachusetts General Hospital and Harvard Medical School, both in Boston, identified 6,125 rheumatologists from a database of all licensed physicians and used multivariate logistic regression to assess gender differences in academic advancement. They arrived at their results after accounting for variables such as age, research and academic appointments, publications, achievements, and years since residency graduation.
Women rheumatologists are younger, completing their residency more recently than their male colleagues. Their numbers in academic rheumatology have gradually increased over the last few decades, recently outpacing men. In 2015, the American College of Rheumatology reported that women made up 41% of the workforce and 66% of rheumatology fellows. Dr. Jorge and associates stressed the importance of fostering women in leadership positions and ensuring gender equity in academic career advancement.
Women also had fewer publications and grants from the National Institutes of Health. Several factors could account for this, such as time spent in the workforce or on parental leave, work-life balance, and mentorship. “However, gender differences in academic promotion remained after adjusting for each of these typical promotion criteria, indicating that other unidentified factors also contribute to the gap in promotion for women academic rheumatologists,” the investigators noted.
The authors weren’t able to assess how parental leave and work effort affected results or why pay differences existed between men and women. They also weren’t able to determine how many physicians left academic practice. “If greater numbers of women than men left the academic rheumatology workforce – for one of many reasons, including that they were not promoted – our findings could underestimate sex differences in academic rank,” they acknowledged.
Lower authorship rate examined
Fewer women in full or associate professor positions might explain why female authorship on research papers is underrepresented, according to another study published Aug. 18 in Arthritis & Rheumatology. Ekta Bagga and colleagues at the University of Auckland (New Zealand) examined 7,651 original research articles from high-impact rheumatology and general medical journals published during 2015-2019 and reported that women were much less likely to achieve first or senior author positions in reports of randomized, controlled trials. This was especially true for studies initiated and funded by industry, compared with other research designs.
More gender parity existed for first authorship than senior authorship – women first authors and senior authors appeared in 51.5% and 35.3% of the papers, respectively. For all geographical regions, the proportion of women senior authors fell below 40%. Representation was especially low in regions other than Europe and North America. These observations likely reflect gender disparities in the medical workforce, Nicola Dalbeth, MD, the study’s senior author, said in an interview.
“We know that, although women make up almost half the rheumatology workforce in many countries around the world, we are less likely to be in positions of senior academic leadership,” added Dr. Dalbeth, a rheumatologist and professor at the University of Auckland’s Bone and Joint Research Group. Institutions and industry should take steps to ensure that women rheumatologists get equal representation, particularly in clinical trial development, she added.
The study had its limitations, one of which was that the researchers didn’t analyze individual author names. This means that one person may have authored multiple articles. “Given the relatively low number of women in academic rheumatology leadership positions, our method of analysis may have overrepresented the number of women authors of rheumatology publications, particularly in senior positions,” stated Dr. Dalbeth and colleagues.
Implicit bias in academia
The articles by Jorge et al. and Bagga et al. suggest that implicit bias is as prevalent in medicine as it is in general society, Jason Kolfenbach, MD, said in an interview. Dr. Kolfenbach is an associate professor of medicine and rheumatology and director of the rheumatology fellowship program at University of Colorado at Denver, Aurora.
“The study by Jorge et al. is eye opening because it demonstrates that academic promotion is lower among women even after adjustment for some of these measures of academic productivity,” Dr. Kolfenbach said. It’s likely that bias plays some role “since there is a human element behind promotions committees, as well as committees selecting faculty for the creation of guidelines and speaker panels at national conferences.”
The study by Bagga et al. “matches my personal perception of industry-sponsored studies and pharmaceutical-sponsored speakers bureaus, namely that they are overrepresented by male faculty,” Dr. Kolfenbach continued.
Prior to COVID-19, the department of medicine at the University of Colorado had begun participating in a formal program called the Bias Reduction in Internal Medicine Initiative, a National Institutes of Health–sponsored study. “I’m hopeful programs such as this can lead to a more equitable situation than described by the findings in these two studies,” he added.
Article type, country of origin play a role
Other research corroborates the findings in these two papers. Giovanni Adami, MD, and coauthors examined 366 rheumatology guidelines and recommendations and determined that only 32% featured a female first author. However, authorship did increase for women over time, achieving parity in 2017.
There are several points to consider when exploring gender disparity, Dr. Adami said in an interview. “Original articles, industry-sponsored articles, and recommendation articles explore different disparities,” he offered. Recommendations and industry-sponsored articles are usually authored by international experts such as division directors or full professors. Original articles, in comparison, aren’t as affected by the “opinion leader” effect, he added.
Country of origin is also a crucial aspect, Dr. Adami said. In his own search of guidelines and articles published by Japanese or Chinese researchers, he noticed that males made up the vast majority of authors. “The cultural aspects of the country where research develops is a vital thing to consider when analyzing gender disparity.”
Dr. Adami’s homeland of Italy is a case in point: most of the division chiefs and professors are male. “Here in Italy, there’s a common belief that a woman cannot pursue an academic career or aim for a leadership position,” he noted.
Italy’s public university system has seen some improvements in gender parity, he continued. “For example, in 2009 there were 61,000 new medical students in Italy, and the majority [57%] were female. Nonetheless, we still have more male professors of medicine and more male PhD candidates.”
Gender gap narrows for conference speakers
In another study, rheumatologists Jean Liew, MD, of the University of Washington, Seattle, and Kanika Monga, MD, of the University of Texas Health Science Center at Houston, found notable gender gaps in speakers at ACR conferences. Women represented under 50% of speakers at these meetings over a 2-year period. “Although the gender gap at recent ACR meetings was narrower as compared with other conferences, we must remain cognizant of its presence and continue to work towards equal representation,” the authors wrote in a correspondence letter in Annals of the Rheumatic Diseases.
Dr. Monga said she was excited to see so many studies on the topic of gender disparities in rheumatology. The Jorge et al. and Bagga et al. papers “delve deeper into quantifying the gender gap in rheumatology. These studies allow us to better identify where the discrepancies may be,” she said in an interview.
“I found it very interesting that women were less likely to be promoted in academic rank but as likely as men to hold leadership positions,” Dr. Monga said. She agreed with the authors that criteria for academic promotion should be reassessed to ensure that it values the diversity of scholarly work that rheumatologists pursue.
Men may still outnumber women speakers at ACR meetings, but the Liew and Monga study did report a 4.2% increase in female speaker representation from 2017 to 2018. “We were happy to note that that continued to be the case at The American College of Rheumatology’s Annual Meeting in 2019. I hope that this reflects a positive change in our specialty,” she said.
Dr. Dalbeth’s study received support from a University of Auckland Summer Studentship Award. She has received consulting fees, speaker fees, or grants from AstraZeneca, Horizon, Amgen, Janssen, and other companies outside of the submitted work. The other authors declared no competing interests.
Dr. Jorge receives funds from the Rheumatology Research Foundation. The senior author on her study receives funding from the National Institute of Arthritis and Musculoskeletal and Skin Diseases.

Researchers home in on optimal biopsy length for giant cell arteritis
A new retrospective analysis has found 1.5-2 cm to be the optimal length of a temporal artery biopsy for detecting giant cell arteritis. Longer lengths did not yield enough improvement in diagnosis to justify the increased risk of complications. The length calculation accounts for post-fixation shrinkage.
The study, published Aug. 20 in Lancet Rheumatology, represents an “important contribution” to help with the diagnosis of giant cell arteritis when a decision has been made to perform a temporal artery biopsy, according to authors of an editorial accompanying the study.
Giant cell arteritis is an inflammatory condition of medium and large arteries, usually affecting the aorta and proximal aorta. Diagnosis includes a combination of clinical presentation and imaging or histology via a temporal artery biopsy, but the optimal tissue length for a biopsy has not been established. Longer lengths were initially considered best because inflammation can be non-uniform, and a shorter length could therefore raise the risk of a false negative if it contained few signs of inflammation.
Studies in the 1990s and early 2000s concluded that biopsies 2-5 cm in length were optimal. But later studies determined that a minimum of just 0.5 cm was necessary. The European League Against Rheumatism updated its recommendations in 2018 and the British Society for Rheumatology followed suit in 2020, both with a suggested minimum length of 1.0 cm. Despite these guidances, the optimal biopsy length beyond 1 cm remains unknown.
For the study, first author Raymond Chu, MD, of the University of Alberta Hospital, Edmonton, reviewed electronic medical records of all patients who underwent temporal artery biopsies in Alberta between Jan. 1, 2008, and Jan. 1, 2018. A single pathologist reviewed all positive findings to ensure uniformity of pathological interpretation. When the reviewer disagreed with the initial diagnosis, researchers removed the result from the analysis.
The study included 1,203 biopsies from 1,176 patients at 22 institutions. A total of 13 positive biopsies were removed following pathologist review. The median biopsy length was 1.3 cm. Median erythrocyte sedimentation rate (ESR) was 41 mm/hour, and median C-reactive protein (CRP) level was 14.7 mg/L. Univariate analyses found associations between positive biopsy and increased age (75.3 vs. 71.3 years; P < .0001), increased ESR (57 vs. 36 mm/hour; P < .0001), lower CRP (12.1 vs. 41.8 mg/L; P < .0001), and longer biopsy length (1.6 vs. 1.2 cm; P = .0025).
In a multivariate analysis, the only variables associated with a positive biopsy were age (adjusted odds ratio [aOR], 1.04; P = .0001), lower CRP levels (aOR, 1.01; P = .0006), and biopsy length (aOR, 1.22; P = .047). The researchers then stratified the sample by biopsy length, using categories of < 0.5 cm, 0.5-1.0 cm, 1.0-1.5 cm, 1.5-2.0 cm, 2.0-2.5 cm, and ≥ 2.5 cm. They identified the two top change points according to the Akaike information criterion as 1.5 cm and 2.0 cm, but only 1.5 cm was statistically significant (≥ 1.5 versus < 1.5; OR, 1.57; P = .011).
Accounting for an average 8% contraction following excision, the researchers recommend an optimal pre-fixation biopsy length of 1.5-2.0 cm.
Some previous studies had suggested no association between increased sample length and false negatives, but they were based on small sample sizes. The current study is limited by its retrospective design and lack of treatment data. The lack of marked inflammation in the sample population suggests that patients were frequently treated empirically with glucocorticoids, and this could have increased the frequency of false negative biopsies, the researchers said.

In the accompanying editorial, Frank Buttgereit, MD, of Charité University Medicine in Berlin and Christian Dejaco, MD, PhD, of the Medical University of Graz (Austria) point out that ultrasound is now often used for the diagnosis of giant cell arteritis, following clinical examination and laboratory testing. When it has been determined that biopsy is necessary, they said that it is imperative that the harvest be carried out by an experienced physician, and the new study provides a useful contribution through its clear recommendation for biopsy length.

The authors of the editorial also point out the importance of experienced pathologists, but interpretation is subject to inter- and intraobserver variability, as shown in a previous study that found that ultrasound and histology have similar reliability.
The study received no funding. Several authors reported receiving personal fees from Hoffmann-LaRoche and serving as site primary investigators for industry-sponsored vasculitis trials.
SOURCE: Chu R et al. Lancet Rheumatol. 2020 Aug 20. doi: 10.1016/S2665-9913(20)30222-8.
A new retrospective analysis has found 1.5-2 cm to be the optimal length of a temporal artery biopsy for detecting giant cell arteritis. Longer lengths did not yield enough improvement in diagnosis to justify the increased risk of complications. The length calculation accounts for post-fixation shrinkage.
The study, published Aug. 20 in Lancet Rheumatology, represents an “important contribution” to help with the diagnosis of giant cell arteritis when a decision has been made to perform a temporal artery biopsy, according to authors of an editorial accompanying the study.
Giant cell arteritis is an inflammatory condition of medium and large arteries, usually affecting the aorta and proximal aorta. Diagnosis includes a combination of clinical presentation and imaging or histology via a temporal artery biopsy, but the optimal tissue length for a biopsy has not been established. Longer lengths were initially considered best because inflammation can be non-uniform, and a shorter length could therefore raise the risk of a false negative if it contained few signs of inflammation.
Studies in the 1990s and early 2000s concluded that biopsies 2-5 cm in length were optimal. But later studies determined that a minimum of just 0.5 cm was necessary. The European League Against Rheumatism updated its recommendations in 2018 and the British Society for Rheumatology followed suit in 2020, both with a suggested minimum length of 1.0 cm. Despite these guidances, the optimal biopsy length beyond 1 cm remains unknown.
For the study, first author Raymond Chu, MD, of the University of Alberta Hospital, Edmonton, reviewed electronic medical records of all patients who underwent temporal artery biopsies in Alberta between Jan. 1, 2008, and Jan. 1, 2018. A single pathologist reviewed all positive findings to ensure uniformity of pathological interpretation. When the reviewer disagreed with the initial diagnosis, researchers removed the result from the analysis.
The study included 1,203 biopsies from 1,176 patients at 22 institutions. A total of 13 positive biopsies were removed following pathologist review. The median biopsy length was 1.3 cm. Median erythrocyte sedimentation rate (ESR) was 41 mm/hour, and median C-reactive protein (CRP) level was 14.7 mg/L. Univariate analyses found associations between positive biopsy and increased age (75.3 vs. 71.3 years; P < .0001), increased ESR (57 vs. 36 mm/hour; P < .0001), lower CRP (12.1 vs. 41.8 mg/L; P < .0001), and longer biopsy length (1.6 vs. 1.2 cm; P = .0025).
In a multivariate analysis, the only variables associated with a positive biopsy were age (adjusted odds ratio [aOR], 1.04; P = .0001), lower CRP levels (aOR, 1.01; P = .0006), and biopsy length (aOR, 1.22; P = .047). The researchers then stratified the sample by biopsy length, using categories of < 0.5 cm, 0.5-1.0 cm, 1.0-1.5 cm, 1.5-2.0 cm, 2.0-2.5 cm, and ≥ 2.5 cm. They identified the two top change points according to the Akaike information criterion as 1.5 cm and 2.0 cm, but only 1.5 cm was statistically significant (≥ 1.5 versus < 1.5; OR, 1.57; P = .011).
Accounting for an average 8% contraction following excision, the researchers recommend an optimal pre-fixation biopsy length of 1.5-2.0 cm.
Some previous studies had suggested no association between increased sample length and false negatives, but they were based on small sample sizes. The current study is limited by its retrospective design and lack of treatment data. The lack of marked inflammation in the sample population suggests that patients were frequently treated empirically with glucocorticoids, and this could have increased the frequency of false negative biopsies, the researchers said.
In the accompanying editorial, Frank Buttgereit, MD, of Charité University Medicine in Berlin and Christian Dejaco, MD, PhD, of the Medical University of Graz (Austria) point out that ultrasound is now often used for the diagnosis of giant cell arteritis, following clinical examination and laboratory testing. When it has been determined that biopsy is necessary, they said that it is imperative that the harvest be carried out by an experienced physician, and the new study provides a useful contribution through its clear recommendation for biopsy length.
The authors of the editorial also point out the importance of experienced pathologists, but interpretation is subject to inter- and intraobserver variability, as shown in a previous study that found that ultrasound and histology have similar reliability.
The study received no funding. Several authors reported receiving personal fees from Hoffmann-LaRoche and serving as site primary investigators for industry-sponsored vasculitis trials.
SOURCE: Chu R et al. Lancet Rheumatol. 2020 Aug 20. doi: 10.1016/S2665-9913(20)30222-8.
FROM LANCET RHEUMATOLOGY
TNF inhibitors linked to inflammatory CNS events
, new research suggests
The nested case-control study included more than 200 participants with diseases such as rheumatoid arthritis, psoriasis, and Crohn’s disease. Results showed that exposure to TNF inhibitors was significantly associated with increased risk for demyelinating CNS events, such as multiple sclerosis, and nondemyelinating events, such as meningitis and encephalitis.
Interestingly, disease-specific secondary analyses showed that the strongest association for inflammatory events was in patients with rheumatoid arthritis.
Lead author Amy Kunchok, MD, of Mayo Clinic, Rochester, Minn., noted that “these are highly effective therapies for patients” and that these CNS events are likely uncommon.
“Our study has observed an association, but this does not imply causality. Therefore, we are not cautioning against using these therapies in appropriate patients,” Dr. Kunchok said in an interview.
“Rather, we recommend that clinicians assessing patients with both inflammatory demyelinating and nondemyelinating CNS events consider a detailed evaluation of the medication history, particularly in patients with coexistent autoimmune diseases who may have a current or past history of biological therapies,” she said.
The findings were published in JAMA Neurology.
Poorly understood
TNF inhibitors “are common therapies for certain autoimmune diseases,” the investigators noted.
Previously, a link between exposure to these inhibitors and inflammatory CNS events “has been postulated but is poorly understood,” they wrote.
In the current study, they examined records for 106 patients who were treated at Mayo clinics in Minnesota, Arizona, or Florida from January 2003 through February 2019. All participants had been diagnosed with an autoimmune disease that the Food and Drug Administration has listed as an indication for TNF inhibitor use. This included rheumatoid arthritis (n = 48), ankylosing spondylitis (n = 4), psoriasis and psoriatic arthritis (n = 21), Crohn’s disease (n = 27), and ulcerative colitis (n = 6). Their records also showed diagnostic codes for the inflammatory demyelinating CNS events of relapsing-remitting or primary progressive MS, clinically isolated syndrome, radiologically isolated syndrome, neuromyelitis optica spectrum disorder, and transverse myelitis or for the inflammatory nondemyelinating CNS events of meningitis, meningoencephalitis, encephalitis, neurosarcoidosis, and CNS vasculitis. The investigators also included 106 age-, sex-, and autoimmune disease–matched participants 1:1 to act as the control group.
In the total study population, 64% were women and the median age at disease onset was 52 years. In addition, 60% of the patient group and 40% of the control group were exposed to TNF inhibitors.
Novel finding?
Results showed that TNF inhibitor exposure was significantly linked to increased risk for developing any inflammatory CNS event (adjusted odds ratio, 3.01; 95% CI, 1.55-5.82; P = .001). When the outcomes were stratified by class of inflammatory event, these results were similar. The aOR was 3.09 (95% CI, 1.19-8.04; P = .02) for inflammatory demyelinating CNS events and was 2.97 (95% CI, 1.15-7.65; P = .02) for inflammatory nondemyelinating events.
Dr. Kunchok noted that the association between the inhibitors and nondemyelinating events was “a novel finding from this study.”
In secondary analyses, patients with rheumatoid arthritis and exposure to TNF inhibitors had the strongest association with any inflammatory CNS event (aOR, 4.82; 95% CI, 1.62-14.36; P = .005).
A pooled cohort comprising only the participants with the other autoimmune diseases did not show a significant association between exposure to TNF inhibitors and development of CNS events (P = .09).
“Because of the lack of power, further stratification by individual autoimmune diseases was not analyzed,” the investigators reported.
Although the overall findings showed that exposure to TNF inhibitors was linked to increased risk for inflammatory events, whether this association “represents de novo or exacerbated inflammatory pathways requires further research,” the authors wrote.
Dr. Kunchok added that more research, especially population-based studies, is also needed to examine the incidence of these inflammatory CNS events in patients exposed to TNF-alpha inhibitors.
Adds to the literature
In an accompanying editorial, Jeffrey M. Gelfand, MD, department of neurology at the University of California, San Francisco, and Jinoos Yazdany, MD, Zuckerberg San Francisco General Hospital at UCSF, noted that although the study adds to the literature, the magnitude of the risk found “remains unclear.”
“Randomized clinical trials are not suited to the study of rare adverse events,” Dr. Gelfand and Dr. Yazdany wrote. They agree with Dr. Kunchok that “next steps should include population-based observational studies that control for disease severity.”
Still, the current study provides additional evidence of rare adverse events in patients receiving TNF inhibitors, they noted. So how should prescribers proceed?
“As with all treatments, the risk-benefit ratio for the individual patient’s situation must be weighed and appropriate counseling must be given to facilitate shared decision-making discussions,” wrote the editorialists.
“Given what is known about the risk of harm, avoiding TNF inhibitors is advisable in patients with known MS,” they wrote.
In addition, neurologic consultation can be helpful for clarifying diagnoses and providing advice on monitoring strategies for TNF inhibitor treatment in those with possible MS or other demyelinating conditions, noted the editorialists.
“In patients who develop new concerning neurological symptoms while receiving TNF inhibitor treatment, timely evaluation is indicated, including consideration of neuroinflammatory, infectious, and neurological diagnoses that may be unrelated to treatment,” they added.
“Broader awareness of risks that studies such as this one by Kunchok et al provide can ... encourage timelier recognition of potential TNF inhibitor–associated neuroinflammatory events and may improve outcomes for patients,” Dr. Gelfand and Dr. Yazdany concluded.
The study was funded by a grant from the National Center for Advancing Translational Sciences. Dr. Kunchok reports having received research funding from Biogen outside this study. A full list of disclosures for the other study authors is in the original article. Dr. Gelfand reports having received g rants for a clinical trial from Genentech and consulting fees from Biogen, Alexion, Theranica, Impel Neuropharma, Advanced Clinical, Biohaven, and Satsuma. Dr. Yazdany reports having received grants from Pfizer and consulting fees from AstraZeneca and Eli Lilly outside the submitted work.
A version of this article originally appeared on Medscape.com.
Age, smoking among leading cancer risk factors for SLE patients
A new study has quantified cancer risk factors in patients with systemic lupus erythematosus, including smoking and the use of certain medications.
“As expected, older age was associated with cancer overall, as well as with the most common cancer subtypes,” wrote Sasha Bernatsky, MD, PhD, of McGill University, Montreal, and coauthors. The study was published in Arthritis Care & Research.
To determine the risk of cancer in people with clinically confirmed incident systemic lupus erythematosus (SLE), the researchers analyzed data from 1,668 newly diagnosed lupus patients with at least one follow-up visit. All patients were enrolled in the Systemic Lupus International Collaborating Clinics inception cohort from across 33 different centers in North America, Europe, and Asia. A total of 89% (n = 1,480) were women, and 49% (n = 824) were white. The average follow-up period was 9 years.
Of the 1,668 SLE patients, 65 developed some type of cancer. The cancers included 15 breast;, 10 nonmelanoma skin; 7 lung; 6 hematologic, 6 prostate; 5 melanoma; 3 cervical; 3 renal; 2 gastric; 2 head and neck; 2 thyroid; and 1 rectal, sarcoma, thymoma, or uterine. No patient had more than one type, and the mean age of the cancer patients at time of SLE diagnosis was 45.6 (standard deviation, 14.5).
Almost half of the 65 cancers occurred in past or current smokers, including all of the lung cancers, while only 33% of patients without cancers smoked prior to baseline. After univariate analysis, characteristics associated with a higher risk of all cancers included older age at SLE diagnosis (adjusted hazard ratio, 1.05; 95% confidence interval, 1.03-1.06), White race/ethnicity (aHR 1.34; 95% CI, 0.76-2.37), and smoking (aHR 1.21; 95% CI, 0.73-2.01).
After multivariate analysis, the two characteristics most associated with increased cancer risk were older age at SLE diagnosis and being male. The analyses also confirmed that older age was a risk factor for breast cancer (aHR 1.06; 95% CI, 1.02-1.10) and nonmelanoma skin cancer (aHR, 1.06; 95% CI, 1.02-1.11), while use of antimalarial drugs was associated with a lower risk of both breast (aHR, 0.28; 95% CI, 0.09-0.90) and nonmelanoma skin (aHR, 0.23; 95% CI, 0.05-0.95) cancers. For lung cancer, the highest risk factor was smoking 15 or more cigarettes a day (aHR, 6.64; 95% CI, 1.43-30.9); for hematologic cancers, it was being in the top quartile of SLE disease activity (aHR, 7.14; 95% CI, 1.13-45.3).
The authors acknowledged their study’s limitations, including the small number of cancers overall and purposefully not comparing cancer risk in SLE patients with risk in the general population. Although their methods – “physicians recording events at annual visits, confirmed by review of charts” – were recognized as very suitable for the current analysis, they noted that a broader comparison would “potentially be problematic due to differential misclassification error” in cancer registry data.
Two of the study’s authors reported potential conflicts of interest, including receiving grants and consulting and personal fees from various pharmaceutical companies. No other potential conflicts were reported.
SOURCE: Bernatsky S et al. Arthritis Care Res. 2020 Aug 19. doi: 10.1002/acr.24425.
FROM ARTHRITIS CARE & RESEARCH
Humira topped drug-revenue list for 2019
Humira outsold all other drugs in 2019 in terms of revenue as cytokine inhibitor medications earned their way to three of the first four spots on the pharmaceutical best-seller list, according to a new analysis from the IQVIA Institute for Human Data Science.
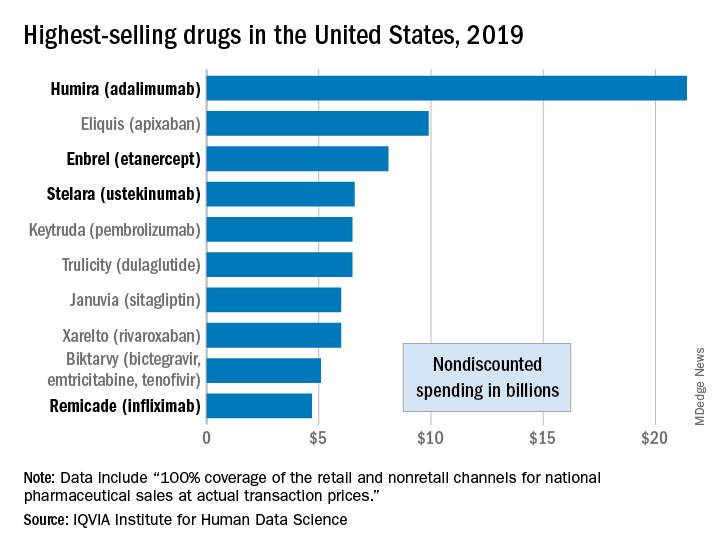
Sales of Humira (adalimumab) amounted to $21.4 billion before discounting, Murray Aitken, the institute’s executive director, and associates wrote in their analysis. That’s more than double the total of the anticoagulant Eliquis (apixaban), which brought in $9.9 billion in its last year before generic forms became available.
The next two spots were filled by the tumor necrosis factor inhibitor Enbrel (etanercept) with $8.1 billion in sales and the interleukin 12/23 inhibitor Stelara (ustekinumab) with sales totaling $6.6 billion, followed by the chemotherapy drug Keytruda (pembrolizumab) close behind after racking up $6.5 billion in sales, the researchers reported.
Total nondiscounted spending on all drugs in the U.S. market came to $511 billion in 2019, an increase of 5.7% over the $484 billion spent in 2018, based on data from the July 2020 IQVIA National Sales Perspectives.
These figures are “not adjusted for estimates of off-invoice discounts and rebates,” the authors noted, but they include “prescription and insulin products sold into chain and independent pharmacies, food store pharmacies, mail service pharmacies, long-term care facilities, hospitals, clinics, and other institutional settings.”
Those “discounts and rebates” do exist, however, and they can add up. Drug sales for 2019, “after deducting negotiated rebates, discounts, and other forms of price concessions, such as patient coupons or vouchers that offset out-of-pocket costs,” were $235 billion less than overall nondiscounted spending, the report noted.
Now that we’ve shown you the money, let’s take a quick look at volume. The leading drugs by number of dispensed prescriptions in 2019 were, not surprisingly, quite different. First, with 118 million prescriptions, was atorvastatin, followed by levothyroxine (113 million), lisinopril (96), amlodipine (89), and metoprolol (85), Mr. Aitken and associates reported.
Altogether, over 4.2 billion prescriptions were dispensed last year, with a couple of caveats: 90-day and 30-day fills were both counted as one prescription, and OTC drugs were not included, they pointed out.
Humira outsold all other drugs in 2019 in terms of revenue as cytokine inhibitor medications earned their way to three of the first four spots on the pharmaceutical best-seller list, according to a new analysis from the IQVIA Institute for Human Data Science.
Sales of Humira (adalimumab) amounted to $21.4 billion before discounting, Murray Aitken, the institute’s executive director, and associates wrote in their analysis. That’s more than double the total of the anticoagulant Eliquis (apixaban), which brought in $9.9 billion in its last year before generic forms became available.
The next two spots were filled by the tumor necrosis factor inhibitor Enbrel (etanercept) with $8.1 billion in sales and the interleukin 12/23 inhibitor Stelara (ustekinumab) with sales totaling $6.6 billion, followed by the chemotherapy drug Keytruda (pembrolizumab) close behind after racking up $6.5 billion in sales, the researchers reported.
Total nondiscounted spending on all drugs in the U.S. market came to $511 billion in 2019, an increase of 5.7% over the $484 billion spent in 2018, based on data from the July 2020 IQVIA National Sales Perspectives.
These figures are “not adjusted for estimates of off-invoice discounts and rebates,” the authors noted, but they include “prescription and insulin products sold into chain and independent pharmacies, food store pharmacies, mail service pharmacies, long-term care facilities, hospitals, clinics, and other institutional settings.”
Those “discounts and rebates” do exist, however, and they can add up. Drug sales for 2019, “after deducting negotiated rebates, discounts, and other forms of price concessions, such as patient coupons or vouchers that offset out-of-pocket costs,” were $235 billion less than overall nondiscounted spending, the report noted.
Now that we’ve shown you the money, let’s take a quick look at volume. The leading drugs by number of dispensed prescriptions in 2019 were, not surprisingly, quite different. First, with 118 million prescriptions, was atorvastatin, followed by levothyroxine (113 million), lisinopril (96), amlodipine (89), and metoprolol (85), Mr. Aitken and associates reported.
Altogether, over 4.2 billion prescriptions were dispensed last year, with a couple of caveats: 90-day and 30-day fills were both counted as one prescription, and OTC drugs were not included, they pointed out.
SGLT2 inhibitors with metformin look safe for bone
The combination of sodium-glucose transporter-2 (SGLT-2) inhibitors and metformin is not associated with an increase in fracture risk among patients with type 2 diabetes (T2D), according to a new meta-analysis of 25 randomized, controlled trials.
Researchers at The Second Clinical College of Dalian Medical University in Jiangsu, China, compared fracture risk associated with the metformin/SLGT2 combination to metformin alone as well as other T2D therapeutics, and found no differences in risk. The study was published online Aug. 11 in Osteoporosis International.
T2D is associated with an increased risk of fracture, though causative mechanisms remain uncertain. Some lines of evidence suggest multiple factors may contribute to fractures, including hyperglycemia, oxidative stress, toxic effects of advanced glycosylation end-products, altered insulin levels, and treatment-induced hypoglycemia, as well as an association between T2D and increased risk of falls.
Antidiabetes drugs can have positive or negative effects on bone. thiazolidinediones, insulin, and sulfonylureas may increase risk of fractures, while dipeptidyl peptidase-4 (DPP-4) inhibitors and glucagon-like peptide-2 (GLP-2) receptor agonists may be protective. Metformin may also reduce fracture risk.
SGLT-2 inhibitors interrupt glucose reabsorption in the kidney, leading to improved glycemic control. Other benefits include improved renal and cardiovascular outcomes, weight loss, and reduced blood pressure, liver fat, and serum uric acid levels.
These properties have made SGLT-2 inhibitors combined with metformin an important therapy for patients at high risk of atherosclerotic disease, or who have heart failure or chronic kidney disease.
But SGLT-2 inhibition increases osmotic diuresis, and this could alter the mineral balance within bone. Some studies also showed that SGLT-2 inhibitors led to changes in bone turnover markers, bone mineral density, and bone microarchitecture. Observational studies of the SGLT-2 inhibitor canagliflozin found associations with a higher rate of fracture risk in patients taking the drug.
Such studies carry the risk of confounding factors, so the researchers took advantage of the fact that many recent clinical trials have examined the impact of SGLT-2 inhibitors on T2D. They pooled data from 25 clinical trials with a total of 19,500 participants, 9,662 of whom received SGLT-2 inhibitors plus metformin; 9,838 received other active comparators.
The fracture rate was 0.91% in the SGLT-2 inhibitors/metformin group, and 0.80% among controls (odds ratio, 0.97; 95% CI, 0.71-1.32), with no heterogeneity. Metformin alone was not associated with a change in fracture rate (OR, 0.95; 95% CI, 0.44-2.08), nor were other forms of diabetes control (OR, 0.95; 95% CI, 0.69-1.31).
There were some differences in fracture risk among SGLT-2 inhibitors when studied individually, though none differed significantly from controls. The highest risk was associated with the canagliflozin/metformin (OR, 2.19; 95% CI, 0.66-7.27), followed by dapagliflozin/metformin (OR, 0.91; 95% CI, 0.50-1.64), empagliflozin/metformin (OR, 0.94; 95% CI, 0.59-1.50), and ertugliflozin/metformin (OR, 0.76; 95% CI, 0.38-1.54).
There were no differences with respect to hip or lumbar spine fractures, or other fractures. The researchers found no differences in bone mineral density or bone turnover markers.
The meta-analysis is limited by the relatively short average follow-up in the included studies, which was 61 weeks. Bone damage may occur over longer time periods. Bone fractures were also not a prespecified adverse event in most included studies.
The studies also did not provide detailed information on the types of fractures experienced, such as whether they were result of a fall, or the location of the fracture, or bone health parameters. Although the results support a belief that SGLT-2 inhibitors do not adversely affect bone health, “given limited information on bone health outcomes, further work is needed to validate this conclusion,” the authors wrote.
The authors did not disclose any funding and had no relevant conflicts of interest.
SOURCE: B-B Qian et al. Osteoporosis Int. 2020 Aug 11. doi: 10.1007/s00198-020-05590-y.
FROM OSTEOPOROSIS INTERNATIONAL
Obesity negatively affects axial spondyloarthritis disease activity
Obesity in adults with axial spondyloarthritis is associated with significantly worse scores on measures of disease activity when compared with normal-weight patients, according to findings from a meta-analysis of 10 studies.

Obesity or overweight could influence axial spondyloarthritis (axSpA) disease activity in several ways, including production of inflammatory mediators by adipose tissue, joint pain caused by excess weight, loss of muscle mass, and increased atherosclerosis, wrote Augusta Ortolan, MD, of the University of Padova (Italy), and colleagues.
However, “it is less clear whether overweight or obesity per se may be a cause of higher disease activity scores,” they added.
In a systematic review published in Arthritis Care & Research, the investigators identified 10 studies to use in the meta-analysis that involved associations between body mass index (BMI) and disease activity in adults with axSpA. The review included three cohort studies and seven cross-sectional studies of patients aged 18 years and older. Disease activity was assessed using the Bath Ankylosing Spondylitis Disease Activity Index (BASDAI) and the Ankylosing Spondylitis Disease Activity Score (ASDAS).
Overall, the mean difference in BASDAI between patients with normal BMI and overweight or obese patients was –0.38 (P < .0001), and the mean difference in ASDAS between the same groups was –0.19 (P < .0001). When separated into overweight and obese categories, only the difference between normal weight and obesity remained significantly associated with differences in scores on both measures (–0.78 and –0.42, respectively; P < .0001 for both measures). The difference in scores between normal-weight and overweight/obese patients increased with BMI categories, which suggests a possible “dose-effect” relationship between fat mass and disease activity, the researchers wrote.
The study findings were limited by several factors, including the lack of randomized, controlled trials, and potential bias and inconsistency involving BMI measurements, the researchers noted.
However, “we were able to mitigate such limitations via a strict methodology and consistency in the outcomes, thus allowing us to use mean differences – instead of standardized mean differences – as outcomes, which are much easier to interpret and can be directly related to the measurement unit of the outcome,” they wrote.
The results extend data from previous studies, which “could help interpret disease activity measures and understand the difference we could expect between an axSpA patient with normal BMI and increased BMI,” they concluded.
The study received no outside funding. The researchers had no financial conflicts to disclose.
SOURCE: Ortolan A et al. Arthritis Care Res. 2020 Aug 16. doi: 10.1002/acr.24416.
Obesity in adults with axial spondyloarthritis is associated with significantly worse scores on measures of disease activity when compared with normal-weight patients, according to findings from a meta-analysis of 10 studies.
Obesity or overweight could influence axial spondyloarthritis (axSpA) disease activity in several ways, including production of inflammatory mediators by adipose tissue, joint pain caused by excess weight, loss of muscle mass, and increased atherosclerosis, wrote Augusta Ortolan, MD, of the University of Padova (Italy), and colleagues.
However, “it is less clear whether overweight or obesity per se may be a cause of higher disease activity scores,” they added.
In a systematic review published in Arthritis Care & Research, the investigators identified 10 studies to use in the meta-analysis that involved associations between body mass index (BMI) and disease activity in adults with axSpA. The review included three cohort studies and seven cross-sectional studies of patients aged 18 years and older. Disease activity was assessed using the Bath Ankylosing Spondylitis Disease Activity Index (BASDAI) and the Ankylosing Spondylitis Disease Activity Score (ASDAS).
Overall, the mean difference in BASDAI between patients with normal BMI and overweight or obese patients was –0.38 (P < .0001), and the mean difference in ASDAS between the same groups was –0.19 (P < .0001). When separated into overweight and obese categories, only the difference between normal weight and obesity remained significantly associated with differences in scores on both measures (–0.78 and –0.42, respectively; P < .0001 for both measures). The difference in scores between normal-weight and overweight/obese patients increased with BMI categories, which suggests a possible “dose-effect” relationship between fat mass and disease activity, the researchers wrote.
The study findings were limited by several factors, including the lack of randomized, controlled trials, and potential bias and inconsistency involving BMI measurements, the researchers noted.
However, “we were able to mitigate such limitations via a strict methodology and consistency in the outcomes, thus allowing us to use mean differences – instead of standardized mean differences – as outcomes, which are much easier to interpret and can be directly related to the measurement unit of the outcome,” they wrote.
The results extend data from previous studies, which “could help interpret disease activity measures and understand the difference we could expect between an axSpA patient with normal BMI and increased BMI,” they concluded.
The study received no outside funding. The researchers had no financial conflicts to disclose.
SOURCE: Ortolan A et al. Arthritis Care Res. 2020 Aug 16. doi: 10.1002/acr.24416.
FROM ARTHRITIS CARE & RESEARCH
The evidence is not clear: Rheumatic diseases, drugs, and COVID-19
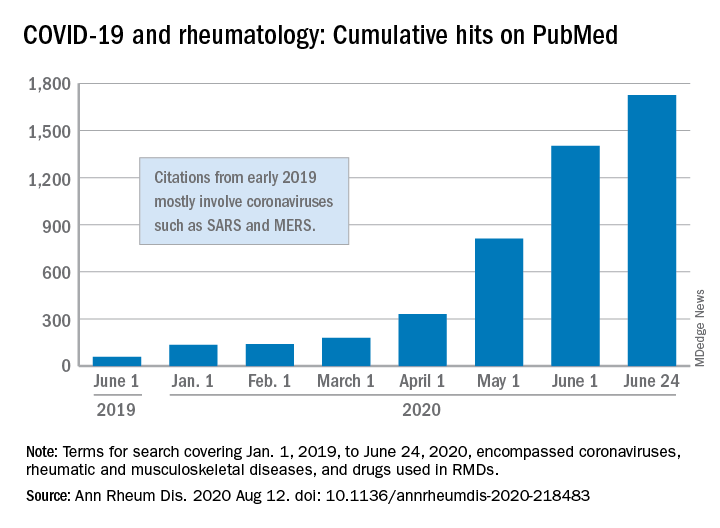
“We are faced by the worldwide spread of a disease that was nonexistent less than a year ago,” Féline P.B. Kroon, MD, and associates said in Annals of the Rheumatic Diseases. “To date, no robust evidence is available to allow strong conclusions on the effects of COVID-19 in patients with RMDs or whether RMDs or [their] treatment impact incidence of infection or outcomes.”
When it comes to quantity of evidence, “the exponential increase in publications over time is evident,” they said. From Jan. 1, 2019 to June 24, 2020, there were 1,725 hits on PubMed for published reports combining COVID-19 with RMDs and drugs used in RMDs. At the beginning of the year, there were only 135 such publications.
The early start of the search, well before identification of the novel coronavirus in China, was meant to ensure that nothing was missed, so “citations that came up in the first months of 2019 mostly encompass papers about other coronaviruses, such as SARS and MERS,” said Dr. Kroon of Zuyderland Medical Center, Heerlen, the Netherlands, when asked for clarification.
The quality of that evidence, however, is another matter. A majority of publications (60%) are “viewpoints or (narrative) literature reviews, and only a small proportion actually presents original data in the form of case reports or case series (15%), observational cohort studies (10%), or clinical trials (<1%),” the investigators explained.
Very few of the published studies, about 10%, specifically involve COVID-19 and RMDs. Even well-regarded sources such as systematic literature reviews or meta-analyses, “which will undoubtedly appear more frequently in the next few months in response to requests by users who feel overwhelmed by a multitude of data, will not eliminate the internal bias present in individual studies,” Dr. Kroon and associates wrote.
The lack of evidence also brings into question one particular form of guidance: recommendations “issued by groups of the so-called experts and (inter)national societies, such as, among others, American College of Rheumatology and European League Against Rheumatism,” the investigators said.
“The rapid increase in research on COVID-19 is encouraging,” but at the same time it “also poses risks of ‘information overload’ or ‘fake news,’ ” they said. “As researchers and clinicians, it is our responsibility to carefully interpret study results that emerge, even more so in this ‘digital era,’ in which published data can quickly have a large societal impact.”
SOURCE: Kroon FPB et al. Ann Rheum Dis. 2020 Aug 12. doi: 10.1136/annrheumdis-2020-218483.
FROM ANNALS OF THE RHEUMATIC DISEASES
RA patients show decreased risk for new-onset type 2 diabetes
Patients with RA were at lower risk for developing incident type 2 diabetes mellitus (T2DM) in comparison with patients with hypertension, psoriatic arthritis (PsA), or osteoarthritis, as well as the general population without RA in a retrospective cohort study of a large, nationwide, commercial health insurance claims database.
This result goes against what the study researchers from the division of pharmacoepidemiology and pharmacoeconomics at Brigham and Women’s Hospital and Harvard Medical School, both in Boston, initially hypothesized: The “risk of incident T2DM in RA patients would be similar to or less than PsA and [hypertension] patients, but higher, compared to general non-RA and OA patients.”
Prior epidemiologic studies of the relationship between RA and incident diabetes have yielded inconclusive results suggesting a small increase or no increase in risk of T2DM in patients with RA, possibly because of differences in the risk of T2DM in comparison groups used by previous studies to calculate relative risk, first author Yinzhu Jin and colleagues noted in their report published in Arthritis Care & Research.
After mining a nationwide U.S. commercial health insurance claims database, the Optum Clinformatics Data Mart, for claims data from Jan. 1, 2005, to Dec. 31, 2017, the researchers matched a total of 108,568 patients in RA, general population non-RA, hypertension, and OA cohorts based on age, sex, and index date (the date of disease-specific medication dispensing). Overall, 77% of those patients were female and had a mean age of nearly 56 years, whereas 48% of patients with PsA were female and their mean age was nearly 49 years. (PsA patients were not matched because of smaller numbers.)
During a median follow-up period of 1.4-1.8 years across the comparison groups, the crude incidence rate for diabetes per 1,000 person-years in the cohorts was 7.0 for RA, 7.4 for general non-RA, 12.3 for hypertension, 7.8 for OA, and 9.9 for PsA. The hazard ratios and 95% confidence interval for risk of diabetes in patients with RA – after adjustment for more than 40 baseline covariates that included demographics, comorbidities, medication use, and health care utilization – was 0.72 (0.66-0.78) in comparison withh the general non-RA cohort, 0.65 (0.60-0.71) in comparison with the hypertension cohort, 0.75 (0.69-0.81) in comparison with the OA cohort, and 0.76 (0.67-0.86) in comparison with the PsA cohort. These values correspond to RA patients having a 24%-35% lower risk of incident diabetes versus the comparison groups, the researchers noted. They observed results consistent to these when they conducted a sensitivity analysis using a 1-year lag time from the index date before starting follow-up.
The lower risk of T2DM in patients with RA in comparison with patients in the non-RA cohort “may be, in part, due to the effect of biologic DMARD [disease-modifying antirheumatic drug] treatment in RA which likely modifies the risk of DM,” the researchers wrote. “Both the increasing use of biologic DMARDs for RA in the U.S. over the last decade and our cohort entry criteria for the RA cohort (i.e., at least one dispensing of a DMARD) may explain the finding of the lower risk of DM in RA.”
The results found with the other three cohorts did not surprise the researchers. The reduced risk of diabetes among RA patients versus those with OA jibes with “higher rates of obesity and other comorbidities in patients with OA” as well as findings from a recent study that found a higher incidence rate of diabetes in OA, compared with RA. Ms. Jin and colleagues also acknowledged it is well known that “hypertension and PsA are associated with metabolic dysregulation and increase the risk of diabetes.”
The researchers defined patients with RA as having at least twoinpatient or outpatient ICD-9 or ICD-10 diagnosis codes of RA, separated by 7-365 days and having at least one dispensing for DMARDs within 1 year from the first RA diagnosis date, and defined the primary outcome of incident T2DM as at least one inpatient or outpatient diagnosis of T2DM plus at least one dispensing of an antidiabetic drug. They set the general non-RA cohort by selecting patients with any inpatient or outpatient diagnosis codes and a dispensing of any medications, and the hypertension, PsA, and OA comparator groups as having at least two inpatient or outpatient disease-specific ICD-9/ICD-10 codes separated by 7-365 days and at least one dispensing of disease-specific medication within 1 year from the first diagnosis date. They excluded patients with RA, PsA, or psoriasis diagnosis or disease-specific medication dispensing any time prior to or on the index date (the date of disease-specific medication dispensing).
The researchers recognized that the conclusions that can be drawn from the study are limited by the “potential misclassification of cohorts and covariates” because they “mainly used diagnosis codes and pharmacy dispensing records in claims data,” and some “important covariates such as baseline obesity are likely underreported and not adequately captured in claims data.” The level of covariate misclassification also may have been different across the study cohorts on “unmeasured covariates such as body mass index, diet, and physical activity, as well as disease specific measures,” thus introducing residual confounding. They also could not “examine potential difference in the risk of T2DM in untreated or undertreated RA patients” because “RA and all the non-RA comparator cohorts were required to use a disease-specific drug,” they wrote.
“While systemic inflammation in RA is thought to increase the risk of [cardiovascular disease] and cardiovascular risk factors such as DM, our findings suggest having RA itself does not confer an increased risk of DM. Future study should determine whether untreated RA or undertreated RA is associated with a greater risk of developing DM,” the researchers concluded.
The study was supported by a research grant from Bristol-Myers Squibb, which “played no role in the study design, data analysis or interpretation of data or presentation of results,” the researchers said. The company was “given the opportunity to make nonbinding comments on a draft of the manuscript, but the authors retained the right of publication and to determine the final wording.” One author reported receiving research grants from Brigham and Women’s Hospital from Pfizer, AbbVie, Bristol-Myers Squibb, and Roche for unrelated topics.
SOURCE: Jin Y et al. Arthritis Care Res. 2020 Aug 4. doi: 10.1002/acr.24343.
FROM ARTHRITIS CARE & RESEARCH