User login
Proposed triple I criteria may overlook febrile women at risk post partum
A large proportion of laboring febrile women are not meeting proposed criteria for intrauterine inflammation or infection or both (triple I), but still may be at risk, according to an analysis of expert recommendations for clinical diagnosis published in Obstetrics & Gynecology.
“Our data suggest caution in universal implementation of the triple I criteria to guide clinical management of febrile women in the intrapartum period,” according to lead author Samsiya Ona, MD, of Brigham and Women’s Hospital in Boston, and her coauthors.
In early 2015, the Eunice Kennedy Shriver National Institute of Child Health and Human Development (NICHD) established criteria for diagnosing triple I in an effort to “decrease overtreatment of intrapartum women and low-risk newborns.” To assess the validity of those criteria, Dr. Ona and her colleagues analyzed 339 women with a temperature taken of 100.4°F or greater (38.0°C) during labor or within 1 hour post partum from June 2015 to September 2017.
The women were split into two groups: 212 met criteria for suspected triple I (documented fever plus clinical signs of intrauterine infection such as maternal leukocytosis greater than 15,000 per mm3, fetal tachycardia greater than 160 beats per minute, and purulent amniotic fluid) and 127 met criteria for isolated maternal fever. Among the suspected triple I group, incidence of adverse clinical infectious outcomes was 12%, comparable with 10% in the isolated maternal fever group (P = .50). When it came to predicting confirmed triple I, the sensitivity and specificity of the suspected triple I criteria were 71% (95% confidence interval, 61.4%-80.1%) and 41% (95% CI, 33.6%-47.8%), respectively. For predicting adverse clinical infectious outcomes, the sensitivity and specificity of the suspected triple I criteria were 68% (95% CI, 50.2%-82.0%) and 38% (95% CI, 32.6%-43.8%).
The authors cited among study limitations their including only women who had blood cultures sent at initial fever and excluding women who did not have repeat febrile temperature taken within 45 minutes. However, they noted the benefits of working with “a unique, large database with physiologic, laboratory, and microbiological parameters” and emphasized the need for an improved method of diagnosis, suggesting “a simple bedside minimally invasive marker of infection may be ideal.”
The study was supported by an Expanding the Boundaries Faculty Grant from the department of obstetrics, gynecology, and reproductive biology at the Brigham and Women’s Hospital in Boston. No conflicts of interest were reported.
SOURCE: Ona S et al. Obstet Gynecol. 2019 Jan. doi: 10.1097/AOG.0000000000003008.
FROM OBSTETRICS & GYNECOLOGY
Key clinical point:
Major finding: The sensitivity and specificity of the suspected triple I criteria to predict an adverse clinical infectious outcome were 68% for the suspected triple I group and 38% for the isolated maternal fever group.
Study details: A retrospective cohort study of 339 women with intrapartum fever from June 2015 to September 2017.
Disclosures: The study was supported by an Expanding the Boundaries Faculty Grant from the department of obstetrics, gynecology, and reproductive biology at the Brigham and Women’s Hospital in Boston. No conflicts of interest were reported.
Source: Ona S et al. Obstet Gynecol. 2019 Jan. doi: 10.1097/AOG.0000000000003008.
Puppy bite at yoga retreat leads to rabies death: Prompts health warning
Individuals going to rabies-endemic countries should have a pretrip consultation with a travel health specialist, say authors of a case report describing the death of a woman who sustained a bite from a rabid puppy during a 2017 yoga retreat in rural India.
Preexposure prophylaxis is warranted, especially for individuals expected to be in those countries for long durations, those planning to go to remote areas, or if they plan activities that may put them at risk for rabies exposure, the authors wrote in Morbidity and Mortality Weekly Report.
“In the case of the yoga retreat tour, given the extended length of the tour and the rural and community activities involved, pretravel rabies vaccination should have been considered,” said Julia Murphy, DVM, a veterinarian with the Virginia Department of Health, and her coauthors in the recently published report.
The case also underscores the importance of prompt rabies diagnosis, according to Dr. Murphy and her colleagues: 250 health care workers were assessed for exposure to the patient, 72 (29%) of whom were advised to initiate postexposure prophylaxis and were treated at a cost of nearly a quarter million dollars.
The Virginia woman described in the case report was aged 65 years and had no preexisting health conditions. She had spent more than 2 months on a yoga retreat tour in India and was bitten by a puppy near her hotel in Rishikesh in northern India, according to results of a public health investigation.
That retreat ended on April 7, 2017, according to the report, and on May 3, 2017, the woman started to have pain and paresthesia in her right arm during gardening.
On May 6, she sought care at an urgent care facility, resulting in a diagnosis of carpal tunnel syndrome and a prescription for an NSAID.
The next day, she was evaluated at a hospital for anxiety, insomnia, shortness of breath, and difficulty swallowing water and was given lorazepam for a presumed panic attack. She was discharged and, in her car, experienced claustrophobia and shortness of breath. She returned to the hospital’s ED, received more lorazepam, and was again discharged.
The day after that, she was transported by ambulance to another hospital with increased anxiety, shortness of breath, chest discomfort, and progressive paresthesia; she was found to have elevated cardiac enzymes and underwent emergency cardiac catheterization, which revealed normal arteries.
That evening, the patient became “progressively agitated and combative,” according to the report, and was found to be gasping for air while trying to drink water. When family were questioned about animal exposures, the woman’s husband indicated that she had been bitten on the right hand by a puppy during the yoga retreat, about 6 weeks before the symptoms started.
Once a diagnosis of rabies was confirmed, the woman was started on aggressive treatment but eventually died, according to Dr. Murphy and her coauthors, which made this patient the ninth person in the United States to die from rabies exposure while overseas since 2008. Canine rabies has been eliminated in the United States because of the strict vaccination laws.
“These events underscore the importance of obtaining a thorough pretravel health consultation, particularly when visiting countries with high incidence of emerging or zoonotic pathogens, to ensure awareness of health risks and appropriate pretravel and postexposure health care actions,” they concluded in their report.
Dr. Murphy and her coauthors reported no potential conflicts of interest related to the case report.
SOURCE: Murphy J et al. MMWR Morb Mortal Wkly Rep. 2019 Jan 4;67(5152):1410-4.
FROM MMWR
Key clinical point: depending on length of trip, location, and activities involved.
Major finding: A Virginia woman died after sustaining a bite from a rabid puppy during a 2017 yoga retreat in rural India.
Study details: Case report including details of the 65-year-old woman’s trip, rabies exposure, symptoms, diagnosis, and eventual death.
Disclosures: Authors reported no potential conflicts of interest.
Source: Murphy J et al. MMWR Morb Mortal Wkly Rep. 2019 Jan 4;67(5152):1410-4.
LAIV4 was less effective for children than IIV against influenza A/H1N1pdm09
The live attenuated influenza vaccine was less effective against the influenza A/H1N1pdm09 virus in children and adolescents across multiple influenza seasons between 2013 and 2016, compared with the inactivated influenza vaccine, according to research published in the journal Pediatrics.
Jessie R. Chung, MPH, from the influenza division at the Centers for Disease Control and Prevention in Atlanta, and her colleagues performed an analysis of five different studies where vaccine effectiveness (VE) was examined for quadrivalent live attenuated vaccine (LAIV4) and inactivated influenza vaccine (IIV) in children and adolescents aged 2-17 years from 42 states.
The analysis included data from the U.S. Influenza Vaccine Effectiveness Network (6,793 patients), a study from the Louisiana State University Health Sciences Center (3,822 patients), the Influenza Clinical Investigation for Children (3,521 patients), Department of Defense Global, Laboratory-based, Influenza Surveillance Program (1,935 patients), and the Influenza Incidence Surveillance Project (1,102 patients) between the periods of 2013-2014 and 2015-2016. The researchers sourced current and previous season vaccination history from electronic medical records and immunization registries.
Of patients who were vaccinated across all seasons, there was 67% effectiveness against influenza A/H1N1pdm09 (95% confidence interval, 62%-72%) for those who received the IIV and 20% (95% CI, −6%-39%) for LAIV4. Among patients who received the LAIV4 vaccination, there was a significantly higher likelihood of developing influenza A/H1N1pdm09 (odds ratio, 2.66; 95% CI, 2.06-3.44) compared with patients who received the IIV vaccination.
With regard to other strains, there was similar effectiveness against influenza A/H3N2 and influenza B with LAIV4 and IIV vaccinations.
“In contrast to findings of reduced LAIV4 effectiveness against influenza A/H1N1pdm09 viruses, our results suggest a possible but nonsignificant benefit of LAIV4 over IIV against influenza B viruses, which has been described previously,” the investigators wrote.
Limitations of the study included having data only one season prior to enrollment and little available demographic information beyond age, gender, and geographic location.
The Influenza Clinical Investigation for Children was funded by MedImmune, a member of the AstraZeneca Group. Two of the researchers are employees of AstraZeneca. The other authors reported having no conflicts of interest. The U.S. Influenza Vaccine Effectiveness Network was supported by the CDC through cooperative agreements with the University of Michigan, Kaiser Permanente Washington Health Research Institute, Marshfield Clinic Research Institute, University of Pittsburgh, and Baylor Scott & White Health. At the University of Pittsburgh, the project also was supported by the National Institutes of Health.
SOURCE: Chung JR et al. Pediatrics. 2018. doi: 10.1542/peds.2018-2094.
There are many explanations for the decline in effectiveness of the live attenuated influenza vaccine (LAIV4), but the data are complicated by conflicting information from studies outside the United States indicating “reasonable protection” against influenza A/H1N1pdm09, A/H3N2, and influenza B, compared with the inactivated influenza virus (IIV), Pedro A. Piedra, MD, wrote in an accompanying editorial.
In 2016, the World Health Organization met to discuss LAIV effectiveness and highlighted factors such as methodological study differences, inadequate vaccine handling at distribution centers, intrinsic virological differences of the A/H1N1pdm09 virus, and increased preexisting population immunity in the United States since 2010 as potential explanations. During the transition from LAIV3 to LAIV4 for the 2013-2014 influenza season, viral interference may have also occurred when the influenza B strain was introduced into the vaccine, he added.
According to the CDC’s Advisory Committee on Immunization Practices (ACIP), viral growth properties of A/H1N1pdm09 has improved in LAIV4, and viral shedding also has improved for children between 2 years and 4 years of age. Although effectiveness numbers were not available for the ACIP recommendation, an interim analysis from Public Health England for the 2017-2018 influenza season found a vaccine effectiveness of 90.3% (95% confidence interval, 16.4%-98.9%).
“This early result is encouraging and supports the reintroduction of LAIV4 in the United States as an option for the control of seasonal influenza,” he said. “It also highlights the need for annual influenza vaccine effectiveness estimates and the importance of the U.S. Influenza Vaccine Effectiveness Network in providing updated information for ACIP recommendations.”
Dr. Piedra is from the departments of molecular virology and microbiology and pediatrics, Baylor College of Medicine, Houston. He reports being a consultant for AstraZeneca, Sanofi Pasteur, GlaxoSmithKline, and Merck Sharp and Dohme, and he has received travel support to present at an influenza seminar supported by Seqirus. His comments are from an editorial accompanying the article by Chung and colleagues ( Pediatrics. 2019. doi: 10.1542/peds.2018- 3290 ).
The live attenuated influenza vaccine was less effective against the influenza A/H1N1pdm09 virus in children and adolescents across multiple influenza seasons between 2013 and 2016, compared with the inactivated influenza vaccine, according to research published in the journal Pediatrics.
Jessie R. Chung, MPH, from the influenza division at the Centers for Disease Control and Prevention in Atlanta, and her colleagues performed an analysis of five different studies where vaccine effectiveness (VE) was examined for quadrivalent live attenuated vaccine (LAIV4) and inactivated influenza vaccine (IIV) in children and adolescents aged 2-17 years from 42 states.
The analysis included data from the U.S. Influenza Vaccine Effectiveness Network (6,793 patients), a study from the Louisiana State University Health Sciences Center (3,822 patients), the Influenza Clinical Investigation for Children (3,521 patients), Department of Defense Global, Laboratory-based, Influenza Surveillance Program (1,935 patients), and the Influenza Incidence Surveillance Project (1,102 patients) between the periods of 2013-2014 and 2015-2016. The researchers sourced current and previous season vaccination history from electronic medical records and immunization registries.
Of patients who were vaccinated across all seasons, there was 67% effectiveness against influenza A/H1N1pdm09 (95% confidence interval, 62%-72%) for those who received the IIV and 20% (95% CI, −6%-39%) for LAIV4. Among patients who received the LAIV4 vaccination, there was a significantly higher likelihood of developing influenza A/H1N1pdm09 (odds ratio, 2.66; 95% CI, 2.06-3.44) compared with patients who received the IIV vaccination.
With regard to other strains, there was similar effectiveness against influenza A/H3N2 and influenza B with LAIV4 and IIV vaccinations.
“In contrast to findings of reduced LAIV4 effectiveness against influenza A/H1N1pdm09 viruses, our results suggest a possible but nonsignificant benefit of LAIV4 over IIV against influenza B viruses, which has been described previously,” the investigators wrote.
Limitations of the study included having data only one season prior to enrollment and little available demographic information beyond age, gender, and geographic location.
The Influenza Clinical Investigation for Children was funded by MedImmune, a member of the AstraZeneca Group. Two of the researchers are employees of AstraZeneca. The other authors reported having no conflicts of interest. The U.S. Influenza Vaccine Effectiveness Network was supported by the CDC through cooperative agreements with the University of Michigan, Kaiser Permanente Washington Health Research Institute, Marshfield Clinic Research Institute, University of Pittsburgh, and Baylor Scott & White Health. At the University of Pittsburgh, the project also was supported by the National Institutes of Health.
SOURCE: Chung JR et al. Pediatrics. 2018. doi: 10.1542/peds.2018-2094.
FROM PEDIATRICS
Key clinical point: The live attenuated influenza vaccine (LAIV4) was significantly less effective than was the inactivated influenza vaccine (IIV) for children against the influenza A/H1N1pdm09 virus across multiple flu seasons.
Major finding:
Study details: A combined analysis of five studies in the United States between the periods of 2013-2014 and 2015-2016 from the U.S. Influenza Vaccine Effectiveness Network.
Disclosures: The Influenza Clinical Investigation for Children was funded by MedImmune, a member of the AstraZeneca Group. Two of the researchers are employees of AstraZeneca. The other authors reported having no conflicts of interest. The U.S. Influenza Vaccine Effectiveness Network was supported by the CDC through cooperative agreements with the University of Michigan, Kaiser Permanente Washington Health Research Institute, Marshfield Clinic Research Institute, University of Pittsburgh, and Baylor Scott & White Health. At the University of Pittsburgh, the project also was supported by the National Institutes of Health.
Source: Chung JR et al. Pediatrics. 2018. doi: 10.1542/peds.2018-2094.
Cerebral small vessel and cognitive impairment
Also today, antidepressants are tied to greater hip fracture incidence, a hospital readmission reduction program may be doing more harm than good, and the flu season rages on with 19 states showing high activity in the final week of 2018.
Amazon Alexa
Apple Podcasts
Google Podcasts
Spotify
Also today, antidepressants are tied to greater hip fracture incidence, a hospital readmission reduction program may be doing more harm than good, and the flu season rages on with 19 states showing high activity in the final week of 2018.
Amazon Alexa
Apple Podcasts
Google Podcasts
Spotify
Also today, antidepressants are tied to greater hip fracture incidence, a hospital readmission reduction program may be doing more harm than good, and the flu season rages on with 19 states showing high activity in the final week of 2018.
Amazon Alexa
Apple Podcasts
Google Podcasts
Spotify

Click for Credit: STIs on the rise; psoriasis & cardiac risk; more
Here are 5 articles from the January issue of Clinician Reviews (individual articles are valid for one year from date of publication—expiration dates below):
1. Can ultrasound screening improve survival in ovarian cancer?
To take the posttest, go to: https://bit.ly/2Vtuc8F
Expires October 17, 2019
2. Higher BMI associated with greater loss of gray matter volume in MS
To take the posttest, go to: https://bit.ly/2ArvFDp
Expires October 29, 2019
3. Psoriasis adds to increased risk of cardiovascular procedures, surgery in patients with hypertension
To take the posttest, go to: https://bit.ly/2sbnkiS
Expires October 31, 2019
4. Fever, intestinal symptoms may delay diagnosis of Kawasaki disease in children
To take the posttest, go to: https://bit.ly/2RdPoBi
Expires October 31, 2019
5. Rate of STIs is rising, and many U.S. teens are sexually active
To take the posttest, go to: https://bit.ly/2CPuYFW
Expires November 8, 2019
Flu season intensifies: High activity now in 19 states
The effects of the flu became much more widespread in the last full week of 2018 as the number of states with a high level of influenza activity more than doubled from the week before, according to the Centers for Disease Control and Prevention.
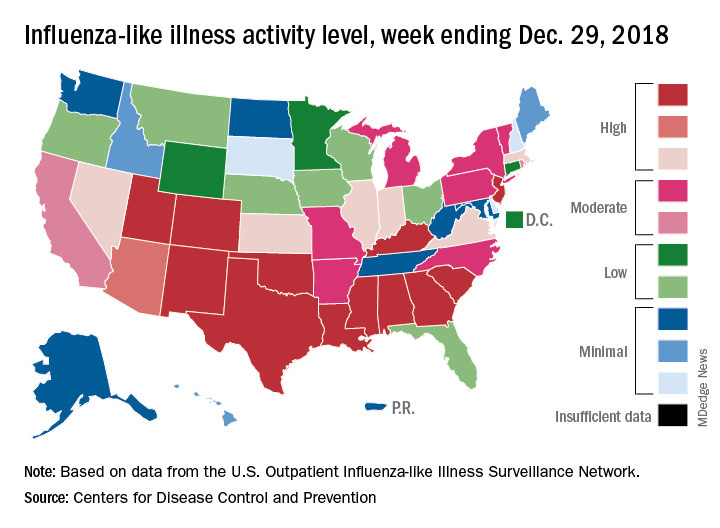
A total of 19 states were in the high range (8-10) on the CDC’s 1-10 scale of influenza-like illness (ILI) activity for the week ending Dec. 29, compared with 9 states the week before, the CDC’s influenza division reported Jan. 4. Of those 19 most-affected states, 12 were at level 10, 1 was at level 9, and 6 were at level 8. Geographic distribution of the virus was reported to be widespread in 24 states, the CDC said.
The proportion of outpatient visits for ILI – defined as fever (temperature of 100° F or greater) and cough and/or sore throat – rose to 4.1% for the week, which was up from 3.3% the previous week and well above the national baseline of 2.2%.
“The increase in the percentage of patient visits for ILI may be influenced in part by a reduction in routine health care visits during the winter holidays,” the report noted. There were 38 influenza deaths reported for the most recent week with available data (the week ending Dec. 22), although reporting for that week was just over 54% complete as of Jan. 4. For the previous weeks, 39 flu-related deaths occurred during the week ending Dec. 15 (reporting 84% complete) and 43 deaths during the week ending Dec. 8 (reporting 94% complete). For the respective weeks of last year’s flu season, total deaths were 359, 165, and 118, CDC data show.
For the week ending Dec. 29, two pediatric deaths were reported, one of which occurred the week before. For the 2018-2019 season so far, 13 flu-related pediatric deaths have been reported, the CDC said.
The effects of the flu became much more widespread in the last full week of 2018 as the number of states with a high level of influenza activity more than doubled from the week before, according to the Centers for Disease Control and Prevention.
A total of 19 states were in the high range (8-10) on the CDC’s 1-10 scale of influenza-like illness (ILI) activity for the week ending Dec. 29, compared with 9 states the week before, the CDC’s influenza division reported Jan. 4. Of those 19 most-affected states, 12 were at level 10, 1 was at level 9, and 6 were at level 8. Geographic distribution of the virus was reported to be widespread in 24 states, the CDC said.
The proportion of outpatient visits for ILI – defined as fever (temperature of 100° F or greater) and cough and/or sore throat – rose to 4.1% for the week, which was up from 3.3% the previous week and well above the national baseline of 2.2%.
“The increase in the percentage of patient visits for ILI may be influenced in part by a reduction in routine health care visits during the winter holidays,” the report noted. There were 38 influenza deaths reported for the most recent week with available data (the week ending Dec. 22), although reporting for that week was just over 54% complete as of Jan. 4. For the previous weeks, 39 flu-related deaths occurred during the week ending Dec. 15 (reporting 84% complete) and 43 deaths during the week ending Dec. 8 (reporting 94% complete). For the respective weeks of last year’s flu season, total deaths were 359, 165, and 118, CDC data show.
For the week ending Dec. 29, two pediatric deaths were reported, one of which occurred the week before. For the 2018-2019 season so far, 13 flu-related pediatric deaths have been reported, the CDC said.
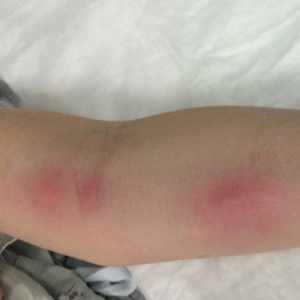
Ascending Erythematous Nodules on the Arm
The Diagnosis: Primary Cutaneous Nocardiosis
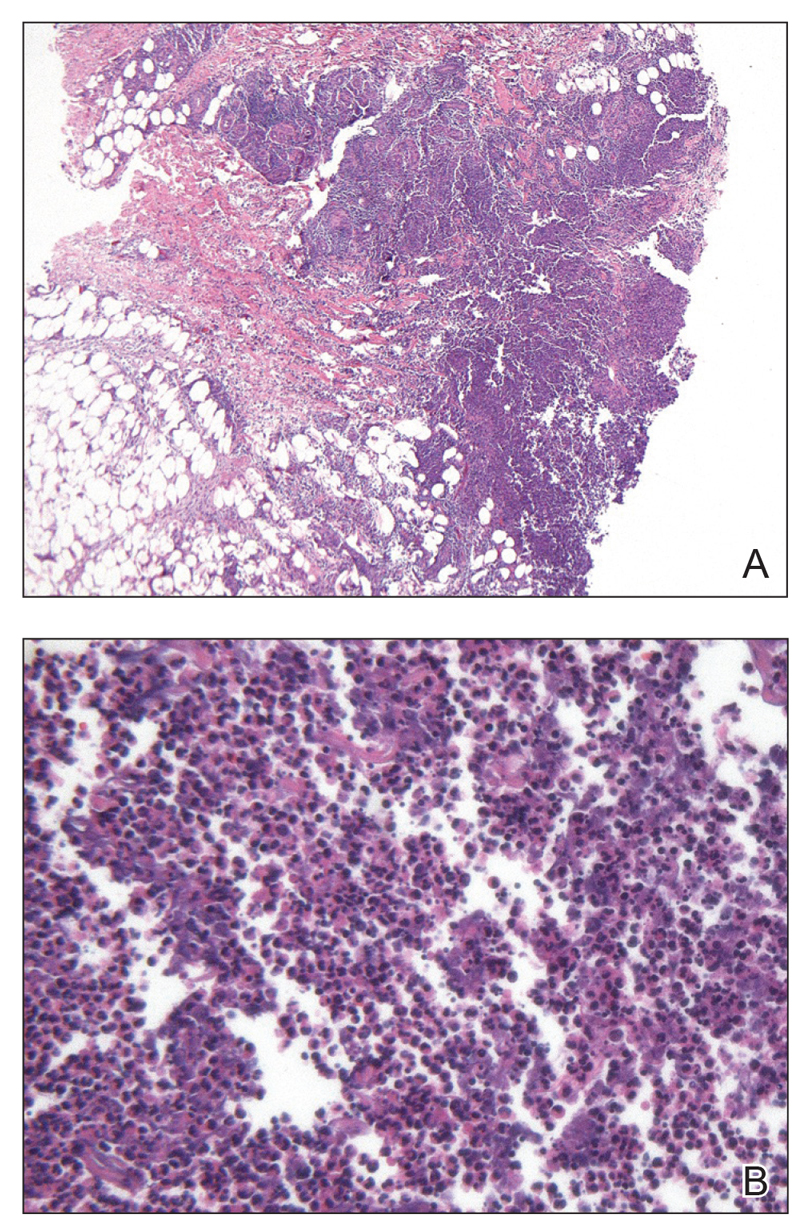
Comprehensive metabolic panel and complete blood cell count were unremarkable; human immunodeficiency virus screening was nonreactive. Punch biopsies were obtained for histopathology, as well as bacterial, fungal, and mycobacterial cultures. Histopathologic examination of a 4-mm punch biopsy of the forearm nodule showed a dermal abscess with neutrophilic infiltration in the dermis (Figure 1). No organisms were seen on Gram, methenamine-silver, periodic acid–Schiff, or acid-fast bacteria stains. Given the clinical suspicion for lymphocutaneous sporotrichosis, the patient was started on itraconazole. She reported modest improvement but subsequently developed a morbilliform eruption necessitating medication discontinuation.
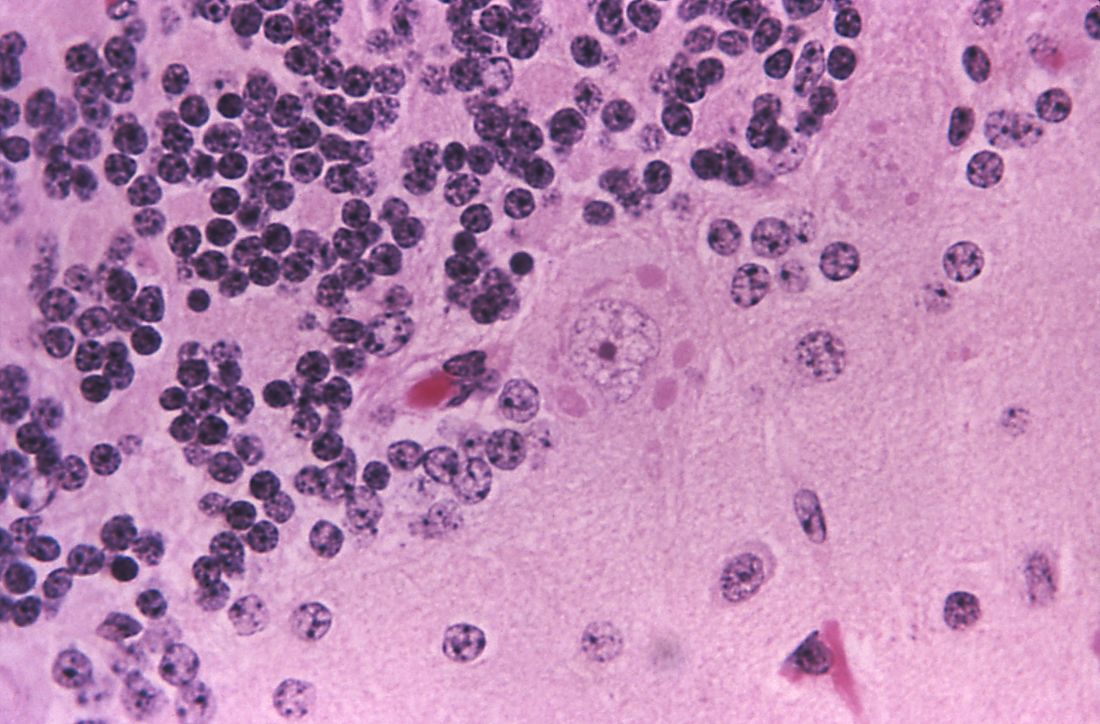
Eighteen days after obtaining the tissue culture, acid-fast organisms grew in culture. These organisms were subcultured on Middlebrook 7H11 agar (Sigma-Aldrich) with growth noted at 30°C and 37°C. Gram stain revealed filamentous gram-variable bacteria (Figure 2) that were identified as Nocardia brasiliensis by 16S ribosomal DNA analysis. Given the patient’s sulfonamide allergy, she started oral minocycline 100 mg twice daily. She responded to the therapy and subsequent testing confirmed susceptibility.
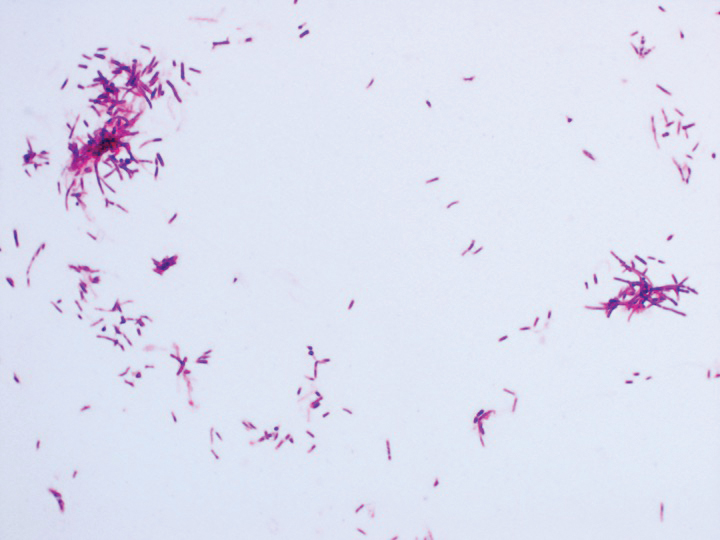
Nocardia brasiliensis, isolated from subculture on Gram stain (original
magnification ×1000).
The genus Nocardia consists of more than 50 species of gram-positive, weakly acid-fast, aerobic actinomycetes that can cause primary cutaneous infection via percutaneous inoculation. Nocardia brasiliensis is the leading cause (approximately 80% of cases) of primary cutaneous or subcutaneous nocardiosis and is found ubiquitously in soil and decaying vegetation.1 The clinical presentation varies, rendering definitive diagnosis a challenge without histopathologic and microbiologic testing.2 Patients presenting with nocardial cellulitis often are suspected to have Streptococcus pyogenes or Staphylococcus aureus infections. The differential diagnosis for patients presenting with nocardial nodular lymphangitis, also known as lymphocutaneous syndrome, includes atypical mycobacterial infections, leishmaniasis, and lymphocutaneous sporotrichosis.2
Histologic examination of nocardial nodules typically shows granulomatous or neutrophilic inflammation, and organisms may appear in small collections resembling sulfur granules.2 The organism itself is weakly positive on acid-fast stain, and useful stains include acid-fast bacteria, methenamine silver, and periodic acid–Schiff.2 Tissue culture often provides the definitive diagnosis, as the histology is nonspecific and organisms may not be visualized.
Oral trimethoprim-sulfamethoxazole 2.5 to 10 mg/kg and 12.5 to 50 mg/kg, respectively, twice daily is the treatment of choice for primary cutaneous nocardiosis. Minocycline 100 to 200 mg twice daily is an accepted alternative in case of sulfonamide allergy, as in our patient. Antibiotics should be tailored according to the susceptibility profile of the isolated organism.3
This case highlights the importance of forming a broad differential diagnosis for patients presenting with lymphocutaneous syndrome. The incidence and prevalence of N brasiliensis infection is difficult to determine due to its nonspecific clinical presentation and a lack of recent epidemiologic studies. Although primary cutaneous nocardiosis in the United States often is diagnosed in the South or Southwest, cases have been reported in other regions.4-6 Traumatic inoculation of contaminated soil, plants, and other organic matter, a well-known method of Sporothrix schenckii transmission, also is a method of N brasiliensis transmission. Because this organism may not be detected on histologic examination, empiric treatment should be considered if the diagnosis is suspected.
1. Brown-Eliot BA, Brown JM, Conville PS, et al. Clinical and laboratory features of the Nocardia spp. based on current molecular taxonomy. Clin Microbiol Rev. 2006;19:259-282.
2. Smego RA Jr, Castiglia M, Asperilla MO. Lymphocutaneous syndrome: a review of non-sporothrix causes. Medicine. 1999;78:38-63.
3. Lerner P. Nocardiosis. Clin Infect Dis. 1996;22:891-903.
4. Smego RA Jr, Gallis HA. The clinical spectrum of Nocardia brasiliensis infection in the United States. Rev Infect Dis. 1984;6:164-180.
5. Fukuda H, Saotome A, Usami N, et al. Lymphocutaneous type of nocardiosis caused by Nocardia brasiliensis: a case report and review of primary cutaneous nocardiosis caused by N. brasiliensis reported in Japan. J Dermatol. 2008;35:346-353.
6. Kil EH, Tsai CL, Kwark EH, et al. A case of nocardiosis with an uncharacteristically long incubation period. Cutis. 2005;76:33-36.
The Diagnosis: Primary Cutaneous Nocardiosis
Comprehensive metabolic panel and complete blood cell count were unremarkable; human immunodeficiency virus screening was nonreactive. Punch biopsies were obtained for histopathology, as well as bacterial, fungal, and mycobacterial cultures. Histopathologic examination of a 4-mm punch biopsy of the forearm nodule showed a dermal abscess with neutrophilic infiltration in the dermis (Figure 1). No organisms were seen on Gram, methenamine-silver, periodic acid–Schiff, or acid-fast bacteria stains. Given the clinical suspicion for lymphocutaneous sporotrichosis, the patient was started on itraconazole. She reported modest improvement but subsequently developed a morbilliform eruption necessitating medication discontinuation.
Eighteen days after obtaining the tissue culture, acid-fast organisms grew in culture. These organisms were subcultured on Middlebrook 7H11 agar (Sigma-Aldrich) with growth noted at 30°C and 37°C. Gram stain revealed filamentous gram-variable bacteria (Figure 2) that were identified as Nocardia brasiliensis by 16S ribosomal DNA analysis. Given the patient’s sulfonamide allergy, she started oral minocycline 100 mg twice daily. She responded to the therapy and subsequent testing confirmed susceptibility.
Nocardia brasiliensis, isolated from subculture on Gram stain (original
magnification ×1000).
The genus Nocardia consists of more than 50 species of gram-positive, weakly acid-fast, aerobic actinomycetes that can cause primary cutaneous infection via percutaneous inoculation. Nocardia brasiliensis is the leading cause (approximately 80% of cases) of primary cutaneous or subcutaneous nocardiosis and is found ubiquitously in soil and decaying vegetation.1 The clinical presentation varies, rendering definitive diagnosis a challenge without histopathologic and microbiologic testing.2 Patients presenting with nocardial cellulitis often are suspected to have Streptococcus pyogenes or Staphylococcus aureus infections. The differential diagnosis for patients presenting with nocardial nodular lymphangitis, also known as lymphocutaneous syndrome, includes atypical mycobacterial infections, leishmaniasis, and lymphocutaneous sporotrichosis.2
Histologic examination of nocardial nodules typically shows granulomatous or neutrophilic inflammation, and organisms may appear in small collections resembling sulfur granules.2 The organism itself is weakly positive on acid-fast stain, and useful stains include acid-fast bacteria, methenamine silver, and periodic acid–Schiff.2 Tissue culture often provides the definitive diagnosis, as the histology is nonspecific and organisms may not be visualized.
Oral trimethoprim-sulfamethoxazole 2.5 to 10 mg/kg and 12.5 to 50 mg/kg, respectively, twice daily is the treatment of choice for primary cutaneous nocardiosis. Minocycline 100 to 200 mg twice daily is an accepted alternative in case of sulfonamide allergy, as in our patient. Antibiotics should be tailored according to the susceptibility profile of the isolated organism.3
This case highlights the importance of forming a broad differential diagnosis for patients presenting with lymphocutaneous syndrome. The incidence and prevalence of N brasiliensis infection is difficult to determine due to its nonspecific clinical presentation and a lack of recent epidemiologic studies. Although primary cutaneous nocardiosis in the United States often is diagnosed in the South or Southwest, cases have been reported in other regions.4-6 Traumatic inoculation of contaminated soil, plants, and other organic matter, a well-known method of Sporothrix schenckii transmission, also is a method of N brasiliensis transmission. Because this organism may not be detected on histologic examination, empiric treatment should be considered if the diagnosis is suspected.
1. Brown-Eliot BA, Brown JM, Conville PS, et al. Clinical and laboratory features of the Nocardia spp. based on current molecular taxonomy. Clin Microbiol Rev. 2006;19:259-282.
2. Smego RA Jr, Castiglia M, Asperilla MO. Lymphocutaneous syndrome: a review of non-sporothrix causes. Medicine. 1999;78:38-63.
3. Lerner P. Nocardiosis. Clin Infect Dis. 1996;22:891-903.
4. Smego RA Jr, Gallis HA. The clinical spectrum of Nocardia brasiliensis infection in the United States. Rev Infect Dis. 1984;6:164-180.
5. Fukuda H, Saotome A, Usami N, et al. Lymphocutaneous type of nocardiosis caused by Nocardia brasiliensis: a case report and review of primary cutaneous nocardiosis caused by N. brasiliensis reported in Japan. J Dermatol. 2008;35:346-353.
6. Kil EH, Tsai CL, Kwark EH, et al. A case of nocardiosis with an uncharacteristically long incubation period. Cutis. 2005;76:33-36.
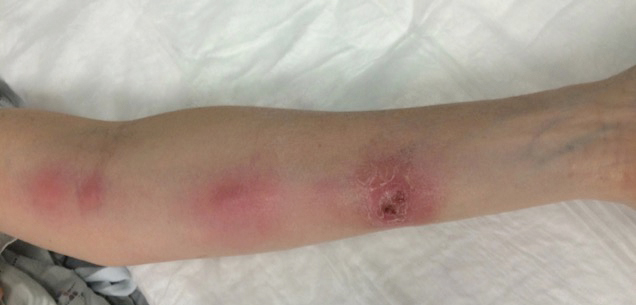
A 54-year-old woman called her primary care provider to report a painful pink nodule on the left wrist 1 week after sustaining thorn injuries while weeding in her garden. She started cephalexin and noted a pink streak with additional nodules extending up the arm over the next 2 days. She
was admitted to an outside hospital for incision and drainage of the wrist nodule and a 3-day course of intravenous vancomycin. Bacterial culture was negative, and she was discharged on oral clindamycin and doxycycline. Two days later, she presented to our emergency department with pain in the left axilla. Physical examination revealed 3 tender erythematous nodules in a linear distribution on the left arm with crusting at the incision and drainage site and painful left axillary lymphadenopathy. The patient was afebrile and otherwise asymptomatic.
Aspirin and Omega-3 fatty acids fail
Also today, New data reveal that college students are at greater risk of meningococcal B infection, children who survive Hodgkin lymphoma face a massive increased risk for second cancers down the road, and the 2018/19 flu season shows high activity in nine states.
Amazon Alexa
Apple Podcasts
Google Podcasts
Spotify
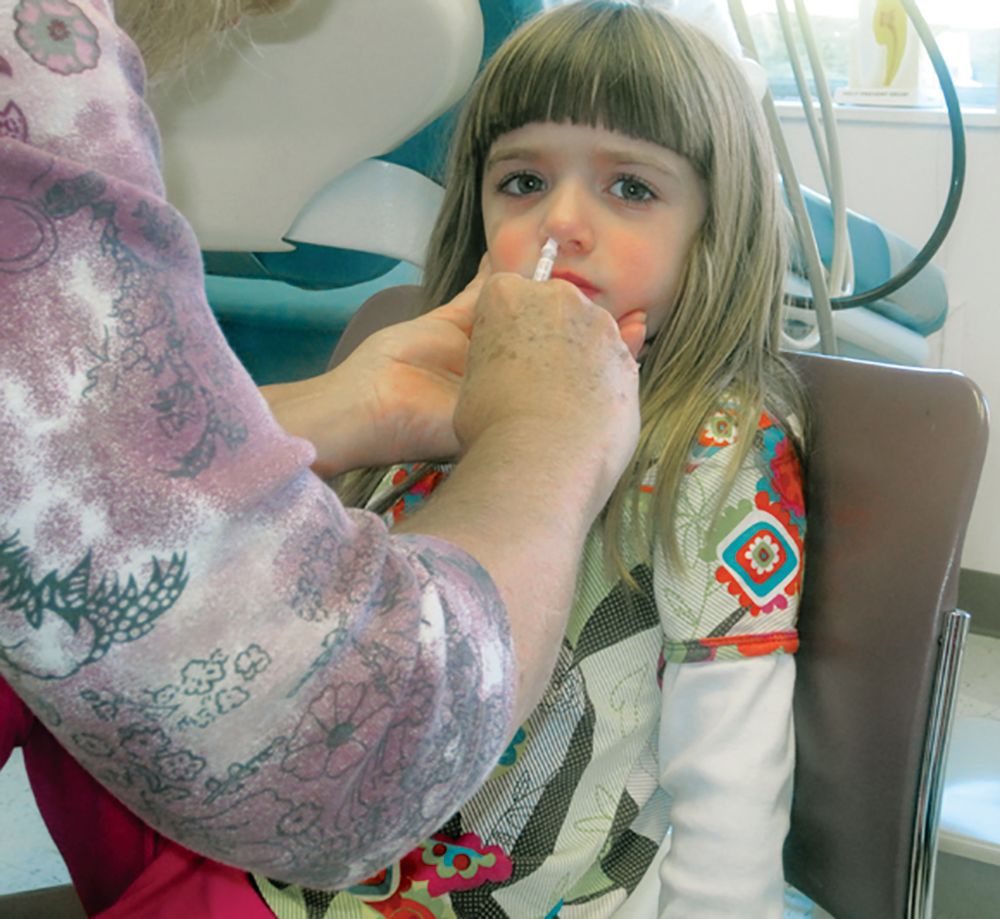
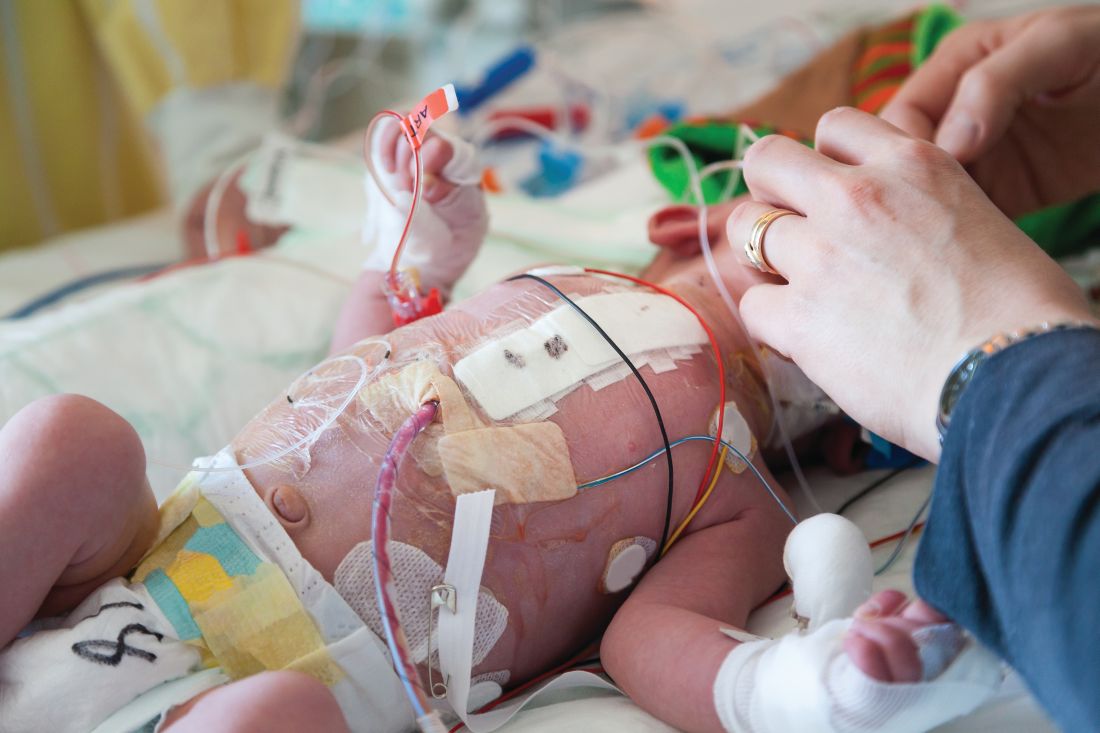
Topical antibiotic decolonizes S. aureus in NICU infants
Application of the topical antibiotic mupirocin to multiple body sites was reported to be safe and efficacious in eradicating Staphylococcus aureus (SA) colonization on infants in the neonatal intensive care unit (NICU), according to researchers at the University of Maryland, Baltimore.
Karen L. Kotloff, MD, and her colleagues conducted a phase 2 multicenter, open-label, randomized trial to assess the safety and efficacy of intranasal plus topical mupirocin in eradicating SA colonization in critically ill infants between April 2014 and May 2016.
“Staph aureus is a leading cause of sepsis in young children admitted to the NICU. Sepsis, which is systemic infection, can be fatal in infants. Thus, preventing these infections is very important in managing risk for babies in the NICU who are fragile and struggling with multiple medical problems,” said Dr. Kotloff in a university interview.
The researchers examined infants in the NICU at eight study centers who were less than 24 months old who underwent serial screening for nasal SA. Infants colonized with SA and were randomly assigned to receive 5 days of mupirocin versus no mupirocin to the intranasal, periumbilical, and perianal areas. Treatment effects were assessed on day 8 (primary decolonization) and day 22 (persistent decolonization) for all three body areas (Pediatrics. 2019 Jan 1. doi: 10.1542/peds.2018-1565).
Primary decolonization occurred in 62/66 (93.9%) of treated infants and 3/64 (4.7%) of the control infants (P less than .001). Persistent decolonization was seen in 21/46 (45.7%) of treated infants compared with 1/48 (2.1%) of the controls (P less than .001).
“This multicenter trial supervised by Dr. Kotloff provides strong support for a safe strategy to minimize Staphylococcus aureus infections in some of the most at-risk patients in any hospital, premature babies,” E. Albert Reece, MD, dean of the University of Maryland School of Medicine, said in a university press release commenting on the study.
FROM PEDIATRICS
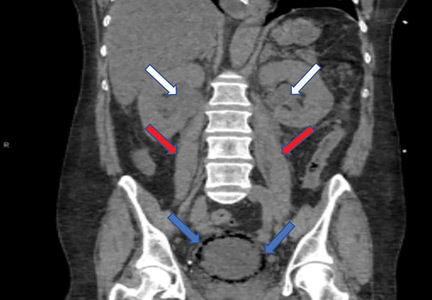
Emphysematous cystitis
A 59-year-old woman with a history of chronic kidney disease and atonic bladder was brought to the hospital by emergency medical services. She had fallen in her home 2 days earlier and remained on the floor until neighbors eventually heard her cries and called 911. She complained of abdominal pain and distention along with emesis.
On presentation, she had tachycardia and tachypnea. The examination was notable for pronounced abdominal distention, diminished bowel sounds, and costovertebral angle tenderness.

While laboratory work was being done, the patient’s tachypnea progressed to respiratory distress, and she ultimately required intubation. Vasopressors were started, as the patient was hemodynamically unstable. A Foley catheter was placed, which yielded about 1,100 mL of purulent urine.
Laboratory workup showed:
- Procalcitonin 189 ng/mL (reference range < 2.0 ng/mL)
- White blood cell count 10.7 × 10⁹/L (4.5–10.0)
- Myoglobin 20,000 ng/mL (< 71)
- Serum creatinine 4.8 mg/dL (0.06–1.10).
Urinalysis was positive for infection; blood and urine cultures later were positive for Escherichia coli.
, bilateral hydronephrosis (white arrows), and bilateral hydroureter (red arrows).")
The patient went into shock that was refractory to pressors, culminating in cardiac arrest despite resuscitative measures.
EMPHYSEMATOUS CYSTITIS, A FORM OF URINARY TRACT INFECTION
Emphysematous cystitis is a rare form of complicated urinary tract infection characterized by gas inside the bladder and in the bladder wall. While the exact mechanisms underlying gas formation are not clear, gas-producing pathogens are clearly implicated in severe infection. E coli and Klebsiella pneumoniae are the most common organisms associated with emphysematous cystitis; others include Proteus mirabilis, and Enterobacter and Streptococcus species.1,2
More than 50% of patients with emphysematous cystitis have diabetes mellitus. Other risk factors include bladder outlet obstruction, neurogenic bladder, and female sex.3 The severity of disease ranges from asymptomatic pneumaturia (up to 7% of cases)2 to fulminant emphysematous cystitis, as in our patient.
The clinical presentation of emphysematous cystitis is nonspecific and can range from minimally symptomatic urinary tract infection to acute abdomen and septic shock.4
Some patients present with pneumaturia (the passing of gas through the urethra with micturition). Pneumaturia arises from 3 discrete causes: urologic instrumentation, fistula between the bladder and large or small bowel, and gas-producing bacteria in the bladder (emphysematous cystitis).5 Pneumaturia should always raise the suspicion of emphysematous cystitis.
The diagnosis can be made with either radiographic or computed tomographic evidence of gas within the bladder and bladder wall, in the absence of both bladder fistula and history of iatrogenic pneumaturia. Emphysematous cystitis should prompt urine and blood cultures to direct antimicrobial therapy, as 50% of patients with emphysematous cystitis have concomitant bacteremia.6
Our patient had an elevated serum level of procalcitonin, a marker of bacterial infection. Procalcitonin is a more specific biomarker of bacterial infection than acute-phase reactants such as the erythrocyte sedimentation rate or the C-reactive protein level. Measuring procalcitonin may help physicians make the diagnosis earlier, differentiate infectious from sterile causes of severe systemic inflammation, assess the severity of systemic inflammation caused by bacterial infections, and decide whether to start or discontinue antibiotic therapy.7
Most cases of emphysematous cystitis can be treated with antibiotics, though early diagnosis is crucial to a favorable outcome. Delay in diagnosis may contribute to the 20% mortality rate associated with this condition.6
- Stein JP, Spitz A, Elmajian DA, et al. Bilateral emphysematous pyelonephritis: a case report and review of the literature. Urology 1996; 47(1):129–134. pmid:8560648
- Amano M, Shimizu T. Emphysematous cystitis: a review of the literature. Intern Med 2014; 53(2):79–82. pmid:24429444
- Wang JH. Emphysematous cystitis. Urol Sci 2010; 21(4):185–186. doi:10.1016/S1879-5226(10)60041-3
- Thomas AA, Lane BR, Thomas AZ, Remer EM, Campbell SC, Shoskes DA. Emphysematous cystitis: a review of 135 cases. BJU Int 2007; 100(1):17–20. doi:10.1111/j.1464-410X.2007.06930.x
- Arthur LM, Johnson HW. Pneumaturia: a case report and review of the literature. J Urol 1948; 60(4):659–665. pmid:18885959
- Grupper M, Kravtsov A, Potasman I. Emphysematous cystitis: illustrative case report and review of the literature. Medicine (Baltimore) 2007; 86(1):47–53. doi:10.1097/MD.0b013e3180307c3a
- Lee H. Procalcitonin as a biomarker of infectious diseases. Korean J Intern Med 2013; 28(3):285–291. doi:10.3904/kjim.2013.28.3.285
A 59-year-old woman with a history of chronic kidney disease and atonic bladder was brought to the hospital by emergency medical services. She had fallen in her home 2 days earlier and remained on the floor until neighbors eventually heard her cries and called 911. She complained of abdominal pain and distention along with emesis.
On presentation, she had tachycardia and tachypnea. The examination was notable for pronounced abdominal distention, diminished bowel sounds, and costovertebral angle tenderness.
While laboratory work was being done, the patient’s tachypnea progressed to respiratory distress, and she ultimately required intubation. Vasopressors were started, as the patient was hemodynamically unstable. A Foley catheter was placed, which yielded about 1,100 mL of purulent urine.
Laboratory workup showed:
- Procalcitonin 189 ng/mL (reference range < 2.0 ng/mL)
- White blood cell count 10.7 × 10⁹/L (4.5–10.0)
- Myoglobin 20,000 ng/mL (< 71)
- Serum creatinine 4.8 mg/dL (0.06–1.10).
Urinalysis was positive for infection; blood and urine cultures later were positive for Escherichia coli.
The patient went into shock that was refractory to pressors, culminating in cardiac arrest despite resuscitative measures.
EMPHYSEMATOUS CYSTITIS, A FORM OF URINARY TRACT INFECTION
Emphysematous cystitis is a rare form of complicated urinary tract infection characterized by gas inside the bladder and in the bladder wall. While the exact mechanisms underlying gas formation are not clear, gas-producing pathogens are clearly implicated in severe infection. E coli and Klebsiella pneumoniae are the most common organisms associated with emphysematous cystitis; others include Proteus mirabilis, and Enterobacter and Streptococcus species.1,2
More than 50% of patients with emphysematous cystitis have diabetes mellitus. Other risk factors include bladder outlet obstruction, neurogenic bladder, and female sex.3 The severity of disease ranges from asymptomatic pneumaturia (up to 7% of cases)2 to fulminant emphysematous cystitis, as in our patient.
The clinical presentation of emphysematous cystitis is nonspecific and can range from minimally symptomatic urinary tract infection to acute abdomen and septic shock.4
Some patients present with pneumaturia (the passing of gas through the urethra with micturition). Pneumaturia arises from 3 discrete causes: urologic instrumentation, fistula between the bladder and large or small bowel, and gas-producing bacteria in the bladder (emphysematous cystitis).5 Pneumaturia should always raise the suspicion of emphysematous cystitis.
The diagnosis can be made with either radiographic or computed tomographic evidence of gas within the bladder and bladder wall, in the absence of both bladder fistula and history of iatrogenic pneumaturia. Emphysematous cystitis should prompt urine and blood cultures to direct antimicrobial therapy, as 50% of patients with emphysematous cystitis have concomitant bacteremia.6
Our patient had an elevated serum level of procalcitonin, a marker of bacterial infection. Procalcitonin is a more specific biomarker of bacterial infection than acute-phase reactants such as the erythrocyte sedimentation rate or the C-reactive protein level. Measuring procalcitonin may help physicians make the diagnosis earlier, differentiate infectious from sterile causes of severe systemic inflammation, assess the severity of systemic inflammation caused by bacterial infections, and decide whether to start or discontinue antibiotic therapy.7
Most cases of emphysematous cystitis can be treated with antibiotics, though early diagnosis is crucial to a favorable outcome. Delay in diagnosis may contribute to the 20% mortality rate associated with this condition.6
- Stein JP, Spitz A, Elmajian DA, et al. Bilateral emphysematous pyelonephritis: a case report and review of the literature. Urology 1996; 47(1):129–134. pmid:8560648
- Amano M, Shimizu T. Emphysematous cystitis: a review of the literature. Intern Med 2014; 53(2):79–82. pmid:24429444
- Wang JH. Emphysematous cystitis. Urol Sci 2010; 21(4):185–186. doi:10.1016/S1879-5226(10)60041-3
- Thomas AA, Lane BR, Thomas AZ, Remer EM, Campbell SC, Shoskes DA. Emphysematous cystitis: a review of 135 cases. BJU Int 2007; 100(1):17–20. doi:10.1111/j.1464-410X.2007.06930.x
- Arthur LM, Johnson HW. Pneumaturia: a case report and review of the literature. J Urol 1948; 60(4):659–665. pmid:18885959
- Grupper M, Kravtsov A, Potasman I. Emphysematous cystitis: illustrative case report and review of the literature. Medicine (Baltimore) 2007; 86(1):47–53. doi:10.1097/MD.0b013e3180307c3a
- Lee H. Procalcitonin as a biomarker of infectious diseases. Korean J Intern Med 2013; 28(3):285–291. doi:10.3904/kjim.2013.28.3.285