User login
Children and COVID: CDC gives perspective on hospitalizations
New COVID-19 cases in children fell by 23% as the latest weekly count dropped to its lowest level since July of 2021, based on data from the American Academy of Pediatrics and the Children’s Hospital Association.
, when the early stages of the Delta surge led to 23,551 cases, the AAP and CHA said in their weekly COVID report.
The two organizations put the total number of cases at nearly 12.8 million from the start of the pandemic to March 17, with children representing 19.0% of cases among all ages. The Centers for Disease Control and Prevention puts the cumulative number of COVID-19 cases at almost 12.0 million as of March 21, or 17.5% of the nationwide total.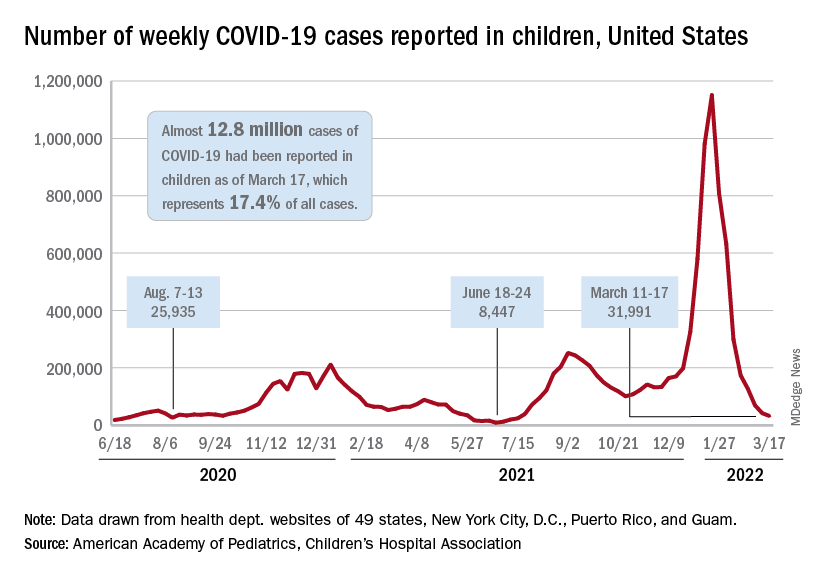
COVID-related hospitalizations also continue to fall, and two new studies from the CDC put children’s experiences during the Omicron surge and the larger pandemic into perspective.
One study showed that hospitalization rates for children aged 4 years and younger during the Omicron surge were five times higher than at the peak of the Delta surge, with the highest rates occurring in infants under 6 months of age. That report was based on the CDC’s COVID-19–Associated Hospitalization Surveillance Network (COVID-NET), which covers 99 counties across 14 states (MMWR. 2022 March 18;71[11]:429-36).
The second study compared child hospitalizations during 1 year of the COVID pandemic (Oct. 1, 2020, to Sept. 30, 2021) with three influenza seasons (2017-2018 through 2019-2020). The pre-Omicron hospitalization rate for those under age 18 years, 48.2 per 100,000 children, was higher than any of the three flu seasons: 33.5 per 100,000 in 2017-2018, 33.8 in 2018-2019, and 41.7 for 2019-2020, the investigators said in a medRxiv preprint.
Most of the increased COVID burden fell on adolescents aged 12-17, they said. The COVID hospitalization rate for that age group was 59.9 per 100,000, versus 12.2-14.1 for influenza, while children aged 5-11 had a COVID-related rate of 25.0 and flu-related rates of 24.3-31.7, and those aged 0-4 had rates of 66.8 for COVID and 70.9-91.5 for the flu, Miranda J. Delahoy of the CDC’s COVID-19 Response Team and associates reported.
WHO issues new TB guidelines for children and adolescents
The World Health Organization now recommends shortened treatment for children with mild tuberculosis, as well as two oral TB treatments (bedaquiline and delamanid) for use in children of all ages. The updated guidelines for TB management in children and adolescents were announced March 21 ahead of World Tuberculosis Day on March 24.
The agency also called for increased investment in global TB programs, noting that in 2020, TB deaths increased for the first time in over a decade. “We cannot falter in our commitment to reach and save every man, woman, child, family, and community impacted by this deadly disease,” said Tereza Kasaeva, MD, PhD, director of the WHO Global Tuberculosis Programme during a press conference.
TB is the 13th-leading cause of death and the second top infectious killer after COVID-19, with more than 4,100 people dying from TB every day. WHO estimates that 1.1 million children fall ill with TB each year.
Calls for investment
The increase in TB deaths from 1.4 million in 2019 to 1.5 million in 2020 was coupled with a decrease in funding. From 2019-2020, global spending for TB diagnostic, treatment, and prevention services fell from $5.8 billion to $5.3 billion. This is less than half of the $13 billion target funding amount for 2022, Dr. Kasaeva said.
Efforts to expand access to TB care have fallen short mainly because of this lack of funding, especially for children. In 2020, about 63% of children under 15 years of age with TB either did not receive or were not reported to have access to TB diagnosis and treatment services, which rose to 72% in children under age 5. Almost two-thirds of children under age 5 also did not receive TB preventive treatment in 2022, according to WHO statistics.
The socioeconomic ramifications of the COVID-19 pandemic as well as ongoing conflict in Eastern Europe, Africa, and the Middle East have “further exacerbated the situation,” Dr. Kasaeva said. “This conveys the urgent need to dramatically increase investments to ramp up the fight against TB and achieve commitments to end TB made by global leaders.”
Dr. Kasaeva laid out WHO’s main points for global investment in TB care:
- Increase domestic and international funding to close gaps in TB research and program implementation. For countries with smaller economies, increased international investment will be necessary in the short or medium term to help regain progress.
- Double funding for TB research, including vaccines.
- Invest in sustaining TB programs and services during the COVID-19 pandemic and ongoing crises so care is not disrupted.
New guidelines
Dr. Kasaeva also noted that adoption of WHO’s new guidelines for children and adolescents should be fast-tracked to improve access to and quality of care. The updates include:
- Rapid molecular tests called Xpert Ultra should be used as the initial test for TB in children and adolescents.
- Diagnostic testing can now include noninvasive specimens, like stool samples.
- Children with mild TB can be treated with a , rather than 6 months. This shortened regimen will allow children to return to school faster and save money for families and the health care system, said Kerri Viney, MD, PhD, a team lead for the WHO Tuberculosis Programme, with a focus on vulnerable populations, including children. She presented the new guidelines during the WHO press conference.
- The recommended treatment regimen for TB meningitis has also been shortened from 12 to 6 months.
Two oral medications for drug-resistant TB (bedaquiline and delamanid) are now recommended for use in children of all ages. “There is no longer a need for painful injections that can have serious side effects, including deafness,” Dr. Viney said.
Health systems should develop new models of decentralized and integrated TB care to bring TB care closer to where children live.
The guidelines are available on the WHO website.
“The WHO guidelines issued today are a game changer for children and adolescents with TB,” Dr. Kasaeva said. The next step is assisting countries in implementing these updates so that children and adolescents globally have access to high quality TB care,” Dr. Viney added. “We have the policy recommendations. We have the implementation guidance, we have child-friendly formulations of TB medicines,” she said. “Let us not wait any longer. Let us invest to end TB in children and adolescents.”
A version of this article first appeared on Medscape.com.
Antiretroviral therapy associated with less risk of preterm birth
Over the past decade, data have suggested that antiretroviral therapy (ART) may be associated with an increased risk for adverse pregnancy outcomes, namely, preterm birth (PTB). But a combination of methodologic challenges, demographic gaps, and spotty clinical data has left the question unresolved, especially for pregnant women with HIV who reside in developed countries.
“Given that a lot of the emerging data has come out of resource-limited settings where patient and clinical characteristics are different from developed world settings like the United States, we felt that this was an important question to address,” Kartik Venkatesh, MD, PhD, a high-risk obstetrician and perinatal epidemiologist at the Ohio State Wexner Medical Center, Columbus, told this news organization.
In a prospective cohort study of U.S. women with or at risk for HIV, Dr. Venkatesh and his colleagues found that ART exposure (including highly active antiretroviral therapy [HAART]) was associated with as much as an 80% decline in the likelihood of PTB (defined as birth less than 34 weeks). The study was published in HIV Medicine.
24 years of data analyzed
Dr. Venkatesh and his team analyzed self-reported birth data of women with singleton live-born pregnancies enrolled in the ongoing, multicenter, prospective observational Women’s Interagency HIV Study (WIHS) from Oct. 1, 1995, to March 31, 2019.
“We first looked at women with HIV versus without HIV, [who were] matched on many clinical and sociodemographic characteristics and at similarly high risk of some of these obstetrical outcomes like PTB,” explained Dr. Venkatesh. “We then looked at the relative impact of antiretroviral therapy amongst women living with HIV compared to no antiretroviral therapy.”
ART regimens were classified as none, monotherapy, dual therapy, or HAART. (HAART was defined as more than three antiretrovirals, including at least one protease inhibitor [PI], nonnucleoside reverse transcriptase inhibitor, integrase inhibitor, or entry inhibitor.) In this cohort, for 63.5% of women receiving ART, therapy was initiated before pregnancy (mean duration of HAART, 6 years), and most were virally suppressed.
Among the 4,944 women assessed in the WIHS trial, 74% (3,646) had HIV. In total, 383 women had 488 singleton deliveries, including 218 women with HIV (272 deliveries) and 165 without HIV (216 deliveries). Sociodemographics in both cohorts were well matched. For most participants, the mean age was 40-41 years at delivery, most were non-Hispanic Black persons, and the mean pregnancy body mass index was greater than or equal to 29 kg/m2. Of the women with HIV, 33% had chronic hypertension; of those without HIV, 42.1% had chronic hypertension; 4.7% and 5.0%, respectively, had pregestational diabetes.
The findings showed that PTB risk less than 34 weeks was similar between women with (10%) and without (8%) HIV (adjusted risk ratio, 1.30; 95% confidence interval, 0.74-2.31). Among deliveries to women with HIV who were receiving ART, PTB risk less than 34 weeks was lower with HAART (7%), compared with not receiving ART (26%) (aRR, 0.19), as well as with monotherapy or dual therapy (3% vs. no ART) (aRR, 0.12). Notably, 67% of deliveries to women receiving HAART included a PI-containing regimen, but these women were not significantly more likely to have a PTB less than 34 weeks, compared with women taking non-PI HAART regimens (aRR, 2.61; 95% CI, 0.65-10.59). Results were similar for secondary outcomes (PTB less than 28 weeks, less than 37 weeks).
Filling in the gaps toward the safest regimen
“This study spans 25 years, so it covers a lot of the history of HIV in pregnancy and is reassuring around using ART in pregnancy,” Shahin Lockman, MD, told this news organization. Dr. Lockman is an associate professor of infectious diseases at Brigham and Women’s Hospital and a co-PI of the Botswana Clinical Trials Unit at the Botswana Harvard AIDS Institute Partnership. She was not involved in the study. “One of the worst things for a mother and for pregnancy outcomes, for the fetus and baby’s health and development, is uncontrolled maternal HIV,’’ she said.
Dr. Lockman also noted potential confounders that drive poor birth outcomes in Southern African women, compared with U.S. women, making comparisons between this and other observational studies difficult. Still, she said that the question is not whether women should be receiving treatment but whether or not there are differences between antiretroviral regimens.
“One of the areas that we did not go deeper into was the subtype of antiretroviral therapy, given the relatively small study numbers [did not] allow us to do a robust analysis,” Dr. Venkatesh said.
Rather, he emphasized that the findings might lend more weight to speculation that immunologic characteristics associated with HIV status and immunotherapy – such as low CD4 cell counts prior to delivery, or duration of HIV infection – may be important drivers of adverse birth outcomes among women with HIV taking ART.
And at least in this cohort, many of these characteristics were similar between the treatment groups.
Both researchers agree that the findings – while reassuring – highlight the importance of collecting robust obstetric and safety data as part of prospective databases of individuals living with HIV, not only in resource-limited settings but also among the domestic U.S. population.
“We’ve learned a lot over the last 10 years,” Dr. Lockman said. “Some regimens (like lopinavir/ritonavir or nevirapine) are associated with significantly worse birth outcomes, whereas efavirenz doesn’t seem to be, or less so, and dolutegravir seems to be associated with even better outcomes. So, I think that where we are moving is to regimens that are the safest.”
Moving forward, Dr. Venkatesh explained, not only should researchers focus on exploring which antiretrovirals are safest in this context but also if the use of preexposure prophylaxis during conception periods affects birth outcomes.
Dr. Venkatesh and Dr. Lockman report no relevant financial relationships.
A version of this article first appeared on Medscape.com.
Acute STEMI During the COVID-19 Pandemic at a Regional Hospital: Incidence, Clinical Characteristics, and Outcomes
From the Department of Medicine, Medical College of Georgia at the Augusta University-University of Georgia Medical Partnership, Athens, GA (Syed H. Ali, Syed Hyder, and Dr. Murrow), and the Department of Cardiology, Piedmont Heart Institute, Piedmont Athens Regional, Athens, GA (Dr. Murrow and Mrs. Davis).
Abstract
Objectives: The aim of this study was to describe the characteristics and in-hospital outcomes of patients with acute ST-segment elevation myocardial infarction (STEMI) during the early COVID-19 pandemic at Piedmont Athens Regional (PAR), a 330-bed tertiary referral center in Northeast Georgia.
Methods: A retrospective study was conducted at PAR to evaluate patients with acute STEMI admitted over an 8-week period during the initial COVID-19 outbreak. This study group was compared to patients admitted during the corresponding period in 2019. The primary endpoint of this study was defined as a composite of sustained ventricular arrhythmia, congestive heart failure (CHF) with pulmonary congestion, and/or in-hospital mortality.
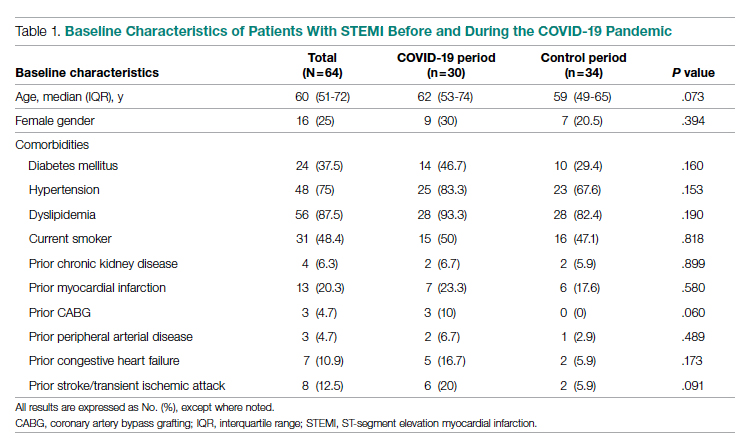
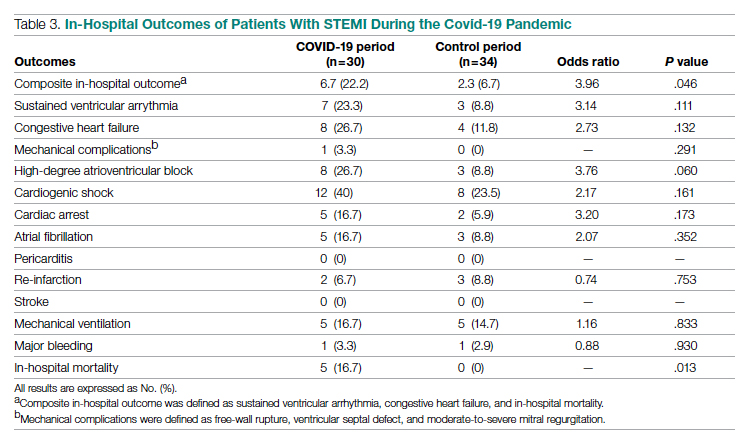
Results: This study cohort was composed of 64 patients with acute STEMI; 30 patients (46.9%) were hospitalized during the COVID-19 pandemic. Patients with STEMI in both the COVID-19 and control groups had similar comorbidities, Killip classification score, and clinical presentations. The median (interquartile range) time from symptom onset to reperfusion (total ischemic time) increased from 99.5 minutes (84.8-132) in 2019 to 149 minutes (96.3-231.8; P = .032) in 2020. Hospitalization during the COVID-19 period was associated with an increased risk for combined in-hospital outcome (odds ratio, 3.96; P = .046).
Conclusion: Patients with STEMI admitted during the first wave of the COVID-19 outbreak experienced longer total ischemic time and increased risk for combined in-hospital outcomes compared to patients admitted during the corresponding period in 2019.
Keywords: myocardial infarction, acute coronary syndrome, hospitalization, outcomes.

The emergence of the SARS-Cov-2 virus in December 2019 caused a worldwide shift in resource allocation and the restructuring of health care systems within the span of a few months. With the rapid spread of infection, the World Health Organization officially declared a pandemic in March 2020. The pandemic led to the deferral and cancellation of in-person patient visits, routine diagnostic studies, and nonessential surgeries and procedures. This response occurred secondary to a joint effort to reduce transmission via stay-at-home mandates and appropriate social distancing.1
Alongside the reduction in elective procedures and health care visits, significant reductions in hospitalization rates due to decreases in acute ST-segment elevation myocardial infarction (STEMI) and catheterization laboratory utilization have been reported in many studies from around the world.2-7 Comprehensive data demonstrating the impact of the COVID-19 pandemic on acute STEMI patient characteristics, clinical presentation, and in-hospital outcomes are lacking. Although patients with previously diagnosed cardiovascular disease are more likely to encounter worse outcomes in the setting of COVID-19, there may also be an indirect impact of the pandemic on high-risk patients, including those without the infection.8 Several theories have been hypothesized to explain this phenomenon. One theory postulates that the fear of contracting the virus during hospitalization is great enough to prevent patients from seeking care.2 Another theory suggests that the increased utilization of telemedicine prevents exacerbation of chronic conditions and the need for hospitalization.9 Contrary to this trend, previous studies have shown an increased incidence of acute STEMI following stressful events such as natural disasters.10
The aim of this study was to describe trends pertaining to clinical characteristics and in-hospital outcomes of patients with acute STEMI during the early COVID-19 pandemic at Piedmont Athens Regional (PAR), a 330-bed tertiary referral center in Northeast Georgia.
Methods
A retrospective cohort study was conducted at PAR to evaluate patients with STEMI admitted to the cardiovascular intensive care unit over an 8-week period (March 5 to May 5, 2020) during the COVID-19 outbreak. COVID-19 was declared a national emergency on March 13, 2020, in the United States. The institutional review board at PAR approved the study; the need for individual consent was waived under the condition that participant data would undergo de-identification and be strictly safeguarded.
Data Collection
Because there are seasonal variations in cardiovascular admissions, patient data from a control period (March 9 to May 9, 2019) were obtained to compare with data from the 2020 period. The number of patients with the diagnosis of acute STEMI during the COVID-19 period was recorded. Demographic data, clinical characteristics, and primary angiographic findings were gathered for all patients. Time from symptom onset to hospital admission and time from hospital admission to reperfusion (defined as door-to-balloon time) were documented for each patient. Killip classification was used to assess patients’ clinical status on admission. Length of stay was determined as days from hospital admission to discharge or death (if occurring during the same hospitalization).
Adverse in-hospital complications were also recorded. These were selected based on inclusion of the following categories of acute STEMI complications: ischemic, mechanical, arrhythmic, embolic, and inflammatory. The following complications occurred in our patient cohort: sustained ventricular arrhythmia, congestive heart failure (CHF) defined as congestion requiring intravenous diuretics, re-infarction, mechanical complications (free-wall rupture, ventricular septal defect, or mitral regurgitation), second- or third-degree atrioventricular block, atrial fibrillation, stroke, mechanical ventilation, major bleeding, pericarditis, cardiogenic shock, cardiac arrest, and in-hospital mortality. The primary outcome of this study was defined as a composite of sustained ventricular arrhythmia, CHF with congestion requiring intravenous diuretics, and/or in-hospital mortality. Ventricular arrythmia and CHF were included in the composite outcome because they are defined as the 2 most common causes of sudden cardiac death following acute STEMI.11,12
Statistical Analysis
Normally distributed continuous variables and categorical variables were compared using the paired t-test. A 2-sided P value <.05 was considered to be statistically significant. Mean admission rates for acute STEMI hospitalizations were determined by dividing the number of admissions by the number of days in each time period. The daily rate of COVID-19 cases per 100,000 individuals was obtained from the Centers for Disease Control and Prevention COVID-19 database. All data analyses were performed using Microsoft Excel.
Results
The study cohort consisted of 64 patients, of whom 30 (46.9%) were hospitalized between March 5 and May 5, 2020, and 34 (53.1%) who were admitted during the analogous time period in 2019. This reflected a 6% decrease in STEMI admissions at PAR in the COVID-19 cohort.
Acute STEMI Hospitalization Rates and COVID-19 Incidence
The mean daily acute STEMI admission rate was 0.50 during the study period compared to 0.57 during the control period. During the study period in 2020 in the state of Georgia, the daily rate of newly confirmed COVID-19 cases ranged from 0.194 per 100,000 on March 5 to 8.778 per 100,000 on May 5. Results of COVID-19 testing were available for 9 STEMI patients, and of these 0 tests were positive.
Baseline Characteristics
Baseline characteristics of the acute STEMI cohorts are presented in Table 1. Approximately 75% were male; median (interquartile range [IQR]) age was 60 (51-72) years. There were no significant differences in age and gender between the study periods. Three-quarters of patients had a history of hypertension, and 87.5% had a history of dyslipidemia. There was no significant difference in baseline comorbidity profiles between the 2 study periods; therefore, our sample populations shared similar characteristics.
Clinical Presentation
Significant differences were observed regarding the time intervals of STEMI patients in the COVID-19 period and the control period (Table 2). Median time from symptom onset to hospital admission (patient delay) was extended from 57.5 minutes (IQR, 40.3-106) in 2019 to 93 minutes (IQR, 48.8-132) in 2020; however, this difference was not statistically significant (P = .697). Median time from hospital admission to reperfusion (system delay) was prolonged from 45 minutes (IQR, 28-61) in 2019 to 78 minutes (IQR, 50-110) in 2020 (P < .001). Overall time from symptom onset to reperfusion (total ischemic time) increased from 99.5 minutes (IQR, 84.8-132) in 2019 to 149 minutes (IQR, 96.3-231.8) in 2020 (P = .032).
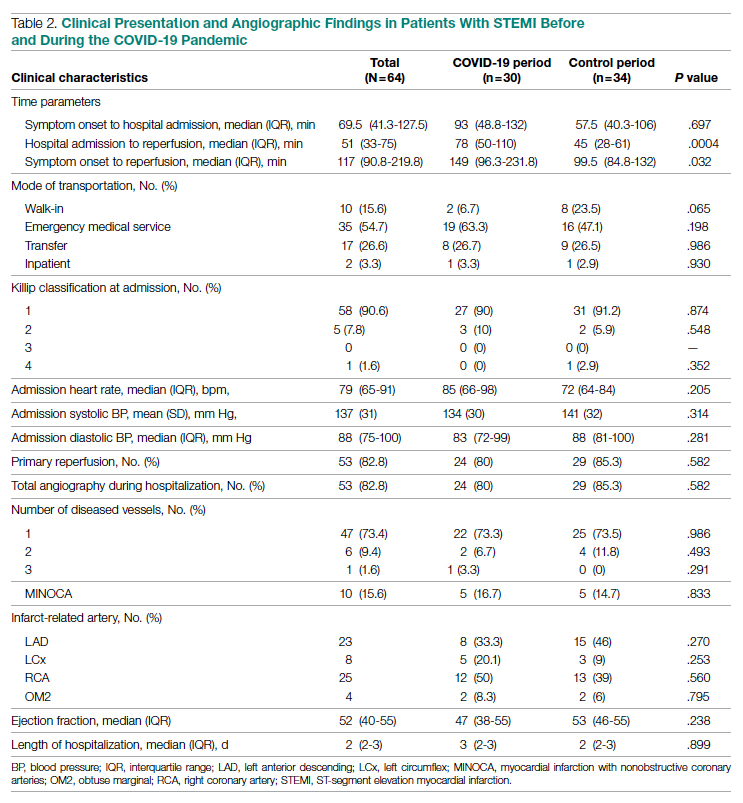
Regarding mode of transportation, 23.5% of patients in 2019 were walk-in admissions to the emergency department. During the COVID-19 period, walk-in admissions decreased to 6.7% (P = .065). There were no significant differences between emergency medical service, transfer, or in-patient admissions for STEMI cases between the 2 study periods.
Killip classification scores were calculated for all patients on admission; 90.6% of patients were classified as Killip Class 1. There was no significant difference between hemodynamic presentations during the COVID-19 period compared to the control period.
Angiographic Data
Overall, 53 (82.8%) patients admitted with acute STEMI underwent coronary angiography during their hospital stay. The proportion of patients who underwent primary reperfusion was greater in the control period than in the COVID-19 period (85.3% vs 80%; P = .582). Angiographic characteristics and findings were similar between the 2 study groups (Table 2).
In-Hospital Outcomes
In-hospital outcome data were available for all patients. As shown in Table 3, hospitalization during the COVID-19 period was independently associated with an increased risk for combined in-hospital outcome (odds ratio, 3.96; P = .046). The rate of in-hospital mortality was greater in the COVID-19 period (P = .013). We found no significant difference when comparing secondary outcomes from admissions during the COVID-19 period and the control period in 2019. For the 5 patients who died during the study period, the primary diagnosis at death was acute STEMI complicated by CHF (3 patients) or cardiogenic shock (2 patients).
Discussion
This single-center retrospective study at PAR looks at the impact of COVID-19 on hospitalizations for acute STEMI during the initial peak of the pandemic. The key findings of this study show a significant increase in ischemic time parameters (symptom onset to reperfusion, hospital admission to reperfusion), in-hospital mortality, and combined in-hospital outcomes.
There was a 49.5-minute increase in total ischemic time noted in this study (P = .032). Though there was a numerical increase in time of symptom onset to hospital admission by 23.5 minutes, this difference was not statistically significant (P = .697). However, this study observed a statistically significant 33-minute increase in ischemic time from hospital admission to reperfusion (P < .001). Multiple studies globally have found a similar increase in total ischemic times, including those conducted in China and Europe.13-15 Every level of potential delay must be considered, including pre-hospital, triage and emergency department, and/or reperfusion team. Pre-hospital sources of delays that have been suggested include “stay-at-home” orders and apprehension to seek medical care due to concern about contracting the virus or overwhelming the health care facilities. There was a clinically significant 4-fold decrease in the number of walk-in acute STEMI cases in the study period. In 2019, there were 8 walk-in cases compared to 2 cases in 2020 (P = .065). However, this change was not statistically significant. In-hospital/systemic sources of delays have been mentioned in other studies; they include increased time taken to rule out COVID-19 (nasopharyngeal swab/chest x-ray) and increased time due to the need for intensive gowning and gloving procedures by staff. It was difficult to objectively determine the sources of system delay by the reperfusion team due to a lack of quantitative data.
In the current study, we found a significant increase in in-hospital mortality during the COVID-19 period compared to a parallel time frame in 2019. This finding is contrary to a multicenter study from Spain that reported no difference in in-hospital outcomes or mortality rates among all acute coronary syndrome cases.16 The worsening outcomes and prognosis may simply be a result of increased ischemic time; however, the virus that causes COVID-19 itself may play a role as well. Studies have found that SARS-Cov-2 infection places patients at greater risk for cardiovascular conditions such as hypercoagulability, myocarditis, and arrhythmias.17 In our study, however, there were no acute STEMI patients who tested positive for COVID-19. Therefore, we cannot discuss the impact of increased thrombus burden in patients with COVID-19. Piedmont Healthcare published a STEMI treatment protocol in May 2020 that advised increased use of tissue plasminogen activator (tPA) in COVID-19-positive cases; during the study period, however, there were no occasions when tPA use was deemed appropriate based on clinical judgment.
Our findings align with previous studies that describe an increase in combined in-hospital adverse outcomes during the COVID-19 era. Previous studies detected a higher rate of complications in the COVID-19 cohort, but in the current study, the adverse in-hospital course is unrelated to underlying infection.18,19 This study reports a higher incidence of major in-hospital outcomes, including a 65% increase in the rate of combined in-hospital outcomes, which is similar to a multicenter study conducted in Israel.19 There was a 2.3-fold numerical increase in sustained ventricular arrhythmias and a 2.5-fold numerical increase in the incidence of cardiac arrest in the study period. This phenomenon was observed despite a similar rate of reperfusion procedures in both groups.
Acute STEMI is a highly fatal condition with an incidence of 8.5 in 10,000 annually in the United States. While studies across the world have shown a 25% to 40% reduction in the rate of hospitalized acute coronary syndrome cases during the COVID-19 pandemic, the decrease from 34 to 30 STEMI admissions at PAR is not statistically significant.20 Possible reasons for the reduction globally include increased out-of-hospital mortality and decreased incidence of acute STEMI across the general population as a result of improved access to telemedicine or decreased levels of life stressors.20
In summary, there was an increase in ischemic time to reperfusion, in-hospital mortality, and combined in-hospital outcomes for acute STEMI patients at PAR during the COVID period.
Limitations
This study has several limitations. This is a single-center study, so the sample size is small and may not be generalizable to a larger population. This is a retrospective observational study, so causation cannot be inferred. This study analyzed ischemic time parameters as average rates over time rather than in an interrupted time series. Post-reperfusion outcomes were limited to hospital stay. Post-hospital follow-up would provide a better picture of the effects of STEMI intervention. There is no account of patients who died out-of-hospital secondary to acute STEMI. COVID-19 testing was not introduced until midway in our study period. Therefore, we cannot rule out the possibility of the SARS-Cov-2 virus inciting acute STEMI and subsequently leading to worse outcomes and poor prognosis.
Conclusions
This study provides an analysis of the incidence, characteristics, and clinical outcomes of patients presenting with acute STEMI during the early period of the COVID-19 pandemic. In-hospital mortality and ischemic time to reperfusion increased while combined in-hospital outcomes worsened.
Acknowledgment: The authors thank Piedmont Athens Regional IRB for approving this project and allowing access to patient data.
Corresponding author: Syed H. Ali; Department of Medicine, Medical College of Georgia at the Augusta University-University of Georgia Medical Partnership, 30606, Athens, GA; [email protected]
Disclosures: None reported.
doi:10.12788/jcom.0085
1. Bhatt AS, Moscone A, McElrath EE, et al. Fewer hospitalizations for acute cardiovascular conditions during the COVID-19 pandemic. J Am Coll Cardiol. 2020;76(3):280-288. doi:10.1016/j.jacc.2020.05.038
2. Metzler B, Siostrzonek P, Binder RK, Bauer A, Reinstadler SJR. Decline of acute coronary syndrome admissions in Austria since the outbreak of Covid-19: the pandemic response causes cardiac collateral damage. Eur Heart J. 2020;41:1852-1853. doi:10.1093/eurheartj/ehaa314
3. De Rosa S, Spaccarotella C, Basso C, et al. Reduction of hospitalizations for myocardial infarction in Italy in the Covid-19 era. Eur Heart J. 2020;41(22):2083-2088.
4. Wilson SJ, Connolly MJ, Elghamry Z, et al. Effect of the COVID-19 pandemic on ST-segment-elevation myocardial infarction presentations and in-hospital outcomes. Circ Cardiovasc Interv. 2020; 13(7):e009438. doi:10.1161/CIRCINTERVENTIONS.120.009438
5. Mafham MM, Spata E, Goldacre R, et al. Covid-19 pandemic and admission rates for and management of acute coronary syndromes in England. Lancet. 2020;396 (10248):381-389. doi:10.1016/S0140-6736(20)31356-8
6. Bhatt AS, Moscone A, McElrath EE, et al. Fewer Hospitalizations for acute cardiovascular conditions during the COVID-19 pandemic. J Am Coll Cardiol. 2020;76(3):280-288. doi:10.1016/j.jacc.2020.05.038
7. Tam CF, Cheung KS, Lam S, et al. Impact of Coronavirus disease 2019 (Covid-19) outbreak on ST-segment elevation myocardial infarction care in Hong Kong, China. Circ Cardiovasc Qual Outcomes. 2020;13(4):e006631. doi:10.1161/CIRCOUTCOMES.120.006631
8. Clerkin KJ, Fried JA, Raikhelkar J, et al. Coronavirus disease 2019 (COVID-19) and cardiovascular disease. Circulation. 2020;141:1648-1655. doi:10.1161/CIRCULATIONAHA.120.046941
9. Ebinger JE, Shah PK. Declining admissions for acute cardiovascular illness: The Covid-19 paradox. J Am Coll Cardiol. 2020;76(3):289-291. doi:10.1016/j.jacc.2020.05.039
10 Leor J, Poole WK, Kloner RA. Sudden cardiac death triggered by an earthquake. N Engl J Med. 1996;334(7):413-419. doi:10.1056/NEJM199602153340701
11. Hiramori K. Major causes of death from acute myocardial infarction in a coronary care unit. Jpn Circ J. 1987;51(9):1041-1047. doi:10.1253/jcj.51.1041
12. Bui AH, Waks JW. Risk stratification of sudden cardiac death after acute myocardial infarction. J Innov Card Rhythm Manag. 2018;9(2):3035-3049. doi:10.19102/icrm.2018.090201
13. Xiang D, Xiang X, Zhang W, et al. Management and outcomes of patients with STEMI during the COVID-19 pandemic in China. J Am Coll Cardiol. 2020;76(11):1318-1324. doi:10.1016/j.jacc.2020.06.039
14. Hakim R, Motreff P, Rangé G. COVID-19 and STEMI. [Article in French]. Ann Cardiol Angeiol (Paris). 2020;69(6):355-359. doi:10.1016/j.ancard.2020.09.034
15. Soylu K, Coksevim M, Yanık A, Bugra Cerik I, Aksan G. Effect of Covid-19 pandemic process on STEMI patients timeline. Int J Clin Pract. 2021;75(5):e14005. doi:10.1111/ijcp.14005
16. Salinas P, Travieso A, Vergara-Uzcategui C, et al. Clinical profile and 30-day mortality of invasively managed patients with suspected acute coronary syndrome during the COVID-19 outbreak. Int Heart J. 2021;62(2):274-281. doi:10.1536/ihj.20-574
17. Hu Y, Sun J, Dai Z, et al. Prevalence and severity of corona virus disease 2019 (Covid-19): a systematic review and meta-analysis. J Clin Virol. 2020;127:104371. doi:10.1016/j.jcv.2020.104371
18. Rodriguez-Leor O, Cid Alvarez AB, Perez de Prado A, et al. In-hospital outcomes of COVID-19 ST-elevation myocardial infarction patients. EuroIntervention. 2021;16(17):1426-1433. doi:10.4244/EIJ-D-20-00935
19. Fardman A, Zahger D, Orvin K, et al. Acute myocardial infarction in the Covid-19 era: incidence, clinical characteristics and in-hospital outcomes—A multicenter registry. PLoS ONE. 2021;16(6): e0253524. doi:10.1371/journal.pone.0253524
20. Pessoa-Amorim G, Camm CF, Gajendragadkar P, et al. Admission of patients with STEMI since the outbreak of the COVID-19 pandemic: a survey by the European Society of Cardiology. Eur Heart J Qual Care Clin Outcomes. 2020;6(3):210-216. doi:10.1093/ehjqcco/qcaa046
From the Department of Medicine, Medical College of Georgia at the Augusta University-University of Georgia Medical Partnership, Athens, GA (Syed H. Ali, Syed Hyder, and Dr. Murrow), and the Department of Cardiology, Piedmont Heart Institute, Piedmont Athens Regional, Athens, GA (Dr. Murrow and Mrs. Davis).
Abstract
Objectives: The aim of this study was to describe the characteristics and in-hospital outcomes of patients with acute ST-segment elevation myocardial infarction (STEMI) during the early COVID-19 pandemic at Piedmont Athens Regional (PAR), a 330-bed tertiary referral center in Northeast Georgia.
Methods: A retrospective study was conducted at PAR to evaluate patients with acute STEMI admitted over an 8-week period during the initial COVID-19 outbreak. This study group was compared to patients admitted during the corresponding period in 2019. The primary endpoint of this study was defined as a composite of sustained ventricular arrhythmia, congestive heart failure (CHF) with pulmonary congestion, and/or in-hospital mortality.
Results: This study cohort was composed of 64 patients with acute STEMI; 30 patients (46.9%) were hospitalized during the COVID-19 pandemic. Patients with STEMI in both the COVID-19 and control groups had similar comorbidities, Killip classification score, and clinical presentations. The median (interquartile range) time from symptom onset to reperfusion (total ischemic time) increased from 99.5 minutes (84.8-132) in 2019 to 149 minutes (96.3-231.8; P = .032) in 2020. Hospitalization during the COVID-19 period was associated with an increased risk for combined in-hospital outcome (odds ratio, 3.96; P = .046).
Conclusion: Patients with STEMI admitted during the first wave of the COVID-19 outbreak experienced longer total ischemic time and increased risk for combined in-hospital outcomes compared to patients admitted during the corresponding period in 2019.
Keywords: myocardial infarction, acute coronary syndrome, hospitalization, outcomes.
The emergence of the SARS-Cov-2 virus in December 2019 caused a worldwide shift in resource allocation and the restructuring of health care systems within the span of a few months. With the rapid spread of infection, the World Health Organization officially declared a pandemic in March 2020. The pandemic led to the deferral and cancellation of in-person patient visits, routine diagnostic studies, and nonessential surgeries and procedures. This response occurred secondary to a joint effort to reduce transmission via stay-at-home mandates and appropriate social distancing.1
Alongside the reduction in elective procedures and health care visits, significant reductions in hospitalization rates due to decreases in acute ST-segment elevation myocardial infarction (STEMI) and catheterization laboratory utilization have been reported in many studies from around the world.2-7 Comprehensive data demonstrating the impact of the COVID-19 pandemic on acute STEMI patient characteristics, clinical presentation, and in-hospital outcomes are lacking. Although patients with previously diagnosed cardiovascular disease are more likely to encounter worse outcomes in the setting of COVID-19, there may also be an indirect impact of the pandemic on high-risk patients, including those without the infection.8 Several theories have been hypothesized to explain this phenomenon. One theory postulates that the fear of contracting the virus during hospitalization is great enough to prevent patients from seeking care.2 Another theory suggests that the increased utilization of telemedicine prevents exacerbation of chronic conditions and the need for hospitalization.9 Contrary to this trend, previous studies have shown an increased incidence of acute STEMI following stressful events such as natural disasters.10
The aim of this study was to describe trends pertaining to clinical characteristics and in-hospital outcomes of patients with acute STEMI during the early COVID-19 pandemic at Piedmont Athens Regional (PAR), a 330-bed tertiary referral center in Northeast Georgia.
Methods
A retrospective cohort study was conducted at PAR to evaluate patients with STEMI admitted to the cardiovascular intensive care unit over an 8-week period (March 5 to May 5, 2020) during the COVID-19 outbreak. COVID-19 was declared a national emergency on March 13, 2020, in the United States. The institutional review board at PAR approved the study; the need for individual consent was waived under the condition that participant data would undergo de-identification and be strictly safeguarded.
Data Collection
Because there are seasonal variations in cardiovascular admissions, patient data from a control period (March 9 to May 9, 2019) were obtained to compare with data from the 2020 period. The number of patients with the diagnosis of acute STEMI during the COVID-19 period was recorded. Demographic data, clinical characteristics, and primary angiographic findings were gathered for all patients. Time from symptom onset to hospital admission and time from hospital admission to reperfusion (defined as door-to-balloon time) were documented for each patient. Killip classification was used to assess patients’ clinical status on admission. Length of stay was determined as days from hospital admission to discharge or death (if occurring during the same hospitalization).
Adverse in-hospital complications were also recorded. These were selected based on inclusion of the following categories of acute STEMI complications: ischemic, mechanical, arrhythmic, embolic, and inflammatory. The following complications occurred in our patient cohort: sustained ventricular arrhythmia, congestive heart failure (CHF) defined as congestion requiring intravenous diuretics, re-infarction, mechanical complications (free-wall rupture, ventricular septal defect, or mitral regurgitation), second- or third-degree atrioventricular block, atrial fibrillation, stroke, mechanical ventilation, major bleeding, pericarditis, cardiogenic shock, cardiac arrest, and in-hospital mortality. The primary outcome of this study was defined as a composite of sustained ventricular arrhythmia, CHF with congestion requiring intravenous diuretics, and/or in-hospital mortality. Ventricular arrythmia and CHF were included in the composite outcome because they are defined as the 2 most common causes of sudden cardiac death following acute STEMI.11,12
Statistical Analysis
Normally distributed continuous variables and categorical variables were compared using the paired t-test. A 2-sided P value <.05 was considered to be statistically significant. Mean admission rates for acute STEMI hospitalizations were determined by dividing the number of admissions by the number of days in each time period. The daily rate of COVID-19 cases per 100,000 individuals was obtained from the Centers for Disease Control and Prevention COVID-19 database. All data analyses were performed using Microsoft Excel.
Results
The study cohort consisted of 64 patients, of whom 30 (46.9%) were hospitalized between March 5 and May 5, 2020, and 34 (53.1%) who were admitted during the analogous time period in 2019. This reflected a 6% decrease in STEMI admissions at PAR in the COVID-19 cohort.
Acute STEMI Hospitalization Rates and COVID-19 Incidence
The mean daily acute STEMI admission rate was 0.50 during the study period compared to 0.57 during the control period. During the study period in 2020 in the state of Georgia, the daily rate of newly confirmed COVID-19 cases ranged from 0.194 per 100,000 on March 5 to 8.778 per 100,000 on May 5. Results of COVID-19 testing were available for 9 STEMI patients, and of these 0 tests were positive.
Baseline Characteristics
Baseline characteristics of the acute STEMI cohorts are presented in Table 1. Approximately 75% were male; median (interquartile range [IQR]) age was 60 (51-72) years. There were no significant differences in age and gender between the study periods. Three-quarters of patients had a history of hypertension, and 87.5% had a history of dyslipidemia. There was no significant difference in baseline comorbidity profiles between the 2 study periods; therefore, our sample populations shared similar characteristics.
Clinical Presentation
Significant differences were observed regarding the time intervals of STEMI patients in the COVID-19 period and the control period (Table 2). Median time from symptom onset to hospital admission (patient delay) was extended from 57.5 minutes (IQR, 40.3-106) in 2019 to 93 minutes (IQR, 48.8-132) in 2020; however, this difference was not statistically significant (P = .697). Median time from hospital admission to reperfusion (system delay) was prolonged from 45 minutes (IQR, 28-61) in 2019 to 78 minutes (IQR, 50-110) in 2020 (P < .001). Overall time from symptom onset to reperfusion (total ischemic time) increased from 99.5 minutes (IQR, 84.8-132) in 2019 to 149 minutes (IQR, 96.3-231.8) in 2020 (P = .032).
Regarding mode of transportation, 23.5% of patients in 2019 were walk-in admissions to the emergency department. During the COVID-19 period, walk-in admissions decreased to 6.7% (P = .065). There were no significant differences between emergency medical service, transfer, or in-patient admissions for STEMI cases between the 2 study periods.
Killip classification scores were calculated for all patients on admission; 90.6% of patients were classified as Killip Class 1. There was no significant difference between hemodynamic presentations during the COVID-19 period compared to the control period.
Angiographic Data
Overall, 53 (82.8%) patients admitted with acute STEMI underwent coronary angiography during their hospital stay. The proportion of patients who underwent primary reperfusion was greater in the control period than in the COVID-19 period (85.3% vs 80%; P = .582). Angiographic characteristics and findings were similar between the 2 study groups (Table 2).
In-Hospital Outcomes
In-hospital outcome data were available for all patients. As shown in Table 3, hospitalization during the COVID-19 period was independently associated with an increased risk for combined in-hospital outcome (odds ratio, 3.96; P = .046). The rate of in-hospital mortality was greater in the COVID-19 period (P = .013). We found no significant difference when comparing secondary outcomes from admissions during the COVID-19 period and the control period in 2019. For the 5 patients who died during the study period, the primary diagnosis at death was acute STEMI complicated by CHF (3 patients) or cardiogenic shock (2 patients).
Discussion
This single-center retrospective study at PAR looks at the impact of COVID-19 on hospitalizations for acute STEMI during the initial peak of the pandemic. The key findings of this study show a significant increase in ischemic time parameters (symptom onset to reperfusion, hospital admission to reperfusion), in-hospital mortality, and combined in-hospital outcomes.
There was a 49.5-minute increase in total ischemic time noted in this study (P = .032). Though there was a numerical increase in time of symptom onset to hospital admission by 23.5 minutes, this difference was not statistically significant (P = .697). However, this study observed a statistically significant 33-minute increase in ischemic time from hospital admission to reperfusion (P < .001). Multiple studies globally have found a similar increase in total ischemic times, including those conducted in China and Europe.13-15 Every level of potential delay must be considered, including pre-hospital, triage and emergency department, and/or reperfusion team. Pre-hospital sources of delays that have been suggested include “stay-at-home” orders and apprehension to seek medical care due to concern about contracting the virus or overwhelming the health care facilities. There was a clinically significant 4-fold decrease in the number of walk-in acute STEMI cases in the study period. In 2019, there were 8 walk-in cases compared to 2 cases in 2020 (P = .065). However, this change was not statistically significant. In-hospital/systemic sources of delays have been mentioned in other studies; they include increased time taken to rule out COVID-19 (nasopharyngeal swab/chest x-ray) and increased time due to the need for intensive gowning and gloving procedures by staff. It was difficult to objectively determine the sources of system delay by the reperfusion team due to a lack of quantitative data.
In the current study, we found a significant increase in in-hospital mortality during the COVID-19 period compared to a parallel time frame in 2019. This finding is contrary to a multicenter study from Spain that reported no difference in in-hospital outcomes or mortality rates among all acute coronary syndrome cases.16 The worsening outcomes and prognosis may simply be a result of increased ischemic time; however, the virus that causes COVID-19 itself may play a role as well. Studies have found that SARS-Cov-2 infection places patients at greater risk for cardiovascular conditions such as hypercoagulability, myocarditis, and arrhythmias.17 In our study, however, there were no acute STEMI patients who tested positive for COVID-19. Therefore, we cannot discuss the impact of increased thrombus burden in patients with COVID-19. Piedmont Healthcare published a STEMI treatment protocol in May 2020 that advised increased use of tissue plasminogen activator (tPA) in COVID-19-positive cases; during the study period, however, there were no occasions when tPA use was deemed appropriate based on clinical judgment.
Our findings align with previous studies that describe an increase in combined in-hospital adverse outcomes during the COVID-19 era. Previous studies detected a higher rate of complications in the COVID-19 cohort, but in the current study, the adverse in-hospital course is unrelated to underlying infection.18,19 This study reports a higher incidence of major in-hospital outcomes, including a 65% increase in the rate of combined in-hospital outcomes, which is similar to a multicenter study conducted in Israel.19 There was a 2.3-fold numerical increase in sustained ventricular arrhythmias and a 2.5-fold numerical increase in the incidence of cardiac arrest in the study period. This phenomenon was observed despite a similar rate of reperfusion procedures in both groups.
Acute STEMI is a highly fatal condition with an incidence of 8.5 in 10,000 annually in the United States. While studies across the world have shown a 25% to 40% reduction in the rate of hospitalized acute coronary syndrome cases during the COVID-19 pandemic, the decrease from 34 to 30 STEMI admissions at PAR is not statistically significant.20 Possible reasons for the reduction globally include increased out-of-hospital mortality and decreased incidence of acute STEMI across the general population as a result of improved access to telemedicine or decreased levels of life stressors.20
In summary, there was an increase in ischemic time to reperfusion, in-hospital mortality, and combined in-hospital outcomes for acute STEMI patients at PAR during the COVID period.
Limitations
This study has several limitations. This is a single-center study, so the sample size is small and may not be generalizable to a larger population. This is a retrospective observational study, so causation cannot be inferred. This study analyzed ischemic time parameters as average rates over time rather than in an interrupted time series. Post-reperfusion outcomes were limited to hospital stay. Post-hospital follow-up would provide a better picture of the effects of STEMI intervention. There is no account of patients who died out-of-hospital secondary to acute STEMI. COVID-19 testing was not introduced until midway in our study period. Therefore, we cannot rule out the possibility of the SARS-Cov-2 virus inciting acute STEMI and subsequently leading to worse outcomes and poor prognosis.
Conclusions
This study provides an analysis of the incidence, characteristics, and clinical outcomes of patients presenting with acute STEMI during the early period of the COVID-19 pandemic. In-hospital mortality and ischemic time to reperfusion increased while combined in-hospital outcomes worsened.
Acknowledgment: The authors thank Piedmont Athens Regional IRB for approving this project and allowing access to patient data.
Corresponding author: Syed H. Ali; Department of Medicine, Medical College of Georgia at the Augusta University-University of Georgia Medical Partnership, 30606, Athens, GA; [email protected]
Disclosures: None reported.
doi:10.12788/jcom.0085
1. Bhatt AS, Moscone A, McElrath EE, et al. Fewer hospitalizations for acute cardiovascular conditions during the COVID-19 pandemic. J Am Coll Cardiol. 2020;76(3):280-288. doi:10.1016/j.jacc.2020.05.038
2. Metzler B, Siostrzonek P, Binder RK, Bauer A, Reinstadler SJR. Decline of acute coronary syndrome admissions in Austria since the outbreak of Covid-19: the pandemic response causes cardiac collateral damage. Eur Heart J. 2020;41:1852-1853. doi:10.1093/eurheartj/ehaa314
3. De Rosa S, Spaccarotella C, Basso C, et al. Reduction of hospitalizations for myocardial infarction in Italy in the Covid-19 era. Eur Heart J. 2020;41(22):2083-2088.
4. Wilson SJ, Connolly MJ, Elghamry Z, et al. Effect of the COVID-19 pandemic on ST-segment-elevation myocardial infarction presentations and in-hospital outcomes. Circ Cardiovasc Interv. 2020; 13(7):e009438. doi:10.1161/CIRCINTERVENTIONS.120.009438
5. Mafham MM, Spata E, Goldacre R, et al. Covid-19 pandemic and admission rates for and management of acute coronary syndromes in England. Lancet. 2020;396 (10248):381-389. doi:10.1016/S0140-6736(20)31356-8
6. Bhatt AS, Moscone A, McElrath EE, et al. Fewer Hospitalizations for acute cardiovascular conditions during the COVID-19 pandemic. J Am Coll Cardiol. 2020;76(3):280-288. doi:10.1016/j.jacc.2020.05.038
7. Tam CF, Cheung KS, Lam S, et al. Impact of Coronavirus disease 2019 (Covid-19) outbreak on ST-segment elevation myocardial infarction care in Hong Kong, China. Circ Cardiovasc Qual Outcomes. 2020;13(4):e006631. doi:10.1161/CIRCOUTCOMES.120.006631
8. Clerkin KJ, Fried JA, Raikhelkar J, et al. Coronavirus disease 2019 (COVID-19) and cardiovascular disease. Circulation. 2020;141:1648-1655. doi:10.1161/CIRCULATIONAHA.120.046941
9. Ebinger JE, Shah PK. Declining admissions for acute cardiovascular illness: The Covid-19 paradox. J Am Coll Cardiol. 2020;76(3):289-291. doi:10.1016/j.jacc.2020.05.039
10 Leor J, Poole WK, Kloner RA. Sudden cardiac death triggered by an earthquake. N Engl J Med. 1996;334(7):413-419. doi:10.1056/NEJM199602153340701
11. Hiramori K. Major causes of death from acute myocardial infarction in a coronary care unit. Jpn Circ J. 1987;51(9):1041-1047. doi:10.1253/jcj.51.1041
12. Bui AH, Waks JW. Risk stratification of sudden cardiac death after acute myocardial infarction. J Innov Card Rhythm Manag. 2018;9(2):3035-3049. doi:10.19102/icrm.2018.090201
13. Xiang D, Xiang X, Zhang W, et al. Management and outcomes of patients with STEMI during the COVID-19 pandemic in China. J Am Coll Cardiol. 2020;76(11):1318-1324. doi:10.1016/j.jacc.2020.06.039
14. Hakim R, Motreff P, Rangé G. COVID-19 and STEMI. [Article in French]. Ann Cardiol Angeiol (Paris). 2020;69(6):355-359. doi:10.1016/j.ancard.2020.09.034
15. Soylu K, Coksevim M, Yanık A, Bugra Cerik I, Aksan G. Effect of Covid-19 pandemic process on STEMI patients timeline. Int J Clin Pract. 2021;75(5):e14005. doi:10.1111/ijcp.14005
16. Salinas P, Travieso A, Vergara-Uzcategui C, et al. Clinical profile and 30-day mortality of invasively managed patients with suspected acute coronary syndrome during the COVID-19 outbreak. Int Heart J. 2021;62(2):274-281. doi:10.1536/ihj.20-574
17. Hu Y, Sun J, Dai Z, et al. Prevalence and severity of corona virus disease 2019 (Covid-19): a systematic review and meta-analysis. J Clin Virol. 2020;127:104371. doi:10.1016/j.jcv.2020.104371
18. Rodriguez-Leor O, Cid Alvarez AB, Perez de Prado A, et al. In-hospital outcomes of COVID-19 ST-elevation myocardial infarction patients. EuroIntervention. 2021;16(17):1426-1433. doi:10.4244/EIJ-D-20-00935
19. Fardman A, Zahger D, Orvin K, et al. Acute myocardial infarction in the Covid-19 era: incidence, clinical characteristics and in-hospital outcomes—A multicenter registry. PLoS ONE. 2021;16(6): e0253524. doi:10.1371/journal.pone.0253524
20. Pessoa-Amorim G, Camm CF, Gajendragadkar P, et al. Admission of patients with STEMI since the outbreak of the COVID-19 pandemic: a survey by the European Society of Cardiology. Eur Heart J Qual Care Clin Outcomes. 2020;6(3):210-216. doi:10.1093/ehjqcco/qcaa046
Oxygen Therapies and Clinical Outcomes for Patients Hospitalized With COVID-19: First Surge vs Second Surge
From Lahey Hospital and Medical Center, Burlington, MA (Drs. Liesching and Lei), and Tufts University School of Medicine, Boston, MA (Dr. Liesching)
ABSTRACT
Objective: To compare the utilization of oxygen therapies and clinical outcomes of patients admitted for COVID-19 during the second surge of the pandemic to that of patients admitted during the first surge.
Design: Observational study using a registry database.
Setting: Three hospitals (791 inpatient beds and 76 intensive care unit [ICU] beds) within the Beth Israel Lahey Health system in Massachusetts.
Participants: We included 3183 patients with COVID-19 admitted to hospitals.
Measurements: Baseline data included demographics and comorbidities. Treatments included low-flow supplemental oxygen (2-6 L/min), high-flow oxygen via nasal cannula, and invasive mechanical ventilation. Outcomes included ICU admission, length of stay, ventilator days, and mortality.
Results: A total of 3183 patients were included: 1586 during the first surge and 1597 during the second surge. Compared to the first surge, patients admitted during the second surge had a similar rate of receiving low-flow supplemental oxygen (65.8% vs 64.1%, P = .3), a higher rate of receiving high-flow nasal cannula (15.4% vs 10.8%, P = .0001), and a lower ventilation rate (5.6% vs 9.7%, P < .0001). The outcomes during the second surge were better than those during the first surge: lower ICU admission rate (8.1% vs 12.7%, P < .0001), shorter length of hospital stay (5 vs 6 days, P < .0001), fewer ventilator days (10 vs 16, P = .01), and lower mortality (8.3% vs 19.2%, P < .0001). Among ventilated patients, those who received high-flow nasal cannula had lower mortality.
Conclusion: Compared to the first surge of the COVID-19 pandemic, patients admitted during the second surge had similar likelihood of receiving low-flow supplemental oxygen, were more likely to receive high-flow nasal cannula, were less likely to be ventilated, and had better outcomes.
Keywords: supplemental oxygen, high-flow nasal cannula, ventilator.
The respiratory system receives the major impact of SARS-CoV-2 virus, and hypoxemia has been the predominant diagnosis for patients hospitalized with COVID-19.1,2 During the initial stage of the pandemic, oxygen therapies and mechanical ventilation were the only choices for these patients.3-6 Standard-of-care treatment for patients with COVID-19 during the initial surge included oxygen therapies and mechanical ventilation for hypoxemia and medications for comorbidities and COVID-19–associated sequelae, such as multi-organ dysfunction and failure. A report from New York during the first surge (May 2020) showed that among 5700 hospitalized patients with COVID-19, 27.8% received supplemental oxygen and 12.2% received invasive mechanical ventilation.7 High-flow nasal cannula (HFNC) oxygen delivery has been utilized widely throughout the pandemic due to its superiority over other noninvasive respiratory support techniques.8-12 Mechanical ventilation is always necessary for critically ill patients with acute respiratory distress syndrome. However, ventilator scarcity has become a bottleneck in caring for severely ill patients with COVID-19 during the pandemic.13
The clinical outcomes of hospitalized COVID-19 patients include a high intubation rate, long length of hospital and intensive care unit (ICU) stay, and high mortality.14,15 As the pandemic evolved, new medications, including remdesivir, hydroxychloroquine, lopinavir, or interferon β-1a, were used in addition to the standard of care, but these did not result in significantly different mortality from standard of care.16 Steroids are becoming foundational to the treatment of severe COVID-19 pneumonia, but evidence from high-quality randomized controlled clinical trials is lacking.17
During the first surge from March to May 2020, Massachusetts had the third highest number of COVID-19 cases among states in the United States.18 In early 2021, COVID-19 cases were climbing close to the peak of the second surge in Massachusetts. In this study, we compared utilization of low-flow supplemental oxygen, HFNC, and mechanical ventilation and clinical outcomes of patients admitted to 3 hospitals in Massachusetts during the second surge of the pandemic to that of patients admitted during the first surge.
Methods
Setting
Beth Israel Lahey Health is a system of academic and teaching hospitals with primary care and specialty care providers. We included 3 centers within the Beth Israel Lahey Health system in Massachusetts: Lahey Hospital and Medical Center, with 335 inpatient hospital beds and 52 critical care beds; Beverly Hospital, with 227 beds and 14 critical care beds; and Winchester Hospital, with 229 beds and 10 ICU beds.
Participants
We included patients admitted to the 3 hospitals with COVID-19 as a primary or secondary diagnosis during the first surge of the pandemic (March 1, 2020 to June 15, 2020) and the second surge (November 15, 2020 to January 27, 2021). The timeframe of the first surge was defined as the window between the start date and the end date of data collection. During the time window of the first surge, 1586 patients were included. The start time of the second surge was defined as the date when the data collection was restarted; the end date was set when the number of patients (1597) accumulated was close to the number of patients in the first surge (1586), so that the two groups had similar sample size.
Study Design
A data registry of COVID-19 patients was created by our institution, and the data were prospectively collected starting in March 2020. We retrospectively extracted data on the following from the registry database for this observational study: demographics and baseline comorbidities; the use of low-flow supplemental oxygen, HFNC, and invasive mechanical ventilator; and ICU admission, length of hospital stay, length of ICU stay, and hospital discharge disposition. Start and end times for each oxygen therapy were not entered in the registry. Data about other oxygen therapies, such as noninvasive positive-pressure ventilation, were not collected in the registry database, and therefore were not included in the analysis.
Statistical Analysis
Continuous variables (eg, age) were tested for data distribution normality using the Shapiro-Wilk test. Normally distributed data were tested using unpaired t-tests and displayed as mean (SD). The skewed data were tested using the Wilcoxon rank sum test and displayed as median (interquartile range [IQR]). The categorical variables were compared using chi-square test. Comparisons with P ≤ .05 were considered significantly different. Statistical analysis for this study was generated using Statistical Analysis Software (SAS), version 9.4 for Windows (SAS Institute Inc.).
Results
Baseline Characteristics
We included 3183 patients: 1586 admitted during the first surge and 1597 admitted during the second surge. Baseline characteristics of patients with COVID-19 admitted during the first and second surges are shown in Table 1. Patients admitted during the second surge were older (73 years vs 71 years, P = .01) and had higher rates of hypertension (64.8% vs 59.6%, P = .003) and asthma (12.9% vs 10.7%, P = .049) but a lower rate of interstitial lung disease (3.3% vs 7.7%, P < .001). Sequential organ failure assessment scores at admission and the rates of other comorbidities were not significantly different between the 2 surges.

Oxygen Therapies
The number of patients who were hospitalized and received low-flow supplemental oxygen, and/or HFNC, and/or ventilator in the first surge and the second surge is shown in the Figure. Of all patients included, 2067 (64.9%) received low-flow supplemental oxygen; of these, 374 (18.1%) subsequently received HFNC, and 85 (22.7%) of these subsequently received mechanical ventilation. Of all 3183 patients, 417 (13.1%) received HFNC; 43 of these patients received HFNC without receiving low-flow supplemental oxygen, and 98 (23.5%) subsequently received mechanical ventilation. Out of all 3183 patients, 244 (7.7%) received mechanical ventilation; 98 (40.2%) of these received HFNC while the remaining 146 (59.8%) did not. At the beginning of the first surge, the ratio of patients who received invasive mechanical ventilation to patients who received HFNC was close to 1:1 (10/10); the ratio decreased to 6:10 in May and June 2020. At the beginning of the second surge, the ratio was 8:10 and then decreased to 3:10 in December 2020 and January 2021.
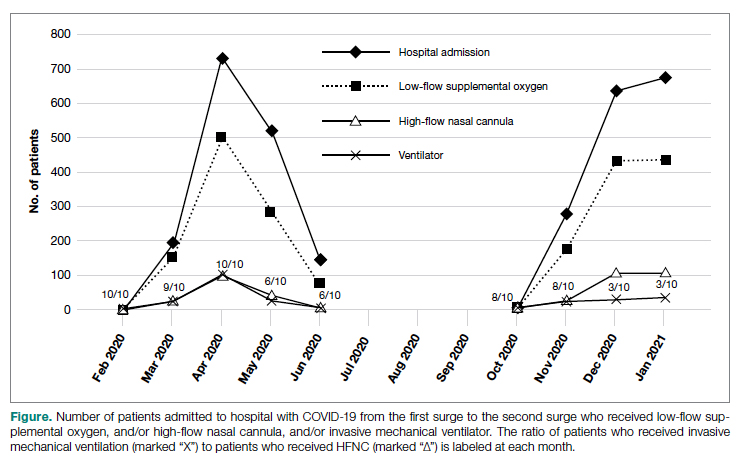
As shown in Table 2, the proportion of patients who received low-flow supplemental oxygen during the second surge was similar to that during the first surge (65.8% vs 64.1%, P = .3). Patients admitted during the second surge were more likely to receive HFNC than patients admitted during the first surge (15.4% vs 10.8%, P = .0001). Patients admitted during the second surge were less likely to be ventilated than the patients admitted during the first surge (5.6% vs 9.7%, P < .0001).
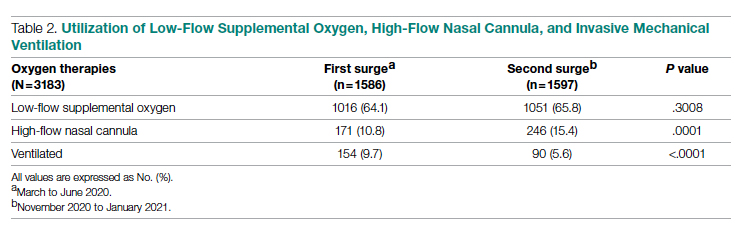
Clinical Outcomes
As shown in Table 3, second surge outcomes were much better than first surge outcomes: the ICU admission rate was lower (8.1% vs 12.7%, P < .0001); patients were more likely to be discharged to home (60.2% vs 47.4%, P < .0001), had a shorter length of hospital stay (5 vs 6 days, P < .0001), and had fewer ventilator days (10 vs 16, P = .01); and mortality was lower (8.3% vs 19.2%, P < .0001). There was a trend that length of ICU stay was shorter during the second surge than during the first surge (7 days vs 9 days, P = .09).
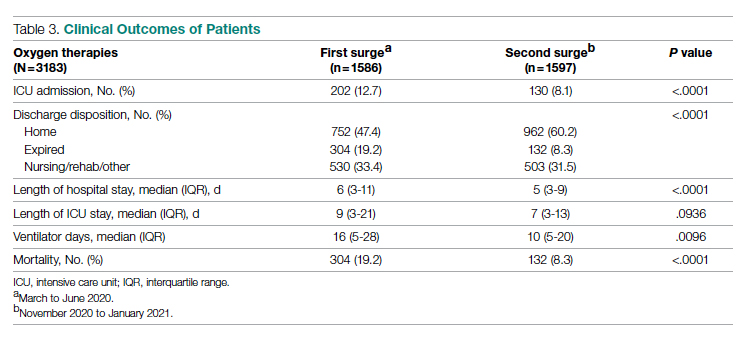
As noted (Figure), the ratio of patients who received invasive mechanical ventilation to patients who received HFNC was decreasing during both the first surge and the second surge. To further analyze the relation between ventilator and HFNC, we performed a subgroup analysis for 244 ventilated patients during both surges to compare outcomes between patients who received HFNC and those who did not receive HFNC (Table 4). Ninety-eight (40%) patients received HFNC. Ventilated patients who received HFNC had lower mortality than those patients who did not receive HFNC (31.6% vs 48%, P = .01), but had a longer length of hospital stay (29 days vs 14 days, P < .0001), longer length of ICU stay (17 days vs 9 days, P < .0001), and a higher number of ventilator days (16 vs 11, P = .001).
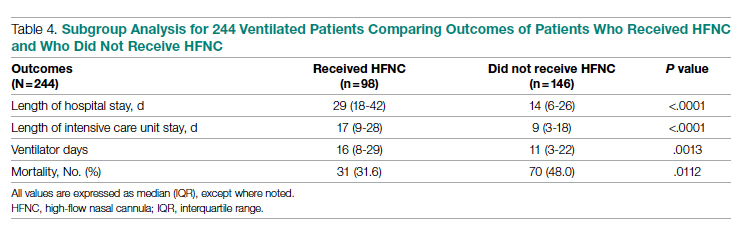
Discussion
Our study compared the baseline patient characteristics; utilization of low-flow supplemental oxygen therapy, HFNC, and mechanical ventilation; and clinical outcomes between the first surge (n = 1586) and the second surge (n = 1597) of the COVID-19 pandemic. During both surges, about two-thirds of admitted patients received low-flow supplemental oxygen. A higher proportion of the admitted patients received HFNC during the second surge than during the first surge, while the intubation rate was lower during the second surge than during the first surge.
Reported low-flow supplemental oxygen use ranged from 28% to 63% depending on the cohort characteristics and location during the first surge.6,7,19 A report from New York during the first surge (March 1 to April 4, 2020) showed that among 5700 hospitalized patients with COVID-19, 27.8% received low-flow supplemental oxygen.7 HFNC is recommended in guidelines on management of patients with acute respiratory failure due to COVID-19.20 In our study, HFNC was utilized in a higher proportion of patients admitted for COVID-19 during the second surge (15.5% vs 10.8%, P = .0001). During the early pandemic period in Wuhan, China, 11% to 21% of admitted COVID-19 patients received HFNC.21,22 Utilization of HFNC in New York during the first surge (March to May 2020) varied from 5% to 14.3% of patients admitted with COVID-19.23,24 Our subgroup analysis of the ventilated patients showed that patients who received HFNC had lower mortality than those who did not (31.6% vs 48.0%, P = .011). Comparably, a report from Paris, France, showed that among patients admitted to ICUs for acute hypoxemic respiratory failure, those who received HFNC had lower mortality at day 60 than those who did not (21% vs 31%, P = .052).25 Our recent analysis showed that patients treated with HFNC prior to mechanical ventilation had lower mortality than those treated with only conventional oxygen (30% vs 52%, P = .05).26 In this subgroup analysis, we could not determine if HFNC treatment was administered before or after ventilation because HFNC was entered as dichotomous data (“Yes” or “No”) in the registry database. We merely showed the beneficial effect of HFNC on reducing mortality for ventilated COVID-19 patients, but did not mean to focus on how and when to apply HFNC.
We observed that the patients admitted during the second surge were less likely to be ventilated than the patients admitted during the first surge (5.6% vs 9.7%, P < .0001). During the first surge in New York, among 5700 patients admitted with COVID-19, 12.2% received invasive mechanical ventilation.7 In another report, also from New York during the first surge, 26.1% of 2015 hospitalized COVID-19 patients received mechanical ventilation.27 In our study, the ventilation rate of 9.7% during the first surge was lower.
Outcomes during the second surge were better than during the first surge, including ICU admission rate, hospital and ICU length of stay, ventilator days, and mortality. The mortality was 19.2% during the first surge vs 8.3% during the second surge (P < .0001). The mortality of 19.2% was lower than the 30.6% mortality reported for 2015 hospitalized COVID-19 patients in New York during the first surge.27 A retrospective study showed that early administration of remdesivir was associated with reduced ICU admission, ventilation use, and mortality.28 The RECOVERY clinical trial showed that dexamethasone improved mortality for COVID-19 patients who received respiratory support, but not for patients who did not receive any respiratory support.29 Perhaps some, if not all, of the improvement in ICU admission and mortality during the second surge was attributed to the new medications, such as antivirals and steroids.
The length of hospital stay for patients with moderate to severe COVID-19 varied from 4 to 53 days at different locations of the world, as shown in a meta-analysis by Rees and colleagues.30 Our results showing a length of stay of 6 days during the first surge and 5 days during the second surge fell into the shorter end of this range. In a retrospective analysis of 1643 adults with severe COVID-19 admitted to hospitals in New York City between March 9, 2020 and April 23, 2020, median hospital length of stay was 7 (IQR, 3-14) days.31 For the ventilated patients in our study, the length of stay of 14 days (did not receive HFNC) and 29 days (received HFNC) was much longer. This longer length of stay might be attributed to the patients in our study being older and having more severe comorbidities.
The main purpose of this study was to compare the oxygen therapies and outcomes between 2 surges. It is difficult to associate the clinical outcomes with the oxygen therapies because new therapies and medications were available after the first surge. It was not possible to adjust the outcomes with confounders (other therapies and medications) because the registry data did not include the new therapies and medications.
A strength of this study was that we included a large, balanced number of patients in the first surge and the second surge. We did not plan the sample size in both groups as we could not predict the number of admissions. We set the end date of data collection for analysis as the time when the number of patients admitted during the second surge was similar to the number of patients admitted during the first surge. A limitation was that the registry database was created by the institution and was not designed solely for this study. The data for oxygen therapies were limited to low-flow supplemental oxygen, HFNC, and invasive mechanical ventilation; data for noninvasive ventilation were not included.
Conclusion
At our centers, during the second surge of COVID-19 pandemic, patients hospitalized with COVID-19 infection were more likely to receive HFNC but less likely to be ventilated. Compared to the first surge, the hospitalized patients with COVID-19 infection had a lower ICU admission rate, shorter length of hospital stay, fewer ventilator days, and lower mortality. For ventilated patients, those who received HFNC had lower mortality than those who did not.
Corresponding author: Timothy N. Liesching, MD, 41 Mall Road, Burlington, MA 01805; [email protected]
Disclosures: None reported.
doi:10.12788/jcom.0086
1. Xie J, Covassin N, Fan Z, et al. Association between hypoxemia and mortality in patients with COVID-19. Mayo Clin Proc. 2020;95(6):1138-1147. doi:10.1016/j.mayocp.2020.04.006
2. Asleh R, Asher E, Yagel O, et al. Predictors of hypoxemia and related adverse outcomes in patients hospitalized with COVID-19: a double-center retrospective study. J Clin Med. 2021;10(16):3581. doi:10.3390/jcm10163581
3. Choi KJ, Hong HL, Kim EJ. Association between oxygen saturation/fraction of inhaled oxygen and mortality in patients with COVID-19 associated pneumonia requiring oxygen therapy. Tuberc Respir Dis (Seoul). 2021;84(2):125-133. doi:10.4046/trd.2020.0126
4. Dixit SB. Role of noninvasive oxygen therapy strategies in COVID-19 patients: Where are we going? Indian J Crit Care Med. 2020;24(10):897-898. doi:10.5005/jp-journals-10071-23625
5. Gonzalez-Castro A, Fajardo Campoverde A, Medina A, et al. Non-invasive mechanical ventilation and high-flow oxygen therapy in the COVID-19 pandemic: the value of a draw. Med Intensiva (Engl Ed). 2021;45(5):320-321. doi:10.1016/j.medine.2021.04.001
6. Pan W, Li J, Ou Y, et al. Clinical outcome of standardized oxygen therapy nursing strategy in COVID-19. Ann Palliat Med. 2020;9(4):2171-2177. doi:10.21037/apm-20-1272
7. Richardson S, Hirsch JS, Narasimhan M, et al. Presenting characteristics, comorbidities, and outcomes among 5700 patients hospitalized with COVID-19 in the New York City area. JAMA. 2020;323(20):2052-2059. doi:10.1001/jama.2020.6775
8. He G, Han Y, Fang Q, et al. Clinical experience of high-flow nasal cannula oxygen therapy in severe COVID-19 patients. Article in Chinese. Zhejiang Da Xue Xue Bao Yi Xue Ban. 2020;49(2):232-239. doi:10.3785/j.issn.1008-9292.2020.03.13
9. Lalla U, Allwood BW, Louw EH, et al. The utility of high-flow nasal cannula oxygen therapy in the management of respiratory failure secondary to COVID-19 pneumonia. S Afr Med J. 2020;110(6):12941.
10. Zhang TT, Dai B, Wang W. Should the high-flow nasal oxygen therapy be used or avoided in COVID-19? J Transl Int Med. 2020;8(2):57-58. doi:10.2478/jtim-2020-0018
11. Agarwal A, Basmaji J, Muttalib F, et al. High-flow nasal cannula for acute hypoxemic respiratory failure in patients with COVID-19: systematic reviews of effectiveness and its risks of aerosolization, dispersion, and infection transmission. Can J Anaesth. 2020;67(9):1217-1248. doi:10.1007/s12630-020-01740-2
12. Geng S, Mei Q, Zhu C, et al. High flow nasal cannula is a good treatment option for COVID-19. Heart Lung. 2020;49(5):444-445. doi:10.1016/j.hrtlng.2020.03.018
13. Feinstein MM, Niforatos JD, Hyun I, et al. Considerations for ventilator triage during the COVID-19 pandemic. Lancet Respir Med. 2020;8(6):e53. doi:10.1016/S2213-2600(20)30192-2
14. Wu Z, McGoogan JM. Characteristics of and important lessons from the coronavirus disease 2019 (COVID-19) outbreak in China: summary of a report of 72314 cases from the Chinese Center for Disease Control and Prevention. JAMA. 2020;323(13):1239-1242. doi:10.1001/jama.2020.2648
15. Rojas-Marte G, Hashmi AT, Khalid M, et al. Outcomes in patients with COVID-19 disease and high oxygen requirements. J Clin Med Res. 2021;13(1):26-37. doi:10.14740/jocmr4405
16. Zhang R, Mylonakis E. In inpatients with COVID-19, none of remdesivir, hydroxychloroquine, lopinavir, or interferon β-1a differed from standard care for in-hospital mortality. Ann Intern Med. 2021;174(2):JC17. doi:10.7326/ACPJ202102160-017
17. Rello J, Waterer GW, Bourdiol A, Roquilly A. COVID-19, steroids and other immunomodulators: The jigsaw is not complete. Anaesth Crit Care Pain Med. 2020;39(6):699-701. doi:10.1016/j.accpm.2020.10.011
18. Dargin J, Stempek S, Lei Y, Gray Jr. A, Liesching T. The effect of a tiered provider staffing model on patient outcomes during the coronavirus disease 2019 pandemic: A single-center observational study. Int J Crit Illn Inj Sci. 2021;11(3). doi:10.4103/ijciis.ijciis_37_21
19. Ni YN, Wang T, Liang BM, Liang ZA. The independent factors associated with oxygen therapy in COVID-19 patients under 65 years old. PLoS One. 2021;16(1):e0245690. doi:10.1371/journal.pone.0245690
20. Alhazzani W, Moller MH, Arabi YM, et al. Surviving Sepsis Campaign: guidelines on the management of critically ill adults with coronavirus disease 2019 (COVID-19). Crit Care Med. 2020;48(6):e440-e469. doi:10.1097/CCM.0000000000004363
21. Wang D, Hu B, Hu C, et al. Clinical characteristics of 138 hospitalized patients with 2019 novel coronavirus-infected pneumonia in Wuhan, China. JAMA. 2020;323(11):1061-1069. doi:10.1001/jama.2020.1585
22. Zhou F, Yu T, Du R, et al. Clinical course and risk factors for mortality of adult inpatients with COVID-19 in Wuhan, China: a retrospective cohort study. Lancet. 2020;395(10229):1054-1062. doi:10.1016/S0140-6736(20)30566-3
23. Argenziano MG, Bruce SL, Slater CL, et al. Characterization and clinical course of 1000 patients with coronavirus disease 2019 in New York: retrospective case series. BMJ. 2020;369:m1996. doi:10.1136/bmj.m1996
24. Cummings MJ, Baldwin MR, Abrams D, et al. Epidemiology, clinical course, and outcomes of critically ill adults with COVID-19 in New York City: a prospective cohort study. Lancet. 2020;395(10239):1763-1770. doi:10.1016/S0140-6736(20)31189-2
25. Demoule A, Vieillard Baron A, Darmon M, et al. High-flow nasal cannula in critically ill patients with severe COVID-19. Am J Respir Crit Care Med. 2020;202(7):1039-1042. doi:10.1164/rccm.202005-2007LE
26. Hansen CK, Stempek S, Liesching T, Lei Y, Dargin J. Characteristics and outcomes of patients receiving high flow nasal cannula therapy prior to mechanical ventilation in COVID-19 respiratory failure: a prospective observational study. Int J Crit Illn Inj Sci. 2021;11(2):56-60. doi:10.4103/IJCIIS.IJCIIS_181_20
27. van Gerwen M, Alsen M, Little C, et al. Risk factors and outcomes of COVID-19 in New York City; a retrospective cohort study. J Med Virol. 2021;93(2):907-915. doi:10.1002/jmv.26337
28. Hussain Alsayed HA, Saheb Sharif-Askari F, Saheb Sharif-Askari N, Hussain AAS, Hamid Q, Halwani R. Early administration of remdesivir to COVID-19 patients associates with higher recovery rate and lower need for ICU admission: A retrospective cohort study. PLoS One. 2021;16(10):e0258643. doi:10.1371/journal.pone.0258643
29. RECOVERY Collaborative Group, Horby P, Lim WS, et al. Dexamethasone in hospitalized patients with Covid-19. N Engl J Med. 2021;384(8):693-704. doi:10.1056/NEJMoa2021436
30. Rees EM, Nightingale ES, Jafari Y, et al. COVID-19 length of hospital stay: a systematic review and data synthesis. BMC Med. 2020;18(1):270. doi:10.1186/s12916-020-01726-3
31. Anderson M, Bach P, Baldwin MR. Hospital length of stay for severe COVID-19: implications for Remdesivir’s value. medRxiv. 2020;2020.08.10.20171637. doi:10.1101/2020.08.10.20171637
From Lahey Hospital and Medical Center, Burlington, MA (Drs. Liesching and Lei), and Tufts University School of Medicine, Boston, MA (Dr. Liesching)
ABSTRACT
Objective: To compare the utilization of oxygen therapies and clinical outcomes of patients admitted for COVID-19 during the second surge of the pandemic to that of patients admitted during the first surge.
Design: Observational study using a registry database.
Setting: Three hospitals (791 inpatient beds and 76 intensive care unit [ICU] beds) within the Beth Israel Lahey Health system in Massachusetts.
Participants: We included 3183 patients with COVID-19 admitted to hospitals.
Measurements: Baseline data included demographics and comorbidities. Treatments included low-flow supplemental oxygen (2-6 L/min), high-flow oxygen via nasal cannula, and invasive mechanical ventilation. Outcomes included ICU admission, length of stay, ventilator days, and mortality.
Results: A total of 3183 patients were included: 1586 during the first surge and 1597 during the second surge. Compared to the first surge, patients admitted during the second surge had a similar rate of receiving low-flow supplemental oxygen (65.8% vs 64.1%, P = .3), a higher rate of receiving high-flow nasal cannula (15.4% vs 10.8%, P = .0001), and a lower ventilation rate (5.6% vs 9.7%, P < .0001). The outcomes during the second surge were better than those during the first surge: lower ICU admission rate (8.1% vs 12.7%, P < .0001), shorter length of hospital stay (5 vs 6 days, P < .0001), fewer ventilator days (10 vs 16, P = .01), and lower mortality (8.3% vs 19.2%, P < .0001). Among ventilated patients, those who received high-flow nasal cannula had lower mortality.
Conclusion: Compared to the first surge of the COVID-19 pandemic, patients admitted during the second surge had similar likelihood of receiving low-flow supplemental oxygen, were more likely to receive high-flow nasal cannula, were less likely to be ventilated, and had better outcomes.
Keywords: supplemental oxygen, high-flow nasal cannula, ventilator.
The respiratory system receives the major impact of SARS-CoV-2 virus, and hypoxemia has been the predominant diagnosis for patients hospitalized with COVID-19.1,2 During the initial stage of the pandemic, oxygen therapies and mechanical ventilation were the only choices for these patients.3-6 Standard-of-care treatment for patients with COVID-19 during the initial surge included oxygen therapies and mechanical ventilation for hypoxemia and medications for comorbidities and COVID-19–associated sequelae, such as multi-organ dysfunction and failure. A report from New York during the first surge (May 2020) showed that among 5700 hospitalized patients with COVID-19, 27.8% received supplemental oxygen and 12.2% received invasive mechanical ventilation.7 High-flow nasal cannula (HFNC) oxygen delivery has been utilized widely throughout the pandemic due to its superiority over other noninvasive respiratory support techniques.8-12 Mechanical ventilation is always necessary for critically ill patients with acute respiratory distress syndrome. However, ventilator scarcity has become a bottleneck in caring for severely ill patients with COVID-19 during the pandemic.13
The clinical outcomes of hospitalized COVID-19 patients include a high intubation rate, long length of hospital and intensive care unit (ICU) stay, and high mortality.14,15 As the pandemic evolved, new medications, including remdesivir, hydroxychloroquine, lopinavir, or interferon β-1a, were used in addition to the standard of care, but these did not result in significantly different mortality from standard of care.16 Steroids are becoming foundational to the treatment of severe COVID-19 pneumonia, but evidence from high-quality randomized controlled clinical trials is lacking.17
During the first surge from March to May 2020, Massachusetts had the third highest number of COVID-19 cases among states in the United States.18 In early 2021, COVID-19 cases were climbing close to the peak of the second surge in Massachusetts. In this study, we compared utilization of low-flow supplemental oxygen, HFNC, and mechanical ventilation and clinical outcomes of patients admitted to 3 hospitals in Massachusetts during the second surge of the pandemic to that of patients admitted during the first surge.
Methods
Setting
Beth Israel Lahey Health is a system of academic and teaching hospitals with primary care and specialty care providers. We included 3 centers within the Beth Israel Lahey Health system in Massachusetts: Lahey Hospital and Medical Center, with 335 inpatient hospital beds and 52 critical care beds; Beverly Hospital, with 227 beds and 14 critical care beds; and Winchester Hospital, with 229 beds and 10 ICU beds.
Participants
We included patients admitted to the 3 hospitals with COVID-19 as a primary or secondary diagnosis during the first surge of the pandemic (March 1, 2020 to June 15, 2020) and the second surge (November 15, 2020 to January 27, 2021). The timeframe of the first surge was defined as the window between the start date and the end date of data collection. During the time window of the first surge, 1586 patients were included. The start time of the second surge was defined as the date when the data collection was restarted; the end date was set when the number of patients (1597) accumulated was close to the number of patients in the first surge (1586), so that the two groups had similar sample size.
Study Design
A data registry of COVID-19 patients was created by our institution, and the data were prospectively collected starting in March 2020. We retrospectively extracted data on the following from the registry database for this observational study: demographics and baseline comorbidities; the use of low-flow supplemental oxygen, HFNC, and invasive mechanical ventilator; and ICU admission, length of hospital stay, length of ICU stay, and hospital discharge disposition. Start and end times for each oxygen therapy were not entered in the registry. Data about other oxygen therapies, such as noninvasive positive-pressure ventilation, were not collected in the registry database, and therefore were not included in the analysis.
Statistical Analysis
Continuous variables (eg, age) were tested for data distribution normality using the Shapiro-Wilk test. Normally distributed data were tested using unpaired t-tests and displayed as mean (SD). The skewed data were tested using the Wilcoxon rank sum test and displayed as median (interquartile range [IQR]). The categorical variables were compared using chi-square test. Comparisons with P ≤ .05 were considered significantly different. Statistical analysis for this study was generated using Statistical Analysis Software (SAS), version 9.4 for Windows (SAS Institute Inc.).
Results
Baseline Characteristics
We included 3183 patients: 1586 admitted during the first surge and 1597 admitted during the second surge. Baseline characteristics of patients with COVID-19 admitted during the first and second surges are shown in Table 1. Patients admitted during the second surge were older (73 years vs 71 years, P = .01) and had higher rates of hypertension (64.8% vs 59.6%, P = .003) and asthma (12.9% vs 10.7%, P = .049) but a lower rate of interstitial lung disease (3.3% vs 7.7%, P < .001). Sequential organ failure assessment scores at admission and the rates of other comorbidities were not significantly different between the 2 surges.
Oxygen Therapies
The number of patients who were hospitalized and received low-flow supplemental oxygen, and/or HFNC, and/or ventilator in the first surge and the second surge is shown in the Figure. Of all patients included, 2067 (64.9%) received low-flow supplemental oxygen; of these, 374 (18.1%) subsequently received HFNC, and 85 (22.7%) of these subsequently received mechanical ventilation. Of all 3183 patients, 417 (13.1%) received HFNC; 43 of these patients received HFNC without receiving low-flow supplemental oxygen, and 98 (23.5%) subsequently received mechanical ventilation. Out of all 3183 patients, 244 (7.7%) received mechanical ventilation; 98 (40.2%) of these received HFNC while the remaining 146 (59.8%) did not. At the beginning of the first surge, the ratio of patients who received invasive mechanical ventilation to patients who received HFNC was close to 1:1 (10/10); the ratio decreased to 6:10 in May and June 2020. At the beginning of the second surge, the ratio was 8:10 and then decreased to 3:10 in December 2020 and January 2021.
As shown in Table 2, the proportion of patients who received low-flow supplemental oxygen during the second surge was similar to that during the first surge (65.8% vs 64.1%, P = .3). Patients admitted during the second surge were more likely to receive HFNC than patients admitted during the first surge (15.4% vs 10.8%, P = .0001). Patients admitted during the second surge were less likely to be ventilated than the patients admitted during the first surge (5.6% vs 9.7%, P < .0001).
Clinical Outcomes
As shown in Table 3, second surge outcomes were much better than first surge outcomes: the ICU admission rate was lower (8.1% vs 12.7%, P < .0001); patients were more likely to be discharged to home (60.2% vs 47.4%, P < .0001), had a shorter length of hospital stay (5 vs 6 days, P < .0001), and had fewer ventilator days (10 vs 16, P = .01); and mortality was lower (8.3% vs 19.2%, P < .0001). There was a trend that length of ICU stay was shorter during the second surge than during the first surge (7 days vs 9 days, P = .09).
As noted (Figure), the ratio of patients who received invasive mechanical ventilation to patients who received HFNC was decreasing during both the first surge and the second surge. To further analyze the relation between ventilator and HFNC, we performed a subgroup analysis for 244 ventilated patients during both surges to compare outcomes between patients who received HFNC and those who did not receive HFNC (Table 4). Ninety-eight (40%) patients received HFNC. Ventilated patients who received HFNC had lower mortality than those patients who did not receive HFNC (31.6% vs 48%, P = .01), but had a longer length of hospital stay (29 days vs 14 days, P < .0001), longer length of ICU stay (17 days vs 9 days, P < .0001), and a higher number of ventilator days (16 vs 11, P = .001).
Discussion
Our study compared the baseline patient characteristics; utilization of low-flow supplemental oxygen therapy, HFNC, and mechanical ventilation; and clinical outcomes between the first surge (n = 1586) and the second surge (n = 1597) of the COVID-19 pandemic. During both surges, about two-thirds of admitted patients received low-flow supplemental oxygen. A higher proportion of the admitted patients received HFNC during the second surge than during the first surge, while the intubation rate was lower during the second surge than during the first surge.
Reported low-flow supplemental oxygen use ranged from 28% to 63% depending on the cohort characteristics and location during the first surge.6,7,19 A report from New York during the first surge (March 1 to April 4, 2020) showed that among 5700 hospitalized patients with COVID-19, 27.8% received low-flow supplemental oxygen.7 HFNC is recommended in guidelines on management of patients with acute respiratory failure due to COVID-19.20 In our study, HFNC was utilized in a higher proportion of patients admitted for COVID-19 during the second surge (15.5% vs 10.8%, P = .0001). During the early pandemic period in Wuhan, China, 11% to 21% of admitted COVID-19 patients received HFNC.21,22 Utilization of HFNC in New York during the first surge (March to May 2020) varied from 5% to 14.3% of patients admitted with COVID-19.23,24 Our subgroup analysis of the ventilated patients showed that patients who received HFNC had lower mortality than those who did not (31.6% vs 48.0%, P = .011). Comparably, a report from Paris, France, showed that among patients admitted to ICUs for acute hypoxemic respiratory failure, those who received HFNC had lower mortality at day 60 than those who did not (21% vs 31%, P = .052).25 Our recent analysis showed that patients treated with HFNC prior to mechanical ventilation had lower mortality than those treated with only conventional oxygen (30% vs 52%, P = .05).26 In this subgroup analysis, we could not determine if HFNC treatment was administered before or after ventilation because HFNC was entered as dichotomous data (“Yes” or “No”) in the registry database. We merely showed the beneficial effect of HFNC on reducing mortality for ventilated COVID-19 patients, but did not mean to focus on how and when to apply HFNC.
We observed that the patients admitted during the second surge were less likely to be ventilated than the patients admitted during the first surge (5.6% vs 9.7%, P < .0001). During the first surge in New York, among 5700 patients admitted with COVID-19, 12.2% received invasive mechanical ventilation.7 In another report, also from New York during the first surge, 26.1% of 2015 hospitalized COVID-19 patients received mechanical ventilation.27 In our study, the ventilation rate of 9.7% during the first surge was lower.
Outcomes during the second surge were better than during the first surge, including ICU admission rate, hospital and ICU length of stay, ventilator days, and mortality. The mortality was 19.2% during the first surge vs 8.3% during the second surge (P < .0001). The mortality of 19.2% was lower than the 30.6% mortality reported for 2015 hospitalized COVID-19 patients in New York during the first surge.27 A retrospective study showed that early administration of remdesivir was associated with reduced ICU admission, ventilation use, and mortality.28 The RECOVERY clinical trial showed that dexamethasone improved mortality for COVID-19 patients who received respiratory support, but not for patients who did not receive any respiratory support.29 Perhaps some, if not all, of the improvement in ICU admission and mortality during the second surge was attributed to the new medications, such as antivirals and steroids.
The length of hospital stay for patients with moderate to severe COVID-19 varied from 4 to 53 days at different locations of the world, as shown in a meta-analysis by Rees and colleagues.30 Our results showing a length of stay of 6 days during the first surge and 5 days during the second surge fell into the shorter end of this range. In a retrospective analysis of 1643 adults with severe COVID-19 admitted to hospitals in New York City between March 9, 2020 and April 23, 2020, median hospital length of stay was 7 (IQR, 3-14) days.31 For the ventilated patients in our study, the length of stay of 14 days (did not receive HFNC) and 29 days (received HFNC) was much longer. This longer length of stay might be attributed to the patients in our study being older and having more severe comorbidities.
The main purpose of this study was to compare the oxygen therapies and outcomes between 2 surges. It is difficult to associate the clinical outcomes with the oxygen therapies because new therapies and medications were available after the first surge. It was not possible to adjust the outcomes with confounders (other therapies and medications) because the registry data did not include the new therapies and medications.
A strength of this study was that we included a large, balanced number of patients in the first surge and the second surge. We did not plan the sample size in both groups as we could not predict the number of admissions. We set the end date of data collection for analysis as the time when the number of patients admitted during the second surge was similar to the number of patients admitted during the first surge. A limitation was that the registry database was created by the institution and was not designed solely for this study. The data for oxygen therapies were limited to low-flow supplemental oxygen, HFNC, and invasive mechanical ventilation; data for noninvasive ventilation were not included.
Conclusion
At our centers, during the second surge of COVID-19 pandemic, patients hospitalized with COVID-19 infection were more likely to receive HFNC but less likely to be ventilated. Compared to the first surge, the hospitalized patients with COVID-19 infection had a lower ICU admission rate, shorter length of hospital stay, fewer ventilator days, and lower mortality. For ventilated patients, those who received HFNC had lower mortality than those who did not.
Corresponding author: Timothy N. Liesching, MD, 41 Mall Road, Burlington, MA 01805; [email protected]
Disclosures: None reported.
doi:10.12788/jcom.0086
1. Xie J, Covassin N, Fan Z, et al. Association between hypoxemia and mortality in patients with COVID-19. Mayo Clin Proc. 2020;95(6):1138-1147. doi:10.1016/j.mayocp.2020.04.006
2. Asleh R, Asher E, Yagel O, et al. Predictors of hypoxemia and related adverse outcomes in patients hospitalized with COVID-19: a double-center retrospective study. J Clin Med. 2021;10(16):3581. doi:10.3390/jcm10163581
3. Choi KJ, Hong HL, Kim EJ. Association between oxygen saturation/fraction of inhaled oxygen and mortality in patients with COVID-19 associated pneumonia requiring oxygen therapy. Tuberc Respir Dis (Seoul). 2021;84(2):125-133. doi:10.4046/trd.2020.0126
4. Dixit SB. Role of noninvasive oxygen therapy strategies in COVID-19 patients: Where are we going? Indian J Crit Care Med. 2020;24(10):897-898. doi:10.5005/jp-journals-10071-23625
5. Gonzalez-Castro A, Fajardo Campoverde A, Medina A, et al. Non-invasive mechanical ventilation and high-flow oxygen therapy in the COVID-19 pandemic: the value of a draw. Med Intensiva (Engl Ed). 2021;45(5):320-321. doi:10.1016/j.medine.2021.04.001
6. Pan W, Li J, Ou Y, et al. Clinical outcome of standardized oxygen therapy nursing strategy in COVID-19. Ann Palliat Med. 2020;9(4):2171-2177. doi:10.21037/apm-20-1272
7. Richardson S, Hirsch JS, Narasimhan M, et al. Presenting characteristics, comorbidities, and outcomes among 5700 patients hospitalized with COVID-19 in the New York City area. JAMA. 2020;323(20):2052-2059. doi:10.1001/jama.2020.6775
8. He G, Han Y, Fang Q, et al. Clinical experience of high-flow nasal cannula oxygen therapy in severe COVID-19 patients. Article in Chinese. Zhejiang Da Xue Xue Bao Yi Xue Ban. 2020;49(2):232-239. doi:10.3785/j.issn.1008-9292.2020.03.13
9. Lalla U, Allwood BW, Louw EH, et al. The utility of high-flow nasal cannula oxygen therapy in the management of respiratory failure secondary to COVID-19 pneumonia. S Afr Med J. 2020;110(6):12941.
10. Zhang TT, Dai B, Wang W. Should the high-flow nasal oxygen therapy be used or avoided in COVID-19? J Transl Int Med. 2020;8(2):57-58. doi:10.2478/jtim-2020-0018
11. Agarwal A, Basmaji J, Muttalib F, et al. High-flow nasal cannula for acute hypoxemic respiratory failure in patients with COVID-19: systematic reviews of effectiveness and its risks of aerosolization, dispersion, and infection transmission. Can J Anaesth. 2020;67(9):1217-1248. doi:10.1007/s12630-020-01740-2
12. Geng S, Mei Q, Zhu C, et al. High flow nasal cannula is a good treatment option for COVID-19. Heart Lung. 2020;49(5):444-445. doi:10.1016/j.hrtlng.2020.03.018
13. Feinstein MM, Niforatos JD, Hyun I, et al. Considerations for ventilator triage during the COVID-19 pandemic. Lancet Respir Med. 2020;8(6):e53. doi:10.1016/S2213-2600(20)30192-2
14. Wu Z, McGoogan JM. Characteristics of and important lessons from the coronavirus disease 2019 (COVID-19) outbreak in China: summary of a report of 72314 cases from the Chinese Center for Disease Control and Prevention. JAMA. 2020;323(13):1239-1242. doi:10.1001/jama.2020.2648
15. Rojas-Marte G, Hashmi AT, Khalid M, et al. Outcomes in patients with COVID-19 disease and high oxygen requirements. J Clin Med Res. 2021;13(1):26-37. doi:10.14740/jocmr4405
16. Zhang R, Mylonakis E. In inpatients with COVID-19, none of remdesivir, hydroxychloroquine, lopinavir, or interferon β-1a differed from standard care for in-hospital mortality. Ann Intern Med. 2021;174(2):JC17. doi:10.7326/ACPJ202102160-017
17. Rello J, Waterer GW, Bourdiol A, Roquilly A. COVID-19, steroids and other immunomodulators: The jigsaw is not complete. Anaesth Crit Care Pain Med. 2020;39(6):699-701. doi:10.1016/j.accpm.2020.10.011
18. Dargin J, Stempek S, Lei Y, Gray Jr. A, Liesching T. The effect of a tiered provider staffing model on patient outcomes during the coronavirus disease 2019 pandemic: A single-center observational study. Int J Crit Illn Inj Sci. 2021;11(3). doi:10.4103/ijciis.ijciis_37_21
19. Ni YN, Wang T, Liang BM, Liang ZA. The independent factors associated with oxygen therapy in COVID-19 patients under 65 years old. PLoS One. 2021;16(1):e0245690. doi:10.1371/journal.pone.0245690
20. Alhazzani W, Moller MH, Arabi YM, et al. Surviving Sepsis Campaign: guidelines on the management of critically ill adults with coronavirus disease 2019 (COVID-19). Crit Care Med. 2020;48(6):e440-e469. doi:10.1097/CCM.0000000000004363
21. Wang D, Hu B, Hu C, et al. Clinical characteristics of 138 hospitalized patients with 2019 novel coronavirus-infected pneumonia in Wuhan, China. JAMA. 2020;323(11):1061-1069. doi:10.1001/jama.2020.1585
22. Zhou F, Yu T, Du R, et al. Clinical course and risk factors for mortality of adult inpatients with COVID-19 in Wuhan, China: a retrospective cohort study. Lancet. 2020;395(10229):1054-1062. doi:10.1016/S0140-6736(20)30566-3
23. Argenziano MG, Bruce SL, Slater CL, et al. Characterization and clinical course of 1000 patients with coronavirus disease 2019 in New York: retrospective case series. BMJ. 2020;369:m1996. doi:10.1136/bmj.m1996
24. Cummings MJ, Baldwin MR, Abrams D, et al. Epidemiology, clinical course, and outcomes of critically ill adults with COVID-19 in New York City: a prospective cohort study. Lancet. 2020;395(10239):1763-1770. doi:10.1016/S0140-6736(20)31189-2
25. Demoule A, Vieillard Baron A, Darmon M, et al. High-flow nasal cannula in critically ill patients with severe COVID-19. Am J Respir Crit Care Med. 2020;202(7):1039-1042. doi:10.1164/rccm.202005-2007LE
26. Hansen CK, Stempek S, Liesching T, Lei Y, Dargin J. Characteristics and outcomes of patients receiving high flow nasal cannula therapy prior to mechanical ventilation in COVID-19 respiratory failure: a prospective observational study. Int J Crit Illn Inj Sci. 2021;11(2):56-60. doi:10.4103/IJCIIS.IJCIIS_181_20
27. van Gerwen M, Alsen M, Little C, et al. Risk factors and outcomes of COVID-19 in New York City; a retrospective cohort study. J Med Virol. 2021;93(2):907-915. doi:10.1002/jmv.26337
28. Hussain Alsayed HA, Saheb Sharif-Askari F, Saheb Sharif-Askari N, Hussain AAS, Hamid Q, Halwani R. Early administration of remdesivir to COVID-19 patients associates with higher recovery rate and lower need for ICU admission: A retrospective cohort study. PLoS One. 2021;16(10):e0258643. doi:10.1371/journal.pone.0258643
29. RECOVERY Collaborative Group, Horby P, Lim WS, et al. Dexamethasone in hospitalized patients with Covid-19. N Engl J Med. 2021;384(8):693-704. doi:10.1056/NEJMoa2021436
30. Rees EM, Nightingale ES, Jafari Y, et al. COVID-19 length of hospital stay: a systematic review and data synthesis. BMC Med. 2020;18(1):270. doi:10.1186/s12916-020-01726-3
31. Anderson M, Bach P, Baldwin MR. Hospital length of stay for severe COVID-19: implications for Remdesivir’s value. medRxiv. 2020;2020.08.10.20171637. doi:10.1101/2020.08.10.20171637
Get the science right
Get the science right. I have spent years researching and reflecting on what makes the best physicians, the best medicine, the optimal organized medical system, and the best medical ethics and law to support all of it. I have traveled to almost innumerable conferences to discuss these topics with colleagues who have similar goals. Time and time again, I come back to the conclusion that, in the modern era, the second-most important thing to do is to get the science right.
The practice of medicine in my Western world can be traced back to Hippocrates and earlier. The practice of nursing has other milestones. The healing arts have different points of origin in other cultures, such as China. In a modern world of mass communication, these various historical paths are converging on scientific evidence. The science to support medicine has always had flaws, but it has fared better than the other options. Sometimes, the science was so sketchy that the key was to believe in whatever the shaman was providing. But for the past 100 years, science, rather than tradition and hierarchy, has been relied upon to guide policy and action. For the past 50 years, evidence-based medicine has ascended. Have we become better than the snake oil salesmen of the late 19th century?

Modern health care is far from perfect. The pandemic has been a major stressor to the health care system. The pandemic has revealed flaws and weaknesses, including inequity in access to care, health illiteracy, and a shaky moral compass balancing individual liberty and social good. Overall, despite multiple mistakes dealing with a novel threat, I think the institutions promoting science have performed well during the pandemic, especially when compared with the moral and governmental institutions encouraging ethical behavior and making policies to promote justice.
My highest praise would be for the professionalism of health care workers. Nurses and physicians have staffed the hospitals and clinics caring for people when the hallways were overflowing for days without end. Without the commitment, the teamwork, and the courage to provide that care, the death toll would have been much higher and the suffering unimaginable. My observation is that these people were not motivated by an abstract primum non nocere, first do no harm. It was the commitment to love one’s neighbor and care for the sick. This dedication is the first most important thing in professionalism.
Part of what fuels that commitment is a belief that what they are doing makes a difference. The belief is stronger when there is measurable, scientific evidence that a difference is being made. The scientific decisions have not been perfect, but at this point the evidence is clear that the shutdown flattened the curve. Vaccines saved lives and will continue to do so. Masks saved lives. Nursing care, particularly intensive care, reduced the case fatality rate and assuaged suffering and grief.
What lessons about training new providers can be gleaned from the past 2 years? Those who teach professionalism for physicians, nurses, and other health care workers should strengthen the common value systems that undergird the commitment people have to the patients and the professions. In the face of postmodern nihilism and relativism, virtues need to be clarified and reinforced. In the face of political polarization which seeks to make a political affiliation the locus of loyalty and commitment, emphasize the fellowship of the health care professions.
To me as a scientist, a key lesson is that we need to be better at getting the science right. Two years ago I was wiping some groceries with alcohol and quarantining cans in shopping bags in the corner of the kitchen for 24 hours before shelving them. I still push elevator buttons with my knuckles. The Centers for Disease Control and Prevention needs to revamp their policy making procedures.
Institutions must work to reestablish the public trust in science. That is a challenge because while many amazing scientific advances have occurred (i.e., my MRI last week showed far more going on than my orthopedist and physical therapist detected based on clinical exam). Imaging such as MR and ultrasound have been major advances in diagnostic medicine, but there are also repeated examples demonstrating where medicine has been wrong. In the past 6 months I have read new guidelines for ear tubes, for neonatal jaundice, for newborn sepsis, and for newborn hypoglycemia. All indicate to me that my training 30 years ago was on target and the interval “improvements” in practice have been worthless Brownian motion based on false scientific discoveries. My recommendation would be that pediatrics do one-third as much research but do that research three times better and get it right.
Dr. Powell is a retired pediatric hospitalist and clinical ethics consultant living in St. Louis. Email him at [email protected].
Get the science right. I have spent years researching and reflecting on what makes the best physicians, the best medicine, the optimal organized medical system, and the best medical ethics and law to support all of it. I have traveled to almost innumerable conferences to discuss these topics with colleagues who have similar goals. Time and time again, I come back to the conclusion that, in the modern era, the second-most important thing to do is to get the science right.
The practice of medicine in my Western world can be traced back to Hippocrates and earlier. The practice of nursing has other milestones. The healing arts have different points of origin in other cultures, such as China. In a modern world of mass communication, these various historical paths are converging on scientific evidence. The science to support medicine has always had flaws, but it has fared better than the other options. Sometimes, the science was so sketchy that the key was to believe in whatever the shaman was providing. But for the past 100 years, science, rather than tradition and hierarchy, has been relied upon to guide policy and action. For the past 50 years, evidence-based medicine has ascended. Have we become better than the snake oil salesmen of the late 19th century?
Modern health care is far from perfect. The pandemic has been a major stressor to the health care system. The pandemic has revealed flaws and weaknesses, including inequity in access to care, health illiteracy, and a shaky moral compass balancing individual liberty and social good. Overall, despite multiple mistakes dealing with a novel threat, I think the institutions promoting science have performed well during the pandemic, especially when compared with the moral and governmental institutions encouraging ethical behavior and making policies to promote justice.
My highest praise would be for the professionalism of health care workers. Nurses and physicians have staffed the hospitals and clinics caring for people when the hallways were overflowing for days without end. Without the commitment, the teamwork, and the courage to provide that care, the death toll would have been much higher and the suffering unimaginable. My observation is that these people were not motivated by an abstract primum non nocere, first do no harm. It was the commitment to love one’s neighbor and care for the sick. This dedication is the first most important thing in professionalism.
Part of what fuels that commitment is a belief that what they are doing makes a difference. The belief is stronger when there is measurable, scientific evidence that a difference is being made. The scientific decisions have not been perfect, but at this point the evidence is clear that the shutdown flattened the curve. Vaccines saved lives and will continue to do so. Masks saved lives. Nursing care, particularly intensive care, reduced the case fatality rate and assuaged suffering and grief.
What lessons about training new providers can be gleaned from the past 2 years? Those who teach professionalism for physicians, nurses, and other health care workers should strengthen the common value systems that undergird the commitment people have to the patients and the professions. In the face of postmodern nihilism and relativism, virtues need to be clarified and reinforced. In the face of political polarization which seeks to make a political affiliation the locus of loyalty and commitment, emphasize the fellowship of the health care professions.
To me as a scientist, a key lesson is that we need to be better at getting the science right. Two years ago I was wiping some groceries with alcohol and quarantining cans in shopping bags in the corner of the kitchen for 24 hours before shelving them. I still push elevator buttons with my knuckles. The Centers for Disease Control and Prevention needs to revamp their policy making procedures.
Institutions must work to reestablish the public trust in science. That is a challenge because while many amazing scientific advances have occurred (i.e., my MRI last week showed far more going on than my orthopedist and physical therapist detected based on clinical exam). Imaging such as MR and ultrasound have been major advances in diagnostic medicine, but there are also repeated examples demonstrating where medicine has been wrong. In the past 6 months I have read new guidelines for ear tubes, for neonatal jaundice, for newborn sepsis, and for newborn hypoglycemia. All indicate to me that my training 30 years ago was on target and the interval “improvements” in practice have been worthless Brownian motion based on false scientific discoveries. My recommendation would be that pediatrics do one-third as much research but do that research three times better and get it right.
Dr. Powell is a retired pediatric hospitalist and clinical ethics consultant living in St. Louis. Email him at [email protected].
Purulent Nodule on the Mandible
The Diagnosis: Odontogenic Cutaneous Sinus Tract
In our patient, panoramic radiography showed a radiolucency in the periapex of the mandibular first molar (Figure 1). Ultrasonography depicted a hypoechoic band that originated from the cutaneous lesion and extended through the subcutaneous tissue to the defective alveolar bone, suggesting odontogenic inflammation (Figure 2).1 The infected pulp was removed, and the purulent nodules then disappeared.

The dental etiology of odontogenic cutaneous sinus tracts can be confirmed by panoramic radiography and ultrasonography. The odontogenic sinus path can be clearly observed via radiography by injecting or inserting a radiopaque substance into the sinus tract.2 Effective treatment of the diseased tooth is removal of the infected pulp, performance of a root canal to eliminate infection, closure and filling of the root canal, and repair of the crown. Once the source of infection is eliminated, the sinus typically subsides within 2 weeks. When residual skin retreats or scars are present, cosmetic surgery can be performed to improve the appearance.3,4

Odontogenic cutaneous sinus tracts usually are caused by a route of drainage from a chronic apical abscess. They follow a path of least resistance through the alveolar bone and periosteum, spreading into the surrounding soft tissues. With the formation of abscesses, sinus tracts will erupt intraorally or cutaneously, depending on the relationship of the posterior tooth apices to the mandibular attachments of the mylohyoid and buccinator muscles and the maxillary attachment of the buccinator.2,5 Clinically, cutaneous lesions present as nodules, cysts, or dimples that have attached to deep tissues through the sinus tract. Half of patients may have no dental symptoms and often are misdiagnosed with nonodontogenic lesions. Subsequent improper treatments, such as repeated use of antibiotics, multiple biopsies, surgical excision, and chemotherapy, often are repeated and ineffective.6 The most common cause of chronic cutaneous sinus tracts in the face and neck is a chronically draining dental infection.2,5 A thorough history is necessary when odontogenic cutaneous sinuses are suspected. Toothache before the development of the sinus tract is an important diagnostic clue.
Pyogenic granuloma, syringocystadenoma papilliferum, osteomyelitis, infected epidermoid cyst, actinomycoses, and salivary gland fistula also should be considered in the differential diagnosis.7-10 Pyogenic granuloma (also known as lobular capillary hemangioma) is a benign overgrowth of capillaries showing a vascular phenotype that usually occurs as a response to different stimulating factors such as local stimuli, trauma, or hormonal factors. Clinically, pyogenic granuloma presents as a red, solitary, painless nodule on the face or distal extremities.11,12 Syringocystadenoma papilliferum is a benign adnexal proliferation with apocrine differentiation that usually presents as a hairless papillomatous plaque or nodule measuring 1 to 4 cm in diameter and often is first noted at birth or during early childhood.7 Osteomyelitis is progressive inflammation of the periosteum and bone marrow that rapidly breaks through the periosteum and spreads to surrounding areas. The mandible is the most susceptible bone for facial osteomyelitis.8 Epidermoid cysts are formed by the proliferation of epidermal cells within a circumscribed dermal space. Infection of the cysts is characterized by redness, swelling, heat, and pain. As the infection progresses, suppurative inflammation develops, leading to local liquefaction and abscesses.9
This case was initially misdiagnosed as infectious skin lesions by outside clinicians. Multiple surgical treatments and long-term antibiotic therapy were attempted before the correct diagnosis was made. The clinical diagnosis of odontogenic cutaneous sinus tracts is challenging due to the variety of affected sites and clinical signs. Ultrasonography should be performed as early as possible to identify the disease and avoid unnecessary surgery. For appropriate dental therapy, close liaison with the stomatology department is warranted.
- Shobatake C, Miyagawa F, Fukumoto T, et al. Usefulness of ultrasonography for rapidly diagnosing cutaneous sinus tracts of dental origin. Eur J Dermatol. 2014;24:683-687.
- Cioffi GA, Terezhalmy GT, Parlette HL. Cutaneous draining sinus tract: an odontogenic etiology. J Am Acad Dermatol. 1986;14:94-100.
- McWalter GM, Alexander JB, del Rio CE, et al. Cutaneous sinus tracts of dental etiology. Oral Surg Oral Med Oral Pathol. 1988;66:608-614.
- Spear KL, Sheridan PJ, Perry HO. Sinus tracts to the chin and jaw of dental origin. J Am Acad Dermatol. 1983;8:486-492.
- Lewin-Epstein J, Taicher S, Azaz B. Cutaneous sinus tracts of dental origin. Arch Dermatol. 1978;114:1158-1161.
- Mittal N, Gupta P. Management of extraoral sinus cases: a clinical dilemma. J Endod. 2004;30:541-547.
- Alegria-Landa V, Jo-Velasco M, Santonja C, et al. Syringocystadenoma papilliferum associated with verrucous carcinoma of the skin in the same lesion: report of four cases. J Cutan Pathol. 2020;47:12-16.
- Prasad KC, Prasad SC, Mouli N, et al. Osteomyelitis in the head and neck. Acta Otolaryngol. 2007;127:194-205.
- Hong SH, Chung HW, Choi JY, et al. MRI findings of subcutaneous epidermal cysts: emphasis on the presence of rupture. AJR Am J Roentgenol. 2006;186:961-966.
- Gefrerer L, Popowski W, Perek JN, et al. Recurrent pyogenic granuloma around dental implants: a rare case report. Int J Periodontics Restorative Dent. 2016;36:573-581.
- Chae JB, Park JT, Kim BR, et al. Agminated eruptive pyogenic granuloma on chin following redundant needle injections. J Dermatol. 2016;43:577-578.
- Thompson LD. Lobular capillary hemangioma (pyogenic granuloma) of the oral cavity. Ear Nose Throat J. 2017;96:240.
The Diagnosis: Odontogenic Cutaneous Sinus Tract
In our patient, panoramic radiography showed a radiolucency in the periapex of the mandibular first molar (Figure 1). Ultrasonography depicted a hypoechoic band that originated from the cutaneous lesion and extended through the subcutaneous tissue to the defective alveolar bone, suggesting odontogenic inflammation (Figure 2).1 The infected pulp was removed, and the purulent nodules then disappeared.
The dental etiology of odontogenic cutaneous sinus tracts can be confirmed by panoramic radiography and ultrasonography. The odontogenic sinus path can be clearly observed via radiography by injecting or inserting a radiopaque substance into the sinus tract.2 Effective treatment of the diseased tooth is removal of the infected pulp, performance of a root canal to eliminate infection, closure and filling of the root canal, and repair of the crown. Once the source of infection is eliminated, the sinus typically subsides within 2 weeks. When residual skin retreats or scars are present, cosmetic surgery can be performed to improve the appearance.3,4
Odontogenic cutaneous sinus tracts usually are caused by a route of drainage from a chronic apical abscess. They follow a path of least resistance through the alveolar bone and periosteum, spreading into the surrounding soft tissues. With the formation of abscesses, sinus tracts will erupt intraorally or cutaneously, depending on the relationship of the posterior tooth apices to the mandibular attachments of the mylohyoid and buccinator muscles and the maxillary attachment of the buccinator.2,5 Clinically, cutaneous lesions present as nodules, cysts, or dimples that have attached to deep tissues through the sinus tract. Half of patients may have no dental symptoms and often are misdiagnosed with nonodontogenic lesions. Subsequent improper treatments, such as repeated use of antibiotics, multiple biopsies, surgical excision, and chemotherapy, often are repeated and ineffective.6 The most common cause of chronic cutaneous sinus tracts in the face and neck is a chronically draining dental infection.2,5 A thorough history is necessary when odontogenic cutaneous sinuses are suspected. Toothache before the development of the sinus tract is an important diagnostic clue.
Pyogenic granuloma, syringocystadenoma papilliferum, osteomyelitis, infected epidermoid cyst, actinomycoses, and salivary gland fistula also should be considered in the differential diagnosis.7-10 Pyogenic granuloma (also known as lobular capillary hemangioma) is a benign overgrowth of capillaries showing a vascular phenotype that usually occurs as a response to different stimulating factors such as local stimuli, trauma, or hormonal factors. Clinically, pyogenic granuloma presents as a red, solitary, painless nodule on the face or distal extremities.11,12 Syringocystadenoma papilliferum is a benign adnexal proliferation with apocrine differentiation that usually presents as a hairless papillomatous plaque or nodule measuring 1 to 4 cm in diameter and often is first noted at birth or during early childhood.7 Osteomyelitis is progressive inflammation of the periosteum and bone marrow that rapidly breaks through the periosteum and spreads to surrounding areas. The mandible is the most susceptible bone for facial osteomyelitis.8 Epidermoid cysts are formed by the proliferation of epidermal cells within a circumscribed dermal space. Infection of the cysts is characterized by redness, swelling, heat, and pain. As the infection progresses, suppurative inflammation develops, leading to local liquefaction and abscesses.9
This case was initially misdiagnosed as infectious skin lesions by outside clinicians. Multiple surgical treatments and long-term antibiotic therapy were attempted before the correct diagnosis was made. The clinical diagnosis of odontogenic cutaneous sinus tracts is challenging due to the variety of affected sites and clinical signs. Ultrasonography should be performed as early as possible to identify the disease and avoid unnecessary surgery. For appropriate dental therapy, close liaison with the stomatology department is warranted.
- Shobatake C, Miyagawa F, Fukumoto T, et al. Usefulness of ultrasonography for rapidly diagnosing cutaneous sinus tracts of dental origin. Eur J Dermatol. 2014;24:683-687.
- Cioffi GA, Terezhalmy GT, Parlette HL. Cutaneous draining sinus tract: an odontogenic etiology. J Am Acad Dermatol. 1986;14:94-100.
- McWalter GM, Alexander JB, del Rio CE, et al. Cutaneous sinus tracts of dental etiology. Oral Surg Oral Med Oral Pathol. 1988;66:608-614.
- Spear KL, Sheridan PJ, Perry HO. Sinus tracts to the chin and jaw of dental origin. J Am Acad Dermatol. 1983;8:486-492.
- Lewin-Epstein J, Taicher S, Azaz B. Cutaneous sinus tracts of dental origin. Arch Dermatol. 1978;114:1158-1161.
- Mittal N, Gupta P. Management of extraoral sinus cases: a clinical dilemma. J Endod. 2004;30:541-547.
- Alegria-Landa V, Jo-Velasco M, Santonja C, et al. Syringocystadenoma papilliferum associated with verrucous carcinoma of the skin in the same lesion: report of four cases. J Cutan Pathol. 2020;47:12-16.
- Prasad KC, Prasad SC, Mouli N, et al. Osteomyelitis in the head and neck. Acta Otolaryngol. 2007;127:194-205.
- Hong SH, Chung HW, Choi JY, et al. MRI findings of subcutaneous epidermal cysts: emphasis on the presence of rupture. AJR Am J Roentgenol. 2006;186:961-966.
- Gefrerer L, Popowski W, Perek JN, et al. Recurrent pyogenic granuloma around dental implants: a rare case report. Int J Periodontics Restorative Dent. 2016;36:573-581.
- Chae JB, Park JT, Kim BR, et al. Agminated eruptive pyogenic granuloma on chin following redundant needle injections. J Dermatol. 2016;43:577-578.
- Thompson LD. Lobular capillary hemangioma (pyogenic granuloma) of the oral cavity. Ear Nose Throat J. 2017;96:240.
A 27-year-old man presented with a recurrent nodule with purulent discharge on the mandible of 3 months’ duration. He underwent several surgical excisions before he was referred to our outpatient clinic, but each time the lesion recurred. The patient was otherwise healthy with no associated discomfort. He denied exposure to animals or ticks, and he did not have a family history of similar lesions. He had a root canal treatment several years prior to the current presentation. Physical examination revealed 2 contiguous nodules with purulent secretions on the left mandible.


Waiting for the under-5 COVID-19 vaccine
In February, citing the need for more data, Pfizer and BioNTech announced that they were delaying the application for their COVID-19 vaccine for children under the age of 5. Earlier evidence suggests that two doses may not provide adequate protection in the 2- to 4-year old age group. With the larger number of infections and illness in the younger age group from the Omicron variant, Pfizer and BioNTech felt they needed more data on the effectiveness of a third dose.
This delay came as a disappointment to parents of children under 5 who have been eager to have them receive the vaccination. However, Peter Marks, MD, director of the Center for Biologics Evaluation and Research at the Food and Drug Administration, told parents that this delay should be reassuring – that the companies were doing important due diligence before releasing a product that is both safe and effective. The American Academy of Pediatrics wisely released a similar statement of reassurance and support.

It is difficult to know how many parents will eventually immunize their young children once the vaccine is approved. Any survey done more than a few weeks ago must be viewed cautiously as “the COVID numbers” around the country continue to improve and parental attitudes are likely to change.
There will always remain subgroups of parents on either extreme of the bell-shaped curve. Some will reject the under-5 vaccine simply because it is a vaccine. Some parents are so anxious to vaccinate that they will want to be first in line even if waiting is the more prudent approach. In a recent opinion piece appearing in the New York Times, a statistician writes that he is so eager to have his young children immunized that he is encouraging the FDA to replace its traditional reliance on “statistical significance” with a less rigid and binary method such as one based on Bayesian theory (Aubrey Carlton, “I’m a parent and a statistician. There’s a smarter way to think about the under-5 vaccine.” The New York Times. 2022 Mar 1.). However, what this statistician misses in his haste to vaccinate his own children is that we are dealing with an entire population with varying levels of scientific sophistication and appetite for risk. While “statistical significance” may no longer be cutting edge to some statisticians, most of the rest of the country finds the term reassuring.
It will be interesting to see what happens if and when the vaccine is approved. Will the American Academy of Pediatrics come out with a strong recommendation? I hope they are careful and provide a sufficient number of caveats, otherwise we in the trenches will again be left to provide more nuanced advice to families who are both anxious and hesitant.
Despite the recent surge in cases among young children, apparently as a result of the Omicron variant, the disease continues to cause less and milder disease among young children than it does in adults. And the degree to which illness in the pediatric population contributes to the health of the general population appears to still be a matter of debate. This may be yet another instance of when the crafty COVID-19 has moved with a pace that will make an under–age-5 vaccine of relatively little value.
First, we must be careful to assure ourselves that any side effects the vaccine might generate are well within an even more restricted acceptable range. Second, we must be careful not to squander our persuasive currency by promoting a vaccine that in retrospect may turn out to be of relatively little value.
Although there is ample evidence that education often fails to convince the committed anti-vaxxers, pediatricians continue to be held in high regard by most parents, many of whom are understandably confused by the tsunami of health information of mixed quality generated by the pandemic. We must be cautious not to cast ourselves as a group whose knee-jerk reaction is to recommend every vaccine with equal vigor. All vaccines are not created equal. We must be patient and prepared to adjust the level of our enthusiasm. We must continue to tailor our advice based on the hard data. Otherwise, parents will stop asking for our advice because they will believe that they already know what we’re going to say.
Dr. Wilkoff practiced primary care pediatrics in Brunswick, Maine, for nearly 40 years. He has authored several books on behavioral pediatrics, including “How to Say No to Your Toddler.” Other than a Littman stethoscope he accepted as a first-year medical student in 1966, Dr. Wilkoff reports having nothing to disclose. Email him at [email protected].
In February, citing the need for more data, Pfizer and BioNTech announced that they were delaying the application for their COVID-19 vaccine for children under the age of 5. Earlier evidence suggests that two doses may not provide adequate protection in the 2- to 4-year old age group. With the larger number of infections and illness in the younger age group from the Omicron variant, Pfizer and BioNTech felt they needed more data on the effectiveness of a third dose.
This delay came as a disappointment to parents of children under 5 who have been eager to have them receive the vaccination. However, Peter Marks, MD, director of the Center for Biologics Evaluation and Research at the Food and Drug Administration, told parents that this delay should be reassuring – that the companies were doing important due diligence before releasing a product that is both safe and effective. The American Academy of Pediatrics wisely released a similar statement of reassurance and support.
It is difficult to know how many parents will eventually immunize their young children once the vaccine is approved. Any survey done more than a few weeks ago must be viewed cautiously as “the COVID numbers” around the country continue to improve and parental attitudes are likely to change.
There will always remain subgroups of parents on either extreme of the bell-shaped curve. Some will reject the under-5 vaccine simply because it is a vaccine. Some parents are so anxious to vaccinate that they will want to be first in line even if waiting is the more prudent approach. In a recent opinion piece appearing in the New York Times, a statistician writes that he is so eager to have his young children immunized that he is encouraging the FDA to replace its traditional reliance on “statistical significance” with a less rigid and binary method such as one based on Bayesian theory (Aubrey Carlton, “I’m a parent and a statistician. There’s a smarter way to think about the under-5 vaccine.” The New York Times. 2022 Mar 1.). However, what this statistician misses in his haste to vaccinate his own children is that we are dealing with an entire population with varying levels of scientific sophistication and appetite for risk. While “statistical significance” may no longer be cutting edge to some statisticians, most of the rest of the country finds the term reassuring.
It will be interesting to see what happens if and when the vaccine is approved. Will the American Academy of Pediatrics come out with a strong recommendation? I hope they are careful and provide a sufficient number of caveats, otherwise we in the trenches will again be left to provide more nuanced advice to families who are both anxious and hesitant.
Despite the recent surge in cases among young children, apparently as a result of the Omicron variant, the disease continues to cause less and milder disease among young children than it does in adults. And the degree to which illness in the pediatric population contributes to the health of the general population appears to still be a matter of debate. This may be yet another instance of when the crafty COVID-19 has moved with a pace that will make an under–age-5 vaccine of relatively little value.
First, we must be careful to assure ourselves that any side effects the vaccine might generate are well within an even more restricted acceptable range. Second, we must be careful not to squander our persuasive currency by promoting a vaccine that in retrospect may turn out to be of relatively little value.
Although there is ample evidence that education often fails to convince the committed anti-vaxxers, pediatricians continue to be held in high regard by most parents, many of whom are understandably confused by the tsunami of health information of mixed quality generated by the pandemic. We must be cautious not to cast ourselves as a group whose knee-jerk reaction is to recommend every vaccine with equal vigor. All vaccines are not created equal. We must be patient and prepared to adjust the level of our enthusiasm. We must continue to tailor our advice based on the hard data. Otherwise, parents will stop asking for our advice because they will believe that they already know what we’re going to say.
Dr. Wilkoff practiced primary care pediatrics in Brunswick, Maine, for nearly 40 years. He has authored several books on behavioral pediatrics, including “How to Say No to Your Toddler.” Other than a Littman stethoscope he accepted as a first-year medical student in 1966, Dr. Wilkoff reports having nothing to disclose. Email him at [email protected].
Answering parents’ questions about Cronobacter and powdered formula
A 6-month-old boy presented with 2 days of looser-than-normal stools without blood or mucous. Before the onset of diarrhea, he had been fed at least two bottles of an infant formula identified in a national recall. His mom requested testing for Cronobacter sakazakii.
In mid-February, Abbott Nutrition recalled specific lots of powdered formula produced at one Michigan manufacturing facility because of possible Cronobacter contamination. To date, a public health investigation has identified four infants in three states who developed Cronobacter infection after consuming formula that was part of the recall. Two of the infants died.

As media reports urged families to search their kitchens for containers of the implicated formula and return them for a refund, worried parents reached out to pediatric care providers for advice.
Cronobacter sakazakii and other Cronobacter species are Gram-negative environmental organisms that occasionally cause bacteremia and meningitis in young infants. Although these infections are not subject to mandatory reporting in most states, laboratory-based surveillance suggests that 18 cases occur annually in the United States (0.49 cases/100,00 infants).
While early reports in the literature described cases in hospitalized, preterm infants, infections also occur in the community and in children born at or near term. A Centers for Disease Control and Prevention review of domestic and international cases identified 183 children <12 months of age between 1961 and 2018 described as diagnosed with Cronobacter bacteremia or meningitis.1 Of the 79 U.S. cases, 34 occurred in term infants and 50 were community onset. Most cases occurred in the first month of life; the oldest child was 35 days of age at the onset of symptoms. Meningitis was more likely in infants born close to term and who were not hospitalized at the time of infection. The majority of infants for whom a feeding history was available had consumed powdered formula.
Back in the exam room, the 6-month-old was examined and found to be vigorous and well-appearing with normal vital signs and no signs of dehydration. The infant’s pediatrician found no clinical indication to perform a blood culture or lumbar puncture, the tests used to diagnose invasive Cronobacter infection. She explained that stool cultures are not recommended, as Cronobacter does not usually cause diarrhea in infants and finding the bacteria in the stool may represent colonization rather than infection.
The pediatrician did take the opportunity to talk to the mom about her formula preparation practices and shared a handout. Powdered formula isn’t sterile, but it is safe for most infants when prepared according to manufacturer’s directions. Contamination of formula during or after preparation can also result in Cronobacter infection in vulnerable infants.
The mom was surprised – and unhappy – to learn that Cronobacter could be lurking in her kitchen. More than a decade ago, investigators visited 78 households in Tennessee and cultured multiple kitchen surfaces.2C. sakazakii was recovered from 21 homes. Most of the positive cultures were from sinks, counter tops, and used dishcloths. Cronobacter has also been cultured from a variety of dried food items, including powdered milk, herbal tea, and starches.
According to the CDC, liquid formula, a product that is sterile until opened, is a safer choice for formula-fed infants who are less than 3 months of age, were born prematurely, or have a compromised immune system. When these infants must be fed powdered formula, preparing it with water heated to at least 158°F or 70°C can kill Cronobacter organisms. Parents should be instructed to boil water and let it cool for about 5 minutes before using it to mix formula.
While most cases of Cronobacter in infants have been epidemiologically linked to consumption of powdered formula, sporadic case reports describe infection in infants fed expressed breast milk. In one report, identical bacterial isolates were recovered from expressed milk fed to an infected infant and the breast pump used to express the milk.3
Moms who express milk should be instructed in proper breast pump hygiene, including washing hands thoroughly before handling breast pumps; disassembling and cleaning breast pumps kits after each use, either in hot soapy water with a dedicated brush and basin or in the dishwasher; air drying on a clean surface; and sanitizing at least daily by boiling, steaming, or using a dishwasher’s sanitize cycle.
Health care providers are encouraged to report Cronobacter cases to their state or local health departments.
Dr. Bryant is a pediatrician specializing in infectious diseases at the University of Louisville (Ky.) and Norton Children’s Hospital, also in Louisville. She said she had no relevant financial disclosures. Email her at [email protected].
References
1. Strysko J et al. Emerg Infect Dis. 2020;26(5):857-65.
2. Kilonzo-Nthenge A et al. J Food Protect 2012;75(8):1512-7.
3. Bowen A et al. MMWR Morb Mortal Wkly Rep. 2017;66:761-2.
A 6-month-old boy presented with 2 days of looser-than-normal stools without blood or mucous. Before the onset of diarrhea, he had been fed at least two bottles of an infant formula identified in a national recall. His mom requested testing for Cronobacter sakazakii.
In mid-February, Abbott Nutrition recalled specific lots of powdered formula produced at one Michigan manufacturing facility because of possible Cronobacter contamination. To date, a public health investigation has identified four infants in three states who developed Cronobacter infection after consuming formula that was part of the recall. Two of the infants died.
As media reports urged families to search their kitchens for containers of the implicated formula and return them for a refund, worried parents reached out to pediatric care providers for advice.
Cronobacter sakazakii and other Cronobacter species are Gram-negative environmental organisms that occasionally cause bacteremia and meningitis in young infants. Although these infections are not subject to mandatory reporting in most states, laboratory-based surveillance suggests that 18 cases occur annually in the United States (0.49 cases/100,00 infants).
While early reports in the literature described cases in hospitalized, preterm infants, infections also occur in the community and in children born at or near term. A Centers for Disease Control and Prevention review of domestic and international cases identified 183 children <12 months of age between 1961 and 2018 described as diagnosed with Cronobacter bacteremia or meningitis.1 Of the 79 U.S. cases, 34 occurred in term infants and 50 were community onset. Most cases occurred in the first month of life; the oldest child was 35 days of age at the onset of symptoms. Meningitis was more likely in infants born close to term and who were not hospitalized at the time of infection. The majority of infants for whom a feeding history was available had consumed powdered formula.
Back in the exam room, the 6-month-old was examined and found to be vigorous and well-appearing with normal vital signs and no signs of dehydration. The infant’s pediatrician found no clinical indication to perform a blood culture or lumbar puncture, the tests used to diagnose invasive Cronobacter infection. She explained that stool cultures are not recommended, as Cronobacter does not usually cause diarrhea in infants and finding the bacteria in the stool may represent colonization rather than infection.
The pediatrician did take the opportunity to talk to the mom about her formula preparation practices and shared a handout. Powdered formula isn’t sterile, but it is safe for most infants when prepared according to manufacturer’s directions. Contamination of formula during or after preparation can also result in Cronobacter infection in vulnerable infants.
The mom was surprised – and unhappy – to learn that Cronobacter could be lurking in her kitchen. More than a decade ago, investigators visited 78 households in Tennessee and cultured multiple kitchen surfaces.2C. sakazakii was recovered from 21 homes. Most of the positive cultures were from sinks, counter tops, and used dishcloths. Cronobacter has also been cultured from a variety of dried food items, including powdered milk, herbal tea, and starches.
According to the CDC, liquid formula, a product that is sterile until opened, is a safer choice for formula-fed infants who are less than 3 months of age, were born prematurely, or have a compromised immune system. When these infants must be fed powdered formula, preparing it with water heated to at least 158°F or 70°C can kill Cronobacter organisms. Parents should be instructed to boil water and let it cool for about 5 minutes before using it to mix formula.
While most cases of Cronobacter in infants have been epidemiologically linked to consumption of powdered formula, sporadic case reports describe infection in infants fed expressed breast milk. In one report, identical bacterial isolates were recovered from expressed milk fed to an infected infant and the breast pump used to express the milk.3
Moms who express milk should be instructed in proper breast pump hygiene, including washing hands thoroughly before handling breast pumps; disassembling and cleaning breast pumps kits after each use, either in hot soapy water with a dedicated brush and basin or in the dishwasher; air drying on a clean surface; and sanitizing at least daily by boiling, steaming, or using a dishwasher’s sanitize cycle.
Health care providers are encouraged to report Cronobacter cases to their state or local health departments.
Dr. Bryant is a pediatrician specializing in infectious diseases at the University of Louisville (Ky.) and Norton Children’s Hospital, also in Louisville. She said she had no relevant financial disclosures. Email her at [email protected].
References
1. Strysko J et al. Emerg Infect Dis. 2020;26(5):857-65.
2. Kilonzo-Nthenge A et al. J Food Protect 2012;75(8):1512-7.
3. Bowen A et al. MMWR Morb Mortal Wkly Rep. 2017;66:761-2.
Norovirus vaccine candidates employ different approaches
Scientists are trying different approaches to developing vaccines against norovirus, seeking to replicate the success seen in developing shots against rotavirus.
Speaking at the 12th World Congress of the World Society for Pediatric Infectious Diseases (WSPID), Miguel O’Ryan, MD, of the University of Chile, Santiago, presented an overview of candidate vaccines. Dr. O’Ryan has been involved for many years with research on rotavirus vaccines and has branched into work with the somewhat similar norovirus.
With advances in preventing rotavirus, norovirus has emerged in recent years as a leading cause of acute gastroenteritis (AGE) in most countries worldwide. It’s associated with almost 20% of all acute diarrheal cases globally and with an estimated 685 million episodes and 212,000 deaths annually, Dr. O’Ryan and coauthors reported in a review in the journal Viruses.
If successful, norovirus vaccines may be used someday to prevent outbreaks among military personnel, as this contagious virus has the potential to disrupt missions, Dr. O’Ryan and coauthors wrote. They also said people might consider getting norovirus vaccines ahead of trips to prevent traveler’s diarrhea. But most importantly, these kinds of vaccines could reduce diarrhea-associated hospitalizations and deaths of children.
Takeda Pharmaceutical Company, for whom Dr. O’Ryan has done consulting, last year announced a collaboration with Frazier Healthcare Partners to launch HilleVax. Based in Boston, the company is intended to commercialize Takeda’s norovirus vaccine candidate.
The Takeda-HilleVax candidate vaccine injection has advanced as far as phase 2 studies, including a test done over two winter seasons in U.S. Navy recruits. Takeda and U.S. Navy scientists reported in 2020 in the journal Vaccine that the primary efficacy outcome for this test could not be evaluated due to an unexpectedly low number of cases of norovirus. Still, data taken from this study indicate that the vaccine induces a broad immune response, the scientists reported.
In his WSPID presentation, Dr. O’Ryan also mentioned an oral norovirus vaccine candidate that the company Vaxart is developing, referring to this as a “very interesting approach.”
Betting on the gut
Based in South San Francisco, California, Vaxart is pursuing a theory that a vaccine designed to generate mucosal antibodies locally in the intestine, in addition to systemic antibodies in the blood, may better protect against norovirus infection than an injectable vaccine.
“A key ability to protect against norovirus needs to come from an intestinal immune response, and injected vaccines don’t give those very well,” Sean Tucker, PhD, the founder and chief scientific officer of Vaxart, told this news organization in an interview. “We think that’s one of the reasons why our oral approaches can have significant advantages.”
Challenges to developing a norovirus vaccine have included a lack of good animal models to use in research and a lack of an ability to grow the virus well in cell culture, Dr. Tucker said.
Vaxart experienced disruptions in its research during the early stages of the pandemic but has since picked up the pace of its efforts to develop its oral vaccine, Dr. Tucker said during the interview.
In a recent filing with the Securities and Exchange Commission, Vaxart said in early 2021 it resumed its norovirus vaccine program by initiating three clinical studies. These included a phase 1b placebo-controlled dose ranging study in healthy elderly adults aged 55-80. Data from these trials may be unveiled in the coming months.
Vaxart said that this year it has already initiated a phase 2 norovirus challenge study, which will evaluate safety, immunogenicity, and clinical efficacy of a vaccine candidate against placebo.
A version of this article first appeared on Medscape.com.