User login
Receptor occupancy and drug response: Understanding the relationship
Most clinicians do not think about receptor occupancy when they prescribe a medication. Most simply assume that if they use a low dose of a medication, they will get a small effect, and if they use a higher dose, they will get a larger effect. However, this is frequently not accurate. Clinicians need to understand the relationship between receptor occupancy and drug response.
In general, when an antagonist of a neurotransmitter receptor is used, it must occupy a minimum of 65% to 70% of the target receptor to be effective. This is clearly the case when the target is a postsynaptic receptor, such as the dopamine D2 receptor.1-3 Similarly, despite significant variability in antidepressant response,4 blockade of 65% to 80% of presynaptic transport proteins—such as the serotonin reuptake pumps when considering serotoninergic antidepressants,5,6 or the norepinephrine reuptake pumps when considering noradrenergic agents such as nortriptyline7—is necessary for these medications to be effective.
It is reasonable to think of the drug response of such agents as following a “threshold” model (Figure 1). This model makes 2 predictions. The first prediction is that a low dose of the drug might result in <50% receptor occupancy, but is not associated with a smaller response; it is simply ineffective. The second prediction is that a very high dose of the drug (eg, one that may exceed 90% receptor occupancy) does not result in any additional benefit, but may cause additional adverse consequences.8

Alternatively, agonist medications, such as benzodiazepines or opiates, have their efficacy in a continuous dose-dependent fashion (Figure 2). Titrating these medications for clinical response is necessary, and minimal effective doses are highly individual. Agonist medications will not be addressed further in this article.

In this article, the term “response” is used to denote the average (population) symptom change in a study population. This term is not used as clinicians often use it to mean that their specific patient’s illness has improved, or that the patient has gone into remission. Furthermore, the information described in this article does not optimize clinical outcome, but instead is intended to help clinicians optimize the use of their pharmacologic tools.
Minimal effective dose

Medications that have a threshold for activity will display that clinically in a minimal effective dose (Table 13,9 and Table 25). The minimal effective dose of medications that act by blocking a neurotransmitter receptor is usually the dose that achieves 65% to 80% receptor occupancy in typical individuals (Table 25). The minimal effective doses for antipsychotics are listed in Table 1.3,9 These doses are known to occupy approximately 65% to 70% of postsynaptic D2 receptors in living humans as confirmed by positron emission tomography (PET) scans.10 Similar minimal effective doses can be determined for serotonin-reuptake inhibiting (SRI) antidepressants (Table 25). In placebo-controlled trials, doses that were smaller than the minimal effective dose did not provide any benefit.

There are important caveats to this. First is the use of partial agonists. Depending on the level of intrinsic activity of a partial agonist and clinical goal, the clinician may aim for a different level of receptor occupancy. For example, aripiprazole will act as a dopamine agonist at lower concentrations, but blocks the receptor at higher concentrations.11 Unlike antagonist antipsychotics, which require only 65% to 70% D2 receptor occupancy to be effective, aripiprazole receptor binding at effective antipsychotic doses is 90% to 95%.12-14 Since aripiprazole has an intrinsic activity of approximately 30% (ie, when it binds, it stimulates the D2 receptor to about 30% of the effect of dopamine binding to the receptor15), binding to 90% of the receptors, and displacing endogenous dopamine, allows aripiprazole to replace the background or tonic tone of dopamine, which has been measured at 19% in people with schizophrenia and 9% in controls.16 Clinically, this still appears as the minimal effective dose achieving maximal response17-19 without significant parkinsonism despite >90% receptor occupancy.12
Continue to: The second caveat is...
The second caveat is the action of low D2 receptor affinity antipsychotics, such as clozapine and quetiapine. These agents generally achieve adequate D2 receptor occupancy for only a brief period of time.20 It has been suggested that continuous receptor occupancy at ≥65% may not be necessary to obtain antipsychotic control.21,22 There may also be specific limbic and cortical (vs striatal) D2 receptor selectivity by clozapine23 compared with other second-generation antipsychotics such as risperidone and olanzapine,24,25 although this point remains debatable.26 Furthermore, the antipsychotic efficacy of low D2 receptor affinity drugs is unreliable, even in controlled, blinded studies (eg, a failed large quetiapine study27). Thus far, the actual antipsychotic mechanism of these agents is yet to be fully understood.
Minimal effective dose achieves maximal response
An interesting aspect of the threshold phenomenon of drug response is that once the minimal effective dose is reached, maximal response is achieved. In other words, there is no additional efficacy with additional dose increases. This is readily demonstrated in some studies in which patients were randomly assigned to different fixed doses or dose ranges. In these studies, there was generally no difference in response rates of different doses, so that once 65% to 80% receptor occupancy is achieved, minimal and maximal clinical response is simultaneously reached.18,28,29
For example, in the original risperidone studies, 6 mg/d was essentially equivalent to 16 mg/d.28 Similarly, lurasidone, 40 mg/d, achieves approximately 65% D2 occupancy.30 When the daily dose is increased to 120 mg, there is no additional benefit in controlling psychosis in schizophrenia.29 This pattern is also seen in partial agonists, where there are no differences between lower and higher doses in terms of response.18
Upon reading this, many clinicians may think “I don’t care what the studies say, I have seen additional benefits with additional doses.” There are several explanations for this. One is that individual patients have genetic variants that may prevent them from responding in a typical fashion. Hints of this are seen in an apparent disconnect between dosage and drug levels, so that it is not surprising that drug levels are a much better predictor of receptor occupancy than dosage.31 Nonetheless, as previously pointed out, for a population, dosage does predict receptor occupancy and outcome. However, for individuals, genetic variations make dosages less reliable. For example, ultrarapid metabolizers of cytochrome P450 (CYP) 2D6 may discontinue risperidone due to nonresponse, or require a higher dose or longer time period to respond.32,33 Similarly, patients who smoke may require an increase in doses of CYP1A2 substrates such as clozapine and olanzapine.34
Alternatively, the clinician may note improvement in mood, sleep, appetite, or other symptoms at lower doses, and then note additional improvements in psychosis or mania at higher doses.3 This occurs due to the varying affinity of different receptors. For example, in bipolar depression trials that used quetiapine in a fixed-dose design, patients who received 300 or 600 mg/d responded in the same fashion, with no additional benefit in improving depression with the higher dose.35 Similarly, in a flexible dose range study that evaluated lurasidone in bipolar depression, an average dose of 34 mg/d (range 20 to 60 mg/d) and an average dose of 83 mg/d (range 80 to 120 mg/d) both resulted in the same response (a 15.4-point reduction in depression ratings and an effect size of 0.51).36 For both quetiapine and lurasidone, higher doses are generally required to control psychosis.29,37 Note that for lurasidone, agitation, but not psychosis, improves with higher doses, which suggests that recruitment of additional receptors results in improvement in a different set of symptoms.9
Continue to: Clinical implications
Clinical implications
The implications for clinicians are relatively clear. Knowing the minimal effective doses for depression, psychosis, or mania informs the target dose. If improvement is seen at lower doses, the clinician needs to assess the profile of symptoms that improved, potential drug–drug interactions, or potential irregularities in the patient’s metabolic pathways. Clinicians need to increase doses above the minimally effective dose carefully, and expend additional effort in analyzing changes in their patient’s symptoms and adverse effects; this analysis should be performed with skepticism and willingness to reduce a dosage if no additional benefit is seen. Attention to these receptor-symptom interactions will improve response and reduce adverse consequences in the majority of patients.
Related Resource
- Lako IM, van den Heuvel ER, Knegtering H, et al. Estimating dopamine D2 receptor occupancy for doses of 8 antipsychotics: a meta-analysis. J Clin Psychopharmacol. 2013;33(5):675-681.
Drug Brand Names
Aripiprazole • Abilify
Asenapine • Saphris
Citalopram • Celexa
Clozapine • Clozaril
Fluoxetine • Prozac
Haloperidol • Haldol
Iloperidone • Fanapt
Lurasidone • Latuda
Nortriptyline • Pamelor
Olanzapine • Zyprexa
Paroxetine • Paxil
Quetiapine • Seroquel
Risperidone • Risperdal
Sertraline • Zoloft
Venlafaxine • Effexor
Ziprasidone • Geodon
1. Farde L, Nordström AL, Wiesel FA, et al. Positron emission tomographic analysis of central D1 and D2 dopamine receptor occupancy in patients treated with classical neuroleptics and clozapine. Relation to extrapyramidal side effects. Arch Gen Psychiatry. 1992;49(7):538-544.
2. Kapur S, Zipursky R, Jones C, et al. Relationship between dopamine D(2) occupancy, clinical response, and side effects: a double-blind PET study of first-episode schizophrenia. Am J Psychiatry. 2000;157(4):514-520.
3. Roberts RJ, Lohano KK, El-Mallakh RS. Antipsychotics as antidepressants. Asia Pacific Psychiatry. 2016;8(3):179-188.
4. Quitkin FM, Rabkin JG, Gerald J, et al. Validity of clinical trials of antidepressants. Am J Psychiatry. 2000;157(3):327-337.
5. Meyer JH, Wilson AA, Sagrati S, et al. Serotonin transporter occupancy of five selective serotonin reuptake inhibitors at different doses: an [11C]DASB positron emission tomography study. Am J Psychiatry. 2004;161(5):826-835.
6. Lundberg J, Tiger M, Landén M, et al. Serotonin transporter occupancy with TCAs and SSRIs: a PET study in patients with major depressive disorder. Int J Neuropsychopharmacol. 2012;15(8):1167-1172.
7. Takano H, Arakawa R, Nogami T, et al. Norepinephrine transporter occupancy by nortriptyline in patients with depression: a positron emission tomography study with (S,S)-[¹8F]FMeNER-D2. Int J Neuropsychopharmacol. 2014;17(4):553-560.
8. Johnson M, Kozielska M, Pilla Reddy V, et al. Dopamine D2 receptor occupancy as a predictor of catalepsy in rats: a pharmacokinetic-pharmacodynamic modeling approach. Pharm Res. 2014;31(10):2605-2617.
9. Allen MH, Citrome L, Pikalov A, et al. Efficacy of lurasidone in the treatment of agitation: a post hoc analysis of five short-term studies in acutely ill patients with schizophrenia. Gen Hosp Psychiatry. 2017;47:75-82.
10. Sekine M, Maeda J, Shimada H, et al. Central nervous system drug evaluation using positron emission tomography. Clin Psychopharmacol Neurosci. 2011;9(1):9-16.
11. Ma GF, Raivio N, Sabrià J, et al. Agonist and antagonist effects of aripiprazole on D2-like receptors controlling rat brain dopamine synthesis depend on the dopaminergic tone. Int J Neuropsychopharmacol. 2014;18(4):pii: pyu046. doi: 10.1093/ijnp/pyu046.
12. Yokoi F, Gründer G, Biziere K, et al. Dopamine D2 and D3 receptor occupancy in normal humans treated with the antipsychotic drug aripiprazole (OPC 14597): a study using positron emission tomography and [11C]raclopride. Neuropsychopharmacology. 2002;27(2):248-259.
13. Gründer G, Carlsson A, Wong DF. Mechanism of new antipsychotic medications: occupancy is not just antagonism. Arch Gen Psychiatry. 2003;60(10):974-977.
14. Mamo D, Graff A, Mizrahi R, et al. Differential effects of aripiprazole on D(2), 5-HT(2), and 5-HT(1A)receptor occupancy in patients with schizophrenia: a triple tracer PET study. Am J Psychiatry. 2007;164(9):1411-1417.
15. Weiden PJ, Preskorn SH, Fahnestock PA, et al. Translating the psychopharmacology of antipsychotics to individualized treatment for severe mental illness: a roadmap. J Clin Psychiatry. 2007;68(suppl 7):1-48.
16. Abi-Dargham A, Rodenhiser J, Printz D, et al. Increased baseline occupancy of D2 receptors by dopamine in schizophrenia. Proc Natl Acad Sci U S A. 2000;97(14):8104-8109.
17. Kane JM, Carson WH, Saha AR, et al. Efficacy and safety of aripiprazole and haloperidol versus placebo in patients with schizophrenia and schizoaffective disorder. J Clin Psychiatry. 2002;63(9):763-771.
18. Potkin SG, Saha AR, Kujawa MJ, et al. Aripiprazole, an antipsychotic with a novel mechanism of action, and risperidone vs placebo in patients with schizophrenia and schizoaffective disorder. Arch Gen Psychiatry. 2003;60(7):681-690.
19. Cutler AJ, Marcus RN, Hardy SA, et al. The efficacy and safety of lower doses of aripiprazole for the treatment of patients with acute exacerbation of schizophrenia. CNS Spectr. 2006;11(9):691-702; quiz 719.
20. Gründer G, Landvogt C, Vernaleken I, et al. The striatal and extrastriatal D2/D3 receptor-binding profile of clozapine in patients with schizophrenia. Neuropsychopharmacology. 2006;31(5):1027-1035.
21. Mizuno Y, Bies RR, Remington G, et al. Dopamine D2 receptor occupancy with risperidone or olanzapine during maintenance treatment of schizophrenia: a cross-sectional study. Prog Neuropsychopharmacol Biol Psychiatry. 2012;37(1):182-187.
22. Moriguchi S, Bies RR, Remington G, et al. Estimated dopamine D2 receptor occupancy and remission in schizophrenia: analysis of the CATIE data. J Clin Psychopharmacol. 2013;33(5):682-685.
23. Pilowsky LS, Mulligan RS, Acton PD, et al. Limbic selectivity of clozapine. Lancet. 1997;350(9076):490-491.
24. Ito H, Arakawa R, Takahashi H, et al. No regional difference in dopamine D2 receptor occupancy by the second-generation antipsychotic drug risperidone in humans: a positron emission tomography study. Int J Neuropsychopharmacol. 2009;12(5):667-675.
25. Arakawa R, Ito H, Okumura M, et al. Extrastriatal dopamine D(2) receptor occupancy in olanzapine-treated patients with schizophrenia. Eur Arch Psychiatry Clin Neurosci. 2010;260(4):345-350.
26. Xiberas X, Martinot JL, Mallet L, et al. Extrastriatal and striatal D(2) dopamine receptor blockade with haloperidol or new antipsychotic drugs in patients with schizophrenia. Br J Psychiatry. 2001;179:503-508.
27. Cutler AJ, Tran-Johnson T, Kalali A, et al. A failed 6-week, randomized, double-blind, placebo-controlled study of once-daily extended release quetiapine fumarate in patients with acute schizophrenia: lessons learned. Psychopharmacol Bull. 2010;43(4):37-69.
28. Marder SR, Meibach RC. Risperidone in the treatment of schizophrenia. Am J Psychiatry. 1994;151(6):825-835.
29. Meltzer HY, Cucchiaro J, Silva R, et al. Lurasidone in the treatment of schizophrenia: a randomized, double-blind, placebo- and olanzapine-controlled study. Am J Psychiatry. 2011;168(9):957-967.
30. Wong DF, Kuwabara H, Brašic JR, et al. Determination of dopamine D2 receptor occupancy by lurasidone using positron emission tomography in healthy male subjects. Psychopharmacology (Berl). 2013;229(2):245-252.
31. Potkin SG, Keator DB, Kesler-West ML, et al. D2 receptor occupancy following lurasidone treatment in patients with schizophrenia or schizoaffective disorder. CNS Spectr. 2014;19(2):176-181.
32. de Leon J, Susce MT, Pan RM, et al. The CYP2D6 poor metabolizer phenotype may be associated with risperidone adverse drug reactions and discontinuation. J Clin Psychiatry. 2005;66(1):15-27.
33. de Leon J, Susce MT, Pan RM, et al. A study of genetic (CYP2D6 and ABCB1) and environmental (drug inhibitors and inducers) variables that may influence plasma risperidone levels. Pharmacopsychiatry. 2007;40(3):93-102.
34. Narahari A, El-Mallakh RS, Kolikonda MK, et al. How coffee and cigarettes can affect the response to psychopharmacotherapy. Current Psychiatry. 2015;14(10):79-80.
35. Calabrese JR, Keck PE Jr, Macfadden W, et al. A randomized, double-blind, placebo-controlled trial of quetiapine in the treatment of bipolar I or II depression. Am J Psychiatry. 2005;162(7):1351-1360.
36. Loebel A, Cucchiaro J, Silva R, et al. Lurasidone monotherapy in the treatment of bipolar I depression: a randomized, double-blind, placebo-controlled study. Am J Psychiatry. 2014;171(2):160-168.
37. Lindenmayer JP, Brown D, Liu S, et al. The efficacy and tolerability of once-daily extended release quetiapine fumarate in hospitalized patients with acute schizophrenia: a 6-week randomized, double-blind, placebo-controlled study. Psychopharmacol Bull. 2008;41(3):11-35.
Most clinicians do not think about receptor occupancy when they prescribe a medication. Most simply assume that if they use a low dose of a medication, they will get a small effect, and if they use a higher dose, they will get a larger effect. However, this is frequently not accurate. Clinicians need to understand the relationship between receptor occupancy and drug response.
In general, when an antagonist of a neurotransmitter receptor is used, it must occupy a minimum of 65% to 70% of the target receptor to be effective. This is clearly the case when the target is a postsynaptic receptor, such as the dopamine D2 receptor.1-3 Similarly, despite significant variability in antidepressant response,4 blockade of 65% to 80% of presynaptic transport proteins—such as the serotonin reuptake pumps when considering serotoninergic antidepressants,5,6 or the norepinephrine reuptake pumps when considering noradrenergic agents such as nortriptyline7—is necessary for these medications to be effective.
It is reasonable to think of the drug response of such agents as following a “threshold” model (Figure 1). This model makes 2 predictions. The first prediction is that a low dose of the drug might result in <50% receptor occupancy, but is not associated with a smaller response; it is simply ineffective. The second prediction is that a very high dose of the drug (eg, one that may exceed 90% receptor occupancy) does not result in any additional benefit, but may cause additional adverse consequences.8
Alternatively, agonist medications, such as benzodiazepines or opiates, have their efficacy in a continuous dose-dependent fashion (Figure 2). Titrating these medications for clinical response is necessary, and minimal effective doses are highly individual. Agonist medications will not be addressed further in this article.
In this article, the term “response” is used to denote the average (population) symptom change in a study population. This term is not used as clinicians often use it to mean that their specific patient’s illness has improved, or that the patient has gone into remission. Furthermore, the information described in this article does not optimize clinical outcome, but instead is intended to help clinicians optimize the use of their pharmacologic tools.
Minimal effective dose
Medications that have a threshold for activity will display that clinically in a minimal effective dose (Table 13,9 and Table 25). The minimal effective dose of medications that act by blocking a neurotransmitter receptor is usually the dose that achieves 65% to 80% receptor occupancy in typical individuals (Table 25). The minimal effective doses for antipsychotics are listed in Table 1.3,9 These doses are known to occupy approximately 65% to 70% of postsynaptic D2 receptors in living humans as confirmed by positron emission tomography (PET) scans.10 Similar minimal effective doses can be determined for serotonin-reuptake inhibiting (SRI) antidepressants (Table 25). In placebo-controlled trials, doses that were smaller than the minimal effective dose did not provide any benefit.
There are important caveats to this. First is the use of partial agonists. Depending on the level of intrinsic activity of a partial agonist and clinical goal, the clinician may aim for a different level of receptor occupancy. For example, aripiprazole will act as a dopamine agonist at lower concentrations, but blocks the receptor at higher concentrations.11 Unlike antagonist antipsychotics, which require only 65% to 70% D2 receptor occupancy to be effective, aripiprazole receptor binding at effective antipsychotic doses is 90% to 95%.12-14 Since aripiprazole has an intrinsic activity of approximately 30% (ie, when it binds, it stimulates the D2 receptor to about 30% of the effect of dopamine binding to the receptor15), binding to 90% of the receptors, and displacing endogenous dopamine, allows aripiprazole to replace the background or tonic tone of dopamine, which has been measured at 19% in people with schizophrenia and 9% in controls.16 Clinically, this still appears as the minimal effective dose achieving maximal response17-19 without significant parkinsonism despite >90% receptor occupancy.12
Continue to: The second caveat is...
The second caveat is the action of low D2 receptor affinity antipsychotics, such as clozapine and quetiapine. These agents generally achieve adequate D2 receptor occupancy for only a brief period of time.20 It has been suggested that continuous receptor occupancy at ≥65% may not be necessary to obtain antipsychotic control.21,22 There may also be specific limbic and cortical (vs striatal) D2 receptor selectivity by clozapine23 compared with other second-generation antipsychotics such as risperidone and olanzapine,24,25 although this point remains debatable.26 Furthermore, the antipsychotic efficacy of low D2 receptor affinity drugs is unreliable, even in controlled, blinded studies (eg, a failed large quetiapine study27). Thus far, the actual antipsychotic mechanism of these agents is yet to be fully understood.
Minimal effective dose achieves maximal response
An interesting aspect of the threshold phenomenon of drug response is that once the minimal effective dose is reached, maximal response is achieved. In other words, there is no additional efficacy with additional dose increases. This is readily demonstrated in some studies in which patients were randomly assigned to different fixed doses or dose ranges. In these studies, there was generally no difference in response rates of different doses, so that once 65% to 80% receptor occupancy is achieved, minimal and maximal clinical response is simultaneously reached.18,28,29
For example, in the original risperidone studies, 6 mg/d was essentially equivalent to 16 mg/d.28 Similarly, lurasidone, 40 mg/d, achieves approximately 65% D2 occupancy.30 When the daily dose is increased to 120 mg, there is no additional benefit in controlling psychosis in schizophrenia.29 This pattern is also seen in partial agonists, where there are no differences between lower and higher doses in terms of response.18
Upon reading this, many clinicians may think “I don’t care what the studies say, I have seen additional benefits with additional doses.” There are several explanations for this. One is that individual patients have genetic variants that may prevent them from responding in a typical fashion. Hints of this are seen in an apparent disconnect between dosage and drug levels, so that it is not surprising that drug levels are a much better predictor of receptor occupancy than dosage.31 Nonetheless, as previously pointed out, for a population, dosage does predict receptor occupancy and outcome. However, for individuals, genetic variations make dosages less reliable. For example, ultrarapid metabolizers of cytochrome P450 (CYP) 2D6 may discontinue risperidone due to nonresponse, or require a higher dose or longer time period to respond.32,33 Similarly, patients who smoke may require an increase in doses of CYP1A2 substrates such as clozapine and olanzapine.34
Alternatively, the clinician may note improvement in mood, sleep, appetite, or other symptoms at lower doses, and then note additional improvements in psychosis or mania at higher doses.3 This occurs due to the varying affinity of different receptors. For example, in bipolar depression trials that used quetiapine in a fixed-dose design, patients who received 300 or 600 mg/d responded in the same fashion, with no additional benefit in improving depression with the higher dose.35 Similarly, in a flexible dose range study that evaluated lurasidone in bipolar depression, an average dose of 34 mg/d (range 20 to 60 mg/d) and an average dose of 83 mg/d (range 80 to 120 mg/d) both resulted in the same response (a 15.4-point reduction in depression ratings and an effect size of 0.51).36 For both quetiapine and lurasidone, higher doses are generally required to control psychosis.29,37 Note that for lurasidone, agitation, but not psychosis, improves with higher doses, which suggests that recruitment of additional receptors results in improvement in a different set of symptoms.9
Continue to: Clinical implications
Clinical implications
The implications for clinicians are relatively clear. Knowing the minimal effective doses for depression, psychosis, or mania informs the target dose. If improvement is seen at lower doses, the clinician needs to assess the profile of symptoms that improved, potential drug–drug interactions, or potential irregularities in the patient’s metabolic pathways. Clinicians need to increase doses above the minimally effective dose carefully, and expend additional effort in analyzing changes in their patient’s symptoms and adverse effects; this analysis should be performed with skepticism and willingness to reduce a dosage if no additional benefit is seen. Attention to these receptor-symptom interactions will improve response and reduce adverse consequences in the majority of patients.
Related Resource
- Lako IM, van den Heuvel ER, Knegtering H, et al. Estimating dopamine D2 receptor occupancy for doses of 8 antipsychotics: a meta-analysis. J Clin Psychopharmacol. 2013;33(5):675-681.
Drug Brand Names
Aripiprazole • Abilify
Asenapine • Saphris
Citalopram • Celexa
Clozapine • Clozaril
Fluoxetine • Prozac
Haloperidol • Haldol
Iloperidone • Fanapt
Lurasidone • Latuda
Nortriptyline • Pamelor
Olanzapine • Zyprexa
Paroxetine • Paxil
Quetiapine • Seroquel
Risperidone • Risperdal
Sertraline • Zoloft
Venlafaxine • Effexor
Ziprasidone • Geodon
1. Farde L, Nordström AL, Wiesel FA, et al. Positron emission tomographic analysis of central D1 and D2 dopamine receptor occupancy in patients treated with classical neuroleptics and clozapine. Relation to extrapyramidal side effects. Arch Gen Psychiatry. 1992;49(7):538-544.
2. Kapur S, Zipursky R, Jones C, et al. Relationship between dopamine D(2) occupancy, clinical response, and side effects: a double-blind PET study of first-episode schizophrenia. Am J Psychiatry. 2000;157(4):514-520.
3. Roberts RJ, Lohano KK, El-Mallakh RS. Antipsychotics as antidepressants. Asia Pacific Psychiatry. 2016;8(3):179-188.
4. Quitkin FM, Rabkin JG, Gerald J, et al. Validity of clinical trials of antidepressants. Am J Psychiatry. 2000;157(3):327-337.
5. Meyer JH, Wilson AA, Sagrati S, et al. Serotonin transporter occupancy of five selective serotonin reuptake inhibitors at different doses: an [11C]DASB positron emission tomography study. Am J Psychiatry. 2004;161(5):826-835.
6. Lundberg J, Tiger M, Landén M, et al. Serotonin transporter occupancy with TCAs and SSRIs: a PET study in patients with major depressive disorder. Int J Neuropsychopharmacol. 2012;15(8):1167-1172.
7. Takano H, Arakawa R, Nogami T, et al. Norepinephrine transporter occupancy by nortriptyline in patients with depression: a positron emission tomography study with (S,S)-[¹8F]FMeNER-D2. Int J Neuropsychopharmacol. 2014;17(4):553-560.
8. Johnson M, Kozielska M, Pilla Reddy V, et al. Dopamine D2 receptor occupancy as a predictor of catalepsy in rats: a pharmacokinetic-pharmacodynamic modeling approach. Pharm Res. 2014;31(10):2605-2617.
9. Allen MH, Citrome L, Pikalov A, et al. Efficacy of lurasidone in the treatment of agitation: a post hoc analysis of five short-term studies in acutely ill patients with schizophrenia. Gen Hosp Psychiatry. 2017;47:75-82.
10. Sekine M, Maeda J, Shimada H, et al. Central nervous system drug evaluation using positron emission tomography. Clin Psychopharmacol Neurosci. 2011;9(1):9-16.
11. Ma GF, Raivio N, Sabrià J, et al. Agonist and antagonist effects of aripiprazole on D2-like receptors controlling rat brain dopamine synthesis depend on the dopaminergic tone. Int J Neuropsychopharmacol. 2014;18(4):pii: pyu046. doi: 10.1093/ijnp/pyu046.
12. Yokoi F, Gründer G, Biziere K, et al. Dopamine D2 and D3 receptor occupancy in normal humans treated with the antipsychotic drug aripiprazole (OPC 14597): a study using positron emission tomography and [11C]raclopride. Neuropsychopharmacology. 2002;27(2):248-259.
13. Gründer G, Carlsson A, Wong DF. Mechanism of new antipsychotic medications: occupancy is not just antagonism. Arch Gen Psychiatry. 2003;60(10):974-977.
14. Mamo D, Graff A, Mizrahi R, et al. Differential effects of aripiprazole on D(2), 5-HT(2), and 5-HT(1A)receptor occupancy in patients with schizophrenia: a triple tracer PET study. Am J Psychiatry. 2007;164(9):1411-1417.
15. Weiden PJ, Preskorn SH, Fahnestock PA, et al. Translating the psychopharmacology of antipsychotics to individualized treatment for severe mental illness: a roadmap. J Clin Psychiatry. 2007;68(suppl 7):1-48.
16. Abi-Dargham A, Rodenhiser J, Printz D, et al. Increased baseline occupancy of D2 receptors by dopamine in schizophrenia. Proc Natl Acad Sci U S A. 2000;97(14):8104-8109.
17. Kane JM, Carson WH, Saha AR, et al. Efficacy and safety of aripiprazole and haloperidol versus placebo in patients with schizophrenia and schizoaffective disorder. J Clin Psychiatry. 2002;63(9):763-771.
18. Potkin SG, Saha AR, Kujawa MJ, et al. Aripiprazole, an antipsychotic with a novel mechanism of action, and risperidone vs placebo in patients with schizophrenia and schizoaffective disorder. Arch Gen Psychiatry. 2003;60(7):681-690.
19. Cutler AJ, Marcus RN, Hardy SA, et al. The efficacy and safety of lower doses of aripiprazole for the treatment of patients with acute exacerbation of schizophrenia. CNS Spectr. 2006;11(9):691-702; quiz 719.
20. Gründer G, Landvogt C, Vernaleken I, et al. The striatal and extrastriatal D2/D3 receptor-binding profile of clozapine in patients with schizophrenia. Neuropsychopharmacology. 2006;31(5):1027-1035.
21. Mizuno Y, Bies RR, Remington G, et al. Dopamine D2 receptor occupancy with risperidone or olanzapine during maintenance treatment of schizophrenia: a cross-sectional study. Prog Neuropsychopharmacol Biol Psychiatry. 2012;37(1):182-187.
22. Moriguchi S, Bies RR, Remington G, et al. Estimated dopamine D2 receptor occupancy and remission in schizophrenia: analysis of the CATIE data. J Clin Psychopharmacol. 2013;33(5):682-685.
23. Pilowsky LS, Mulligan RS, Acton PD, et al. Limbic selectivity of clozapine. Lancet. 1997;350(9076):490-491.
24. Ito H, Arakawa R, Takahashi H, et al. No regional difference in dopamine D2 receptor occupancy by the second-generation antipsychotic drug risperidone in humans: a positron emission tomography study. Int J Neuropsychopharmacol. 2009;12(5):667-675.
25. Arakawa R, Ito H, Okumura M, et al. Extrastriatal dopamine D(2) receptor occupancy in olanzapine-treated patients with schizophrenia. Eur Arch Psychiatry Clin Neurosci. 2010;260(4):345-350.
26. Xiberas X, Martinot JL, Mallet L, et al. Extrastriatal and striatal D(2) dopamine receptor blockade with haloperidol or new antipsychotic drugs in patients with schizophrenia. Br J Psychiatry. 2001;179:503-508.
27. Cutler AJ, Tran-Johnson T, Kalali A, et al. A failed 6-week, randomized, double-blind, placebo-controlled study of once-daily extended release quetiapine fumarate in patients with acute schizophrenia: lessons learned. Psychopharmacol Bull. 2010;43(4):37-69.
28. Marder SR, Meibach RC. Risperidone in the treatment of schizophrenia. Am J Psychiatry. 1994;151(6):825-835.
29. Meltzer HY, Cucchiaro J, Silva R, et al. Lurasidone in the treatment of schizophrenia: a randomized, double-blind, placebo- and olanzapine-controlled study. Am J Psychiatry. 2011;168(9):957-967.
30. Wong DF, Kuwabara H, Brašic JR, et al. Determination of dopamine D2 receptor occupancy by lurasidone using positron emission tomography in healthy male subjects. Psychopharmacology (Berl). 2013;229(2):245-252.
31. Potkin SG, Keator DB, Kesler-West ML, et al. D2 receptor occupancy following lurasidone treatment in patients with schizophrenia or schizoaffective disorder. CNS Spectr. 2014;19(2):176-181.
32. de Leon J, Susce MT, Pan RM, et al. The CYP2D6 poor metabolizer phenotype may be associated with risperidone adverse drug reactions and discontinuation. J Clin Psychiatry. 2005;66(1):15-27.
33. de Leon J, Susce MT, Pan RM, et al. A study of genetic (CYP2D6 and ABCB1) and environmental (drug inhibitors and inducers) variables that may influence plasma risperidone levels. Pharmacopsychiatry. 2007;40(3):93-102.
34. Narahari A, El-Mallakh RS, Kolikonda MK, et al. How coffee and cigarettes can affect the response to psychopharmacotherapy. Current Psychiatry. 2015;14(10):79-80.
35. Calabrese JR, Keck PE Jr, Macfadden W, et al. A randomized, double-blind, placebo-controlled trial of quetiapine in the treatment of bipolar I or II depression. Am J Psychiatry. 2005;162(7):1351-1360.
36. Loebel A, Cucchiaro J, Silva R, et al. Lurasidone monotherapy in the treatment of bipolar I depression: a randomized, double-blind, placebo-controlled study. Am J Psychiatry. 2014;171(2):160-168.
37. Lindenmayer JP, Brown D, Liu S, et al. The efficacy and tolerability of once-daily extended release quetiapine fumarate in hospitalized patients with acute schizophrenia: a 6-week randomized, double-blind, placebo-controlled study. Psychopharmacol Bull. 2008;41(3):11-35.

Obesity: Are shared medical appointments part of the answer?
Obesity is a major health problem in the United States. The facts are well known:
- Its prevalence has almost tripled since the early 1960s1
- More than 35% of US adults are obese (body mass index [BMI] ≥ 30 kg/m2)2
- It increases the risk of comorbid conditions including type 2 diabetes mellitus, heart disease, hypertension, obstructive sleep apnea, certain cancers, asthma, and osteoarthritis3,4
- It decreases life expectancy5
- Medical costs are up to 6 times higher per patient.6
Moreover, obesity is often not appropriately managed, owing to a variety of factors. In this article, we describe use of shared medical appointments as a strategy to improve the efficiency and effectiveness of treating patients with obesity.
Big benefits from small changes in weight
As little as 3% to 5% weight loss is associated with significant clinical benefits, such as improved glycemic control, reduced blood pressure, and reduced cholesterol levels.7,8 However, many patients are unable to reach this modest goal using current approaches to obesity management.
This failure is partially related to the complexity and chronic nature of obesity, which requires continued medical management from a multidisciplinary team. We believe this is an area of care that can be appropriately addressed through shared medical appointments.
CURRENT APPROACHES
Interventions for obesity have increased along with the prevalence of the disease. Hundreds of diets, exercise plans, natural products, and behavioral interventions are marketed, all claiming to be successful. More-intense treatment options include antiobesity medications, intra-abdominal weight loss devices, and bariatric surgery. Despite the availability of treatments, rates of obesity have not declined.
Counseling is important, but underused
Lifestyle modifications that encompass nutrition, physical activity, and behavioral interventions are the mainstay of obesity treatment.
Intensive interventions work better than less-intensive ones. In large clinical trials in overweight patients with diabetes, those who received intensive lifestyle interventions lost 3 to 5 kg more (3% to 8% of body weight) than those who received brief diet and nutrition counseling, as is often performed in a physician’s office.9–12 The US Preventive Services Task Force recommends that patients whose BMI is 30 kg/m2 or higher be offered intensive lifestyle intervention consisting of at least 12 sessions in 1 year.13
But fewer than half of primary care practitioners consistently provide specific guidance on diet, exercise, or weight control to patients with obesity, including those with a weight-related comorbidity.14 The rate has decreased since the 1990s despite the increase in obesity.15
One reason for the underuse is that many primary care practitioners do not have the training or time to deliver the recommended high-intensity obesity treatment.14 Plus, evidence does not clearly show a weight loss benefit from low-intensity interventions. Even when patients lose weight, most regain it, and only 20% are able to maintain their weight loss 1 year after treatment ends.16
Drugs and surgery also underused
Antiobesity medications and bariatric surgery are effective when added to lifestyle interventions, but they are also underused.
Bariatric surgery provides the greatest and most durable weight loss—15% to 30% of body weight—along with improvement in comorbidities such as type 2 diabetes, and its benefits are sustained for at least 10 years.17 However, fewer than 1% of eligible patients undergo bariatric surgery because of its limited availability, invasive nature, potential complications, limited insurance coverage, and high cost.17
The story is similar for antiobesity drugs. They are useful adjuncts to lifestyle interventions, providing an additional 3% to 7% weight loss,18 but fewer than 2% of eligible patients receive them.19 This may be attributed to their modest effectiveness, weight regain after discontinuation, potential adverse effects, and expense due to lack of insurance coverage.
ARE SHARED MEDICAL APPOINTMEMNTS AN ANSWER?
Although treatments have shown some effectiveness at producing weight loss, none has had a widespread impact on obesity. Lifestyle interventions, drugs, and bariatric surgery continue to be underused. Current treatment models are not providing patients with the intensive interventions needed.
Providers often find themselves offering repetitive advice to patients with obesity regarding nutrition and exercise, while simultaneously trying to manage obesity-related comorbidities, all in a 20-minute appointment. Too often, a patient returns home with prescriptions for hypertension or diabetes but no clear plan for weight management.
What can a shared medical appointment do?
A shared medical appointment is a group medical visit in which several patients with a similar clinical diagnosis, such as obesity, see a multidisciplinary team of healthcare providers. Typically, 5 to 10 patients have consultations with providers during a 60- to 90-minute appointment.20
Part of the session is dedicated to education on the patients’ common medical condition with the goal of improving their self-management, but most of the time is spent addressing individual patient concerns.
Each patient takes a turn consulting with a provider, as in a traditional medical appointment, but in a group setting. This allows others in the group to observe and learn from their peers’ experiences. During this consultation, the patient’s concerns are addressed, medications are managed, necessary tests are ordered, and a treatment plan is made.
Patients can continue to receive follow-up care through shared medical appointments at predetermined times, instead of traditional individual medical appointments.
BENEFITS OF SHARED APPOINTMENTS
Shared medical appointments could improve patient access, clinical outcomes, and patient and provider satisfaction and decrease costs.20,21 Since being introduced in the 1990s, their use has dramatically increased. For example, in the first 2 years of conducting shared medical appointments at Cleveland Clinic (2002–2004), there were just 385 shared medical appointments,21 but in 2017 there were approximately 12,300. They are used in a variety of medical and surgical specialties, and have been studied most for treating diabetes.22–24
Increased face time and access
Individual patient follow-up visits typically last 15 to 20 minutes, limiting the provider to seeing a maximum of 6 patients in 90 minutes. In that same time in the setting of a shared appointment, a multidisciplinary team can see up to 10 patients, and the patients receive up to 90 minutes of time with multiple providers.
Additionally, shared medical appointments can improve patient access to timely appointments. In a busy bariatric surgery practice, implementing shared medical appointments reduced patients’ wait time for an appointment by more than half.25 This is particularly important for patients with obesity, who usually require 12 to 26 appointments per year.
Improved patient outcomes
Use of shared medical appointments has improved clinical outcomes compared with traditional care. Patients with type 2 diabetes who attend shared medical appointments are more likely to reach target hemoglobin A1c and blood pressure levels.22−24 These benefits may be attributed to increased access to care, improved self-management skills, more frequent visits, peer support of the group, and the synergistic knowledge of multiple providers on the shared medical appointment team.
Although some trials reported patient retention rates of 75% to 90% in shared medical appointments, many trials did not report their rates. It is likely that some patients declined randomization to avoid shared medical appointments, which could have led to potential attrition and selection biases.23
Increased patient and provider satisfaction
Both patients and providers report high satisfaction with shared medical appointments.22,26 Although patients may initially hesitate to participate, their opinions significantly improve after attending 1 session.26 From 85% to 90% of patients who attend a shared medical appointment schedule their next follow-up appointment as a shared appointment as well.21,25
In comparative studies, patients who attended shared medical appointments had satisfaction rates equal to or higher than rates in patients who participated in usual care,22 noting better access to care and more sensitivity to their needs.27 Providers report greater satisfaction from working more directly with a team of providers, clearing up a backlogged schedule, and adding variety to their practice.21,24
Decreased costs
Data on the cost-effectiveness of shared medical appointments are mixed; however, some studies have shown that they are associated with a decrease in hospital admissions and emergency department visits.22 It seems reasonable to assume that, in an appropriate patient population, shared medical appointments can be cost-effective owing to increased provider productivity, but more research is needed to verify this.
CHALLENGES TO STARTING SHARED APPOINTMENTS FOR OBESITY
Despite their potential to provide comprehensive care to patients, shared medical appointments have limitations. These need to be addressed before implementing a shared medical appointment program.
Adequate resources and staff training
To be successful, a shared medical appointment program needs to have intensive physical and staffing resources. You need a space large enough to accommodate the group and access to the necessary equipment (eg, projector, whiteboard) for educational sessions. Larger or armless chairs may better accommodate patients with obesity. Facilitators need training in how to lead the group sessions, including time management and handling conflicts between patients. Schedulers and clinical intake staff need training in answering patient questions regarding these appointments.
Maintaining patient attendance
The benefits of provider efficiency rest on having an adequate number of patients attend the shared appointments.21 Patient cancellations and no-shows decrease both the efficiency and cost-effectiveness of this model, and they detract from the peer support and group learning that occurs in the group dynamic. To help minimize patient dropout, a discussion of patient expectations should take place prior to enrollment in shared medical appointments. This should include information on the concept of shared appointments, frequency and duration of appointments, and realistic weight loss goals.
Logistical challenges
A shared medical appointment requires a longer patient time slot and is usually less flexible than an individual appointment. Not all patients can take the time for a prescheduled 60- to 90-minute appointment. However, reduced waiting-room time and increased face time with a provider offset some of these challenges.
Recruiting patients
A shared medical appointment is a novel experience for some, and concerns about it may make it a challenge to recruit patients. Patients might worry that the presence of the group will compromise the patient-doctor relationship. Other concerns include potential irrelevance of other patients’ medical issues and reluctance to participate because of body image and the stigma of obesity.
One solution is to select patients from your existing practice so that the individual patient-provider relationship is established before introducing the concept of shared appointments. You will need to explain how shared appointments work, discuss their pros and cons, stress your expectations about attendance and confidentiality, and address any concerns of the patient. It is also important to emphasize that nearly all patients find shared medical appointments useful.
Once a group is established, it may be a challenge to keep a constant group membership to promote positive group dynamics. In practice, patients may drop out or be added, and facilitators need to be able to integrate new members into the group. It is important to emphasize to the group that obesity is chronic and that patients at all stages and levels of treatment can contribute to group learning.
Despite the advantages of shared medical appointments, some patients may not find them useful, even after attending several sessions. These patients should be offered individual follow-up visits. Also, shared appointments may not be suitable for patients who cannot speak English very well, are hearing-impaired, have significant cognitive impairment, or have acute medical issues.
Maintaining patient confidentiality
Maintaining confidentiality of personal and health information in a shared medical appointment is an important concern for patients but can be appropriately managed. In a survey of patients attending pulmonary hypertension shared medical appointments, 24% had concerns about confidentiality before participating, but after a few sessions, this rate was cut in half.28
Patients have reported initially withholding some information, but over time, they usually become more comfortable with the group and disclose more helpful information.29 Strategies to ensure confidentiality include having patients sign a confidentiality agreement at each appointment, providing specific instruction on what characterizes confidentiality breaches, and allowing patients the opportunity to schedule individual appointments as needed.
Ensuring insurance coverage
A shared medical appointment should be billed as an individual medical appointment for level of care, rather than time spent with the provider. This ensures that insurance coverage and copayments are the same as for individual medical appointments.
Lack of insurance coverage is a major barrier to obesity treatment in general. The US Centers for Medicare and Medicaid Services reimburses intensive behavioral obesity treatment delivered by a primary care practitioner, but limits it to 1 year of treatment and requires patients to meet weight loss goals. Some individual and employer-based healthcare plans do not cover dietitian visits, weight management programs, or antiobesity prescriptions.
EVIDENCE OF EFFECTIVENESS IN OBESITY
Few studies have investigated the use of shared medical appointments in obesity treatment. In the pediatric population, these programs significantly decreased BMI and some other anthropometric measurements,30–32 but they did not consistently involve a prescribing provider. This means they did not manage medications or comorbidities as would be expected in a shared medical appointment.
In adults, reported effects have been encouraging, although the studies are not particularly robust. In a 2-year observational study of a single physician conducting biweekly weight management shared medical appointments, participants lost 1% of their baseline weight, while those continuing with usual care gained 0.8%, a statistically significant difference.33 However, participation rates were low, with patients attending an average of only 3 shared medical appointments during the study.
In a meta-analysis of 13 randomized controlled trials of shared medical appointments for patients with type 2 diabetes, only 3 studies reported weight outcomes.23 These results indicated a trend toward weight loss among patients attending shared appointments, but they were not statistically significant.
Positive results also were reported by the Veterans Administration’s MOVE! (Managing Overweight/obesity for Veterans Everywhere) program.34 Participants in shared medical appointments reported that they felt empowered to make positive lifestyle changes, gained knowledge about obesity, were held accountable by their peers, and appreciated the individualized care they received from the multidisciplinary healthcare teams.
A systematic review involving 336 participants in group-based obesity interventions found group treatment produced more robust weight loss than individual treatment.35 However, shared medical appointments are different from weight loss groups in that they combine an educational session and a medical appointment in a peer-group setting, which requires a provider with prescribing privileges to be present. Thus, shared medical appointments can manage medications as well as weight-related comorbidities such as diabetes, hypertension, polycystic ovarian syndrome, and hyperlipidemia.
One more point is that continued attendance at shared medical appointments, even after successful weight loss, may help to maintain the weight loss, which has otherwise been found to be extremely challenging using traditional medical approaches.
WHO SHOULD BE ON THE TEAM?
Because obesity is multifactorial, it requires a comprehensive treatment approach that can be difficult to deliver given the limited time of an individual appointment. In a shared appointment, providers across multiple specialties can meet with patients at the same time to coordinate approaches to obesity treatment.
A multidisciplinary team for shared medical appointments for obesity needs a physician or a nurse practitioner—or ideally, both— who specializes in obesity to facilitate the session. Other key providers include a registered dietitian, an exercise physiologist, a behavioral health specialist, a sleep specialist, and a social worker to participate as needed in the educational component of the appointment or act as outside consultants.
WHAT ARE REALISTIC TARGETS?

- Nutrition
- Physical activity
- Appetite control
- Sleep
- Stress and mood disorders.
Nutrition
A calorie deficit of 500 to 750 calories per day is recommended for weight loss.7,8 Although there is no consensus on the best nutritional content of a diet, adherence to a diet is a significant predictor of weight loss.36 One reason diets fail to bring about weight loss is that patients tend to underestimate their caloric intake by almost 50%.37 Thus, they may benefit from a structured and supervised diet plan.
A dietitian can help patients develop an individualized diet plan that will promote adherence, which includes specific information on food choices, portion sizes, and timing of meals.
Physical activity
At least 150 minutes of physical activity per week is recommended for weight loss, and 200 to 300 minutes per week is recommended for long-term weight maintenance.7,8
An exercise physiologist can help patients design a personalized exercise plan to help achieve these goals. This plan should take into account the patient’s cardiac status, activity level, degree of mobility, and lifestyle.
Most patients are not able to achieve the recommended physical activity goals initially, and activity levels need to be gradually increased over a period of weeks to months. Patients who were previously inactive or have evidence of cardiovascular, renal, or metabolic disease may require a cardiopulmonary assessment, including an electrocardiogram and cardiac stress test, before starting an exercise program.
Appetite control
It is very difficult for patients to lose weight without appetite control. Weight loss that results from diet and exercise is often accompanied by a change in weight-regulating hormones (eg, leptin, ghrelin, peptide YY, and cholecystokinin) that promote weight regain.38 Thus, multiple compensatory mechanisms promote weight regain through increases in appetite and decreases in energy expenditure, resisting weight loss efforts.
Antiobesity drugs can help mitigate these adaptive weight-promoting responses through several mechanisms. They are indicated for use with lifestyle interventions for patients with a BMI of at least 30 mg/kg2 or a BMI of at least 27 kg/m2 with an obesity-related comorbidity.
These drugs promote an additional 3% to 7% weight loss when added to lifestyle interventions.18 But their effects are limited without appropriate lifestyle interventions.
Sleep
Adequate sleep is an often-overlooked component of obesity treatment. Inadequate sleep is associated with weight gain and an appetite-inducing hormone profile.39 Just 2 days of sleep deprivation in healthy normal-weight adult men was associated with a 70% increase in the ghrelin-to-leptin ratio, which showed a linear relationship with self-reported increased hunger.39 Sleep disorders, especially obstructive sleep apnea, are common in patients with obesity but are often underdiagnosed and undertreated.40
Healthy sleep habits and sleep quality should be addressed in shared medical appointments for obesity, as patients may be unaware of the impact that sleep may be having on their obesity treatment. The STOP-BANG questionnaire (snoring, tiredness, observed apnea, high blood pressure, BMI, age, neck circumference, and male sex) is a simple and reliable tool to screen for obstructive sleep apnea.41 Patients with symptoms of a sleep disorder should be referred to a sleep specialist for diagnosis and management.
Stress management and mood disorders
Stress and psychiatric disorders are underappreciated contributors to obesity. All patients receiving obesity treatment need to be screened for mood disorders and suicidal ideation.8
Chronic stress promotes weight gain through activation of the hypothalamic-pituitary-adrenocortical axis, whereby increased cortisol levels enhance appetite and accumulation of visceral fat.42 In addition, obesity is associated with a 25% increased risk of mood disorders, although the mechanism and direction of this association are unclear.43 Weight gain as a side effect of antidepressant or other psychiatric medications is another important consideration.
Management of stress and psychiatric disorders through goal-setting, self-monitoring, and patient education is vital to help patients fully participate in lifestyle changes and maximize weight loss. Patients participating in shared medical appointments usually benefit from consultations with psychiatrists or psychologists to manage psychiatric comorbidities and assist with adherence to behavior modification.
IN FAVOR OF SHARED MEDICAL APPOINTMENTS FOR OBESITY
Shared medical appointments can be an effective method of addressing the challenges of treating patients with obesity, using a multidisciplinary approach that combines nutrition, physical activity, appetite suppression, sleep improvement, and stress management. In addition, shared appointments allow practitioners to treat the primary problem of excess weight, rather than just its comorbidities, recognizing that obesity is a chronic disease that requires long-term, individualized treatment. Satisfaction rates are high for both patients and providers. Overall, education is essential to implementing and maintaining a successful shared medical appointment program.
- Ogden CL, Carroll MD. National Center for Health Statistics. Prevalence of overweight, obesity, and extreme obesity among adults: United States, trends 1960-62 through 2007–2008. www.cdc.gov/nchs/data/hestat/obesity_adult_07_08/obesity_adult_07_08.pdf. Accessed August 8, 2018.
- Flegal KM, Kruszon-Moran D, Carroll MD, Fryar CD, Ogden CL. Trends in obesity among adults in the United States, 2005 to 2014. JAMA 2016; 315(21):2284–2291. doi:10.1001/jama.2016.6458
- Pantalone KM, Hobbs TM, Chagin KM, et al. Prevalence and recognition of obesity and its associated comorbidities: cross-sectional analysis of electronic health record data from a large US integrated health system. BMJ Open 2017; 7(11):e017583. doi:10.1136/bmjopen-2017-017583
- Guh DP, Zhang W, Bansback N, Amarsi Z, Birmingham CL, Anis AH. The incidence of co-morbidities related to obesity and overweight: a systematic review and meta-analysis. BMC Public Health 2009;9:88. doi:10.1186/1471-2458-9-88
- Fontaine KR, Redden DT, Wang C, Westfall AO, Allison DB. Years of life lost due to obesity. JAMA 2003; 289(2):187–193. pmid:12517229
- Tsai AG, Williamson DF, Glick HA. Direct medical cost of overweight and obesity in the United States: a quantitative systematic review. Int Assoc Study Obes Rev 2011; 12(1):50–61. doi:10.1111/j.1467-789X.2009.00708.x
- Jensen MD. Notice of duplicate publication of Jensen MD, Ryan DH, Apovian CM, et al; American College of Cardiology/American Heart Association Task Force on Practice Guidelines; Obesity Society. 2013 AHA/ACC/TOS guideline for the management of overweight and obesity in adults: a report of the American College of Cardiology/American Heart Association Task Force on Practice Guidelines and The Obesity Society. Circulation 2014; 129(25 suppl 2):S102–S138. doi:10.1161/01.cir.0000437739.71477.ee. J Am Coll Cardiol 2014; 63(25 Pt B):2985–3023. doi:10.1016/j.jacc.2013.11.004
- Garvey WT, Mechanick JI, Brett EM, et al; Reviewers of the AACE/ACE Obesity Clinical Practice Guidelines. American Association of Clinical Endocrinologists and American College of Endocrinology comprehensive clinical practice guidelines for medical care of patients with obesity: executive summary. Endocr Pract 2016; 22(7):842–884. doi:10.4158/EP161356.ESGL
- Knowler WC, Barrett-Connor E, Fowler SE, et al; Diabetes Prevention Program Research Group. Reduction in the incidence of type 2 diabetes with lifestyle intervention or metformin. N Engl J Med 2002; 346(6):393–403. doi:10.1056/NEJMoa012512
- Eriksson J, Lindstrom J, Valle T, et al. Prevention of type II diabetes in subjects with impaired glucose tolerance: The Diabetes Prevention Study (DPS) in Finland. Study design and 1-year interim report on the feasibility of the lifestyle intervention programme. Diabetologia 1999; 42(7):793–801. pmid:10440120
- Look AHEAD Research Group; Pi-Sunyer X, Blackburn G, Brancati FL, et al. Reduction in weight and cardiovascular disease risk factors in individuals with type 2 diabetes: one-year results of the look AHEAD trial. Diabetes Care 2007; 30(6):1374–1383. doi:10.2337/dc07-0048
- Burguera B, Jesús Tur J, Escudero AJ, et al. An intensive lifestyle intervention is an effective treatment of morbid obesity: the TRAMOMTANA study—a two-year randomized controlled clinical trial. Int J Endocrinol 2015; 2015:194696. doi:10.1155/2015/194696
- Moyer VA; US Preventive Services Task Force. Screening for and management of obesity in adults: US Preventative Task Force Recommendation Statement. Ann Intern Med 2012; 157(5):373–378. doi:10.7326/0003-4819-157-5-201209040-00475
- Smith AW, Borowski LA, Liu B, et al. US primary care physicians’ diet-, physical activity-, and weight-related care of adult patients. Am J Prev Med 2011; 41(1):33–42. doi:10.1016/j.amepre.2011.03.017
- Kraschnewski JL, Sciamanna CN, Stuckey HL, et al. A silent response to the obesity epidemic: decline in US physician weight counseling. Med Care 2013; 51(2):186–192. doi:10.1097/MLR.0b013e3182726c33
- Wing RR, Hill JO. Successful weight loss maintenance. Annu Rev Nutr 2001; 21:323–341. doi:10.1146/annurev.nutr.21.1.323
- Nguyen NT, Varela JE. Bariatric surgery for obesity and metabolic disorders: state of the art. Nat Rev Gastroenterol Hepatol 2017; 14(3):160–169. doi:10.1038/nrgastro.2016.170
- Yanovski SZ, Yanovski JA. Long-term drug treatment for obesity: a systematic and clinical review. JAMA 2014; 311(1):74–86. doi:10.1001/jama.2013.281361
- Xia Y, Kelton CM, Guo JJ, Bian B, Heaton PC. Treatment of obesity: pharmacotherapy trends in the United States from 1999 to 2010. Obesity (Silver Spring) 2015; 23(8):1721–1728. doi:10.1002/oby.21136
- Ramdas K, Darzi A. Adopting innovations in care delivery—the care of shared medical appointments. N Engl J Med 2017; 376(12):1105–1107. doi:10.1056/NEJMp1612803
- Bronson DL, Maxwell RA. Shared medical appointments: increasing patient access without increasing physician hours. Cleve Clin J Med 2004; 71(5):369–377. pmid:15195773
- Edelman D, McDuffie JR, Oddone E, et al. Shared Medical Appointments for Chronic Medical Conditions: A Systematic Review. Washington, DC: Department of Veterans Affairs; 2012.
- Housden L, Wong ST, Dawes M. Effectiveness of group medical visits for improving diabetes care: a systematic review and meta-analysis. CMAJ 2013; 185(13):E635–E644. doi:10.1503/cmaj.130053
- Housden LM, Wong ST. Using group medical visits with those who have diabetes: examining the evidence. Curr Diab Rep 2016; 16(12):134. doi:10.1007/s11892-016-0817-4
- Kaidar-Person O, Swartz EW, Lefkowitz M, et al. Shared medical appointments: new concept for high-volume follow-up for bariatric patients. Surg Obes Relat Dis 2006; 2(5):509–512. doi:10.1016/j.soard.2006.05.010
- Seager MJ, Egan RJ, Meredith HE, Bates SE, Norton SA, Morgan JD. Shared medical appointments for bariatric surgery follow-up: a patient satisfaction questionnaire. Obes Surg 2012; 22(4):641–645. doi:10.1007/s11695-012-0603-6
- Heyworth L, Rozenblum R, Burgess JF Jr, et al. Influence of shared medical appointments on patient satisfaction: a retrospective 3-year study. Ann Fam Med 2014; 12(4):324–330. doi:10.1370/afm.1660
- Rahaghi FF, Chastain VL, Benavides R, et al. Shared medical appointments in pulmonary hypertension. Pulm Circ 2014; 4(1):53–60. doi:10.1086/674883
- Wong ST, Lavoie JG, Browne AJ, Macleod ML, Chongo M. Patient confidentiality within the context of group medical visits: Is there cause for concern? Health Expect 2015; 18(5):727–739. doi:10.1111/hex.12156
- Geller JS, Dube ET, Cruz GA, Stevens J, Keating Bench K. Pediatric Obesity Empowerment Model Group Medical Visits (POEM-GMV) as treatment for pediatric obesity in an underserved community. Child Obes 2015; 11(5):638–646. doi:10.1089/chi.2014.0163
- Weigel C, Kokocinski K, Lederer P, Dötsch J, Rascher W, Knerr I. Childhood obesity: concept, feasibility, and interim results of a local group-based, long-term treatment program. J Nutr Educ Behav 2008; 40(6):369–373. doi:10.1016/j.jneb.2007.07.009
- Hinchman J, Beno L, Mims A. Kaiser Permanente Georgia’s experience with operation zero: a group medical appointment to address pediatric overweight. Perm J 2006; 10(3):66–71. pmid:21519478
- Palaniappan LP, Muzaffar AL, Wang EJ, Wong EC, Orchard TJ, Mbbch M. Shared medical appointments: promoting weight loss in a clinical setting. J Am Board Fam Med 2011; 24(3):326–328. doi:10.3122/jabfm.2011.03.100220
- Cohen S, Hartley S, Mavi J, Vest B, Wilson M. Veteran experiences related to participation in shared medical appointments. Mil Med 2012; 177(11):1287–1292. pmid:23198503
- Paul-Ebhohimhen V, Avenell A. A systematic review of the effectiveness of group versus individual treatments for adult obesity. Obes Facts 2009; 2(1):17–24. doi:10.1159/000186144
- Sacks FM, Bray GA, Carey VJ, et al. Comparison of weight-loss diets with different compositions of fat, protein, and carbohydrates. N Engl J Med 2009; 360(9):859–873. doi:10.1056/NEJMoa0804748
- Lichtman SW, Pisarska K, Berman ER, et al. Discrepancy between self-reported and actual caloric intake and exercise in obese subjects. N Engl J Med 1992; 327(27):1893–1898. doi:10.1056/NEJM199212313272701
- Sumithran P, Prendergast LA, Delbridge E, et al. Long-term persistence of hormonal adaptations to weight loss. N Engl J Med 2011; 365(17):1597–1604. doi:10.1056/NEJMoa1105816
- Spiegel K, Tasali E, Penev P, Van Cauter E. Brief communication: sleep curtailment in healthy young men is associated with decreased leptin levels, elevated ghrelin levels, and increased hunger and appetite. Ann Intern Med 2004; 141(11):846–850. pmid:15583226
- Kapur V, Strohl KP, Redline S, Iber C, O’Connor G, Nieto J. Underdiagnosis of sleep apnea syndrome in US communities. Sleep Breath 2002; 6(2):49–54. doi:10.1007/s11325-002-0049-5
- Chung F, Yegneswaran B, Liao P, et al. STOP questionnaire: a tool to screen patients for obstructive sleep apnea. Anesthesiology 2008; 108(5):812–821. doi:10.1097/ALN.0b013e31816d83e4
- Charmandari E, Tsigos C, Chrousos G. Endocrinology of the stress response. Annu Rev Physiol 2005; 67:259–284. doi:10.1146/annurev.physiol.67.040403.120816
- Simon GE, Von Korff M, Saunders K, et al. Association between obesity and psychiatric disorders in the US adult population. Arch Gen Psychiatry 2006; 63(7):824-830. doi:10.1001/archpsyc.63.7.824
Obesity is a major health problem in the United States. The facts are well known:
- Its prevalence has almost tripled since the early 1960s1
- More than 35% of US adults are obese (body mass index [BMI] ≥ 30 kg/m2)2
- It increases the risk of comorbid conditions including type 2 diabetes mellitus, heart disease, hypertension, obstructive sleep apnea, certain cancers, asthma, and osteoarthritis3,4
- It decreases life expectancy5
- Medical costs are up to 6 times higher per patient.6
Moreover, obesity is often not appropriately managed, owing to a variety of factors. In this article, we describe use of shared medical appointments as a strategy to improve the efficiency and effectiveness of treating patients with obesity.
Big benefits from small changes in weight
As little as 3% to 5% weight loss is associated with significant clinical benefits, such as improved glycemic control, reduced blood pressure, and reduced cholesterol levels.7,8 However, many patients are unable to reach this modest goal using current approaches to obesity management.
This failure is partially related to the complexity and chronic nature of obesity, which requires continued medical management from a multidisciplinary team. We believe this is an area of care that can be appropriately addressed through shared medical appointments.
CURRENT APPROACHES
Interventions for obesity have increased along with the prevalence of the disease. Hundreds of diets, exercise plans, natural products, and behavioral interventions are marketed, all claiming to be successful. More-intense treatment options include antiobesity medications, intra-abdominal weight loss devices, and bariatric surgery. Despite the availability of treatments, rates of obesity have not declined.
Counseling is important, but underused
Lifestyle modifications that encompass nutrition, physical activity, and behavioral interventions are the mainstay of obesity treatment.
Intensive interventions work better than less-intensive ones. In large clinical trials in overweight patients with diabetes, those who received intensive lifestyle interventions lost 3 to 5 kg more (3% to 8% of body weight) than those who received brief diet and nutrition counseling, as is often performed in a physician’s office.9–12 The US Preventive Services Task Force recommends that patients whose BMI is 30 kg/m2 or higher be offered intensive lifestyle intervention consisting of at least 12 sessions in 1 year.13
But fewer than half of primary care practitioners consistently provide specific guidance on diet, exercise, or weight control to patients with obesity, including those with a weight-related comorbidity.14 The rate has decreased since the 1990s despite the increase in obesity.15
One reason for the underuse is that many primary care practitioners do not have the training or time to deliver the recommended high-intensity obesity treatment.14 Plus, evidence does not clearly show a weight loss benefit from low-intensity interventions. Even when patients lose weight, most regain it, and only 20% are able to maintain their weight loss 1 year after treatment ends.16
Drugs and surgery also underused
Antiobesity medications and bariatric surgery are effective when added to lifestyle interventions, but they are also underused.
Bariatric surgery provides the greatest and most durable weight loss—15% to 30% of body weight—along with improvement in comorbidities such as type 2 diabetes, and its benefits are sustained for at least 10 years.17 However, fewer than 1% of eligible patients undergo bariatric surgery because of its limited availability, invasive nature, potential complications, limited insurance coverage, and high cost.17
The story is similar for antiobesity drugs. They are useful adjuncts to lifestyle interventions, providing an additional 3% to 7% weight loss,18 but fewer than 2% of eligible patients receive them.19 This may be attributed to their modest effectiveness, weight regain after discontinuation, potential adverse effects, and expense due to lack of insurance coverage.
ARE SHARED MEDICAL APPOINTMEMNTS AN ANSWER?
Although treatments have shown some effectiveness at producing weight loss, none has had a widespread impact on obesity. Lifestyle interventions, drugs, and bariatric surgery continue to be underused. Current treatment models are not providing patients with the intensive interventions needed.
Providers often find themselves offering repetitive advice to patients with obesity regarding nutrition and exercise, while simultaneously trying to manage obesity-related comorbidities, all in a 20-minute appointment. Too often, a patient returns home with prescriptions for hypertension or diabetes but no clear plan for weight management.
What can a shared medical appointment do?
A shared medical appointment is a group medical visit in which several patients with a similar clinical diagnosis, such as obesity, see a multidisciplinary team of healthcare providers. Typically, 5 to 10 patients have consultations with providers during a 60- to 90-minute appointment.20
Part of the session is dedicated to education on the patients’ common medical condition with the goal of improving their self-management, but most of the time is spent addressing individual patient concerns.
Each patient takes a turn consulting with a provider, as in a traditional medical appointment, but in a group setting. This allows others in the group to observe and learn from their peers’ experiences. During this consultation, the patient’s concerns are addressed, medications are managed, necessary tests are ordered, and a treatment plan is made.
Patients can continue to receive follow-up care through shared medical appointments at predetermined times, instead of traditional individual medical appointments.
BENEFITS OF SHARED APPOINTMENTS
Shared medical appointments could improve patient access, clinical outcomes, and patient and provider satisfaction and decrease costs.20,21 Since being introduced in the 1990s, their use has dramatically increased. For example, in the first 2 years of conducting shared medical appointments at Cleveland Clinic (2002–2004), there were just 385 shared medical appointments,21 but in 2017 there were approximately 12,300. They are used in a variety of medical and surgical specialties, and have been studied most for treating diabetes.22–24
Increased face time and access
Individual patient follow-up visits typically last 15 to 20 minutes, limiting the provider to seeing a maximum of 6 patients in 90 minutes. In that same time in the setting of a shared appointment, a multidisciplinary team can see up to 10 patients, and the patients receive up to 90 minutes of time with multiple providers.
Additionally, shared medical appointments can improve patient access to timely appointments. In a busy bariatric surgery practice, implementing shared medical appointments reduced patients’ wait time for an appointment by more than half.25 This is particularly important for patients with obesity, who usually require 12 to 26 appointments per year.
Improved patient outcomes
Use of shared medical appointments has improved clinical outcomes compared with traditional care. Patients with type 2 diabetes who attend shared medical appointments are more likely to reach target hemoglobin A1c and blood pressure levels.22−24 These benefits may be attributed to increased access to care, improved self-management skills, more frequent visits, peer support of the group, and the synergistic knowledge of multiple providers on the shared medical appointment team.
Although some trials reported patient retention rates of 75% to 90% in shared medical appointments, many trials did not report their rates. It is likely that some patients declined randomization to avoid shared medical appointments, which could have led to potential attrition and selection biases.23
Increased patient and provider satisfaction
Both patients and providers report high satisfaction with shared medical appointments.22,26 Although patients may initially hesitate to participate, their opinions significantly improve after attending 1 session.26 From 85% to 90% of patients who attend a shared medical appointment schedule their next follow-up appointment as a shared appointment as well.21,25
In comparative studies, patients who attended shared medical appointments had satisfaction rates equal to or higher than rates in patients who participated in usual care,22 noting better access to care and more sensitivity to their needs.27 Providers report greater satisfaction from working more directly with a team of providers, clearing up a backlogged schedule, and adding variety to their practice.21,24
Decreased costs
Data on the cost-effectiveness of shared medical appointments are mixed; however, some studies have shown that they are associated with a decrease in hospital admissions and emergency department visits.22 It seems reasonable to assume that, in an appropriate patient population, shared medical appointments can be cost-effective owing to increased provider productivity, but more research is needed to verify this.
CHALLENGES TO STARTING SHARED APPOINTMENTS FOR OBESITY
Despite their potential to provide comprehensive care to patients, shared medical appointments have limitations. These need to be addressed before implementing a shared medical appointment program.
Adequate resources and staff training
To be successful, a shared medical appointment program needs to have intensive physical and staffing resources. You need a space large enough to accommodate the group and access to the necessary equipment (eg, projector, whiteboard) for educational sessions. Larger or armless chairs may better accommodate patients with obesity. Facilitators need training in how to lead the group sessions, including time management and handling conflicts between patients. Schedulers and clinical intake staff need training in answering patient questions regarding these appointments.
Maintaining patient attendance
The benefits of provider efficiency rest on having an adequate number of patients attend the shared appointments.21 Patient cancellations and no-shows decrease both the efficiency and cost-effectiveness of this model, and they detract from the peer support and group learning that occurs in the group dynamic. To help minimize patient dropout, a discussion of patient expectations should take place prior to enrollment in shared medical appointments. This should include information on the concept of shared appointments, frequency and duration of appointments, and realistic weight loss goals.
Logistical challenges
A shared medical appointment requires a longer patient time slot and is usually less flexible than an individual appointment. Not all patients can take the time for a prescheduled 60- to 90-minute appointment. However, reduced waiting-room time and increased face time with a provider offset some of these challenges.
Recruiting patients
A shared medical appointment is a novel experience for some, and concerns about it may make it a challenge to recruit patients. Patients might worry that the presence of the group will compromise the patient-doctor relationship. Other concerns include potential irrelevance of other patients’ medical issues and reluctance to participate because of body image and the stigma of obesity.
One solution is to select patients from your existing practice so that the individual patient-provider relationship is established before introducing the concept of shared appointments. You will need to explain how shared appointments work, discuss their pros and cons, stress your expectations about attendance and confidentiality, and address any concerns of the patient. It is also important to emphasize that nearly all patients find shared medical appointments useful.
Once a group is established, it may be a challenge to keep a constant group membership to promote positive group dynamics. In practice, patients may drop out or be added, and facilitators need to be able to integrate new members into the group. It is important to emphasize to the group that obesity is chronic and that patients at all stages and levels of treatment can contribute to group learning.
Despite the advantages of shared medical appointments, some patients may not find them useful, even after attending several sessions. These patients should be offered individual follow-up visits. Also, shared appointments may not be suitable for patients who cannot speak English very well, are hearing-impaired, have significant cognitive impairment, or have acute medical issues.
Maintaining patient confidentiality
Maintaining confidentiality of personal and health information in a shared medical appointment is an important concern for patients but can be appropriately managed. In a survey of patients attending pulmonary hypertension shared medical appointments, 24% had concerns about confidentiality before participating, but after a few sessions, this rate was cut in half.28
Patients have reported initially withholding some information, but over time, they usually become more comfortable with the group and disclose more helpful information.29 Strategies to ensure confidentiality include having patients sign a confidentiality agreement at each appointment, providing specific instruction on what characterizes confidentiality breaches, and allowing patients the opportunity to schedule individual appointments as needed.
Ensuring insurance coverage
A shared medical appointment should be billed as an individual medical appointment for level of care, rather than time spent with the provider. This ensures that insurance coverage and copayments are the same as for individual medical appointments.
Lack of insurance coverage is a major barrier to obesity treatment in general. The US Centers for Medicare and Medicaid Services reimburses intensive behavioral obesity treatment delivered by a primary care practitioner, but limits it to 1 year of treatment and requires patients to meet weight loss goals. Some individual and employer-based healthcare plans do not cover dietitian visits, weight management programs, or antiobesity prescriptions.
EVIDENCE OF EFFECTIVENESS IN OBESITY
Few studies have investigated the use of shared medical appointments in obesity treatment. In the pediatric population, these programs significantly decreased BMI and some other anthropometric measurements,30–32 but they did not consistently involve a prescribing provider. This means they did not manage medications or comorbidities as would be expected in a shared medical appointment.
In adults, reported effects have been encouraging, although the studies are not particularly robust. In a 2-year observational study of a single physician conducting biweekly weight management shared medical appointments, participants lost 1% of their baseline weight, while those continuing with usual care gained 0.8%, a statistically significant difference.33 However, participation rates were low, with patients attending an average of only 3 shared medical appointments during the study.
In a meta-analysis of 13 randomized controlled trials of shared medical appointments for patients with type 2 diabetes, only 3 studies reported weight outcomes.23 These results indicated a trend toward weight loss among patients attending shared appointments, but they were not statistically significant.
Positive results also were reported by the Veterans Administration’s MOVE! (Managing Overweight/obesity for Veterans Everywhere) program.34 Participants in shared medical appointments reported that they felt empowered to make positive lifestyle changes, gained knowledge about obesity, were held accountable by their peers, and appreciated the individualized care they received from the multidisciplinary healthcare teams.
A systematic review involving 336 participants in group-based obesity interventions found group treatment produced more robust weight loss than individual treatment.35 However, shared medical appointments are different from weight loss groups in that they combine an educational session and a medical appointment in a peer-group setting, which requires a provider with prescribing privileges to be present. Thus, shared medical appointments can manage medications as well as weight-related comorbidities such as diabetes, hypertension, polycystic ovarian syndrome, and hyperlipidemia.
One more point is that continued attendance at shared medical appointments, even after successful weight loss, may help to maintain the weight loss, which has otherwise been found to be extremely challenging using traditional medical approaches.
WHO SHOULD BE ON THE TEAM?
Because obesity is multifactorial, it requires a comprehensive treatment approach that can be difficult to deliver given the limited time of an individual appointment. In a shared appointment, providers across multiple specialties can meet with patients at the same time to coordinate approaches to obesity treatment.
A multidisciplinary team for shared medical appointments for obesity needs a physician or a nurse practitioner—or ideally, both— who specializes in obesity to facilitate the session. Other key providers include a registered dietitian, an exercise physiologist, a behavioral health specialist, a sleep specialist, and a social worker to participate as needed in the educational component of the appointment or act as outside consultants.
WHAT ARE REALISTIC TARGETS?
- Nutrition
- Physical activity
- Appetite control
- Sleep
- Stress and mood disorders.
Nutrition
A calorie deficit of 500 to 750 calories per day is recommended for weight loss.7,8 Although there is no consensus on the best nutritional content of a diet, adherence to a diet is a significant predictor of weight loss.36 One reason diets fail to bring about weight loss is that patients tend to underestimate their caloric intake by almost 50%.37 Thus, they may benefit from a structured and supervised diet plan.
A dietitian can help patients develop an individualized diet plan that will promote adherence, which includes specific information on food choices, portion sizes, and timing of meals.
Physical activity
At least 150 minutes of physical activity per week is recommended for weight loss, and 200 to 300 minutes per week is recommended for long-term weight maintenance.7,8
An exercise physiologist can help patients design a personalized exercise plan to help achieve these goals. This plan should take into account the patient’s cardiac status, activity level, degree of mobility, and lifestyle.
Most patients are not able to achieve the recommended physical activity goals initially, and activity levels need to be gradually increased over a period of weeks to months. Patients who were previously inactive or have evidence of cardiovascular, renal, or metabolic disease may require a cardiopulmonary assessment, including an electrocardiogram and cardiac stress test, before starting an exercise program.
Appetite control
It is very difficult for patients to lose weight without appetite control. Weight loss that results from diet and exercise is often accompanied by a change in weight-regulating hormones (eg, leptin, ghrelin, peptide YY, and cholecystokinin) that promote weight regain.38 Thus, multiple compensatory mechanisms promote weight regain through increases in appetite and decreases in energy expenditure, resisting weight loss efforts.
Antiobesity drugs can help mitigate these adaptive weight-promoting responses through several mechanisms. They are indicated for use with lifestyle interventions for patients with a BMI of at least 30 mg/kg2 or a BMI of at least 27 kg/m2 with an obesity-related comorbidity.
These drugs promote an additional 3% to 7% weight loss when added to lifestyle interventions.18 But their effects are limited without appropriate lifestyle interventions.
Sleep
Adequate sleep is an often-overlooked component of obesity treatment. Inadequate sleep is associated with weight gain and an appetite-inducing hormone profile.39 Just 2 days of sleep deprivation in healthy normal-weight adult men was associated with a 70% increase in the ghrelin-to-leptin ratio, which showed a linear relationship with self-reported increased hunger.39 Sleep disorders, especially obstructive sleep apnea, are common in patients with obesity but are often underdiagnosed and undertreated.40
Healthy sleep habits and sleep quality should be addressed in shared medical appointments for obesity, as patients may be unaware of the impact that sleep may be having on their obesity treatment. The STOP-BANG questionnaire (snoring, tiredness, observed apnea, high blood pressure, BMI, age, neck circumference, and male sex) is a simple and reliable tool to screen for obstructive sleep apnea.41 Patients with symptoms of a sleep disorder should be referred to a sleep specialist for diagnosis and management.
Stress management and mood disorders
Stress and psychiatric disorders are underappreciated contributors to obesity. All patients receiving obesity treatment need to be screened for mood disorders and suicidal ideation.8
Chronic stress promotes weight gain through activation of the hypothalamic-pituitary-adrenocortical axis, whereby increased cortisol levels enhance appetite and accumulation of visceral fat.42 In addition, obesity is associated with a 25% increased risk of mood disorders, although the mechanism and direction of this association are unclear.43 Weight gain as a side effect of antidepressant or other psychiatric medications is another important consideration.
Management of stress and psychiatric disorders through goal-setting, self-monitoring, and patient education is vital to help patients fully participate in lifestyle changes and maximize weight loss. Patients participating in shared medical appointments usually benefit from consultations with psychiatrists or psychologists to manage psychiatric comorbidities and assist with adherence to behavior modification.
IN FAVOR OF SHARED MEDICAL APPOINTMENTS FOR OBESITY
Shared medical appointments can be an effective method of addressing the challenges of treating patients with obesity, using a multidisciplinary approach that combines nutrition, physical activity, appetite suppression, sleep improvement, and stress management. In addition, shared appointments allow practitioners to treat the primary problem of excess weight, rather than just its comorbidities, recognizing that obesity is a chronic disease that requires long-term, individualized treatment. Satisfaction rates are high for both patients and providers. Overall, education is essential to implementing and maintaining a successful shared medical appointment program.
- Ogden CL, Carroll MD. National Center for Health Statistics. Prevalence of overweight, obesity, and extreme obesity among adults: United States, trends 1960-62 through 2007–2008. www.cdc.gov/nchs/data/hestat/obesity_adult_07_08/obesity_adult_07_08.pdf. Accessed August 8, 2018.
- Flegal KM, Kruszon-Moran D, Carroll MD, Fryar CD, Ogden CL. Trends in obesity among adults in the United States, 2005 to 2014. JAMA 2016; 315(21):2284–2291. doi:10.1001/jama.2016.6458
- Pantalone KM, Hobbs TM, Chagin KM, et al. Prevalence and recognition of obesity and its associated comorbidities: cross-sectional analysis of electronic health record data from a large US integrated health system. BMJ Open 2017; 7(11):e017583. doi:10.1136/bmjopen-2017-017583
- Guh DP, Zhang W, Bansback N, Amarsi Z, Birmingham CL, Anis AH. The incidence of co-morbidities related to obesity and overweight: a systematic review and meta-analysis. BMC Public Health 2009;9:88. doi:10.1186/1471-2458-9-88
- Fontaine KR, Redden DT, Wang C, Westfall AO, Allison DB. Years of life lost due to obesity. JAMA 2003; 289(2):187–193. pmid:12517229
- Tsai AG, Williamson DF, Glick HA. Direct medical cost of overweight and obesity in the United States: a quantitative systematic review. Int Assoc Study Obes Rev 2011; 12(1):50–61. doi:10.1111/j.1467-789X.2009.00708.x
- Jensen MD. Notice of duplicate publication of Jensen MD, Ryan DH, Apovian CM, et al; American College of Cardiology/American Heart Association Task Force on Practice Guidelines; Obesity Society. 2013 AHA/ACC/TOS guideline for the management of overweight and obesity in adults: a report of the American College of Cardiology/American Heart Association Task Force on Practice Guidelines and The Obesity Society. Circulation 2014; 129(25 suppl 2):S102–S138. doi:10.1161/01.cir.0000437739.71477.ee. J Am Coll Cardiol 2014; 63(25 Pt B):2985–3023. doi:10.1016/j.jacc.2013.11.004
- Garvey WT, Mechanick JI, Brett EM, et al; Reviewers of the AACE/ACE Obesity Clinical Practice Guidelines. American Association of Clinical Endocrinologists and American College of Endocrinology comprehensive clinical practice guidelines for medical care of patients with obesity: executive summary. Endocr Pract 2016; 22(7):842–884. doi:10.4158/EP161356.ESGL
- Knowler WC, Barrett-Connor E, Fowler SE, et al; Diabetes Prevention Program Research Group. Reduction in the incidence of type 2 diabetes with lifestyle intervention or metformin. N Engl J Med 2002; 346(6):393–403. doi:10.1056/NEJMoa012512
- Eriksson J, Lindstrom J, Valle T, et al. Prevention of type II diabetes in subjects with impaired glucose tolerance: The Diabetes Prevention Study (DPS) in Finland. Study design and 1-year interim report on the feasibility of the lifestyle intervention programme. Diabetologia 1999; 42(7):793–801. pmid:10440120
- Look AHEAD Research Group; Pi-Sunyer X, Blackburn G, Brancati FL, et al. Reduction in weight and cardiovascular disease risk factors in individuals with type 2 diabetes: one-year results of the look AHEAD trial. Diabetes Care 2007; 30(6):1374–1383. doi:10.2337/dc07-0048
- Burguera B, Jesús Tur J, Escudero AJ, et al. An intensive lifestyle intervention is an effective treatment of morbid obesity: the TRAMOMTANA study—a two-year randomized controlled clinical trial. Int J Endocrinol 2015; 2015:194696. doi:10.1155/2015/194696
- Moyer VA; US Preventive Services Task Force. Screening for and management of obesity in adults: US Preventative Task Force Recommendation Statement. Ann Intern Med 2012; 157(5):373–378. doi:10.7326/0003-4819-157-5-201209040-00475
- Smith AW, Borowski LA, Liu B, et al. US primary care physicians’ diet-, physical activity-, and weight-related care of adult patients. Am J Prev Med 2011; 41(1):33–42. doi:10.1016/j.amepre.2011.03.017
- Kraschnewski JL, Sciamanna CN, Stuckey HL, et al. A silent response to the obesity epidemic: decline in US physician weight counseling. Med Care 2013; 51(2):186–192. doi:10.1097/MLR.0b013e3182726c33
- Wing RR, Hill JO. Successful weight loss maintenance. Annu Rev Nutr 2001; 21:323–341. doi:10.1146/annurev.nutr.21.1.323
- Nguyen NT, Varela JE. Bariatric surgery for obesity and metabolic disorders: state of the art. Nat Rev Gastroenterol Hepatol 2017; 14(3):160–169. doi:10.1038/nrgastro.2016.170
- Yanovski SZ, Yanovski JA. Long-term drug treatment for obesity: a systematic and clinical review. JAMA 2014; 311(1):74–86. doi:10.1001/jama.2013.281361
- Xia Y, Kelton CM, Guo JJ, Bian B, Heaton PC. Treatment of obesity: pharmacotherapy trends in the United States from 1999 to 2010. Obesity (Silver Spring) 2015; 23(8):1721–1728. doi:10.1002/oby.21136
- Ramdas K, Darzi A. Adopting innovations in care delivery—the care of shared medical appointments. N Engl J Med 2017; 376(12):1105–1107. doi:10.1056/NEJMp1612803
- Bronson DL, Maxwell RA. Shared medical appointments: increasing patient access without increasing physician hours. Cleve Clin J Med 2004; 71(5):369–377. pmid:15195773
- Edelman D, McDuffie JR, Oddone E, et al. Shared Medical Appointments for Chronic Medical Conditions: A Systematic Review. Washington, DC: Department of Veterans Affairs; 2012.
- Housden L, Wong ST, Dawes M. Effectiveness of group medical visits for improving diabetes care: a systematic review and meta-analysis. CMAJ 2013; 185(13):E635–E644. doi:10.1503/cmaj.130053
- Housden LM, Wong ST. Using group medical visits with those who have diabetes: examining the evidence. Curr Diab Rep 2016; 16(12):134. doi:10.1007/s11892-016-0817-4
- Kaidar-Person O, Swartz EW, Lefkowitz M, et al. Shared medical appointments: new concept for high-volume follow-up for bariatric patients. Surg Obes Relat Dis 2006; 2(5):509–512. doi:10.1016/j.soard.2006.05.010
- Seager MJ, Egan RJ, Meredith HE, Bates SE, Norton SA, Morgan JD. Shared medical appointments for bariatric surgery follow-up: a patient satisfaction questionnaire. Obes Surg 2012; 22(4):641–645. doi:10.1007/s11695-012-0603-6
- Heyworth L, Rozenblum R, Burgess JF Jr, et al. Influence of shared medical appointments on patient satisfaction: a retrospective 3-year study. Ann Fam Med 2014; 12(4):324–330. doi:10.1370/afm.1660
- Rahaghi FF, Chastain VL, Benavides R, et al. Shared medical appointments in pulmonary hypertension. Pulm Circ 2014; 4(1):53–60. doi:10.1086/674883
- Wong ST, Lavoie JG, Browne AJ, Macleod ML, Chongo M. Patient confidentiality within the context of group medical visits: Is there cause for concern? Health Expect 2015; 18(5):727–739. doi:10.1111/hex.12156
- Geller JS, Dube ET, Cruz GA, Stevens J, Keating Bench K. Pediatric Obesity Empowerment Model Group Medical Visits (POEM-GMV) as treatment for pediatric obesity in an underserved community. Child Obes 2015; 11(5):638–646. doi:10.1089/chi.2014.0163
- Weigel C, Kokocinski K, Lederer P, Dötsch J, Rascher W, Knerr I. Childhood obesity: concept, feasibility, and interim results of a local group-based, long-term treatment program. J Nutr Educ Behav 2008; 40(6):369–373. doi:10.1016/j.jneb.2007.07.009
- Hinchman J, Beno L, Mims A. Kaiser Permanente Georgia’s experience with operation zero: a group medical appointment to address pediatric overweight. Perm J 2006; 10(3):66–71. pmid:21519478
- Palaniappan LP, Muzaffar AL, Wang EJ, Wong EC, Orchard TJ, Mbbch M. Shared medical appointments: promoting weight loss in a clinical setting. J Am Board Fam Med 2011; 24(3):326–328. doi:10.3122/jabfm.2011.03.100220
- Cohen S, Hartley S, Mavi J, Vest B, Wilson M. Veteran experiences related to participation in shared medical appointments. Mil Med 2012; 177(11):1287–1292. pmid:23198503
- Paul-Ebhohimhen V, Avenell A. A systematic review of the effectiveness of group versus individual treatments for adult obesity. Obes Facts 2009; 2(1):17–24. doi:10.1159/000186144
- Sacks FM, Bray GA, Carey VJ, et al. Comparison of weight-loss diets with different compositions of fat, protein, and carbohydrates. N Engl J Med 2009; 360(9):859–873. doi:10.1056/NEJMoa0804748
- Lichtman SW, Pisarska K, Berman ER, et al. Discrepancy between self-reported and actual caloric intake and exercise in obese subjects. N Engl J Med 1992; 327(27):1893–1898. doi:10.1056/NEJM199212313272701
- Sumithran P, Prendergast LA, Delbridge E, et al. Long-term persistence of hormonal adaptations to weight loss. N Engl J Med 2011; 365(17):1597–1604. doi:10.1056/NEJMoa1105816
- Spiegel K, Tasali E, Penev P, Van Cauter E. Brief communication: sleep curtailment in healthy young men is associated with decreased leptin levels, elevated ghrelin levels, and increased hunger and appetite. Ann Intern Med 2004; 141(11):846–850. pmid:15583226
- Kapur V, Strohl KP, Redline S, Iber C, O’Connor G, Nieto J. Underdiagnosis of sleep apnea syndrome in US communities. Sleep Breath 2002; 6(2):49–54. doi:10.1007/s11325-002-0049-5
- Chung F, Yegneswaran B, Liao P, et al. STOP questionnaire: a tool to screen patients for obstructive sleep apnea. Anesthesiology 2008; 108(5):812–821. doi:10.1097/ALN.0b013e31816d83e4
- Charmandari E, Tsigos C, Chrousos G. Endocrinology of the stress response. Annu Rev Physiol 2005; 67:259–284. doi:10.1146/annurev.physiol.67.040403.120816
- Simon GE, Von Korff M, Saunders K, et al. Association between obesity and psychiatric disorders in the US adult population. Arch Gen Psychiatry 2006; 63(7):824-830. doi:10.1001/archpsyc.63.7.824
KEY POINTS
- Shared medical appointments have been shown to improve clinical outcomes and patient satisfaction compared with traditional care. However, they have not been well studied in patients with obesity.
- A shared medical appointment allows multiple patients to be medically managed by a multidisciplinary team, promoting more efficient delivery of care.
- Both patients and practitioners are satisfied with shared medical appointments and find them clinically useful.

Coronary artery calcium scoring: Its practicality and clinical utility in primary care
The United States has seen a decline in fatal myocardial infarctions, largely thanks to early detection of coronary artery disease. Current guidelines on assessment of cardiovascular risk still rely on the traditional 10-year risk model in clinical practice. However, the predictive value of this approach is only moderate, and many coronary events occur in people considered to be at low or intermediate risk.
Coronary artery calcium scoring has emerged as a means of risk stratification by direct measurement of disease. Primary care providers are either using it or are seeing it used by consulting physicians, and its relatively low cost and ease of performance have contributed to its widespread use. However, downstream costs, radiation exposure, and lack of randomized controlled trials have raised concerns.
This article reviews the usefulness and pitfalls of coronary artery calcium scoring, providing a better understanding of the test, its limitations, and the interpretation of results.
ATHEROSCLEROSIS AND CALCIUM

As the calcium deposits grow, they can be detected by imaging tests such as computed tomography (CT), and quantified to assess the extent of disease.4
CALCIFICATION AND CORONARY ARTERY DISEASE
Coronary calcification occurs almost exclusively in atherosclerosis. Several autopsy studies5,6 and histopathologic studies7 have shown a direct relationship between the extent of calcification and atherosclerotic disease.
Sangiorgi et al7 performed a histologic analysis of 723 coronary artery segments. The amount of calcium correlated well with the area of plaque:
- r = 0.89, P < .0001 in the left anterior descending artery
- r = 0.7, P < .001 in the left circumflex artery
- r = 0.89, P < .0001 in the right coronary artery.
Coronary artery calcium has also been associated with obstructive coronary artery disease in studies using intravascular ultrasonography and optical coherence tomography.8,9
TECHNICAL INFORMATION ABOUT THE TEST
First-generation CT scanners used for calcium scoring in the 1980s were electron-beam systems in which a stationary x-ray tube generated an oscillating electron beam, which was reflected around the patient table.10 A single, stationary detector ring captured the images.
These systems have been replaced by multidetector scanners, in which the x-ray tube and multiple rows of detectors are combined in a gantry that rotates at high speed around the patient.
Coronary calcium is measured by noncontrast CT of the heart. Thus, there is no risk of contrast-induced nephropathy or allergic reactions. Images are acquired while the patient holds his or her breath for 3 to 5 seconds. Electrocardiographic gating is used to reduce motion artifact.11,12 With modern scanners, the effective radiation dose associated with calcium testing is as low as 0.5 to 1.5 mSv,13,14 ie, about the same dose as that with mammography. The entire test takes 10 to 15 minutes.


The results fall into 4 categories, which correlate with the severity of coronary artery disease, ranging from no significant disease to severe disease (Table 1). Other scores, which are not commonly used, include the calcium volume score16 and the calcium mass score.17 Figure 2 shows a screenshot from a coronary artery calcium scoring program.
CALCIUM SCORING AS A DIAGNOSTIC TOOL
Early multicenter studies evaluated the utility of calcium scoring to predict coronary stenosis in patients who underwent both cardiac CT and coronary angiography. The sensitivity of calcium scoring for angiographically significant disease was high (95%), but its specificity was low (about 44%).18
Budoff et al,19 reviewing these and subsequent results, concluded that the value of calcium scoring is its high negative predictive value (about 98%); a negative score (no calcification) is strongly associated with the absence of obstructive coronary disease.
Blaha et al20 concluded that a score of 0 would indicate that the patient had a low risk of cardiovascular disease. A test with these characteristics is helpful in excluding cardiovascular disease or at least in determining that it is less likely to be present in a patient deemed to be at intermediate risk.
CALCIUM SCORING AS A PROGNOSTIC TOOL
Early on, investigators recognized the value of calcium scoring in predicting the risk of future cardiovascular events and death.21–25
Predicting cardiovascular events
Pletcher et al21 performed a meta-analysis of studies that measured calcification in asymptomatic patients with subsequent follow-up. The summary-adjusted relative risk of cardiac events such as myocardial infarction, coronary artery revascularization, and coronary heart disease-related death rose with the calcium score:
- 2.1 (95% confidence interval [CI] 1.6–2.9) with a score of 1 to 100
- 4.2 (95% CI 2.5–7.2) with scores of 101 to 400
- 7.2 (95% CI 3.9-13.0) with scores greater than 400.
The meta-analysis was limited in that it included only 4 studies, which were observational.
Kavousi et al,22 in a subsequent meta-analysis of 6,739 women at low risk of atherosclerotic cardiovascular disease based on the American College of Cardiology/American Heart Association (ACC/AHA) pooled cohort equation (10-year risk < 7.5%), found that 36.1% had calcium scores greater than 0. Compared with those whose score was 0, those with higher scores had a higher risk of atherosclerotic cardiovascular disease events. The incidence rates per 1,000 person-years were 1.41 vs 4.33 (relative risk 2.92, 95% CI 2.02–3.83; multivariable-adjusted hazard ratio 2.04, 95% CI 1.44–2.90). This study was limited because the population was mostly of European descent, making it less generalizable to non-European populations.
Calcium scoring has also been shown to be a strong predictor of incident cardiovascular events across different races beyond traditional risk factors such as hypertension, hyperlipidemia, and tobacco use.
Detrano et al,23 in a study of 6,722 patients with diverse ethnic backgrounds, found that the adjusted risk of a coronary event was increased by a factor of 7.73 for calcium scores between 101 and 300 and by a factor of 9.67 for scores above 300 (P < .001). A limitation of this study was that the patients and physicians were informed of the scores, which could have led to bias.
Carr et al24 found an association between calcium and coronary heart disease in a younger population (ages 32–46). In 12.5 years of follow-up, the hazard ratio for cardiovascular events increased exponentially with the calcium score:
- 2.6 (95% CI 1.0–5.7, P = .03) with calcium scores of 1 through 19
- 9.8 (95% CI 4.5–20.5, P < .001) with scores greater than 100.
Predicting mortality
Budoff et al,25 in an observational study of 25,253 patients, found coronary calcium to be an independent predictor of mortality in a multivariable model controlling for age, sex, ethnicity, and cardiac risk factors (model chi-square = 2,017, P < .0001). However, most of the patients were already known to have cardiac risk factors, making the study findings less generalizable to the general population.
Nasir et al26 found that mortality rates rose with the calcium score in a study with 44,052 participants. The annualized mortality rates per 1,000 person-years were:
- 0.87 (95% CI 0.72–1.06) with a score of 0
- 2.97 (95% CI 2.61–3.37) with scores of 1–100
- 6.90 (95% CI 6.02–7.90) with scores of 101–400
- 17.68 (95% CI 5.93–19.62) with scores higher than 400.
The mortality rate also rose with the number of traditional risk factors present, ie, current tobacco use, dyslipidemia, diabetes mellitus, hypertension, and family history of coronary artery disease. Interestingly, those with no risk factors but a calcium score greater than 400 had a higher mortality rate than those with no coronary calcium but more than 3 risk factors (16.89 per 1,000 person-years vs 2.72 per 1,000 person years). As in the previous study, the patient population that was analyzed was at high risk and therefore the findings are not generalizable.
Shaw et al27 found that patients without symptoms but with elevated coronary calcium scores had higher all-cause mortality rates at 15 years than those with a score of 0. The difference remained significant after Cox regression was performed, adjusting for traditional risk factors.
Coronary artery calcium scoring vs other risk-stratification methods
Current guidelines on assessing risk still rely on the traditional 10-year risk model in clinical practice.25 Patients are thus classified as being at low, intermediate, or high risk based on their probability of developing a cardiovascular event or cardiovascular disease-related death in the subsequent 10 years.
However, the predictive value of this approach is only moderate,28 and a significant number of cardiovascular events, including sudden cardiac death, occur in people who were believed to be at low or intermediate risk according to traditional risk factor-based predictions. Because risk scores are strongly influenced by age,29 they are least reliable in young adults.30
Akosah et al31 reviewed the records of 222 young adults (women age 55 or younger, men age 65 or younger) who presented with their first myocardial infarction, and found that only 25% would have qualified for primary prevention pharmacologic treatments according to the National Cholesterol Education Program III guidelines.32,33 Similar findings have been reported regarding previous versions of the risk scores.33
Thus, risk predictions based exclusively on traditional risk factors are not sensitive for detecting young individuals at increased risk, and lead to late treatment of young adults with atherosclerosis, which may be a less effective strategy.34
The reliance on age in risk algorithms also results in low specificity in elderly adults. Using risk scores, elderly adults are systematically stratified in higher risk categories, expanding the indication for statin therapy to almost all men age 65 or older regardless of their actual vascular health, according to current clinical practice guidelines.35,36
Risk scores are based on self-reported history and single-day measurements, since this kind of information is readily available to the physician in the clinic. Moreover, our knowledge about genetic and epigenetic factors associated with the development of atherosclerosis is still in its infancy, with current guidelines not supporting genetic testing as part of cardiovascular risk assessment.37 Thus, a reliable measure of an individual’s lifelong exposure to a number of environmental and genetic factors that may affect cardiovascular health appears unfeasible.
Atherosclerosis is a process in which interactions between genetic, epigenetic, environmental, and traditional risk factors result in subclinical inflammation that could develop into clinically significant disease. Therefore, subclinical coronary atherosclerosis has been shown to be a strong predictor of future incident cardiovascular disease events and death. Thus, alternative approaches that directly measure disease, such as calcium scoring, may help further refine risk stratification of cardiovascular disease.
The MESA trial (Multi-Ethnic Study of Atherosclerosis), for instance, in 6,814 participants, found coronary calcium to provide better discrimination and risk reclassification than the ankle-brachial index, high sensitivity C-reactive protein level, and family history.38 Coronary calcium also had the highest incremental improvement of the area under the receiver operating curve when added to the Framingham Risk Score (0.623 vs 0.784).
Reclassifying cardiovascular risk also has implications regarding whether to start therapies such as statins and aspirin.
For considering statin therapy
Nasir et al39 showed that, in patients eligible for statin therapy by the pooled cohort equation, the absence of coronary artery calcium reclassified approximately one-half of candidates as not eligible for statin therapy. The number needed to treat to prevent an atherosclerotic cardiovascular event in the population who were recommended a statin was 64 with a calcium score of 0, and 24 with a calcium score greater than 100. In the population for whom a statin was considered, the number needed to treat was 223 with a calcium score of 0 and 46 for those with a score greater than 100. Moreover, 57% of intermediate-risk patients and 41% of high-risk patients based on the Framingham Risk Score were found to have a calcium score of 0, implying that these patients may actually be at a lower risk.
The Society of Cardiovascular Computed Tomography guidelines40 say that statin therapy can be considered in patients who have a calcium score greater than 0.
For considering aspirin therapy
Miedema et al41 studied the role of coronary artery calcium in guiding aspirin therapy in 4,229 participants in the MESA trial who were not taking aspirin at baseline. Those with a calcium score higher than 100 had a number needed to treat of 173 in the group with a Framingham Risk Score less than 10% and 92 with a Framingham Risk Score of 10% or higher. The estimated number needed to harm for a major bleeding event was 442. For those who had a score of 0, the estimated number needed to treat was 2,036 for a Framingham Risk Score less than 10% and 808 for a Framingham Risk Score of 10% or higher, with an estimated number needed to harm of 442 for a major bleeding event.
The Society of Cardiovascular Computed Tomography guidelines40 recommend considering aspirin therapy for patients with a coronary calcium score of more than 100.
McClelland et al42 developed a MESA risk score to predict 10-year risk of coronary heart disease using the traditional risk factors along with coronary calcium. The score was validated externally with 2 separate longitudinal studies. Thus, this may serve as another tool to help providers further risk-stratify patients.
COST-EFFECTIVENESS OF THE TEST
As coronary calcium measurement began to be widely used, concerns were raised about the lack of data on its cost-effectiveness.
Cost-effectiveness depends not only on patient selection but also on the cost of therapy. For example, if the cost of a generic statin is $85 per year, then calcium scoring would not be beneficial. However, if the cost of a statin is more than $200, then calcium scoring would be much more cost-effective, offering a way to avoid treating some patients who do not need to be treated.43
Hong et al43 showed that coronary calcium testing was cost-effective when the patient and physician share decision-making about initiating statin therapy. This is especially important if the patient has financial limitations, is concerned about side effects, or wants to avoid taking unnecessary medications.
RISKS AND DOWNSIDES OF CALCIUM SCORING
According to some reports, $8.5 billion is spent annually for low-value care.44 Many of the 80 million CT scans performed annually in the United States are believed to be unnecessary and may lead to additional testing to investigate incidental findings.45
Growing use of coronary calcium measurement has raised similar concerns about radiation exposure, healthcare costs, and increased downstream testing triggered by the detection of incidental noncardiac findings. For instance, Onuma et al46 reported that, in 503 patients undergoing CT to evaluate coronary artery disease, noncardiac findings were seen in 58.1% of them, but only 22.7% of the 503 had clinically significant findings.
Some of these concerns have been addressed. Modern scanners can acquire images in only a few seconds, entailing lower radiation doses than in the past.13,14 The cost of the test is currently less than $100 in many US metropolitan areas.47 However, further studies are needed to adequately and cost-effectively guide follow-up imaging of incidental noncardiac findings.48
An important limitation of calcium scoring for risk assessment is that no randomized controlled trial has evaluated the impact of preventive interventions guided by calcium scores on hard event outcomes. It can be argued that there have been plenty of observational studies that have shown the benefit of coronary calcium scoring when judiciously done in the appropriate population.49 Similarly, no randomized controlled trial has tested the pooled cohort equation and the application of statins based on its use with the current guidelines. The feasibility and cost of a large randomized controlled trial to assess outcomes after coronary artery calcium measurement must also be considered.
Another limitation of coronary calcium scoring is that it cannot rule out the presence of noncalcified atherosclerotic plaque, which often is more unstable and prone to rupture.
In addition, calcification in the coronary vascular bed (even if severe) does not necessarily mean there is clinically relevant coronary stenosis. For instance, an asymptomatic patient could have a coronary artery calcium score higher than 100 and then get a coronary angiogram that reveals only a 30% lesion in the left anterior descending coronary artery. This is because accumulation of (calcified) plaque in the vessel wall is accommodated by expansion of vessel diameter, maintaining luminal dimensions (positive remodeling). By definition, this patient does have coronary artery disease but would be best served by medical management. This could have been determined without an invasive test in an otherwise asymptomatic patient. Thus, performing coronary angiography based on a coronary artery calcium score alone would not have changed this patient’s management and may have exposed the patient to risks of procedural complications, in addition to extra healthcare costs. Therefore, the presence or absence of symptoms should guide the clinician on whether to pursue stress testing for invasive coronary angiography based on the appropriate use criteria.50,51
WHO SHOULD BE TESTED?
In the ACC/AHA 2013 guidelines,37 coronary calcium scoring has a class IIB recommendation in scenarios where it may appear that the risk-based treatment decision is uncertain after formal risk estimation has been done. As discussed above, a score higher than 100 could be a rationale for starting aspirin therapy, and a score higher than 0 for statin therapy. The current guidelines also mention that the coronary calcium score is comparable to other predictors such as the C-reactive protein level and the ankle-brachial index.
Compared with the ACC/AHA guidelines, the 2016 Society of Cardiovascular Computed Tomography guidelines and expert consensus recently have added more specifics in terms of using this test for asymptomatic patients at intermediate risk (10-year risk of atherosclerotic cardiovascular disease 5%–20%) and in selected patients with a family history of premature coronary artery disease and 10-year risk less than 5%.40,52 The 2010 ACC/AHA guidelines were more specific, offering a class IIA recommendation for patients who were at intermediate risk (Framingham Risk Score 10%–20%).53
The ACC/AHA cited cost and radiation exposure as reasons they did not give coronary calcium measurement a stronger recommendation.37 However, as data continue to come in, the guidelines may change, especially since low-dose radiation tools are being used for cancer screening (lungs and breast) and since the cost has declined over the past decade.
OUR APPROACH
Given the negative predictive value of the coronary calcium score, our approach has been to use this test in asymptomatic patients who are found to be at intermediate risk of atherosclerotic cardiovascular disease based on the ACC/AHA risk calculation and are reluctant to start pharmacologic therapy, or who want a more personalized measure of coronary artery disease. This is preceded by a lengthy patient-physician discussion about the risks and benefits of the test.54
The patient’s risk can then be further clarified and possibly reclassified as either low or high if it doesn’t remain intermediate. A discussion can then take place on potentially starting pharmacologic therapy, intensive lifestyle modifications, or both.54,55 If an electronic medical record is available, CT results can be shown to the patient in the office to point out coronary calcifications. Seeing the lesions may serve an as additional motivating factor as patients embark on primary preventive efforts.56
Below, we describe cases of what we would consider appropriate and inappropriate use of coronary artery calcium scoring.
Example 1
A 55-year-old man presents for an annual physical and is found to have a 10-year risk of atherosclerotic cardiovascular disease of 7%, placing him in the intermediate-risk category. Despite an extensive conversation about lifestyle modifications and pharmacologic therapy, he is reluctant to initiate these measures. He is otherwise asymptomatic. Would calcium scoring be reasonable?
Yes, it would be reasonable to perform coronary artery calcium scoring in an otherwise asymptomatic man to help reclassify his risk for a coronary vascular event. The objective data provided by the test could motivate the patient to undertake primary prevention efforts or, if his score is 0, to show that he may not need drug therapy.
Example 2
A 55-year-old man who has a family history of coronary artery disease, is an active smoker, and has diabetes mellitus presents to the clinic with 2 months of exertional chest pain that resolves with rest. Would coronary artery calcium scoring be reasonable?
This patient is symptomatic and is at high risk of coronary artery disease. Statin therapy is already indicated in the AHA/ACC guidelines, since he has diabetes. Therefore, calcium scoring would not be helpful, as it would not change this patient’s management. Instead, he would be best served by stress testing or coronary angiography based on the stability of his symptoms and cardiac biomarkers.
Example 3
A 30-year-old woman with no medical history presents with on-and-off chest pain at both exertion and rest. Her electrocardiogram is unremarkable, and cardiac enzyme tests are negative. Would coronary calcium scoring be reasonable?
This young patient’s story is not typical for coronary artery disease. Therefore, she has a low pretest probability of obstructive coronary artery disease. Moreover, calcium scoring may not be helpful because at her young age there has not been enough time for calcification to develop (median age is the fifth decade of life). Thus, she would be exposed to radiation unnecessarily at a young age.
What to do with an elevated calcium score?
Coronary artery calcification is now being incidentally detected as patients undergo CT for other reasons such as screening for lung cancer based on the US Preventive Services Task Force guidelines. Patients may also get the test done on their own and then present to a provider with an elevated score.
It is important to consider the entire clinical scenario in such patients and not just the score. If a patient presents with an elevated calcium score but has no symptoms and falls in the intermediate-risk group, there is evidence to suggest that he or she should be started on statin or aspirin therapy or both.
As mentioned above, an abnormal test result does not mean that the patient should undergo more-invasive testing such as cardiac catheterization or even stress testing, especially if he or she has no symptoms. However, if the patient is symptomatic, then further cardiac evaluation would be recommended.
SUMMARY
Measuring coronary artery calcium has been found to be valuable in detecting coronary artery disease and in predicting cardiovascular events and death. The test is relatively easy to perform, with newer technology allowing for less radiation and cost. It serves as a more personalized measure of disease and can help facilitate patient-physician discussions about starting pharmacologic therapy, especially if a patient is reluctant.
Currently, coronary calcium scoring has a class IIB recommendation in scenarios in which the risk-based treatment decision is uncertain after formal risk estimation has been done according to the ACC/AHA guideline. The Society of Cardiovascular Computed Tomography guideline and expert consensus documents are more specific in recommending the test in asymptomatic patients in the intermediate-risk group.
Limitations of calcium scoring include the possibility of unnecessary cardiovascular testing such as cardiac catheterization or stress testing being driven by the calcium score alone, as well as the impact of incidental findings. With increased reporting of the coronary calcium score in patients undergoing CT for lung cancer screening, the score should be interpreted in view of the entire clinical scenario.
- Hansson GK. Inflammation, atherosclerosis and coronary artery disease. N Engl J Med 2005; 352(16):1685–1695. doi:10.1056/NEJM199408183310709
- Ross R. Atherosclerosis—an inflammatory disease. N Engl J Med 1999; 340(2):115–126. doi:10.1056/NEJM199901143400207
- Stary HC, Chandler AB, Dinsmore RE, et al. A definition of advanced types of atherosclerotic lesions and a histological classification of atherosclerosis: a report from the Committee on Vascular Lesions of the Council on Arteriosclerosis, American Heart Association. Arterioscler Thromb Vasc Biol 1995; 15(9):1512–1531. doi:10.1161/atvb.15.9.1512
- Maurovich-Horvat P, Ferencik M, Voros S, Merkely B, Hoffmann U. Comprehensive plaque assessment by coronary CT angiography. Nat Rev Cardiol 2014; 11(7):390–402. doi:10.1038/nrcardio.2014.60
- Eggen DA, Strong JP, McGill HC. Coronary calcification. Relationship to clinically significant coronary lesions and race, sex, and topographic distribution. Circulation 1965; 32(6):948–955. pmid:5845254
- Oliver MF, Samuel E, Morley P, Young GB, Kapur PL. Detection of coronary-artery calcification during life. Lancet 1964; 283(7339):891–895. doi:10.1016/S0140-6736(64)91625-3
- Sangiorgi G, Rumberger JA, Severson A, et al. Arterial calcification and not lumen stenosis is highly correlated with atherosclerotic plaque burden in humans: a histologic study of 723 coronary artery segments using nondecalcifying methodology. J Am Coll Cardiol 1998; 31(1):126–133. doi:10.1016/S0735-1097(97)00443-9
- Baumgart D, Schmermund A, Goerge G, et al. Comparison of electron beam computed tomography with intracoronary ultrasound and coronary angiography for detection of coronary atherosclerosis. J Am Coll Cardiol 1997; 30(1):57–64. pmid:9207621
- Krishnamoorthy P, Vengrenyuk Y, Ueda H, et al. Three-dimensional volumetric assessment of coronary artery calcification in patients with stable coronary artery disease by OCT. EuroIntervention 2017; 13(3):312–319. doi:10.4244/EIJ-D-16-00139
- Budoff MJ, Achenbach S, Blumenthal RS, et al. Assessment of coronary artery disease by cardiac computed tomography: a scientific statement from the American Heart Association Committee on Cardiovascular Imaging and Intervention, Council on Cardiovascular Radiology and Intervention, and Committee on C. Circulation 2006; 114(16):1761–1791. doi:10.1161/CIRCULATIONAHA.106.178458
- Schoepf UJ, Becker CR, Bruening RD, et al. Electrocardiographically gated thin-section CT of the lung. Radiology 1999; 212(3):649–654. doi:10.1148/radiology.212.3.r99se08649
- Abbara S, Arbab-Zadeh A, Callister TQ, et al. SCCT guidelines for performance of coronary computed tomographic angiography: a report of the Society of Cardiovascular Computed Tomography Guidelines Committee. J Cardiovasc Comput Tomogr 2009; 3(3):190–204. doi:10.1016/j.jcct.2009.03.004
- Nakazato R, Dey D, Gutstein A, et al. Coronary artery calcium scoring using a reduced tube voltage and radiation dose protocol with dual-source computed tomography. J Cardiovasc Comput Tomogr 2009; 3(6):394–400. doi:10.1016/j.jcct.2009.10.002
- Hecht HS, De Siqueira MEM, Cham M, et al. Low- vs. standard-dose coronary artery calcium scanning. Eur Heart J Cardiovasc Imaging 2015; 16(4):358–363. doi:10.1093/ehjci/jeu218
- Agatston AS, Janowitz WR, Hildner FJ, Zusmer NR, Viamonte M, Detrano R. Quantification of coronary artery calcium using ultrafast computed tomography. J Am Coll Cardiol 1990; 15(4):827–832. doi:10.1016/0735-1097(90)90282-T
- Nezarat N, Kim M, Budoff M. Role of coronary calcium for risk stratification and prognostication. Curr Treat Options Cardiovasc Med 2017; 19(2):8. doi:10.1007/s11936-017-0509-7
- Callister TQ, Cooil B, Raya SP, Lippolis NJ, Russo DJ, Raggi P. Coronary artery disease: improved reproducibility of calcium scoring with an electron-beam CT volumetric method. Radiology 1998; 208(3):807–814. doi:10.1148/radiology.208.3.9722864
- Budoff MJ, Georgiou D, Brody A, et al. Ultrafast computed tomography as a diagnostic modality in the detection of coronary artery disease: a multicenter study. Circulation 1996; 93(5):898–904. pmid:8598080
- Budoff MJ, Diamond GA, Raggi P, et al. Continuous probabilistic prediction of angiographically significant coronary artery disease using electron beam tomography. Circulation 2002; 105(15):1791–1796. doi:10.1161/01.CIR.0000014483.43921.8C
- Blaha MJ, Cainzos-Achirica M, Greenland P, et al. Role of coronary artery calcium score of zero and other negative risk markers for cardiovascular disease: the Multi-Ethnic Study of Atherosclerosis (MESA). Circulation 2016; 133(9):849–858. doi:10.1161/CIRCULATIONAHA.115.018524
- Pletcher MJ, Tice JA, Pignone M, Browner WS. Using the coronary artery calcium score to predict coronary heart disease events: a systematic review and meta-analysis. Arch Intern Med 2004; 164(12):1285–1292. doi:10.1001/archinte.164.12.1285
- Kavousi M, Desai CS, Ayers C, et al. Prevalence and prognostic implications of coronary artery calcification in low-risk women: a meta-analysis. JAMA 2016; 316(20):2126–2134. doi:10.1001/jama.2016.17020
- Detrano R, Guerci AD, Carr JJ, et al. Coronary calcium as a predictor of coronary events in four racial or ethnic groups. N Engl J Med 2008; 358(13):1336-1345. doi:10.1056/NEJMoa072100
- Carr JJ, Jacobs DR, Terry JG, et al. Association of coronary artery calcium in adults aged 32 to 46 years with incident coronary heart disease and death. JAMA Cardiol 2017; 2(4):391–399. doi:10.1001/jamacardio.2016.5493
- Budoff MJ, Shaw LJ, Liu ST, et al. Long-term prognosis associated with coronary calcification. Observations from a registry of 25,253 patients. J Am Coll Cardiol 2007; 49(18):1860–1870. doi:10.1016/j.jacc.2006.10.079
- Nasir K, Rubin J, Blaha MJ, et al. Interplay of coronary artery calcification and traditional risk factors for the prediction of all-cause mortality in asymptomatic individuals. Circ Cardiovasc Imaging 2012; 5(4):467–473. doi:10.1161/CIRCIMAGING.111.964528
- Shaw LJ, Giambrone AE, Blaha MJ, et al. Long-term prognosis after coronary artery calcification testing in asymptomatic patients: a cohort study. Ann Intern Med 2015; 163(1):14–21. doi:10.7326/M14-0612
- Jackson G, Nehra A, Miner M, et al. The assessment of vascular risk in men with erectile dysfunction: the role of the cardiologist and general physician. Int J Clin Pract 2013; 67(11):1163–1172. doi:10.1111/ijcp.12200
- Cook NR, Paynter NP, Eaton CB, et al. Comparison of the Framingham and Reynolds risk scores for global cardiovascular risk prediction in the multiethnic Women’s Health Initiative. Circulation 2012; 125(14):1748–1756. doi:10.1161/CIRCULATIONAHA.111.075929
- Ford ES, Giles WH, Mokdad AH. The distribution of 10-year risk for coronary heart disease among U.S. adults: findings from the National Health and Nutrition Examination Survey III. J Am Coll Cardiol 2004; 43(10):1791–1796. doi:10.1016/j.jacc.2003.11.061
- Akosah KO, Schaper A, Cogbill C, Schoenfeld P. Preventing myocardial infarction in the young adult in the first place: how do the National Cholesterol Education Panel III guidelines perform? J Am Coll Cardiol 2003;41(9):1475–1479. doi:10.1016/S0735-1097(03)00187-6
- Lloyd-Jones DM, Leip EP, Larson MG, et al. Prediction of lifetime risk for cardiovascular disease by risk factor burden at 50 years of age. Circulation 2006;113(6):791–798. doi:10.1161/CIRCULATIONAHA.105.548206
- Expert Panel on Detection and Treatment of High Blood Cholesterol in Adults. Executive summary of the third report of the National Cholesterol Education Program (NCEP) Expert Panel on Detection, Evaluation, and Treatment of High Blood Cholesterol in Adults (Adult Treatment Panel III). JAMA 2001; 285:24862497. pmid:11368702
- Akosah KO, Gower E, Groon L, Rooney BL, Schaper A. Mild hypercholesterolemia and premature heart disease: do the national criteria underestimate disease risk? J Am Coll Cardiol 2000; 35(5):1178–1184. doi:10.1016/S0735-1097(00)00556-8
- Steinberg D, Grundy SM. The case for treating hypercholesterolemia at an earlier age: moving toward consensus. J Am Coll Cardiol 2012; 60(25):2640–2641. doi:10.1016/j.jacc.2012.09.016
- Martin SS, Blaha MJ, Blankstein R, et al. Dyslipidemia, coronary artery calcium, and incident atherosclerotic cardiovascular disease: Implications for statin therapy from the multi-ethnic study of atherosclerosis. Circulation 2014; 129(1):77–86. doi:10.1161/CIRCULATIONAHA.113.003625
- Goff DC, Lloyd-Jones DM, Bennett G, et al. 2013 ACC/AHA guideline on the assessment of cardiovascular risk: a report of the American College of Cardiology/American Heart Association Task Force on Practice guidelines. Circulation 2014; 129(25 suppl 2):S49–S73. doi:10.1161/01.cir.0000437741.48606.98
- Yeboah J, McClelland RL, Polonsky TS, et al. Comparison of novel risk markers for improvement in cardiovascular risk assessment in intermediate-risk individuals. JAMA 2012; 308(8):788–795. doi:10.1001/jama.2012.9624
- Nasir K, Bittencourt MS, Blaha MJ, et al. Implications of coronary artery calcium testing among statin candidates according to American College of Cardiology/American Heart Association cholesterol management guidelines MESA (Multi-Ethnic Study of Atherosclerosis). J Am Coll Cardiol 2015; 66(15):1657–1668. doi:10.1016/j.jacc.2015.07.066
- Hecht H, Blaha MJ, Berman DS, et al. Clinical indications for coronary artery calcium scoring in asymptomatic patients: expert consensus statement from the Society of Cardiovascular Computed Tomography. J Cardiovasc Comput Tomogr 2017; 11(2):157–168. doi:10.1016/j.jcct.2017.02.010
- Miedema MD, Duprez DA, Misialek JR, et al. Use of coronary artery calcium testing to guide aspirin utilization for primary prevention: estimates from the multi-ethnic study of atherosclerosis. Circ Cardiovasc Qual Outcomes 2014; 7(3):453–460. doi:10.1161/CIRCOUTCOMES.113.000690
- McClelland RL, Jorgensen NW, Budoff M, et al. 10-year coronary heart disease risk prediction using coronary artery calcium and traditional risk factors. J Am Coll Cardiol 2015; 66(15):1643–1653. doi:10.1016/j.jacc.2015.08.035
- Hong JC, Blankstein R, Shaw LJ, et al. Implications of coronary artery calcium testing for treatment decisions among statin candidates according to the ACC/AHA cholesterol management guidelines: a cost-effectiveness analysis. JACC Cardiovasc Imaging 2017; 10(8):938–952. doi:10.1016/j.jcmg.2017.04.014
- Schwartz AL, Landon BE, Elshaug AG, Chernew ME, McWilliams JM. Measuring low-value care in Medicare. JAMA Intern Med 2014; 174(7):1067–1076. doi:10.1001/jamainternmed.2014.1541
- Lehnert BE, Bree RL. Analysis of appropriateness of outpatient CT and MRI referred from primary care clinics at an academic medical center: how critical is the need for improved decision support? J Am Coll Radiol 2010; 7(3):192–197. doi:10.1016/j.jacr.2009.11.010
- Onuma Y, Tanabe K, Nakazawa G, et al. Noncardiac findings in cardiac imaging with multidetector computed tomography. J Am Coll Cardiol 2006; 48(2):402–406. doi:10.1016/j.jacc.2006.04.071
- Hecht HS. Coronary artery calcium scanning: past, present, and future. JACC Cardiovasc Imaging 2015; 8(5):579–596. doi:10.1016/j.jcmg.2015.02.006
- MacHaalany J, Yam Y, Ruddy TD, et al. Potential clinical and economic consequences of noncardiac incidental findings on cardiac computed tomography. J Am Coll Cardiol 2009; 54(16):1533–1541. doi:10.1016/j.jacc.2009.06.026
- McEvoy JW, Martin SS, Blaha MJ, et al. The case for and against a coronary artery calcium trial: means, motive, and opportunity. JACC Cardiovasc Imaging 2016; 9(8):994–1002. doi:10.1016/j.jcmg.2016.03.012
- Patel MR, Bailey SR, Bonow RO, et al. ACCF/SCAI/AATS/AHA/ASE/ASNC/HFSA/HRS/SCCM/SCCT/SCMR/STS 2012 appropriate use criteria for diagnostic catheterization. J Thorac Cardiovasc Surg 2012; 144(1):39–71. doi:10.1016/j.jtcvs.2012.04.013
- Villines TC, Hulten EA, Shaw LJ, et al. Prevalence and severity of coronary artery disease and adverse events among symptomatic patients with coronary artery calcification scores of zero undergoing coronary computed tomography angiography. J Am Coll Cardiol 2011; 58(24):2533–2540. doi:10.1016/j.jacc.2011.10.851
- Hecht HS, Cronin P, Blaha MJ, et al. 2016 SCCT/STR guidelines for coronary artery calcium scoring of noncontrast noncardiac chest CT scans: a report of the Society of Cardiovascular Computed Tomography and Society of Thoracic Radiology. J Thorac Imaging 2017; 32(5):W54–W66. doi:10.1097/RTI.0000000000000287
- Greenland P, Alpert JS, Beller GA, et al. 2010 ACCF/AHA guideline for assessment of cardiovascular risk in asymptomatic adults: executive summary: a report of the American College of Cardiology foundation/American Heart Association task force on practice guidelines. Circulation 2010; 122(25):2748–2764. doi:10.1161/CIR.0b013e3182051bab
- Martin SS, Sperling LS, Blaha MJ, et al. Clinician-patient risk discussion for atherosclerotic cardiovascular disease prevention: importance to implementation of the 2013 ACC/AHA guidelines. J Am Coll Cardiol 2015; 65(13):1361–1368. doi:10.1016/j.jacc.2015.01.043
- Gupta A, Lau E, Varshney R, et al. The identification of calcified coronary plaque is associated with initiation and continuation of pharmacologic and lifestyle preventive therapies: a systematic review and meta-analysis. JACC Cardiovasc Imaging 2017; 10(8):833–842. doi:10.1016/j.jcmg.2017.01.030
- Rozanski A, Gransar H, Shaw LJ, et al. Impact of coronary artery calcium scanning on coronary risk factors and downstream testing: The EISNER (Early Identification of Subclinical Atherosclerosis by Noninvasive Imaging Research) prospective randomized trial. J Am Coll Cardiol 2011; 57(15):1622–1632. doi:10.1016/j.jacc.2011.01.019
The United States has seen a decline in fatal myocardial infarctions, largely thanks to early detection of coronary artery disease. Current guidelines on assessment of cardiovascular risk still rely on the traditional 10-year risk model in clinical practice. However, the predictive value of this approach is only moderate, and many coronary events occur in people considered to be at low or intermediate risk.
Coronary artery calcium scoring has emerged as a means of risk stratification by direct measurement of disease. Primary care providers are either using it or are seeing it used by consulting physicians, and its relatively low cost and ease of performance have contributed to its widespread use. However, downstream costs, radiation exposure, and lack of randomized controlled trials have raised concerns.
This article reviews the usefulness and pitfalls of coronary artery calcium scoring, providing a better understanding of the test, its limitations, and the interpretation of results.
ATHEROSCLEROSIS AND CALCIUM
As the calcium deposits grow, they can be detected by imaging tests such as computed tomography (CT), and quantified to assess the extent of disease.4
CALCIFICATION AND CORONARY ARTERY DISEASE
Coronary calcification occurs almost exclusively in atherosclerosis. Several autopsy studies5,6 and histopathologic studies7 have shown a direct relationship between the extent of calcification and atherosclerotic disease.
Sangiorgi et al7 performed a histologic analysis of 723 coronary artery segments. The amount of calcium correlated well with the area of plaque:
- r = 0.89, P < .0001 in the left anterior descending artery
- r = 0.7, P < .001 in the left circumflex artery
- r = 0.89, P < .0001 in the right coronary artery.
Coronary artery calcium has also been associated with obstructive coronary artery disease in studies using intravascular ultrasonography and optical coherence tomography.8,9
TECHNICAL INFORMATION ABOUT THE TEST
First-generation CT scanners used for calcium scoring in the 1980s were electron-beam systems in which a stationary x-ray tube generated an oscillating electron beam, which was reflected around the patient table.10 A single, stationary detector ring captured the images.
These systems have been replaced by multidetector scanners, in which the x-ray tube and multiple rows of detectors are combined in a gantry that rotates at high speed around the patient.
Coronary calcium is measured by noncontrast CT of the heart. Thus, there is no risk of contrast-induced nephropathy or allergic reactions. Images are acquired while the patient holds his or her breath for 3 to 5 seconds. Electrocardiographic gating is used to reduce motion artifact.11,12 With modern scanners, the effective radiation dose associated with calcium testing is as low as 0.5 to 1.5 mSv,13,14 ie, about the same dose as that with mammography. The entire test takes 10 to 15 minutes.
The results fall into 4 categories, which correlate with the severity of coronary artery disease, ranging from no significant disease to severe disease (Table 1). Other scores, which are not commonly used, include the calcium volume score16 and the calcium mass score.17 Figure 2 shows a screenshot from a coronary artery calcium scoring program.
CALCIUM SCORING AS A DIAGNOSTIC TOOL
Early multicenter studies evaluated the utility of calcium scoring to predict coronary stenosis in patients who underwent both cardiac CT and coronary angiography. The sensitivity of calcium scoring for angiographically significant disease was high (95%), but its specificity was low (about 44%).18
Budoff et al,19 reviewing these and subsequent results, concluded that the value of calcium scoring is its high negative predictive value (about 98%); a negative score (no calcification) is strongly associated with the absence of obstructive coronary disease.
Blaha et al20 concluded that a score of 0 would indicate that the patient had a low risk of cardiovascular disease. A test with these characteristics is helpful in excluding cardiovascular disease or at least in determining that it is less likely to be present in a patient deemed to be at intermediate risk.
CALCIUM SCORING AS A PROGNOSTIC TOOL
Early on, investigators recognized the value of calcium scoring in predicting the risk of future cardiovascular events and death.21–25
Predicting cardiovascular events
Pletcher et al21 performed a meta-analysis of studies that measured calcification in asymptomatic patients with subsequent follow-up. The summary-adjusted relative risk of cardiac events such as myocardial infarction, coronary artery revascularization, and coronary heart disease-related death rose with the calcium score:
- 2.1 (95% confidence interval [CI] 1.6–2.9) with a score of 1 to 100
- 4.2 (95% CI 2.5–7.2) with scores of 101 to 400
- 7.2 (95% CI 3.9-13.0) with scores greater than 400.
The meta-analysis was limited in that it included only 4 studies, which were observational.
Kavousi et al,22 in a subsequent meta-analysis of 6,739 women at low risk of atherosclerotic cardiovascular disease based on the American College of Cardiology/American Heart Association (ACC/AHA) pooled cohort equation (10-year risk < 7.5%), found that 36.1% had calcium scores greater than 0. Compared with those whose score was 0, those with higher scores had a higher risk of atherosclerotic cardiovascular disease events. The incidence rates per 1,000 person-years were 1.41 vs 4.33 (relative risk 2.92, 95% CI 2.02–3.83; multivariable-adjusted hazard ratio 2.04, 95% CI 1.44–2.90). This study was limited because the population was mostly of European descent, making it less generalizable to non-European populations.
Calcium scoring has also been shown to be a strong predictor of incident cardiovascular events across different races beyond traditional risk factors such as hypertension, hyperlipidemia, and tobacco use.
Detrano et al,23 in a study of 6,722 patients with diverse ethnic backgrounds, found that the adjusted risk of a coronary event was increased by a factor of 7.73 for calcium scores between 101 and 300 and by a factor of 9.67 for scores above 300 (P < .001). A limitation of this study was that the patients and physicians were informed of the scores, which could have led to bias.
Carr et al24 found an association between calcium and coronary heart disease in a younger population (ages 32–46). In 12.5 years of follow-up, the hazard ratio for cardiovascular events increased exponentially with the calcium score:
- 2.6 (95% CI 1.0–5.7, P = .03) with calcium scores of 1 through 19
- 9.8 (95% CI 4.5–20.5, P < .001) with scores greater than 100.
Predicting mortality
Budoff et al,25 in an observational study of 25,253 patients, found coronary calcium to be an independent predictor of mortality in a multivariable model controlling for age, sex, ethnicity, and cardiac risk factors (model chi-square = 2,017, P < .0001). However, most of the patients were already known to have cardiac risk factors, making the study findings less generalizable to the general population.
Nasir et al26 found that mortality rates rose with the calcium score in a study with 44,052 participants. The annualized mortality rates per 1,000 person-years were:
- 0.87 (95% CI 0.72–1.06) with a score of 0
- 2.97 (95% CI 2.61–3.37) with scores of 1–100
- 6.90 (95% CI 6.02–7.90) with scores of 101–400
- 17.68 (95% CI 5.93–19.62) with scores higher than 400.
The mortality rate also rose with the number of traditional risk factors present, ie, current tobacco use, dyslipidemia, diabetes mellitus, hypertension, and family history of coronary artery disease. Interestingly, those with no risk factors but a calcium score greater than 400 had a higher mortality rate than those with no coronary calcium but more than 3 risk factors (16.89 per 1,000 person-years vs 2.72 per 1,000 person years). As in the previous study, the patient population that was analyzed was at high risk and therefore the findings are not generalizable.
Shaw et al27 found that patients without symptoms but with elevated coronary calcium scores had higher all-cause mortality rates at 15 years than those with a score of 0. The difference remained significant after Cox regression was performed, adjusting for traditional risk factors.
Coronary artery calcium scoring vs other risk-stratification methods
Current guidelines on assessing risk still rely on the traditional 10-year risk model in clinical practice.25 Patients are thus classified as being at low, intermediate, or high risk based on their probability of developing a cardiovascular event or cardiovascular disease-related death in the subsequent 10 years.
However, the predictive value of this approach is only moderate,28 and a significant number of cardiovascular events, including sudden cardiac death, occur in people who were believed to be at low or intermediate risk according to traditional risk factor-based predictions. Because risk scores are strongly influenced by age,29 they are least reliable in young adults.30
Akosah et al31 reviewed the records of 222 young adults (women age 55 or younger, men age 65 or younger) who presented with their first myocardial infarction, and found that only 25% would have qualified for primary prevention pharmacologic treatments according to the National Cholesterol Education Program III guidelines.32,33 Similar findings have been reported regarding previous versions of the risk scores.33
Thus, risk predictions based exclusively on traditional risk factors are not sensitive for detecting young individuals at increased risk, and lead to late treatment of young adults with atherosclerosis, which may be a less effective strategy.34
The reliance on age in risk algorithms also results in low specificity in elderly adults. Using risk scores, elderly adults are systematically stratified in higher risk categories, expanding the indication for statin therapy to almost all men age 65 or older regardless of their actual vascular health, according to current clinical practice guidelines.35,36
Risk scores are based on self-reported history and single-day measurements, since this kind of information is readily available to the physician in the clinic. Moreover, our knowledge about genetic and epigenetic factors associated with the development of atherosclerosis is still in its infancy, with current guidelines not supporting genetic testing as part of cardiovascular risk assessment.37 Thus, a reliable measure of an individual’s lifelong exposure to a number of environmental and genetic factors that may affect cardiovascular health appears unfeasible.
Atherosclerosis is a process in which interactions between genetic, epigenetic, environmental, and traditional risk factors result in subclinical inflammation that could develop into clinically significant disease. Therefore, subclinical coronary atherosclerosis has been shown to be a strong predictor of future incident cardiovascular disease events and death. Thus, alternative approaches that directly measure disease, such as calcium scoring, may help further refine risk stratification of cardiovascular disease.
The MESA trial (Multi-Ethnic Study of Atherosclerosis), for instance, in 6,814 participants, found coronary calcium to provide better discrimination and risk reclassification than the ankle-brachial index, high sensitivity C-reactive protein level, and family history.38 Coronary calcium also had the highest incremental improvement of the area under the receiver operating curve when added to the Framingham Risk Score (0.623 vs 0.784).
Reclassifying cardiovascular risk also has implications regarding whether to start therapies such as statins and aspirin.
For considering statin therapy
Nasir et al39 showed that, in patients eligible for statin therapy by the pooled cohort equation, the absence of coronary artery calcium reclassified approximately one-half of candidates as not eligible for statin therapy. The number needed to treat to prevent an atherosclerotic cardiovascular event in the population who were recommended a statin was 64 with a calcium score of 0, and 24 with a calcium score greater than 100. In the population for whom a statin was considered, the number needed to treat was 223 with a calcium score of 0 and 46 for those with a score greater than 100. Moreover, 57% of intermediate-risk patients and 41% of high-risk patients based on the Framingham Risk Score were found to have a calcium score of 0, implying that these patients may actually be at a lower risk.
The Society of Cardiovascular Computed Tomography guidelines40 say that statin therapy can be considered in patients who have a calcium score greater than 0.
For considering aspirin therapy
Miedema et al41 studied the role of coronary artery calcium in guiding aspirin therapy in 4,229 participants in the MESA trial who were not taking aspirin at baseline. Those with a calcium score higher than 100 had a number needed to treat of 173 in the group with a Framingham Risk Score less than 10% and 92 with a Framingham Risk Score of 10% or higher. The estimated number needed to harm for a major bleeding event was 442. For those who had a score of 0, the estimated number needed to treat was 2,036 for a Framingham Risk Score less than 10% and 808 for a Framingham Risk Score of 10% or higher, with an estimated number needed to harm of 442 for a major bleeding event.
The Society of Cardiovascular Computed Tomography guidelines40 recommend considering aspirin therapy for patients with a coronary calcium score of more than 100.
McClelland et al42 developed a MESA risk score to predict 10-year risk of coronary heart disease using the traditional risk factors along with coronary calcium. The score was validated externally with 2 separate longitudinal studies. Thus, this may serve as another tool to help providers further risk-stratify patients.
COST-EFFECTIVENESS OF THE TEST
As coronary calcium measurement began to be widely used, concerns were raised about the lack of data on its cost-effectiveness.
Cost-effectiveness depends not only on patient selection but also on the cost of therapy. For example, if the cost of a generic statin is $85 per year, then calcium scoring would not be beneficial. However, if the cost of a statin is more than $200, then calcium scoring would be much more cost-effective, offering a way to avoid treating some patients who do not need to be treated.43
Hong et al43 showed that coronary calcium testing was cost-effective when the patient and physician share decision-making about initiating statin therapy. This is especially important if the patient has financial limitations, is concerned about side effects, or wants to avoid taking unnecessary medications.
RISKS AND DOWNSIDES OF CALCIUM SCORING
According to some reports, $8.5 billion is spent annually for low-value care.44 Many of the 80 million CT scans performed annually in the United States are believed to be unnecessary and may lead to additional testing to investigate incidental findings.45
Growing use of coronary calcium measurement has raised similar concerns about radiation exposure, healthcare costs, and increased downstream testing triggered by the detection of incidental noncardiac findings. For instance, Onuma et al46 reported that, in 503 patients undergoing CT to evaluate coronary artery disease, noncardiac findings were seen in 58.1% of them, but only 22.7% of the 503 had clinically significant findings.
Some of these concerns have been addressed. Modern scanners can acquire images in only a few seconds, entailing lower radiation doses than in the past.13,14 The cost of the test is currently less than $100 in many US metropolitan areas.47 However, further studies are needed to adequately and cost-effectively guide follow-up imaging of incidental noncardiac findings.48
An important limitation of calcium scoring for risk assessment is that no randomized controlled trial has evaluated the impact of preventive interventions guided by calcium scores on hard event outcomes. It can be argued that there have been plenty of observational studies that have shown the benefit of coronary calcium scoring when judiciously done in the appropriate population.49 Similarly, no randomized controlled trial has tested the pooled cohort equation and the application of statins based on its use with the current guidelines. The feasibility and cost of a large randomized controlled trial to assess outcomes after coronary artery calcium measurement must also be considered.
Another limitation of coronary calcium scoring is that it cannot rule out the presence of noncalcified atherosclerotic plaque, which often is more unstable and prone to rupture.
In addition, calcification in the coronary vascular bed (even if severe) does not necessarily mean there is clinically relevant coronary stenosis. For instance, an asymptomatic patient could have a coronary artery calcium score higher than 100 and then get a coronary angiogram that reveals only a 30% lesion in the left anterior descending coronary artery. This is because accumulation of (calcified) plaque in the vessel wall is accommodated by expansion of vessel diameter, maintaining luminal dimensions (positive remodeling). By definition, this patient does have coronary artery disease but would be best served by medical management. This could have been determined without an invasive test in an otherwise asymptomatic patient. Thus, performing coronary angiography based on a coronary artery calcium score alone would not have changed this patient’s management and may have exposed the patient to risks of procedural complications, in addition to extra healthcare costs. Therefore, the presence or absence of symptoms should guide the clinician on whether to pursue stress testing for invasive coronary angiography based on the appropriate use criteria.50,51
WHO SHOULD BE TESTED?
In the ACC/AHA 2013 guidelines,37 coronary calcium scoring has a class IIB recommendation in scenarios where it may appear that the risk-based treatment decision is uncertain after formal risk estimation has been done. As discussed above, a score higher than 100 could be a rationale for starting aspirin therapy, and a score higher than 0 for statin therapy. The current guidelines also mention that the coronary calcium score is comparable to other predictors such as the C-reactive protein level and the ankle-brachial index.
Compared with the ACC/AHA guidelines, the 2016 Society of Cardiovascular Computed Tomography guidelines and expert consensus recently have added more specifics in terms of using this test for asymptomatic patients at intermediate risk (10-year risk of atherosclerotic cardiovascular disease 5%–20%) and in selected patients with a family history of premature coronary artery disease and 10-year risk less than 5%.40,52 The 2010 ACC/AHA guidelines were more specific, offering a class IIA recommendation for patients who were at intermediate risk (Framingham Risk Score 10%–20%).53
The ACC/AHA cited cost and radiation exposure as reasons they did not give coronary calcium measurement a stronger recommendation.37 However, as data continue to come in, the guidelines may change, especially since low-dose radiation tools are being used for cancer screening (lungs and breast) and since the cost has declined over the past decade.
OUR APPROACH
Given the negative predictive value of the coronary calcium score, our approach has been to use this test in asymptomatic patients who are found to be at intermediate risk of atherosclerotic cardiovascular disease based on the ACC/AHA risk calculation and are reluctant to start pharmacologic therapy, or who want a more personalized measure of coronary artery disease. This is preceded by a lengthy patient-physician discussion about the risks and benefits of the test.54
The patient’s risk can then be further clarified and possibly reclassified as either low or high if it doesn’t remain intermediate. A discussion can then take place on potentially starting pharmacologic therapy, intensive lifestyle modifications, or both.54,55 If an electronic medical record is available, CT results can be shown to the patient in the office to point out coronary calcifications. Seeing the lesions may serve an as additional motivating factor as patients embark on primary preventive efforts.56
Below, we describe cases of what we would consider appropriate and inappropriate use of coronary artery calcium scoring.
Example 1
A 55-year-old man presents for an annual physical and is found to have a 10-year risk of atherosclerotic cardiovascular disease of 7%, placing him in the intermediate-risk category. Despite an extensive conversation about lifestyle modifications and pharmacologic therapy, he is reluctant to initiate these measures. He is otherwise asymptomatic. Would calcium scoring be reasonable?
Yes, it would be reasonable to perform coronary artery calcium scoring in an otherwise asymptomatic man to help reclassify his risk for a coronary vascular event. The objective data provided by the test could motivate the patient to undertake primary prevention efforts or, if his score is 0, to show that he may not need drug therapy.
Example 2
A 55-year-old man who has a family history of coronary artery disease, is an active smoker, and has diabetes mellitus presents to the clinic with 2 months of exertional chest pain that resolves with rest. Would coronary artery calcium scoring be reasonable?
This patient is symptomatic and is at high risk of coronary artery disease. Statin therapy is already indicated in the AHA/ACC guidelines, since he has diabetes. Therefore, calcium scoring would not be helpful, as it would not change this patient’s management. Instead, he would be best served by stress testing or coronary angiography based on the stability of his symptoms and cardiac biomarkers.
Example 3
A 30-year-old woman with no medical history presents with on-and-off chest pain at both exertion and rest. Her electrocardiogram is unremarkable, and cardiac enzyme tests are negative. Would coronary calcium scoring be reasonable?
This young patient’s story is not typical for coronary artery disease. Therefore, she has a low pretest probability of obstructive coronary artery disease. Moreover, calcium scoring may not be helpful because at her young age there has not been enough time for calcification to develop (median age is the fifth decade of life). Thus, she would be exposed to radiation unnecessarily at a young age.
What to do with an elevated calcium score?
Coronary artery calcification is now being incidentally detected as patients undergo CT for other reasons such as screening for lung cancer based on the US Preventive Services Task Force guidelines. Patients may also get the test done on their own and then present to a provider with an elevated score.
It is important to consider the entire clinical scenario in such patients and not just the score. If a patient presents with an elevated calcium score but has no symptoms and falls in the intermediate-risk group, there is evidence to suggest that he or she should be started on statin or aspirin therapy or both.
As mentioned above, an abnormal test result does not mean that the patient should undergo more-invasive testing such as cardiac catheterization or even stress testing, especially if he or she has no symptoms. However, if the patient is symptomatic, then further cardiac evaluation would be recommended.
SUMMARY
Measuring coronary artery calcium has been found to be valuable in detecting coronary artery disease and in predicting cardiovascular events and death. The test is relatively easy to perform, with newer technology allowing for less radiation and cost. It serves as a more personalized measure of disease and can help facilitate patient-physician discussions about starting pharmacologic therapy, especially if a patient is reluctant.
Currently, coronary calcium scoring has a class IIB recommendation in scenarios in which the risk-based treatment decision is uncertain after formal risk estimation has been done according to the ACC/AHA guideline. The Society of Cardiovascular Computed Tomography guideline and expert consensus documents are more specific in recommending the test in asymptomatic patients in the intermediate-risk group.
Limitations of calcium scoring include the possibility of unnecessary cardiovascular testing such as cardiac catheterization or stress testing being driven by the calcium score alone, as well as the impact of incidental findings. With increased reporting of the coronary calcium score in patients undergoing CT for lung cancer screening, the score should be interpreted in view of the entire clinical scenario.
- Hansson GK. Inflammation, atherosclerosis and coronary artery disease. N Engl J Med 2005; 352(16):1685–1695. doi:10.1056/NEJM199408183310709
- Ross R. Atherosclerosis—an inflammatory disease. N Engl J Med 1999; 340(2):115–126. doi:10.1056/NEJM199901143400207
- Stary HC, Chandler AB, Dinsmore RE, et al. A definition of advanced types of atherosclerotic lesions and a histological classification of atherosclerosis: a report from the Committee on Vascular Lesions of the Council on Arteriosclerosis, American Heart Association. Arterioscler Thromb Vasc Biol 1995; 15(9):1512–1531. doi:10.1161/atvb.15.9.1512
- Maurovich-Horvat P, Ferencik M, Voros S, Merkely B, Hoffmann U. Comprehensive plaque assessment by coronary CT angiography. Nat Rev Cardiol 2014; 11(7):390–402. doi:10.1038/nrcardio.2014.60
- Eggen DA, Strong JP, McGill HC. Coronary calcification. Relationship to clinically significant coronary lesions and race, sex, and topographic distribution. Circulation 1965; 32(6):948–955. pmid:5845254
- Oliver MF, Samuel E, Morley P, Young GB, Kapur PL. Detection of coronary-artery calcification during life. Lancet 1964; 283(7339):891–895. doi:10.1016/S0140-6736(64)91625-3
- Sangiorgi G, Rumberger JA, Severson A, et al. Arterial calcification and not lumen stenosis is highly correlated with atherosclerotic plaque burden in humans: a histologic study of 723 coronary artery segments using nondecalcifying methodology. J Am Coll Cardiol 1998; 31(1):126–133. doi:10.1016/S0735-1097(97)00443-9
- Baumgart D, Schmermund A, Goerge G, et al. Comparison of electron beam computed tomography with intracoronary ultrasound and coronary angiography for detection of coronary atherosclerosis. J Am Coll Cardiol 1997; 30(1):57–64. pmid:9207621
- Krishnamoorthy P, Vengrenyuk Y, Ueda H, et al. Three-dimensional volumetric assessment of coronary artery calcification in patients with stable coronary artery disease by OCT. EuroIntervention 2017; 13(3):312–319. doi:10.4244/EIJ-D-16-00139
- Budoff MJ, Achenbach S, Blumenthal RS, et al. Assessment of coronary artery disease by cardiac computed tomography: a scientific statement from the American Heart Association Committee on Cardiovascular Imaging and Intervention, Council on Cardiovascular Radiology and Intervention, and Committee on C. Circulation 2006; 114(16):1761–1791. doi:10.1161/CIRCULATIONAHA.106.178458
- Schoepf UJ, Becker CR, Bruening RD, et al. Electrocardiographically gated thin-section CT of the lung. Radiology 1999; 212(3):649–654. doi:10.1148/radiology.212.3.r99se08649
- Abbara S, Arbab-Zadeh A, Callister TQ, et al. SCCT guidelines for performance of coronary computed tomographic angiography: a report of the Society of Cardiovascular Computed Tomography Guidelines Committee. J Cardiovasc Comput Tomogr 2009; 3(3):190–204. doi:10.1016/j.jcct.2009.03.004
- Nakazato R, Dey D, Gutstein A, et al. Coronary artery calcium scoring using a reduced tube voltage and radiation dose protocol with dual-source computed tomography. J Cardiovasc Comput Tomogr 2009; 3(6):394–400. doi:10.1016/j.jcct.2009.10.002
- Hecht HS, De Siqueira MEM, Cham M, et al. Low- vs. standard-dose coronary artery calcium scanning. Eur Heart J Cardiovasc Imaging 2015; 16(4):358–363. doi:10.1093/ehjci/jeu218
- Agatston AS, Janowitz WR, Hildner FJ, Zusmer NR, Viamonte M, Detrano R. Quantification of coronary artery calcium using ultrafast computed tomography. J Am Coll Cardiol 1990; 15(4):827–832. doi:10.1016/0735-1097(90)90282-T
- Nezarat N, Kim M, Budoff M. Role of coronary calcium for risk stratification and prognostication. Curr Treat Options Cardiovasc Med 2017; 19(2):8. doi:10.1007/s11936-017-0509-7
- Callister TQ, Cooil B, Raya SP, Lippolis NJ, Russo DJ, Raggi P. Coronary artery disease: improved reproducibility of calcium scoring with an electron-beam CT volumetric method. Radiology 1998; 208(3):807–814. doi:10.1148/radiology.208.3.9722864
- Budoff MJ, Georgiou D, Brody A, et al. Ultrafast computed tomography as a diagnostic modality in the detection of coronary artery disease: a multicenter study. Circulation 1996; 93(5):898–904. pmid:8598080
- Budoff MJ, Diamond GA, Raggi P, et al. Continuous probabilistic prediction of angiographically significant coronary artery disease using electron beam tomography. Circulation 2002; 105(15):1791–1796. doi:10.1161/01.CIR.0000014483.43921.8C
- Blaha MJ, Cainzos-Achirica M, Greenland P, et al. Role of coronary artery calcium score of zero and other negative risk markers for cardiovascular disease: the Multi-Ethnic Study of Atherosclerosis (MESA). Circulation 2016; 133(9):849–858. doi:10.1161/CIRCULATIONAHA.115.018524
- Pletcher MJ, Tice JA, Pignone M, Browner WS. Using the coronary artery calcium score to predict coronary heart disease events: a systematic review and meta-analysis. Arch Intern Med 2004; 164(12):1285–1292. doi:10.1001/archinte.164.12.1285
- Kavousi M, Desai CS, Ayers C, et al. Prevalence and prognostic implications of coronary artery calcification in low-risk women: a meta-analysis. JAMA 2016; 316(20):2126–2134. doi:10.1001/jama.2016.17020
- Detrano R, Guerci AD, Carr JJ, et al. Coronary calcium as a predictor of coronary events in four racial or ethnic groups. N Engl J Med 2008; 358(13):1336-1345. doi:10.1056/NEJMoa072100
- Carr JJ, Jacobs DR, Terry JG, et al. Association of coronary artery calcium in adults aged 32 to 46 years with incident coronary heart disease and death. JAMA Cardiol 2017; 2(4):391–399. doi:10.1001/jamacardio.2016.5493
- Budoff MJ, Shaw LJ, Liu ST, et al. Long-term prognosis associated with coronary calcification. Observations from a registry of 25,253 patients. J Am Coll Cardiol 2007; 49(18):1860–1870. doi:10.1016/j.jacc.2006.10.079
- Nasir K, Rubin J, Blaha MJ, et al. Interplay of coronary artery calcification and traditional risk factors for the prediction of all-cause mortality in asymptomatic individuals. Circ Cardiovasc Imaging 2012; 5(4):467–473. doi:10.1161/CIRCIMAGING.111.964528
- Shaw LJ, Giambrone AE, Blaha MJ, et al. Long-term prognosis after coronary artery calcification testing in asymptomatic patients: a cohort study. Ann Intern Med 2015; 163(1):14–21. doi:10.7326/M14-0612
- Jackson G, Nehra A, Miner M, et al. The assessment of vascular risk in men with erectile dysfunction: the role of the cardiologist and general physician. Int J Clin Pract 2013; 67(11):1163–1172. doi:10.1111/ijcp.12200
- Cook NR, Paynter NP, Eaton CB, et al. Comparison of the Framingham and Reynolds risk scores for global cardiovascular risk prediction in the multiethnic Women’s Health Initiative. Circulation 2012; 125(14):1748–1756. doi:10.1161/CIRCULATIONAHA.111.075929
- Ford ES, Giles WH, Mokdad AH. The distribution of 10-year risk for coronary heart disease among U.S. adults: findings from the National Health and Nutrition Examination Survey III. J Am Coll Cardiol 2004; 43(10):1791–1796. doi:10.1016/j.jacc.2003.11.061
- Akosah KO, Schaper A, Cogbill C, Schoenfeld P. Preventing myocardial infarction in the young adult in the first place: how do the National Cholesterol Education Panel III guidelines perform? J Am Coll Cardiol 2003;41(9):1475–1479. doi:10.1016/S0735-1097(03)00187-6
- Lloyd-Jones DM, Leip EP, Larson MG, et al. Prediction of lifetime risk for cardiovascular disease by risk factor burden at 50 years of age. Circulation 2006;113(6):791–798. doi:10.1161/CIRCULATIONAHA.105.548206
- Expert Panel on Detection and Treatment of High Blood Cholesterol in Adults. Executive summary of the third report of the National Cholesterol Education Program (NCEP) Expert Panel on Detection, Evaluation, and Treatment of High Blood Cholesterol in Adults (Adult Treatment Panel III). JAMA 2001; 285:24862497. pmid:11368702
- Akosah KO, Gower E, Groon L, Rooney BL, Schaper A. Mild hypercholesterolemia and premature heart disease: do the national criteria underestimate disease risk? J Am Coll Cardiol 2000; 35(5):1178–1184. doi:10.1016/S0735-1097(00)00556-8
- Steinberg D, Grundy SM. The case for treating hypercholesterolemia at an earlier age: moving toward consensus. J Am Coll Cardiol 2012; 60(25):2640–2641. doi:10.1016/j.jacc.2012.09.016
- Martin SS, Blaha MJ, Blankstein R, et al. Dyslipidemia, coronary artery calcium, and incident atherosclerotic cardiovascular disease: Implications for statin therapy from the multi-ethnic study of atherosclerosis. Circulation 2014; 129(1):77–86. doi:10.1161/CIRCULATIONAHA.113.003625
- Goff DC, Lloyd-Jones DM, Bennett G, et al. 2013 ACC/AHA guideline on the assessment of cardiovascular risk: a report of the American College of Cardiology/American Heart Association Task Force on Practice guidelines. Circulation 2014; 129(25 suppl 2):S49–S73. doi:10.1161/01.cir.0000437741.48606.98
- Yeboah J, McClelland RL, Polonsky TS, et al. Comparison of novel risk markers for improvement in cardiovascular risk assessment in intermediate-risk individuals. JAMA 2012; 308(8):788–795. doi:10.1001/jama.2012.9624
- Nasir K, Bittencourt MS, Blaha MJ, et al. Implications of coronary artery calcium testing among statin candidates according to American College of Cardiology/American Heart Association cholesterol management guidelines MESA (Multi-Ethnic Study of Atherosclerosis). J Am Coll Cardiol 2015; 66(15):1657–1668. doi:10.1016/j.jacc.2015.07.066
- Hecht H, Blaha MJ, Berman DS, et al. Clinical indications for coronary artery calcium scoring in asymptomatic patients: expert consensus statement from the Society of Cardiovascular Computed Tomography. J Cardiovasc Comput Tomogr 2017; 11(2):157–168. doi:10.1016/j.jcct.2017.02.010
- Miedema MD, Duprez DA, Misialek JR, et al. Use of coronary artery calcium testing to guide aspirin utilization for primary prevention: estimates from the multi-ethnic study of atherosclerosis. Circ Cardiovasc Qual Outcomes 2014; 7(3):453–460. doi:10.1161/CIRCOUTCOMES.113.000690
- McClelland RL, Jorgensen NW, Budoff M, et al. 10-year coronary heart disease risk prediction using coronary artery calcium and traditional risk factors. J Am Coll Cardiol 2015; 66(15):1643–1653. doi:10.1016/j.jacc.2015.08.035
- Hong JC, Blankstein R, Shaw LJ, et al. Implications of coronary artery calcium testing for treatment decisions among statin candidates according to the ACC/AHA cholesterol management guidelines: a cost-effectiveness analysis. JACC Cardiovasc Imaging 2017; 10(8):938–952. doi:10.1016/j.jcmg.2017.04.014
- Schwartz AL, Landon BE, Elshaug AG, Chernew ME, McWilliams JM. Measuring low-value care in Medicare. JAMA Intern Med 2014; 174(7):1067–1076. doi:10.1001/jamainternmed.2014.1541
- Lehnert BE, Bree RL. Analysis of appropriateness of outpatient CT and MRI referred from primary care clinics at an academic medical center: how critical is the need for improved decision support? J Am Coll Radiol 2010; 7(3):192–197. doi:10.1016/j.jacr.2009.11.010
- Onuma Y, Tanabe K, Nakazawa G, et al. Noncardiac findings in cardiac imaging with multidetector computed tomography. J Am Coll Cardiol 2006; 48(2):402–406. doi:10.1016/j.jacc.2006.04.071
- Hecht HS. Coronary artery calcium scanning: past, present, and future. JACC Cardiovasc Imaging 2015; 8(5):579–596. doi:10.1016/j.jcmg.2015.02.006
- MacHaalany J, Yam Y, Ruddy TD, et al. Potential clinical and economic consequences of noncardiac incidental findings on cardiac computed tomography. J Am Coll Cardiol 2009; 54(16):1533–1541. doi:10.1016/j.jacc.2009.06.026
- McEvoy JW, Martin SS, Blaha MJ, et al. The case for and against a coronary artery calcium trial: means, motive, and opportunity. JACC Cardiovasc Imaging 2016; 9(8):994–1002. doi:10.1016/j.jcmg.2016.03.012
- Patel MR, Bailey SR, Bonow RO, et al. ACCF/SCAI/AATS/AHA/ASE/ASNC/HFSA/HRS/SCCM/SCCT/SCMR/STS 2012 appropriate use criteria for diagnostic catheterization. J Thorac Cardiovasc Surg 2012; 144(1):39–71. doi:10.1016/j.jtcvs.2012.04.013
- Villines TC, Hulten EA, Shaw LJ, et al. Prevalence and severity of coronary artery disease and adverse events among symptomatic patients with coronary artery calcification scores of zero undergoing coronary computed tomography angiography. J Am Coll Cardiol 2011; 58(24):2533–2540. doi:10.1016/j.jacc.2011.10.851
- Hecht HS, Cronin P, Blaha MJ, et al. 2016 SCCT/STR guidelines for coronary artery calcium scoring of noncontrast noncardiac chest CT scans: a report of the Society of Cardiovascular Computed Tomography and Society of Thoracic Radiology. J Thorac Imaging 2017; 32(5):W54–W66. doi:10.1097/RTI.0000000000000287
- Greenland P, Alpert JS, Beller GA, et al. 2010 ACCF/AHA guideline for assessment of cardiovascular risk in asymptomatic adults: executive summary: a report of the American College of Cardiology foundation/American Heart Association task force on practice guidelines. Circulation 2010; 122(25):2748–2764. doi:10.1161/CIR.0b013e3182051bab
- Martin SS, Sperling LS, Blaha MJ, et al. Clinician-patient risk discussion for atherosclerotic cardiovascular disease prevention: importance to implementation of the 2013 ACC/AHA guidelines. J Am Coll Cardiol 2015; 65(13):1361–1368. doi:10.1016/j.jacc.2015.01.043
- Gupta A, Lau E, Varshney R, et al. The identification of calcified coronary plaque is associated with initiation and continuation of pharmacologic and lifestyle preventive therapies: a systematic review and meta-analysis. JACC Cardiovasc Imaging 2017; 10(8):833–842. doi:10.1016/j.jcmg.2017.01.030
- Rozanski A, Gransar H, Shaw LJ, et al. Impact of coronary artery calcium scanning on coronary risk factors and downstream testing: The EISNER (Early Identification of Subclinical Atherosclerosis by Noninvasive Imaging Research) prospective randomized trial. J Am Coll Cardiol 2011; 57(15):1622–1632. doi:10.1016/j.jacc.2011.01.019
KEY POINTS
- Coronary artery calcium testing is useful in diagnosing subclinical coronary artery disease and in predicting the risk of future cardiovascular events and death.
- Given the high negative predictive value of the test, it can also serve to reclassify risk in patients beyond traditional risk factors.
- Along with shared decision-making, elevated calcium scores can guide the initiation of statin or aspirin therapy.
- A high score in an asymptomatic patient should not trigger further testing without a comprehensive discussion of the risks and benefits.
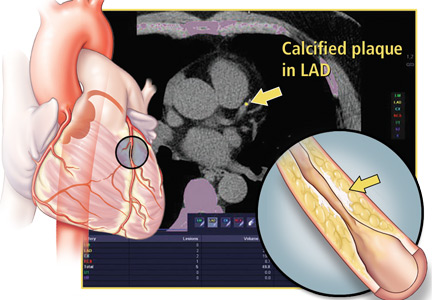
CDC recommendations for the 2018-2019 influenza season
The 2017-2018 influenza season was one of the most severe in this century, according to every indicator measured by the Centers for Disease Control and Prevention (CDC). The proportion of outpatient visits due to influenza-like illness (ILI) was elevated nationally above a baseline of 2.2% for 19 straight weeks, and for 3 weeks it was over 7%.1 High ILI activity was widespread and included all 50 states in January.
From October 2017 through April 2018, the CDC estimates that the influenza-related hospitalization rate was 106.6 per 100,000 population, with the highest rates among children 0 to 4 years (74.3/100,000), adults 50 to 64 years (115.7/100,000), and adults 65 years and older (460.9/100,000). More than 90% of adults hospitalized had a chronic condition, such as heart or lung disease, diabetes, or obesity, placing them at high risk for influenza complications.1
Influenza severity is also measured as the proportion of deaths due to pneumonia and influenza, which was above the epidemic threshold for 16 weeks in 2017-2018 and was above 10% for 4 weeks in January.1 Based on all of these indicators, the 2017-2018 influenza season was classified as high severity overall and for all age groups, the first time this has happened since the 2003-2004 season. There were 171 pediatric deaths attributed to influenza, and more than three-quarters of vaccine-eligible children who died from influenza this season had not received influenza vaccine.1
The type of influenza predominating last season was influenza A from early- through mid-season, and was influenza B later in the season (see https://stacks.cdc.gov/view/cdc/54974).1 For the entire season, 71.2% of specimens that tested positive for influenza in public health labs were Influenza A and 84.9% of these were H3N2.1
Effectiveness of influenza vaccine last season. As measured by preventing respiratory illness needing medical attention, vaccine effectiveness was 36% overall: 25% against influenza A (H3N2), 67% against influenza A (H1N1), and 42% against influenza B.1 Effectiveness varied by age, being the highest in those 8 years and younger.2 Effectiveness was questionable in those older than 65, with an estimated effectiveness of 23% but confidence intervals including 0.2
While the effectiveness of influenza vaccines remains suboptimal, the morbidity and mortality they prevent is still considerable. The CDC estimates that in 2016-2017, more than 5 million influenza illnesses, 2.6 million medical visits, and 84,700 hospitalizations were prevented.3 And effectiveness last season was similar to, or better than, what has been seen in each of the past 10 years (FIGURE).4

Three drugs were recommended for use to treat influenza in 2017-1018 (oseltamivir, peramivir, and zanamivir), and no resistance was found except in 1% of influenza A (H1N1) tested.1 No resistance was found in other A or any B viruses tested.1
Continue to: Safety
Safety
The safety of influenza vaccines is studied each year by both the CDC and US Food and Drug Administration (FDA). This past year, studies were conducted using the CDC-supported Safety Datalink System, looking for increased rates of acute disseminated encephalomyelitis, anaphylaxis, Bell’s palsy, encephalitis, Guillain-Barré syndrome (GBS), seizures, and transverse myelitis.5 No safety signals were detected. However, for some of the newer vaccines, the numbers of vaccinated individuals studied were small. The FDA studied the incidence of GBS using Medicare data and found no increased rates in those vaccinated.5
2018-2019 Recommendations
There are only a few changes to the recommendations for the upcoming influenza season. The Advisory Committee on Immunization Practices (ACIP) still recommends universal vaccination for anyone age 6 months and older who does not have a contraindication (TABLE 16). Two of the antigens in the vaccines for this coming season are slightly different from last season (TABLE 27).

After 2 years of recommending against the use of live attenuated influenza vaccine (LAIV) because of its low effectiveness in children against influenza A (H1N1), ACIP now includes it as an option for the upcoming season in individuals ages 2 through 49 years.8 The basis of this revised recommendation was 2-fold: 1) evidence of LAIV effectiveness comparable to that of inactivated products against A (H3N2) and B viruses; and 2) evidence that a new strain of A (H1N1) now used to produce the vaccine (A/Slovenia) produces a significantly higher antibody response than the strain (A/Bolivia) used in the years when the vaccine was not effective against A (H1N1).

However, the new formulation’s clinical effectiveness against A (H1N1) has not been demonstrated, leading the American Academy of Pediatrics to recommend that LAIV should be used in children only if other options are not available or if injectable vaccine is refused.9 Contraindications to the use of LAIV remain the same as the previous version of the vaccine (TABLE 16).
Individuals with non-severe egg allergies can receive any licensed, recommended age-appropriate influenza vaccine and no longer have to be monitored for 30 minutes after receiving the vaccine. People who have severe egg allergies should be vaccinated with an egg-free product or in a medical setting and be supervised by a health care provider who is able to recognize and manage severe allergic conditions.
Continue to: Children 6 months through 8 years...
Children 6 months through 8 years who have previously received an influenza vaccine, either trivalent or quadrivalent, need only 1 dose; those who have not received vaccination need 2 doses separated by at least 4 weeks.
Available vaccine products
A table found on the CDC influenza Web site lists the vaccine products available in the United States and the ages for which they are approved.6 The options now include 2 standard-dose trivalent inactivated influenza vaccines (IIV3), 4 standard-dose quadrivalent inactivated influenza vaccines (IIV4), one cell culture-based IIV4 (ccIIV4), one standard dose IIV4 intradermal option, a trivalent and a quadrivalent recombinant influenza vaccine (RIV3, RIV4), one LAIV, and 2 products for those 65 years and older—an adjuvanted IIV3 (aIIV3) and a high dose IIV3. Three of these products do not depend on egg-based technology: RIV3, RIV4, and ccIIV4.
Comparative effectiveness studies of these vaccine options, including those available for the elderly, are being conducted. Studies presented at the June 2018 ACIP meeting show comparable effectiveness of egg-based and non–egg-based products.6 At this time, ACIP does not make a preferential recommendation for any influenza vaccine product for any age group.
1. Garten R, Blanton L, Elal AIA, eta al. Update: Influenza activity in the United States during the 2017-18 season and composition of the 2018-2019 influenza vaccine. MMWR Morb Mortal Wkly Rep. 2018;67;634-642.
2. Flannery B, Chung JR, Belongia EA, et al. Interim estimates of 2017-18 seasonal influenza vaccine effectiveness – United States, February 2018. MMWR Morb Mortal Wkly Rep. 2018;67:180-185.
3. Flannery B, Chung J, Ferdinands J. Preliminary estimates of 2017-2018 seasonal influenza vaccine effectiveness against laboratory-confirmed influenza from the US Flu VE and HAIVEN network. Meeting of the Advisory Committee on Immunization Practices; June 20, 2018; Atlanta, Ga. Available at: https://www.cdc.gov/vaccines/acip/meetings/downloads/slides-2018-06/flu-02-Flannery-508.pdf. Accessed August 11, 2018.
4. CDC. Seasonal influenza vaccine effectiveness, 2005-2018. Available at: https://www.cdc.gov/flu/professionals/vaccination/effectiveness-studies.htm. Accessed July 27, 2018.
5. Shimabukuro T. End-of-season update: 2017-2018 influenza vaccine safety monitoring. Presented at: meeting of the Advisory Committee on Immunization Practices; June 20, 2018; Atlanta, Ga. Available at: https://www.cdc.gov/vaccines/acip/meetings/downloads/slides-2018-06/flu-04-Shimabukuro-508.pdf. Accessed August 11, 2018.
6. CDC. Prevention and Control of Seasonal Influenza with Vaccines: Recommendations of the Advisory Committee on Immunization Practices—United States, 2018–19 Influenza Season. Available at: https://www.cdc.gov/mmwr/volumes/67/rr/rr6703a1.htm?s_cid=rr6703a1_w. Accessed August 23, 2018.
7. CDC. Update: Influenza activity in the United States during the 2017-18 season and composition of the 2018-19 influenza vaccine. Available at: https://www.cdc.gov/mmwr/volumes/67/wr/mm6722a4.htm. Accessed July 27, 2018.
8. Grohskopf LA, Sokolow LZ, Fry AM, et al. Update: ACIP recommendations for the use of quadrivalent live attenuated influenza vaccine (LAIV4) — United States, 2018–19 influenza season. MMWR Morb Mortal Wkly Rep. 2018;67:643-645.
9. Jenco M. AAP: Give children IIV flu shot; use LAIV as last resort. Available at: http://www.aappublications.org/news/2018/05/21/fluvaccine051818. Accessed August 1, 2018.
The 2017-2018 influenza season was one of the most severe in this century, according to every indicator measured by the Centers for Disease Control and Prevention (CDC). The proportion of outpatient visits due to influenza-like illness (ILI) was elevated nationally above a baseline of 2.2% for 19 straight weeks, and for 3 weeks it was over 7%.1 High ILI activity was widespread and included all 50 states in January.
From October 2017 through April 2018, the CDC estimates that the influenza-related hospitalization rate was 106.6 per 100,000 population, with the highest rates among children 0 to 4 years (74.3/100,000), adults 50 to 64 years (115.7/100,000), and adults 65 years and older (460.9/100,000). More than 90% of adults hospitalized had a chronic condition, such as heart or lung disease, diabetes, or obesity, placing them at high risk for influenza complications.1
Influenza severity is also measured as the proportion of deaths due to pneumonia and influenza, which was above the epidemic threshold for 16 weeks in 2017-2018 and was above 10% for 4 weeks in January.1 Based on all of these indicators, the 2017-2018 influenza season was classified as high severity overall and for all age groups, the first time this has happened since the 2003-2004 season. There were 171 pediatric deaths attributed to influenza, and more than three-quarters of vaccine-eligible children who died from influenza this season had not received influenza vaccine.1
The type of influenza predominating last season was influenza A from early- through mid-season, and was influenza B later in the season (see https://stacks.cdc.gov/view/cdc/54974).1 For the entire season, 71.2% of specimens that tested positive for influenza in public health labs were Influenza A and 84.9% of these were H3N2.1
Effectiveness of influenza vaccine last season. As measured by preventing respiratory illness needing medical attention, vaccine effectiveness was 36% overall: 25% against influenza A (H3N2), 67% against influenza A (H1N1), and 42% against influenza B.1 Effectiveness varied by age, being the highest in those 8 years and younger.2 Effectiveness was questionable in those older than 65, with an estimated effectiveness of 23% but confidence intervals including 0.2
While the effectiveness of influenza vaccines remains suboptimal, the morbidity and mortality they prevent is still considerable. The CDC estimates that in 2016-2017, more than 5 million influenza illnesses, 2.6 million medical visits, and 84,700 hospitalizations were prevented.3 And effectiveness last season was similar to, or better than, what has been seen in each of the past 10 years (FIGURE).4
Three drugs were recommended for use to treat influenza in 2017-1018 (oseltamivir, peramivir, and zanamivir), and no resistance was found except in 1% of influenza A (H1N1) tested.1 No resistance was found in other A or any B viruses tested.1
Continue to: Safety
Safety
The safety of influenza vaccines is studied each year by both the CDC and US Food and Drug Administration (FDA). This past year, studies were conducted using the CDC-supported Safety Datalink System, looking for increased rates of acute disseminated encephalomyelitis, anaphylaxis, Bell’s palsy, encephalitis, Guillain-Barré syndrome (GBS), seizures, and transverse myelitis.5 No safety signals were detected. However, for some of the newer vaccines, the numbers of vaccinated individuals studied were small. The FDA studied the incidence of GBS using Medicare data and found no increased rates in those vaccinated.5
2018-2019 Recommendations
There are only a few changes to the recommendations for the upcoming influenza season. The Advisory Committee on Immunization Practices (ACIP) still recommends universal vaccination for anyone age 6 months and older who does not have a contraindication (TABLE 16). Two of the antigens in the vaccines for this coming season are slightly different from last season (TABLE 27).
After 2 years of recommending against the use of live attenuated influenza vaccine (LAIV) because of its low effectiveness in children against influenza A (H1N1), ACIP now includes it as an option for the upcoming season in individuals ages 2 through 49 years.8 The basis of this revised recommendation was 2-fold: 1) evidence of LAIV effectiveness comparable to that of inactivated products against A (H3N2) and B viruses; and 2) evidence that a new strain of A (H1N1) now used to produce the vaccine (A/Slovenia) produces a significantly higher antibody response than the strain (A/Bolivia) used in the years when the vaccine was not effective against A (H1N1).
However, the new formulation’s clinical effectiveness against A (H1N1) has not been demonstrated, leading the American Academy of Pediatrics to recommend that LAIV should be used in children only if other options are not available or if injectable vaccine is refused.9 Contraindications to the use of LAIV remain the same as the previous version of the vaccine (TABLE 16).
Individuals with non-severe egg allergies can receive any licensed, recommended age-appropriate influenza vaccine and no longer have to be monitored for 30 minutes after receiving the vaccine. People who have severe egg allergies should be vaccinated with an egg-free product or in a medical setting and be supervised by a health care provider who is able to recognize and manage severe allergic conditions.
Continue to: Children 6 months through 8 years...
Children 6 months through 8 years who have previously received an influenza vaccine, either trivalent or quadrivalent, need only 1 dose; those who have not received vaccination need 2 doses separated by at least 4 weeks.
Available vaccine products
A table found on the CDC influenza Web site lists the vaccine products available in the United States and the ages for which they are approved.6 The options now include 2 standard-dose trivalent inactivated influenza vaccines (IIV3), 4 standard-dose quadrivalent inactivated influenza vaccines (IIV4), one cell culture-based IIV4 (ccIIV4), one standard dose IIV4 intradermal option, a trivalent and a quadrivalent recombinant influenza vaccine (RIV3, RIV4), one LAIV, and 2 products for those 65 years and older—an adjuvanted IIV3 (aIIV3) and a high dose IIV3. Three of these products do not depend on egg-based technology: RIV3, RIV4, and ccIIV4.
Comparative effectiveness studies of these vaccine options, including those available for the elderly, are being conducted. Studies presented at the June 2018 ACIP meeting show comparable effectiveness of egg-based and non–egg-based products.6 At this time, ACIP does not make a preferential recommendation for any influenza vaccine product for any age group.
1. Garten R, Blanton L, Elal AIA, eta al. Update: Influenza activity in the United States during the 2017-18 season and composition of the 2018-2019 influenza vaccine. MMWR Morb Mortal Wkly Rep. 2018;67;634-642.
2. Flannery B, Chung JR, Belongia EA, et al. Interim estimates of 2017-18 seasonal influenza vaccine effectiveness – United States, February 2018. MMWR Morb Mortal Wkly Rep. 2018;67:180-185.
3. Flannery B, Chung J, Ferdinands J. Preliminary estimates of 2017-2018 seasonal influenza vaccine effectiveness against laboratory-confirmed influenza from the US Flu VE and HAIVEN network. Meeting of the Advisory Committee on Immunization Practices; June 20, 2018; Atlanta, Ga. Available at: https://www.cdc.gov/vaccines/acip/meetings/downloads/slides-2018-06/flu-02-Flannery-508.pdf. Accessed August 11, 2018.
4. CDC. Seasonal influenza vaccine effectiveness, 2005-2018. Available at: https://www.cdc.gov/flu/professionals/vaccination/effectiveness-studies.htm. Accessed July 27, 2018.
5. Shimabukuro T. End-of-season update: 2017-2018 influenza vaccine safety monitoring. Presented at: meeting of the Advisory Committee on Immunization Practices; June 20, 2018; Atlanta, Ga. Available at: https://www.cdc.gov/vaccines/acip/meetings/downloads/slides-2018-06/flu-04-Shimabukuro-508.pdf. Accessed August 11, 2018.
6. CDC. Prevention and Control of Seasonal Influenza with Vaccines: Recommendations of the Advisory Committee on Immunization Practices—United States, 2018–19 Influenza Season. Available at: https://www.cdc.gov/mmwr/volumes/67/rr/rr6703a1.htm?s_cid=rr6703a1_w. Accessed August 23, 2018.
7. CDC. Update: Influenza activity in the United States during the 2017-18 season and composition of the 2018-19 influenza vaccine. Available at: https://www.cdc.gov/mmwr/volumes/67/wr/mm6722a4.htm. Accessed July 27, 2018.
8. Grohskopf LA, Sokolow LZ, Fry AM, et al. Update: ACIP recommendations for the use of quadrivalent live attenuated influenza vaccine (LAIV4) — United States, 2018–19 influenza season. MMWR Morb Mortal Wkly Rep. 2018;67:643-645.
9. Jenco M. AAP: Give children IIV flu shot; use LAIV as last resort. Available at: http://www.aappublications.org/news/2018/05/21/fluvaccine051818. Accessed August 1, 2018.

Safety Huddle Intervention for Reducing Physiologic Monitor Alarms: A Hybrid Effectiveness-Implementation Cluster Randomized Trial
Physiologic monitor alarms occur frequently in the hospital environment, with average rates on pediatric wards between 42 and 155 alarms per monitored patient-day.1 However, average rates do not depict the full story, because only 9%–25% of patients are responsible for most alarms on inpatient wards.1,2 In addition, only 0.5%–1% of alarms on pediatric wards warrant action.3,4 Downstream consequences of high alarm rates include interruptions5,6 and alarm fatigue.3,4,7
Alarm customization, the process of reviewing individual patients’ alarm data and using that data to implement patient-specific alarm reduction interventions, has emerged as a potential approach to unit-wide alarm management.8-11 Potential customizations include broadening alarm thresholds, instituting delays between the time the alarm condition is met and the time the alarm sounds, and changing electrodes.8-11 However, the workflows within which to identify the patients who will benefit from customization, make decisions about how to customize, and implement customizations have not been delineated.
Safety huddles are brief structured discussions among physicians, nurses, and other staff aiming to identify and mitigate threats to patient safety.11-13 In this study, we aimed to evaluate the influence of a safety huddle-based alarm intervention strategy targeting high alarm pediatric ward patients on (a) unit-level alarm rates and (b) patient-level alarm rates, as well as to (c) evaluate implementation outcomes. We hypothesized that patients discussed in huddles would have greater reductions in alarm rates in the 24 hours following their huddle than patients who were not discussed. Given that most alarms are generated by a small fraction of patients,1,2 we hypothesized that patient-level reductions would translate to unit-level reductions.
METHODS
Human Subject Protection
The Institutional Review Board of Children’s Hospital of Philadelphia approved this study with a waiver of informed consent. We registered the study at ClinicalTrials.gov (identifier NCT02458872). The original protocol is available as an Online Supplement.
Design and Framework

For our secondary effectiveness outcome evaluating the effect of the intervention on the alarm rates of the individual patients discussed in huddles, we used a cohort design embedded within the trial to analyze patient-specific alarm data collected only on randomly selected “intensive data collection days,” described below and in Figure 1.
Setting and Subjects
All patients hospitalized on 8 units that admit general pediatric and medical subspecialty patients at Children’s Hospital of Philadelphia between June 15, 2015 and May 8, 2016 were included in the primary (unit-level) analysis. Every patient’s bedside included a General Electric Dash 3000 physiologic monitor. Decisions to monitor patients were made by physicians and required orders. Default alarm settings are available in Supplementary Table 1; these settings required orders to change.
All 8 units were already convening scheduled safety huddles led by the charge nurse each day. All nurses and at least one resident were expected to attend; attending physicians and fellows were welcome but not expected to attend. Huddles focused on discussing safety concerns and patient flow. None of the preexisting huddles included alarm discussion.
Intervention
For each nonholiday weekday, we generated customized paper-based alarm huddle data “dashboards” (Supplementary Figure 1) displaying data from the patients (up to a maximum of 4) on each intervention unit with the highest numbers of high-acuity alarms (“crisis” and “warning” audible alarms, see Supplementary Table 2 for detailed listing of alarm types) in the preceding 4 hours by reviewing data from the monitor network using BedMasterEx v4.2 (Excel Medical Electronics). Dashboards listed the most frequent types of alarms, alarm settings, and included a script for discussing the alarms with checkboxes to indicate changes agreed upon by the team during the huddle. Patients with fewer than 20 alarms in the preceding 4h were not included; thus, sometimes fewer than 4 patients’ data were available for discussion. We hand-delivered dashboards to the charge nurses leading huddles, and they facilitated the multidisciplinary alarm discussions focused on reviewing alarm data and customizing settings to reduce unnecessary alarms.
Study Periods
The study had 3 periods as shown in Supplementary Figure 2: (1) 16-week baseline data collection, (2) phased intervention implementation during which we serially spent 2-8 weeks on each of the 4 intervention units implementing the intervention, and (3) 16-week postimplementation data collection.
Outcomes
The primary effectiveness outcome was the change in unit-level alarms per patient-day between the baseline and postimplementation periods in intervention versus control units, with all patients on the units included. The secondary effectiveness outcome (analyzed using the embedded cohort design) was the change in individual patient-level alarms between the 24 hours leading up to a huddle and the 24 hours following huddles in patients who were versus patients who were not discussed in huddles.
Implementation outcomes included adoption and fidelity measures. To measure adoption (defined as “intention to try” the intervention),16 we measured the frequency of discussions attended by patients’ nurses and physicians. We evaluated 3 elements of fidelity: adherence, dose, and quality of delivery.17 We measured adherence as the incorporation of alarm discussion into huddles when there were eligible patients to discuss. We measured dose as the average number of patients discussed on each unit per calendar day during the postimplementation period. We measured quality of delivery as the extent to which changes to monitoring that were agreed upon in the huddles were made at the bedside.
Safety Measures
To surveil for unintended consequences of reduced monitoring, we screened the hospital’s rapid response and code blue team database weekly for any events in patients previously discussed in huddles that occurred between huddle and hospital discharge. We reviewed charts to determine if the events were related to the intervention.
Randomization
Prior to randomization, the 8 units were divided into pairs based on participation in hospital-wide Joint Commission alarm management activities, use of alarm middleware that relayed detailed alarm information to nurses’ mobile phones, and baseline alarm rates. One unit in each pair was randomized to intervention and the other to control by coin flip.
Data Collection
We used Research Electronic Data Capture (REDCap)18 database tools.
Data for Unit-Level Analyses
We captured all alarms occurring on the study units during the study period using data from BedMasterEx. We obtained census data accurate to the hour from the Clinical Data Warehouse.
Data Captured in All Huddles
During each huddle, we collected the number of patients whose alarms were discussed, patient characteristics, presence of nurses and physicians, and monitoring changes agreed upon. We then followed up 4 hours later to determine if changes were made at the bedside by examining monitor settings.
Data Captured Only During Intensive Data Collection Days
We randomly selected 1 day during each of the 16 weeks of the postimplementation period to obtain additional patient-level data. On each intensive data collection day, the 4 monitored patients on each intervention and control unit with the most high-acuity alarms in the 4 hours prior to huddles occurring — regardless of whether or not these patients were later discussed in huddles — were identified for data collection. On these dates, a member of the research team reviewed each patient’s alarm counts in 4-hour blocks during the 24 hours before and after the huddle. Given that the huddles were not always at the same time every day (ranging between 10:00 and 13:00), we operationally set the huddle time as 12:00 for all units.
Data Analysis
We used Stata/SE 14.2 for all analyses.
Unit-Level Alarm Rates
To compare unit-level rates, we performed an interrupted time series analysis using segmented (piecewise) regression to evaluate the impact of the intervention.19,20 We used a multivariable generalized estimating equation model with the negative binomial distribution21 and clustering by unit. We bootstrapped the model and generated percentile-based 95% confidence intervals. We then used the model to estimate the alarm rate difference in differences between the baseline data collection period and the postimplementation data collection period for intervention versus control units.
Patient-Level Alarm Rates
In contrast to unit-level analysis, we used an embedded cohort design to model the change in individual patients’ alarms between the 24 hours leading up to huddles and the 24 hours following huddles in patients who were versus patients who were not discussed in huddles. The analysis was restricted to the patients included in intensive data collection days. We performed bootstrapped linear regression and generated percentile-based 95% confidence intervals using the difference in 4-hour block alarm rate between pre- and posthuddle as the outcome. We clustered within patients. We stratified by unit and preceding alarm rate. We modeled the alarm rate difference between the 24-hour prehuddle and the 24-hour posthuddle for huddled and nonhuddled patients and the difference in differences between exposure groups.
Implementation Outcomes
We summarized adoption and fidelity using proportions.
RESULTS
Alarm dashboards informed 580 structured alarm discussions during 353 safety huddles (huddles often included discussion of more than one patient).
Unit-Level Alarm Rates
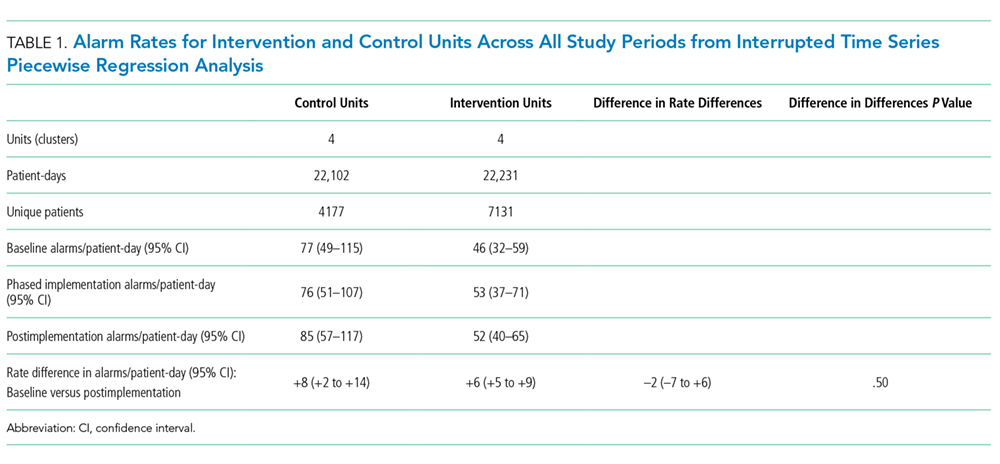
Visually, alarm rates over time on each individual unit appeared flat despite the intervention (Supplementary Figure 3). Using piecewise regression, we found that intervention and control units had small increases in alarm rates between the baseline and postimplementation periods with a nonsignificant difference in these differences between the control and intervention groups (Table 1).
Patient-Level Alarm Rates
We then restricted the analysis to the patients whose data were collected during intensive data collection days. We obtained data from 1974 pre-post pairs of 4-hour time periods.
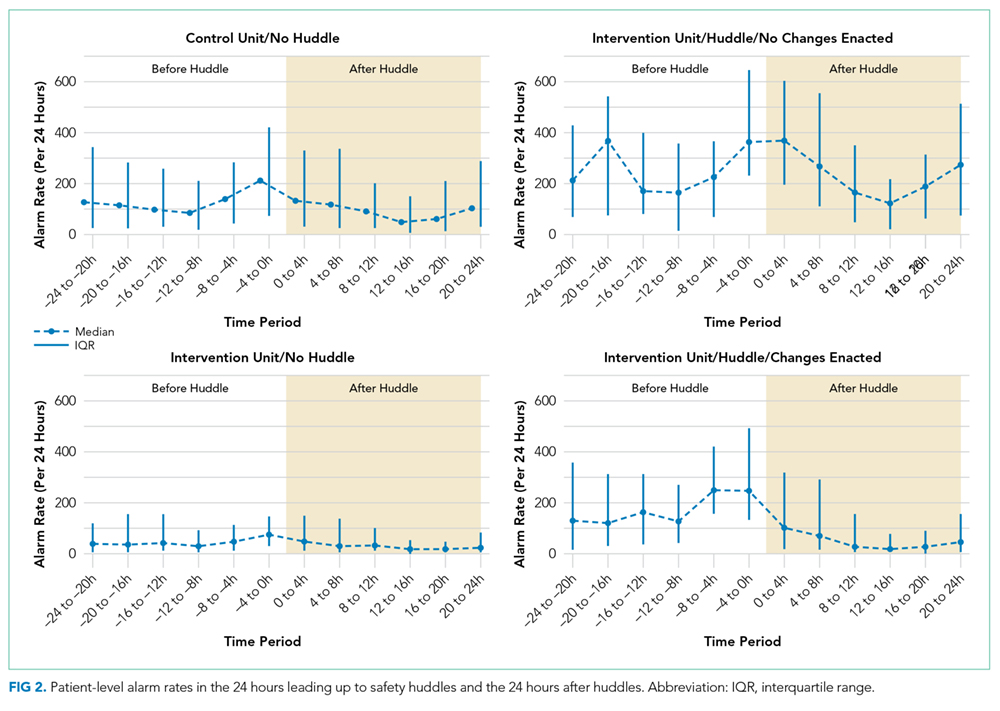

Implementation Outcomes
Adoption
The patient’s nurse attended 482 of the 580 huddle discussions (83.1%), and at least one of the patient’s physicians (resident, fellow, or attending) attended 394 (67.9%).
Fidelity: Adherence
In addition to the 353 huddles that included alarm discussion, 123 instances had no patients with ≥20 high acuity alarms in the preceding 4 hours therefore, no data were brought to the huddle. There were an additional 30 instances when a huddle did not occur or there was no alarm discussion in the huddle despite data being available. Thus, adherence occurred in 353 of 383 huddles (92.2%).
Fidelity: Dose
During the 112 calendar day postimplementation period, 379 patients’ alarms were discussed in huddles for an average intervention dose of 0.85 discussions per unit per calendar day.
Fidelity: Quality of Delivery
In 362 of the 580 huddle discussions (62.4%), changes were agreed upon. The most frequently agreed upon changes were discontinuing monitoring (32.0%), monitoring only when asleep or unsupervised (23.8%), widening heart rate parameters (12.7%), changing electrocardiographic leads/wires (8.6%), changing the pulse oximetry probe (8.0%), and increasing the delay time between when oxygen desaturation was detected and when the alarm was generated (4.7%). Of the huddle discussions with changes agreed upon, 346 (95.6%) changes were enacted at the bedside.
Safety Measures
There were 0 code blue events and 26 rapid response team activations for patients discussed in huddles. None were related to the intervention.
Discussion
Our main finding was that the huddle strategy was effective in safely reducing the burden of alarms for the high alarm pediatric ward patients whose alarms were discussed, but it did not reduce unit-level alarm rates. Implementation outcomes explained this finding. Although adoption and adherence were high, the overall dose of the intervention was low.
We also found that 36% of alarms had technical causes, the majority of which were related to the pulse oximetry probe detecting that it was off the patient or searching for a pulse. Although these alarms are likely perceived differently by clinical staff (most monitors generate different sounds for technical alarms), they still represent a substantial contribution to the alarm environment. Minimizing them in patients who must remain continuously monitored requires more intensive effort to implement other types of interventions than the main focus of this study, such as changing pulse oximetry probes and electrocardiographic leads/wires.
In one-third of huddles, monitoring was simply discontinued. We observed in many cases that, while these patients may have had legitimate indications for monitoring upon admission, their conditions had improved; after brief multidisciplinary discussion, the team concluded that monitoring was no longer indicated. This observation may suggest interventions at the ordering phase, such as prespecifying a monitoring duration.22,23
This study’s findings were consistent with a quasi-experimental study of safety huddle-based alarm discussions in a pediatric intensive care unit that showed a patient-level reduction of 116 alarms per patient-day in those discussed in huddles relative to controls.11 A smaller quasi-experimental study of implementing a nighttime alarm “ward round” in an adult intensive care unit showed a significant reduction in unit-level alarms/patient-day from 168 to 84.9 In a quality improvement report, a monitoring care process bundle that included discussion of alarm settings showed a reduction in unit-level alarms/patient-day from 180 to 40.10 Our study strengthens the body of literature using a cluster-randomized design, measuring patient- and unit-level outcomes, and including implementation outcomes that explain effectiveness findings.
On a hypothetical unit similar to the ones we studied with 20 occupied beds and 60 alarms/patient-day, an average of 1200 alarms would occur each day. We delivered the intervention to 0.85 patients per day. Changes were made at the bedside in 60% of those with the intervention delivered, and those patients had a difference in differences of 119 fewer alarms compared with the comparison patients on control units. In this scenario, we could expect a relative reduction of 0.85 x 0.60 x 119 = 61 fewer alarms/day total on the unit or a 5% reduction. However, that estimated reduction did not account for the arrival of new patients with high alarm rates, which certainly occurred in this study and explained the lack of effect at the unit level.
As described above, the intervention dose was low, which translated into a lack of effect at the unit level despite a strong effect at the patient level. This result was partly due to the manual process required to produce the alarm dashboards that restricted their availability to nonholiday weekdays. The study was performed at one hospital, which limited generalizability. The study hospital was already convening daily safety huddles that were well attended by nurses and physicians. Other hospitals without existing huddle structures may face challenges in implementing similar multidisciplinary alarm discussions. In addition, the study design was randomized at the unit (rather than patient) level, which limited our ability to balance potential confounders at the patient level.
Conclusion
A safety huddle intervention strategy to drive alarm customization was effective in safely reducing alarms for individual children discussed. However, unit-level alarm rates were not affected by the intervention due to a low dose. Leaders of efforts to reduce alarms should consider beginning with passive interventions (such as changes to default settings and alarm delays) and use huddle-based discussion as a second-line intervention to address remaining patients with high alarm rates.
Acknowledgments
We thank Matthew MacMurchy, BA, for his assistance with data collection.
Funding/Support
This study was supported by a Young Investigator Award (Bonafide, PI) from the Academic Pediatric Association.
Role of the Funder/Sponsor
The Academic Pediatric Association had no role in the design or conduct of the study; collection, management, analysis, or interpretation of the data; preparation, review, or approval of the manuscript; or decision to submit for publication.
Disclosures
No relevant financial activities, aside from the grant funding from the Academic Pediatric Association listed above, are reported.
1. Schondelmeyer AC, Brady PW, Goel VV, et al. Physiologic monitor alarm rates at 5 children’s hospitals. J Hosp Med. 2018;In press. PubMed
2. Cvach M, Kitchens M, Smith K, Harris P, Flack MN. Customizing alarm limits based on specific needs of patients. Biomed Instrum Technol. 2017;51(3):227-234. PubMed
3. Bonafide CP, Lin R, Zander M, et al. Association between exposure to nonactionable physiologic monitor alarms and response time in a children’s hospital. J Hosp Med. 2015;10(6):345-351. PubMed
4. Bonafide CP, Localio AR, Holmes JH, et al. Video analysis of factors associated with response time to physiologic monitor alarms in a children’s hospital. JAMA Pediatr. 2017;171(6):524-531. PubMed
5. Lange K, Nowak M, Zoller R, Lauer W. Boundary conditions for safe detection of clinical alarms: An observational study to identify the cognitive and perceptual demands on an Intensive Care Unit. In: In: D. de Waard, K.A. Brookhuis, A. Toffetti, A. Stuiver, C. Weikert, D. Coelho, D. Manzey, A.B. Ünal, S. Röttger, and N. Merat (Eds.) Proceedings of the Human Factors and Ergonomics Society Europe Chapter 2015 Annual Conference. Groningen, Netherlands; 2016.
6. Westbrook JI, Li L, Hooper TD, Raban MZ, Middleton S, Lehnbom EC. Effectiveness of a ‘Do not interrupt’ bundled intervention to reduce interruptions during medication administration: a cluster randomised controlled feasibility study. BMJ Qual Saf. 2017;26:734-742. PubMed
7. Chopra V, McMahon LF Jr. Redesigning hospital alarms for patient safety: alarmed and potentially dangerous. JAMA. 2014;311(12):1199-1200. PubMed
8. Turmell JW, Coke L, Catinella R, Hosford T, Majeski A. Alarm fatigue: use of an evidence-based alarm management strategy. J Nurs Care Qual. 2017;32(1):47-54. PubMed
9. Koerber JP, Walker J, Worsley M, Thorpe CM. An alarm ward round reduces the frequency of false alarms on the ICU at night. J Intensive Care Soc. 2011;12(1):75-76.
10. Dandoy CE, Davies SM, Flesch L, et al. A team-based approach to reducing cardiac monitor alarms. Pediatrics. 2014;134(6):e1686-1694. PubMed
11. Dewan M, Wolfe H, Lin R, et al. Impact of a safety huddle–based intervention on monitor alarm rates in low-acuity pediatric intensive care unit patients. J Hosp Med. 2017;12(8):652-657. PubMed
12. Goldenhar LM, Brady PW, Sutcliffe KM, Muething SE. Huddling for high reliability and situation awareness. BMJ Qual Saf. 2013;22(11):899-906. PubMed
13. Brady PW, Muething S, Kotagal U, et al. Improving situation awareness to reduce unrecognized clinical deterioration and serious safety events. Pediatrics. 2013;131:e298-308. PubMed
14. Curran GM, Bauer M, Mittman B, Pyne JM, Stetler C. Effectiveness-implementation hybrid designs: combining elements of clinical effectiveness and implementation research to enhance public health impact. Med Care. 2012;50(3):217-226. PubMed
15. Damschroder LJ, Aron DC, Keith RE, Kirsh SR, Alexander JA, Lowery JC. Fostering implementation of health services research findings into practice: a consolidated framework for advancing implementation science. Implement Sci. 2009;4(1):50. PubMed
16. Proctor E, Silmere H, Raghavan R, et al. Outcomes for implementation research: conceptual distinctions, measurement challenges, and research agenda. Adm Policy Ment Health. 2011;38(2):65-76. PubMed
17. Allen JD, Linnan LA, Emmons KM. Fidelity and its relationship to implementation effectiveness, adaptation, and dissemination. In: Dissemination and Implementation Research in Health: Translating Science to Practice (Brownson RC, Proctor EK, Colditz GA Eds.). Oxford University Press; 2012:281-304.
18. Harris PA, Taylor R, Thielke R, Payne J, Gonzalez N, Conde JG. Research electronic data capture (REDCap)—a metadata-driven methodology and workflow process for providing translational research informatics support. J Biomed Inf. 2009;42:377-381. PubMed
19. Singer JD, Willett JB. Applied Longitudinal Data Analysis: Modeling Change and Event Occurrence. New York: Oxford University Press; 2003.
20. Wagner AK, Soumerai SB, Zhang F, Ross-Degnan D. Segmented regression analysis of interrupted time series studies in medication use research. J Clin Pharm Ther. 2002;27:299-309. PubMed
21. Gardner W, Mulvey EP, Shaw EC. Regression analyses of counts and rates: Poisson, overdispersed Poisson, and negative binomial models. Psychol Bull. 1995;118:392-404. PubMed
22. Dressler R, Dryer MM, Coletti C, Mahoney D, Doorey AJ. Altering overuse of cardiac telemetry in non-intensive care unit settings by hardwiring the use of American Heart Association guidelines. JAMA Intern Med. 2014;174(11):1852-1854. PubMed
23. Boggan JC, Navar-Boggan AM, Patel V, Schulteis RD, Simel DL. Reductions in telemetry order duration do not reduce telemetry utilization. J Hosp Med. 2014;9(12):795-796. PubMed
Physiologic monitor alarms occur frequently in the hospital environment, with average rates on pediatric wards between 42 and 155 alarms per monitored patient-day.1 However, average rates do not depict the full story, because only 9%–25% of patients are responsible for most alarms on inpatient wards.1,2 In addition, only 0.5%–1% of alarms on pediatric wards warrant action.3,4 Downstream consequences of high alarm rates include interruptions5,6 and alarm fatigue.3,4,7
Alarm customization, the process of reviewing individual patients’ alarm data and using that data to implement patient-specific alarm reduction interventions, has emerged as a potential approach to unit-wide alarm management.8-11 Potential customizations include broadening alarm thresholds, instituting delays between the time the alarm condition is met and the time the alarm sounds, and changing electrodes.8-11 However, the workflows within which to identify the patients who will benefit from customization, make decisions about how to customize, and implement customizations have not been delineated.
Safety huddles are brief structured discussions among physicians, nurses, and other staff aiming to identify and mitigate threats to patient safety.11-13 In this study, we aimed to evaluate the influence of a safety huddle-based alarm intervention strategy targeting high alarm pediatric ward patients on (a) unit-level alarm rates and (b) patient-level alarm rates, as well as to (c) evaluate implementation outcomes. We hypothesized that patients discussed in huddles would have greater reductions in alarm rates in the 24 hours following their huddle than patients who were not discussed. Given that most alarms are generated by a small fraction of patients,1,2 we hypothesized that patient-level reductions would translate to unit-level reductions.
METHODS
Human Subject Protection
The Institutional Review Board of Children’s Hospital of Philadelphia approved this study with a waiver of informed consent. We registered the study at ClinicalTrials.gov (identifier NCT02458872). The original protocol is available as an Online Supplement.
Design and Framework
For our secondary effectiveness outcome evaluating the effect of the intervention on the alarm rates of the individual patients discussed in huddles, we used a cohort design embedded within the trial to analyze patient-specific alarm data collected only on randomly selected “intensive data collection days,” described below and in Figure 1.
Setting and Subjects
All patients hospitalized on 8 units that admit general pediatric and medical subspecialty patients at Children’s Hospital of Philadelphia between June 15, 2015 and May 8, 2016 were included in the primary (unit-level) analysis. Every patient’s bedside included a General Electric Dash 3000 physiologic monitor. Decisions to monitor patients were made by physicians and required orders. Default alarm settings are available in Supplementary Table 1; these settings required orders to change.
All 8 units were already convening scheduled safety huddles led by the charge nurse each day. All nurses and at least one resident were expected to attend; attending physicians and fellows were welcome but not expected to attend. Huddles focused on discussing safety concerns and patient flow. None of the preexisting huddles included alarm discussion.
Intervention
For each nonholiday weekday, we generated customized paper-based alarm huddle data “dashboards” (Supplementary Figure 1) displaying data from the patients (up to a maximum of 4) on each intervention unit with the highest numbers of high-acuity alarms (“crisis” and “warning” audible alarms, see Supplementary Table 2 for detailed listing of alarm types) in the preceding 4 hours by reviewing data from the monitor network using BedMasterEx v4.2 (Excel Medical Electronics). Dashboards listed the most frequent types of alarms, alarm settings, and included a script for discussing the alarms with checkboxes to indicate changes agreed upon by the team during the huddle. Patients with fewer than 20 alarms in the preceding 4h were not included; thus, sometimes fewer than 4 patients’ data were available for discussion. We hand-delivered dashboards to the charge nurses leading huddles, and they facilitated the multidisciplinary alarm discussions focused on reviewing alarm data and customizing settings to reduce unnecessary alarms.
Study Periods
The study had 3 periods as shown in Supplementary Figure 2: (1) 16-week baseline data collection, (2) phased intervention implementation during which we serially spent 2-8 weeks on each of the 4 intervention units implementing the intervention, and (3) 16-week postimplementation data collection.
Outcomes
The primary effectiveness outcome was the change in unit-level alarms per patient-day between the baseline and postimplementation periods in intervention versus control units, with all patients on the units included. The secondary effectiveness outcome (analyzed using the embedded cohort design) was the change in individual patient-level alarms between the 24 hours leading up to a huddle and the 24 hours following huddles in patients who were versus patients who were not discussed in huddles.
Implementation outcomes included adoption and fidelity measures. To measure adoption (defined as “intention to try” the intervention),16 we measured the frequency of discussions attended by patients’ nurses and physicians. We evaluated 3 elements of fidelity: adherence, dose, and quality of delivery.17 We measured adherence as the incorporation of alarm discussion into huddles when there were eligible patients to discuss. We measured dose as the average number of patients discussed on each unit per calendar day during the postimplementation period. We measured quality of delivery as the extent to which changes to monitoring that were agreed upon in the huddles were made at the bedside.
Safety Measures
To surveil for unintended consequences of reduced monitoring, we screened the hospital’s rapid response and code blue team database weekly for any events in patients previously discussed in huddles that occurred between huddle and hospital discharge. We reviewed charts to determine if the events were related to the intervention.
Randomization
Prior to randomization, the 8 units were divided into pairs based on participation in hospital-wide Joint Commission alarm management activities, use of alarm middleware that relayed detailed alarm information to nurses’ mobile phones, and baseline alarm rates. One unit in each pair was randomized to intervention and the other to control by coin flip.
Data Collection
We used Research Electronic Data Capture (REDCap)18 database tools.
Data for Unit-Level Analyses
We captured all alarms occurring on the study units during the study period using data from BedMasterEx. We obtained census data accurate to the hour from the Clinical Data Warehouse.
Data Captured in All Huddles
During each huddle, we collected the number of patients whose alarms were discussed, patient characteristics, presence of nurses and physicians, and monitoring changes agreed upon. We then followed up 4 hours later to determine if changes were made at the bedside by examining monitor settings.
Data Captured Only During Intensive Data Collection Days
We randomly selected 1 day during each of the 16 weeks of the postimplementation period to obtain additional patient-level data. On each intensive data collection day, the 4 monitored patients on each intervention and control unit with the most high-acuity alarms in the 4 hours prior to huddles occurring — regardless of whether or not these patients were later discussed in huddles — were identified for data collection. On these dates, a member of the research team reviewed each patient’s alarm counts in 4-hour blocks during the 24 hours before and after the huddle. Given that the huddles were not always at the same time every day (ranging between 10:00 and 13:00), we operationally set the huddle time as 12:00 for all units.
Data Analysis
We used Stata/SE 14.2 for all analyses.
Unit-Level Alarm Rates
To compare unit-level rates, we performed an interrupted time series analysis using segmented (piecewise) regression to evaluate the impact of the intervention.19,20 We used a multivariable generalized estimating equation model with the negative binomial distribution21 and clustering by unit. We bootstrapped the model and generated percentile-based 95% confidence intervals. We then used the model to estimate the alarm rate difference in differences between the baseline data collection period and the postimplementation data collection period for intervention versus control units.
Patient-Level Alarm Rates
In contrast to unit-level analysis, we used an embedded cohort design to model the change in individual patients’ alarms between the 24 hours leading up to huddles and the 24 hours following huddles in patients who were versus patients who were not discussed in huddles. The analysis was restricted to the patients included in intensive data collection days. We performed bootstrapped linear regression and generated percentile-based 95% confidence intervals using the difference in 4-hour block alarm rate between pre- and posthuddle as the outcome. We clustered within patients. We stratified by unit and preceding alarm rate. We modeled the alarm rate difference between the 24-hour prehuddle and the 24-hour posthuddle for huddled and nonhuddled patients and the difference in differences between exposure groups.
Implementation Outcomes
We summarized adoption and fidelity using proportions.
RESULTS
Alarm dashboards informed 580 structured alarm discussions during 353 safety huddles (huddles often included discussion of more than one patient).
Unit-Level Alarm Rates
Visually, alarm rates over time on each individual unit appeared flat despite the intervention (Supplementary Figure 3). Using piecewise regression, we found that intervention and control units had small increases in alarm rates between the baseline and postimplementation periods with a nonsignificant difference in these differences between the control and intervention groups (Table 1).
Patient-Level Alarm Rates
We then restricted the analysis to the patients whose data were collected during intensive data collection days. We obtained data from 1974 pre-post pairs of 4-hour time periods.
Implementation Outcomes
Adoption
The patient’s nurse attended 482 of the 580 huddle discussions (83.1%), and at least one of the patient’s physicians (resident, fellow, or attending) attended 394 (67.9%).
Fidelity: Adherence
In addition to the 353 huddles that included alarm discussion, 123 instances had no patients with ≥20 high acuity alarms in the preceding 4 hours therefore, no data were brought to the huddle. There were an additional 30 instances when a huddle did not occur or there was no alarm discussion in the huddle despite data being available. Thus, adherence occurred in 353 of 383 huddles (92.2%).
Fidelity: Dose
During the 112 calendar day postimplementation period, 379 patients’ alarms were discussed in huddles for an average intervention dose of 0.85 discussions per unit per calendar day.
Fidelity: Quality of Delivery
In 362 of the 580 huddle discussions (62.4%), changes were agreed upon. The most frequently agreed upon changes were discontinuing monitoring (32.0%), monitoring only when asleep or unsupervised (23.8%), widening heart rate parameters (12.7%), changing electrocardiographic leads/wires (8.6%), changing the pulse oximetry probe (8.0%), and increasing the delay time between when oxygen desaturation was detected and when the alarm was generated (4.7%). Of the huddle discussions with changes agreed upon, 346 (95.6%) changes were enacted at the bedside.
Safety Measures
There were 0 code blue events and 26 rapid response team activations for patients discussed in huddles. None were related to the intervention.
Discussion
Our main finding was that the huddle strategy was effective in safely reducing the burden of alarms for the high alarm pediatric ward patients whose alarms were discussed, but it did not reduce unit-level alarm rates. Implementation outcomes explained this finding. Although adoption and adherence were high, the overall dose of the intervention was low.
We also found that 36% of alarms had technical causes, the majority of which were related to the pulse oximetry probe detecting that it was off the patient or searching for a pulse. Although these alarms are likely perceived differently by clinical staff (most monitors generate different sounds for technical alarms), they still represent a substantial contribution to the alarm environment. Minimizing them in patients who must remain continuously monitored requires more intensive effort to implement other types of interventions than the main focus of this study, such as changing pulse oximetry probes and electrocardiographic leads/wires.
In one-third of huddles, monitoring was simply discontinued. We observed in many cases that, while these patients may have had legitimate indications for monitoring upon admission, their conditions had improved; after brief multidisciplinary discussion, the team concluded that monitoring was no longer indicated. This observation may suggest interventions at the ordering phase, such as prespecifying a monitoring duration.22,23
This study’s findings were consistent with a quasi-experimental study of safety huddle-based alarm discussions in a pediatric intensive care unit that showed a patient-level reduction of 116 alarms per patient-day in those discussed in huddles relative to controls.11 A smaller quasi-experimental study of implementing a nighttime alarm “ward round” in an adult intensive care unit showed a significant reduction in unit-level alarms/patient-day from 168 to 84.9 In a quality improvement report, a monitoring care process bundle that included discussion of alarm settings showed a reduction in unit-level alarms/patient-day from 180 to 40.10 Our study strengthens the body of literature using a cluster-randomized design, measuring patient- and unit-level outcomes, and including implementation outcomes that explain effectiveness findings.
On a hypothetical unit similar to the ones we studied with 20 occupied beds and 60 alarms/patient-day, an average of 1200 alarms would occur each day. We delivered the intervention to 0.85 patients per day. Changes were made at the bedside in 60% of those with the intervention delivered, and those patients had a difference in differences of 119 fewer alarms compared with the comparison patients on control units. In this scenario, we could expect a relative reduction of 0.85 x 0.60 x 119 = 61 fewer alarms/day total on the unit or a 5% reduction. However, that estimated reduction did not account for the arrival of new patients with high alarm rates, which certainly occurred in this study and explained the lack of effect at the unit level.
As described above, the intervention dose was low, which translated into a lack of effect at the unit level despite a strong effect at the patient level. This result was partly due to the manual process required to produce the alarm dashboards that restricted their availability to nonholiday weekdays. The study was performed at one hospital, which limited generalizability. The study hospital was already convening daily safety huddles that were well attended by nurses and physicians. Other hospitals without existing huddle structures may face challenges in implementing similar multidisciplinary alarm discussions. In addition, the study design was randomized at the unit (rather than patient) level, which limited our ability to balance potential confounders at the patient level.
Conclusion
A safety huddle intervention strategy to drive alarm customization was effective in safely reducing alarms for individual children discussed. However, unit-level alarm rates were not affected by the intervention due to a low dose. Leaders of efforts to reduce alarms should consider beginning with passive interventions (such as changes to default settings and alarm delays) and use huddle-based discussion as a second-line intervention to address remaining patients with high alarm rates.
Acknowledgments
We thank Matthew MacMurchy, BA, for his assistance with data collection.
Funding/Support
This study was supported by a Young Investigator Award (Bonafide, PI) from the Academic Pediatric Association.
Role of the Funder/Sponsor
The Academic Pediatric Association had no role in the design or conduct of the study; collection, management, analysis, or interpretation of the data; preparation, review, or approval of the manuscript; or decision to submit for publication.
Disclosures
No relevant financial activities, aside from the grant funding from the Academic Pediatric Association listed above, are reported.
1. Schondelmeyer AC, Brady PW, Goel VV, et al. Physiologic monitor alarm rates at 5 children’s hospitals. J Hosp Med. 2018;In press. PubMed
2. Cvach M, Kitchens M, Smith K, Harris P, Flack MN. Customizing alarm limits based on specific needs of patients. Biomed Instrum Technol. 2017;51(3):227-234. PubMed
3. Bonafide CP, Lin R, Zander M, et al. Association between exposure to nonactionable physiologic monitor alarms and response time in a children’s hospital. J Hosp Med. 2015;10(6):345-351. PubMed
4. Bonafide CP, Localio AR, Holmes JH, et al. Video analysis of factors associated with response time to physiologic monitor alarms in a children’s hospital. JAMA Pediatr. 2017;171(6):524-531. PubMed
5. Lange K, Nowak M, Zoller R, Lauer W. Boundary conditions for safe detection of clinical alarms: An observational study to identify the cognitive and perceptual demands on an Intensive Care Unit. In: In: D. de Waard, K.A. Brookhuis, A. Toffetti, A. Stuiver, C. Weikert, D. Coelho, D. Manzey, A.B. Ünal, S. Röttger, and N. Merat (Eds.) Proceedings of the Human Factors and Ergonomics Society Europe Chapter 2015 Annual Conference. Groningen, Netherlands; 2016.
6. Westbrook JI, Li L, Hooper TD, Raban MZ, Middleton S, Lehnbom EC. Effectiveness of a ‘Do not interrupt’ bundled intervention to reduce interruptions during medication administration: a cluster randomised controlled feasibility study. BMJ Qual Saf. 2017;26:734-742. PubMed
7. Chopra V, McMahon LF Jr. Redesigning hospital alarms for patient safety: alarmed and potentially dangerous. JAMA. 2014;311(12):1199-1200. PubMed
8. Turmell JW, Coke L, Catinella R, Hosford T, Majeski A. Alarm fatigue: use of an evidence-based alarm management strategy. J Nurs Care Qual. 2017;32(1):47-54. PubMed
9. Koerber JP, Walker J, Worsley M, Thorpe CM. An alarm ward round reduces the frequency of false alarms on the ICU at night. J Intensive Care Soc. 2011;12(1):75-76.
10. Dandoy CE, Davies SM, Flesch L, et al. A team-based approach to reducing cardiac monitor alarms. Pediatrics. 2014;134(6):e1686-1694. PubMed
11. Dewan M, Wolfe H, Lin R, et al. Impact of a safety huddle–based intervention on monitor alarm rates in low-acuity pediatric intensive care unit patients. J Hosp Med. 2017;12(8):652-657. PubMed
12. Goldenhar LM, Brady PW, Sutcliffe KM, Muething SE. Huddling for high reliability and situation awareness. BMJ Qual Saf. 2013;22(11):899-906. PubMed
13. Brady PW, Muething S, Kotagal U, et al. Improving situation awareness to reduce unrecognized clinical deterioration and serious safety events. Pediatrics. 2013;131:e298-308. PubMed
14. Curran GM, Bauer M, Mittman B, Pyne JM, Stetler C. Effectiveness-implementation hybrid designs: combining elements of clinical effectiveness and implementation research to enhance public health impact. Med Care. 2012;50(3):217-226. PubMed
15. Damschroder LJ, Aron DC, Keith RE, Kirsh SR, Alexander JA, Lowery JC. Fostering implementation of health services research findings into practice: a consolidated framework for advancing implementation science. Implement Sci. 2009;4(1):50. PubMed
16. Proctor E, Silmere H, Raghavan R, et al. Outcomes for implementation research: conceptual distinctions, measurement challenges, and research agenda. Adm Policy Ment Health. 2011;38(2):65-76. PubMed
17. Allen JD, Linnan LA, Emmons KM. Fidelity and its relationship to implementation effectiveness, adaptation, and dissemination. In: Dissemination and Implementation Research in Health: Translating Science to Practice (Brownson RC, Proctor EK, Colditz GA Eds.). Oxford University Press; 2012:281-304.
18. Harris PA, Taylor R, Thielke R, Payne J, Gonzalez N, Conde JG. Research electronic data capture (REDCap)—a metadata-driven methodology and workflow process for providing translational research informatics support. J Biomed Inf. 2009;42:377-381. PubMed
19. Singer JD, Willett JB. Applied Longitudinal Data Analysis: Modeling Change and Event Occurrence. New York: Oxford University Press; 2003.
20. Wagner AK, Soumerai SB, Zhang F, Ross-Degnan D. Segmented regression analysis of interrupted time series studies in medication use research. J Clin Pharm Ther. 2002;27:299-309. PubMed
21. Gardner W, Mulvey EP, Shaw EC. Regression analyses of counts and rates: Poisson, overdispersed Poisson, and negative binomial models. Psychol Bull. 1995;118:392-404. PubMed
22. Dressler R, Dryer MM, Coletti C, Mahoney D, Doorey AJ. Altering overuse of cardiac telemetry in non-intensive care unit settings by hardwiring the use of American Heart Association guidelines. JAMA Intern Med. 2014;174(11):1852-1854. PubMed
23. Boggan JC, Navar-Boggan AM, Patel V, Schulteis RD, Simel DL. Reductions in telemetry order duration do not reduce telemetry utilization. J Hosp Med. 2014;9(12):795-796. PubMed
© 2018 Society of Hospital Medicine
Update in Hospital Medicine: Practical Lessons from the Literature
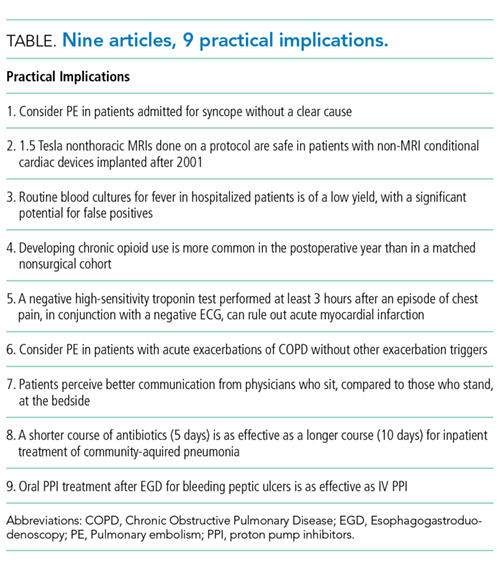
ESSENTIAL PUBLICATIONS
Prevalence of Pulmonary Embolism among Patients Hospitalized for Syncope. Prandoni P et al. New England Journal of Medicine, 2016;375(16):1524-31.1
Background
Pulmonary embolism (PE), a potentially fatal disease, is rarely considered as a likely cause of syncope. To determine the prevalence of PE among patients presenting with their first episode of syncope, the authors performed a systematic workup for pulmonary embolism in adult patients admitted for syncope at 11 hospitals in Italy.
Findings
Of the 2584 patients who presented to the emergency department (ED) with syncope during the study, 560 patients were admitted and met the inclusion criteria. A modified Wells Score was applied, and a D-dimer was measured on every hospitalized patient. Those with a high pretest probability, a Wells Score of 4.0 or higher, or a positive D-dimer underwent further testing for pulmonary embolism by a CT scan, a ventilation perfusion scan, or an autopsy. Ninety-seven of the 560 patients admitted to the hospital for syncope were found to have a PE (17%). One in
Cautions
Nearly 72% of the patients with common explanations for syncope, such as vasovagal, drug-induced, or volume depletion, were discharged from the ED and not included in the study. The authors focused on the prevalence of PE. The causation between PE and syncope is not clear in each of the patients. Of the patients’ diagnosis by a CT, only 67% of the PEs were found to be in a main pulmonary artery or lobar artery. The other 33% were segmental or subsegmental. Of those diagnosed by a ventilation perfusion scan, 50% of the patients had 25% or more of the area of both lungs involved. The other 50% involved less than 25% of the area of both lungs. Also, it is important to note that 75% of the patients admitted to the hospital in this study were 70 years of age or older.
Implications
After common diagnoses are ruled out, it is important to consider pulmonary embolism in patients hospitalized with syncope. Providers should calculate a Wells Score and measure a D-dimer to guide the decision making.
Assessing the Risks Associated with MRI in Patients with a Pacemaker or Defibrillator. Russo RJ et al. New England Journal of Medicine, 2017;376(8):755-64.2
Background
Magnetic resonance imaging (MRI) in patients with implantable cardiac devices is considered a safety risk due to the potential of cardiac lead heating and subsequent myocardial injury or alterations of the pacing properties. Although manufacturers have developed “MRI-conditional” devices designed to reduce these risks, still 2 million people in the United States and 6 million people worldwide have “non–MRI-conditional” devices. The authors evaluated the event rates in patients with “non-MRI-conditional” devices undergoing an MRI.
Findings
The authors prospectively followed up 1500 adults with cardiac devices placed since 2001 who received nonthoracic MRIs according to a specific protocol available in the supplemental materials published with this article in the New England Journal of Medicine. Of the 1000 patients with pacemakers only, they observed 5 atrial arrhythmias and 6 electrical resets. Of the 500 patients with implantable cardioverter defibrillators (ICDs), they observed 1 atrial arrhythmia and 1 generator failure (although this case had deviated from the protocol). All of the atrial arrhythmias were self-terminating. No deaths, lead failure requiring an immediate replacement, a loss of capture, or ventricular arrhythmias were observed.
Cautions
Patients who were pacing dependent were excluded. No devices implanted before 2001 were included in the study, and the MRIs performed were only 1.5 Tesla (a lower field strength than the also available 3 Tesla MRIs).
Implications
It is safe to proceed with 1.5 Tesla nonthoracic MRIs in patients, following the protocol outlined in this article, with non–MRI conditional cardiac devices implanted since 2001.
Culture If Spikes? Indications and Yield of Blood Cultures in Hospitalized Medical Patients. Linsenmeyer K et al. Journal of Hospital Medicine, 2016;11(5):336-40.3
Background
Blood cultures are frequently drawn for the evaluation of an inpatient fever. This “culture if spikes” approach may lead to unnecessary testing and false positive results. In this study, the authors evaluated rates of true positive and false positive blood cultures in the setting of an inpatient fever.
Findings
The patients hospitalized on the general medicine or cardiology floors at a Veterans Affairs teaching hospital were prospectively followed over 7 months. A total of 576 blood cultures were ordered among 323 unique patients. The patients were older (average age of 70 years) and predominantly male (94%). The true-positive rate for cultures, determined by a consensus among the microbiology and infectious disease departments based on a review of clinical and laboratory data, was 3.6% compared with a false-positive rate of 2.3%. The clinical characteristics associated with a higher likelihood of a true positive included: the indication for a culture as a follow-up from a previous culture (likelihood ratio [LR] 3.4), a working diagnosis of bacteremia or endocarditis (LR 3.7), and the constellation of fever and leukocytosis in a patient who has not been on antibiotics (LR 5.6).
Cautions
This study was performed at a single center with patients in the medicine and cardiology services, and thus, the data is representative of clinical practice patterns specific to that site.
Implications
Reflexive ordering of blood cultures for inpatient fever is of a low yield with a false-positive rate that approximates the true positive rate. A large number of patients are tested unnecessarily, and for those with positive tests, physicians are as likely to be misled as they are certain to truly identify a pathogen. The positive predictive value of blood cultures is improved when drawn on patients who are not on antibiotics and when the patient has a specific diagnosis, such as pneumonia, previous bacteremia, or suspected endocarditis.
Incidence of and Risk Factors for Chronic Opioid Use among Opioid-Naive Patients in the Postoperative Period. Sun EC et al. JAMA Internal Medicine, 2016;176(9):1286-93.4
Background
Each day in the United States, 650,000 opioid prescriptions are filled, and 78 people suffer an opiate-related death. Opioids are frequently prescribed for inpatient management of postoperative pain. In this study, authors compared the development of chronic opioid use between patients who had undergone surgery and those who had not.
Findings
This was a retrospective analysis of a nationwide insurance claims database. A total of 641,941 opioid-naive patients underwent 1 of 11 designated surgeries in the study period and were compared with 18,011,137 opioid-naive patients who did not undergo surgery. Chronic opioid use was defined as the filling of 10 or more prescriptions or receiving more than a 120-day supply between 90 and 365 days postoperatively (or following the assigned faux surgical date in those not having surgery). This was observed in a small proportion of the surgical patients (less than 0.5%). However, several procedures were associated with the increased odds of postoperative chronic opioid use, including a simple mastectomy (Odds ratio [OR] 2.65), a cesarean delivery (OR 1.28), an open appendectomy (OR 1.69), an open and laparoscopic cholecystectomy (ORs 3.60 and 1.62, respectively), and a total hip and total knee arthroplasty (ORs 2.52 and 5.10, respectively). Also, male sex, age greater than 50 years, preoperative benzodiazepines or antidepressants, and a history of drug abuse were associated with increased odds.
Cautions
This study was limited by the claims-based data and that the nonsurgical population was inherently different from the surgical population in ways that could lead to confounding.
Implications
In perioperative care, there is a need to focus on multimodal approaches to pain and to implement opioid reducing and sparing strategies that might include options such as acetaminophen, NSAIDs, neuropathic pain medications, and Lidocaine patches. Moreover, at discharge, careful consideration should be given to the quantity and duration of the postoperative opioids.
Rapid Rule-out of Acute Myocardial Infarction with a Single High-Sensitivity Cardiac Troponin T Measurement below the Limit of Detection: A Collaborative Meta-Analysis. Pickering JW et al. Annals of Internal Medicine, 2017;166:715-24.5
Background
High-sensitivity cardiac troponin testing (hs-cTnT) is now available in the United States. Studies have found that these can play a significant role in a rapid rule-out of acute myocardial infarction (AMI).
Findings
In this meta-analysis, the authors identified 11 studies with 9241 participants that prospectively evaluated patients presenting to the emergency department (ED) with chest pain, underwent an ECG, and had hs-cTnT drawn. A total of 30% of the patients were classified as low risk with negative hs-cTnT and negative ECG (defined as no ST changes or T-wave inversions indicative of ischemia). Among the low risk patients, only 14 of the 2825 (0.5%) had AMI according to the Global Task Forces definition.6 Seven of these were in patients with hs-cTnT drawn within 3 hours of a chest pain onset. The pooled negative predictive value was 99.0% (CI 93.8%–99.8%).
Cautions
The heterogeneity between the studies in this meta-analysis, especially in the exclusion criteria, warrants careful consideration when being implemented in new settings. A more sensitive test will result in more positive troponins due to different limits of detection. Thus, medical teams and institutions need to plan accordingly. Caution should be taken for any patient presenting within 3 hours of a chest pain onset.
Implications
Rapid rule-out protocols—which include clinical evaluation, a negative ECG, and a negative high-sensitivity cardiac troponin—identify a large proportion of low-risk patients who are unlikely to have a true AMI.
Prevalence and Localization of Pulmonary Embolism in Unexplained Acute Exacerbations of COPD: A Systematic Review and Meta-analysis. Aleva FE et al. Chest, 2017;151(3):544-54.7
Background
Acute exacerbations of chronic obstructive pulmonary disease (AE-COPD) are frequent. In up to 30%, no clear trigger is found. Previous studies suggested that 1 in 4 of these patients may have a pulmonary embolus (PE).7 This study reviewed the literature and meta-data to describe the prevalence, the embolism location, and the clinical predictors of PE among patients with unexplained AE-COPD.
Findings
A systematic review of the literature and meta-analysis identified 7 studies with 880 patients. In the pooled analysis, 16% had PE (range: 3%–29%). Of the 120 patients with PE, two-thirds were in lobar or larger arteries and one-third in segmental or smaller. Pleuritic chest pain and signs of cardiac compromise (hypotension, syncope, and right-sided heart failure) were associated with PE.
Cautions
This study was heterogeneous leading to a broad confidence interval for prevalence ranging from 8%–25%. Given the frequency of AE-COPD with no identified trigger, physicians need to attend to risks of repeat radiation exposure when considering an evaluation for PE.
Implications
One in 6 patients with unexplained AE-COPD was found to have PE; the odds were greater in those with pleuritic chest pain or signs of cardiac compromise. In patients with AE-COPD with an unclear trigger, the providers should consider an evaluation for PE by using a clinical prediction rule and/or a D-dimer.
Sitting at Patients’ Bedsides May Improve Patients’ Perceptions of Physician Communication Skills. Merel SE et al. Journal of Hospital Medicine, 2016;11(12):865-8.9
Background
Sitting at a patient’s bedside in the inpatient setting is considered a best practice, yet it has not been widely adopted. The authors conducted a cluster-randomized trial of physicians on a single 28-bed hospitalist only run unit where physicians were assigned to sitting or standing for the first 3 days of a 7-day workweek assignment. New admissions or transfers to the unit were considered eligible for the study.
Findings
Sixteen hospitalists saw on an average 13 patients daily during the study (a total of 159 patients were included in the analysis after 52 patients were excluded or declined to participate). The hospitalists were 69% female, and 81% had been in practice 3 years or less. The average time spent in the patient’s room was 12:00 minutes while seated and 12:10 minutes while standing. There was no difference in the patients’ perception of the amount of time spent—the patients overestimated this by 4 minutes in both groups. Sitting was associated with higher ratings for “listening carefully” and “explaining things in a way that was easy to understand.” There was no difference in ratings on the physicians interrupting the patient when talking or in treating patients with courtesy and respect.
Cautions
The study had a small sample size, was limited to English-speaking patients, and was a single-site study. It involved only attending-level physicians and did not involve nonphysician team members. The physicians were not blinded and were aware that the interactions were monitored, perhaps creating a Hawthorne effect. The analysis did not control for other factors such as the severity of the illness, the number of consultants used, or the degree of health literacy.
Implications
This study supports an important best practice highlighted in etiquette-based medicine 10: sitting at the bedside provided a benefit in the patient’s perception of communication by physicians without a negative effect on the physician’s workflow.
The Duration of Antibiotic Treatment in Community-Acquired Pneumonia: A Multi-Center Randomized Clinical Trial. Uranga A et al. JAMA Intern Medicine, 2016;176(9):1257-65.11
Background
The optimal duration of treatment for community-acquired pneumonia (CAP) is unclear; a growing body of evidence suggests shorter and longer durations may be equivalent.
Findings
At 4 hospitals in Spain, 312 adults with a mean age of 65 years and a diagnosis of CAP (non-ICU) were randomized to a short (5 days) versus a long (provider discretion) course of antibiotics. In the short-course group, the antibiotics were stopped after 5 days if the body temperature had been 37.8o C or less for 48 hours, and no more than 1 sign of clinical instability was present (SBP < 90 mmHg, HR >100/min, RR > 24/min, O2Sat < 90%). The median number of antibiotic days was 5 for the short-course group and 10 for the long-course group (P < .01). There was no difference in the resolution of pneumonia symptoms at 10 days or 30 days or in 30-day mortality. There were no differences in in-hospital side effects. However, 30-day readmissions were higher in the long-course group compared with the short-course group (6.6% vs 1.4%; P = .02). The results were similar across all of the Pneumonia Severity Index (PSI) classes.
Cautions
Most of the patients were not severely ill (~60% PSI I-III), the level of comorbid disease was low, and nearly 80% of the patients received fluoroquinolone. There was a significant cross over with 30% of patients assigned to the short-course group receiving antibiotics for more than 5 days.
Implications
Inpatient providers should aim to treat patients with community-acquired pneumonia (regardless of the severity of the illness) for 5 days. At day 5, if the patient is afebrile and has no signs of clinical instability, clinicians should be comfortable stopping antibiotics.
Is the Era of Intravenous Proton Pump Inhibitors Coming to an End in Patients with Bleeding Peptic Ulcers? A Meta-Analysis of the Published Literature. Jian Z et al. British Journal of Clinical Pharmacology, 2016;82(3):880-9.12
Background
Guidelines recommend intravenous proton pump inhibitors (PPI) after an endoscopy for patients with a bleeding peptic ulcer. Yet, acid suppression with oral PPI is deemed equivalent to the intravenous route.
Findings
This systematic review and meta-analysis identified 7 randomized controlled trials involving 859 patients. After an endoscopy, the patients were randomized to receive either oral or intravenous PPI. Most of the patients had “high-risk” peptic ulcers (active bleeding, a visible vessel, an adherent clot). The PPI dose and frequency varied between the studies. Re-bleeding rates were no different between the oral and intravenous route at 72 hours (2.4% vs 5.1%; P = .26), 7 days (5.6% vs 6.8%; P =.68), or 30 days (7.9% vs 8.8%; P = .62). There was also no difference in 30-day mortality (2.1% vs 2.4%; P = .88), and the length of stay was the same in both groups. Side effects were not reported.
Cautions
This systematic review and meta-analysis included multiple heterogeneous small studies of moderate quality. A large number of patients were excluded, increasing the risk of a selection bias.
Implications
There is no clear indication for intravenous PPI in the treatment of bleeding peptic ulcers following an endoscopy. Converting to oral PPI is equivalent to intravenous and is a safe, effective, and cost-saving option for patients with bleeding peptic ulcers.
1. Prandoni P, Lensing AW, Prins MH, et al. Prevalence of pulmonary embolism among patients hospitalized for syncope. N Engl J Med. 2016; 375(16):1524-1531. PubMed
2. Russo RJ, Costa HS, Silva PD, et al. Assessing the risks associated with MRI in patients with a pacemaker or defibrillator. N Engl J Med. 2017;376(8):755-764. PubMed
3. Linsenmeyer K, Gupta K, Strymish JM, Dhanani M, Brecher SM, Breu AC. Culture if spikes? Indications and yield of blood cultures in hospitalized medical patients. J Hosp Med. 2016;11(5):336-340. PubMed
4. Sun EC, Darnall BD, Baker LC, Mackey S. Incidence of and risk factors for chronic opioid use among opioid-naive patients in the postoperative period. JAMA Intern Med. 2016;176(9):1286-1293. PubMed
5. Pickering JW, Than MP, Cullen L, et al. Rapid rule-out of acute myocardial infarction with a single high-sensitivity cardiac troponin T measurement below the limit of detection: A collaborative meta-analysis. Ann Intern Med. 2017;166(10):715-724. PubMed
6. Thygesen K, Alpert JS, White HD, Jaffe AS, Apple FS, Galvani M, et al; Joint ESC/ACCF/AHA/WHF Task Force for the Redefinition of Myocardial Infarction. Universal definition of myocardial infarction. Circulation. 2007;116:2634-2653. PubMed
7. Aleva FE, Voets LWLM, Simons SO, de Mast Q, van der Ven AJAM, Heijdra YF. Prevalence and localization of pulmonary embolism in unexplained acute exacerbations of COPD: A systematic review and meta-analysis. Chest. 2017; 151(3):544-554. PubMed
8. Rizkallah J, Man SFP, Sin DD. Prevalence of pulmonary embolism in acute exacerbations of COPD: A systematic review and meta-analysis. Chest. 2009;135(3):786-793. PubMed
9. Merel SE, McKinney CM, Ufkes P, Kwan AC, White AA. Sitting at patients’ bedsides may improve patients’ perceptions of physician communication skills. J Hosp Med. 2016;11(12):865-868. PubMed
10. Kahn MW. Etiquette-based medicine. N Engl J Med. 2008;358(19):1988-1989. PubMed
11. Uranga A, España PP, Bilbao A, et al. Duration of antibiotic treatment in community-acquired pneumonia: A multicenter randomized clinical trial. JAMA Intern Med. 2016;176(9):1257-1265. PubMed
12. Jian Z, Li H, Race NS, Ma T, Jin H, Yin Z. Is the era of intravenous proton pump inhibitors coming to an end in patients with bleeding peptic ulcers? Meta-analysis of the published literature. Br J Clin Pharmacol. 2016;82(3):880-889. PubMed
ESSENTIAL PUBLICATIONS
Prevalence of Pulmonary Embolism among Patients Hospitalized for Syncope. Prandoni P et al. New England Journal of Medicine, 2016;375(16):1524-31.1
Background
Pulmonary embolism (PE), a potentially fatal disease, is rarely considered as a likely cause of syncope. To determine the prevalence of PE among patients presenting with their first episode of syncope, the authors performed a systematic workup for pulmonary embolism in adult patients admitted for syncope at 11 hospitals in Italy.
Findings
Of the 2584 patients who presented to the emergency department (ED) with syncope during the study, 560 patients were admitted and met the inclusion criteria. A modified Wells Score was applied, and a D-dimer was measured on every hospitalized patient. Those with a high pretest probability, a Wells Score of 4.0 or higher, or a positive D-dimer underwent further testing for pulmonary embolism by a CT scan, a ventilation perfusion scan, or an autopsy. Ninety-seven of the 560 patients admitted to the hospital for syncope were found to have a PE (17%). One in
Cautions
Nearly 72% of the patients with common explanations for syncope, such as vasovagal, drug-induced, or volume depletion, were discharged from the ED and not included in the study. The authors focused on the prevalence of PE. The causation between PE and syncope is not clear in each of the patients. Of the patients’ diagnosis by a CT, only 67% of the PEs were found to be in a main pulmonary artery or lobar artery. The other 33% were segmental or subsegmental. Of those diagnosed by a ventilation perfusion scan, 50% of the patients had 25% or more of the area of both lungs involved. The other 50% involved less than 25% of the area of both lungs. Also, it is important to note that 75% of the patients admitted to the hospital in this study were 70 years of age or older.
Implications
After common diagnoses are ruled out, it is important to consider pulmonary embolism in patients hospitalized with syncope. Providers should calculate a Wells Score and measure a D-dimer to guide the decision making.
Assessing the Risks Associated with MRI in Patients with a Pacemaker or Defibrillator. Russo RJ et al. New England Journal of Medicine, 2017;376(8):755-64.2
Background
Magnetic resonance imaging (MRI) in patients with implantable cardiac devices is considered a safety risk due to the potential of cardiac lead heating and subsequent myocardial injury or alterations of the pacing properties. Although manufacturers have developed “MRI-conditional” devices designed to reduce these risks, still 2 million people in the United States and 6 million people worldwide have “non–MRI-conditional” devices. The authors evaluated the event rates in patients with “non-MRI-conditional” devices undergoing an MRI.
Findings
The authors prospectively followed up 1500 adults with cardiac devices placed since 2001 who received nonthoracic MRIs according to a specific protocol available in the supplemental materials published with this article in the New England Journal of Medicine. Of the 1000 patients with pacemakers only, they observed 5 atrial arrhythmias and 6 electrical resets. Of the 500 patients with implantable cardioverter defibrillators (ICDs), they observed 1 atrial arrhythmia and 1 generator failure (although this case had deviated from the protocol). All of the atrial arrhythmias were self-terminating. No deaths, lead failure requiring an immediate replacement, a loss of capture, or ventricular arrhythmias were observed.
Cautions
Patients who were pacing dependent were excluded. No devices implanted before 2001 were included in the study, and the MRIs performed were only 1.5 Tesla (a lower field strength than the also available 3 Tesla MRIs).
Implications
It is safe to proceed with 1.5 Tesla nonthoracic MRIs in patients, following the protocol outlined in this article, with non–MRI conditional cardiac devices implanted since 2001.
Culture If Spikes? Indications and Yield of Blood Cultures in Hospitalized Medical Patients. Linsenmeyer K et al. Journal of Hospital Medicine, 2016;11(5):336-40.3
Background
Blood cultures are frequently drawn for the evaluation of an inpatient fever. This “culture if spikes” approach may lead to unnecessary testing and false positive results. In this study, the authors evaluated rates of true positive and false positive blood cultures in the setting of an inpatient fever.
Findings
The patients hospitalized on the general medicine or cardiology floors at a Veterans Affairs teaching hospital were prospectively followed over 7 months. A total of 576 blood cultures were ordered among 323 unique patients. The patients were older (average age of 70 years) and predominantly male (94%). The true-positive rate for cultures, determined by a consensus among the microbiology and infectious disease departments based on a review of clinical and laboratory data, was 3.6% compared with a false-positive rate of 2.3%. The clinical characteristics associated with a higher likelihood of a true positive included: the indication for a culture as a follow-up from a previous culture (likelihood ratio [LR] 3.4), a working diagnosis of bacteremia or endocarditis (LR 3.7), and the constellation of fever and leukocytosis in a patient who has not been on antibiotics (LR 5.6).
Cautions
This study was performed at a single center with patients in the medicine and cardiology services, and thus, the data is representative of clinical practice patterns specific to that site.
Implications
Reflexive ordering of blood cultures for inpatient fever is of a low yield with a false-positive rate that approximates the true positive rate. A large number of patients are tested unnecessarily, and for those with positive tests, physicians are as likely to be misled as they are certain to truly identify a pathogen. The positive predictive value of blood cultures is improved when drawn on patients who are not on antibiotics and when the patient has a specific diagnosis, such as pneumonia, previous bacteremia, or suspected endocarditis.
Incidence of and Risk Factors for Chronic Opioid Use among Opioid-Naive Patients in the Postoperative Period. Sun EC et al. JAMA Internal Medicine, 2016;176(9):1286-93.4
Background
Each day in the United States, 650,000 opioid prescriptions are filled, and 78 people suffer an opiate-related death. Opioids are frequently prescribed for inpatient management of postoperative pain. In this study, authors compared the development of chronic opioid use between patients who had undergone surgery and those who had not.
Findings
This was a retrospective analysis of a nationwide insurance claims database. A total of 641,941 opioid-naive patients underwent 1 of 11 designated surgeries in the study period and were compared with 18,011,137 opioid-naive patients who did not undergo surgery. Chronic opioid use was defined as the filling of 10 or more prescriptions or receiving more than a 120-day supply between 90 and 365 days postoperatively (or following the assigned faux surgical date in those not having surgery). This was observed in a small proportion of the surgical patients (less than 0.5%). However, several procedures were associated with the increased odds of postoperative chronic opioid use, including a simple mastectomy (Odds ratio [OR] 2.65), a cesarean delivery (OR 1.28), an open appendectomy (OR 1.69), an open and laparoscopic cholecystectomy (ORs 3.60 and 1.62, respectively), and a total hip and total knee arthroplasty (ORs 2.52 and 5.10, respectively). Also, male sex, age greater than 50 years, preoperative benzodiazepines or antidepressants, and a history of drug abuse were associated with increased odds.
Cautions
This study was limited by the claims-based data and that the nonsurgical population was inherently different from the surgical population in ways that could lead to confounding.
Implications
In perioperative care, there is a need to focus on multimodal approaches to pain and to implement opioid reducing and sparing strategies that might include options such as acetaminophen, NSAIDs, neuropathic pain medications, and Lidocaine patches. Moreover, at discharge, careful consideration should be given to the quantity and duration of the postoperative opioids.
Rapid Rule-out of Acute Myocardial Infarction with a Single High-Sensitivity Cardiac Troponin T Measurement below the Limit of Detection: A Collaborative Meta-Analysis. Pickering JW et al. Annals of Internal Medicine, 2017;166:715-24.5
Background
High-sensitivity cardiac troponin testing (hs-cTnT) is now available in the United States. Studies have found that these can play a significant role in a rapid rule-out of acute myocardial infarction (AMI).
Findings
In this meta-analysis, the authors identified 11 studies with 9241 participants that prospectively evaluated patients presenting to the emergency department (ED) with chest pain, underwent an ECG, and had hs-cTnT drawn. A total of 30% of the patients were classified as low risk with negative hs-cTnT and negative ECG (defined as no ST changes or T-wave inversions indicative of ischemia). Among the low risk patients, only 14 of the 2825 (0.5%) had AMI according to the Global Task Forces definition.6 Seven of these were in patients with hs-cTnT drawn within 3 hours of a chest pain onset. The pooled negative predictive value was 99.0% (CI 93.8%–99.8%).
Cautions
The heterogeneity between the studies in this meta-analysis, especially in the exclusion criteria, warrants careful consideration when being implemented in new settings. A more sensitive test will result in more positive troponins due to different limits of detection. Thus, medical teams and institutions need to plan accordingly. Caution should be taken for any patient presenting within 3 hours of a chest pain onset.
Implications
Rapid rule-out protocols—which include clinical evaluation, a negative ECG, and a negative high-sensitivity cardiac troponin—identify a large proportion of low-risk patients who are unlikely to have a true AMI.
Prevalence and Localization of Pulmonary Embolism in Unexplained Acute Exacerbations of COPD: A Systematic Review and Meta-analysis. Aleva FE et al. Chest, 2017;151(3):544-54.7
Background
Acute exacerbations of chronic obstructive pulmonary disease (AE-COPD) are frequent. In up to 30%, no clear trigger is found. Previous studies suggested that 1 in 4 of these patients may have a pulmonary embolus (PE).7 This study reviewed the literature and meta-data to describe the prevalence, the embolism location, and the clinical predictors of PE among patients with unexplained AE-COPD.
Findings
A systematic review of the literature and meta-analysis identified 7 studies with 880 patients. In the pooled analysis, 16% had PE (range: 3%–29%). Of the 120 patients with PE, two-thirds were in lobar or larger arteries and one-third in segmental or smaller. Pleuritic chest pain and signs of cardiac compromise (hypotension, syncope, and right-sided heart failure) were associated with PE.
Cautions
This study was heterogeneous leading to a broad confidence interval for prevalence ranging from 8%–25%. Given the frequency of AE-COPD with no identified trigger, physicians need to attend to risks of repeat radiation exposure when considering an evaluation for PE.
Implications
One in 6 patients with unexplained AE-COPD was found to have PE; the odds were greater in those with pleuritic chest pain or signs of cardiac compromise. In patients with AE-COPD with an unclear trigger, the providers should consider an evaluation for PE by using a clinical prediction rule and/or a D-dimer.
Sitting at Patients’ Bedsides May Improve Patients’ Perceptions of Physician Communication Skills. Merel SE et al. Journal of Hospital Medicine, 2016;11(12):865-8.9
Background
Sitting at a patient’s bedside in the inpatient setting is considered a best practice, yet it has not been widely adopted. The authors conducted a cluster-randomized trial of physicians on a single 28-bed hospitalist only run unit where physicians were assigned to sitting or standing for the first 3 days of a 7-day workweek assignment. New admissions or transfers to the unit were considered eligible for the study.
Findings
Sixteen hospitalists saw on an average 13 patients daily during the study (a total of 159 patients were included in the analysis after 52 patients were excluded or declined to participate). The hospitalists were 69% female, and 81% had been in practice 3 years or less. The average time spent in the patient’s room was 12:00 minutes while seated and 12:10 minutes while standing. There was no difference in the patients’ perception of the amount of time spent—the patients overestimated this by 4 minutes in both groups. Sitting was associated with higher ratings for “listening carefully” and “explaining things in a way that was easy to understand.” There was no difference in ratings on the physicians interrupting the patient when talking or in treating patients with courtesy and respect.
Cautions
The study had a small sample size, was limited to English-speaking patients, and was a single-site study. It involved only attending-level physicians and did not involve nonphysician team members. The physicians were not blinded and were aware that the interactions were monitored, perhaps creating a Hawthorne effect. The analysis did not control for other factors such as the severity of the illness, the number of consultants used, or the degree of health literacy.
Implications
This study supports an important best practice highlighted in etiquette-based medicine 10: sitting at the bedside provided a benefit in the patient’s perception of communication by physicians without a negative effect on the physician’s workflow.
The Duration of Antibiotic Treatment in Community-Acquired Pneumonia: A Multi-Center Randomized Clinical Trial. Uranga A et al. JAMA Intern Medicine, 2016;176(9):1257-65.11
Background
The optimal duration of treatment for community-acquired pneumonia (CAP) is unclear; a growing body of evidence suggests shorter and longer durations may be equivalent.
Findings
At 4 hospitals in Spain, 312 adults with a mean age of 65 years and a diagnosis of CAP (non-ICU) were randomized to a short (5 days) versus a long (provider discretion) course of antibiotics. In the short-course group, the antibiotics were stopped after 5 days if the body temperature had been 37.8o C or less for 48 hours, and no more than 1 sign of clinical instability was present (SBP < 90 mmHg, HR >100/min, RR > 24/min, O2Sat < 90%). The median number of antibiotic days was 5 for the short-course group and 10 for the long-course group (P < .01). There was no difference in the resolution of pneumonia symptoms at 10 days or 30 days or in 30-day mortality. There were no differences in in-hospital side effects. However, 30-day readmissions were higher in the long-course group compared with the short-course group (6.6% vs 1.4%; P = .02). The results were similar across all of the Pneumonia Severity Index (PSI) classes.
Cautions
Most of the patients were not severely ill (~60% PSI I-III), the level of comorbid disease was low, and nearly 80% of the patients received fluoroquinolone. There was a significant cross over with 30% of patients assigned to the short-course group receiving antibiotics for more than 5 days.
Implications
Inpatient providers should aim to treat patients with community-acquired pneumonia (regardless of the severity of the illness) for 5 days. At day 5, if the patient is afebrile and has no signs of clinical instability, clinicians should be comfortable stopping antibiotics.
Is the Era of Intravenous Proton Pump Inhibitors Coming to an End in Patients with Bleeding Peptic Ulcers? A Meta-Analysis of the Published Literature. Jian Z et al. British Journal of Clinical Pharmacology, 2016;82(3):880-9.12
Background
Guidelines recommend intravenous proton pump inhibitors (PPI) after an endoscopy for patients with a bleeding peptic ulcer. Yet, acid suppression with oral PPI is deemed equivalent to the intravenous route.
Findings
This systematic review and meta-analysis identified 7 randomized controlled trials involving 859 patients. After an endoscopy, the patients were randomized to receive either oral or intravenous PPI. Most of the patients had “high-risk” peptic ulcers (active bleeding, a visible vessel, an adherent clot). The PPI dose and frequency varied between the studies. Re-bleeding rates were no different between the oral and intravenous route at 72 hours (2.4% vs 5.1%; P = .26), 7 days (5.6% vs 6.8%; P =.68), or 30 days (7.9% vs 8.8%; P = .62). There was also no difference in 30-day mortality (2.1% vs 2.4%; P = .88), and the length of stay was the same in both groups. Side effects were not reported.
Cautions
This systematic review and meta-analysis included multiple heterogeneous small studies of moderate quality. A large number of patients were excluded, increasing the risk of a selection bias.
Implications
There is no clear indication for intravenous PPI in the treatment of bleeding peptic ulcers following an endoscopy. Converting to oral PPI is equivalent to intravenous and is a safe, effective, and cost-saving option for patients with bleeding peptic ulcers.
1. Prandoni P, Lensing AW, Prins MH, et al. Prevalence of pulmonary embolism among patients hospitalized for syncope. N Engl J Med. 2016; 375(16):1524-1531. PubMed
2. Russo RJ, Costa HS, Silva PD, et al. Assessing the risks associated with MRI in patients with a pacemaker or defibrillator. N Engl J Med. 2017;376(8):755-764. PubMed
3. Linsenmeyer K, Gupta K, Strymish JM, Dhanani M, Brecher SM, Breu AC. Culture if spikes? Indications and yield of blood cultures in hospitalized medical patients. J Hosp Med. 2016;11(5):336-340. PubMed
4. Sun EC, Darnall BD, Baker LC, Mackey S. Incidence of and risk factors for chronic opioid use among opioid-naive patients in the postoperative period. JAMA Intern Med. 2016;176(9):1286-1293. PubMed
5. Pickering JW, Than MP, Cullen L, et al. Rapid rule-out of acute myocardial infarction with a single high-sensitivity cardiac troponin T measurement below the limit of detection: A collaborative meta-analysis. Ann Intern Med. 2017;166(10):715-724. PubMed
6. Thygesen K, Alpert JS, White HD, Jaffe AS, Apple FS, Galvani M, et al; Joint ESC/ACCF/AHA/WHF Task Force for the Redefinition of Myocardial Infarction. Universal definition of myocardial infarction. Circulation. 2007;116:2634-2653. PubMed
7. Aleva FE, Voets LWLM, Simons SO, de Mast Q, van der Ven AJAM, Heijdra YF. Prevalence and localization of pulmonary embolism in unexplained acute exacerbations of COPD: A systematic review and meta-analysis. Chest. 2017; 151(3):544-554. PubMed
8. Rizkallah J, Man SFP, Sin DD. Prevalence of pulmonary embolism in acute exacerbations of COPD: A systematic review and meta-analysis. Chest. 2009;135(3):786-793. PubMed
9. Merel SE, McKinney CM, Ufkes P, Kwan AC, White AA. Sitting at patients’ bedsides may improve patients’ perceptions of physician communication skills. J Hosp Med. 2016;11(12):865-868. PubMed
10. Kahn MW. Etiquette-based medicine. N Engl J Med. 2008;358(19):1988-1989. PubMed
11. Uranga A, España PP, Bilbao A, et al. Duration of antibiotic treatment in community-acquired pneumonia: A multicenter randomized clinical trial. JAMA Intern Med. 2016;176(9):1257-1265. PubMed
12. Jian Z, Li H, Race NS, Ma T, Jin H, Yin Z. Is the era of intravenous proton pump inhibitors coming to an end in patients with bleeding peptic ulcers? Meta-analysis of the published literature. Br J Clin Pharmacol. 2016;82(3):880-889. PubMed
© 2018 Society of Hospital Medicine
Interventions to Improve Follow-Up of Laboratory Test Results Pending at Discharge: A Systematic Review
The 2015 National Academy of Sciences (NAS; formerly the Institute of Medicine [IOM]) report, Improving Diagnosis in Health Care, attributes up to 10% of patient deaths and 17% of hospital adverse events to diagnostic errors,1 one cause of which is absent or delayed follow-up of laboratory test results.2 Poor communication or follow-up of laboratory tests with abnormal results has been cited repeatedly as a threat to patient safety.1,3,4 In a survey of internists, 83% reported at least one unacceptably delayed laboratory test result during the previous 2 months.5
Care transitions magnify the risk of missed test results.6,7 Up to 16% of all emergency department (ED) and 23% of all hospitalized patients will have pending laboratory test results at release or discharge.6 The percentage of tests that received follow-up ranged from 1% to 75% for tests done in the ED and from 20% to 69% for tests ordered on inpatients. In one study, 41% of all surveyed medical inpatients had at least one test result pending at discharge (TPAD). When further studied, over 40% of the results were abnormal and 9% required action, but the responsible physicians were unaware of 62% of the test results.8 Many examples of morbidity from such failure have been reported. One of many described by El-Kareh et al., for example, is that of an 81-year-old man on total parenteral nutrition who was treated for suspected line infection and discharged without antibiotics, but whose blood cultures grew Klebsiella pneumoniae after his discharge.9 Another example, presented on the Agency for Healthcare Research and Quality (AHRQ) Patient Safety Network, reported a patient admitted for a urinary tract infection and then discharged from the hospital on trimethoprim–sulfamethoxazole. He returned to the hospital 11 days later with severe sepsis. Upon review, the urine culture results from his previous admission, which were returned 2 days after his discharge, indicated that the infectious agent was not sensitive to trimethoprim–sulfamethoxazole. The results had not been reviewed by hospital clinicians or forwarded to the patient’s physician, so the patient continued on the ineffective treatment. His second hospital admission lasted 7 days, but he made a complete recovery with the correct antibiotic.10
Several barriers impede the follow-up of TPAD. First, who should receive test results or who is responsible for addressing them may be unclear. Second, even if responsibility is clear, communication between the provider who ordered the test and the provider responsible for follow-up may be suboptimal.11 Finally, providers who need to follow up on abnormal results may not appreciate the urgency or significance of pending results.
The hospitalist model of care increases efficiency during hospitalization but further complicates care coordination.12 The hospitalist who orders a test may not be on duty at discharge or when test results are finalized. Primary care providers may have little contact with their patients during their admission.12 Effective communication between providers is key to ensuring appropriate follow-up care, but primary care physicians and hospital physicians communicate directly in 20% or fewer admissions.13 The hospital discharge summary is the primary method of communication with the next provider, but 65%–84% of all discharge summaries lack information on TPAD.13,14
In this work, we sought to identify and evaluate interventions aimed at improving documentation, communication, and follow-up of TPAD. This review was conducted through the Laboratory Medicine Best Practices (LMBP™) initiative, which is sponsored by the Centers for Disease Control and Prevention’s (CDC’s) Division of Laboratory Systems (https://wwwn.cdc.gov/labbestpractices/). The LMBP™ was initiated as the CDC’s response to the IOM report To Err is Human: Building a Safer Health System.15
METHODS
We applied the first four phases of the LMBP™-developed A-6 Cycle methodology to evaluate quality improvement practices as described below.16 Our report follows the Meta-analysis Of Observational Studies in Epidemiology (MOOSE) guidelines.17
Asking the Question
The full review, which is available from the corresponding author, assessed the evidence that the interventions improved (1) the timeliness of follow-up of TPAD or reduced adverse health events; (2) discharge planning, documentation, or communication with the outpatient care provider regarding TPAD; and (3) health outcomes. In this article, we present the impact of interventions to improve the documentation, communication, and follow-up of TPAD. The review protocol, which is also available from the corresponding author, was developed with the input of a panel of experts (Appendix A) in laboratory medicine, systematic reviews, informatics, and patient safety. The analytic framework (Appendix B) describes the scope of the review. The inclusion criteria for papers reporting on interventions to improve communication of TPAD are the following:
- Population: Patients who were admitted to an inpatient facility or who visited an ED (including patients released from the ED) and who had one or more TPADs.
- Interventions: Practices that explicitly aimed to improve the documentation, communication, or follow-up of TPAD, alone or as part of a broader quality improvement effort.
- Comparators: Standard practice, pre-intervention practice, or any other valid comparator.
- Outcomes: Documentation completeness, physician awareness of pending tests, or follow-up of TPAD.
Acquire the Evidence
A professional librarian conducted literature searches in PubMed, CINAHL, Cochrane, and EMBASE using terms that captured relevant health care settings, transition of patient care, laboratory tests, communication, and pending or missed tests (Appendix C). Citations were also identified by expert panel members and by manual searches of bibliographies of relevant studies. We included studies published in English in 2005 or later. We sought unpublished studies through expert panelists and queries to relevant professional organizations.
Appraise the Studies
Two independent reviewers evaluated each retrieved citation for inclusion. We excluded articles that (1) did not explicitly address laboratory TPAD; (2) were letters, editorials, commentaries, or abstracts; (3) did not address transition between settings; (4) did not include an intervention; (5) were case reports or case series; or (6) were not published in English. A team member abstracted predetermined data elements (Appendix D) from each included study, and a senior scientist reviewed the abstraction. Two senior scientists independently scored the quality of the eligible studies on the A-6 domains of study characteristics, practice description, outcome measures, and results and findings; studies scored below 4 points on a 10-point scale were excluded. Based on this appraisal, studies were classified as good, fair, or poor; poor studies were excluded.
Analyze the Evidence
We synthesized the evidence by intervention type and outcome. The strength of the evidence that each intervention improved the desired outcome was rated in accordance with the A-6 methodology as high, moderate, suggestive, or insufficient based on the number of studies, the study ratings, and the consistency and magnitude of the effect size.
RESULTS
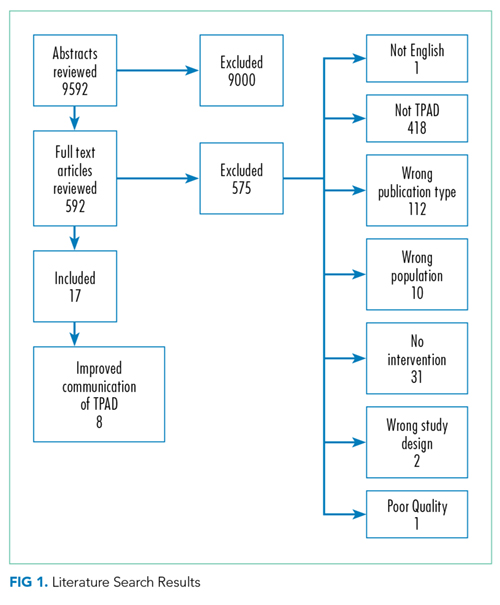
Education to Improve Discharge Summaries
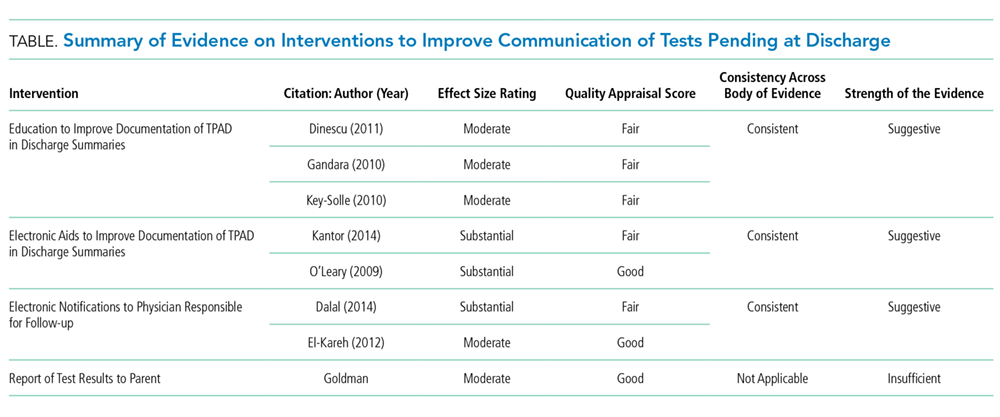

Electronic Tools for Preparation of Discharge Summaries
Two studies 21,22 investigated tools to aid preparation of discharge summaries. Kantor et al.,21 rated fair, evaluated an EMR-generated list of TPAD, and O’Leary et al.,22 rated good, evaluated an electronic discharge summary template. The EMR-generated list resulted in an absolute increase of 25% in the proportion of TPAD documented and of 18% in the percentage of discharge summaries with complete information on TPAD. An electronic discharge summary template increased the percentage of discharge summaries with complete information on TPAD by 32.4%.22 O’Leary et al.22 was the only study that reported a negative effect of an intervention. The authors found a 10% (P = .04) reduction in the documentation of clinically significant laboratory results after implementation of the electronic discharge summary.
Electronic Notifications to Physicians
One good study, El-Kareh et al.,23 and one fair study, Dalal et al.,24 examined the impact of electronic notification of pending laboratory tests or test results to physicians. El-Kareh et al.23 also provided evidence on improved follow-up of test results. Physicians in intervention clusters were three times more likely (OR 3.2 95% CI 1.3-8.4) to have documented follow-up of test results than those in control clusters.23 The absolute increase in awareness of TPAD was 20%,23,24 among primary care physicians and 12%23 or 38%24 among inpatient attending physicians in the intervention clusters.
Notification of Patients or Parents
One study evaluated the impact of online parental access to the results of laboratory tests ordered during a child’s ED visit.25 The intervention indirectly increased physician awareness of the test results: 36 parents (12% of enrolled families) reported informing their physician of the test results. Therapy changed for seven children (5% of 141 whose parents retrieved the child’s test results and completed the follow-up survey).
DISCUSSION
Evidence Summary
We identified four interventions aimed at improving follow-up of TPAD and found suggestive evidence indicating that individual education for preparers of discharge summaries improved the quality of discharge summary documentation of TPAD; however, this type of evidence is below the level of evidence required by the LMBP™ to issue a recommendation. Site variations in the type and timing of interventions,20 small sample size,18 short follow-up,18,19 lack of detail on educational content,18-20 and differences in evaluated interventions limited the evidence quality. The long-term impact of educational interventions is also a concern. Oluma et al., for example, found that the benefits of education interventions were not sustained over time.26
Two studies21,22 evaluated aids to completing discharge summaries. The aids, which include a list of TPADs21 and an electronic template,22 resulted in a substantial increase in the completeness of the documentation of TPAD. Because of the differences in the interventions and the limited number of studies obtained, the evidence was rated as suggestive.
Suggestive evidence that automated e-mail notifications increased awareness of TPAD results by inpatient attending physicians and primary care providers was found. A limitation of this evidence is that both studies23,24 retrieved were conducted at the same institution; thus, the findings may not be generalizable to other institutions. Only one paper25 examined the impact of patient or parental access to laboratory tests results on the primary care physician’s awareness and follow-up of TPAD; as such, we consider the available evidence insufficient to evaluate the intervention.
Limitations
The evidence regarding interventions to improve follow-up of TPAD is limited. The interventions evaluated varied considerably in design and implementation. Most studies were conducted at a single medical center. Few studies had concurrent controls, and even fewer were randomized trials. Some studies included multiple interventions, thereby rendering the isolation of the impact of any single intervention difficult to accomplish.
Comparison to Other Literature
We found no other reviews of interventions to improve follow-up of TPAD. A review of interventions to improve information transfer found that computer-generated discharge summaries improved the timeliness and, less consistently, completeness of the summary.13 The authors of this review13 recommended computer-generated structured summaries that highlight the most pertinent information for follow-up care, as supported by a recent qualitative exploration of care coordination between hospitalists and primary care physicians.27
CONCLUSIONS
Successful follow-up of TPAD during care transition is a multistep process requiring identification and documentation of TPAD, notification of person responsible for follow-up, and their recognition and execution of the appropriate follow-up actions. We found suggestive evidence that individual education and tools, such as automated templates or abstraction, can improve documentation of TPADs and that automated alerts to the physician responsible for follow-up can improve awareness of TPAD results. The interventions were distinct; evidence from one intervention and outcome should be applied cautiously to other interventions and outcomes.
None of the interventions completely resolved the problems of documentation, awareness, or follow-up of TPAD. New interventions should consider the barriers to coordination identified by Jones et al.27 and Callen et al.7 Both studies identified a lack of systems, policies, and practices to support communication across different settings, including lack of access or difficulty navigating electronic medical records at other institutions; unclear or varied accountability for follow-up care; and inconsistent receipt of discharge documents after initial follow-up visit. These systemic problems were exacerbated by a lack of personal relationships between the community physicians, hospital, and ED clinicians, and between acute care clinicians and patients. In EDs, high patient throughput and short length of stay were found to contribute to these barriers. Although laboratories have a responsibility, required by CLIA regulations, to ensure the accurate and complete transmission of test reports,28 none of the interventions appeared to include laboratorians as stakeholders during the design, implementation, or evaluation of the interventions. Incorporating laboratory personnel and processes into the design of follow-up solutions may increase their effectiveness.
Medical informatics tools have the potential to improve patient safety during care transitions. Unfortunately, the evidence regarding informatics interventions to improve follow-up of TPAD was limited by both the number and the quality of the published studies. In addition, better-designed studies in this area are needed. Studies of interventions to improve follow-up of TPAD need to include well-chosen comparator populations and single, well-defined interventions. Evaluation of the interventions would be strengthened if the studies measured both the targeted outcome of the intervention, such as physician awareness of TPAD, and its impact on patient outcomes. Evaluation of the generalizability of the interventions would be strengthened by multi-site studies and, where appropriate, application of the same intervention to multiple study populations. As failure to communicate or follow up on abnormal laboratory tests is a critical threat to patient safety, more research and interventions to address this problem are urgently needed.
Acknowledgments
The authors appreciate the thoughtful insights offered by the following expert panel members: Joanne Callen, PhD; Julie Gayken, MT; Eric Poon, MD; Meera Viswanathan, PhD; and David West, PhD. The authors thank Dr. Jennifer Taylor for her review of the draft manuscript.
Funding
This work was funded by contract number 200-2014-F-61251 from the Centers for Disease Control and Prevention, Division of Laboratory Systems. Dr. Singh was additionally supported by the Houston VA HSR&D Center for Innovations in Quality, Effectiveness, and Safety (CIN 13-413).
Disclaimer
The findings and conclusions in this study are those of the authors and do not necessarily represent the official position of the Centers for Disease Control and Prevention or the Department of Veterans Affairs.
Disclosures
Drs. Whitehead, Graber, and Meleth, Ms. Kennedy, and Mr. Epner received funding for their work on this manuscript (Contract No. 200-2014-F-61251) from the Centers for Disease Control and Prevention. Dr. Graber receives honoraria from several institutions for presentations on diagnostic errors and has a grant from the Macy Foundation to develop a curriculum on diagnostic errors. Unrelated to this publication, Mr. Epner receives payment as a board member of Silicon BioDevices, as a consultant to Kaiser Foundation Health Plan of Colorado, for lectures from Sysmex, Inc., and for meeting expenses from Abbott Laboratories. He has stock or stock options in Silicon BioDevices, Inc. and Viewics, Inc. No other authors have any financial conflicts to report.
1. National Academies of Sciences E, and Medicine. Improving diagnosis in health care. 2015. http://www.nap.edu/catalog/21794/improving-diagnosis-in-health-care. Accessed January 8, 2018.
2. Schiff GD, Hasan O, Kim S, et al. Diagnostic error in medicine: analysis of 583 physician-reported errors. Arch Intern Med. 2009;169(20):1881-1887. PubMed
3. World Alliance for Patient Safety. Summary of the evidence on patient safety: Implications for research. Geneva, Switzerland; 2008.
4. The Joint Commission. National patient safety goals. Effective January 1, 2015. NPSG.02.03.012015.
5. Poon EG, Gandhi TK, Sequist TD, Murff HJ, Karson AS, Bates DW. “I wish I had seen this test result earlier!”: Dissatisfaction with test result management systems in primary care. Arch Intern Med. 2004;164(20):2223-2228. PubMed
6. Callen J, Georgiou A, Li J, Westbrook JI. The safety implications of missed test results for hospitalised patients: a systematic review. BMJ Quality Safety. 2011;20(2):194-199. PubMed
7. Callen JL, Westbrook JI, Georgiou A, Li J. Failure to follow-up test results for ambulatory patients: a systematic review. J Gen Intern Med. 2012;27(10):1334-1348. PubMed
8. Roy CL, Poon EG, Karson AS, et al. Patient safety concerns arising from test results that return after hospital discharge. Ann Intern Med. 2005;143(2):121-128. PubMed
9. El-Kareh R, Roy C, Brodsky G, Perencevich M, Poon EG. Incidence and predictors of microbiology results returning postdischarge and requiring follow-up. J Hosp Med. 2011;6(5):291-296. PubMed
10. Coffey C. Treatment Challenges After Discharge. WebM&M, Cases & Commentaries. 2010;(November 29, 2010). https://psnet.ahrq.gov/webmm/case/227/treatment-challenges-after-discharge. Accessed November 2010.
11. Dalal AK, Schnipper JL, Poon EG, et al. Design and implementation of an automated email notification system for results of tests pending at discharge. J Am Med Inform Assoc. 2012;19(4):523-528. PubMed
12. Wachter RM, Goldman L. The hospitalist movement 5 years later. JAMA. 2002;287(4):487-494. PubMed
13. Kripalani S, LeFevre F, Phillips CO, Williams MV, Basaviah P, Baker DW. Deficits in communication and information transfer between hospital-based and primary care physicians: implications for patient safety and continuity of care. JAMA. 2007;297(8):831-841. PubMed
14. Were MC, Li X, Kesterson J, et al. Adequacy of hospital discharge summaries in documenting tests with pending results and outpatient follow-up providers. J Gen Intern Med. 2009;24(9):1002-1006. PubMed
15. Institute of Medicine. To err is human : building a safer health system Washington, DC.1999.
16. Christenson RH, Snyder SR, Shaw CS, et al. Laboratory medicine best practices: systematic evidence review and evaluation methods for quality improvement. Clin Chem. 2011;57(6):816-825. PubMed
17. Stroup DF, Berlin JA, Morton SC, et al. Meta-analysis of observational studies in epidemiology: a proposal for reporting. Meta-analysis Of Observational Studies in Epidemiology (MOOSE) group. JAMA. 2000;283(15):2008-2012. PubMed
18. Dinescu A, Fernandez H, Ross JS, Karani R. Audit and feedback: An intervention to improve discharge summary completion. J Hosp Med. 2011;6:28-32. PubMed
19. Key-Solle M, Paulk E, Bradford K, Skinner AC, Lewis MC, Shomaker K. Improving the quality of discharge communication with an educational intervention. Pediatrics. 2010;126:734-739. PubMed
20. Gandara E, Ungar J, Lee J, Chan-Macrae M, O’Malley T, Schnipper JL. Discharge documentation of patients discharged to subacute facilities: A three-year quality improvement process across an integrated health care system. Jt Comm J Qual Patient Saf. 2010;36:243-251. PubMed
21. Kantor MA, Evans KH, Shieh L. Pending Studies at Hospital Discharge: A Pre-post Analysis of an Electronic Medical Record Tool to Improve Communication at Hospital Discharge. J Gen Intern Med. 2014;30(3):312-318. PubMed
22. O’Leary KJ, Liebovitz DM, Feinglass J, et al. Creating a better discharge summary: improvement in quality and timeliness using an electronic discharge summary. J Hosp Med. 2009;4(4):219-225. PubMed
23. El-Kareh R, Roy C, Williams DH, Poon EG. Impact of automated alerts on follow-up of post-discharge microbiology results: a cluster randomized controlled trial. J Gen Intern Med. 2012;27:1243-1250. PubMed
24. Dalal AK, Roy CL, Poon EG, et al. Impact of an automated email notification system for results of tests pending at discharge: a cluster-randomized controlled trial. J Am Med Inform Assoc. 2014;21(3):473-480. PubMed
25. Goldman RD, Antoon R, Tait G, Zimmer D, Viegas A, Mounstephen B. Culture results via the internet: A novel way for communication after an emergency department visit. J Pediatr. 2005;147:221-226. PubMed
26. Olomu AB, Stommel M, Holmes-Rovner MM, et al. Is quality improvement sustainable? Findings of the American College of Cardiology’s Guidelines applied in practice. Int J Qual Health Care. 2014;26(3):215-222. PubMed
27. Jones CD, Vu MB, O’Donnell CM, et al. A failure to communicate: a qualitative exploration of care coordination between hospitalists and primary care providers around patient hospitalizations. J Gen Intern Med. 2015;30(4):417-424. PubMed
28. Clinical Laboratory Improvement Amendments Regulations, 42 CFR 493.1291(a)(1988). PubMed
The 2015 National Academy of Sciences (NAS; formerly the Institute of Medicine [IOM]) report, Improving Diagnosis in Health Care, attributes up to 10% of patient deaths and 17% of hospital adverse events to diagnostic errors,1 one cause of which is absent or delayed follow-up of laboratory test results.2 Poor communication or follow-up of laboratory tests with abnormal results has been cited repeatedly as a threat to patient safety.1,3,4 In a survey of internists, 83% reported at least one unacceptably delayed laboratory test result during the previous 2 months.5
Care transitions magnify the risk of missed test results.6,7 Up to 16% of all emergency department (ED) and 23% of all hospitalized patients will have pending laboratory test results at release or discharge.6 The percentage of tests that received follow-up ranged from 1% to 75% for tests done in the ED and from 20% to 69% for tests ordered on inpatients. In one study, 41% of all surveyed medical inpatients had at least one test result pending at discharge (TPAD). When further studied, over 40% of the results were abnormal and 9% required action, but the responsible physicians were unaware of 62% of the test results.8 Many examples of morbidity from such failure have been reported. One of many described by El-Kareh et al., for example, is that of an 81-year-old man on total parenteral nutrition who was treated for suspected line infection and discharged without antibiotics, but whose blood cultures grew Klebsiella pneumoniae after his discharge.9 Another example, presented on the Agency for Healthcare Research and Quality (AHRQ) Patient Safety Network, reported a patient admitted for a urinary tract infection and then discharged from the hospital on trimethoprim–sulfamethoxazole. He returned to the hospital 11 days later with severe sepsis. Upon review, the urine culture results from his previous admission, which were returned 2 days after his discharge, indicated that the infectious agent was not sensitive to trimethoprim–sulfamethoxazole. The results had not been reviewed by hospital clinicians or forwarded to the patient’s physician, so the patient continued on the ineffective treatment. His second hospital admission lasted 7 days, but he made a complete recovery with the correct antibiotic.10
Several barriers impede the follow-up of TPAD. First, who should receive test results or who is responsible for addressing them may be unclear. Second, even if responsibility is clear, communication between the provider who ordered the test and the provider responsible for follow-up may be suboptimal.11 Finally, providers who need to follow up on abnormal results may not appreciate the urgency or significance of pending results.
The hospitalist model of care increases efficiency during hospitalization but further complicates care coordination.12 The hospitalist who orders a test may not be on duty at discharge or when test results are finalized. Primary care providers may have little contact with their patients during their admission.12 Effective communication between providers is key to ensuring appropriate follow-up care, but primary care physicians and hospital physicians communicate directly in 20% or fewer admissions.13 The hospital discharge summary is the primary method of communication with the next provider, but 65%–84% of all discharge summaries lack information on TPAD.13,14
In this work, we sought to identify and evaluate interventions aimed at improving documentation, communication, and follow-up of TPAD. This review was conducted through the Laboratory Medicine Best Practices (LMBP™) initiative, which is sponsored by the Centers for Disease Control and Prevention’s (CDC’s) Division of Laboratory Systems (https://wwwn.cdc.gov/labbestpractices/). The LMBP™ was initiated as the CDC’s response to the IOM report To Err is Human: Building a Safer Health System.15
METHODS
We applied the first four phases of the LMBP™-developed A-6 Cycle methodology to evaluate quality improvement practices as described below.16 Our report follows the Meta-analysis Of Observational Studies in Epidemiology (MOOSE) guidelines.17
Asking the Question
The full review, which is available from the corresponding author, assessed the evidence that the interventions improved (1) the timeliness of follow-up of TPAD or reduced adverse health events; (2) discharge planning, documentation, or communication with the outpatient care provider regarding TPAD; and (3) health outcomes. In this article, we present the impact of interventions to improve the documentation, communication, and follow-up of TPAD. The review protocol, which is also available from the corresponding author, was developed with the input of a panel of experts (Appendix A) in laboratory medicine, systematic reviews, informatics, and patient safety. The analytic framework (Appendix B) describes the scope of the review. The inclusion criteria for papers reporting on interventions to improve communication of TPAD are the following:
- Population: Patients who were admitted to an inpatient facility or who visited an ED (including patients released from the ED) and who had one or more TPADs.
- Interventions: Practices that explicitly aimed to improve the documentation, communication, or follow-up of TPAD, alone or as part of a broader quality improvement effort.
- Comparators: Standard practice, pre-intervention practice, or any other valid comparator.
- Outcomes: Documentation completeness, physician awareness of pending tests, or follow-up of TPAD.
Acquire the Evidence
A professional librarian conducted literature searches in PubMed, CINAHL, Cochrane, and EMBASE using terms that captured relevant health care settings, transition of patient care, laboratory tests, communication, and pending or missed tests (Appendix C). Citations were also identified by expert panel members and by manual searches of bibliographies of relevant studies. We included studies published in English in 2005 or later. We sought unpublished studies through expert panelists and queries to relevant professional organizations.
Appraise the Studies
Two independent reviewers evaluated each retrieved citation for inclusion. We excluded articles that (1) did not explicitly address laboratory TPAD; (2) were letters, editorials, commentaries, or abstracts; (3) did not address transition between settings; (4) did not include an intervention; (5) were case reports or case series; or (6) were not published in English. A team member abstracted predetermined data elements (Appendix D) from each included study, and a senior scientist reviewed the abstraction. Two senior scientists independently scored the quality of the eligible studies on the A-6 domains of study characteristics, practice description, outcome measures, and results and findings; studies scored below 4 points on a 10-point scale were excluded. Based on this appraisal, studies were classified as good, fair, or poor; poor studies were excluded.
Analyze the Evidence
We synthesized the evidence by intervention type and outcome. The strength of the evidence that each intervention improved the desired outcome was rated in accordance with the A-6 methodology as high, moderate, suggestive, or insufficient based on the number of studies, the study ratings, and the consistency and magnitude of the effect size.
RESULTS
Education to Improve Discharge Summaries
Electronic Tools for Preparation of Discharge Summaries
Two studies 21,22 investigated tools to aid preparation of discharge summaries. Kantor et al.,21 rated fair, evaluated an EMR-generated list of TPAD, and O’Leary et al.,22 rated good, evaluated an electronic discharge summary template. The EMR-generated list resulted in an absolute increase of 25% in the proportion of TPAD documented and of 18% in the percentage of discharge summaries with complete information on TPAD. An electronic discharge summary template increased the percentage of discharge summaries with complete information on TPAD by 32.4%.22 O’Leary et al.22 was the only study that reported a negative effect of an intervention. The authors found a 10% (P = .04) reduction in the documentation of clinically significant laboratory results after implementation of the electronic discharge summary.
Electronic Notifications to Physicians
One good study, El-Kareh et al.,23 and one fair study, Dalal et al.,24 examined the impact of electronic notification of pending laboratory tests or test results to physicians. El-Kareh et al.23 also provided evidence on improved follow-up of test results. Physicians in intervention clusters were three times more likely (OR 3.2 95% CI 1.3-8.4) to have documented follow-up of test results than those in control clusters.23 The absolute increase in awareness of TPAD was 20%,23,24 among primary care physicians and 12%23 or 38%24 among inpatient attending physicians in the intervention clusters.
Notification of Patients or Parents
One study evaluated the impact of online parental access to the results of laboratory tests ordered during a child’s ED visit.25 The intervention indirectly increased physician awareness of the test results: 36 parents (12% of enrolled families) reported informing their physician of the test results. Therapy changed for seven children (5% of 141 whose parents retrieved the child’s test results and completed the follow-up survey).
DISCUSSION
Evidence Summary
We identified four interventions aimed at improving follow-up of TPAD and found suggestive evidence indicating that individual education for preparers of discharge summaries improved the quality of discharge summary documentation of TPAD; however, this type of evidence is below the level of evidence required by the LMBP™ to issue a recommendation. Site variations in the type and timing of interventions,20 small sample size,18 short follow-up,18,19 lack of detail on educational content,18-20 and differences in evaluated interventions limited the evidence quality. The long-term impact of educational interventions is also a concern. Oluma et al., for example, found that the benefits of education interventions were not sustained over time.26
Two studies21,22 evaluated aids to completing discharge summaries. The aids, which include a list of TPADs21 and an electronic template,22 resulted in a substantial increase in the completeness of the documentation of TPAD. Because of the differences in the interventions and the limited number of studies obtained, the evidence was rated as suggestive.
Suggestive evidence that automated e-mail notifications increased awareness of TPAD results by inpatient attending physicians and primary care providers was found. A limitation of this evidence is that both studies23,24 retrieved were conducted at the same institution; thus, the findings may not be generalizable to other institutions. Only one paper25 examined the impact of patient or parental access to laboratory tests results on the primary care physician’s awareness and follow-up of TPAD; as such, we consider the available evidence insufficient to evaluate the intervention.
Limitations
The evidence regarding interventions to improve follow-up of TPAD is limited. The interventions evaluated varied considerably in design and implementation. Most studies were conducted at a single medical center. Few studies had concurrent controls, and even fewer were randomized trials. Some studies included multiple interventions, thereby rendering the isolation of the impact of any single intervention difficult to accomplish.
Comparison to Other Literature
We found no other reviews of interventions to improve follow-up of TPAD. A review of interventions to improve information transfer found that computer-generated discharge summaries improved the timeliness and, less consistently, completeness of the summary.13 The authors of this review13 recommended computer-generated structured summaries that highlight the most pertinent information for follow-up care, as supported by a recent qualitative exploration of care coordination between hospitalists and primary care physicians.27
CONCLUSIONS
Successful follow-up of TPAD during care transition is a multistep process requiring identification and documentation of TPAD, notification of person responsible for follow-up, and their recognition and execution of the appropriate follow-up actions. We found suggestive evidence that individual education and tools, such as automated templates or abstraction, can improve documentation of TPADs and that automated alerts to the physician responsible for follow-up can improve awareness of TPAD results. The interventions were distinct; evidence from one intervention and outcome should be applied cautiously to other interventions and outcomes.
None of the interventions completely resolved the problems of documentation, awareness, or follow-up of TPAD. New interventions should consider the barriers to coordination identified by Jones et al.27 and Callen et al.7 Both studies identified a lack of systems, policies, and practices to support communication across different settings, including lack of access or difficulty navigating electronic medical records at other institutions; unclear or varied accountability for follow-up care; and inconsistent receipt of discharge documents after initial follow-up visit. These systemic problems were exacerbated by a lack of personal relationships between the community physicians, hospital, and ED clinicians, and between acute care clinicians and patients. In EDs, high patient throughput and short length of stay were found to contribute to these barriers. Although laboratories have a responsibility, required by CLIA regulations, to ensure the accurate and complete transmission of test reports,28 none of the interventions appeared to include laboratorians as stakeholders during the design, implementation, or evaluation of the interventions. Incorporating laboratory personnel and processes into the design of follow-up solutions may increase their effectiveness.
Medical informatics tools have the potential to improve patient safety during care transitions. Unfortunately, the evidence regarding informatics interventions to improve follow-up of TPAD was limited by both the number and the quality of the published studies. In addition, better-designed studies in this area are needed. Studies of interventions to improve follow-up of TPAD need to include well-chosen comparator populations and single, well-defined interventions. Evaluation of the interventions would be strengthened if the studies measured both the targeted outcome of the intervention, such as physician awareness of TPAD, and its impact on patient outcomes. Evaluation of the generalizability of the interventions would be strengthened by multi-site studies and, where appropriate, application of the same intervention to multiple study populations. As failure to communicate or follow up on abnormal laboratory tests is a critical threat to patient safety, more research and interventions to address this problem are urgently needed.
Acknowledgments
The authors appreciate the thoughtful insights offered by the following expert panel members: Joanne Callen, PhD; Julie Gayken, MT; Eric Poon, MD; Meera Viswanathan, PhD; and David West, PhD. The authors thank Dr. Jennifer Taylor for her review of the draft manuscript.
Funding
This work was funded by contract number 200-2014-F-61251 from the Centers for Disease Control and Prevention, Division of Laboratory Systems. Dr. Singh was additionally supported by the Houston VA HSR&D Center for Innovations in Quality, Effectiveness, and Safety (CIN 13-413).
Disclaimer
The findings and conclusions in this study are those of the authors and do not necessarily represent the official position of the Centers for Disease Control and Prevention or the Department of Veterans Affairs.
Disclosures
Drs. Whitehead, Graber, and Meleth, Ms. Kennedy, and Mr. Epner received funding for their work on this manuscript (Contract No. 200-2014-F-61251) from the Centers for Disease Control and Prevention. Dr. Graber receives honoraria from several institutions for presentations on diagnostic errors and has a grant from the Macy Foundation to develop a curriculum on diagnostic errors. Unrelated to this publication, Mr. Epner receives payment as a board member of Silicon BioDevices, as a consultant to Kaiser Foundation Health Plan of Colorado, for lectures from Sysmex, Inc., and for meeting expenses from Abbott Laboratories. He has stock or stock options in Silicon BioDevices, Inc. and Viewics, Inc. No other authors have any financial conflicts to report.
1. National Academies of Sciences E, and Medicine. Improving diagnosis in health care. 2015. http://www.nap.edu/catalog/21794/improving-diagnosis-in-health-care. Accessed January 8, 2018.
2. Schiff GD, Hasan O, Kim S, et al. Diagnostic error in medicine: analysis of 583 physician-reported errors. Arch Intern Med. 2009;169(20):1881-1887. PubMed
3. World Alliance for Patient Safety. Summary of the evidence on patient safety: Implications for research. Geneva, Switzerland; 2008.
4. The Joint Commission. National patient safety goals. Effective January 1, 2015. NPSG.02.03.012015.
5. Poon EG, Gandhi TK, Sequist TD, Murff HJ, Karson AS, Bates DW. “I wish I had seen this test result earlier!”: Dissatisfaction with test result management systems in primary care. Arch Intern Med. 2004;164(20):2223-2228. PubMed
6. Callen J, Georgiou A, Li J, Westbrook JI. The safety implications of missed test results for hospitalised patients: a systematic review. BMJ Quality Safety. 2011;20(2):194-199. PubMed
7. Callen JL, Westbrook JI, Georgiou A, Li J. Failure to follow-up test results for ambulatory patients: a systematic review. J Gen Intern Med. 2012;27(10):1334-1348. PubMed
8. Roy CL, Poon EG, Karson AS, et al. Patient safety concerns arising from test results that return after hospital discharge. Ann Intern Med. 2005;143(2):121-128. PubMed
9. El-Kareh R, Roy C, Brodsky G, Perencevich M, Poon EG. Incidence and predictors of microbiology results returning postdischarge and requiring follow-up. J Hosp Med. 2011;6(5):291-296. PubMed
10. Coffey C. Treatment Challenges After Discharge. WebM&M, Cases & Commentaries. 2010;(November 29, 2010). https://psnet.ahrq.gov/webmm/case/227/treatment-challenges-after-discharge. Accessed November 2010.
11. Dalal AK, Schnipper JL, Poon EG, et al. Design and implementation of an automated email notification system for results of tests pending at discharge. J Am Med Inform Assoc. 2012;19(4):523-528. PubMed
12. Wachter RM, Goldman L. The hospitalist movement 5 years later. JAMA. 2002;287(4):487-494. PubMed
13. Kripalani S, LeFevre F, Phillips CO, Williams MV, Basaviah P, Baker DW. Deficits in communication and information transfer between hospital-based and primary care physicians: implications for patient safety and continuity of care. JAMA. 2007;297(8):831-841. PubMed
14. Were MC, Li X, Kesterson J, et al. Adequacy of hospital discharge summaries in documenting tests with pending results and outpatient follow-up providers. J Gen Intern Med. 2009;24(9):1002-1006. PubMed
15. Institute of Medicine. To err is human : building a safer health system Washington, DC.1999.
16. Christenson RH, Snyder SR, Shaw CS, et al. Laboratory medicine best practices: systematic evidence review and evaluation methods for quality improvement. Clin Chem. 2011;57(6):816-825. PubMed
17. Stroup DF, Berlin JA, Morton SC, et al. Meta-analysis of observational studies in epidemiology: a proposal for reporting. Meta-analysis Of Observational Studies in Epidemiology (MOOSE) group. JAMA. 2000;283(15):2008-2012. PubMed
18. Dinescu A, Fernandez H, Ross JS, Karani R. Audit and feedback: An intervention to improve discharge summary completion. J Hosp Med. 2011;6:28-32. PubMed
19. Key-Solle M, Paulk E, Bradford K, Skinner AC, Lewis MC, Shomaker K. Improving the quality of discharge communication with an educational intervention. Pediatrics. 2010;126:734-739. PubMed
20. Gandara E, Ungar J, Lee J, Chan-Macrae M, O’Malley T, Schnipper JL. Discharge documentation of patients discharged to subacute facilities: A three-year quality improvement process across an integrated health care system. Jt Comm J Qual Patient Saf. 2010;36:243-251. PubMed
21. Kantor MA, Evans KH, Shieh L. Pending Studies at Hospital Discharge: A Pre-post Analysis of an Electronic Medical Record Tool to Improve Communication at Hospital Discharge. J Gen Intern Med. 2014;30(3):312-318. PubMed
22. O’Leary KJ, Liebovitz DM, Feinglass J, et al. Creating a better discharge summary: improvement in quality and timeliness using an electronic discharge summary. J Hosp Med. 2009;4(4):219-225. PubMed
23. El-Kareh R, Roy C, Williams DH, Poon EG. Impact of automated alerts on follow-up of post-discharge microbiology results: a cluster randomized controlled trial. J Gen Intern Med. 2012;27:1243-1250. PubMed
24. Dalal AK, Roy CL, Poon EG, et al. Impact of an automated email notification system for results of tests pending at discharge: a cluster-randomized controlled trial. J Am Med Inform Assoc. 2014;21(3):473-480. PubMed
25. Goldman RD, Antoon R, Tait G, Zimmer D, Viegas A, Mounstephen B. Culture results via the internet: A novel way for communication after an emergency department visit. J Pediatr. 2005;147:221-226. PubMed
26. Olomu AB, Stommel M, Holmes-Rovner MM, et al. Is quality improvement sustainable? Findings of the American College of Cardiology’s Guidelines applied in practice. Int J Qual Health Care. 2014;26(3):215-222. PubMed
27. Jones CD, Vu MB, O’Donnell CM, et al. A failure to communicate: a qualitative exploration of care coordination between hospitalists and primary care providers around patient hospitalizations. J Gen Intern Med. 2015;30(4):417-424. PubMed
28. Clinical Laboratory Improvement Amendments Regulations, 42 CFR 493.1291(a)(1988). PubMed
© 2018 Society of Hospital Medicine
Real-world challenges in managing ‘dual diagnosis’ patients
The term “dual diagnosis” describes the clinically challenging comorbidity of a substance use disorder (SUD) along with another major mental illness. Based on data from the Epidemiologic Catchment Area study, the lifetime prevalence of SUDs among patients with mental illness is approximately 30%, and is higher among patients with certain mental disorders, such as schizophrenia (47%), bipolar disorder (61%), and antisocial personality disorder (84%).1 These statistics highlight that addiction is often the rule rather than the exception among those with severe mental illness.1 Not surprisingly, the combined effects of having an SUD along with another mental illness are uniformly negative (Table 12-4).

Based on outcomes research, the core tenets of evidence-based dual-diagnosis treatment include the importance of integrated (rather than parallel) and simultaneous (rather than sequential) care, which means an ideal treatment program includes a unified, multidisciplinary team whose coordinated efforts focus on treating both disorders concurrently.2 Evidence-based psychotherapies for addiction, including motivational interviewing, cognitive-behavioral therapy, relapse prevention, contingency management, skills training, and/or case management, are a necessity,3,5 and must be balanced with rational and appropriate pharmacotherapy targeting both the SUD as well as the other disorder (Table 22,3,5-9).

3 ‘Real-world’ clinical challenges
Ideal vs real-world treatment
Treating patients with co-occurring disorders (CODs) within integrated dual-disorder treatment (IDDT) programs sounds straightforward. However, implementing evidence-based “best practice” treatment is a significant challenge in the real world for several reasons. First, individuals with CODs often struggle with poor insight, low motivation to change, and lack of access to health care. According to the Substance Abuse and Mental Health Services Administration (SAMHSA), 52% of individuals with CODs in the U.S. received no treatment at all in 2016.10 For patients with dual disorders who do seek care, most are not given access to specialty SUD treatment10 and may instead find themselves treated by psychiatrists with limited SUD training who fail to provide evidence-based psychotherapies and underutilize pharmacotherapies for SUDs.11 In the setting of CODs, the “harm reduction model” can be conflated with therapeutic nihilism, resulting in the neglect of SUD issues, with clinicians expecting patients to seek SUD treatment on their own, through self-help groups such as Alcoholics Anonymous or in other community treatment programs staffed by nonprofessionals that often are not tailored to the unique needs of patients with dual disorders. Psychiatrists working with other mental health professionals who provide psychotherapy for SUDs often do so in parallel rather than in an evidence-based, integrated fashion.
IDDT programs are not widely available. One study found that fewer than 20% of addiction treatment programs and fewer than 10% of mental health programs in the U.S. met criteria for dual diagnosis–capable services.12 Getting treatment programs to become dual diagnosis–capable is possible, but it is a time-consuming and costly endeavor that, once achieved, requires continuous staff training and programmatic adaptations to interruptions in funding.13-16 With myriad barriers to the establishment and maintenance of IDDTs, many patients with dual disorders are left without access to the most effective and comprehensive care; as few as 4% of individuals with CODs are treated within integrated programs.17
Diagnostic dilemmas
Establishing whether or not a patient with an active SUD has another serious mental illness (SMI) is a crucial first step for optimizing treatment, but diagnostic reliability can prove challenging and requires careful clinical assessment (Table 3). As always in psychiatry, accurate diagnosis is limited to careful clinical assessment18 and, in the case of possible dual disorders, is complicated by the fact that both SUDs as well as non-SUDs can result in the same psychiatric symptoms (eg, insomnia, anxiety, depression, manic behaviors, and psychosis). Clinicians must therefore distinguish between:
- Symptoms of substance intoxication or withdrawal vs independent symptoms of an underlying psychiatric disorder (that persist beyond a month after cessation of intoxication or withdrawal)
- Subclinical symptoms vs threshold mental illness, keeping in mind that some mood and anxiety states can be normal given social situations and stressors (eg, turmoil in relationships, employment difficulties, homelessness, etc.)
- Any mental illness (AMI) vs SMI. The latter is defined by SAMHSA as AMI that substantially interferes with or limits ≥1 major life activities.10

With these distinctions in mind, data from the 2016 National Survey on Drug Use and Health indicate that dual-diagnosis comorbidity was higher when the threshold for mental illness was lower—among the 19 million adults in the U.S. with SUDs, the past-year prevalence was 43% for AMI and 14% for SMI.10 Looking at substance-induced disorders vs “independent” disorders, the 2001-2002 National Epidemiologic Survey on Alcohol and Related Conditions found that for individuals with SUDs, the past-year prevalence of an independent mood or anxiety disorder was 35% and 26%, respectively.19 Taken together, these findings illustrate the substantial rate of dual-diagnosis comorbidity, the diagnostic heterogeneity and range of severity of CODs,20 and the potential for both false negatives (eg, diagnosing a substance-induced syndrome when in fact a patient has an underlying disorder) and false positives (diagnosing a full-blown mental illness when symptoms are subclinical or substance-induced) when performing diagnostic assessments in the setting of known SUDs.
Continue to: False positives are more likely...
False positives are more likely when patients seeking treatment for non-SUDs don’t disclose active drug use, even when asked. Both patients and their treating clinicians may also be prone to underestimating the significant potential for morbidity associated with SUDs, such that substance-induced symptoms may be misattributed to a dual disorder. Diagnostic questioning and thorough chart review that includes careful assessment of whether psychiatric symptoms preceded the onset of substance use, and whether they persisted in the setting of extended sobriety, is therefore paramount for minimizing false positives when assessing for dual diagnoses.18,21 Likewise, random urine toxicology testing can be invaluable in verifying claims regarding sobriety.
Another factor that can complicate diagnosis is that there are often considerable secondary gains (eg, disability income, hospitalization, housing, access to prescription medications, and mitigation of the blame and stigma associated with addiction) associated with having a dual disorder as opposed to having “just” a SUD. As a result, for some patients, obtaining a non-SUD diagnosis can be highly incentivized.22,23 Clinicians must therefore be savvy about the high potential for malingering, embellishment, and mislabeling of symptoms when conducting diagnostic interviews. For example, in assessing for psychosis, the frequent endorsement of “hearing voices” in patients with SUDs often results in a diagnosis of schizophrenia or unspecified psychotic disorder,22 despite the fact that this symptom can occur during substance intoxication and withdrawal, is well documented among people without mental illness as well as those with non-psychotic disorders,24 and can resolve without medications or with non-antipsychotic pharmacotherapy.25
When assessing for dual disorders, diagnostic false positives and false negatives can both contribute to inappropriate treatment and unrealistic expectations for recovery, and therefore underscore the importance of careful diagnostic assessment. Even with diligent assessment, however, diagnostic clarity can prove elusive due to inadequate sobriety, inconsistent reporting, and poor memory.26 Therefore, for patients with known SUDs but diagnostic uncertainty about a dual disorder, the work-up should include a trial of prospective observation, with completion of appropriate detoxification, throughout a 1-month period of sobriety and in the absence of psychiatric medications, to determine if there are persistent symptoms that would justify a dual diagnosis. In research settings, such observations have revealed that most of depressive symptoms among alcoholics who present for substance abuse treatment resolve after a month of abstinence.27 A similar time course for resolution has been noted for anxiety, distress, fatigue, and depressive symptoms among individuals with cocaine dependence.28 These findings support the guideline established in DSM-IV that symptoms persisting beyond a month of sobriety “should be considered to be manifestations of an independent, non-substance-induced mental disorder,”29 while symptoms occurring within that month may well be substance-induced. Unfortunately, in real-world clinical practice, and particularly in outpatient settings, it can be quite difficult to achieve the requisite period of sobriety for reliable diagnosis, and patients are often prematurely prescribed medications (eg, an antidepressant, antipsychotic, or mood stabilizer) that can confound the cause of symptomatic resolution. Such prescriptions are driven by compelling pressures from patients to relieve their acute suffering, as well as the predilection of some clinicians to give patients “the benefit of doubt” in assessing for dual diagnoses. However, whether an inappropriate diagnosis or a prescription for an unnecessary medication represents a benefit is debatable at best.
Pharmacotherapy
A third real-world challenge in managing patients with dual disorders involves optimizing pharmacotherapy. Unfortunately, because patients with SUDs often are excluded from clinical trials, evidence-based guidance for patients with dual disorders is lacking. In addition, medications for both CODs often remain inaccessible to patients with dual disorders for 3 reasons:
- SUDs negatively impact medication adherence among patients with dual disorders, who sometimes point out that “it says right here on the bottle not to take this medication with drugs or alcohol!”
- Some self-help groups still espouse blanket opposition of any “psychotropic” medications, even when clearly indicated for patients with COD. Groups that recognize the importance of pharmacotherapy, such as Dual Diagnosis Anonymous (DDA), have emerged, but are not yet widely available.30
- Although there are increasing options for FDA-approved medications for SUDs, they are limited to the treatment of alcohol, opioid, and nicotine use disorders31; are often restricted due to hospital and health insurance formularies32; and remain underprescribed for patients with dual disorders.11
Continue to: Although underutilization of pharmacotherapy is...
Although underutilization of pharmacotherapy is a pitfall to be avoided in the treatment of patients with dual disorders, medication overutilization can be just as problematic. Patients with dual disorders are sometimes singularly focused on resolving acute anxiety, depression, or psychosis at the expense of working towards sobriety.33 Although the “self-medication hypothesis” is frequently invoked by patients and clinicians alike to suggest that substance use occurs in the service of “treating” underlying disorders,34 this theory has not been well supported in studies.35-37 Some patients may pledge dedication to abstinence, but still pressure physicians for a pharmacologic solution to their suffering. With expanding legalization of cannabis for both recreational and medical purposes, patients are increasingly seeking doctors’ recommendations for “medical marijuana” for a wide range of complaints, despite the fact that data supporting a therapeutic role for cannabis in the treatment of mental illness is sparse,38 whereas the potential harm in terms of either causing or worsening psychosis is well established.39,40 Clinicians must be knowledgeable about the abuse potential of prescribed medications, ranging from sleep aids, analgesics, and muscle relaxants to antidepressants and antipsychotics, while also being mindful of the psychological meaningfulness of seeking, prescribing, and not prescribing medications.41
Although the simultaneous treatment of patients with dual disorders that includes pharmacotherapy for both SUDs and CODs is vital for optimizing clinical outcomes, clinicians should strive for diagnostic accuracy and use medications judiciously. In addition, although pharmacotherapy often is necessary to deliver evidence-based treatment for patients with dual disorders, it is inadequate as standalone treatment and should be administered along with psychosocial interventions within an integrated, multidisciplinary treatment setting.
The keys to optimal outcomes
The treatment of patients with dual disorders can be challenging, to say the least. Ideal, evidence-based therapy in the form of an IDDT program can be difficult for clinicians to implement and for patients to access. Best efforts to perform meticulous clinical assessment to clarify diagnoses, use pharmacotherapy judiciously, work collaboratively in a multidisciplinary setting, and optimize treatment given available resources are keys to clinical success.
Bottom Line
Ideal treatment of patients with dual disorders consists of simultaneous, integrated interventions delivered by a multidisciplinary team. However, in the real world, limited resources, diagnostic challenges, and both over- and underutilization of pharmacotherapy often hamper optimal treatment.
Related Resources
- Substance Abuse and Mental Health Services Administration. Co-occurring disorders. https://www.samhsa.gov/disorders/co-occurring.
- National Alliance on Mental Illness. Dual diagnosis. https://www.nami.org/Learn-More/Mental-Health-Conditions/Related-Conditions/Dual-Diagnosis.
- Foundations Recovery Network. Dual diagnosis support groups. http://www.dualdiagnosis.org/resource/ddrn/self-helpsupport-groups/support-groups.
- Substance Abuse and Mental Health Services Administration. Integrated treatment for co-occurring disorders evidence-based practices (EBP) KIT. https://store.samhsa.gov/product/Integrated-Treatment-for-Co-Occurring-Disorders-Evidence-Based-Practices-EBP-KIT/SMA08-4367.
- Substance Abuse and Mental Health Services Administration. Substance abuse treatment for persons with co-occurring disorders. https://store.samhsa.gov/shin/content/SMA13-3992/SMA13-3992.pdf.
1. Regier DA, Farmer ME, Rae DS, et al. Comorbidity of mental disorders with alcohol and other drug abuse. Results from the epidemiologic catchment area (ECA) study. JAMA. 1990;264(19):2511-2518.
2. Drake RE, Mercer-McFadden C, Muesner KT, et al. Review of integrated mental health and substance abuse treatment for patients with dual disorders. Schizophr Bull. 1998;24(4):589-608.
3. Horsfall J, Cleary M, Hunt GE, et al. Psychosocial treatments for people with co-occurring severe mental illness and substance use disorders (dual diagnosis): a review of empiric evidence. Harv Rev Psychiatry. 2009;17(1):24-34.
4. Krawczyk N, Feder KA, Saloner B, et al. The association of psychiatric comorbidity with treatment completion among clients admitted to substance use treatment programs in a U.S. national sample. Drug Alcohol Depend. 2017;175:157-163.
5. Brunette MF, Muesner KT. Psychosocial interventions for the long-term management of patients with severe mental illness and co-occurring substance use disorder. J Clin Psychiatry. 2006;67(suppl 7):10-17.
6. Tiet QQ, Mausbach B. Treatments for patients with dual diagnosis: a review. Alcohol Clin Exp Res. 2007;31(4):513-536.
7. Kelly TM, Daley DC, Douaihy AB. Treatment of substance abusing patients with comorbid psychiatric disorders. Addict Behav. 2012;37(1):11-24.
8. Tsuang JT, Ho AP, Eckman TA, et al. Dual diagnosis treatment for patients with schizophrenia who are substance dependent. Psychatr Serv. 1997;48(7):887-889.
9. Rosen MI, Rosenheck RA, Shaner A, et al. Veterans who may need a payee to prevent misuse of funds for drugs. Psychiatr Serv. 2002;53(8):995-1000.
10. Substance Abuse and Mental Health Services Administration. Key substance use and mental health indicators in the United States: results from the 2016 National Survey on Drug Use and Health. HHS Publication No. SMA 17-5044, NSDUH Series H-52. Rockville, MD: Center for Behavioral Health Statistics and Quality, Substance Abuse and Mental Health Services Administration. https://www.samhsa.gov/data/sites/default/files/NSDUH-FFR1-2016/NSDUH-FFR1-2016.pdf. Published September 2017. Accessed August 7, 2018.
11. Rubinsky AD, Chen C, Batki SL, et al. Comparative utilization of pharmacotherapy for alcohol use disorder and other psychiatric disorders among U.S. Veterans Health Administration patients with dual diagnoses. J Psychiatr Res. 2015;69:150-157.
12. McGovern MP, Lambert-Harris C, McHugo GJ, et al. Improving the dual diagnosis capability of addiction and mental health treatment services: implementation factors associated with program level changes. J Dual Diag. 2010;6:237-250.
13. Reno R. Maintaining quality of care in a comprehensive dual diagnosis treatment program. Psychiatr Serv. 2001;52(5):673-675.
14. McGovern MP, Lambert-Harris, Gotham HJ, et al. Dual diagnosis capability in mental health and addiction treatment services: an assessment of programs across multiple state systems. Adm Policy Ment Health. 2014;41(2):205-214.
15. Gotham HJ, Claus RE, Selig K, et al. Increasing program capabilities to provide treatment for co-occurring substance use and mental disorders: organizational characteristics. J Subs Abuse Treat. 2010;38(2):160-169.
16. Priester MA, Browne T, Iachini A, et al. Treatment access barriers and disparities among individuals with co-occurring mental health and substance use disorders: an integrative literature review. J Subst Abuse Treat. 2016;61:47-59.
17. Drake RE, Bond GR. Implementing integrated mental health and substance abuse services. J Dual Diagnosis. 2010;6(3-4):251-262.
18. Miele GM, Trautman KD, Hasin DS. Assessing comorbid mental and substance-use disorders: a guide for clinical practice. J Pract Psychiatry Behav Health. 1996;5:272-282.
19. Stinson FS, Grant BF, Dawson DA, et al. Comorbidity between DSM-IV alcohol and specific drug use disorders in the United States: Results from the National Epidemiologic Survey on Alcohol and Related Conditions. Drug Alcohol Depend. 2015;80(1):105-116.
20. Flynn PM, Brown BS. Co-occurring disorders in substance abuse treatment: Issues and prospects. J Subt Abuse Treat. 2008;34(1):36-47.
21. Grant BF, Stintson FS, Dawson DA, et al. Prevalence and co-occurrence of substance use disorders and independent mood and anxiety disorders. Arch Gen Psychiatry. 2004;61(8):807-816.
22. Pierre JM, Wirshing DA, Wirshing WC. “Iatrogenic malingering” in VA substance abuse treatment. Psych Services. 2003;54(2):253-254.
23. Pierre JM, Shnayder I, Wirshing DA, et al. Intranasal quetiapine abuse. Am J Psychiatry. 2004;161(9):1718.
24. Pierre JM. Hallucinations in non-psychotic disorders: Toward a differential diagnosis of “hearing voices.” Harv Rev Psychiatry. 2010;18(1):22-35.
25. Pierre JM. Nonantipsychotic therapy for monosymptomatic auditory hallucinations. Biol Psychiatry. 2010;68(7):e33-e34.
26. Shaner A, Roberts LJ, Eckman TA, et al. Sources of diagnostic uncertainty for chronically psychotic cocaine abusers. Psychiatr Serv. 1998;49(5):684-690.
27. Brown SA, Shuckit MA. Changes in depression among abstinent alcoholics. J Stud Alcohol. 1988;49(5):412-417.
28. Weddington WW, Brown BS, Haertzen CA, et al. Changes in mood, craving, and sleep during short-term abstinence reported by male cocaine addicts. A controlled, residential study. Arch Gen Psychiatry. 1990;47(9):861-868.
29. American Psychiatric Association. Diagnostic and statistical manual of mental disorders, 4th edition. Washington, DC: American Psychiatric Association; 1994:210.
30. Roush S, Monica C, Carpenter-Song E, et al. First-person perspectives on Dual Diagnosis Anonymous (DDA): a qualitative study. J Dual Diagnosis. 2015;11(2):136-141.
31. Klein JW. Pharmacotherapy for substance abuse disorders. Med Clin N Am. 2016;100(4):891-910.
32. Horgan CM, Reif S, Hodgkin D, et al. Availability of addiction medications in private health plans. J Subst Abuse Treat. 2008;34(2):147-156.
33. Frances RJ. The wrath of grapes versus the self-medication hypothesis. Harvard Rev Psychiatry. 1997;4(5):287-289.
34. Khantzian EJ. The self-medication hypothesis of substance use disorders: a reconsideration and recent applications. Harvard Rev Psychiatry. 1997;4(5):231-244.
35. Hall DH, Queener JE. Self-medication hypothesis of substance use: testing Khantzian’s updated theory. J Psychoactive Drugs. 2007;39(2):151-158.
36. Henwood B, Padgett DK. Reevaluating the self-medication hypothesis among the dually diagnosed. Am J Addict. 2007;16(3):160-165.
37. Lembke A. Time to abandon the self-medication hypothesis in patients with psychiatric disorders. Am J Drug Alc Abuse. 2012;38(6):524-529.
38. Wilkinson ST, Radhakrishnan R, D’Souza DC. A systematic review of the evidence for medical marijuana in psychiatric indications. J Clin Psychiatry. 2016;77(8):1050-1064.
39. Walsh Z, Gonzalez R, Crosby K, et al. Medical cannabis and mental health: a guided systematic review. Clin Psychol Rev. 2017;51:15-29.
40. Pierre JM. Risks of increasingly potent cannabis: the joint effects of potency and frequency. Current Psychiatry. 2017;16:14-20.
41. Zweben JE, Smith DE. Considerations in using psychotropic medication with dual diagnosis patients in recovery. J Psychoactive Drugs. 1989;21(2):221-228.
The term “dual diagnosis” describes the clinically challenging comorbidity of a substance use disorder (SUD) along with another major mental illness. Based on data from the Epidemiologic Catchment Area study, the lifetime prevalence of SUDs among patients with mental illness is approximately 30%, and is higher among patients with certain mental disorders, such as schizophrenia (47%), bipolar disorder (61%), and antisocial personality disorder (84%).1 These statistics highlight that addiction is often the rule rather than the exception among those with severe mental illness.1 Not surprisingly, the combined effects of having an SUD along with another mental illness are uniformly negative (Table 12-4).
Based on outcomes research, the core tenets of evidence-based dual-diagnosis treatment include the importance of integrated (rather than parallel) and simultaneous (rather than sequential) care, which means an ideal treatment program includes a unified, multidisciplinary team whose coordinated efforts focus on treating both disorders concurrently.2 Evidence-based psychotherapies for addiction, including motivational interviewing, cognitive-behavioral therapy, relapse prevention, contingency management, skills training, and/or case management, are a necessity,3,5 and must be balanced with rational and appropriate pharmacotherapy targeting both the SUD as well as the other disorder (Table 22,3,5-9).
3 ‘Real-world’ clinical challenges
Ideal vs real-world treatment
Treating patients with co-occurring disorders (CODs) within integrated dual-disorder treatment (IDDT) programs sounds straightforward. However, implementing evidence-based “best practice” treatment is a significant challenge in the real world for several reasons. First, individuals with CODs often struggle with poor insight, low motivation to change, and lack of access to health care. According to the Substance Abuse and Mental Health Services Administration (SAMHSA), 52% of individuals with CODs in the U.S. received no treatment at all in 2016.10 For patients with dual disorders who do seek care, most are not given access to specialty SUD treatment10 and may instead find themselves treated by psychiatrists with limited SUD training who fail to provide evidence-based psychotherapies and underutilize pharmacotherapies for SUDs.11 In the setting of CODs, the “harm reduction model” can be conflated with therapeutic nihilism, resulting in the neglect of SUD issues, with clinicians expecting patients to seek SUD treatment on their own, through self-help groups such as Alcoholics Anonymous or in other community treatment programs staffed by nonprofessionals that often are not tailored to the unique needs of patients with dual disorders. Psychiatrists working with other mental health professionals who provide psychotherapy for SUDs often do so in parallel rather than in an evidence-based, integrated fashion.
IDDT programs are not widely available. One study found that fewer than 20% of addiction treatment programs and fewer than 10% of mental health programs in the U.S. met criteria for dual diagnosis–capable services.12 Getting treatment programs to become dual diagnosis–capable is possible, but it is a time-consuming and costly endeavor that, once achieved, requires continuous staff training and programmatic adaptations to interruptions in funding.13-16 With myriad barriers to the establishment and maintenance of IDDTs, many patients with dual disorders are left without access to the most effective and comprehensive care; as few as 4% of individuals with CODs are treated within integrated programs.17
Diagnostic dilemmas
Establishing whether or not a patient with an active SUD has another serious mental illness (SMI) is a crucial first step for optimizing treatment, but diagnostic reliability can prove challenging and requires careful clinical assessment (Table 3). As always in psychiatry, accurate diagnosis is limited to careful clinical assessment18 and, in the case of possible dual disorders, is complicated by the fact that both SUDs as well as non-SUDs can result in the same psychiatric symptoms (eg, insomnia, anxiety, depression, manic behaviors, and psychosis). Clinicians must therefore distinguish between:
- Symptoms of substance intoxication or withdrawal vs independent symptoms of an underlying psychiatric disorder (that persist beyond a month after cessation of intoxication or withdrawal)
- Subclinical symptoms vs threshold mental illness, keeping in mind that some mood and anxiety states can be normal given social situations and stressors (eg, turmoil in relationships, employment difficulties, homelessness, etc.)
- Any mental illness (AMI) vs SMI. The latter is defined by SAMHSA as AMI that substantially interferes with or limits ≥1 major life activities.10
With these distinctions in mind, data from the 2016 National Survey on Drug Use and Health indicate that dual-diagnosis comorbidity was higher when the threshold for mental illness was lower—among the 19 million adults in the U.S. with SUDs, the past-year prevalence was 43% for AMI and 14% for SMI.10 Looking at substance-induced disorders vs “independent” disorders, the 2001-2002 National Epidemiologic Survey on Alcohol and Related Conditions found that for individuals with SUDs, the past-year prevalence of an independent mood or anxiety disorder was 35% and 26%, respectively.19 Taken together, these findings illustrate the substantial rate of dual-diagnosis comorbidity, the diagnostic heterogeneity and range of severity of CODs,20 and the potential for both false negatives (eg, diagnosing a substance-induced syndrome when in fact a patient has an underlying disorder) and false positives (diagnosing a full-blown mental illness when symptoms are subclinical or substance-induced) when performing diagnostic assessments in the setting of known SUDs.
Continue to: False positives are more likely...
False positives are more likely when patients seeking treatment for non-SUDs don’t disclose active drug use, even when asked. Both patients and their treating clinicians may also be prone to underestimating the significant potential for morbidity associated with SUDs, such that substance-induced symptoms may be misattributed to a dual disorder. Diagnostic questioning and thorough chart review that includes careful assessment of whether psychiatric symptoms preceded the onset of substance use, and whether they persisted in the setting of extended sobriety, is therefore paramount for minimizing false positives when assessing for dual diagnoses.18,21 Likewise, random urine toxicology testing can be invaluable in verifying claims regarding sobriety.
Another factor that can complicate diagnosis is that there are often considerable secondary gains (eg, disability income, hospitalization, housing, access to prescription medications, and mitigation of the blame and stigma associated with addiction) associated with having a dual disorder as opposed to having “just” a SUD. As a result, for some patients, obtaining a non-SUD diagnosis can be highly incentivized.22,23 Clinicians must therefore be savvy about the high potential for malingering, embellishment, and mislabeling of symptoms when conducting diagnostic interviews. For example, in assessing for psychosis, the frequent endorsement of “hearing voices” in patients with SUDs often results in a diagnosis of schizophrenia or unspecified psychotic disorder,22 despite the fact that this symptom can occur during substance intoxication and withdrawal, is well documented among people without mental illness as well as those with non-psychotic disorders,24 and can resolve without medications or with non-antipsychotic pharmacotherapy.25
When assessing for dual disorders, diagnostic false positives and false negatives can both contribute to inappropriate treatment and unrealistic expectations for recovery, and therefore underscore the importance of careful diagnostic assessment. Even with diligent assessment, however, diagnostic clarity can prove elusive due to inadequate sobriety, inconsistent reporting, and poor memory.26 Therefore, for patients with known SUDs but diagnostic uncertainty about a dual disorder, the work-up should include a trial of prospective observation, with completion of appropriate detoxification, throughout a 1-month period of sobriety and in the absence of psychiatric medications, to determine if there are persistent symptoms that would justify a dual diagnosis. In research settings, such observations have revealed that most of depressive symptoms among alcoholics who present for substance abuse treatment resolve after a month of abstinence.27 A similar time course for resolution has been noted for anxiety, distress, fatigue, and depressive symptoms among individuals with cocaine dependence.28 These findings support the guideline established in DSM-IV that symptoms persisting beyond a month of sobriety “should be considered to be manifestations of an independent, non-substance-induced mental disorder,”29 while symptoms occurring within that month may well be substance-induced. Unfortunately, in real-world clinical practice, and particularly in outpatient settings, it can be quite difficult to achieve the requisite period of sobriety for reliable diagnosis, and patients are often prematurely prescribed medications (eg, an antidepressant, antipsychotic, or mood stabilizer) that can confound the cause of symptomatic resolution. Such prescriptions are driven by compelling pressures from patients to relieve their acute suffering, as well as the predilection of some clinicians to give patients “the benefit of doubt” in assessing for dual diagnoses. However, whether an inappropriate diagnosis or a prescription for an unnecessary medication represents a benefit is debatable at best.
Pharmacotherapy
A third real-world challenge in managing patients with dual disorders involves optimizing pharmacotherapy. Unfortunately, because patients with SUDs often are excluded from clinical trials, evidence-based guidance for patients with dual disorders is lacking. In addition, medications for both CODs often remain inaccessible to patients with dual disorders for 3 reasons:
- SUDs negatively impact medication adherence among patients with dual disorders, who sometimes point out that “it says right here on the bottle not to take this medication with drugs or alcohol!”
- Some self-help groups still espouse blanket opposition of any “psychotropic” medications, even when clearly indicated for patients with COD. Groups that recognize the importance of pharmacotherapy, such as Dual Diagnosis Anonymous (DDA), have emerged, but are not yet widely available.30
- Although there are increasing options for FDA-approved medications for SUDs, they are limited to the treatment of alcohol, opioid, and nicotine use disorders31; are often restricted due to hospital and health insurance formularies32; and remain underprescribed for patients with dual disorders.11
Continue to: Although underutilization of pharmacotherapy is...
Although underutilization of pharmacotherapy is a pitfall to be avoided in the treatment of patients with dual disorders, medication overutilization can be just as problematic. Patients with dual disorders are sometimes singularly focused on resolving acute anxiety, depression, or psychosis at the expense of working towards sobriety.33 Although the “self-medication hypothesis” is frequently invoked by patients and clinicians alike to suggest that substance use occurs in the service of “treating” underlying disorders,34 this theory has not been well supported in studies.35-37 Some patients may pledge dedication to abstinence, but still pressure physicians for a pharmacologic solution to their suffering. With expanding legalization of cannabis for both recreational and medical purposes, patients are increasingly seeking doctors’ recommendations for “medical marijuana” for a wide range of complaints, despite the fact that data supporting a therapeutic role for cannabis in the treatment of mental illness is sparse,38 whereas the potential harm in terms of either causing or worsening psychosis is well established.39,40 Clinicians must be knowledgeable about the abuse potential of prescribed medications, ranging from sleep aids, analgesics, and muscle relaxants to antidepressants and antipsychotics, while also being mindful of the psychological meaningfulness of seeking, prescribing, and not prescribing medications.41
Although the simultaneous treatment of patients with dual disorders that includes pharmacotherapy for both SUDs and CODs is vital for optimizing clinical outcomes, clinicians should strive for diagnostic accuracy and use medications judiciously. In addition, although pharmacotherapy often is necessary to deliver evidence-based treatment for patients with dual disorders, it is inadequate as standalone treatment and should be administered along with psychosocial interventions within an integrated, multidisciplinary treatment setting.
The keys to optimal outcomes
The treatment of patients with dual disorders can be challenging, to say the least. Ideal, evidence-based therapy in the form of an IDDT program can be difficult for clinicians to implement and for patients to access. Best efforts to perform meticulous clinical assessment to clarify diagnoses, use pharmacotherapy judiciously, work collaboratively in a multidisciplinary setting, and optimize treatment given available resources are keys to clinical success.
Bottom Line
Ideal treatment of patients with dual disorders consists of simultaneous, integrated interventions delivered by a multidisciplinary team. However, in the real world, limited resources, diagnostic challenges, and both over- and underutilization of pharmacotherapy often hamper optimal treatment.
Related Resources
- Substance Abuse and Mental Health Services Administration. Co-occurring disorders. https://www.samhsa.gov/disorders/co-occurring.
- National Alliance on Mental Illness. Dual diagnosis. https://www.nami.org/Learn-More/Mental-Health-Conditions/Related-Conditions/Dual-Diagnosis.
- Foundations Recovery Network. Dual diagnosis support groups. http://www.dualdiagnosis.org/resource/ddrn/self-helpsupport-groups/support-groups.
- Substance Abuse and Mental Health Services Administration. Integrated treatment for co-occurring disorders evidence-based practices (EBP) KIT. https://store.samhsa.gov/product/Integrated-Treatment-for-Co-Occurring-Disorders-Evidence-Based-Practices-EBP-KIT/SMA08-4367.
- Substance Abuse and Mental Health Services Administration. Substance abuse treatment for persons with co-occurring disorders. https://store.samhsa.gov/shin/content/SMA13-3992/SMA13-3992.pdf.
1. Regier DA, Farmer ME, Rae DS, et al. Comorbidity of mental disorders with alcohol and other drug abuse. Results from the epidemiologic catchment area (ECA) study. JAMA. 1990;264(19):2511-2518.
2. Drake RE, Mercer-McFadden C, Muesner KT, et al. Review of integrated mental health and substance abuse treatment for patients with dual disorders. Schizophr Bull. 1998;24(4):589-608.
3. Horsfall J, Cleary M, Hunt GE, et al. Psychosocial treatments for people with co-occurring severe mental illness and substance use disorders (dual diagnosis): a review of empiric evidence. Harv Rev Psychiatry. 2009;17(1):24-34.
4. Krawczyk N, Feder KA, Saloner B, et al. The association of psychiatric comorbidity with treatment completion among clients admitted to substance use treatment programs in a U.S. national sample. Drug Alcohol Depend. 2017;175:157-163.
5. Brunette MF, Muesner KT. Psychosocial interventions for the long-term management of patients with severe mental illness and co-occurring substance use disorder. J Clin Psychiatry. 2006;67(suppl 7):10-17.
6. Tiet QQ, Mausbach B. Treatments for patients with dual diagnosis: a review. Alcohol Clin Exp Res. 2007;31(4):513-536.
7. Kelly TM, Daley DC, Douaihy AB. Treatment of substance abusing patients with comorbid psychiatric disorders. Addict Behav. 2012;37(1):11-24.
8. Tsuang JT, Ho AP, Eckman TA, et al. Dual diagnosis treatment for patients with schizophrenia who are substance dependent. Psychatr Serv. 1997;48(7):887-889.
9. Rosen MI, Rosenheck RA, Shaner A, et al. Veterans who may need a payee to prevent misuse of funds for drugs. Psychiatr Serv. 2002;53(8):995-1000.
10. Substance Abuse and Mental Health Services Administration. Key substance use and mental health indicators in the United States: results from the 2016 National Survey on Drug Use and Health. HHS Publication No. SMA 17-5044, NSDUH Series H-52. Rockville, MD: Center for Behavioral Health Statistics and Quality, Substance Abuse and Mental Health Services Administration. https://www.samhsa.gov/data/sites/default/files/NSDUH-FFR1-2016/NSDUH-FFR1-2016.pdf. Published September 2017. Accessed August 7, 2018.
11. Rubinsky AD, Chen C, Batki SL, et al. Comparative utilization of pharmacotherapy for alcohol use disorder and other psychiatric disorders among U.S. Veterans Health Administration patients with dual diagnoses. J Psychiatr Res. 2015;69:150-157.
12. McGovern MP, Lambert-Harris C, McHugo GJ, et al. Improving the dual diagnosis capability of addiction and mental health treatment services: implementation factors associated with program level changes. J Dual Diag. 2010;6:237-250.
13. Reno R. Maintaining quality of care in a comprehensive dual diagnosis treatment program. Psychiatr Serv. 2001;52(5):673-675.
14. McGovern MP, Lambert-Harris, Gotham HJ, et al. Dual diagnosis capability in mental health and addiction treatment services: an assessment of programs across multiple state systems. Adm Policy Ment Health. 2014;41(2):205-214.
15. Gotham HJ, Claus RE, Selig K, et al. Increasing program capabilities to provide treatment for co-occurring substance use and mental disorders: organizational characteristics. J Subs Abuse Treat. 2010;38(2):160-169.
16. Priester MA, Browne T, Iachini A, et al. Treatment access barriers and disparities among individuals with co-occurring mental health and substance use disorders: an integrative literature review. J Subst Abuse Treat. 2016;61:47-59.
17. Drake RE, Bond GR. Implementing integrated mental health and substance abuse services. J Dual Diagnosis. 2010;6(3-4):251-262.
18. Miele GM, Trautman KD, Hasin DS. Assessing comorbid mental and substance-use disorders: a guide for clinical practice. J Pract Psychiatry Behav Health. 1996;5:272-282.
19. Stinson FS, Grant BF, Dawson DA, et al. Comorbidity between DSM-IV alcohol and specific drug use disorders in the United States: Results from the National Epidemiologic Survey on Alcohol and Related Conditions. Drug Alcohol Depend. 2015;80(1):105-116.
20. Flynn PM, Brown BS. Co-occurring disorders in substance abuse treatment: Issues and prospects. J Subt Abuse Treat. 2008;34(1):36-47.
21. Grant BF, Stintson FS, Dawson DA, et al. Prevalence and co-occurrence of substance use disorders and independent mood and anxiety disorders. Arch Gen Psychiatry. 2004;61(8):807-816.
22. Pierre JM, Wirshing DA, Wirshing WC. “Iatrogenic malingering” in VA substance abuse treatment. Psych Services. 2003;54(2):253-254.
23. Pierre JM, Shnayder I, Wirshing DA, et al. Intranasal quetiapine abuse. Am J Psychiatry. 2004;161(9):1718.
24. Pierre JM. Hallucinations in non-psychotic disorders: Toward a differential diagnosis of “hearing voices.” Harv Rev Psychiatry. 2010;18(1):22-35.
25. Pierre JM. Nonantipsychotic therapy for monosymptomatic auditory hallucinations. Biol Psychiatry. 2010;68(7):e33-e34.
26. Shaner A, Roberts LJ, Eckman TA, et al. Sources of diagnostic uncertainty for chronically psychotic cocaine abusers. Psychiatr Serv. 1998;49(5):684-690.
27. Brown SA, Shuckit MA. Changes in depression among abstinent alcoholics. J Stud Alcohol. 1988;49(5):412-417.
28. Weddington WW, Brown BS, Haertzen CA, et al. Changes in mood, craving, and sleep during short-term abstinence reported by male cocaine addicts. A controlled, residential study. Arch Gen Psychiatry. 1990;47(9):861-868.
29. American Psychiatric Association. Diagnostic and statistical manual of mental disorders, 4th edition. Washington, DC: American Psychiatric Association; 1994:210.
30. Roush S, Monica C, Carpenter-Song E, et al. First-person perspectives on Dual Diagnosis Anonymous (DDA): a qualitative study. J Dual Diagnosis. 2015;11(2):136-141.
31. Klein JW. Pharmacotherapy for substance abuse disorders. Med Clin N Am. 2016;100(4):891-910.
32. Horgan CM, Reif S, Hodgkin D, et al. Availability of addiction medications in private health plans. J Subst Abuse Treat. 2008;34(2):147-156.
33. Frances RJ. The wrath of grapes versus the self-medication hypothesis. Harvard Rev Psychiatry. 1997;4(5):287-289.
34. Khantzian EJ. The self-medication hypothesis of substance use disorders: a reconsideration and recent applications. Harvard Rev Psychiatry. 1997;4(5):231-244.
35. Hall DH, Queener JE. Self-medication hypothesis of substance use: testing Khantzian’s updated theory. J Psychoactive Drugs. 2007;39(2):151-158.
36. Henwood B, Padgett DK. Reevaluating the self-medication hypothesis among the dually diagnosed. Am J Addict. 2007;16(3):160-165.
37. Lembke A. Time to abandon the self-medication hypothesis in patients with psychiatric disorders. Am J Drug Alc Abuse. 2012;38(6):524-529.
38. Wilkinson ST, Radhakrishnan R, D’Souza DC. A systematic review of the evidence for medical marijuana in psychiatric indications. J Clin Psychiatry. 2016;77(8):1050-1064.
39. Walsh Z, Gonzalez R, Crosby K, et al. Medical cannabis and mental health: a guided systematic review. Clin Psychol Rev. 2017;51:15-29.
40. Pierre JM. Risks of increasingly potent cannabis: the joint effects of potency and frequency. Current Psychiatry. 2017;16:14-20.
41. Zweben JE, Smith DE. Considerations in using psychotropic medication with dual diagnosis patients in recovery. J Psychoactive Drugs. 1989;21(2):221-228.

CBT for depression: What the evidence says
Major depressive disorder (MDD) has a devastating impact on individuals and society because of its high prevalence, its recurrent nature, its frequent comorbidity with other disorders, and the functional impairment it causes. Compared with other chronic diseases, such as arthritis, asthma, and diabetes, MDD produces the greatest decrement in health worldwide.1 The goals in treating MDD should be not just to reduce symptom severity but also to achieve continuing remission and lower the risk for relapse.2
Antidepressants are the most common treatment for depression.3 Among psychotherapies used to treat MDD, cognitive-behavioral therapy (CBT) has been identified as an effective treatment.4 Collaborative care models have been reported to manage MDD more effectively.5 In this article, we review the evidence supporting the use of CBT as monotherapy and in combination with antidepressants for acute and long-term treatment of MDD.
Acute treatment: Not too soon for CBT
Mild to moderate depression
Research has indicated that for the treatment of mild MDD, antidepressants are unlikely to be more effective than placebo.6,7 Studies also have reported that response to antidepressants begins to outpace response to placebo only when symptoms are no longer mild. Using antidepressants for patients with mild depression could therefore place them at risk of overtreatment.8 In keeping with these findings, the American Psychiatric Association (APA) has recommended the use of evidence-based psychotherapies, such as CBT, as an initial treatment choice for patients with mild to moderate MDD.9
Two recent studies have suggested that the combination of CBT plus antidepressants could boost improvement in psychosocial functioning for patients with mild MDD.10,11 However, neither study included a group of patients who received only CBT to evaluate if CBT alone could have also produced similar effects. Other limitations include the lack of a control group in one study and small sample sizes in both studies. However, both studies had a long follow-up period and specifically studied the impact on psychosocial functioning.
Moderate to severe depression
Earlier depression treatment guidelines suggested that antidepressants should be used to treat more severe depression, while psychotherapy should be used mainly for mild depression.12 This recommendation was influenced by the well-known National Institute of Mental Health (NIMH) Treatment of Depression Collaborative Research Program, a multicenter randomized controlled trial (RCT) that used a placebo control.13 In this study, CBT was compared with antidepressants and found to be no more effective than placebo for more severely depressed patients.13 However, this finding was not consistent across the 3 sites where the study was conducted; at the site where CBT was provided by more experienced CBT therapists, patients with more severe depression who received CBT fared as well as patients treated with antidepressants.14 A later double-blind RCT that used experienced therapists found that CBT was as effective as antidepressants (monoamine oxidase inhibitors), and both treatments were superior to placebo in reducing symptoms of atypical depression.15
Another placebo-controlled RCT conducted at 2 sites found that CBT was as effective as antidepressants in the treatment of moderately to severely depressed patients. As in the NIMH Treatment of Depression Collaborative Research Program trial,13 in this study, there were indications that the results were dependent on therapist experience.16 These findings suggest that the experience of the therapist is an important factor.
A recent meta-analysis of treatments of the acute phase of MDD compared 11 RCTs of CBT and second-generation antidepressants (selective serotonin reuptake inhibitors, serotonin-norepinephrine reuptake inhibitors, and other medications with related mechanisms of action).17 It found that as a first-step treatment, CBT and antidepressants had a similar impact on symptom relief in patients with moderate to severe depression. Patients treated with antidepressants also had a higher risk of experiencing adverse events or discontinuing treatment because of adverse events. However, this meta-analysis included trials that had methodological shortcomings, which reduces the strength of these conclusions.
Continue to: Patients with MDD and comorbid personality disorders have been...
Patients with MDD and comorbid personality disorders have been reported to have poorer outcomes, regardless of the treatment used.18 Fournier et al19 examined the impact of antidepressants and CBT in moderately to severely depressed patients with and without a personality disorder. They found that a combination of antidepressants and CBT was suitable for patients with personality disorders because antidepressants would boost the initial response and CBT would help sustain improvement in the long term.
Presently, the APA suggests that the combination of psychotherapy and antidepressants may be used as an initial treatment for patients with moderate to severe MDD.9 As research brings to light other factors that affect treatment outcomes, these guidelines could change.
Table 110,11,15,16 summarizes the findings of select studies evaluating the use of CBT for the acute treatment of depression.

CBT’s role in long-term treatment
Recurrence and relapse are major problems associated with MDD. The large majority of individuals who experience an episode of depression go on to experience more episodes of depression,20 and the risk of recurrence increases after each successive episode.21
To reduce the risk of relapse and the return of symptoms, it is recommended that patients treated with antidepressants continue pharmacotherapy for 4 to 9 months after remission.9 Maintenance pharmacotherapy, which involves keeping patients on antidepressants beyond the point of recovery, is intended to reduce the risk of recurrence, and is standard treatment for patients with chronic or recurrent MDD.22 However, this preventive effect exists only while the patient continues to take the medication. Rates of symptom recurrence following medication withdrawal are often high regardless of how long patients have taken medications.23
Continue to: Studies examining CBT as a maintenance treatment...
Studies examining CBT as a maintenance treatment—provided alone or in combination with or sequentially with antidepressants—have found it has an enduring effect that extends beyond the end of treatment and equals the impact of continuing antidepressants.24-27 A recent meta-analysis of 10 trials where CBT had been provided to patients after acute treatment found that the risk of relapse was reduced by 21% in the first year and by 28% in the first 2 years.28
Studies have compared the prophylactic impact of maintenance CBT and antidepressants. In an early study, 40 patients who had been successfully treated with antidepressants but had residual symptoms were randomly assigned to 20 weeks of CBT or to clinical management.29 By the end of 20 weeks, patients were tapered off their antidepressant. All patients were then followed for 2 years, during which time they received no treatment. At the 2-year follow-up, the CBT group had a relapse rate of 25%, compared with 80% in the antidepressant group.29 Weaknesses of this study include a small sample size, and the fact that a single therapist provided the CBT.
This study was extended to a 6-year follow-up; antidepressants were prescribed only to patients who relapsed. The CBT group continued to have a significantly lower relapse rate (40%) compared with the antidepressant group (90%).30
In another RCT, patients with depression who had recovered with CBT or medication continued with the same treatment during a maintenance phase.26 The CBT group received 3 booster sessions during the next year and antidepressant group received medication. At the end of the second year (without CBT or medication) CBT patients were less likely to relapse compared with patients receiving antidepressants. The adjusted relapse rates were 17.3% for CBT and 53.6% for antidepressants.26
An RCT that included 452 patients with severe depression used a long intervention period (up to 42 weeks) and a flexible treatment algorithm to more closely model the strategies used in clinical practice.31 Patients were randomly assigned to antidepressants only or in combination with CBT. At the end of 12 months, outcome assessment by blinded interviewers indicated that patients with more severe depression were more likely to benefit from the combination of antidepressants and CBT (76.9% vs 60.3%) and those with severe, non-chronic depression received the most benefit (79.5% vs 62.8%). The lack of a CBT-only group limits the generalizability of these findings. Neither patients nor clinicians were blinded to the treatment assignment, which is a common limitation in psychotherapy studies but could have contributed to the finding that combined treatment was more effective.
Continue to: Some evidence suggests...
Some evidence suggests that augmenting treatment as usual (TAU) with CBT can have a resilient protective impact that also intensifies with the number of depressive episodes experienced. In an RCT, 172 patients with depression in remission were randomly assigned to TAU or to TAU augmented with CBT.32 The time to recurrence was assessed over the course of 10 years. Augmenting TAU with CBT had a significant protective impact that was greater for patients who had >3 previous episodes.32
Another long-term study assessed the longitudinal course of 158 patients who received CBT, medication, and clinical management, or medication and clinical management alone.33 Patients were followed 6 years after randomization (4.5 years after completion of CBT). Researchers found the effects of CBT in preventing relapse and recurrence persisted for several years.33
Table 224,26,29-32 summarizes the findings of select studies evaluating the use of CBT for the long-term treatment of depression.

Limitations of long-term studies
Studies that have examined the efficacy of adding CBT to antidepressants in the continuation and maintenance treatment of patients with MDD have had some limitations. The definitions of relapse and recurrence have not always been clearly delineated in all studies. This is important because recurrence rates tend to be lower, and long-term follow-up would be needed to detect multiple recurrences so that their incidence is not underestimated. In addition, the types of CBT interventions utilized has varied across studies. Some studies have employed standard interventions such as cognitive restructuring, while others have added strategies that focus on enhancing memories for positive experiences or interventions to encourage medication adherence. Despite these limitations, research has shown promising results and suggests that adding CBT to the maintenance treatment of patients with depression—with or without antidepressants—is likely to reduce the rate of relapse and recurrence.
Consider CBT for all depressed patients
Research indicates that CBT can be the preferred treatment for patients with mild to moderate MDD. Antidepressants significantly reduce depressive symptoms in patients with moderate to severe MDD. Some research suggests that CBT can be as effective as antidepressants for moderate and severe MDD. However, as the severity and chronicity of depression increase, other moderating factors need to be considered. The expertise of the CBT therapist has an impact on outcomes. Treatment protocols that utilize CBT plus antidepressants are likely to be more effective than CBT or antidepressants alone. Incorporating CBT in the acute phase of depression treatment, with or without antidepressants, can have a long-term impact. For maintenance treatment, CBT alone and CBT plus antidepressants have been found to help sustain remission.
Continue to: Bottom Line
Bottom Line
Cognitive-behavioral therapy (CBT) can be an effective treatment for patients with major depressive disorder, regardless of symptom severity. The expertise of the clinician who provides CBT has a substantial impact on outcomes. Combination treatment with CBT plus antidepressants is more likely to be effective than either treatment alone.
Related Resources
- Flynn HA, Warren R. Using CBT effectively for treating depression and anxiety. Current Psychiatry. 2014;13(6):45-53.
- Ijaz S, Davies P, Williams CJ, et al. Psychological therapies for treatment-resistant depression in adults. Cochrane Database Syst Rev. 2018;5:CD010558.
1. Moussavi S, Chatterji S, Verdes E, et al. Depression, chronic diseases, and decrements in health: results from the World Health Surveys. Lancet. 2007;370(9590):851-858.
2. Keller MB. Past, present, and future directions for defining optimal treatment outcome in depression: remission and beyond. JAMA. 2003;289(23):3152-3160.
3. Marcus SC, Olfson M. National trends in the treatment for depression from 1998 to 2007. Arch Gen Psychiatry. 2010;67(12):1265-1273.
4. Chambless DL, Ollendick TH. Empirically supported psychological interventions: controversies and evidence. Annu Rev Psychol. 2001;52:685-716.
5. Oxman TE, Dietrich AJ, Schulberg HC. Evidence-based models of integrated management of depression in primary care. Psychiatr Clin North Am. 2005;28(4):1061-1077.
6. Fournier JC, DeRubeis RJ, Hollon SD, et al. Antidepressant drug effects and depression severity: a patient-level meta-analysis. JAMA. 2010;303(1):47-53.
7. Paykel ES, Hollyman JA, Freeling P, et al. Predictors of therapeutic benefit from amitriptyline in mild depression: a general practice placebo-controlled trial. J Affect Disord. 1988;14(1):83-95
8. Marcus SC, Olfson M. National trends in the treatment for depression from 1998 to 2007. Arch Gen Psychiatry. 2010;67(12):1265-1273.
9. Practice guideline for the treatment of patients with major depressive disorder, 3rd ed. Arlington, VA: American Psychiatric Association; 2010.
10. Zhang B, Ding X, Lu W, et al. Effect of group cognitive-behavioral therapy on the quality of life and social functioning of patients with mild depression. Shanghai Arch Psychiatry. 2016;28(1):18-27.
11. Matsunaga M, Okamoto Y, Suzuki S et.al. Psychosocial functioning in patients with treatment-resistant depression after group cognitive behavioral therapy. BMC Psychiatry. 2010;10:22.
12. American Psychiatric Association. Practice Guideline for Major Depressive Disorder in Adults. Am J Psychiatry. 1993;150(suppl 4):1-26.
13. Elkin I, Shea MT, Watkins JT, et al. National Institute of Mental Health Treatment of Depression Collaborative Research Program. General effectiveness of treatments. Arch Gen Psychiatry. 1989;46(11):971-982; discussion 983.
14. Jacobson NS, Hollon SD. Prospects for future comparisons between drugs and psychotherapy: lessons from the CBT-versus-pharmacotherapy exchange. J Consult Clin Psychol. 1996;64(1):104-108.
15. Jarrett RB, Schaffer M, McIntire D, et al. Treatment of atypical depression with cognitive therapy or phenelzine: a double-blind, placebo-controlled trial. Arch Gen Psychiatry. 1999;56(5):431-437.
16. DeRubeis RJ, Hollon SD, Amsterdam JD, et al. Cognitive therapy vs medications in the treatment of moderate to severe depression. Arch Gen Psychiatry. 2005;62(4):409-416.
17. Amick HR, Gartlehner G, Gaynes BN, et al. Comparative benefits and harms of second generation antidepressants and cognitive behavioral therapies in initial treatment of major depressive disorder: systematic review and meta-analysis. BMJ. 2015;351:h6019. doi: 10.1136/bmj.h6019.
18. Newton-Howes G, Tyrer P, Johnson T. Personality disorder and the outcome of depression: meta-analysis of published studies. Br J Psychiatry. 2006;188(1):13-20.
19. Fournier JC, DeRubeis RJ, Shelton RC, et al. Antidepressant medications v. cognitive therapy in people with depression with or without personality disorder. Br J Psychiatry. 2008;192(2):124-129.
20. Mueller TI, Leon AC, Keller MB, et al. Recurrence after recovery from major depressive disorder during 15 years of observational follow-up. Am J Psychiatry. 1999;156(7):1000-1006.
21. Solomon DA, Keller MB, Leon AC, et al. Multiple recurrences of major depressive disorder. Am J Psychiatry. 2000;157(2):229-233.
22. Frank E, Prien RF, Jarrett RB, et al. Conceptualization and rationale for consensus definitions of terms in major depressive disorder. Remission, recovery, relapse, and recurrence. Arch Gen Psychiatry. 1991;48(9):851-855.
23. Thase ME. Relapse and recurrence of depression: an updated practical approach for prevention. In: Palmer KJ, ed. Drug treatment issues in depression. Auckland, New Zealand: Adis International; 2000:35-52.
24. Evans MD, Hollon, SD, DeRubeis RJ, et al. Differential relapse following cognitive therapy and pharmacotherapy for depression. Arch Gen Psychiatry. 1992;49(10):802-808.
25. Vittengal JR, Clark LA, Dunn TW, et al. Reducing relapse and recurrence in unipolar depression: a comparative meta-analysis of cognitive-behavioral therapy’s effects. J Consult Clin Psychol. 2007;75(3):475-488.
26. Hollon SD, DeRubeis RJ, Shelton RC, et al. Prevention of relapse following cognitive therapy vs medications in moderate to severe depression. Arch Gen Psychiatry. 2005;62(4):417-422.
27. Paykel ES, Scott J, Teasdale JD, et al. Prevention of relapse in residual depression by cognitive therapy: a controlled trial. Arch Gen Psychiatry. 1999;56(9):829-835.
28. Clarke K, Mayo-Wilson E, Kenny J, et al. Can non-pharmacological interventions prevent relapse in adults who have recovered from depression? A systematic review and meta-analysis of randomised controlled trials. Clin Psychol Rev. 2015;39:58-70.
29. Fava GA, Rafanelli C, Grandi, S, et al. Prevention of recurrent depression with cognitive behavioral therapy: preliminary findings. Arch Gen Psychiatry. 1998;55(9):816-820.
30. Fava GA, Ruini C, Rafanelli C, et al. Six-year outcome of cognitive behavior therapy for prevention of recurrent depression. Am J Psychiatry. 2004;161(10):1872-1876.
31. Hollon SD, DeRubeis RJ, Fawcett J, et al. Effect of cognitive therapy with antidepressant medications vs antidepressants alone on the rate of recovery in major depressive disorder: a randomized clinical trial. JAMA Psychiatry. 2014;71(10):1157-1164.
32. Bockting CL, Smid NH, Koeter MW, et al. Enduring effects of preventive cognitive therapy in adults remitted from recurrent depression: a 10 year follow-up of a randomized controlled trial. J Affect Disord. 2015;185:188-194.
33. Paykel ES, Scott J, Cornwall PL, et al. Duration of relapse prevention after cognitive therapy in residual depression: follow-up of controlled trial. Psychol Med. 2005;35(1):59-68.
Major depressive disorder (MDD) has a devastating impact on individuals and society because of its high prevalence, its recurrent nature, its frequent comorbidity with other disorders, and the functional impairment it causes. Compared with other chronic diseases, such as arthritis, asthma, and diabetes, MDD produces the greatest decrement in health worldwide.1 The goals in treating MDD should be not just to reduce symptom severity but also to achieve continuing remission and lower the risk for relapse.2
Antidepressants are the most common treatment for depression.3 Among psychotherapies used to treat MDD, cognitive-behavioral therapy (CBT) has been identified as an effective treatment.4 Collaborative care models have been reported to manage MDD more effectively.5 In this article, we review the evidence supporting the use of CBT as monotherapy and in combination with antidepressants for acute and long-term treatment of MDD.
Acute treatment: Not too soon for CBT
Mild to moderate depression
Research has indicated that for the treatment of mild MDD, antidepressants are unlikely to be more effective than placebo.6,7 Studies also have reported that response to antidepressants begins to outpace response to placebo only when symptoms are no longer mild. Using antidepressants for patients with mild depression could therefore place them at risk of overtreatment.8 In keeping with these findings, the American Psychiatric Association (APA) has recommended the use of evidence-based psychotherapies, such as CBT, as an initial treatment choice for patients with mild to moderate MDD.9
Two recent studies have suggested that the combination of CBT plus antidepressants could boost improvement in psychosocial functioning for patients with mild MDD.10,11 However, neither study included a group of patients who received only CBT to evaluate if CBT alone could have also produced similar effects. Other limitations include the lack of a control group in one study and small sample sizes in both studies. However, both studies had a long follow-up period and specifically studied the impact on psychosocial functioning.
Moderate to severe depression
Earlier depression treatment guidelines suggested that antidepressants should be used to treat more severe depression, while psychotherapy should be used mainly for mild depression.12 This recommendation was influenced by the well-known National Institute of Mental Health (NIMH) Treatment of Depression Collaborative Research Program, a multicenter randomized controlled trial (RCT) that used a placebo control.13 In this study, CBT was compared with antidepressants and found to be no more effective than placebo for more severely depressed patients.13 However, this finding was not consistent across the 3 sites where the study was conducted; at the site where CBT was provided by more experienced CBT therapists, patients with more severe depression who received CBT fared as well as patients treated with antidepressants.14 A later double-blind RCT that used experienced therapists found that CBT was as effective as antidepressants (monoamine oxidase inhibitors), and both treatments were superior to placebo in reducing symptoms of atypical depression.15
Another placebo-controlled RCT conducted at 2 sites found that CBT was as effective as antidepressants in the treatment of moderately to severely depressed patients. As in the NIMH Treatment of Depression Collaborative Research Program trial,13 in this study, there were indications that the results were dependent on therapist experience.16 These findings suggest that the experience of the therapist is an important factor.
A recent meta-analysis of treatments of the acute phase of MDD compared 11 RCTs of CBT and second-generation antidepressants (selective serotonin reuptake inhibitors, serotonin-norepinephrine reuptake inhibitors, and other medications with related mechanisms of action).17 It found that as a first-step treatment, CBT and antidepressants had a similar impact on symptom relief in patients with moderate to severe depression. Patients treated with antidepressants also had a higher risk of experiencing adverse events or discontinuing treatment because of adverse events. However, this meta-analysis included trials that had methodological shortcomings, which reduces the strength of these conclusions.
Continue to: Patients with MDD and comorbid personality disorders have been...
Patients with MDD and comorbid personality disorders have been reported to have poorer outcomes, regardless of the treatment used.18 Fournier et al19 examined the impact of antidepressants and CBT in moderately to severely depressed patients with and without a personality disorder. They found that a combination of antidepressants and CBT was suitable for patients with personality disorders because antidepressants would boost the initial response and CBT would help sustain improvement in the long term.
Presently, the APA suggests that the combination of psychotherapy and antidepressants may be used as an initial treatment for patients with moderate to severe MDD.9 As research brings to light other factors that affect treatment outcomes, these guidelines could change.
Table 110,11,15,16 summarizes the findings of select studies evaluating the use of CBT for the acute treatment of depression.
CBT’s role in long-term treatment
Recurrence and relapse are major problems associated with MDD. The large majority of individuals who experience an episode of depression go on to experience more episodes of depression,20 and the risk of recurrence increases after each successive episode.21
To reduce the risk of relapse and the return of symptoms, it is recommended that patients treated with antidepressants continue pharmacotherapy for 4 to 9 months after remission.9 Maintenance pharmacotherapy, which involves keeping patients on antidepressants beyond the point of recovery, is intended to reduce the risk of recurrence, and is standard treatment for patients with chronic or recurrent MDD.22 However, this preventive effect exists only while the patient continues to take the medication. Rates of symptom recurrence following medication withdrawal are often high regardless of how long patients have taken medications.23
Continue to: Studies examining CBT as a maintenance treatment...
Studies examining CBT as a maintenance treatment—provided alone or in combination with or sequentially with antidepressants—have found it has an enduring effect that extends beyond the end of treatment and equals the impact of continuing antidepressants.24-27 A recent meta-analysis of 10 trials where CBT had been provided to patients after acute treatment found that the risk of relapse was reduced by 21% in the first year and by 28% in the first 2 years.28
Studies have compared the prophylactic impact of maintenance CBT and antidepressants. In an early study, 40 patients who had been successfully treated with antidepressants but had residual symptoms were randomly assigned to 20 weeks of CBT or to clinical management.29 By the end of 20 weeks, patients were tapered off their antidepressant. All patients were then followed for 2 years, during which time they received no treatment. At the 2-year follow-up, the CBT group had a relapse rate of 25%, compared with 80% in the antidepressant group.29 Weaknesses of this study include a small sample size, and the fact that a single therapist provided the CBT.
This study was extended to a 6-year follow-up; antidepressants were prescribed only to patients who relapsed. The CBT group continued to have a significantly lower relapse rate (40%) compared with the antidepressant group (90%).30
In another RCT, patients with depression who had recovered with CBT or medication continued with the same treatment during a maintenance phase.26 The CBT group received 3 booster sessions during the next year and antidepressant group received medication. At the end of the second year (without CBT or medication) CBT patients were less likely to relapse compared with patients receiving antidepressants. The adjusted relapse rates were 17.3% for CBT and 53.6% for antidepressants.26
An RCT that included 452 patients with severe depression used a long intervention period (up to 42 weeks) and a flexible treatment algorithm to more closely model the strategies used in clinical practice.31 Patients were randomly assigned to antidepressants only or in combination with CBT. At the end of 12 months, outcome assessment by blinded interviewers indicated that patients with more severe depression were more likely to benefit from the combination of antidepressants and CBT (76.9% vs 60.3%) and those with severe, non-chronic depression received the most benefit (79.5% vs 62.8%). The lack of a CBT-only group limits the generalizability of these findings. Neither patients nor clinicians were blinded to the treatment assignment, which is a common limitation in psychotherapy studies but could have contributed to the finding that combined treatment was more effective.
Continue to: Some evidence suggests...
Some evidence suggests that augmenting treatment as usual (TAU) with CBT can have a resilient protective impact that also intensifies with the number of depressive episodes experienced. In an RCT, 172 patients with depression in remission were randomly assigned to TAU or to TAU augmented with CBT.32 The time to recurrence was assessed over the course of 10 years. Augmenting TAU with CBT had a significant protective impact that was greater for patients who had >3 previous episodes.32
Another long-term study assessed the longitudinal course of 158 patients who received CBT, medication, and clinical management, or medication and clinical management alone.33 Patients were followed 6 years after randomization (4.5 years after completion of CBT). Researchers found the effects of CBT in preventing relapse and recurrence persisted for several years.33
Table 224,26,29-32 summarizes the findings of select studies evaluating the use of CBT for the long-term treatment of depression.
Limitations of long-term studies
Studies that have examined the efficacy of adding CBT to antidepressants in the continuation and maintenance treatment of patients with MDD have had some limitations. The definitions of relapse and recurrence have not always been clearly delineated in all studies. This is important because recurrence rates tend to be lower, and long-term follow-up would be needed to detect multiple recurrences so that their incidence is not underestimated. In addition, the types of CBT interventions utilized has varied across studies. Some studies have employed standard interventions such as cognitive restructuring, while others have added strategies that focus on enhancing memories for positive experiences or interventions to encourage medication adherence. Despite these limitations, research has shown promising results and suggests that adding CBT to the maintenance treatment of patients with depression—with or without antidepressants—is likely to reduce the rate of relapse and recurrence.
Consider CBT for all depressed patients
Research indicates that CBT can be the preferred treatment for patients with mild to moderate MDD. Antidepressants significantly reduce depressive symptoms in patients with moderate to severe MDD. Some research suggests that CBT can be as effective as antidepressants for moderate and severe MDD. However, as the severity and chronicity of depression increase, other moderating factors need to be considered. The expertise of the CBT therapist has an impact on outcomes. Treatment protocols that utilize CBT plus antidepressants are likely to be more effective than CBT or antidepressants alone. Incorporating CBT in the acute phase of depression treatment, with or without antidepressants, can have a long-term impact. For maintenance treatment, CBT alone and CBT plus antidepressants have been found to help sustain remission.
Continue to: Bottom Line
Bottom Line
Cognitive-behavioral therapy (CBT) can be an effective treatment for patients with major depressive disorder, regardless of symptom severity. The expertise of the clinician who provides CBT has a substantial impact on outcomes. Combination treatment with CBT plus antidepressants is more likely to be effective than either treatment alone.
Related Resources
- Flynn HA, Warren R. Using CBT effectively for treating depression and anxiety. Current Psychiatry. 2014;13(6):45-53.
- Ijaz S, Davies P, Williams CJ, et al. Psychological therapies for treatment-resistant depression in adults. Cochrane Database Syst Rev. 2018;5:CD010558.
1. Moussavi S, Chatterji S, Verdes E, et al. Depression, chronic diseases, and decrements in health: results from the World Health Surveys. Lancet. 2007;370(9590):851-858.
2. Keller MB. Past, present, and future directions for defining optimal treatment outcome in depression: remission and beyond. JAMA. 2003;289(23):3152-3160.
3. Marcus SC, Olfson M. National trends in the treatment for depression from 1998 to 2007. Arch Gen Psychiatry. 2010;67(12):1265-1273.
4. Chambless DL, Ollendick TH. Empirically supported psychological interventions: controversies and evidence. Annu Rev Psychol. 2001;52:685-716.
5. Oxman TE, Dietrich AJ, Schulberg HC. Evidence-based models of integrated management of depression in primary care. Psychiatr Clin North Am. 2005;28(4):1061-1077.
6. Fournier JC, DeRubeis RJ, Hollon SD, et al. Antidepressant drug effects and depression severity: a patient-level meta-analysis. JAMA. 2010;303(1):47-53.
7. Paykel ES, Hollyman JA, Freeling P, et al. Predictors of therapeutic benefit from amitriptyline in mild depression: a general practice placebo-controlled trial. J Affect Disord. 1988;14(1):83-95
8. Marcus SC, Olfson M. National trends in the treatment for depression from 1998 to 2007. Arch Gen Psychiatry. 2010;67(12):1265-1273.
9. Practice guideline for the treatment of patients with major depressive disorder, 3rd ed. Arlington, VA: American Psychiatric Association; 2010.
10. Zhang B, Ding X, Lu W, et al. Effect of group cognitive-behavioral therapy on the quality of life and social functioning of patients with mild depression. Shanghai Arch Psychiatry. 2016;28(1):18-27.
11. Matsunaga M, Okamoto Y, Suzuki S et.al. Psychosocial functioning in patients with treatment-resistant depression after group cognitive behavioral therapy. BMC Psychiatry. 2010;10:22.
12. American Psychiatric Association. Practice Guideline for Major Depressive Disorder in Adults. Am J Psychiatry. 1993;150(suppl 4):1-26.
13. Elkin I, Shea MT, Watkins JT, et al. National Institute of Mental Health Treatment of Depression Collaborative Research Program. General effectiveness of treatments. Arch Gen Psychiatry. 1989;46(11):971-982; discussion 983.
14. Jacobson NS, Hollon SD. Prospects for future comparisons between drugs and psychotherapy: lessons from the CBT-versus-pharmacotherapy exchange. J Consult Clin Psychol. 1996;64(1):104-108.
15. Jarrett RB, Schaffer M, McIntire D, et al. Treatment of atypical depression with cognitive therapy or phenelzine: a double-blind, placebo-controlled trial. Arch Gen Psychiatry. 1999;56(5):431-437.
16. DeRubeis RJ, Hollon SD, Amsterdam JD, et al. Cognitive therapy vs medications in the treatment of moderate to severe depression. Arch Gen Psychiatry. 2005;62(4):409-416.
17. Amick HR, Gartlehner G, Gaynes BN, et al. Comparative benefits and harms of second generation antidepressants and cognitive behavioral therapies in initial treatment of major depressive disorder: systematic review and meta-analysis. BMJ. 2015;351:h6019. doi: 10.1136/bmj.h6019.
18. Newton-Howes G, Tyrer P, Johnson T. Personality disorder and the outcome of depression: meta-analysis of published studies. Br J Psychiatry. 2006;188(1):13-20.
19. Fournier JC, DeRubeis RJ, Shelton RC, et al. Antidepressant medications v. cognitive therapy in people with depression with or without personality disorder. Br J Psychiatry. 2008;192(2):124-129.
20. Mueller TI, Leon AC, Keller MB, et al. Recurrence after recovery from major depressive disorder during 15 years of observational follow-up. Am J Psychiatry. 1999;156(7):1000-1006.
21. Solomon DA, Keller MB, Leon AC, et al. Multiple recurrences of major depressive disorder. Am J Psychiatry. 2000;157(2):229-233.
22. Frank E, Prien RF, Jarrett RB, et al. Conceptualization and rationale for consensus definitions of terms in major depressive disorder. Remission, recovery, relapse, and recurrence. Arch Gen Psychiatry. 1991;48(9):851-855.
23. Thase ME. Relapse and recurrence of depression: an updated practical approach for prevention. In: Palmer KJ, ed. Drug treatment issues in depression. Auckland, New Zealand: Adis International; 2000:35-52.
24. Evans MD, Hollon, SD, DeRubeis RJ, et al. Differential relapse following cognitive therapy and pharmacotherapy for depression. Arch Gen Psychiatry. 1992;49(10):802-808.
25. Vittengal JR, Clark LA, Dunn TW, et al. Reducing relapse and recurrence in unipolar depression: a comparative meta-analysis of cognitive-behavioral therapy’s effects. J Consult Clin Psychol. 2007;75(3):475-488.
26. Hollon SD, DeRubeis RJ, Shelton RC, et al. Prevention of relapse following cognitive therapy vs medications in moderate to severe depression. Arch Gen Psychiatry. 2005;62(4):417-422.
27. Paykel ES, Scott J, Teasdale JD, et al. Prevention of relapse in residual depression by cognitive therapy: a controlled trial. Arch Gen Psychiatry. 1999;56(9):829-835.
28. Clarke K, Mayo-Wilson E, Kenny J, et al. Can non-pharmacological interventions prevent relapse in adults who have recovered from depression? A systematic review and meta-analysis of randomised controlled trials. Clin Psychol Rev. 2015;39:58-70.
29. Fava GA, Rafanelli C, Grandi, S, et al. Prevention of recurrent depression with cognitive behavioral therapy: preliminary findings. Arch Gen Psychiatry. 1998;55(9):816-820.
30. Fava GA, Ruini C, Rafanelli C, et al. Six-year outcome of cognitive behavior therapy for prevention of recurrent depression. Am J Psychiatry. 2004;161(10):1872-1876.
31. Hollon SD, DeRubeis RJ, Fawcett J, et al. Effect of cognitive therapy with antidepressant medications vs antidepressants alone on the rate of recovery in major depressive disorder: a randomized clinical trial. JAMA Psychiatry. 2014;71(10):1157-1164.
32. Bockting CL, Smid NH, Koeter MW, et al. Enduring effects of preventive cognitive therapy in adults remitted from recurrent depression: a 10 year follow-up of a randomized controlled trial. J Affect Disord. 2015;185:188-194.
33. Paykel ES, Scott J, Cornwall PL, et al. Duration of relapse prevention after cognitive therapy in residual depression: follow-up of controlled trial. Psychol Med. 2005;35(1):59-68.
