User login
Bringing you the latest news, research and reviews, exclusive interviews, podcasts, quizzes, and more.
div[contains(@class, 'header__large-screen')]
div[contains(@class, 'read-next-article')]
div[contains(@class, 'nav-primary')]
nav[contains(@class, 'nav-primary')]
section[contains(@class, 'footer-nav-section-wrapper')]
footer[@id='footer']
div[contains(@class, 'main-prefix')]
section[contains(@class, 'nav-hidden')]
div[contains(@class, 'ce-card-content')]
nav[contains(@class, 'nav-ce-stack')]
COVID-19 in children: Weekly cases drop to 6-month low
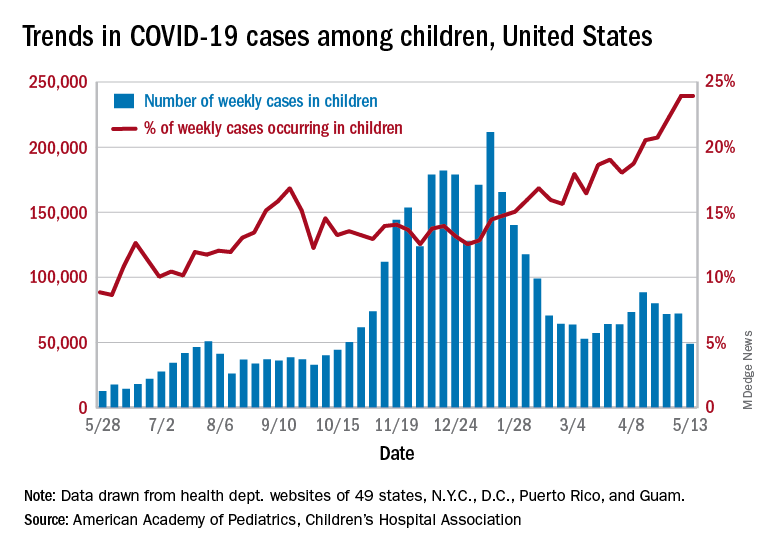
Just 1 week after it looked like the COVID-19 situation in children might be taking another turn for the worse, the number of new pediatric cases dropped to its lowest level since October, according to a report from the American Academy of Pediatrics and the Children’s Hospital Association.
the AAP and CHA said in their weekly COVID-19 report. During the week of April 30 to May 6 – the same week Rhode Island reported a large backlog of cases and increased its total by 30% – the number of new cases went up slightly after 2 weeks of declines.
Other positive indicators come in the form of the proportion of cases occurring in children. The cumulative percentage of cases in children since the start of the pandemic remained at 14.0% for a second consecutive week, and the proportion of new cases in children held at 24.0% and did not increase for the first time in 6 weeks, based on data from 49 states (excluding New York), the District of Columbia, New York City, Puerto Rico, and Guam.
The total number of child COVID-19 cases reported in these jurisdictions is now up to 3.9 million, for a cumulative rate of 5,187 cases per 100,000 children in the United States. Among the states, total counts range from a low of 4,070 in Hawaii to 475,619 in California. Hawaii also has the lowest rate at 1,357 per 100,000 children, while the highest, 9,778 per 100,000, can be found in Rhode Island, the AAP and CHA said.
Deaths in children continue to accumulate at a relatively slow pace, with two more added during the week of May 7-13, bringing the total to 308 for the entire pandemic in 43 states, New York City, Puerto Rico, and Guam. Children’s share of the mortality burden is currently 0.06%, a figure that has not changed since mid-December, and the death rate for children with COVID-19 is 0.01%, according to the report.
Almost two-thirds (65%) of all deaths have occurred in just nine states – Arizona (31), California (21), Colorado (13), Georgia (10), Illinois (18), Maryland (10), Pennsylvania (10), Tennessee (10), and Texas (52) – and New York City (24), while eight states have not reported any deaths yet, the two groups said.
Dr. Fauci: Extraordinary challenges, scientific triumphs with COVID-19
“Vaccines have been the bright light of this extraordinary challenge that we’ve gone through,” said Anthony S. Fauci, MD, director of the National Institute of Allergy and Infectious Diseases.
In an address for the opening ceremony of the American Thoracic Society’s virtual international conference, Dr. Fauci emphasized the role of basic and clinical research and government support for science in helping turn the tide of the COVID-19 pandemic.
“A few weeks ago, I wrote an editorial in Science, because there was some misunderstanding about how and why we were able to go from a realization of a new pathogen in January of 2020, to getting doses of vaccines in the arms of individuals – a highly efficacious vaccine – 11 months later. Truly, an unprecedented accomplishment,” he said.
“But as I said in the editorial, the speed and efficiency with which these highly efficacious vaccines were developed, and their potential for saving millions of lives, are due to an extraordinary multidisciplinary effort, involving basic, preclinical, and clinical science that had been underway – out of the spotlight – for decades and decades before the unfolding of the COVID-19 pandemic, a fact that very few people really appreciate: namely, the importance of investment in biomedical research.”
The general addresses the troops
Perhaps no other audience is so well suited to receive Dr. Fauci’s speech as those who are currently attending (virtually) the ATS conference, including researchers who scrutinize the virus from every angle to describe its workings and identify its vulnerabilities, epidemiologists who study viral transmission and look for ways to thwart it, public health workers who fan out to communities across the country to push vaccine acceptance, and clinicians who specialize in critical care and pulmonary medicine, many of whom staff the respiratory floors and intensive care units where the most severely ill patients are treated.
Speaking about the lessons learned and challenges remaining from the COVID-19 pandemic, Dr. Fauci briefly reviewed the epidemiology, virology and transmission, diagnostics, and clinical course of SARS-CoV-2 infections and the therapeutics and vaccines for COVID-19.
Epidemiology
The pandemic began in December 2019 with recognition of a novel type of pneumonia in the Wuhan District of Central China, Dr. Fauci noted.
“Very quickly thereafter, in the first week of January 2020, the Chinese identified a new strain of coronavirus as [the] source of the outbreak. Fast forward to where we are right now: We have experienced and are experiencing the most devastating pandemic of a respiratory illness in the last 102 years, with already approximately 160 million individuals having been infected – and this is clearly a gross undercounting – and also 3.3 million deaths, again, very likely an undercounting,” he said.
According to the Centers for Disease Control and Prevention, as of May 9, 2021, there were approximately 32.5 million cases of COVID-19 and 578,520 deaths in the United States. Those cases and deaths occurred largely in three surges in the United States, in early spring, early summer, and late fall of 2020.
Virology and transmission
SARS-CoV-2 is a beta-coronavirus in the same subgenus as SARS-CoV-1 and some bat coronaviruses, Dr. Fauci explained. The viral genome is large, about 30,000 kilobases, and it has four structural proteins, most importantly the S or “spike” protein that allows the virus to attach to and fuse with cell membranes by binding to the ACE2 receptor on tissues in the upper and lower respiratory tract, gastrointestinal tract, cardiovascular system, and other organ systems.
The virus is transmitted mainly through exposure to respiratory droplets within 6 feet of an infected person, or sometimes through droplets or particles that remain in the air over time and various distances.
Contact with contaminated surfaces, once feared as a means of transmission, is now understood to be less common.
The virus has been detected in stool, blood, semen, and ocular secretions, although the role of transmission through these sources is still unknown.
“Some very interesting characteristics of this virus, really quite unique compared to other viruses, certainly other respiratory viruses, is [that] about a third to 40% of people who are infected never develop any symptoms,” Dr. Fauci said. “Importantly, and very problematic to what we do to contain it – particularly with regard to identification, isolation, and contract tracing – between 50% and 60% of the transmissions occur either from someone who will never develop symptoms, or someone in the presymptomatic phase of disease.”
The fundamentals of preventing acquisition and transmission are as familiar to most Americans now as the Pledge of Allegiance: universal mask wearing, physical distancing, avoiding crowds and congregate settings, preference for outdoor over indoor settings, and frequent hand washing, he noted.
Diagnostics
Tests for SARS-CoV-2 infection fall into three basic categories: molecular tests such as polymerase chain reaction (PCR) that are highly specific and highly sensitive for actual infections, antigen tests that detect the viral protein rather than the nucleic acids, and antibody tests to detect serum proteins made in response to viral infection.
Antigen testing is used largely for broader surveillance of groups of individuals to detect viral penetrance within that group, Dr. Fauci noted.
Clinical course
The clinical course of COVID-19 has some interesting characteristics but is not substantially different from a flu-like syndrome, Dr. Fauci said.
Symptoms and signs common to both types of infections include fever, cough, fatigue, anorexia, dyspnea, and myalgias, but the loss of smell and/or taste preceding the onset of respiratory symptoms is a unique feature of COVID-19.
Dr. Fauci cited data on more than 44,000 individuals with confirmed COVID-19 in China that showed that a large majority (81%) of cases were mild or moderate in nature, but 14% of patients experienced severe disease, and 5% were critically ill. The case-fatality rate in this study was 2.3%.
People at increased risk for severe disease include older adults and those of any age with certain comorbidities.
Manifestations of severe COVID-19 infections in adults can include neurological disorders, hyperinflammation, acute respiratory distress syndrome, cardiac dysfunction, hypercoagulability, and acute kidney injury.
In children, COVID-19 has been associated with a multisystem inflammatory syndrome (MIS-C) similar to Kawasaki disease.
In a substantial number of cases, the effects of COVID-19 can linger for 6 months or longer, Dr. Fauci said, pointing to a study from the University of Washington in Seattle.
Investigators there found that approximately 30% of patients enrolled at their center reported persistent symptoms for as long as 9 months after the initial illness, with fatigue as the most commonly reported symptom. One-third of outpatients with mild disease also reported persistent symptoms.
Therapeutics
Therapeutics that are either approved by the Food and Drug Administration, have emergency use authorization, or are in clinical trials for early or moderate disease include remdesivir (Veklury, Gilead Sciences), monoclonal antibodies, convalescent plasma, antiviral agents, hyperimmune globulin, anticoagulants, and immunomodulators.
Options for moderate to severe to advanced disease include dexamethasone, baricitinib (Olumiant, Eli Lilly and Company) plus remdesivir, and immunomodulators such as infliximab (Remicade, Janssen Biotech), and biosimilars.
Vaccines
Finally, Dr. Fauci reviewed the current state of vaccines, including the three with emergency use authorization from the FDA as of this writing: two nucleic acid, messenger RNA-based (mRNA) vaccines from Moderna and Pfizer/BioNTech, and an adenoviral vector-based vaccine from Johnson & Johnson.
Other vaccines in development or in use elsewhere in the world include recombinant protein and adjuvant approaches by GlaxoSmithKline and Sanofi (in a phase 2 clinical trial launched in February 2021) and by Novavax.
The three vaccines in use in the United States were highly efficacious in both clinical trials, with efficacy of about 95% for the mRNA vaccines and 67% for the Johnson & Johnson vaccine.
The real-world performance of these vaccines has been even more impressive, however.
For example, the Johnson & Johnson vaccine had 72% efficacy at preventing moderate to severe COVID 19 in the United States, 68% in Brazil, and 64% in South Africa, and 85% efficacy against severe disease across all regions studied, Dr. Fauci said.
He cited a study of 22,234 employees of the University of Texas Southwestern Medical Center in Dallas who were vaccinated under a program started on Dec. 15, 2020. The COVID-19 infection rate among these vaccinated employees was 0.05%.
Dr. Fauci recounted the experience in Israel, where the highly transmissible B.1.1.7 strain of SARS-CoV-2 is predominant. A chart of the progress shows clearly that as the vaccine doses delivered steadily increased, the number of COVID-19 cases began a precipitous decline.
Horse race
Fittingly for a speech presented on the day that the Preakness Stakes – the second leg in thoroughbred racing’s Triple Crown – was run, Dr. Fauci closed with a cartoon showing two racehorses, labeled “SARS-CoV-2” and “Vaccines,” nearly neck-and-neck, but with vaccines having a slight lead.
“We are in a race against the virus. The vaccines, and the virus: If we vaccinate the overwhelming proportion of our population, we will without a doubt be able to crush the outbreak in the same way as we have done with other viral-borne diseases like measles, smallpox, and polio.
“So, the message is: Get vaccinated,” he concluded.
Long-term use of prescription sleep meds unsupported by new research
a new study shows.
“While there are good data from [randomized, controlled trials] that these medications improve sleep disturbances in the short term,” few studies have examined whether they provide long-term benefits, stated the authors of the paper, which was published in BMJ Open.
“The current observational study does not support use of sleep medications over the long term, as there were no self-reported differences at 1 or 2 years of follow-up comparing sleep medication users with nonusers,” author Daniel H. Solomon, MD, MPH, from Brigham and Women’s Hospital, Boston, and colleagues wrote.
Women included in the analysis were drawn from the Study of Women’s Health Across the Nation (SWAN), an ongoing multicenter, longitudinal study examining women during the menopausal transition. The average age of the women included in the cohort was 49.5 years and approximately half were White. All women reported a sleep disturbance on at least 3 nights per week during a 2-week interval. At follow up, women were asked to use a Likert scale to rate three aspects of sleep: difficulty initiating sleep, frequent awakening, and waking up early. On the scale, 1 represented having no difficulties on any nights, 3 represented having difficulties 1-2 nights per week, and 5 represented having difficulty 5-7 nights per week.
Women already using prescription sleep medication at their baseline visit were excluded from the study. Medications used included benzodiazepines, selective BZD receptor agonists, and other hypnotics.
Over the 21 years of follow-up in the SWAN study (1995-2016), Dr. Solomon and colleagues identified 238 women using sleep medication and these were compared with a cohort of 447 propensity score–matched non–sleep medication uses. Overall, the 685 women included were similar in characteristics to each other as well as to the other potentially eligible women not included in the analysis.
Sleep disturbance patterns compared
At baseline, sleep disturbance patterns were similar between the two groups. Among medication users, the mean score for difficulty initiating sleep was 2.7 (95% confidence interval, 2.5-2.9), waking frequently 3.8 (95% CI, 3.6-3.9), and waking early 2.9 (95% CI, 2.7-3.1). Among the nonusers, the baseline scores were 2.6 (95% CI, 2.5-2.7), 3.7 (95% CI, 3.6-3.8), and 2.7 (95% CI, 2.5-2.8), respectively. After 1 year, there was no statistically significant difference in scores between the two groups. The average ratings for medication users were 2.6 (95% CI, 2.3-2.8) for difficulty initiating sleep, 3.8 (95% CI, 3.6-4.0) for waking frequently, and 2.8 (95% CI, 2.6-3.0) for waking early.
Average ratings among nonusers were 2.3 (95% CI, 2.2-2.4), 3.5 (95% CI, 3.3-3.6), and 2.5 (95% CI, 2.3-2.6), respectively.
After 2 years, there were still no statistically significant reductions in sleep disturbances among those taking prescription sleep medications, compared with those not taking medication.
The researchers noted that approximately half of the women in this cohort were current or past tobacco users and that 20% were moderate to heavy alcohol users.
More work-up, not more medication, needed
The study authors acknowledged the limitations of an observational study and noted that, since participants only reported medication use and sleep disturbances at annual visits, they did not know whether patients’ medication use was intermittent or of any interim outcomes. Additionally, the authors pointed out that those classified as “nonusers” may have been using over-the-counter medication.
“Investigations should look at detailed-use patterns, on a daily or weekly basis, with frequent outcomes data,” Dr. Solomon said in an interview. “While our data shed new light on chronic use, we only had data collected on an annual basis; daily or weekly data would provide more granular information.”
Regarding clinician prescribing practices, Dr. Solomon said, “short-term, intermittent use can be helpful, but use these agents sparingly” and “educate patients that chronic regular use of medications for sleep is not associated with improvement in sleep disturbances.”
Commenting on the study, Andrea Matsumura, MD, a sleep specialist at the Oregon Clinic in Portland, echoed this sentiment: “When someone says they are having trouble sleeping this is the tip of the iceberg and it warrants an evaluation to determine if someone has a breathing disorder, a circadian disorder, a life situation, or a type of insomnia that is driving the sleeplessness.”
“I think this study supports what we all should know,” Dr. Matsumura concluded. “Sleep aids are not meant to be used long term” and should not be used for longer than 2 weeks without further work-up.
Funding for this study was provided through a grant from the National Institutes of Health. Dr. Solomon has received salary support from research grants to Brigham and Women’s Hospital for unrelated work from AbbVie, Amgen, Corrona, Genentech and Pfizer. The other authors and Dr. Matsumura have reported no relevant financial relationships.
FROM BMJ OPEN
E-cigarettes linked to wheeze, shortness of breath
The use of e-cigarettes is linked to a higher frequency of self-reported wheezing and shortness of breath in adolescents and young adults, according to an online survey. The association was present even after controlling for cigarette and cannabis use.
Previous studies of adolescents and young adults have shown associations between e-cigarette use and wheeze, shortness of breath, and asthma. The Youth Risk Behavior Surveillance (YRBS) survey by the Centers for Disease Control and Prevention and other health agencies, conducted from 2015 to 2017, found that 63.5% of youth who used e-cigarettes also used some combination of cigarettes and cannabis. Combined use was associated with a 55%-65% increased odds of self-reported asthma.
The Population Assessment of Tobacco and Health (PATH) study, which was published in October 2020, had similar findings, though it did not find an association between e-cigarette use alone and wheezing.
“The findings from the current study highlight that we need to keep asking young people about respiratory symptoms, couse of other tobacco products, as well as cannabis use. As more products, including cannabis and various e-cigarette devices, enter the market, assessing respiratory health will be important both where adolescents and young adults receive their health care and in research,” Alayna Tackett, PhD, said in an interview. Dr. Tackett presented the study at the American Thoracic Society’s virtual international conference. She is an assistant professor of preventive medicine at the University of Southern California, Los Angeles.
“I found [the study] very interesting because it seems to be identifying a physiologic response to these e-cigarettes,” said Christopher Pascoe, MD, who was asked to comment. “And they were so young [age 14-21 years]. The fact that these symptoms of wheezing and shortness of breath are coming from people who are this young suggests that there may be chronic problems showing up later with continued use of these devices.”
Dr. Pascoe is an assistant professor of physiology and pathophysiology at the University of Manitoba, Winnipeg, where he also works with the Children’s Hospital Research Institute of Manitoba. His own research examines lung tissue harvested from pneumothorax surgeries in smokers and e-cigarette users to identify markers of inflammation.
He called the research a “good start” at unraveling the impacts of e-cigarettes and smoking, since some people use both products. “The fact that there was still a twofold increase in odds for wheezing, shortness of breath among people who use these e-cigarettes, but weren’t using cannabis and weren’t using cigarettes. I think it’s novel, and it suggests that there is an effect [of e-cigarettes alone].”
The study is based on a self-reported data, which is a significant limitation, especially considering that asthma is often overreported. “Self-report can be fraught with things, but I think it’s an interesting starting point for trying to recruit people who are just e-cigarette users and following them up further,” said Dr. Pascoe.
The researchers surveyed 2,931 individuals aged 14-21 years between Aug. 6 and Aug.30, 2020, with an average age of 18.9 years. Of the respondents, 80% were women and girls, and 75% were White. The high percentage of women and girls was unusual. Dr. Tackett provided no explanation for the atypical demographic but noted that the current study used convenience sampling.
The survey asked about use of e-cigarettes, cigarettes, and cannabis in the past 30 days, as well as asthma diagnosis and respiratory symptoms over the same period. The methodology employed survey management company Lucid, which recruited, collected data from, and provided compensation to participants.
A total of 24% of participants reported asthma, 13% reported wheeze, and 20% reported shortness of breath. Among 1,414 respondents who reported e-cigarette use in the past 30 days, 15% also said they had used cigarettes, and 37% said they had used cannabis.
After controlling for age, birth sex, and race/ethnicity, compared with self-reported never e-cigarette users, there was an association between past 30-day e-cigarette use and self-reported asthma (odds ratio, 1.4; 95% CI, 1.1-1.7), wheeze (OR, 3.1; 95% CI, 2.3-4.2), and shortness of breath (OR, 2.9; 95% CI, 2.3-3.6). After the researchers controlled for past 30-day cigarette cannabis use, the association with asthma was no longer statistically significant (OR, 1.11; 95% CI, 0.87-1.41), but the association with wheeze (OR, 2.3; 95% CI, 1.6-3.0) and shortness of breath (OR, 2.1; 95% CI, 1.6-2.8) remained.
Dr. Tackett noted that wheeze and shortness of breath are only two indicators of respiratory health, and more research needs to be done. Her team is conducting follow-up studies using objective measurement tools such as home-based spirometry in adolescents and young adults who exclusively use e-cigarettes and who have never used e-cigarettes.
“We need to better understand the complex relationships between use of these products and whether multiple product use is associated with worse respiratory outcomes,” said Dr. Tackett.
Dr. Pascoe and Dr. Tackett disclosed no relevant financial relationships.
A version of this article first appeared on Medscape.com.
Infants with UTI do not have an increased risk of bacterial meningitis
The decision to perform a spinal tap procedure in infants to determine whether they have bacterial meningitis should not be guided by abnormal urinalysis results alone, according to new research published in JAMA Network Open.
The findings suggest febrile infants with positive urinalysis results do not have a higher risk of bacterial meningitis than those with negative urinalysis results.
Nearly 1 in 100,000 people are diagnosed with bacterial meningitis in the United States each year, according to Boston Children’s Hospital. Infants have an increased risk for bacterial meningitis, compared with those in other age groups, according to the Centers for Disease Control and Prevention. However, rates of the infectious disease have been declining in the United States since the late 1990s.
Researchers of the current study said published guidelines and quality initiatives recommend performing a lumbar puncture on febrile infants with positive urinalysis results to exclude bacterial meningitis as a cause.
“It really raises the question of should we be doing everything we’re doing?” study author Brett Burstein, MD, PhD, MPH, said in an interview. “What we conclude here is that, contrary to all the published guidelines, this invasive strategy for testing in well-appearing infants should not be guided by the urinalysis results. That’s a major departure.”
The study adds to growing research that questions whether a lumbar puncture in infants with fever and a positive urinalysis results should be routinely required.
“[Our findings] certainly goes against 30 years of clinical decisions, rules, and guidelines,” Dr. Burstein said. “We think they’re very important and they stand to change practice because approximately 500 infants will undergo these invasive procedures to not miss that needle in the haystack.”
Dr. Burstein, a clinician-scientist in pediatric emergency medicine at Montreal Children’s Hospital, led a team of researchers to perform a meta-analysis of 48 studies, including data from more than 25,000 infants.
Researchers found that the prevalence of bacterial meningitis in well-appearing febrile infants aged 29-60 days with a positive urinalysis results was 0.44%, compared with 0.50% of infants with negative urinalysis results.
Instead of relying on urinalysis results alone, Dr. Burstein suggests doctors use other stratifying biomarkers to decide whether they should perform a lumbar puncture.
“If you’ve done blood testing, for example, and your blood test results suggest serious infection, that should guide the decision to go on to invasive testing,” Dr. Burstein said. “You can use your urinary tract infection information in combination now with blood results.”
This means that, if infants have reassuring blood results, despite having a urinary tract infection, they do not need invasive testing, according to Dr. Burstein.
Some of the risks involved with invasive lumbar puncture testing include infection, bleeding, respiratory problems, as well as pain for the infant and parental anxiety.
Paul Aronson, MD, MHS, of Yale University, New Haven, Conn., who was not involved in the study, said in an interview that he has personally moved away from routine lumbar puncture in infants with a positive urinalysis, but added that many doctors have not.
Dr. Aronson said that, although there have been previous studies on this topic, what sets Dr. Burstein’s study apart is the fact that it has a “tightly defined” group of patients, which are infants aged between 29 and 60 days. He also said it is helpful that the study compared the prevalence of meningitis between infants who had positive urinalysis results with those who had negative results.
“The study compared positive urinalyses to negative analyses, which in the meta-analysis form had not been done previously,” Dr. Aronson said. “And so I think this [current study] probably provides some of the strongest evidence.”
No relevant financial relationships were reported.
FROM JAMA NETWORK OPEN
Less ambulatory care occurred than expected in pandemic, according to study
according to an analysis of national claims data from Jan. 1, 2019, to Oct. 31, 2020.

“The COVID-19 pandemic has seriously disrupted access to U.S. ambulatory care, endangering population health,” said John N. Mafi, MD, of the University of California, Los Angeles, in a presentation at the annual meeting of the Society of General Internal Medicine.
Dr. Mafi and colleagues conducted the analysis, which included 20 monthly cohorts, and measured outpatient visit rates per 100 members across all 20 study months. The researchers used a “difference-in-differences study design” and compared changes in rates of ambulatory care visits in January-February 2019 through September-October 2019 with the same periods in 2020.
They found that overall utilization fell to 68.9% of expected rates. This number increased to 82.6% of expected rates by May-June 2020 and to 87.7% of expected rates by July-August 2020.
To examine the impact of COVID-19 on U.S. ambulatory care patterns, the researchers identified 10.4 million individuals aged 18 years and older using the MedInsight research claims database. This database included Medicaid, commercial, dual eligible (receiving both Medicare and Medicaid benefits), Medicare Advantage (MA), and Medicare fee-for-service (FFS) patients. The average age of the individuals studied was 52 years, and 55% of the population were women. The researchers measured outpatient visit rates per 100 beneficiaries for several types of ambulatory care visits: emergency, urgent care, office, physical exams, preventive, alcohol/drug, and psychiatric care.
The researchers verified parallel trends in visits between 2018 and 2019 to establish a historical benchmark and divided the patient population into three groups based on insurance enrollment (continuously enrolled, not continuously enrolled, and fully enrolled) to account for new members adding insurance and disrupted coverage caused by job losses or other factors. The trends in ambulatory care utilization were similar between cohorts across the groups.
The rebound seen by the summer of 2020 showed variation when broken out by insurance type: 94.0% for Medicare FFS; 88.9% for commercial insurance; 86.3% for Medicare Advantage; 83.6% for dual eligible; and 78.0% for Medicaid.
“The big picture is that utilization looks similar across the three groups and has not attained prepandemic levels,” Dr. Mafi said.
When the results were divided by service type, utilization rates remained below expected rates while needs remain similar for U.S. Preventive Services Task Force–recommended preventive screening services, Dr. Mafi noted. The demand for psychiatric and substance use services has increased, but use rates are below expected rates. In addition, both avoidable and nonavoidable ED utilization both remained below expected rates.
In-person visits are down across insurance groups, but virtual visits are skyrocketing, across all insurance groups, Dr. Mafi added. However, virtual care visits have not completely compensated for declines in in-person visits, notably among dual-eligible and Medicaid insurance members.
Takeaways for policy makers include the fact that, while some reductions in unnecessary care, such as avoidable ED visits, may be beneficial, the “reduced USPSTF-recommended cancer and other evidence-based disease prevention may worsen health outcomes, particularly for Medicaid beneficiaries,” he said.
Outreach and outcomes
The study is important because “understanding ambulatory care patterns during the pandemic can highlight vulnerabilities and opportunities in our health care system,” Dr. Mafi said in an interview.
“While the COVID-19 pandemic has seriously disrupted access to U.S. ambulatory care, most studies have focused on the early months of the pandemic,” he noted.
Dr. Mafi said he was not surprised that ambulatory care utilization has not rebounded among Medicaid beneficiaries relative to other insurance groups.
“Medicaid beneficiaries are underresourced individuals who are disproportionately racial/ethnic minorities, and they historically have had difficulties accessing care. Our data suggest that the COVID-19 pandemic may be widening these preexisting inequities in access to ambulatory care,” he observed.
The study findings were limited by the use of the MedInsight research dataset, which is a convenience sample; and, therefore, the results might not be generalizable nationally, Dr. Mafi said. “However, it does include beneficiaries from all major insurance types across all 50 U.S. states. Additionally, our analysis was completed at the population level rather than the patient level, and so we were unable to account for patient-level characteristics such as clinical complexity,” he explained.
“The take-home message for clinicians is that our patients with Medicaid insurance may need additional efforts to overcome barriers to accessing ambulatory care, such as creating robust telemedicine outreach programs,” said Dr. Mafi. “Policy makers should also consider providing additional support and resources to safety net health systems who disproportionately care for Medicaid beneficiaries, such as higher reimbursements for both in-person and telemedicine visits.”
More research is needed, he emphasized. “We urgently need further inquiry into the impact of this persistently deferred ambulatory care utilization on important health outcomes such as preventable death/disability and quality of care.”
COVID consequences challenge ambulatory care
“These study findings mirror what we are seeing in primary care settings,” Maureen Lyons, MD, of Washington University. St. Louis, said in an interview. “With the pandemic, there are many additional barriers for patients accessing care, and these barriers have disproportionately impacted those who are already disadvantaged.
“From clinical experience, there are barriers directly related to COVID-19, such as the risk of infection or discomfort being in a clinic setting with other people. However, there also are barriers related to change in financial situation or insurance related to changes or loss of employment,” she said.
“Additionally, many patients have needed to take on increased responsibilities in other areas of their lives, such as caring for an ill family member or being responsible for children’s virtual school,” she said. These new responsibilities can lead people to skip or postpone ambulatory care visits.
“Loss of ambulatory care is likely to lead to increases in preventable illnesses with long-lasting effects,” Dr. Lyons noted. “Studying this in a robust fashion, as Dr. Mafi and colleagues have done, is a critical step in understanding and addressing this urgent need.”
Dr. Mafi noted that the data he presented is preliminary, and that he and his team hope to publish finalized estimates of ambulatory utilization rates in a forthcoming scientific paper.
The study was a collaboration between UCLA and Millman MedInsight, an actuarial health analytics company. Several coauthors are Millman employees. Dr. Mafi and the other researchers had no other relevant financial conflicts to disclose. Dr. Lyons had no financial conflicts to disclose.
according to an analysis of national claims data from Jan. 1, 2019, to Oct. 31, 2020.
“The COVID-19 pandemic has seriously disrupted access to U.S. ambulatory care, endangering population health,” said John N. Mafi, MD, of the University of California, Los Angeles, in a presentation at the annual meeting of the Society of General Internal Medicine.
Dr. Mafi and colleagues conducted the analysis, which included 20 monthly cohorts, and measured outpatient visit rates per 100 members across all 20 study months. The researchers used a “difference-in-differences study design” and compared changes in rates of ambulatory care visits in January-February 2019 through September-October 2019 with the same periods in 2020.
They found that overall utilization fell to 68.9% of expected rates. This number increased to 82.6% of expected rates by May-June 2020 and to 87.7% of expected rates by July-August 2020.
To examine the impact of COVID-19 on U.S. ambulatory care patterns, the researchers identified 10.4 million individuals aged 18 years and older using the MedInsight research claims database. This database included Medicaid, commercial, dual eligible (receiving both Medicare and Medicaid benefits), Medicare Advantage (MA), and Medicare fee-for-service (FFS) patients. The average age of the individuals studied was 52 years, and 55% of the population were women. The researchers measured outpatient visit rates per 100 beneficiaries for several types of ambulatory care visits: emergency, urgent care, office, physical exams, preventive, alcohol/drug, and psychiatric care.
The researchers verified parallel trends in visits between 2018 and 2019 to establish a historical benchmark and divided the patient population into three groups based on insurance enrollment (continuously enrolled, not continuously enrolled, and fully enrolled) to account for new members adding insurance and disrupted coverage caused by job losses or other factors. The trends in ambulatory care utilization were similar between cohorts across the groups.
The rebound seen by the summer of 2020 showed variation when broken out by insurance type: 94.0% for Medicare FFS; 88.9% for commercial insurance; 86.3% for Medicare Advantage; 83.6% for dual eligible; and 78.0% for Medicaid.
“The big picture is that utilization looks similar across the three groups and has not attained prepandemic levels,” Dr. Mafi said.
When the results were divided by service type, utilization rates remained below expected rates while needs remain similar for U.S. Preventive Services Task Force–recommended preventive screening services, Dr. Mafi noted. The demand for psychiatric and substance use services has increased, but use rates are below expected rates. In addition, both avoidable and nonavoidable ED utilization both remained below expected rates.
In-person visits are down across insurance groups, but virtual visits are skyrocketing, across all insurance groups, Dr. Mafi added. However, virtual care visits have not completely compensated for declines in in-person visits, notably among dual-eligible and Medicaid insurance members.
Takeaways for policy makers include the fact that, while some reductions in unnecessary care, such as avoidable ED visits, may be beneficial, the “reduced USPSTF-recommended cancer and other evidence-based disease prevention may worsen health outcomes, particularly for Medicaid beneficiaries,” he said.
Outreach and outcomes
The study is important because “understanding ambulatory care patterns during the pandemic can highlight vulnerabilities and opportunities in our health care system,” Dr. Mafi said in an interview.
“While the COVID-19 pandemic has seriously disrupted access to U.S. ambulatory care, most studies have focused on the early months of the pandemic,” he noted.
Dr. Mafi said he was not surprised that ambulatory care utilization has not rebounded among Medicaid beneficiaries relative to other insurance groups.
“Medicaid beneficiaries are underresourced individuals who are disproportionately racial/ethnic minorities, and they historically have had difficulties accessing care. Our data suggest that the COVID-19 pandemic may be widening these preexisting inequities in access to ambulatory care,” he observed.
The study findings were limited by the use of the MedInsight research dataset, which is a convenience sample; and, therefore, the results might not be generalizable nationally, Dr. Mafi said. “However, it does include beneficiaries from all major insurance types across all 50 U.S. states. Additionally, our analysis was completed at the population level rather than the patient level, and so we were unable to account for patient-level characteristics such as clinical complexity,” he explained.
“The take-home message for clinicians is that our patients with Medicaid insurance may need additional efforts to overcome barriers to accessing ambulatory care, such as creating robust telemedicine outreach programs,” said Dr. Mafi. “Policy makers should also consider providing additional support and resources to safety net health systems who disproportionately care for Medicaid beneficiaries, such as higher reimbursements for both in-person and telemedicine visits.”
More research is needed, he emphasized. “We urgently need further inquiry into the impact of this persistently deferred ambulatory care utilization on important health outcomes such as preventable death/disability and quality of care.”
COVID consequences challenge ambulatory care
“These study findings mirror what we are seeing in primary care settings,” Maureen Lyons, MD, of Washington University. St. Louis, said in an interview. “With the pandemic, there are many additional barriers for patients accessing care, and these barriers have disproportionately impacted those who are already disadvantaged.
“From clinical experience, there are barriers directly related to COVID-19, such as the risk of infection or discomfort being in a clinic setting with other people. However, there also are barriers related to change in financial situation or insurance related to changes or loss of employment,” she said.
“Additionally, many patients have needed to take on increased responsibilities in other areas of their lives, such as caring for an ill family member or being responsible for children’s virtual school,” she said. These new responsibilities can lead people to skip or postpone ambulatory care visits.
“Loss of ambulatory care is likely to lead to increases in preventable illnesses with long-lasting effects,” Dr. Lyons noted. “Studying this in a robust fashion, as Dr. Mafi and colleagues have done, is a critical step in understanding and addressing this urgent need.”
Dr. Mafi noted that the data he presented is preliminary, and that he and his team hope to publish finalized estimates of ambulatory utilization rates in a forthcoming scientific paper.
The study was a collaboration between UCLA and Millman MedInsight, an actuarial health analytics company. Several coauthors are Millman employees. Dr. Mafi and the other researchers had no other relevant financial conflicts to disclose. Dr. Lyons had no financial conflicts to disclose.
FROM SGIM 2021
Pediatricians see drop in income during the pandemic
The average income for pediatricians declined slightly from 2019 to 2020, according to the Medscape Pediatrician Compensation Report 2021.

The report, which was conducted between October 2020 and February 2021, found that the average pediatrician income was down $11,000 – from $232,000 in 2019 to $221,000 in 2020, with 48% of pediatricians reporting at least some decline in compensation.
The specialty also earned the least amount of money in 2020, compared with all of the other specialties, which isn’t surprising since pediatricians have been among the lowest-paid physician specialties since 2013. The highest-earning specialty was plastic surgery with an average income of $526,000 annually.
Most pediatricians who saw a drop in income cited pandemic-related issues such as job loss, fewer hours, and fewer patients.
Jesse Hackell, MD, vice president and chief operating officer of Ponoma Pediatrics in New York, said in an interview the reduced wages pediatricians saw in 2020 didn’t surprise him because many pediatric offices saw a huge drop in visits that were not urgent.
“[The report] shows that procedural specialties tended to do a lot better than the nonprocedural specialties,” Dr. Hackell said. “That’s because, during the shutdown, if you broke your leg, you still needed the orthopedist. And even though the hospitals weren’t doing elective surgeries, they were certainly doing the emergency stuff.”
Meanwhile, in pediatrician offices, where Dr. Hackell said office visits dropped 70%-80% at the beginning of the pandemic, “parents weren’t going to bring a healthy kid out for routine visits and they weren’t going to bring a kid out for minor illnesses and expose them to possibly communicable diseases in the office.”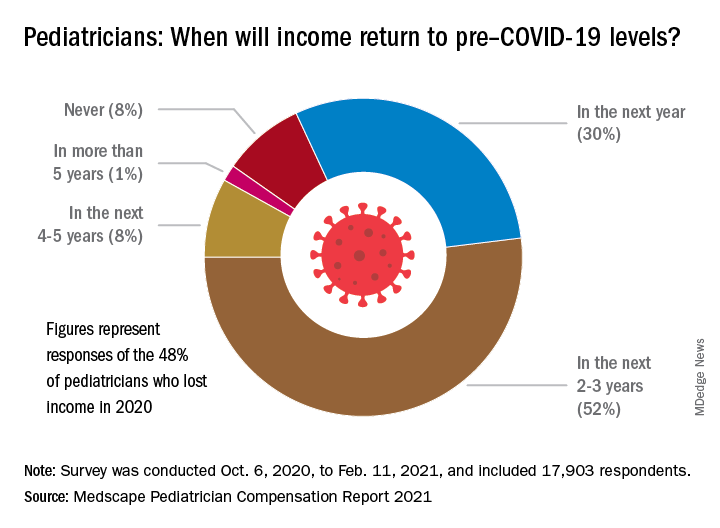
About 52% of pediatricians who lost income because of the pandemic believe their income levels will return to normal in 2-3 years. Meanwhile 30% of pediatricians expect their income to return to normal within a year, and 8% believe it will take 4 years for them to bounce back.
Physician work hours generally declined for some time during the pandemic, according to the report. However, most pediatricians are working about the same number of hours as they did before the pandemic, which is 47 hours per week.
Despite working the same number of hours per week that they did prepandemic, they are seeing fewer patients. They are currently seeing on average 64 patients per week, compared with the 78 patients they used to see weekly before the pandemic.
Dr. Hackell said that might be because pediatric offices are trying to make up the loss of revenue during the beginning of the pandemic, from the reduced number of well visits and immunizations, in the second half of the year with outreach.
“Since about June 2020, we’ve been making concerted efforts to remind parents that preventing other infectious diseases is critically important,” Dr. Hackell explained. “And so actually, for the second half of the year, many of us saw more well visits and immunization volume than in 2019 as we sought to make up the gap. It wasn’t that we were seeing more overall, but we’re trying to make up the gap that happened from March, April, May, [and] June.”
Most pediatricians find their work rewarding. One-third say the most rewarding part of their job is gratitude from and relationships with their patients. Meanwhile, 31% of pediatricians said knowing they are making the world a better place was a rewarding part of their job. Only 8% of them said making money was a rewarding part of their job.
Dr. Hackell said he did not go into pediatrics to make money, it was because he found it stimulating and has “no complaints.”
“I’ve been a pediatrician for 40 years and I wouldn’t do anything else,” Dr. Hackell said. “I don’t know that there’s anything that I would find as rewarding as the relationships that I’ve had over 40 years with my patients. You know, getting invited to weddings of kids who I saw when they were newborns is pretty impressive. It’s the gratification of having ongoing relationships with families.”
Furthermore, the report revealed that 77% of pediatricians said they would pick medicine again if they had a choice, and 82% said they would choose the same specialty.
The experts disclosed no relevant financial interests.
*This story was updated on 5/18/2021.
The average income for pediatricians declined slightly from 2019 to 2020, according to the Medscape Pediatrician Compensation Report 2021.
The report, which was conducted between October 2020 and February 2021, found that the average pediatrician income was down $11,000 – from $232,000 in 2019 to $221,000 in 2020, with 48% of pediatricians reporting at least some decline in compensation.
The specialty also earned the least amount of money in 2020, compared with all of the other specialties, which isn’t surprising since pediatricians have been among the lowest-paid physician specialties since 2013. The highest-earning specialty was plastic surgery with an average income of $526,000 annually.
Most pediatricians who saw a drop in income cited pandemic-related issues such as job loss, fewer hours, and fewer patients.
Jesse Hackell, MD, vice president and chief operating officer of Ponoma Pediatrics in New York, said in an interview the reduced wages pediatricians saw in 2020 didn’t surprise him because many pediatric offices saw a huge drop in visits that were not urgent.
“[The report] shows that procedural specialties tended to do a lot better than the nonprocedural specialties,” Dr. Hackell said. “That’s because, during the shutdown, if you broke your leg, you still needed the orthopedist. And even though the hospitals weren’t doing elective surgeries, they were certainly doing the emergency stuff.”
Meanwhile, in pediatrician offices, where Dr. Hackell said office visits dropped 70%-80% at the beginning of the pandemic, “parents weren’t going to bring a healthy kid out for routine visits and they weren’t going to bring a kid out for minor illnesses and expose them to possibly communicable diseases in the office.”
About 52% of pediatricians who lost income because of the pandemic believe their income levels will return to normal in 2-3 years. Meanwhile 30% of pediatricians expect their income to return to normal within a year, and 8% believe it will take 4 years for them to bounce back.
Physician work hours generally declined for some time during the pandemic, according to the report. However, most pediatricians are working about the same number of hours as they did before the pandemic, which is 47 hours per week.
Despite working the same number of hours per week that they did prepandemic, they are seeing fewer patients. They are currently seeing on average 64 patients per week, compared with the 78 patients they used to see weekly before the pandemic.
Dr. Hackell said that might be because pediatric offices are trying to make up the loss of revenue during the beginning of the pandemic, from the reduced number of well visits and immunizations, in the second half of the year with outreach.
“Since about June 2020, we’ve been making concerted efforts to remind parents that preventing other infectious diseases is critically important,” Dr. Hackell explained. “And so actually, for the second half of the year, many of us saw more well visits and immunization volume than in 2019 as we sought to make up the gap. It wasn’t that we were seeing more overall, but we’re trying to make up the gap that happened from March, April, May, [and] June.”
Most pediatricians find their work rewarding. One-third say the most rewarding part of their job is gratitude from and relationships with their patients. Meanwhile, 31% of pediatricians said knowing they are making the world a better place was a rewarding part of their job. Only 8% of them said making money was a rewarding part of their job.
Dr. Hackell said he did not go into pediatrics to make money, it was because he found it stimulating and has “no complaints.”
“I’ve been a pediatrician for 40 years and I wouldn’t do anything else,” Dr. Hackell said. “I don’t know that there’s anything that I would find as rewarding as the relationships that I’ve had over 40 years with my patients. You know, getting invited to weddings of kids who I saw when they were newborns is pretty impressive. It’s the gratification of having ongoing relationships with families.”
Furthermore, the report revealed that 77% of pediatricians said they would pick medicine again if they had a choice, and 82% said they would choose the same specialty.
The experts disclosed no relevant financial interests.
*This story was updated on 5/18/2021.
Widespread Hyperkeratotic Papules in a Transplant Recipient
The Diagnosis: Trichodysplasia Spinulosa
Trichodysplasia spinulosa has been described in case reports over the last several decades, with its causative virus trichodysplasia spinulosa-associated polyomavirus (TSPyV) identified in 2010 by van der Meijden et al.1 Trichodysplasia spinulosa-associated polyomavirus is a small, nonenveloped, double-stranded DNA virus in the Polyomaviridae family, among several other known cutaneous polyomaviruses including Merkel cell polyomavirus, human polyomavirus (HPyV) 6, HPyV7, HPyV10, and possibly HPyV13.2 The primary target of TSPyV is follicular keratinocytes, and it is believed to cause trichodysplasia spinulosa by primary infection rather than by reactivation. Trichodysplasia spinulosa presents in immunosuppressed patients as a folliculocentric eruption of papules with keratinous spines on the face, often with concurrent alopecia, eventually spreading to the trunk and extremities.3 The diagnosis often is clinical, but a biopsy may be performed for histopathologic confirmation. Alternatively, lesional spicules can be painlessly collected manually and submitted for viral polymerase chain reaction (PCR).4 The diagnosis of trichodysplasia spinulosa can be difficult due to similarities with other more common conditions such as keratosis pilaris, milia, filiform warts, or lichen spinulosus.
Similar to trichodysplasia spinulosa, keratosis pilaris also presents with folliculocentric and often erythematous papules.5 Keratosis pilaris most frequently affects the posterior upper arms and thighs but also may affect the cheeks, as seen in trichodysplasia spinulosa. Differentiation between the 2 diagnoses can be made on a clinical basis, as keratosis pilaris lacks the characteristic keratinous spines and often spares the central face and nose, locations that commonly are affected in trichodysplasia spinulosa.3
Milia typically appear as white to yellow papules, often on the cheeks, eyelids, nose, and chin.6 Given their predilection for the face, milia can appear similarly to trichodysplasia spinulosa. Differentiation can be made clinically, as milia typically are not as numerous as the spiculed papules seen in trichodysplasia spinulosa. Morphologically, milia will present as smooth, dome-shaped papules as opposed to the keratinous spicules seen in trichodysplasia spinulosa. The diagnosis of milia can be confirmed by incision and removal of the white chalky keratin core, a feature absent in trichodysplasia spinulosa.
Filiform warts are benign epidermal proliferations caused by human papillomavirus infection that manifest as flesh-colored, verrucous, hyperkeratotic papules.7 They can appear on virtually any skin surface, including the face, and thus may be mistaken for trichodysplasia spinulosa. Close inspection usually will reveal tiny black dots that represent thrombosed capillaries, a feature lacking in trichodysplasia spinulosa. In long-standing lesions or immunocompromised patients, confluent verrucous plaques may develop.8 Diagnosis of filiform warts can be confirmed with biopsy, which will demonstrate a compact stratum corneum, coarse hypergranulosis, and papillomatosis curving inward, while biopsy of a trichodysplasia spinulosa lesion would show polyomavirus infection of the hair follicle and characteristic eosinophilic inclusion bodies.9
Lichen spinulosus may appear as multiple folliculocentric scaly papules with hairlike horny spines.10 Lichen spinulosus differs from trichodysplasia spinulosa in that it commonly appears on the neck, abdomen, trochanteric region, arms, elbows, or knees. Lichen spinulosus also classically appears as a concrete cluster of papules, often localized to a certain region, in contrast to trichodysplasia spinulosa, which will be widespread, often spreading over time. Finally, clinical history may help differentiate the 2 entities. Lichen spinulosus most often appears in children and adolescents and often has an indolent course, typically resolving during puberty, while trichodysplasia spinulosa is seen in immunocompromised patients.
In our patient, the dermatology team made a diagnosis of trichodysplasia spinulosa based on the characteristic clinical presentation, which was confirmed after approximately 10 lesional spicules were removed by tissue forceps and submitted for PCR analysis showing TSPyV (Figure). Two other cases utilized spicule PCR analysis for confirmation of TSPyV.11,12 This technique may represent a viable option for diagnostic confirmation in pediatric cases.
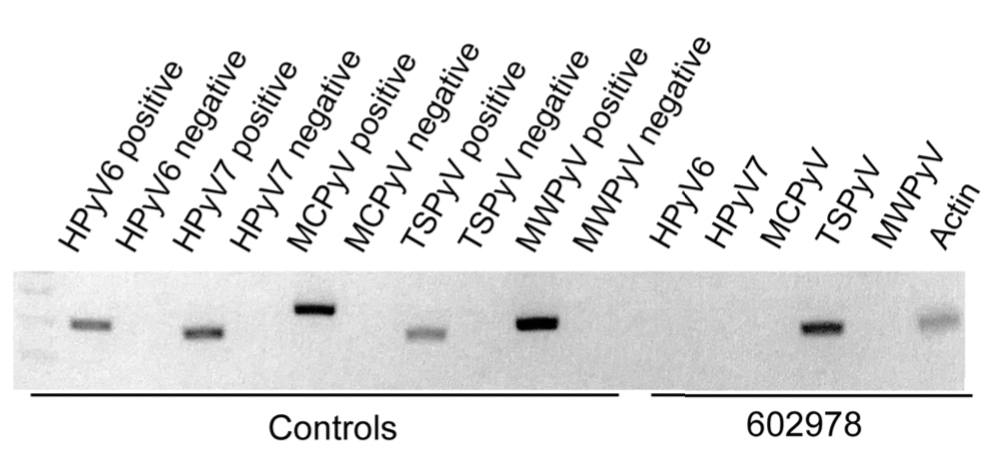
Although some articles have examined the molecular and biologic features of trichodysplasia spinulosa, literature on clinical presentation and management is limited to isolated case reports with no comprehensive studies to establish a standardized treatment. Of these reports, oral valganciclovir 900 mg daily, topical retinoids, cidofovir cream 1% to 3%, and decreasing or altering the immunosuppressive regimen all have been noted to provide clinical improvement.13,14 Other therapies including leflunomide and routine manual extraction of spicules also have shown effectiveness in the treatment of trichodysplasia spinulosa.15
In our patient, treatment included decreasing immunosuppression, as she was getting recurrent sinus and upper respiratory infections. Mycophenolate mofetil was discontinued, and the patient was continued solely on tacrolimus therapy. She demonstrated notable improvement after 3 months, with approximately 50% clearance of the eruption. A mutual decision was made at that visit to initiate therapy with compounded cidofovir cream 1% daily to the lesions until the next follow-up visit. Unfortunately, the patient did not return for her scheduled dermatology visits and was lost to long-term follow-up.
Acknowledgment
We thank Richard C. Wang, MD, PhD (Dallas, Texas), for his dermatologic expertise and assistance in analysis of lesional samples for TSPyV.
- van der Meijden E, Janssens RWA, Lauber C, et al. Discovery of a new human polyomavirus associated with trichodysplasia spinulosa in an immunocompromised patient. PLoS Pathog. 2010;6:E1001024.
- Sheu JC, Tran J, Rady PL, et al. Polyomaviruses of the skin: integrating molecular and clinical advances in an emerging class of viruses. Br J Dermatol. 2019;180:1302-1311.
- Sperling LC, Tomaszewski MM, Thomas DA. Viral-associated trichodysplasia in patients who are immunocompromised. J Am Acad Dermatol. 2004;50:318-322.
- Wu JH, Nguyen HP, Rady PL, et al. Molecular insight into the viral biology and clinical features of trichodysplasia spinulosa. Br J Dermatol. 2016;174:490-498.
- Hwang S, Schwartz RA. Keratosis pilaris: a common follicular hyperkeratosis. Cutis. 2008;82:177-180.
- Berk DR, Bayliss SJ. Milia: a review and classification. J Am Acad Dermatol. 2008;59:1050-1063.
- Micali G, Dall'Oglio F, Nasca MR, et al. Management of cutaneous warts: an evidence-based approach. Am J Clin Dermatol. 2004;5:311-317.
- Bolognia J, Schaffer JV, Cerroni L. Dermatology. 4th ed. Elsevier; 2018.
- Elston DM, Ferringer T, Ko CJ. Dermatopathology. 3rd ed. Elsevier; 2018.
- Tilly JJ, Drolet BA, Esterly NB. Lichenoid eruptions in children. J Am Acad Dermatol. 2004;51:606-624.
- Chamseddin BH, Tran BAPD, Lee EE, et al. Trichodysplasia spinulosa in a child: identification of trichodysplasia spinulosa-associated polyomavirus in skin, serum, and urine. Pediatr Dermatol. 2019;36:723-724.
- Sonstegard A, Grossman M, Garg A. Trichodysplasia spinulosa in a kidney transplant recipient. JAMA Dermatol. 2021;157:105.
- Leitenberger JJ, Abdelmalek M, Wang RC, et al. Two cases of trichodysplasia spinulosa responsive to compounded topical cidofovir 3% cream. JAAD Case Rep. 2015;1:S33-S35.
- DeCrescenzo AJ, Philips RC, Wilkerson MG. Trichodysplasia spinulosa: a rare complication of immunosuppression. JAAD Case Rep. 2016;2:307-309.
- Nguyen KD, Chamseddin BH, Cockerell CJ, et al. The biology and clinical features of cutaneous polyomaviruses. J Invest Dermatol. 2019;139:285-292.
The Diagnosis: Trichodysplasia Spinulosa
Trichodysplasia spinulosa has been described in case reports over the last several decades, with its causative virus trichodysplasia spinulosa-associated polyomavirus (TSPyV) identified in 2010 by van der Meijden et al.1 Trichodysplasia spinulosa-associated polyomavirus is a small, nonenveloped, double-stranded DNA virus in the Polyomaviridae family, among several other known cutaneous polyomaviruses including Merkel cell polyomavirus, human polyomavirus (HPyV) 6, HPyV7, HPyV10, and possibly HPyV13.2 The primary target of TSPyV is follicular keratinocytes, and it is believed to cause trichodysplasia spinulosa by primary infection rather than by reactivation. Trichodysplasia spinulosa presents in immunosuppressed patients as a folliculocentric eruption of papules with keratinous spines on the face, often with concurrent alopecia, eventually spreading to the trunk and extremities.3 The diagnosis often is clinical, but a biopsy may be performed for histopathologic confirmation. Alternatively, lesional spicules can be painlessly collected manually and submitted for viral polymerase chain reaction (PCR).4 The diagnosis of trichodysplasia spinulosa can be difficult due to similarities with other more common conditions such as keratosis pilaris, milia, filiform warts, or lichen spinulosus.
Similar to trichodysplasia spinulosa, keratosis pilaris also presents with folliculocentric and often erythematous papules.5 Keratosis pilaris most frequently affects the posterior upper arms and thighs but also may affect the cheeks, as seen in trichodysplasia spinulosa. Differentiation between the 2 diagnoses can be made on a clinical basis, as keratosis pilaris lacks the characteristic keratinous spines and often spares the central face and nose, locations that commonly are affected in trichodysplasia spinulosa.3
Milia typically appear as white to yellow papules, often on the cheeks, eyelids, nose, and chin.6 Given their predilection for the face, milia can appear similarly to trichodysplasia spinulosa. Differentiation can be made clinically, as milia typically are not as numerous as the spiculed papules seen in trichodysplasia spinulosa. Morphologically, milia will present as smooth, dome-shaped papules as opposed to the keratinous spicules seen in trichodysplasia spinulosa. The diagnosis of milia can be confirmed by incision and removal of the white chalky keratin core, a feature absent in trichodysplasia spinulosa.
Filiform warts are benign epidermal proliferations caused by human papillomavirus infection that manifest as flesh-colored, verrucous, hyperkeratotic papules.7 They can appear on virtually any skin surface, including the face, and thus may be mistaken for trichodysplasia spinulosa. Close inspection usually will reveal tiny black dots that represent thrombosed capillaries, a feature lacking in trichodysplasia spinulosa. In long-standing lesions or immunocompromised patients, confluent verrucous plaques may develop.8 Diagnosis of filiform warts can be confirmed with biopsy, which will demonstrate a compact stratum corneum, coarse hypergranulosis, and papillomatosis curving inward, while biopsy of a trichodysplasia spinulosa lesion would show polyomavirus infection of the hair follicle and characteristic eosinophilic inclusion bodies.9
Lichen spinulosus may appear as multiple folliculocentric scaly papules with hairlike horny spines.10 Lichen spinulosus differs from trichodysplasia spinulosa in that it commonly appears on the neck, abdomen, trochanteric region, arms, elbows, or knees. Lichen spinulosus also classically appears as a concrete cluster of papules, often localized to a certain region, in contrast to trichodysplasia spinulosa, which will be widespread, often spreading over time. Finally, clinical history may help differentiate the 2 entities. Lichen spinulosus most often appears in children and adolescents and often has an indolent course, typically resolving during puberty, while trichodysplasia spinulosa is seen in immunocompromised patients.
In our patient, the dermatology team made a diagnosis of trichodysplasia spinulosa based on the characteristic clinical presentation, which was confirmed after approximately 10 lesional spicules were removed by tissue forceps and submitted for PCR analysis showing TSPyV (Figure). Two other cases utilized spicule PCR analysis for confirmation of TSPyV.11,12 This technique may represent a viable option for diagnostic confirmation in pediatric cases.
Although some articles have examined the molecular and biologic features of trichodysplasia spinulosa, literature on clinical presentation and management is limited to isolated case reports with no comprehensive studies to establish a standardized treatment. Of these reports, oral valganciclovir 900 mg daily, topical retinoids, cidofovir cream 1% to 3%, and decreasing or altering the immunosuppressive regimen all have been noted to provide clinical improvement.13,14 Other therapies including leflunomide and routine manual extraction of spicules also have shown effectiveness in the treatment of trichodysplasia spinulosa.15
In our patient, treatment included decreasing immunosuppression, as she was getting recurrent sinus and upper respiratory infections. Mycophenolate mofetil was discontinued, and the patient was continued solely on tacrolimus therapy. She demonstrated notable improvement after 3 months, with approximately 50% clearance of the eruption. A mutual decision was made at that visit to initiate therapy with compounded cidofovir cream 1% daily to the lesions until the next follow-up visit. Unfortunately, the patient did not return for her scheduled dermatology visits and was lost to long-term follow-up.
Acknowledgment
We thank Richard C. Wang, MD, PhD (Dallas, Texas), for his dermatologic expertise and assistance in analysis of lesional samples for TSPyV.
- van der Meijden E, Janssens RWA, Lauber C, et al. Discovery of a new human polyomavirus associated with trichodysplasia spinulosa in an immunocompromised patient. PLoS Pathog. 2010;6:E1001024.
- Sheu JC, Tran J, Rady PL, et al. Polyomaviruses of the skin: integrating molecular and clinical advances in an emerging class of viruses. Br J Dermatol. 2019;180:1302-1311.
- Sperling LC, Tomaszewski MM, Thomas DA. Viral-associated trichodysplasia in patients who are immunocompromised. J Am Acad Dermatol. 2004;50:318-322.
- Wu JH, Nguyen HP, Rady PL, et al. Molecular insight into the viral biology and clinical features of trichodysplasia spinulosa. Br J Dermatol. 2016;174:490-498.
- Hwang S, Schwartz RA. Keratosis pilaris: a common follicular hyperkeratosis. Cutis. 2008;82:177-180.
- Berk DR, Bayliss SJ. Milia: a review and classification. J Am Acad Dermatol. 2008;59:1050-1063.
- Micali G, Dall'Oglio F, Nasca MR, et al. Management of cutaneous warts: an evidence-based approach. Am J Clin Dermatol. 2004;5:311-317.
- Bolognia J, Schaffer JV, Cerroni L. Dermatology. 4th ed. Elsevier; 2018.
- Elston DM, Ferringer T, Ko CJ. Dermatopathology. 3rd ed. Elsevier; 2018.
- Tilly JJ, Drolet BA, Esterly NB. Lichenoid eruptions in children. J Am Acad Dermatol. 2004;51:606-624.
- Chamseddin BH, Tran BAPD, Lee EE, et al. Trichodysplasia spinulosa in a child: identification of trichodysplasia spinulosa-associated polyomavirus in skin, serum, and urine. Pediatr Dermatol. 2019;36:723-724.
- Sonstegard A, Grossman M, Garg A. Trichodysplasia spinulosa in a kidney transplant recipient. JAMA Dermatol. 2021;157:105.
- Leitenberger JJ, Abdelmalek M, Wang RC, et al. Two cases of trichodysplasia spinulosa responsive to compounded topical cidofovir 3% cream. JAAD Case Rep. 2015;1:S33-S35.
- DeCrescenzo AJ, Philips RC, Wilkerson MG. Trichodysplasia spinulosa: a rare complication of immunosuppression. JAAD Case Rep. 2016;2:307-309.
- Nguyen KD, Chamseddin BH, Cockerell CJ, et al. The biology and clinical features of cutaneous polyomaviruses. J Invest Dermatol. 2019;139:285-292.
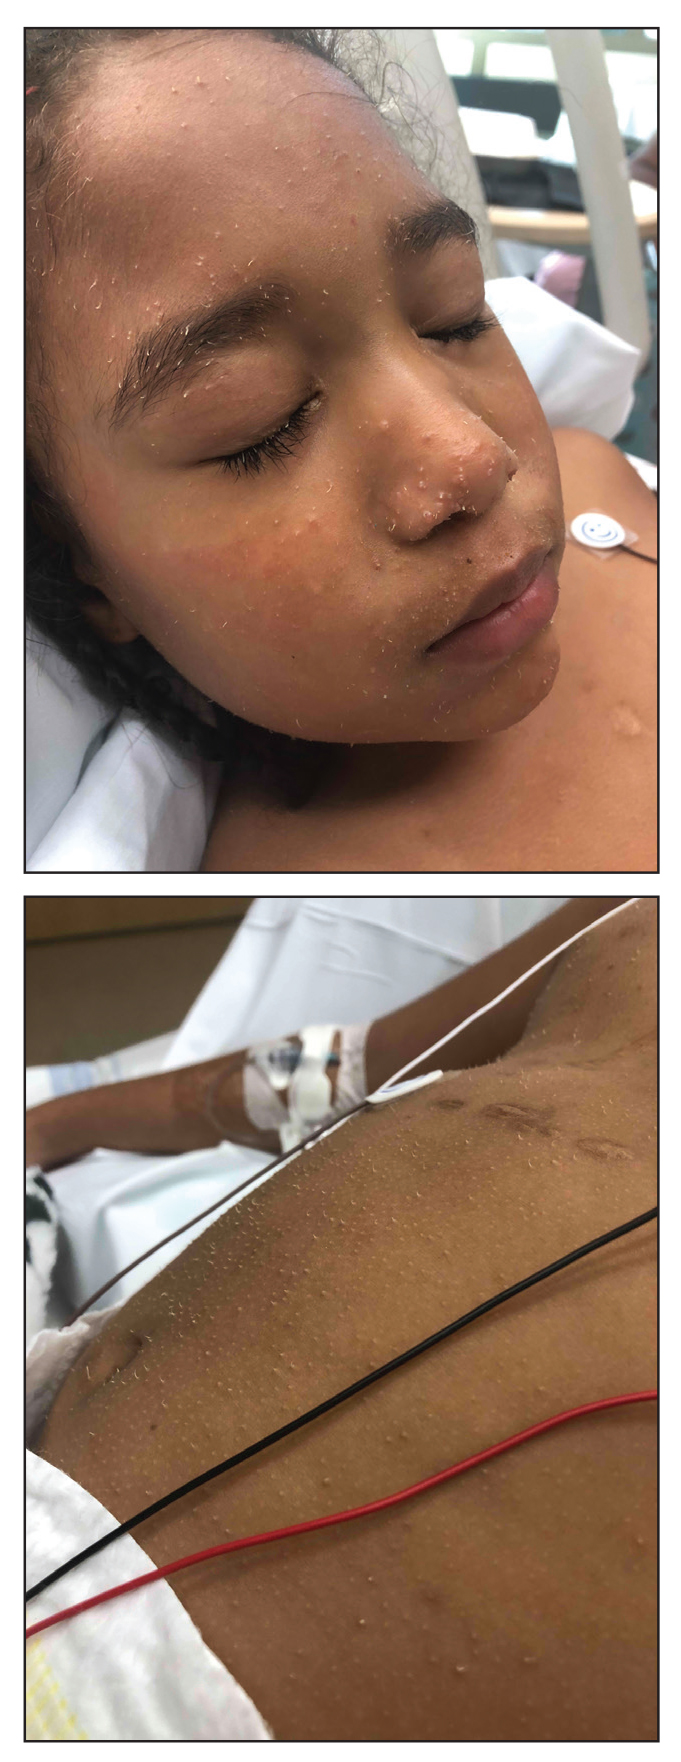
A 4-year-old girl with a history of cardiac transplantation 1 year prior for dilated cardiomyopathy presented to the dermatology consultation service with widespread hyperkeratotic papules of 2 months’ duration. The eruption initially had appeared on the face with subsequent involvement of the trunk and extremities. Her immunosuppressive medications included oral tacrolimus and mycophenolate mofetil. No over-the-counter or prescription treatments had been used for the eruption; the patient’s mother had been manually extracting the spicules from the nose, cheeks, and forehead with tweezers. The lesions were asymptomatic with only mild follicular erythema. Physical examination revealed multiple folliculocentric keratinous spicules on the nose, cheeks, forehead (top), trunk (bottom), arms, and legs.
Study points to best treatments for depression in primary care
according to a network meta-analysis (NMA) comparing either and both approaches with control conditions in the primary care setting.
The findings are important, since the majority of depressed patients are treated by primary care physicians, yet relatively few randomized trials of treatment have focused on this setting, noted senior study author Pim Cuijpers, PhD, from Vrije Universiteit Amsterdam, and colleagues, in the paper, which was published in Annals of Family Medicine.
“The main message is that clinicians should certainly consider psychotherapy instead of pharmacotherapy, because this is preferred by most patients, and when possible, combined treatments should be the preferred choice because the outcomes are considerably better,” he said in an interview. Either way, he emphasized that “preference of patients is very important and all three treatments are better than usual care.”
The NMA included studies comparing psychotherapy, antidepressant medication, or a combination of both, with control conditions (defined as usual care, wait list, or pill placebo) in adult primary care patients with depression.
Patients could have major depression, persistent mood disorders (dysthymia), both, or high scores on self-rating depression scales. The primary outcome of the NMA was response, defined as a 50% improvement in the Hamilton Depression Rating scores (HAM-D).
A total of 58 studies met inclusion criteria, involving 9,301 patients.
Treatment options compared
Compared with usual care, both psychotherapy alone and pharmacotherapy alone had significantly better response rates, with no significant difference between them (relative risk, 1.60 and RR, 1.65, respectively). The combination of psychotherapy and pharmacotherapy was even better (RR, 2.15), whereas the wait list was less effective (RR, 0.68).
When comparing combined therapy with psychotherapy or pharmacotherapy, the superiority of combination therapy over psychotherapy was only slightly statistically significant (RR, 1.35; 95% confidence interval, 1.00-1.81), while pharmacotherapy was only slightly inferior (RR, 1.30; 95% CI, 0.98-1.73).
“The significance level is not very high, which is related to statistical power,” said Dr. Cuijpers. “But the mean benefit is quite substantial in my opinion, with a 35% higher chance of response in the combined treatment, compared to psychotherapy alone.”
Looking at the outcome of remission, (normally defined as a score of 7 or less on the HAM-D), the outcomes were “comparable to those for response, with the exception that combined treatment was not significantly different from psychotherapy,” they wrote.
One important caveat is that several studies included in the NMA included patients with moderate to severe depression, a population that is different from the usual primary care population of depressed patients who have mild to moderate symptoms. Antidepressant medications are also assumed to work better against more severe symptoms, added the authors. “The inclusion of these studies might therefore have resulted in an overestimation of the effects of pharmacotherapy in the present NMA.”
Among other limitations, the authors noted that studies included mixed populations of patients with dysthymia and major depression; they also made no distinction between different types of antidepressants.
Psychotherapies unknown, but meta-analysis is still useful
Commenting on these findings, Neil Skolnik, MD, professor of family and community medicine at Sidney Kimmel Medical College, Philadelphia, said this is “an important study, confirming and extending the conclusions” of a systematic review published in 2016 as a Clinical Practice Guideline from the American College of Physicians.
“Unfortunately, the authors did not specify what type of psychotherapy was studied in the meta-analysis, so we have to look elsewhere if we want to advise our patients on what type of psychotherapy to seek, since there are important differences between different types of therapy,” he said.
Still, he described the study as providing “helpful information for the practicing clinician, as it gives us solid information with which to engage and advise patients in a shared decision-making process for effective treatment of depression.”
“Some patients will choose psychotherapy, some will choose medications. They can make either choice with the confidence that both approaches are effective,” Dr. Skolnik elaborated. “In addition, if psychotherapy does not seem to be sufficiently helping we are on solid ground adding an antidepressant medication to psychotherapy, with this data showing that the combined treatment works better than psychotherapy alone.”
Dr. Cuijpers receives allowances for his memberships on the board of directors of Mind, Fonds Psychische Gezondheid, and Korrelatie, and for being chair of the PACO committee of the Raad voor Civiel-militaire Zorg en Onderzoek of the Dutch Ministry of Defense. He also serves as deputy editor of Depression and Anxiety and associate editor of Psychological Bulletin, and he receives royalties for books he has authored or coauthored. He received grants from the European Union, ZonMw, and PFGV. Another study author reported receiving personal fees from Mitsubishi-Tanabe, MSD, and Shionogi and a grant from Mitsubishi-Tanabe outside the submitted work. One author has received research and consultancy fees from INCiPiT (Italian Network for Paediatric Trials), CARIPLO Foundation, and Angelini Pharmam, while another reported receiving personal fees from Boehringer Ingelheim, Kyowa Kirin, ASKA Pharmaceutical, and Toyota Motor Corporation outside the submitted work. The other authors and Dr. Skolnik reported no conflicts.
FROM ANNALS OF FAMILY MEDICINE
Among asymptomatic, 2% may harbor 90% of community’s viral load: Study
About 2% of asymptomatic college students carried 90% of COVID-19 viral load levels on a Colorado campus last year, new research reveals. Furthermore, the viral loads in these students were as elevated as those seen in hospitalized patients.
“College campuses were one of the few places where people without any symptoms or suspicions of exposure were being screened for the virus. This allowed us to make some powerful comparisons between symptomatic vs healthy carriers of the virus,” senior study author Sara Sawyer, PhD, professor of virology at the University of Colorado, Boulder, said in an interview.
“It turns out, walking around a college campus can be as dangerous as walking through a COVID ward in the hospital, in that you will experience these viral ‘super carriers’ equally in both settings,” she said.
“This is an important study in advancing our understanding of how SARS-CoV-2 is distributed in the population,” Thomas Giordano, MD, MPH, professor and section chief of infectious diseases at Baylor College of Medicine, Houston, said in an interview.
The study “adds to the evidence that viral load is not too tightly correlated with symptoms.” In fact, Dr. Giordano added, “this study suggests viral load is not at all correlated with symptoms.”
Viral load may not be correlated with transmissibility either, said Raphael Viscidi, MD, when asked to comment. “This is not a transmissibility study. They did not show that viral load is the factor related to transmission.”
“It’s true that 2% of the population they studied carried 90% of the virus, but it does not establish any biological importance to that 2%,” added Dr. Viscidi, professor of pediatrics and oncology at Johns Hopkins University, Baltimore,.
The 2% could just be the upper tail end of a normal bell-shaped distribution curve, Dr. Viscidi said, or there could be something biologically unique about that group. But the study does not make that distinction, he said.
The study was published online May 10, 2021, in PNAS, the official journal of the National Academy of Sciences.
A similar picture in hospitalized patients
Out of more than 72,500 saliva samples taken during COVID-19 screening at the University of Colorado Boulder between Aug. 27 and Dec. 11, 2020, 1,405 were positive for SARS-CoV-2.
The investigators also compared viral loads from students with those of hospitalized patients based on published data. They found the distribution of viral loads between these groups “indistinguishable.”
“Strikingly, these datasets demonstrate dramatic differences in viral levels between individuals, with a very small minority of the infected individuals harboring the vast majority of the infectious virions,” the researchers wrote. The comparison “really represents two extremes: One group is mostly hospitalized, while the other group represents a mostly young and healthy (but infected) college population.”
“It would be interesting to adjust public health recommendations based on a person’s viral load,” Dr. Giordano said. “One could speculate that a person with a very high viral load could be isolated longer or more thoroughly, while someone with a very low viral load could be minimally isolated.
“This is speculation, and more data are needed to test this concept,” he added. Also, quantitative viral load testing would need to be standardized before it could be used to guide such decision-making
Preceding the COVID-19 vaccine era
It should be noted that the research was conducted in fall 2020, before access to COVID-19 immunization.
“The study was performed prior to vaccine availability in a cohort of young people. It adds further data to support prior observations that the majority of infections are spread by a much smaller group of individuals,” David Hirschwerk, MD, said in an interview.
“Now that vaccines are available, I think it is very likely that a repeat study of this type would show diminished transmission from vaccinated people who were infected yet asymptomatic,” added Dr. Hirschwerk, an infectious disease specialist at Northwell Health in New Hyde Park, N.Y., who was not affiliated with the research.
Mechanism still a mystery
“This finding has been in the literature in piecemeal fashion since the beginning of the pandemic,” Dr. Sawyer said. “I just think we were the first to realize the bigger implications of these plots of viral load that we have all been seeing over and over again.”
How a minority of people walk around asymptomatic with a majority of virus remains unanswered. Are there special people who can harbor these extremely high viral loads? Or do many infected individuals experience a short period of time when they carry such elevated levels?
The highest observed viral load in the current study was more than 6 trillion virions per mL. “It is remarkable to consider that this individual was on campus and reported no symptoms at our testing site,” the researchers wrote.
In contrast, the lowest viral load detected was 8 virions per mL.
Although more research is needed, the investigators noted that “a strong implication is that these individuals who are viral ‘super carriers’ may also be ‘superspreaders.’ ”
Some of the study authors have financial ties to companies that offer commercial SARS-CoV-2 testing, including Darwin Biosciences, TUMI Genomics, Faze Medicines, and Arpeggio Biosciences.
A version of this article first appeared on Medscape.com.