User login
Nerves of Steal
A 60 year‐old woman with advanced kidney disease presented with one month of progressively worsening, sharp burning pain and decreased sensation in her left hand. Cold air exacerbated the pain. She noted decreasing ability to utilize her left fingers, a weakened grip and that the muscles in her hand looked smaller.
Localized sensory and motor symptoms in a discrete region of a single limb suggest neuropathy. The lack of symptoms in the face or ipsilateral lower extremity would dissuade a clinician from considering central etiologies; the presence of neuropathic pain is uncommon for cortical lesions. The involvement of motor and sensory nerves indicates peripheral nerve involvement.
The general approach to patients with peripheral neuropathy begins with identifying the neuropathy as a mononeuropathy (involving a single nerve), a polyneuropathy (symmetric involvement of multiple nerves) or a mononeuropathy multiplex (asymmetric involvement of multiple nerves). The patient, in this case, described subacute neuropathic pain, sensory loss, and weakness in her left hand in a distribution consistent with mononeuropathy or mononeuropathy multiplex.
This patient could have carpal tunnel syndrome given its prevalence in patients with advanced renal disease. The differential diagnosis is broad, however, and includes ulnar mononeuropathy, nerve ischemia due to vasculitis or vasculopathy, lower cervical radiculopathy (though the patient does not describe neck or radicular pain), lower brachial plexopathy, and complex regional pain syndrome.
The patient was diagnosed with advanced kidney disease one year ago when biopsy revealed focal segmental glomerulosclerosis secondary to lithium. Since her diagnosis, two grafts were placed in the left upper arm in anticipation of dialysis: the first, placed seven months prior to this admission, failed to mature; the second, placed one month prior to this admission, was complicated by bleeding at the fistula site and was not yet mature. Prior to this admission she had not required hemodialysis. Her past history included hypertension, dyslipidemia, hypothyroidism, secondary hyperparathyroidism, a remote history of cervical cancer (stage unknown, recent PAP smear negative), microcytosis and schizoaffective disorder. Her medications were furosemide, amlodipine, lisinopril, atenolol, atorvastatin, pantoprazole, olanzapine, levothyroxine, iron, darbepoetin, sevelamer, multivitamin and docusate.
Given the history of procedures in the left arm one should consider ischemic injury to the left median nerve. Other local complications could include compressive lesions such as an abscess or hematoma or direct nerve injury from the procedure. Carpal tunnel syndrome remains high on the differential due to its prevalence and because renal failure and hypothyroidism increase the risk of carpal tunnel syndrome.
A careful physical examination would localize the nerve or nerves involved. Examination findings that would be consistent with carpal tunnel syndrome include sensory loss in the distribution of the left median nerve, weakness of muscles innervated by the median nerve, including the abductor pollicus brevis and opponens muscles, and a Tinels and Phalens sign of the left wrist. A proximal median neuropathy resulting from ischemia or compression might also involve median‐innervated forearm muscle such as the pronator teres (forearm pronation) and flexor carpi radialis (hand flexion and abduction) muscles. Complex regional pain syndrome can be seen after a traumatic injury or surgery and is typified by severe neuropathic pain in a limb, often in combination with trophic changes in the affected extremity. A cervical radiculopathy would affect muscles supplied by the injured nerve root. For example, a C8 radiculopathy would affect all of the intrinsic hand muscles, the wrist and finger extensors, and the triceps brachii. A lower brachial plexopathy would present similarly to a lower cervical radiculopathy on clinical examination; electrodiagnostic evaluation would be necessary to distinguish these two disorders.
The patient appeared fatigued and her left hand was wrapped in blankets. Her vital signs were stable. There was no thyroid enlargement or lymphadenopathy. There was marked thenar, hypothenar and forearm atrophy on the left. Strength testing of her left hand demonstrated a grip strength of 2/5, finger extension and interosseous strength of 1/5, left wrist flexion and extension of 3/5; left biceps and triceps were 5/5. Sensation was mildly decreased to light touch, temperature, pain and proprioception throughout the left hand. Strength and sensation were intact in the right upper and bilateral lower extremities. Reflexes were 2+ throughout. The left radial pulse was diminished compared to the left ulnar that was 1+. The left hand was dry and cool. Laboratory evaluation revealed an elevated white blood cell count of 15,300/mm3, a hematocrit of 33 percent, mean corpuscular volume of 73 fL, and a normal platelet count. Electrolytes were consistent with advanced renal disease. The thyroid stimulating hormone level was normal.
The patient's examination reveals an injury to the sensory and motor components of the left ulnar, median, and distal radial nerves. The volar forearm wasting suggests proximal median motor nerve injury in the forearm. Because the triceps is spared, the weakness of finger and wrist extension implies distal radial motor nerve injury. The interosseous weakness is consistent with injury to the ulnar motor nerve. Weakness of grip and wrist flexion is less specific and it may be explained by injury to either the median or ulnar motor nerves. The diffuse sensory loss over the palmar and dorsal aspect of the left hand is consistent with neuropathic injury to the left median, ulnar, and radial sensory nerves. The preserved deep tendon reflexes are controlled by the musculocutaneous nerve (the biceps reflex) and branches arising from the proximal radial nerve (the triceps and brachioradialis reflexes), both of which are proximal to the apparent level of neuropathic insult.
Carpal tunnel syndrome is excluded since abnormalities extend beyond the median nerve distribution. The presentation is consistent with a mononeuropathy multiplex. Axonal etiologies of mononeuropathy multiplexincluding vasculitis, ischemia, neoplastic infiltration, and infectious etiologies such as Lyme diseaseare more common than demyelinating causes. Vasculitic neuropathy commonly involves the lower extremities and may have systemic symptoms, not present in this case. Neoplasm or other compressive lesions such as hematoma could explain these findings. Abscess must be considered given the leukocytosis. A lower brachial plexopathy, technically a mononeuropathy multiplex involving the proximal arm at the level of the brachial plexus, is also in the differential diagnosis. Another axonal disorder to consider would be neuralgic amyotrophy, an idiopathic form of acute brachial plexopathy associated with pain that is a complication of surgery that typically presents within a few hours to weeks of the procedure.
Demyelinating causes of mononeuropathy multiplex are less likely and include a variant of chronic inflammatory demyelinating polyneuropathy (Lewis‐Sumner syndrome) and hereditary neuropathy with liability to pressure palsies. Both processes are typically indolent and usually not painful, though the latter may present with fulminant numbness and weakness.
Nerve conduction and needle electromyography of the arm and cervical paraspinal muscles would differentiate axonal degeneration from demyelination. It would identify the affected nerves and any nerve root involvement. Given the concern for abscess or hematoma, MR neurography focused on the surgical site would also be important.
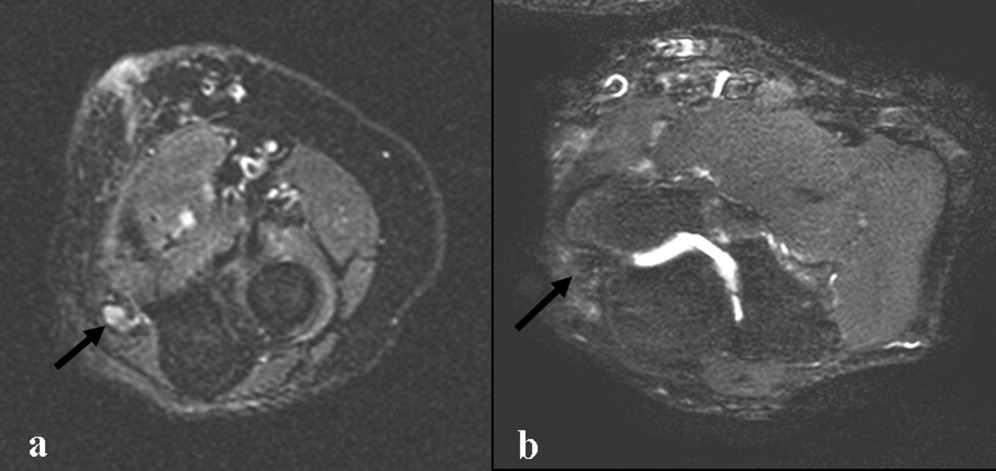
Electromyography and nerve conduction velocities demonstrated severe axonal loss of the left median, ulnar and distal radial sensory nerves consistent with acute denervation. A magnetic resonance neurogram following the course of these nerves revealed enlarged ulnar and median nerves with abnormal signal, but no compressive lesion (Fig. 1).

The electrodiagnostic testing is consistent with severe acute axonal injury to the left ulnar, median and radial nerves. This supports a diagnosis of mononeuropathy multiplex with axonal injury. Demyelinating causes are excluded at this point.
The MR neurogram demonstrates nonspecific nerve enlargement, which may be seen in ischemia, neoplastic processes (primary or metastatic), demyelinating disease, or, rarely, amyloidosis. Neoplastic involvement is unlikely in this case given the absence of a compressive mass lesion and the long segmental involvement of both the median and ulnar nerves. Compression from an abscess or hematoma is excluded. Neuralgic amyotrophy does not typically cause nerve enlargement.
Ischemia is the most likely diagnosis. Laboratory evaluation for vasculitis would be reasonable. Vasculitides that could present in this fashion include: polyarteritis nodosa, mixed connective tissue disease, Wegner's granulomatosis, Churg‐Strauss angiitis, Sjogren's, hepatitis C with serum cryoglobulinemia and possibly rheumatoid arthritis. Given the history of fistula placement in the affected limb, vascular sufficiency must be assessed.
Anti‐nuclear antibodies and anti‐neutrophilic cytoplasmic antibodies were negative, and a C‐ reactive protein was 5.9 mg/L (normal range, 0 to 10 mg/L). The erythrocyte sedimentation rate was 32mm/hr (normal range, 0 to 20) and serologies for hepatitis B and C were negative. There was no evidence of serum cryoglobulins.
A modestly elevated sedimentation rate and normal C‐reactive protein argue against a diagnosis of vasculitis. The negative ANA, ANCA, hepatitis serologies and cryoglobulin tests render unlikely the diagnoses of polyarteritis nodosa, Wegner's granulomatosis, Churg‐Strauss angiitis, or hepatitis related cryoglobulinemia. Eosinophilia (present in Churg‐Strauss), ENA (positive in mixed connective tissue disease), anti‐SSA and SSB (positive in Sjogren's) and a rheumatoid factor would round out this evaluation for vasculitis. A left radial sensory nerve biopsy could also be of value in diagnosing vasculitic neuropathy in this patient.
Given the evidence against vasculitis, the possibility of ischemia due to vascular insufficiency is concerning. Two ischemic complications of hemodialysis are known to cause distal multiple mononeuropathies. The first, ischemic monomelic neuropathy syndrome is seen almost exclusively in diabetics. It is characterized by the development of acute pain, weakness of the forearm and hand muscles, and sensory loss within minutes or hours of AV graft placement. Transient occlusion of the blood supply to the nerves of the forearm and hand induces nerve ischemia, but does not cause necrosis of other tissues. The nerve conduction findings in this patient are consistent with ischemic monomelic neuropathy syndrome. The delayed onset of her symptoms, however, makes this diagnosis unlikely.
The second ischemic complication of hemodialysis, and the likelier diagnosis, is vascular steal syndrome. This has a similar clinical and electrodiagnostic presentation to ischemic monomelic neuropathy syndrome, but has a latency period after surgery of days to months. Vascular steal occurs when a reversal of blood flow into the fistula steals flow from the palmar arch arteries and induces ischemia of the vasa nervorum. Vascular studies should be obtained urgently when this diagnosis is considered.
Evaluation of the arteriovenous graft and vascular surgery consultation were sought. Digital photoplethysmography revealed diminished waveforms in all fingers of the left hand. Arterial Doppler evaluation of the left upper extremity confirmed low‐velocity flow in the radial and ulnar arteries and failed to confirm flow in the brachial artery distal to the arteriovenous fistula. The patient underwent an angiogram of the left axillary and brachial arteries. There was normal flow until the level of the arteriovenous fistula but minimal flow distal to the fistula (Fig. 2).
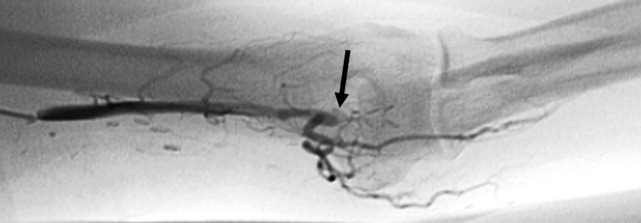
The diminished waveforms on digital photoplethysmography are consistent with poor perfusion distally. The angiogram suggests that the multiple mononeuropathies are a consequence of ischemia from impaired blood flow.
Consulting the vascular surgeons in this setting is essential because restoring adequate blood flow to the affected nerves can prevent further loss of function. Prognosis is dependent on many factors, including the severity of the functional loss and the duration of the symptoms prior to the restoration of blood flow. The patient's severe weakness and substantial muscle atrophy, manifestations of axonal degeneration, imply a poorer prognosis for recovery of function.
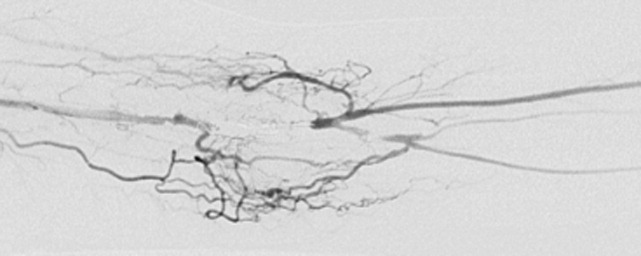
Embolization of the arteriovenous fistula was performed by interventional radiology. Post embolization angiograms demonstrated improved peripheral arterial flow (Fig. 3). One day later, the patient's finger flexion and extension improved. She reported mildly decreased dysesthesias and on examination her fingers were warmer to the touch. One month after discharge, her strength continued to be impaired, though improved and she still experienced pain.
COMMENTARY
Hospitalists must be equipped to recognize urgent and potentially reversible causes of neuropathy. The hospitalist should maintain a high index of suspicion for ischemia (either due to vasculitis or vascular compromise), traumatic nerve injury, nerve compression or entrapment, lymphoma or metastatic infiltration, hepatitis C with cryoglobulinemia, Guillain‐Barre syndrome and toxic exposures. Table 1 highlights important causes of mononeuropathy multiplex and summarizes associated findings and indicated diagnostic tests for specific evaluation.
| Diagnosis | Associated features | Specific evaluation |
|---|---|---|
| Axonal neuropathies | ||
| Ischemia (including vascular steal) | Poor arterial pulses, history of vascular surgery | Digital photoplethysmography, Doppler, angiography |
| Nerve compression and trauma | History of traumatic injury, mass, infection/abscess | MR neurography |
| Lymphoma or metastatic infiltration | History of known cancer, weight loss | PET, whole body CT, bone marrow biopsy |
| Vasculitis | Waxing and waning symptoms, association with connective tissue diseases, painful | CRP, ESR, Hepatitis C, cryoglobulins, ANA, ANCA, antibodies to SSA/SSB, ENA, eosinophil count, serum complement, SPEP/UPEP, RF, nerve biopsy |
| Neurosarcoidosis | Hilar lymphadenopathy, chronic cough | Chest CT, ACE, nerve biopsy |
| Lyme | Tick bite, erythema chronicum migrans | Lyme serology |
| Leprosy | Resident of southeast Asia, skin lesions | Skin smear for acid fast bacilli (mycobacterium), nerve biopsy |
| Demyelinating neuropathies | ||
| Lewis‐Sumner syndrome (i.e. asymmetric CIDP) | Relapsing remitting or chronic progressive course, areflexia | Lumbar puncture (increased spinal fluid protein common) |
| Hereditary neuropathy with liability to pressure palsy | Family history, recurrent episodes of entrapment/compression neuropathies | Genetic testing (deletion in the gene for peripheral myelin protein‐22) |
| Multifocal motor neuropathy with conduction block | Multifocal weakness in the distal arms/legs without sensory symptoms | Only motor abnormalities on nerve conduction including conduction block |
Another challenge for hospitalists is efficient evaluation of neuropathy. A systematic framework for creating a differential diagnosis and familiarity with available diagnostic tests is crucial. Hospitalists should be aware of three broad categories of neuropathy: mononeuropathy, polyneuropathy and mononeuropathy multiplex. Electrodiagnostic testing is essential to confirm the involved nerves and distinguishes axonal from demyelinating etiologies. Ultrasound, MR neurogram and, when indicated, nerve biopsy may be useful. Table 2 reviews these diagnostic tools as well as their indications and limitations.
| Test | Indications | Limitations |
|---|---|---|
| Electrodiagnostic Testing7 | Any peripheral neuropathy, muscle or neuromuscular junction disorder | Concomitant disease can reduce accuracy |
| Detects severity, chronicity, axonal v. demyelinating, diffuse v. focal, asymmetric v. symmetric | ||
| Electromyography (EMG) | EMG | EMG |
| Monopolar/concentric needle electrode inserted into the muscle belly | Differentiates axonal v. muscle damage; sensitive for even mild axon degeneration; localizes lesions. | Patient discomfort |
| Evaluates only motor fibers | ||
| Measures action potential at rest vs. during voluntary activation | Does not detect demyelination | |
| Might not be positive in first 21 days of symptoms | ||
| Nerve Conduction Studies (NCS) | NCS | NCS |
| Sensory | High sensitivity to differentiate axon loss from demyelination; localizes lesions. | Certain sensory responses lost with aging |
| Recording electrode placed over sensory nerve | ||
| Sensory nerve stimulated distally | Sensory localizes lesion to proximal vs. distal or to dorsal root ganglion | Less sensitive for mild axonal loss |
| Measures stimulus at proximal site | ||
| Motor | Motor amount of axonal loss | |
| Recording electrode placed over muscle belly | ||
| Motor nerve stimulated proximally | ||
| Measures stimulus at muscle | ||
| Specialized NCS tests | Specialized testing can identify radiculopathy, peripheral neuropathy, myasthenia gravis | |
| Ultrasound8 | ||
| Performed with typical ultrasound equipment | Suspected nerve entrapment | Doesn't show pathologic changes within nerves |
| Clinician must localize lesion for technician and explicitly guide test process | Evidence strongest for evaluation of median and ulnar nerves and Morton's neuroma | Difficult to visualize deep nerves or nerves surrounded by fat |
| Normal nerves appear tubular with linear echoes on a longitudinal scan; honeycomb on transverse scan | Detects lesions, nerve thickening, decreased echogenicity | Small field of view unless reconstructed |
| Results operator dependent | ||
| Less accurate than MRI for tumors | ||
| MRI9, 10 MR neurography | ||
| Standard MRI equipment | Concern regarding entrapment, trauma or mass lesions | Expense |
| Optimizes nerve resolution compared with surrounding tissues | To narrow differential when clinical and electrodiagnostic studies are inconclusive | Time (1560 minutes depending on scan requested) |
| When carpal tunnel syndrome does not respond to conservative management | ||
| Detects mass lesions compressing nerves, nerve enlargement and abnormal signal (neuritis, infiltration), increased signal in denervated muscle groups (once strength is 3 of 5). These changes can be seen as early at 4 days post trauma compared to 23 weeks on EMG. | ||
| Nerve Biopsy11 | ||
| Biopsy a nerve in the region of sensory loss or of a sensory nerve demonstrating electrophysiological abnormalities (decrease risk of adverse effects and to increase the likelihood of diagnosis | Rarely necessary | Painful, often for months |
| Concomitant muscle biopsy increases likelihood of diagnosing vasculitis or sarcoidosis | Use as last resort when evaluation not definitive | Risk of bleeding and infection |
| Greatest yield in multifocal neuropathies, or suspected amyloidotic polyneuropathy, vasculitis, sarcoidosis, lepromatous neuropathy, or rare hereditary disease where no genetic testing exists | ||
| Detects inflammation, amyloid deposits, tumor infiltration | ||
| Commonly targeted nerves include: LE sural, superficial peroneal, UE superficial radial |
Ischemic steal syndrome should be considered when neuropathy develops in a limb subsequent to arterio‐venous access procedures. Any vascular network, including the vertebral, carotid and coronary arteries, is at risk for steal. A feature common to all steal syndromes is the diversion of blood away from its original destination toward a lower pressure alternative. In some cases, this leads to a reversal of arterial flow and ischemia. Ischemic complications from AV access occur in 1‐9% of patients.1 Symptoms of steal can be mild, such as self‐limited dialysis induced pain, coldness and numbness, or severe, including severe pain, sensory and motor loss.2 If vascular compromise is sufficient, gangrene can ensue. Sensory deficits usually precede motor loss and the radial pulse is commonly absent or diminished. Other findings can include pallor of the fingers, muscle atrophy, resorption of the nail bed, and gangrene or ulcerations of the fingers. Risk factors for steal include atherosclerotic disease, female gender, age greater than 60 years, diabetes mellitus, previous surgery on the same arm, and use of the brachial artery as a donor.3 Symptoms of ischemic steal typically present within the first month after surgery, but can also be delayed; there is one report of a patient presenting one year postoperatively.4
Imaging studies such as doppler and angiography can be helpful in diagnosing ischemic steal syndrome. Fistulagrams may reveal a reversal of blood flow in the distal arm and hand, but these are reserved for cases with suspected proximal obstructive arterial disease.5 Vascular imaging studies can be misleading, however, as many patients will have physiologic but asymptomatic reversal of flow. Thus, a functional assessment such as digital plethysmography is recommended, especially in cases where clinical symptoms are vague. Digital pressures less than 60mmHg demonstrated 100% sensitivity and 87% specificity in one case control study of 40 patients.6 Treatment of ischemic steal syndrome is aimed at decreasing flow through the access shunt.
In conclusion, this case highlights the importance of timely and systematic evaluation of peripheral neuropathy in the hospital setting. Neuropathy with rapid progression and high potential for permanent damage necessitates early neurologic, or in this case, vascular consultation. Hospitalists should be facile in evaluating peripheral neuropathies and recognizing the appropriate indications for diagnostic tests and procedures.
- .Upper limb ischemia after vascular access surgery: differential diagnosis and management.Sem Dial2000;13:312–315.
- ,,,,,.Steal syndrome complicating hemodialysis access.Cardiovascular Surg (London, England)1997;5:648–653.
- ,,,,,.Onset of arterial ‘steal’ following proximal angioaccess: immediate and delayed types.Nephrol Dial Transplant2003;18:2387–2390.
- ,,,,.Incidence and characteristics of patients with hand ischemia after hemodialysis access procedure.J Surg Res1998;74:8–10
- ,,,,,.Ischemic steal syndrome: a case series and review of current management.Curr Surg2006;63:130–135.
- ,,,.Use of digital pressure measurements for the diagnosis of AV access‐induced hand ischemia.Vasc Med2006;11:227–231.
- ,.Electrodiagnostic testing of nerves and muscles: when, why, and how to order.Cleve Clin J Med2005;72:37–48.
- ,.High‐resolution sonography of the peripheral nervous system—a review of the literature.Eur J Neurol2004;11:305–314.
- ,,, et al.Role of magnetic resonance imaging in entrapment and compressive neuropathy‐what, where, and how to see the peripheral nerves on the musculoskeletal magnetic resonance image: part 2. Upper extremity.Eur Radiol2007;17:509–522.
- ,,,,,.The utility of magnetic resonance imaging in evaluating peripheral nerve disorders.Muscle Nerve2002;25:314–331.
- .Indications and usefulness of nerve biopsy.Arch Neurol2002;59:1532–1535.
A 60 year‐old woman with advanced kidney disease presented with one month of progressively worsening, sharp burning pain and decreased sensation in her left hand. Cold air exacerbated the pain. She noted decreasing ability to utilize her left fingers, a weakened grip and that the muscles in her hand looked smaller.
Localized sensory and motor symptoms in a discrete region of a single limb suggest neuropathy. The lack of symptoms in the face or ipsilateral lower extremity would dissuade a clinician from considering central etiologies; the presence of neuropathic pain is uncommon for cortical lesions. The involvement of motor and sensory nerves indicates peripheral nerve involvement.
The general approach to patients with peripheral neuropathy begins with identifying the neuropathy as a mononeuropathy (involving a single nerve), a polyneuropathy (symmetric involvement of multiple nerves) or a mononeuropathy multiplex (asymmetric involvement of multiple nerves). The patient, in this case, described subacute neuropathic pain, sensory loss, and weakness in her left hand in a distribution consistent with mononeuropathy or mononeuropathy multiplex.
This patient could have carpal tunnel syndrome given its prevalence in patients with advanced renal disease. The differential diagnosis is broad, however, and includes ulnar mononeuropathy, nerve ischemia due to vasculitis or vasculopathy, lower cervical radiculopathy (though the patient does not describe neck or radicular pain), lower brachial plexopathy, and complex regional pain syndrome.
The patient was diagnosed with advanced kidney disease one year ago when biopsy revealed focal segmental glomerulosclerosis secondary to lithium. Since her diagnosis, two grafts were placed in the left upper arm in anticipation of dialysis: the first, placed seven months prior to this admission, failed to mature; the second, placed one month prior to this admission, was complicated by bleeding at the fistula site and was not yet mature. Prior to this admission she had not required hemodialysis. Her past history included hypertension, dyslipidemia, hypothyroidism, secondary hyperparathyroidism, a remote history of cervical cancer (stage unknown, recent PAP smear negative), microcytosis and schizoaffective disorder. Her medications were furosemide, amlodipine, lisinopril, atenolol, atorvastatin, pantoprazole, olanzapine, levothyroxine, iron, darbepoetin, sevelamer, multivitamin and docusate.
Given the history of procedures in the left arm one should consider ischemic injury to the left median nerve. Other local complications could include compressive lesions such as an abscess or hematoma or direct nerve injury from the procedure. Carpal tunnel syndrome remains high on the differential due to its prevalence and because renal failure and hypothyroidism increase the risk of carpal tunnel syndrome.
A careful physical examination would localize the nerve or nerves involved. Examination findings that would be consistent with carpal tunnel syndrome include sensory loss in the distribution of the left median nerve, weakness of muscles innervated by the median nerve, including the abductor pollicus brevis and opponens muscles, and a Tinels and Phalens sign of the left wrist. A proximal median neuropathy resulting from ischemia or compression might also involve median‐innervated forearm muscle such as the pronator teres (forearm pronation) and flexor carpi radialis (hand flexion and abduction) muscles. Complex regional pain syndrome can be seen after a traumatic injury or surgery and is typified by severe neuropathic pain in a limb, often in combination with trophic changes in the affected extremity. A cervical radiculopathy would affect muscles supplied by the injured nerve root. For example, a C8 radiculopathy would affect all of the intrinsic hand muscles, the wrist and finger extensors, and the triceps brachii. A lower brachial plexopathy would present similarly to a lower cervical radiculopathy on clinical examination; electrodiagnostic evaluation would be necessary to distinguish these two disorders.
The patient appeared fatigued and her left hand was wrapped in blankets. Her vital signs were stable. There was no thyroid enlargement or lymphadenopathy. There was marked thenar, hypothenar and forearm atrophy on the left. Strength testing of her left hand demonstrated a grip strength of 2/5, finger extension and interosseous strength of 1/5, left wrist flexion and extension of 3/5; left biceps and triceps were 5/5. Sensation was mildly decreased to light touch, temperature, pain and proprioception throughout the left hand. Strength and sensation were intact in the right upper and bilateral lower extremities. Reflexes were 2+ throughout. The left radial pulse was diminished compared to the left ulnar that was 1+. The left hand was dry and cool. Laboratory evaluation revealed an elevated white blood cell count of 15,300/mm3, a hematocrit of 33 percent, mean corpuscular volume of 73 fL, and a normal platelet count. Electrolytes were consistent with advanced renal disease. The thyroid stimulating hormone level was normal.
The patient's examination reveals an injury to the sensory and motor components of the left ulnar, median, and distal radial nerves. The volar forearm wasting suggests proximal median motor nerve injury in the forearm. Because the triceps is spared, the weakness of finger and wrist extension implies distal radial motor nerve injury. The interosseous weakness is consistent with injury to the ulnar motor nerve. Weakness of grip and wrist flexion is less specific and it may be explained by injury to either the median or ulnar motor nerves. The diffuse sensory loss over the palmar and dorsal aspect of the left hand is consistent with neuropathic injury to the left median, ulnar, and radial sensory nerves. The preserved deep tendon reflexes are controlled by the musculocutaneous nerve (the biceps reflex) and branches arising from the proximal radial nerve (the triceps and brachioradialis reflexes), both of which are proximal to the apparent level of neuropathic insult.
Carpal tunnel syndrome is excluded since abnormalities extend beyond the median nerve distribution. The presentation is consistent with a mononeuropathy multiplex. Axonal etiologies of mononeuropathy multiplexincluding vasculitis, ischemia, neoplastic infiltration, and infectious etiologies such as Lyme diseaseare more common than demyelinating causes. Vasculitic neuropathy commonly involves the lower extremities and may have systemic symptoms, not present in this case. Neoplasm or other compressive lesions such as hematoma could explain these findings. Abscess must be considered given the leukocytosis. A lower brachial plexopathy, technically a mononeuropathy multiplex involving the proximal arm at the level of the brachial plexus, is also in the differential diagnosis. Another axonal disorder to consider would be neuralgic amyotrophy, an idiopathic form of acute brachial plexopathy associated with pain that is a complication of surgery that typically presents within a few hours to weeks of the procedure.
Demyelinating causes of mononeuropathy multiplex are less likely and include a variant of chronic inflammatory demyelinating polyneuropathy (Lewis‐Sumner syndrome) and hereditary neuropathy with liability to pressure palsies. Both processes are typically indolent and usually not painful, though the latter may present with fulminant numbness and weakness.
Nerve conduction and needle electromyography of the arm and cervical paraspinal muscles would differentiate axonal degeneration from demyelination. It would identify the affected nerves and any nerve root involvement. Given the concern for abscess or hematoma, MR neurography focused on the surgical site would also be important.
Electromyography and nerve conduction velocities demonstrated severe axonal loss of the left median, ulnar and distal radial sensory nerves consistent with acute denervation. A magnetic resonance neurogram following the course of these nerves revealed enlarged ulnar and median nerves with abnormal signal, but no compressive lesion (Fig. 1).
The electrodiagnostic testing is consistent with severe acute axonal injury to the left ulnar, median and radial nerves. This supports a diagnosis of mononeuropathy multiplex with axonal injury. Demyelinating causes are excluded at this point.
The MR neurogram demonstrates nonspecific nerve enlargement, which may be seen in ischemia, neoplastic processes (primary or metastatic), demyelinating disease, or, rarely, amyloidosis. Neoplastic involvement is unlikely in this case given the absence of a compressive mass lesion and the long segmental involvement of both the median and ulnar nerves. Compression from an abscess or hematoma is excluded. Neuralgic amyotrophy does not typically cause nerve enlargement.
Ischemia is the most likely diagnosis. Laboratory evaluation for vasculitis would be reasonable. Vasculitides that could present in this fashion include: polyarteritis nodosa, mixed connective tissue disease, Wegner's granulomatosis, Churg‐Strauss angiitis, Sjogren's, hepatitis C with serum cryoglobulinemia and possibly rheumatoid arthritis. Given the history of fistula placement in the affected limb, vascular sufficiency must be assessed.
Anti‐nuclear antibodies and anti‐neutrophilic cytoplasmic antibodies were negative, and a C‐ reactive protein was 5.9 mg/L (normal range, 0 to 10 mg/L). The erythrocyte sedimentation rate was 32mm/hr (normal range, 0 to 20) and serologies for hepatitis B and C were negative. There was no evidence of serum cryoglobulins.
A modestly elevated sedimentation rate and normal C‐reactive protein argue against a diagnosis of vasculitis. The negative ANA, ANCA, hepatitis serologies and cryoglobulin tests render unlikely the diagnoses of polyarteritis nodosa, Wegner's granulomatosis, Churg‐Strauss angiitis, or hepatitis related cryoglobulinemia. Eosinophilia (present in Churg‐Strauss), ENA (positive in mixed connective tissue disease), anti‐SSA and SSB (positive in Sjogren's) and a rheumatoid factor would round out this evaluation for vasculitis. A left radial sensory nerve biopsy could also be of value in diagnosing vasculitic neuropathy in this patient.
Given the evidence against vasculitis, the possibility of ischemia due to vascular insufficiency is concerning. Two ischemic complications of hemodialysis are known to cause distal multiple mononeuropathies. The first, ischemic monomelic neuropathy syndrome is seen almost exclusively in diabetics. It is characterized by the development of acute pain, weakness of the forearm and hand muscles, and sensory loss within minutes or hours of AV graft placement. Transient occlusion of the blood supply to the nerves of the forearm and hand induces nerve ischemia, but does not cause necrosis of other tissues. The nerve conduction findings in this patient are consistent with ischemic monomelic neuropathy syndrome. The delayed onset of her symptoms, however, makes this diagnosis unlikely.
The second ischemic complication of hemodialysis, and the likelier diagnosis, is vascular steal syndrome. This has a similar clinical and electrodiagnostic presentation to ischemic monomelic neuropathy syndrome, but has a latency period after surgery of days to months. Vascular steal occurs when a reversal of blood flow into the fistula steals flow from the palmar arch arteries and induces ischemia of the vasa nervorum. Vascular studies should be obtained urgently when this diagnosis is considered.
Evaluation of the arteriovenous graft and vascular surgery consultation were sought. Digital photoplethysmography revealed diminished waveforms in all fingers of the left hand. Arterial Doppler evaluation of the left upper extremity confirmed low‐velocity flow in the radial and ulnar arteries and failed to confirm flow in the brachial artery distal to the arteriovenous fistula. The patient underwent an angiogram of the left axillary and brachial arteries. There was normal flow until the level of the arteriovenous fistula but minimal flow distal to the fistula (Fig. 2).
The diminished waveforms on digital photoplethysmography are consistent with poor perfusion distally. The angiogram suggests that the multiple mononeuropathies are a consequence of ischemia from impaired blood flow.
Consulting the vascular surgeons in this setting is essential because restoring adequate blood flow to the affected nerves can prevent further loss of function. Prognosis is dependent on many factors, including the severity of the functional loss and the duration of the symptoms prior to the restoration of blood flow. The patient's severe weakness and substantial muscle atrophy, manifestations of axonal degeneration, imply a poorer prognosis for recovery of function.
Embolization of the arteriovenous fistula was performed by interventional radiology. Post embolization angiograms demonstrated improved peripheral arterial flow (Fig. 3). One day later, the patient's finger flexion and extension improved. She reported mildly decreased dysesthesias and on examination her fingers were warmer to the touch. One month after discharge, her strength continued to be impaired, though improved and she still experienced pain.
COMMENTARY
Hospitalists must be equipped to recognize urgent and potentially reversible causes of neuropathy. The hospitalist should maintain a high index of suspicion for ischemia (either due to vasculitis or vascular compromise), traumatic nerve injury, nerve compression or entrapment, lymphoma or metastatic infiltration, hepatitis C with cryoglobulinemia, Guillain‐Barre syndrome and toxic exposures. Table 1 highlights important causes of mononeuropathy multiplex and summarizes associated findings and indicated diagnostic tests for specific evaluation.
| Diagnosis | Associated features | Specific evaluation |
|---|---|---|
| Axonal neuropathies | ||
| Ischemia (including vascular steal) | Poor arterial pulses, history of vascular surgery | Digital photoplethysmography, Doppler, angiography |
| Nerve compression and trauma | History of traumatic injury, mass, infection/abscess | MR neurography |
| Lymphoma or metastatic infiltration | History of known cancer, weight loss | PET, whole body CT, bone marrow biopsy |
| Vasculitis | Waxing and waning symptoms, association with connective tissue diseases, painful | CRP, ESR, Hepatitis C, cryoglobulins, ANA, ANCA, antibodies to SSA/SSB, ENA, eosinophil count, serum complement, SPEP/UPEP, RF, nerve biopsy |
| Neurosarcoidosis | Hilar lymphadenopathy, chronic cough | Chest CT, ACE, nerve biopsy |
| Lyme | Tick bite, erythema chronicum migrans | Lyme serology |
| Leprosy | Resident of southeast Asia, skin lesions | Skin smear for acid fast bacilli (mycobacterium), nerve biopsy |
| Demyelinating neuropathies | ||
| Lewis‐Sumner syndrome (i.e. asymmetric CIDP) | Relapsing remitting or chronic progressive course, areflexia | Lumbar puncture (increased spinal fluid protein common) |
| Hereditary neuropathy with liability to pressure palsy | Family history, recurrent episodes of entrapment/compression neuropathies | Genetic testing (deletion in the gene for peripheral myelin protein‐22) |
| Multifocal motor neuropathy with conduction block | Multifocal weakness in the distal arms/legs without sensory symptoms | Only motor abnormalities on nerve conduction including conduction block |
Another challenge for hospitalists is efficient evaluation of neuropathy. A systematic framework for creating a differential diagnosis and familiarity with available diagnostic tests is crucial. Hospitalists should be aware of three broad categories of neuropathy: mononeuropathy, polyneuropathy and mononeuropathy multiplex. Electrodiagnostic testing is essential to confirm the involved nerves and distinguishes axonal from demyelinating etiologies. Ultrasound, MR neurogram and, when indicated, nerve biopsy may be useful. Table 2 reviews these diagnostic tools as well as their indications and limitations.
| Test | Indications | Limitations |
|---|---|---|
| Electrodiagnostic Testing7 | Any peripheral neuropathy, muscle or neuromuscular junction disorder | Concomitant disease can reduce accuracy |
| Detects severity, chronicity, axonal v. demyelinating, diffuse v. focal, asymmetric v. symmetric | ||
| Electromyography (EMG) | EMG | EMG |
| Monopolar/concentric needle electrode inserted into the muscle belly | Differentiates axonal v. muscle damage; sensitive for even mild axon degeneration; localizes lesions. | Patient discomfort |
| Evaluates only motor fibers | ||
| Measures action potential at rest vs. during voluntary activation | Does not detect demyelination | |
| Might not be positive in first 21 days of symptoms | ||
| Nerve Conduction Studies (NCS) | NCS | NCS |
| Sensory | High sensitivity to differentiate axon loss from demyelination; localizes lesions. | Certain sensory responses lost with aging |
| Recording electrode placed over sensory nerve | ||
| Sensory nerve stimulated distally | Sensory localizes lesion to proximal vs. distal or to dorsal root ganglion | Less sensitive for mild axonal loss |
| Measures stimulus at proximal site | ||
| Motor | Motor amount of axonal loss | |
| Recording electrode placed over muscle belly | ||
| Motor nerve stimulated proximally | ||
| Measures stimulus at muscle | ||
| Specialized NCS tests | Specialized testing can identify radiculopathy, peripheral neuropathy, myasthenia gravis | |
| Ultrasound8 | ||
| Performed with typical ultrasound equipment | Suspected nerve entrapment | Doesn't show pathologic changes within nerves |
| Clinician must localize lesion for technician and explicitly guide test process | Evidence strongest for evaluation of median and ulnar nerves and Morton's neuroma | Difficult to visualize deep nerves or nerves surrounded by fat |
| Normal nerves appear tubular with linear echoes on a longitudinal scan; honeycomb on transverse scan | Detects lesions, nerve thickening, decreased echogenicity | Small field of view unless reconstructed |
| Results operator dependent | ||
| Less accurate than MRI for tumors | ||
| MRI9, 10 MR neurography | ||
| Standard MRI equipment | Concern regarding entrapment, trauma or mass lesions | Expense |
| Optimizes nerve resolution compared with surrounding tissues | To narrow differential when clinical and electrodiagnostic studies are inconclusive | Time (1560 minutes depending on scan requested) |
| When carpal tunnel syndrome does not respond to conservative management | ||
| Detects mass lesions compressing nerves, nerve enlargement and abnormal signal (neuritis, infiltration), increased signal in denervated muscle groups (once strength is 3 of 5). These changes can be seen as early at 4 days post trauma compared to 23 weeks on EMG. | ||
| Nerve Biopsy11 | ||
| Biopsy a nerve in the region of sensory loss or of a sensory nerve demonstrating electrophysiological abnormalities (decrease risk of adverse effects and to increase the likelihood of diagnosis | Rarely necessary | Painful, often for months |
| Concomitant muscle biopsy increases likelihood of diagnosing vasculitis or sarcoidosis | Use as last resort when evaluation not definitive | Risk of bleeding and infection |
| Greatest yield in multifocal neuropathies, or suspected amyloidotic polyneuropathy, vasculitis, sarcoidosis, lepromatous neuropathy, or rare hereditary disease where no genetic testing exists | ||
| Detects inflammation, amyloid deposits, tumor infiltration | ||
| Commonly targeted nerves include: LE sural, superficial peroneal, UE superficial radial |
Ischemic steal syndrome should be considered when neuropathy develops in a limb subsequent to arterio‐venous access procedures. Any vascular network, including the vertebral, carotid and coronary arteries, is at risk for steal. A feature common to all steal syndromes is the diversion of blood away from its original destination toward a lower pressure alternative. In some cases, this leads to a reversal of arterial flow and ischemia. Ischemic complications from AV access occur in 1‐9% of patients.1 Symptoms of steal can be mild, such as self‐limited dialysis induced pain, coldness and numbness, or severe, including severe pain, sensory and motor loss.2 If vascular compromise is sufficient, gangrene can ensue. Sensory deficits usually precede motor loss and the radial pulse is commonly absent or diminished. Other findings can include pallor of the fingers, muscle atrophy, resorption of the nail bed, and gangrene or ulcerations of the fingers. Risk factors for steal include atherosclerotic disease, female gender, age greater than 60 years, diabetes mellitus, previous surgery on the same arm, and use of the brachial artery as a donor.3 Symptoms of ischemic steal typically present within the first month after surgery, but can also be delayed; there is one report of a patient presenting one year postoperatively.4
Imaging studies such as doppler and angiography can be helpful in diagnosing ischemic steal syndrome. Fistulagrams may reveal a reversal of blood flow in the distal arm and hand, but these are reserved for cases with suspected proximal obstructive arterial disease.5 Vascular imaging studies can be misleading, however, as many patients will have physiologic but asymptomatic reversal of flow. Thus, a functional assessment such as digital plethysmography is recommended, especially in cases where clinical symptoms are vague. Digital pressures less than 60mmHg demonstrated 100% sensitivity and 87% specificity in one case control study of 40 patients.6 Treatment of ischemic steal syndrome is aimed at decreasing flow through the access shunt.
In conclusion, this case highlights the importance of timely and systematic evaluation of peripheral neuropathy in the hospital setting. Neuropathy with rapid progression and high potential for permanent damage necessitates early neurologic, or in this case, vascular consultation. Hospitalists should be facile in evaluating peripheral neuropathies and recognizing the appropriate indications for diagnostic tests and procedures.
- .Upper limb ischemia after vascular access surgery: differential diagnosis and management.Sem Dial2000;13:312–315.
- ,,,,,.Steal syndrome complicating hemodialysis access.Cardiovascular Surg (London, England)1997;5:648–653.
- ,,,,,.Onset of arterial ‘steal’ following proximal angioaccess: immediate and delayed types.Nephrol Dial Transplant2003;18:2387–2390.
- ,,,,.Incidence and characteristics of patients with hand ischemia after hemodialysis access procedure.J Surg Res1998;74:8–10
- ,,,,,.Ischemic steal syndrome: a case series and review of current management.Curr Surg2006;63:130–135.
- ,,,.Use of digital pressure measurements for the diagnosis of AV access‐induced hand ischemia.Vasc Med2006;11:227–231.
- ,.Electrodiagnostic testing of nerves and muscles: when, why, and how to order.Cleve Clin J Med2005;72:37–48.
- ,.High‐resolution sonography of the peripheral nervous system—a review of the literature.Eur J Neurol2004;11:305–314.
- ,,, et al.Role of magnetic resonance imaging in entrapment and compressive neuropathy‐what, where, and how to see the peripheral nerves on the musculoskeletal magnetic resonance image: part 2. Upper extremity.Eur Radiol2007;17:509–522.
- ,,,,,.The utility of magnetic resonance imaging in evaluating peripheral nerve disorders.Muscle Nerve2002;25:314–331.
- .Indications and usefulness of nerve biopsy.Arch Neurol2002;59:1532–1535.
Handoffs
To the seasoned intensivist, discussions with family members of critically ill patients in the intensive care unit (ICU) can be very predictable. However, this does not imply that these dialogues are straightforward or simple. Each day, we spend a significant amount of time meeting with family members at different stages of their loved one's ICU stay. Some family members are satisfied with these exchanges while others leave them distraught or in emotional shambles. At times, intensivists do not always effectively communicate with family members.13 Both the team and the families come to the ICU table with different sets of perspectives, expectations, conversational skill sets, life experiences, and tolerances for stress. These differences are magnified when the ICU course turns rocky.
We thought it useful to illustrate ICU dialogues with family members as we perceive them. We focus on the potential checkpoints where miscommunication and misunderstanding may occur throughout the roller coaster ICU experience. To this end, over the past few years, our Critical Care Medicine group has been collecting thought‐provoking comments from various family conferences. Herein, we present the dynamic phases of an ICU encounter contextually inserting relevant quotes.
The specter of a loved one lying helplessly in an ICU bed, attached to imposing machines, with tubes coming out on all sides can be quite numbing and frightening. No amount of schooling or training can really prepare a person for this emotionally taxing situation. Disbelief reigns! We frequently hear, How can a person go from being fine one day to being so sick the next? or He was shoveling snow just last week! or, She was just fine after surgery, talking, walking, and eating.
Not only is the ICU a strange and scary place, but oftentimes, in the midst of our first meeting with family members of newly admitted ICU patients, we quickly realize that they are not really sure who we are or what we do. It seems to us that Critical Care Medicine as a medical specialty suffers from a lack of brand recognition. Often the family members say, You're a what? An intensivist? We've never heard of an intensivist. Do you also work in the Emergency Room? I heard someone mention critical care, is that the same as intensive care? Or sometimes we get whacked, What about getting a real doctor, like a cardiologist or a pulmonologist!
Family members immediately find different ways to let us know how much the patient means to them. They try to impress upon us the vitality and unique nature of their loved ones in the hope that this will make us all work harder. He's a real fighter and never gives up. Or He's a young and healthy 90. Or You have to take extra care of her, she's very special, she's the mother of eight children. Sometimes political or social connections are used to further incentivize or push the ICU team. He's best friends with Mr. Z who is on the Board of Trustees, or She's friends with this or that politician.
But, Google has really altered the nature of our family discussions; everyone, it seems, can now be a doctor. We used to hear I'm not a doctor, but Now, the inevitable internet search leads to I've been doing some reading on the web about this new drug and I've heard that it's a wonder drug. Why isn't my mother getting it? Or What is the APACHE III score of my sister and how are you using this value?
Just as intensivists regularly look at reams of lab data and calculate all types of organ failure and prognostication scores, family members similarly reframe the ICU discussion to a numbers game. This approach to seemingly getting our arms around the complicated big picture is used in many aspects of our lives, whether tracking our retirement portfolios or determining the odds of next week's football game. Doctor, what are her chances for improvement ‐ 50/50, 30/70 or 80/20? Even one in a million? Over time, family members even become experts at looking at the bedside monitors and devices. I've been watching the numbers, I see that the heart rate is down and you were able to decrease the oxygen on the respirator to 80%, and the blood oxygen is still over 90%, so my father must be better, right?
As the days go by, some families become more desperate. They seek good news or even any news from every person they meet. And the ICU environment certainly offers family members a myriad of people with whom to converse. Unfortunately, this frantic search for information leads them to receive conflicting and unreliable data. Frustration results, Why do we keep getting mixed messages? Or, Doctor, we like the hospital, but why can't all of you get the story straight? As family members gather together with other patients' families in the waiting room day and night, they often share their ICU stories with each other. We'll overhear someone say, What about the new antibiotic the patient in Bed 8 is getting? Shouldn't my husband be getting that too? I see everyone is gowning up, I keep hearing about that bad Staph bug going around, my father better not catch it.
Occasionally we become concerned, even perplexed, when we cannot successfully convey our message to the family despite our best intentions and efforts. Some families are just in denial; the reality of no progress and/or likely poor outcome cannot be heard, much less accepted. Doctor, I have been badgered with the truth enough. I just don't want to believe it. Or, Doctor, don't you ever have any good news to report to us? The insatiable need for prolonged and repetitive family conferences may deflect time away from the care of other patients and meeting with other families.
Unfortunately, some patients get stuck in the ICU, either not improving, or just steadily deteriorating despite aggressive care. We broach treatment limitation or end of life care with the family as we realize that further ICU care is not going to be beneficial. Sometimes this news is greeted with stunned silence. The family often pleads for their loved one to be able to stay a little bit longer in the ICU, Let's just see how he does for a few more days or over the weekend. Or, We just need to buy some more time until everything turns around. Or other approaches are used to postpone the inevitable ICU transfer. Doctor, our 50th wedding anniversary is in two weeks, so let's continue to keep him in the ICU. Or, You can't discharge my mother, she averages 14.5 alarms per hour, how can the ward ever take care of her?
And then comes the quest for the miracle, Don't you believe in miracles? Haven't you ever seen someone in this condition get better? Are you giving up? We'll never give up! Or, ignoring the express wishes of the patient, Oh, Doctor, my father did have an advanced directive, but I'm not sure whether I want to give it to you. Or, the message now gets personal What would you do if this was your mother or father?
Such questions highlight the existential dichotomy of critical care. As intensivists, we sometimes have to reconcile the family members' unrealistic view of prognosis, overly hopeful expectations, and desire for endless futile ICU care with our own understandings of prognosis, goals of care, and appropriate use of ICU beds. Where, and when should we draw the line? How do we all let go?4
This collection of comments and thoughts reflects a synthesis of many different discussions conducted under diverse conditions. Thankfully, not all of the individual elements of the scenario described above occur with each patient. Family members and intensivists commonly have amicable discourse resulting in an acceptable degree of understanding and consensus regarding the prognosis and care plan. However, on occasion, things just don't go as well as hoped for, neither in clinical outcomes nor in our discussions. While effective ICU communication strategies have been designed and studied,512 even the best of these may not prevent conflict and disagreement. Nevertheless, our challenge as critical care practitioners is to ensure that our dialogues with family members are honest and direct and that we communicate in a timely, consistent and empathetic manner.
Well, onto the next family meeting!
Acknowledgements
The authors thank the current and past critical care fellows for their contributions to this manuscript. We are particularly indebted to the ICU nurses, patient representatives and social workers of the Memorial Sloan‐Kettering Cancer Center, New York, New York who provide daily clinical and emotional support to our ICU patients and their families and to the CCM attending team.
- ,,, et al.Half the families of intensive care unit patients experience inadequate communication with physicians.Crit Care Med2000;28(8):3044–3049.
- ,,, et al.Missed opportunities during family conferences about end‐of‐life care in the intensive care unit.Am J Respir Crit Care Med2005;171:844–849.
- ,.Impact on family satisfaction: The Critical Care Family Assistance Program.Chest2005;128:76S–80S.
- .The art of letting go.NEJM2007;357:3–5.
- ,,, et al.The family conference as a focus to improve communication about end‐of‐life care in the intensive care unit: opportunities for improvement.Crit Care Med2001;29:suppl 2:N26–N33.
- ,,, et al.A communication strategy and brochure for relatives of patients dying in the ICU.N Engl J Med2007:356:469–478.
- ,.The healing power of listening in the ICU.N Engl J Med2007;356:513–515.
- ,.The pressure to withhold or withdraw life‐sustaining therapy from critically ill patients in the United States.Am J Respir Crit Care Med2007;175(11):1104–1108.
- ,,, et al.An intensive communication intervention for the critically ill.Am J Med2000;109:469–475.
- ,,.Improving family communications at the end of life: implications for length of stay in the intensive care unit and resource use.Am J Crit Care2003;12(4)317–323.
- ,,, et al.Conflict associated with decisions to limit life‐sustaining treatment in intensive care units.J Gen Intern Med2001;16(5)339–341.
- ,,, et al.Families looking back: one year after discussion of withdrawal or withholding of life‐sustaining support.Crit Care Med2001;29(1)197–201.
To the seasoned intensivist, discussions with family members of critically ill patients in the intensive care unit (ICU) can be very predictable. However, this does not imply that these dialogues are straightforward or simple. Each day, we spend a significant amount of time meeting with family members at different stages of their loved one's ICU stay. Some family members are satisfied with these exchanges while others leave them distraught or in emotional shambles. At times, intensivists do not always effectively communicate with family members.13 Both the team and the families come to the ICU table with different sets of perspectives, expectations, conversational skill sets, life experiences, and tolerances for stress. These differences are magnified when the ICU course turns rocky.
We thought it useful to illustrate ICU dialogues with family members as we perceive them. We focus on the potential checkpoints where miscommunication and misunderstanding may occur throughout the roller coaster ICU experience. To this end, over the past few years, our Critical Care Medicine group has been collecting thought‐provoking comments from various family conferences. Herein, we present the dynamic phases of an ICU encounter contextually inserting relevant quotes.
The specter of a loved one lying helplessly in an ICU bed, attached to imposing machines, with tubes coming out on all sides can be quite numbing and frightening. No amount of schooling or training can really prepare a person for this emotionally taxing situation. Disbelief reigns! We frequently hear, How can a person go from being fine one day to being so sick the next? or He was shoveling snow just last week! or, She was just fine after surgery, talking, walking, and eating.
Not only is the ICU a strange and scary place, but oftentimes, in the midst of our first meeting with family members of newly admitted ICU patients, we quickly realize that they are not really sure who we are or what we do. It seems to us that Critical Care Medicine as a medical specialty suffers from a lack of brand recognition. Often the family members say, You're a what? An intensivist? We've never heard of an intensivist. Do you also work in the Emergency Room? I heard someone mention critical care, is that the same as intensive care? Or sometimes we get whacked, What about getting a real doctor, like a cardiologist or a pulmonologist!
Family members immediately find different ways to let us know how much the patient means to them. They try to impress upon us the vitality and unique nature of their loved ones in the hope that this will make us all work harder. He's a real fighter and never gives up. Or He's a young and healthy 90. Or You have to take extra care of her, she's very special, she's the mother of eight children. Sometimes political or social connections are used to further incentivize or push the ICU team. He's best friends with Mr. Z who is on the Board of Trustees, or She's friends with this or that politician.
But, Google has really altered the nature of our family discussions; everyone, it seems, can now be a doctor. We used to hear I'm not a doctor, but Now, the inevitable internet search leads to I've been doing some reading on the web about this new drug and I've heard that it's a wonder drug. Why isn't my mother getting it? Or What is the APACHE III score of my sister and how are you using this value?
Just as intensivists regularly look at reams of lab data and calculate all types of organ failure and prognostication scores, family members similarly reframe the ICU discussion to a numbers game. This approach to seemingly getting our arms around the complicated big picture is used in many aspects of our lives, whether tracking our retirement portfolios or determining the odds of next week's football game. Doctor, what are her chances for improvement ‐ 50/50, 30/70 or 80/20? Even one in a million? Over time, family members even become experts at looking at the bedside monitors and devices. I've been watching the numbers, I see that the heart rate is down and you were able to decrease the oxygen on the respirator to 80%, and the blood oxygen is still over 90%, so my father must be better, right?
As the days go by, some families become more desperate. They seek good news or even any news from every person they meet. And the ICU environment certainly offers family members a myriad of people with whom to converse. Unfortunately, this frantic search for information leads them to receive conflicting and unreliable data. Frustration results, Why do we keep getting mixed messages? Or, Doctor, we like the hospital, but why can't all of you get the story straight? As family members gather together with other patients' families in the waiting room day and night, they often share their ICU stories with each other. We'll overhear someone say, What about the new antibiotic the patient in Bed 8 is getting? Shouldn't my husband be getting that too? I see everyone is gowning up, I keep hearing about that bad Staph bug going around, my father better not catch it.
Occasionally we become concerned, even perplexed, when we cannot successfully convey our message to the family despite our best intentions and efforts. Some families are just in denial; the reality of no progress and/or likely poor outcome cannot be heard, much less accepted. Doctor, I have been badgered with the truth enough. I just don't want to believe it. Or, Doctor, don't you ever have any good news to report to us? The insatiable need for prolonged and repetitive family conferences may deflect time away from the care of other patients and meeting with other families.
Unfortunately, some patients get stuck in the ICU, either not improving, or just steadily deteriorating despite aggressive care. We broach treatment limitation or end of life care with the family as we realize that further ICU care is not going to be beneficial. Sometimes this news is greeted with stunned silence. The family often pleads for their loved one to be able to stay a little bit longer in the ICU, Let's just see how he does for a few more days or over the weekend. Or, We just need to buy some more time until everything turns around. Or other approaches are used to postpone the inevitable ICU transfer. Doctor, our 50th wedding anniversary is in two weeks, so let's continue to keep him in the ICU. Or, You can't discharge my mother, she averages 14.5 alarms per hour, how can the ward ever take care of her?
And then comes the quest for the miracle, Don't you believe in miracles? Haven't you ever seen someone in this condition get better? Are you giving up? We'll never give up! Or, ignoring the express wishes of the patient, Oh, Doctor, my father did have an advanced directive, but I'm not sure whether I want to give it to you. Or, the message now gets personal What would you do if this was your mother or father?
Such questions highlight the existential dichotomy of critical care. As intensivists, we sometimes have to reconcile the family members' unrealistic view of prognosis, overly hopeful expectations, and desire for endless futile ICU care with our own understandings of prognosis, goals of care, and appropriate use of ICU beds. Where, and when should we draw the line? How do we all let go?4
This collection of comments and thoughts reflects a synthesis of many different discussions conducted under diverse conditions. Thankfully, not all of the individual elements of the scenario described above occur with each patient. Family members and intensivists commonly have amicable discourse resulting in an acceptable degree of understanding and consensus regarding the prognosis and care plan. However, on occasion, things just don't go as well as hoped for, neither in clinical outcomes nor in our discussions. While effective ICU communication strategies have been designed and studied,512 even the best of these may not prevent conflict and disagreement. Nevertheless, our challenge as critical care practitioners is to ensure that our dialogues with family members are honest and direct and that we communicate in a timely, consistent and empathetic manner.
Well, onto the next family meeting!
Acknowledgements
The authors thank the current and past critical care fellows for their contributions to this manuscript. We are particularly indebted to the ICU nurses, patient representatives and social workers of the Memorial Sloan‐Kettering Cancer Center, New York, New York who provide daily clinical and emotional support to our ICU patients and their families and to the CCM attending team.
- ,,, et al.Half the families of intensive care unit patients experience inadequate communication with physicians.Crit Care Med2000;28(8):3044–3049.
- ,,, et al.Missed opportunities during family conferences about end‐of‐life care in the intensive care unit.Am J Respir Crit Care Med2005;171:844–849.
- ,.Impact on family satisfaction: The Critical Care Family Assistance Program.Chest2005;128:76S–80S.
- .The art of letting go.NEJM2007;357:3–5.
- ,,, et al.The family conference as a focus to improve communication about end‐of‐life care in the intensive care unit: opportunities for improvement.Crit Care Med2001;29:suppl 2:N26–N33.
- ,,, et al.A communication strategy and brochure for relatives of patients dying in the ICU.N Engl J Med2007:356:469–478.
- ,.The healing power of listening in the ICU.N Engl J Med2007;356:513–515.
- ,.The pressure to withhold or withdraw life‐sustaining therapy from critically ill patients in the United States.Am J Respir Crit Care Med2007;175(11):1104–1108.
- ,,, et al.An intensive communication intervention for the critically ill.Am J Med2000;109:469–475.
- ,,.Improving family communications at the end of life: implications for length of stay in the intensive care unit and resource use.Am J Crit Care2003;12(4)317–323.
- ,,, et al.Conflict associated with decisions to limit life‐sustaining treatment in intensive care units.J Gen Intern Med2001;16(5)339–341.
- ,,, et al.Families looking back: one year after discussion of withdrawal or withholding of life‐sustaining support.Crit Care Med2001;29(1)197–201.
Case Report: Failure at the Transition of Care
The patient is an 86‐year‐old woman with a history of mild dementia, major depression with psychotic features, congestive heart failure, hypertension, hyperlipidemia, osteoporosis, and hypothyroidism. She presented to her primary care physician (PCP) complaining of 4 days of bilateral lower extremity edema and dyspnea on exertion. She was admitted to the hospitalist service for exacerbation of congestive heart failure.
MEDICATIONS
Donepezil, olanzapine, mirtazapine, sertraline, spironolactone, triamterene/hydrochlorothizide, simvastatin, alendronate, levothyroxine, multivitamin.
SOCIAL HISTORY
She lived alone in an independent‐living retirement apartment that provided meals but not medical care, and she was able to function independently in her activities of daily living. Her pharmacy delivered her medications via courier service, whereas visiting home nurses filled her medication box and checked on her status weekly.
HOSPITAL COURSE
Admission vitals were: heart rate, 83; blood pressure, 158/84; respiratory rate, 20; temperature, 36.4, and saturation, 95% on room air. Echocardiogram revealed intact ejection fraction, left ventricular hypertrophy, and impaired relaxation. A TSH of 6.6 demonstrated undertreated hypothyroidism. Telemetry monitoring was significant for frequent short bursts of narrow‐complex tachycardia without clear atrial activity. The etiology of her heart failure exacerbation was presumed to be paroxysmal atrial fibrillation in the setting of diastolic dysfunction. Given her mild hyperkalemia (5.1), her diuretics were changed to monotherapy with furosemide. Low‐dose beta blockade and antithrombotic therapy were started as well as increased supplementation of levothyroxine. After several days of diuresis, her potassium had normalized, she tolerated initiation of a new ACE inhibitor, and her dyspnea had resolved. On the last hospital day, her dentures were accidentally discarded with her breakfast tray, causing her great distress.
On discharge she was on 4 new medications, 2 old medications had been stopped, and 1 prior medication's dose had been increased. During medication reconciliation, the patient reported that she had not been taking olanzapine for weeks, and thus this was omitted from her home health medication orders, with instructions to discuss with her PCP on first follow‐up within the week. The patient was provided with congestive heart failure instructions and a complete medication list. Unfortunately, the day of discharge was the first day of a holiday weekend.
Case management was unavailable on the weekend; her out‐of‐state family member was unable to be reached by phone, and her usual pharmacy courier service was closed. As she did not have a friend or family member to pick up her prescriptions from an alternate pharmacy, her prescriptions were provided as handwritten scripts, called in to her pharmacy's voice mail, and written on the home health orders. The patient was discharged to her home with communication to her PCP via telephone, e‐mail, and electronic discharge summary.
POSTDISCHARGE
Medications were not delivered to the patient until the third postdischarge day. Three days after discharge, the daughter from out of state left a message for the PCP expressing concern that the patient was failingnot eating or taking any of her medications. An expedited home nursing visit was arranged. Five days after discharge, the pharmacist called the PCP stating he had not received a prescription for the beta‐blocker. Her PCP saw the patient in clinic 6 days after discharge and reconciled the medication list, restarting the olanzapine that the patient had stopped a few weeks before and the mirtazapine, which had not been restarted despite its presence on the discharge orders and patient instructions. She continued to have poor appetite and mood and was taking her medications only with great effort from her visiting nurse and staff at the retirement community. A major cause of this decline was the significant worsening of her depression brought on by hospitalization, lapses in her psychiatric medications, and emotional distress induced by the loss of her dentures during her hospital stay. She was readmitted 10 days after her discharge because she was unable to care for herself.
DISCUSSION
This case demonstrates numerous pitfalls in the transition process. Despite communication between the hospitalists and the PCP and a common electronic medical record, this patient failed the transition from the acute care hospital to the ambulatory setting. On the holiday weekend, ancillary support services were unavailable, including case management to contact her home care agency and her pharmacy to fill and deliver her new prescriptions. Despite efforts by the discharging physician, the out‐of‐town family could not be contacted. Thus, an elderly woman with cognitive impairment was left to process a new diagnosis and 7 medication changes with an unreliable mechanism to obtain her new medications.
With the rise of hospital medicine, it has increasingly been recognized that transitions represent a point of vulnerability in the care of geriatric patients. A change in physical location of care and handoffs between caregivers create the potential for error and loss of information. Prior research has demonstrated frequent quantitative and qualitative deficiencies in the information conveyed between inpatient and outpatient physicians, with direct communication occurring less than 20% of the time.1 In this case, communication occurred between the hospitalists and the outpatient physician, demonstrating that communication is just one element of successful transitions.
Components of effective care transitions have been described in the literature, including: preparation of the patient and caregiver for the transition, medication reconciliation, instructions to patient and caregiver about symptoms and signs of worsening, and an explicit follow‐up plan for tests and appointments.2 Optimally, there is interactive discussion between the hospitalist and the receiving clinician with a summary of events including an updated medication, allergy, and problem list, current advance directives, and a common plan of care.2 This case illustrates that these elements are necessary but may not be sufficient.
Some interventions have been found to be effective. A nurse‐led multidisciplinary approach to the discharge of elderly patients with congestive heart failure led to decreased readmission rates after 90 days and was found to be a cost‐saving measure.3 Similar results have been seen in geriatric patients with a variety of diagnoses in trials using advanced‐practice nurses to bridge the vulnerable period of discharge or by interventions to improve the ability of family caregivers to handle the challenges of the transition.46 Individualized attention to the unique needs of each patient and members of their social support structure, and investment in resources to do so, has the ability to decrease readmissions.
Medication errors, medication omissions, or the inability to fill medications on discharge represent a patient safety challenge. There has been increasing emphasis on medication reconciliation at admission and discharge, but in some cases the gold standard medication list is hard to determine. Electronic medical records would seem to be a natural solution to this problem, but as this case illustrates, the electronic record may not reflect the reality of patient adherence. As in this case, clarification may require another visit with the primary provider, leaving a period of time with an uncertain medication list and therefore a vulnerable patient. Access to medications after discharge was also a problem in this case, but this is not rare. A 2001 study found that 2 days after discharge from a general medicine hospital service, 1 in 5 patients had been unable to obtain all discharge medications.7 A pharmacist‐led medication reconciliation intervention in nursing home patients led to decreases in length of stay and discrepancy‐related adverse drug events. Furthermore, a follow‐up call allowed for clarification of medication questions in 25% of cases.7, 8
Patient characteristics such as depression and cognitive dysfunction have been found to affect readmission rates and are important to assess in addressing risk for poor outcomes after discharge. A 2000 study comparing readmission rates after discharge from a geriatric rehabilitation hospital found that patients with depression had an odds ratio of 3.5 for readmission compared with those without depression.9 Inadequate health literacy is also associated with decreased ability to self‐manage chronic disease and is associated with increased risk of mortality in community‐dwelling elderly such as the patient in this case.10 Asking patients or their proxies to explain their own understanding of the discharge plan can unmask comprehension issues that otherwise may go undetected.
Discharge on a weekend presents a period of critical vulnerability. Early recognition that a transition is susceptible to failure allows the events necessary for success to occur during the week when services are available. An example in the present case might include having had the pharmacy fill the prescriptions prior to the day of discharge. This does introduce a new opportunity for error in cases in which the plan of care changes but would have solved the inability to have prescriptions filled once the holiday weekend had begun.
In cases in which the usual mechanisms break down, increased effort on the part of the hospitalist can usually create a unique solution to the problem. Examples of creative solutions that did not occur in this case might include contacting the manager of the patient's retirement apartment to determine if this individual might be willing to fill prescriptions at an alternate pharmacy. A better alternative would be to change the system such that the solution is readily accessible and time efficient. Weekend availability of case management would be one such step. A means for the hospital's inpatient pharmacy to provide 2‐3 days of bridging medications would prevent weekend prescription access from affecting timely discharges of multiple patients over the course of a year. The hospitalist is in a unique position to take a leadership role in effecting system change to address these issues.
Ultimately, it is the duty of the hospitalist to take responsibility for the safety and well‐being of the patient, and if no solution can be found, it may be necessary to hold discharge or find an alternate disposition until logistical hurdles have been overcome. Indeed, for patients admitted for myocardial infarction, discharges were less likely to occur on weekends, presumably because of lack of ancillary services.11 With foresight, creative problem solving, and systems improvement, this should rarely be necessary.
Transitions continue to be a difficult time for the most vulnerable patients. Intense efforts have improved outcomes in selected populations but have not been broadly applied. Identification of patients at the highest risk, such as those with depression, poor social support, and cognitive limitations, would allow anticipation of difficult transitions and potential utilization of proven interventions, such as advanced‐practice nurses or follow‐up pharmacy contact. Processes such as these might have prevented some of the problems in this patient's discharge. Appreciation of the weekend discharge as a time of particular challenges allows barriers to be identified and solutions created during the week, when resources are still available. Attention to all elements of effective transitions should become part of the growing culture of patient safety.
- ,,, et al.Deficits in communication and information transfer between hospital‐based and primary care physicians: implications for patient safety and continuity of care.JAMA.2007;297:831–841.
- .Falling through the cracks: challenges and opportunities for improving transitional care for persons with continuous complex care needs.J Am Geriatr Soc.2003;51:549–555.
- ,,, et al.A multidisciplinary intervention to prevent the readmission of elderly patients with congestive heart failure.N Engl J Med.1995;333:1190–1195.
- ,,, et al.Comprehensive discharge planning and home follow‐up of hospitalized elders: a randomized clinical trial.JAMA.1999;281:613–620.
- ,,, et al.Comprehensive discharge planning for the hospitalized elderly: a randomized clinical trial.Ann Intern Med.1994;120:999–1006.
- ,,, et al.Preparing patients and caregivers to participate in care delivered across settings: the care transitions intervention.J Am Geriatr Soc.2004;52:1817–1825.
- ,,, et al.The impact of follow‐up telephone calls to patients after hospitalization.Am J Med.2001;111:26S–30S.
- ,,, et al.Medication reconciliation for reducing drug discrepancy adverse events.Am J Geriatr Pharmacother.2006;4:236–243.
- ,,, et al.Depression and activities of daily living predict rehospitalization within 6 months of discharge from geriatric rehabilitation.Rehabil Psychol.2004;49:219–223.
- ,,, et al.Health literacy and mortality among elderly persons.Arch Intern Med.2007;167:1503–1509.
- ,,, et al.Restricted weekend service inappropriately delays discharge after acute myocardial infarction.Heart.2002;87:216–219.
The patient is an 86‐year‐old woman with a history of mild dementia, major depression with psychotic features, congestive heart failure, hypertension, hyperlipidemia, osteoporosis, and hypothyroidism. She presented to her primary care physician (PCP) complaining of 4 days of bilateral lower extremity edema and dyspnea on exertion. She was admitted to the hospitalist service for exacerbation of congestive heart failure.
MEDICATIONS
Donepezil, olanzapine, mirtazapine, sertraline, spironolactone, triamterene/hydrochlorothizide, simvastatin, alendronate, levothyroxine, multivitamin.
SOCIAL HISTORY
She lived alone in an independent‐living retirement apartment that provided meals but not medical care, and she was able to function independently in her activities of daily living. Her pharmacy delivered her medications via courier service, whereas visiting home nurses filled her medication box and checked on her status weekly.
HOSPITAL COURSE
Admission vitals were: heart rate, 83; blood pressure, 158/84; respiratory rate, 20; temperature, 36.4, and saturation, 95% on room air. Echocardiogram revealed intact ejection fraction, left ventricular hypertrophy, and impaired relaxation. A TSH of 6.6 demonstrated undertreated hypothyroidism. Telemetry monitoring was significant for frequent short bursts of narrow‐complex tachycardia without clear atrial activity. The etiology of her heart failure exacerbation was presumed to be paroxysmal atrial fibrillation in the setting of diastolic dysfunction. Given her mild hyperkalemia (5.1), her diuretics were changed to monotherapy with furosemide. Low‐dose beta blockade and antithrombotic therapy were started as well as increased supplementation of levothyroxine. After several days of diuresis, her potassium had normalized, she tolerated initiation of a new ACE inhibitor, and her dyspnea had resolved. On the last hospital day, her dentures were accidentally discarded with her breakfast tray, causing her great distress.
On discharge she was on 4 new medications, 2 old medications had been stopped, and 1 prior medication's dose had been increased. During medication reconciliation, the patient reported that she had not been taking olanzapine for weeks, and thus this was omitted from her home health medication orders, with instructions to discuss with her PCP on first follow‐up within the week. The patient was provided with congestive heart failure instructions and a complete medication list. Unfortunately, the day of discharge was the first day of a holiday weekend.
Case management was unavailable on the weekend; her out‐of‐state family member was unable to be reached by phone, and her usual pharmacy courier service was closed. As she did not have a friend or family member to pick up her prescriptions from an alternate pharmacy, her prescriptions were provided as handwritten scripts, called in to her pharmacy's voice mail, and written on the home health orders. The patient was discharged to her home with communication to her PCP via telephone, e‐mail, and electronic discharge summary.
POSTDISCHARGE
Medications were not delivered to the patient until the third postdischarge day. Three days after discharge, the daughter from out of state left a message for the PCP expressing concern that the patient was failingnot eating or taking any of her medications. An expedited home nursing visit was arranged. Five days after discharge, the pharmacist called the PCP stating he had not received a prescription for the beta‐blocker. Her PCP saw the patient in clinic 6 days after discharge and reconciled the medication list, restarting the olanzapine that the patient had stopped a few weeks before and the mirtazapine, which had not been restarted despite its presence on the discharge orders and patient instructions. She continued to have poor appetite and mood and was taking her medications only with great effort from her visiting nurse and staff at the retirement community. A major cause of this decline was the significant worsening of her depression brought on by hospitalization, lapses in her psychiatric medications, and emotional distress induced by the loss of her dentures during her hospital stay. She was readmitted 10 days after her discharge because she was unable to care for herself.
DISCUSSION
This case demonstrates numerous pitfalls in the transition process. Despite communication between the hospitalists and the PCP and a common electronic medical record, this patient failed the transition from the acute care hospital to the ambulatory setting. On the holiday weekend, ancillary support services were unavailable, including case management to contact her home care agency and her pharmacy to fill and deliver her new prescriptions. Despite efforts by the discharging physician, the out‐of‐town family could not be contacted. Thus, an elderly woman with cognitive impairment was left to process a new diagnosis and 7 medication changes with an unreliable mechanism to obtain her new medications.
With the rise of hospital medicine, it has increasingly been recognized that transitions represent a point of vulnerability in the care of geriatric patients. A change in physical location of care and handoffs between caregivers create the potential for error and loss of information. Prior research has demonstrated frequent quantitative and qualitative deficiencies in the information conveyed between inpatient and outpatient physicians, with direct communication occurring less than 20% of the time.1 In this case, communication occurred between the hospitalists and the outpatient physician, demonstrating that communication is just one element of successful transitions.
Components of effective care transitions have been described in the literature, including: preparation of the patient and caregiver for the transition, medication reconciliation, instructions to patient and caregiver about symptoms and signs of worsening, and an explicit follow‐up plan for tests and appointments.2 Optimally, there is interactive discussion between the hospitalist and the receiving clinician with a summary of events including an updated medication, allergy, and problem list, current advance directives, and a common plan of care.2 This case illustrates that these elements are necessary but may not be sufficient.
Some interventions have been found to be effective. A nurse‐led multidisciplinary approach to the discharge of elderly patients with congestive heart failure led to decreased readmission rates after 90 days and was found to be a cost‐saving measure.3 Similar results have been seen in geriatric patients with a variety of diagnoses in trials using advanced‐practice nurses to bridge the vulnerable period of discharge or by interventions to improve the ability of family caregivers to handle the challenges of the transition.46 Individualized attention to the unique needs of each patient and members of their social support structure, and investment in resources to do so, has the ability to decrease readmissions.
Medication errors, medication omissions, or the inability to fill medications on discharge represent a patient safety challenge. There has been increasing emphasis on medication reconciliation at admission and discharge, but in some cases the gold standard medication list is hard to determine. Electronic medical records would seem to be a natural solution to this problem, but as this case illustrates, the electronic record may not reflect the reality of patient adherence. As in this case, clarification may require another visit with the primary provider, leaving a period of time with an uncertain medication list and therefore a vulnerable patient. Access to medications after discharge was also a problem in this case, but this is not rare. A 2001 study found that 2 days after discharge from a general medicine hospital service, 1 in 5 patients had been unable to obtain all discharge medications.7 A pharmacist‐led medication reconciliation intervention in nursing home patients led to decreases in length of stay and discrepancy‐related adverse drug events. Furthermore, a follow‐up call allowed for clarification of medication questions in 25% of cases.7, 8
Patient characteristics such as depression and cognitive dysfunction have been found to affect readmission rates and are important to assess in addressing risk for poor outcomes after discharge. A 2000 study comparing readmission rates after discharge from a geriatric rehabilitation hospital found that patients with depression had an odds ratio of 3.5 for readmission compared with those without depression.9 Inadequate health literacy is also associated with decreased ability to self‐manage chronic disease and is associated with increased risk of mortality in community‐dwelling elderly such as the patient in this case.10 Asking patients or their proxies to explain their own understanding of the discharge plan can unmask comprehension issues that otherwise may go undetected.
Discharge on a weekend presents a period of critical vulnerability. Early recognition that a transition is susceptible to failure allows the events necessary for success to occur during the week when services are available. An example in the present case might include having had the pharmacy fill the prescriptions prior to the day of discharge. This does introduce a new opportunity for error in cases in which the plan of care changes but would have solved the inability to have prescriptions filled once the holiday weekend had begun.
In cases in which the usual mechanisms break down, increased effort on the part of the hospitalist can usually create a unique solution to the problem. Examples of creative solutions that did not occur in this case might include contacting the manager of the patient's retirement apartment to determine if this individual might be willing to fill prescriptions at an alternate pharmacy. A better alternative would be to change the system such that the solution is readily accessible and time efficient. Weekend availability of case management would be one such step. A means for the hospital's inpatient pharmacy to provide 2‐3 days of bridging medications would prevent weekend prescription access from affecting timely discharges of multiple patients over the course of a year. The hospitalist is in a unique position to take a leadership role in effecting system change to address these issues.
Ultimately, it is the duty of the hospitalist to take responsibility for the safety and well‐being of the patient, and if no solution can be found, it may be necessary to hold discharge or find an alternate disposition until logistical hurdles have been overcome. Indeed, for patients admitted for myocardial infarction, discharges were less likely to occur on weekends, presumably because of lack of ancillary services.11 With foresight, creative problem solving, and systems improvement, this should rarely be necessary.
Transitions continue to be a difficult time for the most vulnerable patients. Intense efforts have improved outcomes in selected populations but have not been broadly applied. Identification of patients at the highest risk, such as those with depression, poor social support, and cognitive limitations, would allow anticipation of difficult transitions and potential utilization of proven interventions, such as advanced‐practice nurses or follow‐up pharmacy contact. Processes such as these might have prevented some of the problems in this patient's discharge. Appreciation of the weekend discharge as a time of particular challenges allows barriers to be identified and solutions created during the week, when resources are still available. Attention to all elements of effective transitions should become part of the growing culture of patient safety.
- ,,, et al.Deficits in communication and information transfer between hospital‐based and primary care physicians: implications for patient safety and continuity of care.JAMA.2007;297:831–841.
- .Falling through the cracks: challenges and opportunities for improving transitional care for persons with continuous complex care needs.J Am Geriatr Soc.2003;51:549–555.
- ,,, et al.A multidisciplinary intervention to prevent the readmission of elderly patients with congestive heart failure.N Engl J Med.1995;333:1190–1195.
- ,,, et al.Comprehensive discharge planning and home follow‐up of hospitalized elders: a randomized clinical trial.JAMA.1999;281:613–620.
- ,,, et al.Comprehensive discharge planning for the hospitalized elderly: a randomized clinical trial.Ann Intern Med.1994;120:999–1006.
- ,,, et al.Preparing patients and caregivers to participate in care delivered across settings: the care transitions intervention.J Am Geriatr Soc.2004;52:1817–1825.
- ,,, et al.The impact of follow‐up telephone calls to patients after hospitalization.Am J Med.2001;111:26S–30S.
- ,,, et al.Medication reconciliation for reducing drug discrepancy adverse events.Am J Geriatr Pharmacother.2006;4:236–243.
- ,,, et al.Depression and activities of daily living predict rehospitalization within 6 months of discharge from geriatric rehabilitation.Rehabil Psychol.2004;49:219–223.
- ,,, et al.Health literacy and mortality among elderly persons.Arch Intern Med.2007;167:1503–1509.
- ,,, et al.Restricted weekend service inappropriately delays discharge after acute myocardial infarction.Heart.2002;87:216–219.
Jumpstarting Hospital Medicine Research
Dramatic changes in the organization, financing, and delivery of hospital care that began a decade ago continue to accelerate. One of the most important changes has been the emergence of hospitalists as providers of inpatient care.1 Hospitalists are physicians, usually general internists, whose clinical focus is the hospitalized patient. As patient illnesses have become more severe and complex, physicians have found it difficult to balance inpatient and outpatient care and have focused on one of the two.25 It is estimated that there are currently 15,000 practicing hospitalists nationally, and projections suggest that this number may exceed 30,000 by 2010, which is equal to the number of cardiologists currently practicing in the United States.6 A 2003 survey from the American Hospital Association showed that more than 30% of the nation's 4900 community hospitals have hospital medicine groups.7 Furthermore, more than 70% of the nation's largest hospitals (>500 beds) and 66% of major teaching hospitals use hospitalists.7
The transition to a hospitalist model generates multiple new research questions about the best approach to caring for the hospitalized patient. Additionally, hospitalists may spawn new areas of clinical research by tackling clinical issues that formerly lacked a large number of specialist investigators. Examples include implementation‐based studies,8, 9 inpatient safety practices,1012 quasi‐experimental studies focusing on common inpatient issues,13, 14 and the evaluation of new methods for reducing resource utilization within various inpatient care delivery structures.15, 16
Similarly, if future clinical trials are to be carried out in real‐world settings, by necessity these will require the participation of hospitalists. Clinical research performed by hospitalists and hospital medicine programs, however, remains underdeveloped. Although this has been attributed to several variables, including the youth of the field, a paucity of fellowship‐trained hospitalist researchers, and a lack of a hospitalist‐oriented national funding source, we also believe that additional barriers exist which could be overcome if hospitalists actively partnered with specialists to perform hospital‐based clinical and translational research.
Hospitalists lack clinical expertise in many clinical issues. In both academic and nonacademic settings, the diagnostic approach, individual treatment decisions, and follow‐up of complex patients occur with frequent consultation of specialists. Specialists often provide a deeper understanding of both the pathophysiologic concepts and scientific principles underlying important clinical questions and are more likely to have had fellowship training that included clinical research experience. Specialists also have more access to extramural funding for disease‐based investigation, and thus their involvement in hospital‐based clinical research would likely enhance funding opportunities, improve project feasibility, and increase dissemination of the results. A successful clinical research program will therefore be one that combines specialists and hospitalists working collaboratively to determine the best way to care for inpatients. With that in mind, we created the University of Michigan SpecialistHospitalist Allied Research Program (SHARP).
METHODS
Setting
The University of Michigan Medical Center includes a 900‐bed teaching hospital with more than 44,000 yearly inpatient discharges, and the Department of Internal Medicine manages nearly 15,000 annual discharges. The University of Michigan Hospital Medicine Program has grown dramatically over the past few years and now includes more than 30 hospitalists. These hospitalists will manage nearly 8000 admissions in the upcoming year, which represent more than half of all the patients admitted to the Department of Internal Medicine. Five years ago, these 8000 admissions would have been cared for by 3 to 4 times as many providers, most of whom would have been specialists. Currently, specialists consult regularly on patients cared for by hospitalists, and as a result, a few loosely formed research collaborations developed spontaneously but lacked resources or infrastructure to facilitate their completion. SHARP was intended to organize these clinical research pilot studies and jumpstart hospital‐based clinical and translational research.
The SHARP Intervention
Objectives
In 2006, hospitalists and specialists with an interest in expanding clinical and translational research aimed at caring for inpatients were brought together for the SHARP intervention. This intervention had several objectives:
To develop a clinical research infrastructure within the University of Michigan Hospital Medicine Program to facilitate patient participation.
To foster increased specialisthospitalist collaboration for addressing common inpatient problems.
To facilitate pilot projects and preliminary data collection that enhance the ability to obtain subsequent extramural funding for collaborative research projects.
To facilitate multicenter investigation led by the University of Michigan by allowing the SHARP investigators to use an existing hospitalist consortium to expand the scope of research projects.
Ultimately, to develop the ability to perform multicenter intervention‐based clinical trials.
Structure
The key to SHARP's infrastructure is its personnel and governance structure. At the head of SHARP is an academic hospitalist as principal investigator (PI) and an academic cardiologist with health services research training serving as coprincipal investigator (Co‐PI). Key personnel also include a hospitalist investigator, a masters‐level research associate, a PhD clinical epidemiologist, and the hospitalists and subspecialists who serve as investigators. Although the program leadership has research experience, many of the hospitalist and specialist investigators are junior faculty without extensive prior research experience. Thus, SHARP was specifically designed to build the capacity to enhance inpatient clinical and translational research and to remove barriers for new investigators developing their academic careers.
It is critical that oversight provides direction for the research program, assists with project identification and selection, and facilitates collaborations that tie diverse projects together. We believe that this is best accomplished by the creation of a steering committee chaired by both the PI and Co‐PI. The steering committee also includes key individuals such as the Vice Chair of the Department of Medicine and the Associate Dean for Clinical and Translational Research at the University of Michigan. The 2 cochairs are responsible for overseeing the program and reporting the progress of SHARP to the University of Michigan Department of Internal Medicine. They will help identify and produce viable research proposals that can be brought to the full committee. To help the program understand and overcome bureaucratic obstacles, we have also included a former high‐level administrator on the steering committee as a consultant. Given the initial scope of the program, the SHARP steering committee has had a small number of key individuals. As the program grows and increases its number of ongoing collaborative projects, we will likely need to expand committee membership.
SHARP leadership meets regularly to plan projects, discuss grant ideas, make hiring decisions, and troubleshoot problems in existing projects. The entire steering committee meets quarterly to help chart the overall course of the program. A more thorough description of the program and its structure can be found on the SHARP Web site (
SHARP Funding
SHARP could not exist without resources. The funding for the program comes from the Department of Internal Medicine and uses revenue from the hospital medicine program that flows to the department. To garner support for the program, SHARP leadership sought buy‐in from the Chair of Medicine, all the division chiefs, and key faculty active in clinical research. The fact that the program has the potential to benefit not just hospitalists but also other department faculty such as specialists facilitated departmental funding. The program is funded for 3 years with an 18‐month program review to gauge progress. Funding is used to build clinical research infrastructure and facilitate collection of pilot data. SHARP resources support a portion of the salaries of key personnel for the 3‐year duration of the project (research associate, 50%; PI, 10%; Co‐PI, 5%; and epidemiologist, 5%), after which time intramural funding ends. Every SHARP project is, therefore, expected to apply for extramural funding with the goal of full extramural programmatic support after 3 years.
SHARP Performance Metrics
Measuring the accomplishments of SHARP is clearly important. As the program is intended to jumpstart collaborative inpatient clinical research, the number of such projects is important to track. An additional goal is to support work that leads to extramural funding. As the program started from scratch, it is unrealistic to have completed peer‐reviewed manuscripts or successful extramural grants as the sole metrics by which the program is judged, especially early in its initiation. In a yearly report to the department chair, we will report on primary and secondary outcomes (see Table 1).
| Primary outcomes |
|---|
|
| 1. Number of ongoing research projects involving SHARP support and a brief description of the aims and status of each |
| 2. Number of extramural grants submitted in which SHARP is mentioned or involved |
| 3. Extramural grants received (total and direct dollars) |
| 4. Peer‐reviewed publications authored by SHARP investigators |
| Secondary outcomes |
| 1. Abstracts accepted for presentation at national or international scientific meetings |
| 2. Non‐peer‐reviewed publications related to SHARP |
| 3. Invited presentations by SHARP investigators |
| 4. People who have visited the University of Michigan in conjunction with SHARP work (eg, visiting professors) |
Initial SHARP Projects
SHARP has a formal process for evaluating potential projects. A steering committee ultimately decides how best to use SHARP‐related resources. Key components in this decision are related to the proposal's innovation, feasibility, and importance as well as the extent of specialisthospitalist collaboration. The 2 projects described next are our initial areas of focus and exemplify these concepts. One project partners hospitalists with infectious disease specialists, whereas the second pairs hospitalists with geriatricians and clinical pharmacists.
Reducing False Positive Blood Cultures
The blood culture is an important tool for the diagnosis and management of bloodstream infections. As a result, physicians have a low threshold for obtaining blood cultures. Unfortunately, up to half of all positive blood cultures are positive because of contamination. These false positive cultures lead to additional diagnostic testing, unnecessary antibiotics, and increased healthcare costs.17 A variety of antiseptic agents and techniques are used to prevent falsely positive cultures. However, a recent evidence‐based systematic review performed by University of Michigan investigators found no clear evidence to suggest which antiseptic agent should be routinely used. They concluded that a randomized controlled trial was urgently needed.18
SHARP and its infrastructure have begun a cluster‐randomized crossover trial at the university hospital. The trial compares the effects of a variety of skin antiseptic agents on peripheral blood culture contamination rates. The study population includes hospitalized patients undergoing venipuncture for peripheral blood cultures on 3 general medicine and surgery floors. The trial will include over 12,000 blood culture sets and will have 85% power to detect a 0.5% difference in effectiveness between antiseptic agents. Key outcomes will be rates of positive blood cultures (true positive versus false positive), quantity of additional diagnostic testing generated by positive cultures, resource use (including antibiotics), and associated costs. Clinical outcomes such as length of stay and inpatient mortality will also be measured as secondary outcomes.
Pharmacist‐Facilitated Hospital Discharge
Hospital discharge is a complex process in which patients must be transferred from the care of an inpatient team to that of an outpatient provider. During most hospitalizations, a patient will have new medications added, a chronic medication stopped, or a change in medication dosage. Studies have revealed that the most common adverse events that have an impact on patients after discharge are related to medications.1921 In our experience at the University of Michigan, patients frequently have medication‐related adverse events after discharge because they do not understand what medications they should be taking, what they are used for, how to manage side effects, or whom to call with problems. In addition, predictable medication‐related issues (such as the ability to pay for a medicine or expected serum electrolyte changes with newly added medications) are not universally anticipated. The frail elderly are especially vulnerable to medication‐related adverse events.
Building on the work of others in the field, we proposed studying the impact of an inpatient clinical pharmacist to address medication misadventures related to hospital discharge in our elderly population.22 The study uses an interrupted time series design (the pharmacist will alternate months at a nonresident hospitalist service and a resident general medicine service) to measure the impact of the clinical pharmacist. The pharmacist will focus on patients over the age of 65 meeting criteria that identify them to be at high risk for an adverse medication event after discharge. These factors include any new medication started in the hospital, medication noncompliance or an adverse medication event that led to the admission, or use of a high‐risk medication (eg, anticoagulants, narcotics, diuretics, diabetic agents, and immunosuppressives). The pharmacist and inpatient physicians will identify high‐risk patients who will receive predischarge medication counseling. This process will identify problem medications and needed follow‐up (eg, laboratory testing) and assess compliance issues. After discharge, patients will be contacted by the pharmacist both within 72 hours and at 30 days. Standardized questions will be asked of patients to troubleshoot medication issues, assess them for problems with medications or follow‐up, and identify patients who may need more urgent access to a healthcare provider to address medication‐related problems.
Key outcomes will include the pharmacist's actions at discharge (eg, dose changes made, medication class switches, and side‐effect monitoring implemented). In addition, we will track types of medication issues identified after discharge and interventions made. Important clinical outcomes will include return to the emergency department after discharge, 30‐day readmission rates, and healthcare‐related costs.
DISCUSSION AND NEXT STEPS
SHARP is a novel clinical research program partnering hospitalists with specialists. Its current focus targets single‐institution studies that generate pilot data leading to larger projects. The ultimate goal is to develop the ability to do larger multicenter investigator‐initiated projects. The SHARP program will also have the ability to perform observational studies to identify predictors and risk factors and the ability to carry out implementation studies that show how best to translate results from published articles to direct patient care.
A specialisthospitalist collaboration overcomes barriers that we feel may impede hospital medicine research at an academic medical center. For a similar program to succeed at other institutions, key components from our program will have to be replicated. First, senior, fellowship‐trained researchers are required to mentor junior investigators (who may or may not have additional fellowship training), help guide project selection, oversee grant and manuscript submissions, and troubleshoot problems that arise in the course of any clinical research project. In our institution, this comes from within our hospitalist program and from our specialist collaborators. In institutions lacking hospitalists with research experience, this guidance could come from within a division of general medicine, internal medicine specialty divisions, internal medicine department leadership, or even noninternal medicine departments (eg, emergency medicine, neurology, and surgery) that have traditionally been involved in clinical research programs.
A second key component that must be considered is funding. An initial investment is necessary to fund key personnel dedicated to getting projects started on the right track, collecting pilot data, and ensuring project completion and dissemination of the results. The positive margin generated by our hospitalist program facilitated the initial investment. In the absence of a positive margin, resources could come directly from the hospital, the medical school, the department of internal medicine, or perhaps a foundation. The case would need to be made that an initial short‐term investment would enhance the academic standing of the institution, enhance the careers of young investigators, and over time lead to a self‐sustaining program through investigator‐initiated grants and extramural funding. In addition to experienced leadership and funding, we created an oversight committee, but we feel that this is not a critical component. A potential concern with a program that partners with specialists might be that research topics become too disease‐specific or specialty‐oriented. We specifically created the oversight committee to protect against this possibility, and other institutions might need similar safeguards.
Our next step includes leveraging existing hospitalist collaboratives that reach beyond academic medical centers to expand further the reach of SHARP. Ultimately, any new therapy, clinical tool, diagnostic paradigm, or implementation strategy that is developed or evaluated bythe SHARP program would need to be tested in a real‐world setting to assess external validity. With support from the Blue Cross Blue Shield of Michigan Foundation, we have created a multihospital patient safety consortium, the Hospitalists as Emerging Leaders in Patient Safety Consortium, which includes academic, government, urban, rural, teaching, and nonteaching hospitals.23 Although the initial focus is patient safety, our goal for the consortium is to develop it into a multihospital clinical research program that could take pilot projects developed by SHARP and test them in real‐world settings. We believe that full‐scale multihospital studies based on SHARP pilot data will be very attractive to external funding agencies and will help SHARP become financially self‐sufficient after the initial 3‐year start‐up.
Hospital medicine research is desperately needed.24, 25 Unfortunately, the clinical research capabilities of most hospital medicine programs are quite underdeveloped. We believe that partnering hospitalists with specialists can facilitate collaborative research to identify the best way to care for inpatients. If successful, we believe that variations of this model can be replicated at other institutions and will be a critical factor in jumpstarting hospital medicine clinical research.
Acknowledgements
The authors thank Dr. Marc E. Lippman, Dr. Robert F. Todd, Dr. Larry McMahon, Dr. Timothy J. Laing, and Mr. Lindsay J. Graham, whose support made this program possible.
- ,.The emerging role of “hospitalists” in the American health care system.N Engl J Med.1996;335:514–517.
- ,,,,,.What effect does increasing inpatient time have on outpatient‐oriented internist satisfaction?J Gen Intern Med.2003;18:725–729.
- ,,,,.Characteristics of general internists who practice only outpatient medicine: results from the physician worklife study.Semin Med Pract.2002;5:5–11.
- ,.Hospitalists in teaching hospitals: opportunities but not without danger.J Gen Intern Med.2004;19:392–393.
- ,.Hospitalists: the new model of inpatient medical care in the United States.Eur J Intern Med.2003;14:65–70.
- ,,,,.The potential size of the hospitalist workforce in the United States.Am J Med.1999;106:441–445.
- ,,,.The status of hospital medicine groups in the United States.J Hosp Med.2006;1:75–80.
- ,,, et al.Translating infection prevention evidence into practice using quantitative and qualitative research.Am J Infect Control.2006;34:507–512.
- ,,,,,.Implementation of a voluntary hospitalist service at a community teaching hospital: improved clinical efficiency and patient outcomes.Ann Intern Med.2002;137:859–865.
- ,,,,.Making health care safer: a critical analysis of patient safety practices.Evid Rep Technol Assess (Summ).2001;(43):i–x,1–668.
- ,,,.Safe but sound: patient safety meets evidence‐based medicine.JAMA.2002;288:508–513.
- ,,,.Clinical pharmacists and inpatient medical care: a systematic review.Arch Intern Med.2006;166:955–964.
- ,,, et al.Are antiseptic‐coated central venous catheters effective in a real‐world setting?Am J Infect Control.2006;34:388–393.
- ,,,,.Effectiveness of ceftriaxone plus doxycycline in the treatment of patients hospitalized with community‐acquired pneumonia.J Hosp Med.2006;1:7–12.
- ,,, et al.Effects of physician experience on costs and outcomes on an academic general medicine service: results of a trial of hospitalists.Ann Intern Med.2002;137:866–874.
- ,,,,.What effect does physician “profiling” have on inpatient physician satisfaction and hospital length of stay?BMC Health Serv Res.2006;6:45.
- ,,.Contaminant blood cultures and resource utilization. The true consequences of false‐positive results.JAMA.1991;265:365–369.
- ,,,,,.Review of clinical trials of skin antiseptic agents used to reduce blood culture contamination.Infect Control Hosp Epidemiol.2007;28:892–895.
- ,,,,.The incidence and severity of adverse events affecting patients after discharge from the hospital.Ann Intern Med.2003;138:161–167.
- ,,,,.Adverse drug events occurring following hospital discharge.J Gen Intern Med.2005;20:317–323.
- ,,, et al.Adverse events among medical patients after discharge from hospital.CMAJ.2004;170:345–349.
- ,,, et al.Role of pharmacist counseling in preventing adverse drug events after hospitalization.Arch Intern Med.2006;166:565–571.
- ,,.Hospitalists as emerging leaders in patient safety: targeting a few to affect many.JPatient Saf.2005;1:78–82.
- .The future of hospital medicine: evolution or revolution?Am J Med.2004;117:446–450.
- ,,,.Hospital medicine fellowships: works in progress.Am J Med.2006;119:72 e1–7.
Dramatic changes in the organization, financing, and delivery of hospital care that began a decade ago continue to accelerate. One of the most important changes has been the emergence of hospitalists as providers of inpatient care.1 Hospitalists are physicians, usually general internists, whose clinical focus is the hospitalized patient. As patient illnesses have become more severe and complex, physicians have found it difficult to balance inpatient and outpatient care and have focused on one of the two.25 It is estimated that there are currently 15,000 practicing hospitalists nationally, and projections suggest that this number may exceed 30,000 by 2010, which is equal to the number of cardiologists currently practicing in the United States.6 A 2003 survey from the American Hospital Association showed that more than 30% of the nation's 4900 community hospitals have hospital medicine groups.7 Furthermore, more than 70% of the nation's largest hospitals (>500 beds) and 66% of major teaching hospitals use hospitalists.7
The transition to a hospitalist model generates multiple new research questions about the best approach to caring for the hospitalized patient. Additionally, hospitalists may spawn new areas of clinical research by tackling clinical issues that formerly lacked a large number of specialist investigators. Examples include implementation‐based studies,8, 9 inpatient safety practices,1012 quasi‐experimental studies focusing on common inpatient issues,13, 14 and the evaluation of new methods for reducing resource utilization within various inpatient care delivery structures.15, 16
Similarly, if future clinical trials are to be carried out in real‐world settings, by necessity these will require the participation of hospitalists. Clinical research performed by hospitalists and hospital medicine programs, however, remains underdeveloped. Although this has been attributed to several variables, including the youth of the field, a paucity of fellowship‐trained hospitalist researchers, and a lack of a hospitalist‐oriented national funding source, we also believe that additional barriers exist which could be overcome if hospitalists actively partnered with specialists to perform hospital‐based clinical and translational research.
Hospitalists lack clinical expertise in many clinical issues. In both academic and nonacademic settings, the diagnostic approach, individual treatment decisions, and follow‐up of complex patients occur with frequent consultation of specialists. Specialists often provide a deeper understanding of both the pathophysiologic concepts and scientific principles underlying important clinical questions and are more likely to have had fellowship training that included clinical research experience. Specialists also have more access to extramural funding for disease‐based investigation, and thus their involvement in hospital‐based clinical research would likely enhance funding opportunities, improve project feasibility, and increase dissemination of the results. A successful clinical research program will therefore be one that combines specialists and hospitalists working collaboratively to determine the best way to care for inpatients. With that in mind, we created the University of Michigan SpecialistHospitalist Allied Research Program (SHARP).
METHODS
Setting
The University of Michigan Medical Center includes a 900‐bed teaching hospital with more than 44,000 yearly inpatient discharges, and the Department of Internal Medicine manages nearly 15,000 annual discharges. The University of Michigan Hospital Medicine Program has grown dramatically over the past few years and now includes more than 30 hospitalists. These hospitalists will manage nearly 8000 admissions in the upcoming year, which represent more than half of all the patients admitted to the Department of Internal Medicine. Five years ago, these 8000 admissions would have been cared for by 3 to 4 times as many providers, most of whom would have been specialists. Currently, specialists consult regularly on patients cared for by hospitalists, and as a result, a few loosely formed research collaborations developed spontaneously but lacked resources or infrastructure to facilitate their completion. SHARP was intended to organize these clinical research pilot studies and jumpstart hospital‐based clinical and translational research.
The SHARP Intervention
Objectives
In 2006, hospitalists and specialists with an interest in expanding clinical and translational research aimed at caring for inpatients were brought together for the SHARP intervention. This intervention had several objectives:
To develop a clinical research infrastructure within the University of Michigan Hospital Medicine Program to facilitate patient participation.
To foster increased specialisthospitalist collaboration for addressing common inpatient problems.
To facilitate pilot projects and preliminary data collection that enhance the ability to obtain subsequent extramural funding for collaborative research projects.
To facilitate multicenter investigation led by the University of Michigan by allowing the SHARP investigators to use an existing hospitalist consortium to expand the scope of research projects.
Ultimately, to develop the ability to perform multicenter intervention‐based clinical trials.
Structure
The key to SHARP's infrastructure is its personnel and governance structure. At the head of SHARP is an academic hospitalist as principal investigator (PI) and an academic cardiologist with health services research training serving as coprincipal investigator (Co‐PI). Key personnel also include a hospitalist investigator, a masters‐level research associate, a PhD clinical epidemiologist, and the hospitalists and subspecialists who serve as investigators. Although the program leadership has research experience, many of the hospitalist and specialist investigators are junior faculty without extensive prior research experience. Thus, SHARP was specifically designed to build the capacity to enhance inpatient clinical and translational research and to remove barriers for new investigators developing their academic careers.
It is critical that oversight provides direction for the research program, assists with project identification and selection, and facilitates collaborations that tie diverse projects together. We believe that this is best accomplished by the creation of a steering committee chaired by both the PI and Co‐PI. The steering committee also includes key individuals such as the Vice Chair of the Department of Medicine and the Associate Dean for Clinical and Translational Research at the University of Michigan. The 2 cochairs are responsible for overseeing the program and reporting the progress of SHARP to the University of Michigan Department of Internal Medicine. They will help identify and produce viable research proposals that can be brought to the full committee. To help the program understand and overcome bureaucratic obstacles, we have also included a former high‐level administrator on the steering committee as a consultant. Given the initial scope of the program, the SHARP steering committee has had a small number of key individuals. As the program grows and increases its number of ongoing collaborative projects, we will likely need to expand committee membership.
SHARP leadership meets regularly to plan projects, discuss grant ideas, make hiring decisions, and troubleshoot problems in existing projects. The entire steering committee meets quarterly to help chart the overall course of the program. A more thorough description of the program and its structure can be found on the SHARP Web site (
SHARP Funding
SHARP could not exist without resources. The funding for the program comes from the Department of Internal Medicine and uses revenue from the hospital medicine program that flows to the department. To garner support for the program, SHARP leadership sought buy‐in from the Chair of Medicine, all the division chiefs, and key faculty active in clinical research. The fact that the program has the potential to benefit not just hospitalists but also other department faculty such as specialists facilitated departmental funding. The program is funded for 3 years with an 18‐month program review to gauge progress. Funding is used to build clinical research infrastructure and facilitate collection of pilot data. SHARP resources support a portion of the salaries of key personnel for the 3‐year duration of the project (research associate, 50%; PI, 10%; Co‐PI, 5%; and epidemiologist, 5%), after which time intramural funding ends. Every SHARP project is, therefore, expected to apply for extramural funding with the goal of full extramural programmatic support after 3 years.
SHARP Performance Metrics
Measuring the accomplishments of SHARP is clearly important. As the program is intended to jumpstart collaborative inpatient clinical research, the number of such projects is important to track. An additional goal is to support work that leads to extramural funding. As the program started from scratch, it is unrealistic to have completed peer‐reviewed manuscripts or successful extramural grants as the sole metrics by which the program is judged, especially early in its initiation. In a yearly report to the department chair, we will report on primary and secondary outcomes (see Table 1).
| Primary outcomes |
|---|
|
| 1. Number of ongoing research projects involving SHARP support and a brief description of the aims and status of each |
| 2. Number of extramural grants submitted in which SHARP is mentioned or involved |
| 3. Extramural grants received (total and direct dollars) |
| 4. Peer‐reviewed publications authored by SHARP investigators |
| Secondary outcomes |
| 1. Abstracts accepted for presentation at national or international scientific meetings |
| 2. Non‐peer‐reviewed publications related to SHARP |
| 3. Invited presentations by SHARP investigators |
| 4. People who have visited the University of Michigan in conjunction with SHARP work (eg, visiting professors) |
Initial SHARP Projects
SHARP has a formal process for evaluating potential projects. A steering committee ultimately decides how best to use SHARP‐related resources. Key components in this decision are related to the proposal's innovation, feasibility, and importance as well as the extent of specialisthospitalist collaboration. The 2 projects described next are our initial areas of focus and exemplify these concepts. One project partners hospitalists with infectious disease specialists, whereas the second pairs hospitalists with geriatricians and clinical pharmacists.
Reducing False Positive Blood Cultures
The blood culture is an important tool for the diagnosis and management of bloodstream infections. As a result, physicians have a low threshold for obtaining blood cultures. Unfortunately, up to half of all positive blood cultures are positive because of contamination. These false positive cultures lead to additional diagnostic testing, unnecessary antibiotics, and increased healthcare costs.17 A variety of antiseptic agents and techniques are used to prevent falsely positive cultures. However, a recent evidence‐based systematic review performed by University of Michigan investigators found no clear evidence to suggest which antiseptic agent should be routinely used. They concluded that a randomized controlled trial was urgently needed.18
SHARP and its infrastructure have begun a cluster‐randomized crossover trial at the university hospital. The trial compares the effects of a variety of skin antiseptic agents on peripheral blood culture contamination rates. The study population includes hospitalized patients undergoing venipuncture for peripheral blood cultures on 3 general medicine and surgery floors. The trial will include over 12,000 blood culture sets and will have 85% power to detect a 0.5% difference in effectiveness between antiseptic agents. Key outcomes will be rates of positive blood cultures (true positive versus false positive), quantity of additional diagnostic testing generated by positive cultures, resource use (including antibiotics), and associated costs. Clinical outcomes such as length of stay and inpatient mortality will also be measured as secondary outcomes.
Pharmacist‐Facilitated Hospital Discharge
Hospital discharge is a complex process in which patients must be transferred from the care of an inpatient team to that of an outpatient provider. During most hospitalizations, a patient will have new medications added, a chronic medication stopped, or a change in medication dosage. Studies have revealed that the most common adverse events that have an impact on patients after discharge are related to medications.1921 In our experience at the University of Michigan, patients frequently have medication‐related adverse events after discharge because they do not understand what medications they should be taking, what they are used for, how to manage side effects, or whom to call with problems. In addition, predictable medication‐related issues (such as the ability to pay for a medicine or expected serum electrolyte changes with newly added medications) are not universally anticipated. The frail elderly are especially vulnerable to medication‐related adverse events.
Building on the work of others in the field, we proposed studying the impact of an inpatient clinical pharmacist to address medication misadventures related to hospital discharge in our elderly population.22 The study uses an interrupted time series design (the pharmacist will alternate months at a nonresident hospitalist service and a resident general medicine service) to measure the impact of the clinical pharmacist. The pharmacist will focus on patients over the age of 65 meeting criteria that identify them to be at high risk for an adverse medication event after discharge. These factors include any new medication started in the hospital, medication noncompliance or an adverse medication event that led to the admission, or use of a high‐risk medication (eg, anticoagulants, narcotics, diuretics, diabetic agents, and immunosuppressives). The pharmacist and inpatient physicians will identify high‐risk patients who will receive predischarge medication counseling. This process will identify problem medications and needed follow‐up (eg, laboratory testing) and assess compliance issues. After discharge, patients will be contacted by the pharmacist both within 72 hours and at 30 days. Standardized questions will be asked of patients to troubleshoot medication issues, assess them for problems with medications or follow‐up, and identify patients who may need more urgent access to a healthcare provider to address medication‐related problems.
Key outcomes will include the pharmacist's actions at discharge (eg, dose changes made, medication class switches, and side‐effect monitoring implemented). In addition, we will track types of medication issues identified after discharge and interventions made. Important clinical outcomes will include return to the emergency department after discharge, 30‐day readmission rates, and healthcare‐related costs.
DISCUSSION AND NEXT STEPS
SHARP is a novel clinical research program partnering hospitalists with specialists. Its current focus targets single‐institution studies that generate pilot data leading to larger projects. The ultimate goal is to develop the ability to do larger multicenter investigator‐initiated projects. The SHARP program will also have the ability to perform observational studies to identify predictors and risk factors and the ability to carry out implementation studies that show how best to translate results from published articles to direct patient care.
A specialisthospitalist collaboration overcomes barriers that we feel may impede hospital medicine research at an academic medical center. For a similar program to succeed at other institutions, key components from our program will have to be replicated. First, senior, fellowship‐trained researchers are required to mentor junior investigators (who may or may not have additional fellowship training), help guide project selection, oversee grant and manuscript submissions, and troubleshoot problems that arise in the course of any clinical research project. In our institution, this comes from within our hospitalist program and from our specialist collaborators. In institutions lacking hospitalists with research experience, this guidance could come from within a division of general medicine, internal medicine specialty divisions, internal medicine department leadership, or even noninternal medicine departments (eg, emergency medicine, neurology, and surgery) that have traditionally been involved in clinical research programs.
A second key component that must be considered is funding. An initial investment is necessary to fund key personnel dedicated to getting projects started on the right track, collecting pilot data, and ensuring project completion and dissemination of the results. The positive margin generated by our hospitalist program facilitated the initial investment. In the absence of a positive margin, resources could come directly from the hospital, the medical school, the department of internal medicine, or perhaps a foundation. The case would need to be made that an initial short‐term investment would enhance the academic standing of the institution, enhance the careers of young investigators, and over time lead to a self‐sustaining program through investigator‐initiated grants and extramural funding. In addition to experienced leadership and funding, we created an oversight committee, but we feel that this is not a critical component. A potential concern with a program that partners with specialists might be that research topics become too disease‐specific or specialty‐oriented. We specifically created the oversight committee to protect against this possibility, and other institutions might need similar safeguards.
Our next step includes leveraging existing hospitalist collaboratives that reach beyond academic medical centers to expand further the reach of SHARP. Ultimately, any new therapy, clinical tool, diagnostic paradigm, or implementation strategy that is developed or evaluated bythe SHARP program would need to be tested in a real‐world setting to assess external validity. With support from the Blue Cross Blue Shield of Michigan Foundation, we have created a multihospital patient safety consortium, the Hospitalists as Emerging Leaders in Patient Safety Consortium, which includes academic, government, urban, rural, teaching, and nonteaching hospitals.23 Although the initial focus is patient safety, our goal for the consortium is to develop it into a multihospital clinical research program that could take pilot projects developed by SHARP and test them in real‐world settings. We believe that full‐scale multihospital studies based on SHARP pilot data will be very attractive to external funding agencies and will help SHARP become financially self‐sufficient after the initial 3‐year start‐up.
Hospital medicine research is desperately needed.24, 25 Unfortunately, the clinical research capabilities of most hospital medicine programs are quite underdeveloped. We believe that partnering hospitalists with specialists can facilitate collaborative research to identify the best way to care for inpatients. If successful, we believe that variations of this model can be replicated at other institutions and will be a critical factor in jumpstarting hospital medicine clinical research.
Acknowledgements
The authors thank Dr. Marc E. Lippman, Dr. Robert F. Todd, Dr. Larry McMahon, Dr. Timothy J. Laing, and Mr. Lindsay J. Graham, whose support made this program possible.
- ,.The emerging role of “hospitalists” in the American health care system.N Engl J Med.1996;335:514–517.
- ,,,,,.What effect does increasing inpatient time have on outpatient‐oriented internist satisfaction?J Gen Intern Med.2003;18:725–729.
- ,,,,.Characteristics of general internists who practice only outpatient medicine: results from the physician worklife study.Semin Med Pract.2002;5:5–11.
- ,.Hospitalists in teaching hospitals: opportunities but not without danger.J Gen Intern Med.2004;19:392–393.
- ,.Hospitalists: the new model of inpatient medical care in the United States.Eur J Intern Med.2003;14:65–70.
- ,,,,.The potential size of the hospitalist workforce in the United States.Am J Med.1999;106:441–445.
- ,,,.The status of hospital medicine groups in the United States.J Hosp Med.2006;1:75–80.
- ,,, et al.Translating infection prevention evidence into practice using quantitative and qualitative research.Am J Infect Control.2006;34:507–512.
- ,,,,,.Implementation of a voluntary hospitalist service at a community teaching hospital: improved clinical efficiency and patient outcomes.Ann Intern Med.2002;137:859–865.
- ,,,,.Making health care safer: a critical analysis of patient safety practices.Evid Rep Technol Assess (Summ).2001;(43):i–x,1–668.
- ,,,.Safe but sound: patient safety meets evidence‐based medicine.JAMA.2002;288:508–513.
- ,,,.Clinical pharmacists and inpatient medical care: a systematic review.Arch Intern Med.2006;166:955–964.
- ,,, et al.Are antiseptic‐coated central venous catheters effective in a real‐world setting?Am J Infect Control.2006;34:388–393.
- ,,,,.Effectiveness of ceftriaxone plus doxycycline in the treatment of patients hospitalized with community‐acquired pneumonia.J Hosp Med.2006;1:7–12.
- ,,, et al.Effects of physician experience on costs and outcomes on an academic general medicine service: results of a trial of hospitalists.Ann Intern Med.2002;137:866–874.
- ,,,,.What effect does physician “profiling” have on inpatient physician satisfaction and hospital length of stay?BMC Health Serv Res.2006;6:45.
- ,,.Contaminant blood cultures and resource utilization. The true consequences of false‐positive results.JAMA.1991;265:365–369.
- ,,,,,.Review of clinical trials of skin antiseptic agents used to reduce blood culture contamination.Infect Control Hosp Epidemiol.2007;28:892–895.
- ,,,,.The incidence and severity of adverse events affecting patients after discharge from the hospital.Ann Intern Med.2003;138:161–167.
- ,,,,.Adverse drug events occurring following hospital discharge.J Gen Intern Med.2005;20:317–323.
- ,,, et al.Adverse events among medical patients after discharge from hospital.CMAJ.2004;170:345–349.
- ,,, et al.Role of pharmacist counseling in preventing adverse drug events after hospitalization.Arch Intern Med.2006;166:565–571.
- ,,.Hospitalists as emerging leaders in patient safety: targeting a few to affect many.JPatient Saf.2005;1:78–82.
- .The future of hospital medicine: evolution or revolution?Am J Med.2004;117:446–450.
- ,,,.Hospital medicine fellowships: works in progress.Am J Med.2006;119:72 e1–7.
Copyright © 2008 Society of Hospital Medicine
Acute Stroke Patient with Atrial Fibrillation
INITIAL EVALUATION
The approach to patients with acute stroke symptoms should always start with the stabilization of the airway, breathing, and circulation. A fast clinical investigation for possible mimickers of an acute stroke (head trauma, migraines, epilepsy, infection, hypoglycemia, other metabolic derangements, and intoxications) is the next step. The history and physical examination should be guided by the National Institutes of Health stroke scale, which has been widely accepted by the American Stroke Association (ASA), the American Academy of Neurology, and the National Institute of Neurological Disorders and Stroke.2, 9 Strict control of electrolytes, glucose, and fever, management of blood pressure depending on thetype of stroke, and prophylaxis for deep vein thrombosis/pulmonary embolism, aspiration, dehydration, hypoxemia, malnutrition, and pressure sores should be initiated.9, 10 All patients with suspected acute stroke must be promptly assessed for thrombolytic therapy on the basis of the time since onset of symptoms and the National Institutes of Health stroke scale. Noncontrast computed tomography of the brain is the first step for differentiating between ischemic and hemorrhagic events.3, 9 There is an increased interest in the use of magnetic resonance imaging to detect acute intracranial hemorrhage (ICH) and its ability to detect stroke earlier than computed tomography.911 Multimodal computed tomography and magnetic resonance imaging provide additional information that will improve the diagnosis of ischemic stroke, and they have been added as a class I recommendation to the most recent stroke guidelines.9, 12 Computed tomographic angiography and perfusion computed tomography may precisely describe details regarding the site of occlusion, infarct core, salvageable brain tissue, and collateral flow that can improve patient selection for intravenous or intra‐arterial thrombolysis and exclude stroke mimics.9, 13
ISCHEMIC STROKE
Thrombolysis
In the setting of acute ischemic stroke, the patient should be promptly evaluated for thrombolytic therapy according to the American College of Chest Physicians guidelines.14 Intravenous r‐TPA (recombinant tissue plasminogen activator) is given only to 1% to 2% of stroke patients in the United States. This low percentage is mainly due to delayed presentation to an emergency department beyond the 3‐hour treatment window.15 Clear benefit has been proven for eligible patients if thrombolytic therapy is administered within 3 hours from the initiation of symptoms, although no subgroup analysis has been done in patients with atrial fibrillation.9 The efficacy of intravenous thrombolysis within the 3‐hour time window is similar between different stroke subtypes; therefore, its administration should not be delayed in order to investigate its etiology.16 Intravenous thrombolysis remains the standard of care, but recent studies have demonstrated that intra‐arterial administration, despite its risks, may be more effective in selected patients.9, 1719 Patients most likely to benefit from intra‐arterial thrombolysis are those with middle cerebral artery occlusion of less than 6 hours (Prolyse in Acute Cerebral Thromboembolism Trials I and II) and patients with severe basilar artery stroke.17, 19 A recent study in Germany has demonstrated that intra‐arterial thrombolysis may be superior to intravenous thrombolysis in the 3‐ to 6‐hour treatment window.19 The updated 2007 guidelines from the American Heart Association (AHA)/ASA have included intra‐arterial thrombolysis for specific patients who are not eligible for intravenous thrombolysis when this can be performed at experienced stroke centers.9 Thrombolysis reduces overall disability and improves the quality of life in appropriately selected patients. The risk of hemorrhage is approximately 5.2%.20 After intravenous thrombolysis, approximately one‐third of patients ultimately develop re‐occlusion of the artery, especially patients with only partial recanalization. This may lead to neurologic deterioration and higher in‐hospital mortality.21 According to more recent studies, ultrasound‐enhanced thrombolysis may augment tissue plasminogen activator induced arterial recanalization by continuous transcranial Doppler.22 Symptomatic hemorrhagic transformation of the infarction remains the primary concern with the administration of intravenous rtTPA.23, 24 Despite the apparent risks of ICH, atrial fibrillation patients not on warfarin should always be promptly referred for thrombolysis whenever they are eligible.
Heparin
For many years, clinicians have believed in the role of heparin in patients with atrial fibrillation, especially after intracranial hemorrhage is excluded by negative initial noncontrast head computed tomography.25 The most obvious pathophysiologic mechanism in patients with atrial fibrillation is cardioembolism. Therefore, it was believed that heparin could contribute to the resolution of the responsible clot. Two large international trials (the Heparin in Acute Embolic Stroke Trial and the International Stroke Trial), confirmed by multiple smaller ones, have investigated the use of heparin (unfractionated or low‐molecular‐weight heparin) at therapeutic doses in the setting of an acute ischemic event.2628 Surprisingly, none of them showed a statistically significant benefit, but instead they showed a clear increase in hemorrhagic events. Therefore, routine use of unfractionated heparin or low‐molecular‐weight heparin at therapeutic doses should be avoided in the acute setting of a stroke.28, 29
Aspirin
Among the antiplatelet agents, aspirin is the only well‐studied agent for the treatment of acute ischemic stroke. It has been proven that during the first 24 hours after stroke, there is substantial platelet activation that can be inhibited by aspirin.30, 31 Two major trials, the Chinese Acute Stroke Trial and the International Stroke Trial, have demonstrated the benefit of early aspirin use in patients with stroke and atrial fibrillation.30 Both proved a decrease in recurrent stroke without a significant increase in hemorrhaging. The recommended dose of aspirin is 325 mg/day.9 Currently, clopidogrel alone or in combination with aspirin and the intravenous administration of antiplatelet agents that inhibit the glycoprotein IIb/IIIa receptor are class III recommendations. They should not be used outside the setting of clinical trials.9
Warfarin
It is well known that atrial fibrillation increases the risk of ischemic stroke by a factor of 5.32 Studies have shown that maintaining the INR above 2.0 decreases not only the frequency but also the severity and mortality of ischemic events.4, 8, 32 The National Anticoagulation Benchmark Outcomes Report has shown that in the highest risk atrial fibrillation patients, only 55% receive warfarin and 21% do not receive aspirin or warfarin.33 This discrepancy results from the fact that warfarin is the second most common drug, after insulin, responsible for adverse drug events in emergency room visits. In atrial fibrillation patients on warfarin who present to the emergency with an acute stroke, there are no clear guidelines regarding the continued use of warfarin at therapeutic doses (target INR = 2.03.0). Warfarin is usually not initiated in the acute setting until the patient is medically stable. The exact time at which warfarin can be started or resumed after an acute ischemic stroke remains to be determined.34 Usually, it is preferable to start it within 1 week after the event, given the risk of early recurrent acute stroke during the next 2 to 4 weeks after the initial stroke.35
HEMORRHAGIC STROKE/ICH
Introduction
The risk of spontaneous ICH is 0.15%/year in patients over 70 years old and increases to 0.3% to 0.8% when patients are on therapeutic doses of warfarin with INR between 2 and 3.36, 37 Given the multiple interactions of warfarin with other medications, this is a significant concern because ICH is associated with substantial neurological deterioration.38 Although most warfarin‐induced ICH occurs in patients with therapeutic INR, it becomes the most prevalent mechanism when the INR exceeds 5.0, and it should be highly suspected.1, 4 Therefore, prompt determination of INR is critical in the initial evaluation of acute stroke in patients with atrial fibrillation. Age is the most important predisposing factor for ICH in patients with atrial fibrillation. There is almost a 50% increase in warfarin‐induced bleeding for every decade of age above 40.39 Cerebral amyloid angiopathy plays an important role in warfarin‐associated lobar ICH in the elderly, and it may contribute to the patient candidacy for warfarin treatment in the near future.40 On the other hand, a hemorrhagic stroke can be an iatrogenic complication of initiation of warfarin, heparin, or early thrombolysis because symptomatic hemorrhagic transformation of the infarction is the main and most lethal side effect of intravenous rtTPA in the treatment of acute ischemic stroke.24 ICH is associated with a 30% to 50% mortality rate, and it represents the most lethal and least treatable form of stroke.32 It has been suggested that macroalbuminuria is an independent predictor of hemorrhagic transformation and particularly of severe hemorrhage in patients with acute ischemic stroke, but specific guidelines for screening or special management of those patients do not currently exist.33 ICH is a medical emergency with high mortality and should be recognized and treated promptly. Recently, the AHA and ASA have published updated guidelines for the management of spontaneous ICH in adults.12
Vitamin K
All experts agree that anticoagulation should be urgently reversed in the setting of ICH. Although high doses of intravenous vitamin K (1020 mg) are usually enough to reverse the anticoagulant effect of warfarin, it may take up to 12 to 24 hours to act, and it depends on intact liver function. Given the high mortality of this condition, vitamin K as monotherapy is considered inadequate, and a more aggressive approach is recommended.41
Fresh Frozen Plasma (FFP)
In the United States, for many years FFP has been considered the standard of care for the acute reversal of warfarin‐associated anticoagulation.42 In general, 10 to 15 cc/kg FFP is used.43 Timing rather than dosage seems to be more important for a better clinical outcome.44 The use of FFP is complicated by the delayed time for thawing and compatibility check, volume overload, and sometimes inadequate and unpredictable correction. The median time for door‐to‐INR normalization is 30 hours, which is a significant delay for such a potentially fatal condition. Another possible complication of FFP is the report of increasing hematomas.45
Prothrombin Complex Concentrates (PCCs)
PCCs contain vitamin K dependent coagulation factors II, VII, IX, and X, the factors deficient in warfarin therapy.44, 46 Therefore, a PCC dose of 25 to 59 U/kg has been used in life‐threatening bleeding, resulting in a decrease in the median INR from 3.8 to 1.3 immediately after administration.42 PCCs should always be given with vitamin K. Thrombotic events have been described with the infusion of PCCs, but no clear guidelines have been published.42 A recent study from the Mayo Clinic showed that many experts suggest its use in the urgent condition of warfarin‐associated ICH.41 PCCs are widely used in the European community and have previously been cited as the agent of choice for urgent warfarin reversal.42, 47, 48 A recent study comparing PCCs with FFP and vitamin K has demonstrated that PCCs may be superior to FFP and vitamin K by reducing the risk of hematoma growth.49
Recombinant Factor VIIa
Recombinant factor VIIa is a preparation of activated coagulation factor VII (factor VIIa) that is produced by recombinant DNA technology.50 It was initially used for the treatment of inhibitors in patients with hemophilia. It has also been used in the past to correct anticoagulation in patients with acute ICH,36 but most studies have been done in patients with hemophilia or factor VII deficiency.50 Major limitations include cost, prothrombotic potential, and lack of correction of other coagulation factors dependent on vitamin K. Studies have shown that factor VII may be a safe, rapid, and effective way of reversing anticoagulation and may offer an improved quality of life to patients with ICH.51, 52 Factor Seven for Acute Hemorrhagic Stroke Treatment, a large phase III trial, is in progress, but preliminary results are controversial regarding the reduction in the size of hemorrhage, mortality, and improvement of functional outcome.32 In a recent article from the Mayo Clinic,41 several experts on clinical stroke, neurologic intensive care, and hematology suggest its use, alone or with FFP, for the urgent reversal of INR in the clinical setting of warfarin‐associated ICH. Currently, according to the 2007 AHA/ASA updated guidelines, recombinant factor VIIa can be administered within the first 3 to 4 hours after onset of ICH to slow progression of bleeding, although its efficacy and safety remain to be confirmed (class IIb recommendation).12
Surgical Evacuation
Despite the clear guidelines for the indications of surgery in spontaneous intracranial bleeding,12 the role of surgical evacuation in patients with supratherapeutic INR is not well defined. Many neurosurgeons are reluctant to operate in the setting of impaired hemostasis. The International Surgical Trial in Intracerebral Hemorrhage showed no clear benefit of early neurosurgical intervention compared to conservative treatment.53 Different surgical trials have shown different outcomes.54 The selection of patients who would benefit from surgery depends on the location and size of the hemorrhage, coagulation status, and Glasgow Coma Scale.55 Patients with rapidly expanding hematomas in a surgically accessible intracranial territory are more likely to benefit from a neurosurgical intervention. Newer surgical techniques with a computed‐tomography‐guided stereotactic approach or endoscopy‐guided evacuation in emerging ICH may offer better outcomes.56
RECENT ADVANCES
Mechanical Embolectomy
Mechanical embolectomy is a growing field of neurology with a promising interventional approach to the treatment of embolic strokes.57, 58 Patients with atrial fibrillation will probably be one of the patient groups who will receive maximum benefit when the efficacy and safety of the procedure are established. Endovascular reperfusion via mechanical embolectomy is offered to patients who are ineligible for thrombolytics, and it extends the time window up to 8 hours.58 For the first time, in 2007 the AHA/ASA guidelines have included the Mechanical Embolus Removal in Cerebral Ischemia device as a reasonable intervention for extraction of intra‐arterial thrombi in carefully selected patients.9
Left Atrial Appendage (LAA) Occlusion
The LAA is the source of 91% of embolic thrombi in patients with atrial fibrillation.59 Therefore, surgical or percutaneous removal or occlusion of the LAA would be an important treatment option, especially in high‐risk patients intolerant of warfarin or with recurrent strokes, despite anticoagulation. Several surgical techniques and percutaneous LAA occlusion devices have been studied with different success rates and safety characteristics.6063 Currently, there are no official guidelines for the use of those interventions.
Genetic Testing for Warfarin Sensitivity
Warfarin is the second most common drug, after insulin, to require emergency room visits for adverse drug events. In September 2007, the Food and Drug Administration approved the Nanosphere Verigene Warfarin Metabolism Nucleic Acid Test, which detects variants of 2 genes (CYP2C9 and VKORC1) implicated in the unexpected response to warfarin.6466 Guidelines for the applied use of these tests are currently under development.66
CONCLUSION
On average, there is a new stroke every 45 seconds, and every 3 to 4 minutes, someone dies from a stroke in the United States. Atrial fibrillation accounts for one‐fourth of all strokes in the elderly population. Acute stroke in anticoagulated patients with atrial fibrillation is a common, challenging scenario in emergency departments because many questions remain unanswered (Table 1). A special and prompt approach from the clinician is needed to achieve effective management and avoid potentially fatal complications (Figure 2). Many hospitals in the United States have formed stroke teams to ensure prompt clinical and radiographic assessment of stroke patients. Only early recognition of cardioembolic or hemorrhagic strokes in atrial fibrillation patients can lead to aggressive management of this potentially fatal and disabling condition.

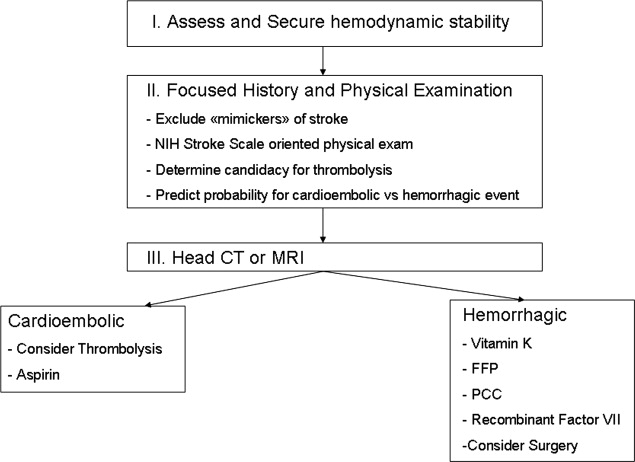
| 1. When can warfarin be safely started after an acute cardioembolic stroke? |
| 2. Could heparin in lower doses be beneficial without the risk of bleeding? |
| 3. Should we repeat thrombolysis in cases of re‐occlusion? |
| 4. What is the role of other antithrombotic and antiplatelet agents in these patients? |
- ,.The Atlas of Heart Disease and Stroke.Geneva, Switzerland:World Health Organization;2004.
- National Institute of Neurological Disorders and Stroke. NIH Stroke Scale. Available at: http://www.ninds.nih.gov/doctors/NIH_stroke_scale_booklet.pdf. Accessed January2008.
- Royal College of Physicians.National Clinical Guidelines for Stroke.2nd ed.Prepared by the Intercollegiate Stroke Working Party.London:RCP,2004.
- The European Atrial Fibrillation Trial Study Group.Optimal oral anticoagulant therapy in patients with nonrheumatic atrial fibrillation and recent cerebral ischemia.N Engl J Med.1995;333:5–10.
- ,,, et al.Advanced age, anticoagulation intensity, and risk for intracranial hemorrhage among patients taking warfarin for atrial fibrillation.Ann Intern Med.2004;141(10):745–752.
- ,.Antithrombotic treatment in atrial fibrillation.Heart.2007;93(1):39–44.
- ,,, et al.Selecting patients with atrial fibrillation for anticoagulation: stroke risk stratification in patients taking aspirin.Circulation.2004;110(16):2287–2292.
- ,,.Atrial fibrillation.Med J Aust.2007;186(4):197–202.
- ,,, et al.Guidelines for the early management of adults with ischemic stroke. A guideline from the American Heart Association/American Stroke Association Stroke Council, Clinical Cardiology Council, Cardiovascular Radiology and Intervention Council, and the Atherosclerotic Peripheral Vascular Disease and Quality of Care Outcomes in Research Interdisciplinary Working Groups.Stroke.2007;38(5):1655–1711.
- ,,, et al.MRI of acute post‐ischemic cerebral hemorrhage in stroke patients: diagnosis with T2*‐weighted gradient‐echo sequences.Neuroradiology.2001;43(10):809–815.
- ,,, et al.Emergency imaging of cerebrovascular accidents.J Neuroradiol.2004;31(4):327–333.
- ,,, et al.Guidelines for the management of spontaneous intracerebral hemorrhage in adults. 2007 update. A guideline from the American Heart Association, American Stroke Association Stroke Council, High Blood Pressure Research Council, and the Quality of Care and Outcomes in Research Interdisciplinary Working Group.Stroke.2007;38(6):2001–2023.
- ,,,,,.Systematic comparison of perfusion‐CT and CT‐angiography in acute stroke patients.Ann Neurol.2007;61(6):533–543.
- ,,,,.Antithrombotic and thrombolytic therapy for ischemic stroke: the seventh ACCP conference on antithrombotic and thrombolytic therapy.Chest.2004;126(3 suppl):S483–S512.
- .Acute ischemic stroke treatment in 2007.Circulation.2007;116(13):1504–1514.
- ,,,,.Efficacy of IV tissue plasminogen activator in acute stroke: does stroke subtype really matter?Neurology.2003;61(1):71–75.
- ,,,,,.Efficacy of intraarterial thrombolysis of basilar artery stroke.J Stroke Cerebrovasc Dis.1999;8(1):22–27.
- ,,, et al.Treatment of acute ischemic brain infarction with the assistance of local intraarterial thrombolysis with recombinant tissue‐type plasminogen activator.Acta Radiol.2007;48(7):774–780.
- ,,,,.Intra‐arterial thrombolysis using rt‐PA in patients with acute stroke due to vessel occlusion of anterior and/or posterior cerebral circulation.Neuroradiology.2008;50(1):75–83.
- .Tissue plasminogen activator for acute ischemic stroke in clinical practice: a meta‐analysis of safety data.Stroke.2003;34:2847–2850.
- ,.Arterial reocclusion in stroke patients treated with intravenous tissue plasminogen activator.Neurology.2002;59:862–867.
- ,,, et al.Site of arterial occlusion identified by transcranial Doppler predicts the response to intravenous thrombolysis for stroke.Stroke.2007;38(3):948–954.
- ,,,.Thrombolysis for acute ischemic stroke.Cochrane Database Syst Rev.2003;(3):CD000213.
- ,,, et al.Association of outcome with early stroke treatment: pooled analysis of ATLANTIS, ECASS, and NINDS rt‐PA stroke trials.Lancet.2004;363:768–774.
- ,,,,,.Trends in medical care of hospitalized stroke patients between 1980 and 1990: the Minnesota stroke survey.J Stroke Cerebrovasc Dis.1998;7(1):76–84.
- ,,,.Low molecular‐weight heparin versus aspirin in patients with acute ischaemic stroke and atrial fibrillation: a double‐blind randomized study. HAEST Study Group. Heparin in Acute Embolic Stroke Trial.Lancet.2000;355(9211):1205–1210.
- International Stroke Trial Collaborative Group.The International Stroke Trial (IST): a randomized trial of aspirin, subcutaneous heparin, both, or neither among 19435 patients with acute ischemic stroke.Lancet.1997;349(9065):1569–1581.
- .Emergent use of anticoagulation for treatment of patients with ischemic stroke.Stroke.2002;33:856–861.
- ,,,.Efficacy and safety of anticoagulant treatment in acute cardioembolic stroke: a meta‐analysis of randomized controlled trials.Stroke.2007;38(2):423–430.
- .The results of CAPRIE, IST and CAST. International Stroke Trial. Chinese Acute Stroke Trial.Thromb Res1998;92(1 suppl 1):S13–S16.
- ,,,,.Platelet activation and lipid peroxidation in patients with acute ischemic stroke.Stroke.1997;28:1557–1563.
- ,,, et al.Effect of intensity of oral anticoagulation on stroke severity and mortality in atrial fibrillation elaine.N Engl J Med.2003;349:1019–1026.
- ,,,.Hospitalized patients with atrial fibrillation and a high risk of stroke are not being provided with adequate anticoagulation.J Am Coll Cardiol.2005;46(9):1729–1736.
- ,.Preventing stroke in patients with atrial fibrillation.JAMA.1999;281(19):1830–1835.
- ,.Atrial fibrillation, stroke, and acute antithrombotic therapy: analysis of randomized clinical trials.Stroke.2002;33(11):2722–2727.
- ,,, et al.Recombinant factor VIIa for rapid reversal of warfarin anticoagulation in acute intracranial hemorrhage.Mayo Clin Proc.2004;79(12):1495–1500.
- ,,,.Managing the therapeutic dilemma: patients with spontaneous intracerebral hemorrhage and urgent need for anticoagulation.J Neurol.2000;247(3):209–214.
- ,,, et al.Early hemorrhage growth in patients with intracerebral hemorrhage.Stroke.1997;28:1–5.
- ,,.Bleeding complications in oral anticoagulant therapy: an analysis of risk factors.Arch Intern Med.1993;153:1557–1562.
- ,,,.Warfarin‐associated hemorrhage and cerebral amyloid angiopathy: a genetic and pathologic study.Neurology.2000;55(7):947–951.
- ,,, et al.Treatment of warfarin‐associated intracerebral hemorrhage: literature review and expert opinion.Mayo Clinic Proc.2007;82(1):82–92.
- ,,,,.Urgent reversal of warfarin with prothrombin complex concentrate.J Thromb Haemost.2006;4(5):967–970.
- ,.The headache over warfarin in British neurosurgical intensive care units: a national survey of current practice.Intensive Care Med.2007;33(11):1946–1953.
- ,,, et al.Timing of fresh frozen plasma administration and rapid correction of coagulopathy in warfarin‐related intracerebral hemorrhage.Stroke.2006;37(1):151–155.
- ,,,.Progression of warfarin‐associated intracerebral hemorrhage after INR normalization with FFP.Neurology.2006;67(7):1272–1274.
- ,,, et al.Successful emergency reversal of phenprocoumon anticoagulation with prothrombin complex concentrate: a prospective clinical study.Blood Coagul Fibrinolysis.2007;18(6):565–570.
- ,,, et al.Guidelines for the use of fresh‐frozen plasma, cryoprecipitate and cryosupernatant.Br J Hematol.2004;126(1):11–28.
- ,,,,,.The pharmacology and management of vitamin K antagonists. The seventh ACCP conference on antithrombotic and thrombolytic therapy.Chest.2004;126:204s–33s.
- ,,, et al.Hematoma growth and outcome in treated neurocritical care patients with intracerebral hemorrhage related to oral anticoagulant therapy. Comparison of acute treatment strategies using vitamin K, fresh frozen plasma, and prothrombin complex concentrates.Stroke.2006;37:1465.
- ,.Recombinant factor VIIa.BioDrugs.1999;12(1):71–77.
- ,,, et al.Impact of recombinant activated factor VII on health‐related quality of life after intracerebral hemorrhage.Cerebrovasc Dis.2007;24(2–3):219–225.
- ,,, et al.Recombinant activated factor VII for acute intracerebral hemorrhage: US phase IIA trial.Neurocrit Care.2006;4(3):206–214.
- ,,, et al.Early surgery versus initial conservative treatment in patients with spontaneous supratentorial intracerebral haematomas in the International Surgical Trial in Intracerebral Haemorrhage (STICH): a randomised trial.Lancet.2005;365(9457):387–397.
- ,,,,,.Advances in the care of patients with intracerebral hemorrhage.Mayo Clin Proc.2007;82(8):987–990.
- ,,,.Surgery for intracerebral hemorrhage.Neurol Sci.2004;25:s10–s11.
- ,,,.Endoscopy‐guided removal of spontaneous intracerebral hemorrhage: comparison with computer tomography‐guided stereotactic evacuation.Childs Nerv Syst.2007;23(6):677–683.
- ,.Endovascular reperfusion therapy in acute ischaemic stroke.Acta Neurol Scand Suppl.2007;187:22–29.
- .Safety of mechanical thrombectomy and intravenous tissue plasminogen activator in acute ischemic stroke. Results of the multi Mechanical Embolus Removal in Cerebral Ischemia (MERCI) trial, part I.AJNR Am J Neuroradiol.2006;27(6):1177–1182.
- ,.Appendage obliteration to reduce stroke in cardiac surgical patients with atrial fibrillation.Ann Thorac Surg.1996;61(2):755–759.
- ,,, et al.Percutaneous devices for stroke prevention.Cardiovasc Revasc Med.2007;8(3):216–225.
- ,,.Sealing the left atrial appendage: ready for prime time?Am J Med Sci.2007;333(5):285–289.
- ,,, et al.Initial worldwide experience with the WATCHMAN left atrial appendage system for stroke prevention in atrial fibrillation.J Am Coll Cardiol.2007;49(13):1490–1495.
- ,.Left atrial appendage exclusion for stroke prevention in patients with nonrheumatic atrial fibrillation.Stroke.2007;38(2 suppl):624–630.
- FDA News. FDA clears genetic lab test for warfarin sensitivity. Available at: http://www.fda.gov/bbs/topics/news/2007/new01701.html. Accessed January2008.
- .Pharmacogenomics and warfarin therapy.Issues Emerg Health Technol.2007;(104):1–8.
- ,,.Advancing stroke therapeutics through genetic understanding.Curr Drug Targets.2007;8(7):850–859.
INITIAL EVALUATION
The approach to patients with acute stroke symptoms should always start with the stabilization of the airway, breathing, and circulation. A fast clinical investigation for possible mimickers of an acute stroke (head trauma, migraines, epilepsy, infection, hypoglycemia, other metabolic derangements, and intoxications) is the next step. The history and physical examination should be guided by the National Institutes of Health stroke scale, which has been widely accepted by the American Stroke Association (ASA), the American Academy of Neurology, and the National Institute of Neurological Disorders and Stroke.2, 9 Strict control of electrolytes, glucose, and fever, management of blood pressure depending on thetype of stroke, and prophylaxis for deep vein thrombosis/pulmonary embolism, aspiration, dehydration, hypoxemia, malnutrition, and pressure sores should be initiated.9, 10 All patients with suspected acute stroke must be promptly assessed for thrombolytic therapy on the basis of the time since onset of symptoms and the National Institutes of Health stroke scale. Noncontrast computed tomography of the brain is the first step for differentiating between ischemic and hemorrhagic events.3, 9 There is an increased interest in the use of magnetic resonance imaging to detect acute intracranial hemorrhage (ICH) and its ability to detect stroke earlier than computed tomography.911 Multimodal computed tomography and magnetic resonance imaging provide additional information that will improve the diagnosis of ischemic stroke, and they have been added as a class I recommendation to the most recent stroke guidelines.9, 12 Computed tomographic angiography and perfusion computed tomography may precisely describe details regarding the site of occlusion, infarct core, salvageable brain tissue, and collateral flow that can improve patient selection for intravenous or intra‐arterial thrombolysis and exclude stroke mimics.9, 13
ISCHEMIC STROKE
Thrombolysis
In the setting of acute ischemic stroke, the patient should be promptly evaluated for thrombolytic therapy according to the American College of Chest Physicians guidelines.14 Intravenous r‐TPA (recombinant tissue plasminogen activator) is given only to 1% to 2% of stroke patients in the United States. This low percentage is mainly due to delayed presentation to an emergency department beyond the 3‐hour treatment window.15 Clear benefit has been proven for eligible patients if thrombolytic therapy is administered within 3 hours from the initiation of symptoms, although no subgroup analysis has been done in patients with atrial fibrillation.9 The efficacy of intravenous thrombolysis within the 3‐hour time window is similar between different stroke subtypes; therefore, its administration should not be delayed in order to investigate its etiology.16 Intravenous thrombolysis remains the standard of care, but recent studies have demonstrated that intra‐arterial administration, despite its risks, may be more effective in selected patients.9, 1719 Patients most likely to benefit from intra‐arterial thrombolysis are those with middle cerebral artery occlusion of less than 6 hours (Prolyse in Acute Cerebral Thromboembolism Trials I and II) and patients with severe basilar artery stroke.17, 19 A recent study in Germany has demonstrated that intra‐arterial thrombolysis may be superior to intravenous thrombolysis in the 3‐ to 6‐hour treatment window.19 The updated 2007 guidelines from the American Heart Association (AHA)/ASA have included intra‐arterial thrombolysis for specific patients who are not eligible for intravenous thrombolysis when this can be performed at experienced stroke centers.9 Thrombolysis reduces overall disability and improves the quality of life in appropriately selected patients. The risk of hemorrhage is approximately 5.2%.20 After intravenous thrombolysis, approximately one‐third of patients ultimately develop re‐occlusion of the artery, especially patients with only partial recanalization. This may lead to neurologic deterioration and higher in‐hospital mortality.21 According to more recent studies, ultrasound‐enhanced thrombolysis may augment tissue plasminogen activator induced arterial recanalization by continuous transcranial Doppler.22 Symptomatic hemorrhagic transformation of the infarction remains the primary concern with the administration of intravenous rtTPA.23, 24 Despite the apparent risks of ICH, atrial fibrillation patients not on warfarin should always be promptly referred for thrombolysis whenever they are eligible.
Heparin
For many years, clinicians have believed in the role of heparin in patients with atrial fibrillation, especially after intracranial hemorrhage is excluded by negative initial noncontrast head computed tomography.25 The most obvious pathophysiologic mechanism in patients with atrial fibrillation is cardioembolism. Therefore, it was believed that heparin could contribute to the resolution of the responsible clot. Two large international trials (the Heparin in Acute Embolic Stroke Trial and the International Stroke Trial), confirmed by multiple smaller ones, have investigated the use of heparin (unfractionated or low‐molecular‐weight heparin) at therapeutic doses in the setting of an acute ischemic event.2628 Surprisingly, none of them showed a statistically significant benefit, but instead they showed a clear increase in hemorrhagic events. Therefore, routine use of unfractionated heparin or low‐molecular‐weight heparin at therapeutic doses should be avoided in the acute setting of a stroke.28, 29
Aspirin
Among the antiplatelet agents, aspirin is the only well‐studied agent for the treatment of acute ischemic stroke. It has been proven that during the first 24 hours after stroke, there is substantial platelet activation that can be inhibited by aspirin.30, 31 Two major trials, the Chinese Acute Stroke Trial and the International Stroke Trial, have demonstrated the benefit of early aspirin use in patients with stroke and atrial fibrillation.30 Both proved a decrease in recurrent stroke without a significant increase in hemorrhaging. The recommended dose of aspirin is 325 mg/day.9 Currently, clopidogrel alone or in combination with aspirin and the intravenous administration of antiplatelet agents that inhibit the glycoprotein IIb/IIIa receptor are class III recommendations. They should not be used outside the setting of clinical trials.9
Warfarin
It is well known that atrial fibrillation increases the risk of ischemic stroke by a factor of 5.32 Studies have shown that maintaining the INR above 2.0 decreases not only the frequency but also the severity and mortality of ischemic events.4, 8, 32 The National Anticoagulation Benchmark Outcomes Report has shown that in the highest risk atrial fibrillation patients, only 55% receive warfarin and 21% do not receive aspirin or warfarin.33 This discrepancy results from the fact that warfarin is the second most common drug, after insulin, responsible for adverse drug events in emergency room visits. In atrial fibrillation patients on warfarin who present to the emergency with an acute stroke, there are no clear guidelines regarding the continued use of warfarin at therapeutic doses (target INR = 2.03.0). Warfarin is usually not initiated in the acute setting until the patient is medically stable. The exact time at which warfarin can be started or resumed after an acute ischemic stroke remains to be determined.34 Usually, it is preferable to start it within 1 week after the event, given the risk of early recurrent acute stroke during the next 2 to 4 weeks after the initial stroke.35
HEMORRHAGIC STROKE/ICH
Introduction
The risk of spontaneous ICH is 0.15%/year in patients over 70 years old and increases to 0.3% to 0.8% when patients are on therapeutic doses of warfarin with INR between 2 and 3.36, 37 Given the multiple interactions of warfarin with other medications, this is a significant concern because ICH is associated with substantial neurological deterioration.38 Although most warfarin‐induced ICH occurs in patients with therapeutic INR, it becomes the most prevalent mechanism when the INR exceeds 5.0, and it should be highly suspected.1, 4 Therefore, prompt determination of INR is critical in the initial evaluation of acute stroke in patients with atrial fibrillation. Age is the most important predisposing factor for ICH in patients with atrial fibrillation. There is almost a 50% increase in warfarin‐induced bleeding for every decade of age above 40.39 Cerebral amyloid angiopathy plays an important role in warfarin‐associated lobar ICH in the elderly, and it may contribute to the patient candidacy for warfarin treatment in the near future.40 On the other hand, a hemorrhagic stroke can be an iatrogenic complication of initiation of warfarin, heparin, or early thrombolysis because symptomatic hemorrhagic transformation of the infarction is the main and most lethal side effect of intravenous rtTPA in the treatment of acute ischemic stroke.24 ICH is associated with a 30% to 50% mortality rate, and it represents the most lethal and least treatable form of stroke.32 It has been suggested that macroalbuminuria is an independent predictor of hemorrhagic transformation and particularly of severe hemorrhage in patients with acute ischemic stroke, but specific guidelines for screening or special management of those patients do not currently exist.33 ICH is a medical emergency with high mortality and should be recognized and treated promptly. Recently, the AHA and ASA have published updated guidelines for the management of spontaneous ICH in adults.12
Vitamin K
All experts agree that anticoagulation should be urgently reversed in the setting of ICH. Although high doses of intravenous vitamin K (1020 mg) are usually enough to reverse the anticoagulant effect of warfarin, it may take up to 12 to 24 hours to act, and it depends on intact liver function. Given the high mortality of this condition, vitamin K as monotherapy is considered inadequate, and a more aggressive approach is recommended.41
Fresh Frozen Plasma (FFP)
In the United States, for many years FFP has been considered the standard of care for the acute reversal of warfarin‐associated anticoagulation.42 In general, 10 to 15 cc/kg FFP is used.43 Timing rather than dosage seems to be more important for a better clinical outcome.44 The use of FFP is complicated by the delayed time for thawing and compatibility check, volume overload, and sometimes inadequate and unpredictable correction. The median time for door‐to‐INR normalization is 30 hours, which is a significant delay for such a potentially fatal condition. Another possible complication of FFP is the report of increasing hematomas.45
Prothrombin Complex Concentrates (PCCs)
PCCs contain vitamin K dependent coagulation factors II, VII, IX, and X, the factors deficient in warfarin therapy.44, 46 Therefore, a PCC dose of 25 to 59 U/kg has been used in life‐threatening bleeding, resulting in a decrease in the median INR from 3.8 to 1.3 immediately after administration.42 PCCs should always be given with vitamin K. Thrombotic events have been described with the infusion of PCCs, but no clear guidelines have been published.42 A recent study from the Mayo Clinic showed that many experts suggest its use in the urgent condition of warfarin‐associated ICH.41 PCCs are widely used in the European community and have previously been cited as the agent of choice for urgent warfarin reversal.42, 47, 48 A recent study comparing PCCs with FFP and vitamin K has demonstrated that PCCs may be superior to FFP and vitamin K by reducing the risk of hematoma growth.49
Recombinant Factor VIIa
Recombinant factor VIIa is a preparation of activated coagulation factor VII (factor VIIa) that is produced by recombinant DNA technology.50 It was initially used for the treatment of inhibitors in patients with hemophilia. It has also been used in the past to correct anticoagulation in patients with acute ICH,36 but most studies have been done in patients with hemophilia or factor VII deficiency.50 Major limitations include cost, prothrombotic potential, and lack of correction of other coagulation factors dependent on vitamin K. Studies have shown that factor VII may be a safe, rapid, and effective way of reversing anticoagulation and may offer an improved quality of life to patients with ICH.51, 52 Factor Seven for Acute Hemorrhagic Stroke Treatment, a large phase III trial, is in progress, but preliminary results are controversial regarding the reduction in the size of hemorrhage, mortality, and improvement of functional outcome.32 In a recent article from the Mayo Clinic,41 several experts on clinical stroke, neurologic intensive care, and hematology suggest its use, alone or with FFP, for the urgent reversal of INR in the clinical setting of warfarin‐associated ICH. Currently, according to the 2007 AHA/ASA updated guidelines, recombinant factor VIIa can be administered within the first 3 to 4 hours after onset of ICH to slow progression of bleeding, although its efficacy and safety remain to be confirmed (class IIb recommendation).12
Surgical Evacuation
Despite the clear guidelines for the indications of surgery in spontaneous intracranial bleeding,12 the role of surgical evacuation in patients with supratherapeutic INR is not well defined. Many neurosurgeons are reluctant to operate in the setting of impaired hemostasis. The International Surgical Trial in Intracerebral Hemorrhage showed no clear benefit of early neurosurgical intervention compared to conservative treatment.53 Different surgical trials have shown different outcomes.54 The selection of patients who would benefit from surgery depends on the location and size of the hemorrhage, coagulation status, and Glasgow Coma Scale.55 Patients with rapidly expanding hematomas in a surgically accessible intracranial territory are more likely to benefit from a neurosurgical intervention. Newer surgical techniques with a computed‐tomography‐guided stereotactic approach or endoscopy‐guided evacuation in emerging ICH may offer better outcomes.56
RECENT ADVANCES
Mechanical Embolectomy
Mechanical embolectomy is a growing field of neurology with a promising interventional approach to the treatment of embolic strokes.57, 58 Patients with atrial fibrillation will probably be one of the patient groups who will receive maximum benefit when the efficacy and safety of the procedure are established. Endovascular reperfusion via mechanical embolectomy is offered to patients who are ineligible for thrombolytics, and it extends the time window up to 8 hours.58 For the first time, in 2007 the AHA/ASA guidelines have included the Mechanical Embolus Removal in Cerebral Ischemia device as a reasonable intervention for extraction of intra‐arterial thrombi in carefully selected patients.9
Left Atrial Appendage (LAA) Occlusion
The LAA is the source of 91% of embolic thrombi in patients with atrial fibrillation.59 Therefore, surgical or percutaneous removal or occlusion of the LAA would be an important treatment option, especially in high‐risk patients intolerant of warfarin or with recurrent strokes, despite anticoagulation. Several surgical techniques and percutaneous LAA occlusion devices have been studied with different success rates and safety characteristics.6063 Currently, there are no official guidelines for the use of those interventions.
Genetic Testing for Warfarin Sensitivity
Warfarin is the second most common drug, after insulin, to require emergency room visits for adverse drug events. In September 2007, the Food and Drug Administration approved the Nanosphere Verigene Warfarin Metabolism Nucleic Acid Test, which detects variants of 2 genes (CYP2C9 and VKORC1) implicated in the unexpected response to warfarin.6466 Guidelines for the applied use of these tests are currently under development.66
CONCLUSION
On average, there is a new stroke every 45 seconds, and every 3 to 4 minutes, someone dies from a stroke in the United States. Atrial fibrillation accounts for one‐fourth of all strokes in the elderly population. Acute stroke in anticoagulated patients with atrial fibrillation is a common, challenging scenario in emergency departments because many questions remain unanswered (Table 1). A special and prompt approach from the clinician is needed to achieve effective management and avoid potentially fatal complications (Figure 2). Many hospitals in the United States have formed stroke teams to ensure prompt clinical and radiographic assessment of stroke patients. Only early recognition of cardioembolic or hemorrhagic strokes in atrial fibrillation patients can lead to aggressive management of this potentially fatal and disabling condition.
| 1. When can warfarin be safely started after an acute cardioembolic stroke? |
| 2. Could heparin in lower doses be beneficial without the risk of bleeding? |
| 3. Should we repeat thrombolysis in cases of re‐occlusion? |
| 4. What is the role of other antithrombotic and antiplatelet agents in these patients? |
- ,.The Atlas of Heart Disease and Stroke.Geneva, Switzerland:World Health Organization;2004.
- National Institute of Neurological Disorders and Stroke. NIH Stroke Scale. Available at: http://www.ninds.nih.gov/doctors/NIH_stroke_scale_booklet.pdf. Accessed January2008.
- Royal College of Physicians.National Clinical Guidelines for Stroke.2nd ed.Prepared by the Intercollegiate Stroke Working Party.London:RCP,2004.
- The European Atrial Fibrillation Trial Study Group.Optimal oral anticoagulant therapy in patients with nonrheumatic atrial fibrillation and recent cerebral ischemia.N Engl J Med.1995;333:5–10.
- ,,, et al.Advanced age, anticoagulation intensity, and risk for intracranial hemorrhage among patients taking warfarin for atrial fibrillation.Ann Intern Med.2004;141(10):745–752.
- ,.Antithrombotic treatment in atrial fibrillation.Heart.2007;93(1):39–44.
- ,,, et al.Selecting patients with atrial fibrillation for anticoagulation: stroke risk stratification in patients taking aspirin.Circulation.2004;110(16):2287–2292.
- ,,.Atrial fibrillation.Med J Aust.2007;186(4):197–202.
- ,,, et al.Guidelines for the early management of adults with ischemic stroke. A guideline from the American Heart Association/American Stroke Association Stroke Council, Clinical Cardiology Council, Cardiovascular Radiology and Intervention Council, and the Atherosclerotic Peripheral Vascular Disease and Quality of Care Outcomes in Research Interdisciplinary Working Groups.Stroke.2007;38(5):1655–1711.
- ,,, et al.MRI of acute post‐ischemic cerebral hemorrhage in stroke patients: diagnosis with T2*‐weighted gradient‐echo sequences.Neuroradiology.2001;43(10):809–815.
- ,,, et al.Emergency imaging of cerebrovascular accidents.J Neuroradiol.2004;31(4):327–333.
- ,,, et al.Guidelines for the management of spontaneous intracerebral hemorrhage in adults. 2007 update. A guideline from the American Heart Association, American Stroke Association Stroke Council, High Blood Pressure Research Council, and the Quality of Care and Outcomes in Research Interdisciplinary Working Group.Stroke.2007;38(6):2001–2023.
- ,,,,,.Systematic comparison of perfusion‐CT and CT‐angiography in acute stroke patients.Ann Neurol.2007;61(6):533–543.
- ,,,,.Antithrombotic and thrombolytic therapy for ischemic stroke: the seventh ACCP conference on antithrombotic and thrombolytic therapy.Chest.2004;126(3 suppl):S483–S512.
- .Acute ischemic stroke treatment in 2007.Circulation.2007;116(13):1504–1514.
- ,,,,.Efficacy of IV tissue plasminogen activator in acute stroke: does stroke subtype really matter?Neurology.2003;61(1):71–75.
- ,,,,,.Efficacy of intraarterial thrombolysis of basilar artery stroke.J Stroke Cerebrovasc Dis.1999;8(1):22–27.
- ,,, et al.Treatment of acute ischemic brain infarction with the assistance of local intraarterial thrombolysis with recombinant tissue‐type plasminogen activator.Acta Radiol.2007;48(7):774–780.
- ,,,,.Intra‐arterial thrombolysis using rt‐PA in patients with acute stroke due to vessel occlusion of anterior and/or posterior cerebral circulation.Neuroradiology.2008;50(1):75–83.
- .Tissue plasminogen activator for acute ischemic stroke in clinical practice: a meta‐analysis of safety data.Stroke.2003;34:2847–2850.
- ,.Arterial reocclusion in stroke patients treated with intravenous tissue plasminogen activator.Neurology.2002;59:862–867.
- ,,, et al.Site of arterial occlusion identified by transcranial Doppler predicts the response to intravenous thrombolysis for stroke.Stroke.2007;38(3):948–954.
- ,,,.Thrombolysis for acute ischemic stroke.Cochrane Database Syst Rev.2003;(3):CD000213.
- ,,, et al.Association of outcome with early stroke treatment: pooled analysis of ATLANTIS, ECASS, and NINDS rt‐PA stroke trials.Lancet.2004;363:768–774.
- ,,,,,.Trends in medical care of hospitalized stroke patients between 1980 and 1990: the Minnesota stroke survey.J Stroke Cerebrovasc Dis.1998;7(1):76–84.
- ,,,.Low molecular‐weight heparin versus aspirin in patients with acute ischaemic stroke and atrial fibrillation: a double‐blind randomized study. HAEST Study Group. Heparin in Acute Embolic Stroke Trial.Lancet.2000;355(9211):1205–1210.
- International Stroke Trial Collaborative Group.The International Stroke Trial (IST): a randomized trial of aspirin, subcutaneous heparin, both, or neither among 19435 patients with acute ischemic stroke.Lancet.1997;349(9065):1569–1581.
- .Emergent use of anticoagulation for treatment of patients with ischemic stroke.Stroke.2002;33:856–861.
- ,,,.Efficacy and safety of anticoagulant treatment in acute cardioembolic stroke: a meta‐analysis of randomized controlled trials.Stroke.2007;38(2):423–430.
- .The results of CAPRIE, IST and CAST. International Stroke Trial. Chinese Acute Stroke Trial.Thromb Res1998;92(1 suppl 1):S13–S16.
- ,,,,.Platelet activation and lipid peroxidation in patients with acute ischemic stroke.Stroke.1997;28:1557–1563.
- ,,, et al.Effect of intensity of oral anticoagulation on stroke severity and mortality in atrial fibrillation elaine.N Engl J Med.2003;349:1019–1026.
- ,,,.Hospitalized patients with atrial fibrillation and a high risk of stroke are not being provided with adequate anticoagulation.J Am Coll Cardiol.2005;46(9):1729–1736.
- ,.Preventing stroke in patients with atrial fibrillation.JAMA.1999;281(19):1830–1835.
- ,.Atrial fibrillation, stroke, and acute antithrombotic therapy: analysis of randomized clinical trials.Stroke.2002;33(11):2722–2727.
- ,,, et al.Recombinant factor VIIa for rapid reversal of warfarin anticoagulation in acute intracranial hemorrhage.Mayo Clin Proc.2004;79(12):1495–1500.
- ,,,.Managing the therapeutic dilemma: patients with spontaneous intracerebral hemorrhage and urgent need for anticoagulation.J Neurol.2000;247(3):209–214.
- ,,, et al.Early hemorrhage growth in patients with intracerebral hemorrhage.Stroke.1997;28:1–5.
- ,,.Bleeding complications in oral anticoagulant therapy: an analysis of risk factors.Arch Intern Med.1993;153:1557–1562.
- ,,,.Warfarin‐associated hemorrhage and cerebral amyloid angiopathy: a genetic and pathologic study.Neurology.2000;55(7):947–951.
- ,,, et al.Treatment of warfarin‐associated intracerebral hemorrhage: literature review and expert opinion.Mayo Clinic Proc.2007;82(1):82–92.
- ,,,,.Urgent reversal of warfarin with prothrombin complex concentrate.J Thromb Haemost.2006;4(5):967–970.
- ,.The headache over warfarin in British neurosurgical intensive care units: a national survey of current practice.Intensive Care Med.2007;33(11):1946–1953.
- ,,, et al.Timing of fresh frozen plasma administration and rapid correction of coagulopathy in warfarin‐related intracerebral hemorrhage.Stroke.2006;37(1):151–155.
- ,,,.Progression of warfarin‐associated intracerebral hemorrhage after INR normalization with FFP.Neurology.2006;67(7):1272–1274.
- ,,, et al.Successful emergency reversal of phenprocoumon anticoagulation with prothrombin complex concentrate: a prospective clinical study.Blood Coagul Fibrinolysis.2007;18(6):565–570.
- ,,, et al.Guidelines for the use of fresh‐frozen plasma, cryoprecipitate and cryosupernatant.Br J Hematol.2004;126(1):11–28.
- ,,,,,.The pharmacology and management of vitamin K antagonists. The seventh ACCP conference on antithrombotic and thrombolytic therapy.Chest.2004;126:204s–33s.
- ,,, et al.Hematoma growth and outcome in treated neurocritical care patients with intracerebral hemorrhage related to oral anticoagulant therapy. Comparison of acute treatment strategies using vitamin K, fresh frozen plasma, and prothrombin complex concentrates.Stroke.2006;37:1465.
- ,.Recombinant factor VIIa.BioDrugs.1999;12(1):71–77.
- ,,, et al.Impact of recombinant activated factor VII on health‐related quality of life after intracerebral hemorrhage.Cerebrovasc Dis.2007;24(2–3):219–225.
- ,,, et al.Recombinant activated factor VII for acute intracerebral hemorrhage: US phase IIA trial.Neurocrit Care.2006;4(3):206–214.
- ,,, et al.Early surgery versus initial conservative treatment in patients with spontaneous supratentorial intracerebral haematomas in the International Surgical Trial in Intracerebral Haemorrhage (STICH): a randomised trial.Lancet.2005;365(9457):387–397.
- ,,,,,.Advances in the care of patients with intracerebral hemorrhage.Mayo Clin Proc.2007;82(8):987–990.
- ,,,.Surgery for intracerebral hemorrhage.Neurol Sci.2004;25:s10–s11.
- ,,,.Endoscopy‐guided removal of spontaneous intracerebral hemorrhage: comparison with computer tomography‐guided stereotactic evacuation.Childs Nerv Syst.2007;23(6):677–683.
- ,.Endovascular reperfusion therapy in acute ischaemic stroke.Acta Neurol Scand Suppl.2007;187:22–29.
- .Safety of mechanical thrombectomy and intravenous tissue plasminogen activator in acute ischemic stroke. Results of the multi Mechanical Embolus Removal in Cerebral Ischemia (MERCI) trial, part I.AJNR Am J Neuroradiol.2006;27(6):1177–1182.
- ,.Appendage obliteration to reduce stroke in cardiac surgical patients with atrial fibrillation.Ann Thorac Surg.1996;61(2):755–759.
- ,,, et al.Percutaneous devices for stroke prevention.Cardiovasc Revasc Med.2007;8(3):216–225.
- ,,.Sealing the left atrial appendage: ready for prime time?Am J Med Sci.2007;333(5):285–289.
- ,,, et al.Initial worldwide experience with the WATCHMAN left atrial appendage system for stroke prevention in atrial fibrillation.J Am Coll Cardiol.2007;49(13):1490–1495.
- ,.Left atrial appendage exclusion for stroke prevention in patients with nonrheumatic atrial fibrillation.Stroke.2007;38(2 suppl):624–630.
- FDA News. FDA clears genetic lab test for warfarin sensitivity. Available at: http://www.fda.gov/bbs/topics/news/2007/new01701.html. Accessed January2008.
- .Pharmacogenomics and warfarin therapy.Issues Emerg Health Technol.2007;(104):1–8.
- ,,.Advancing stroke therapeutics through genetic understanding.Curr Drug Targets.2007;8(7):850–859.
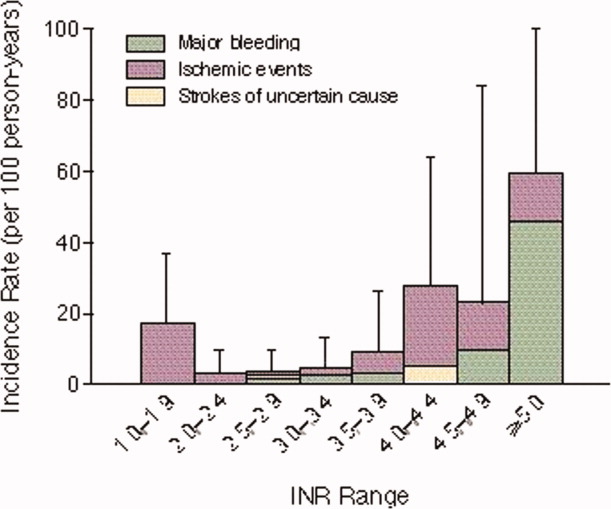
Doctor Remodel

How often are patients in your program readmitted in 30 days to any hospital? I know many of you monitor readmission rates back to your own program or facility. But if you examine the patient perspective, how often are patients you discharge being readmitted to any acute care hospital within 30 days?
Given the increasing frequency that the Centers for Medicare and Medicaid Services (CMS) is reporting about readmission rates, I asked my quality director to research our hospital’s data.
As would any reasonable chief medical officer (CMO), I figured we probably had some opportunities for improvement, but overall I felt the numbers were probably fine. Like any hospital I have worked in, we have a core group of patients who return to the hospital frequently. But from a working hospitalist perspective, it didn’t seem to be a problem in our hospital.
So, when the data returned, our initial impressions about the rates were reaffirmed. The overall hospital 30-day readmit rate to our hospital was about 6%. We looked across different payers, socioeconomic groups, discharging services, and diagnosis for areas of opportunity. We found that two populations had slightly higher rates of readmission—congestive heart failure (CHF) and sickle-cell pain crisis—but in general, there were no particular outliers.
I commissioned two quality improvement groups to begin looking at these areas, though I felt pretty good about our data. Although this was not a true all-facility, 30-day readmission rate, we felt it had to be a reasonable proxy for the true rate, which we could not obtain.
We looked to benchmark ourselves because we had no reference for comparison. CMS refers frequently to an approximate 20% readmission rate across the nation; we felt good because our rates were significantly lower. We did some like-facility comparisons, and our rate was still a little better than those facilities, so we continued to feel good.
For those of you who prefer more exact numbers, MedPac reported in June 2007 that 17.6% of admissions resulted in a readmission within 30 days, accounting for about $15 billion in Medicare spending. Further, 6% of admissions resulted in a seven-day readmission rate.
I admit from personal experience that the number CMS touts has always boggled my mind to a degree. This means that almost one in five patients returns to a hospital within 30 days. Having worked in a variety of hospitals and communities, I couldn’t imagine a rate this high. I had never seen patients bouncing back that often.
To me, this simply reaffirmed the hypothesis that healthcare has a serious problem with continuity of care and communication. But this was not my hospital’s problem—we were better than 20%! This was a problem for communities with a poor primary care base or perhaps a community without hospitalists to efficiently take care of inpatients.
But it turns out I fell into a classic leadership trap: thinking we are better than we really are.
Several months ago, I was sitting in a meeting with the quality and patient safety staff, when one of the outcomes managers passed a report to me from CMS. It was the “Pepper Report,” which CMS had begun sending to all hospitals in the past year. One of the key bits of data in this report is the hospital’s 30-day readmit rate. Because CMS is able to gather data from all facilities, this is the true readmit rate—at least for the Medicare population. Ours was approximately 17%. I was immediately deflated.
But like the optimistic person I am, I immediately saw a burning platform for change and began to plan our attack on this problem.
What is our chief tactic? A good discharge. I am convinced more than ever that we simply need to focus on a better discharge.
I am not alone in this thinking. Almost from the beginning of the hospitalist movement, we have focused on the “black hole,” that period of time from discharge to first followup appointment. Many of you who have come to SHM meetings have attended discharge planning and transitions of care sessions. We have worked closely with the Hartford Foundation in developing a good discharge for elderly patients. Part of this effort resulted in discharge checklist you will find on the SHM Web site (www.hospitalmedicine.org). The next version of this is Project BOOST (Better Outcomes for Older Adults through Safe Transitions), led by Mark V. Williams, MD, principal investigator on the project and professor and chief of the Division of Hospital Medicine at the Feinberg School of Medicine at Northwestern University in Chicago.
In early June, a group of SHM leaders visited with MedPac, which advises Congress on Medicare policy. MedPac is interested in recommendations to improve the readmission rates in the U.S. If the plea to simply provide good medical care doesn’t move you, I hope the CMS “incentives” will.
What You Can Do
Focus on the good discharge. Many tactics are intuitive. Ensure that a succinct yet complete discharge summary is sent to the next physician in a timely manner. Clearly articulate a treatment plan not only immediately after discharge but for the next several months in general. Be sure to list all test results, their interpretation, and any pending at the time of discharge. Reconcile all medications from the admission list. Teach patients and families about the illness and what to do in certain circumstances.
These are just a few of the things to do. I am sure we will discover more or refine those we know. But by simply focusing on a good discharge, your program and hospital will be in good shape for the coming scrutiny. TH
Dr. Cawley is president of SHM.
Plan Good Discharges

It was probably just the ramblings of a mad woman. Only she wasn’t mad, so I searched for a hint of delirium. Nothing. She was mentally fit and lucid—perhaps too lucid. Could it be true … had I become my archenemy?
To decide, I put her utterance to the test through the Kubler-Ross obstacle course, hopping the denial hurdle, quick-footing through the anger tire course, wading through the bargaining pool, and finally swinging safely across the depression crevasse to acceptance.
She was my eighth patient that day, a 78-year-old woman admitted to the orthopedic service with a hip fracture. I was asked to do a preoperative risk assessment and comanage her diabetes and heart failure. During our introductions she asked what kind of doctor I was.
“A hospitalist,” I replied.
“Oh … that’s nice,” she answered, her furrowed eyebrow transforming her crow’s feet into a question mark.
“You know, a doctor who only cares for patients in the hospital,” I clarified. “I just take care of your acute problems.”
“You think a broken hip is cute?”
“No, no, not ‘cute.’ Acute. You know, I only deal with your urgent problems. When you leave here you will go back to see your primary care doctor, who will follow up your hip fracture and your more chronic issues.”
That’s when she dropped the bomb.
“Oh, I see; you’re sort of like a contractor for my body then—just helping when things get broke.”
I should explain my aversion to this comment. Reared by a 10-thumbed father, I’m genetically incapable of curing even the simplest household hiccup. This doesn’t mean I haven’t or won’t try. In fact, I’m willing to try anything. My wife, however, is too smart to allow that. She knows that home improvement project plus me equals larger home improvement project. Combine this mathematical axiom with our turn-of-the-(20th)-century home, and it’s easy to see why I find myself betrothed in nearly continuous engagement with contractors.
But this is a marriage on the rocks. As dependent as I am on home contractors, I generally dislike working with them. They’re all fine people I’m sure, and truth be told most of them are quite skilled at their work. The problem is that they go about their job as if they are allergic to customer service.
The only contractors who are not perpetually late are those who won’t give you a time to meet. “I’ll meet you in the morning,” they’ll say, only to define morning as any time after the sun comes up.
Then there’s the estimate, which appears to be an approximation calculated in a cavernous ballpark using an underestimater. It’s also not exactly clear how or what goes into the calculation of an estimate.
I recently got a written estimate that read as follows: “Fix sink, $400.” When I asked what the $400 would go toward, I got the ever-so-helpful reply: “Fixing the sink.” I responded, “No, I mean, how much are the parts and the labor and things like that?” He gruffly countered, “Four hundred dollars.” Uncovering how he came up with this estimate was about as easy as solving a Rubik’s cube. I gave up trying—and eventually paid $550.
Another time, a contractor agreed to fix a plumbing leak in our upstairs bathroom that had caused water damage to our first-floor ceiling. While tearing out the floor to reach the leak, he mistakenly ran a circular saw through a pipe, causing a considerably larger gusher that quickly destroyed said ceiling.
I understand these things happen. However, imagine my surprise when the eventual project cost was more than twice the estimated cost. He explained that repairing the new water damage was quite expensive and accounted for the variance with the estimate. We “discussed” this development, during which time I explained to him in no uncertain terms what the temperature in hell would be when I paid for his mistake.
So, it stung a bit to be called a “contractor.” But I could live with it. In fact, on the surface my patient’s analogy was quite good. Hospitalists do swoop in and fix patients’ problems only to then leave their lives, most often for good. It was only after a few days that her statement started to sour in my amygdala.
Habitual tardiness, sketchy response times, vague payment structures, lack of transparency in pricing, pricing errors into the cost of the job—I don’t think the analogy was intended to be so perceptive. I and the healthcare system within which I work really had adopted some of the less-desirable attributes of the contracting world.
I usually tell patients I’ll be back in an hour to give them their test results, knowing that I’m on “doctor time” and this could mean several hours or more. My tardiness usually results from being delayed while caring for another patient—but it’s all the same to the patient left waiting. Trying to build in cushion time for these unforeseen delays leaves a patient with a disagreeable contractor-like window of time to wait. For those who want to have their family at our daily rounds, an “I’ll come see you in the morning” is not just unhelpful—it disrespects the importance of their time.
Then there’s our payment system. It’s a mystery even to me: $12 aspirins, $100,000 cancer drugs, intentionally inflated professional fees and hospital bills that aren’t expected to be paid in full (unless the patient lacks an insurer to negotiate a lower price when they ironically are expected to foot the entire bill). All of which is made worse by the lack of transparency in our pricing. Patients (and most often I) simply are not privy to the costs of various tests and interventions. And, costs for the same procedure often differ among hospitals.
Few of us would contract for work without playing a role in choosing the supplies and knowing the rough cost of the materials. Yet that’s the situation our patients find themselves in daily.
Finally, expecting patients or their insurers to pay for my mistakes is not fair. I recognize there are adverse events that are unavoidable and should be reimbursed. However, many errors are as avoidable as being careful not to cut through a working pipe. Payment for these outcomes should be shouldered by the health system—not the patient.
I limped through the next few days re-examining my patient interactions. I licked my wounds, vowing to eschew those traits that so offend me as a consumer. I might not be able to repair a broken healthcare system, but I can refurbish the way I interact with my patients by being timely and responsive and not underestimating the effect of poor customer service. TH
Dr. Glasheen is associate professor of medicine at the University of Colorado, Denver, where he serves as director of the Hospital Medicine Program and the Hospitalist Training Program, and as associate program director of the Internal Medicine Residency Program.
Coat Tales
Russ Cucina, MD, MS, a hospitalist at the University of California San Francisco (UCSF) Medical Center, and a colleague once spent a week wearing pedometers on the job to study how much ground they covered in the course of managing their patient caseloads in a huge hospital like UCSF. The result: an average of four miles walked per day.
“The usual productivity infrastructure for physicians in their offices is simply not as available to hospitalists, or isn’t under our control,” Dr. Cucina says. There may be networked computer terminals throughout the hospital, but how many there are, how accessible they are, and how much competition there is for them varies. Hospitalists may have their own offices, desks or shared office space, depending on institutional commitments, but these may be a trek from patient care areas.
As a result, they must bring essential tools of their trade on their persons. Some carry a briefcase or wear a fanny pack, but more often these essential tools are stuffed into every available pocket of their medical lab coats.
Dr. Cucina’s short list of essentials is typical of working hospitalists. It includes his “smart phone,” combining a personal digital assistant (PDA) and cell phone, pens, a reflex hammer, a tuning fork for testing neurologic sensitivities, a stethoscope, swabs for sterilizing the stethoscope, a stash of large hospital gloves (which can be a hard size to find), and a bulky and awkward—but secure—prescription pad in a cardstock wrapper.
He also totes a stack of 3-by-5-inch index cards held together with a steel ring—one card for each active patient, updated daily by hand with medication changes, lab results and other information provided by the residents. “I have tried higher-tech approaches,” he explains. “I am the hospital’s associate medical director for information technology, and I need to keep up to date and try new things, including the various applications for keeping patient lists on line. But nothing has yet beaten out hand-written index cards for efficiency and ease of use. The time it takes to input this information electronically just isn’t worth it.”
Hospitalists say additional medical tools, such as an otoscope or ophthalmoscope, could be helpful but may pile on too much bulk and weight. “I’m often challenged to find one on the floor when I really need it,” Dr. Cucina says. Portable scopes are also quite valuable and at some risk for disappearing from an unattended lab coat in the highly trafficked hospital setting.
PDA Is No Panacea
For many hospitalists, one key to efficient mobility on the job is the PDA or laptop computer, with basic references such as UpToDate, Epocrates, Tarascon Pocket Pharmacopoeia, or the Washington Manual of Medical Therapeutics, either loaded or accessed via the Internet. PDAs involve serious compromises balancing size and weight with ease of keyboard use, ease of reading the screen, and memory or processing speed. (See “Tackle Technology,” November 2007, p. 22 for a discussion of how hospitalists use portable computing devices on the job.)
“We’ve come a long way from tongue depressors and otoscopes,” says William Ford, MD, program medical director for Cogent Healthcare’s large and expanding hospitalist group based at Temple University, Collegeville, Pa. “Some of us at Temple, depending on the service, carry one or more cell phones and between one and three pagers, in a pocket or attached to a belt.” The doctors may have their own PDAs, but Cogent no longer supplies them, having converted to a Web-based tool that offers a variety of practice management resources accessed by laptop computers via the Internet.
Dr. Cucina believes the technology is evolving toward a tablet device that will integrate more of the resource databases hospitalists need in their daily practice with other essential functions, such as lab results, billing, and communications with primary physicians—all in a user-friendly scale and format. In the meantime, there’s still a lot that has to be stuffed into pockets.
Some hospitalists also prefer to hold favorite reference resources, such as the pocket-sized Sanford Guide to Antimicrobial Therapy in their hands. That also involves tradeoffs, notes Michelle Pezzani, MD, hospitalist at El Camino Hospital in Mountain View, Calif.
“I tried carrying a book bag over my shoulder, but I felt like a school kid,” Dr. Pezzani relates. “I also noticed that the more reference books I had stuffed into my pockets, the less confidence other people seemed to have in me as a physician.” Not to mention that her pockets ripped open from the weight. She even developed a sore neck from her ergonomically unbalanced, overstuffed lab coat.
“Although I love being a hospitalist, it’s getting to the point where I feel disorganized because I have no real home base,” Dr. Pezzani laments. She finds her hospitalist group’s shared office—a converted labor-and-delivery room with no windows and three desktop computers for nine doctors—less than ideal. She spends as little time as possible there.
“My life would be easier if I didn’t have to carry my office in my pockets—my ink-stained pockets,” she says. “I can’t carry my laptop around with me because of the neck pain, so I asked the hospital to give me a locker closer to the middle of the building. It has also become a kind of science for me to transfer a few personal essentials into a little satchel with a string that I wear around my neck,” since a purse is not feasible.
Love/Hate Situation
Dr. Cucina uses an online custom supplier of medical lab coats with extra, zippered pockets on the inside and outside. He’s careful not to let the lab coat of out his sight when he takes it off.
Randy Ferrance, MD, a hospitalist in internal medicine and pediatrics at Riverside Tappahannock Hospital in Tappahannock, Va., acknowledges his own love-hate relationship with the lab coat. In his pockets, he carries a stack of 3-by-5-inch index cards, an 8.5-by-11-inch hospital census sheet, folded over, a prescription pad, a highlighter pen and spare pens, the ubiquitous stethoscope, an EKG caliper, a reflex hammer with microfilament test for diabetes, and a pocket Sanford Guide.
“I’d love to ditch the lab coat,” Dr. Ferrance says. “I often take it off when I sit down and sometimes end up leaving it behind, such as in the medical dictation area. I never want to wear one when I’m talking to a child. But for a lot of families of patients who are critically ill, it is a symbol, almost like the armor of the knighthood of medicine. You have to read each family, but for some, you lose credibility when you take it off. They’re looking for everything that medicine can offer, and the lab coat gives them more confidence in you.”
Dr. Ferrance appreciates the smaller size of his 47-bed hospital, where he is never a long walk from anyplace. He frequently returns during the day to his office, which he doesn’t have to share with other doctors. He uses it for family conferences and to store larger manuals, his laptop, and diagnostic kits.
He also values his Treo Smart phone, which incorporates a variety of programs, including a drug reference, billing program, lab reports on active patients, pediatric growth chart program, pneumonia severity index calculator, a medical calculator, Geriatrics At Your Fingertips, the Harriet Lane Handbook: A Manual for Pediatric House Officers, the American Association of Pediatrics’ Redbook comprehensive online infectious disease resource, hospice eligibility criteria, a camera—“to take pictures of odd lesions”—and access to e-mail and sports scores.
Although a briefcase is one more thing to lug around and risk losing, Julia Wright, MD, director of hospital medicine at the University of Wisconsin Hospital in Madison, says she carries a bag that is a woman’s version of a briefcase, with her laptop and active administrative files required for her growing administrative duties as director of an academic hospitalist group.
“There are advantages to being mobile, but disadvantages as well,” Dr. Wright says. “You just can’t get everything done. I get between 50 and 60 phone pages a day, and a lot of curbside consults, as well.” The medical center is restructuring teaching services so a hospitalist’s assigned patients would be more often concentrated in one area, with less running from floor to floor, as well as exploring new office facilities for the hospitalist group.
Currently, 11 University of Wisconsin hospitalists share a room with five cubicles. “I’ve put my pictures up on the wall anyway, and I keep my files, stapler, and office supplies there. A couple of my partners keep their reference books there. What I like about sharing space like this is it can help with communication and collegiality within the group. We do a lot of patient hand-offs there. But as we grow and it becomes more crowded, we’re going to need some more dedicated space.” TH
Larry Beresford is a medical writer based in California.
The Patient Has Left the Building
The hospitalist service at the University of Wisconsin Hospital and Clinics in the Department of Medicine recently admitted a patient with altered sensorium, which the team determined most likely was narcotic-related. Going the extra distance, they did a spinal tap to rule out meningitis.
Within a day of changing the medication, the patient got better and was ready for discharge. However, says Julia S. Wright, MD, director of the Madison-based service, an important test remained from the spinal tap. “We thought that those results would not change the medical management of the case, but we knew if it were positive, it would be a big deal,” she recalls.
Not all medical-legal experts would agree the responsibility for patient care ends when patients leave the hospital. Often there are extenuating circumstances that may warrant the hospitalist’s continued communication and contact with patients and/or their providers and caregivers. Although there are no universally accepted standards of care that define these post-discharge issues, several hospitalists recently discussed their institutions’ and groups’ guiding principles for managing the nuances of post-discharge protocol.
Who’s Responsible?
Hospitalist Jeffrey Greenwald, MD, associate professor of medicine at Boston University School of Medicine, is a member of SHM’s Hospital Quality and Patient Safety Committee and also has been investigating pre- and post-discharge interventions through a grant-funded project from the Agency for Healthcare Research and Quality (AHRQ) called “Project RED” (the Re-Engineered Discharge, online at www.ahrq.gov/qual/pips).
One reason the post-discharge period is a “gray zone” of responsibility for care, he believes, is that the hospital system was designed to have a finite endpoint—the discharge. “This ‘out of sight, out of mind’ mentality has existed forever in the inpatient service, but it has become more highlighted in the post-hospitalist era,” he notes.
That mentality can sometimes take over in the hospitalists’ minds. “I think a lot of hospitalists are burying their heads [in the sand] about how these patients are being sent home and the chances for miscommunication and a ‘bounce-back,’ ” notes David Yu, MD, FACP, ABIM, medical director of hospitalist services, Decatur Memorial Hospital, Decatur, Ill., and clinical assistant professor of family and community medicine, Southern Illinois University School of Medicine. “This is going to be more of an issue as hospitalists become increasingly busy. The temptation is to squeeze time on discharges, because it takes an effort to reconcile medications and tie up loose ends at time of discharge. It is not acceptable to write, ‘resume current medications and follow up with PCP’ and think the job is done. It is magical thinking that discharge medications and follow-up instructions will be figured out somehow by the patient and discharging nurse.”
Cover the Gray Zone
Hospitalists describe differing approaches to ensuring patients get the care they need when they leave the hospital.
In the case of the UWHC patient who wanted to leave the hospital, the hospitalist team arranged to stay in touch with the patient. They watched for the test results during the next 24 hours. When the test came back positive, they called the patient back to the hospital, and began treatment.
“Although tracking test results may be out of the hospitalist’s purview, I think we have a strong obligation to make sure we look at some of that data,” Dr. Wright says. “I think there has to be some redundancy, otherwise, the patient probably would not have seen the primary care physician in time and would have become more ill.”
Attention to detail before discharge can avoid problems in the post-discharge period. Partnering with the pharmacy to achieve medication reconciliation has been shown to reduce risk of readmission, notes Tom Bookwalter, PharmD, associate professor of health sciences at the University of California San Francisco School of Medicine and formerly clinical pharmacist there. Using standardized templates and electronic medical records (EMR), hospitalists at many academic centers can furnish real-time discharge summaries to patients’ primary care physicians.
Dr. Yu is especially proud of the EMR system at his institution, by which discharge summaries are faxed to the primary care physician (PCP) in real time. “A patient can call their primary care physician right after discharge, and that physician will know exactly what happened during the hospital course, and what the medications and the discharge plan are,” he explains.
In addition, computerized entry and transmission eliminates the risk of error introduced when handwritten instructions are given to patients. “We believe that communication is the ‘mother’s milk’ of the hospitalist,” Dr. Yu says. Accordingly, his hospitalist service also makes a courtesy call to the PCP following transmission of the EMR for the patient.
Attorney Patrick T. O’Rourke of the Office of University Counsel at Colorado University in Denver and legal columnist for The Hospitalist, advises how to avoid inviting unintended legal consequences. “It’s important for hospitalists to understand that they are the conduit of information about what happened during the hospitalization,” he notes. “Failing to define everyone’s job in the discharge process can expose people to liability.”
In that vein, he urges hospitalists not to delegate the process of giving discharge instructions to the patient. Patients should hear directly from the hospitalist about their condition, the recommended course of action, and how to respond in case of emergency post-discharge. When returning the patient to their regular physician, the hospitalist should also touch base with the patient’s physician via e-mail or telephone to prevent gaps in communication.
Other Strategies
If budgets allow, some groups employ ancillary staff who call patients after discharge.
Hospitalist David Grace, MD, area medical officer for the Schumacher Group, Hospital Medicine Division, in Lafayette, La., reports that having a practice coordinator who calls patients within 48 hours of discharge “adds one more layer of safety to the process.” “Yes” answers to some questions (e.g., “Have your symptoms worsened? Do you have any new symptoms?”) trigger follow-up calls to the on-call hospitalist to take appropriate steps. However, O’Rourke cautions that midlevel providers should possess adequate training to be able to act appropriately upon patients’ information.
Hospitalist Randy Ferrance, DC, MD, medical director at Riverside Tappahannock Hospice in Tappahannock, Va., agrees follow-up calls to patients are a good idea. “I think more aggressive follow up in the short term, and then turning the patient over, for continuity reasons, to their primary care physician as quickly as possible is very important.” His hospitalist group, comprising only four staff, struggles with having the time to devote to such activities. However, with an average inpatient age of 72, their patients often transition to home healthcare. His group enjoys an “excellent relationship” with all the area home health agencies. Those agencies are asked to call the hospitalist group during their first visit with the patient, in addition to sending their usual report to the primary care physician. “At that first home health visit, we consider ourselves still responsible for the patient,” he says.
Beyond Liability Protection
Adhering to the “higher standard” of patient safety can improve transitions of care even further, Dr. Greenwald believes. Such actions might include a mechanism for patients to reach a member of the hospitalist team (nurse, pharmacist or physician) if they have post-discharge concerns; empowering patients and family members to know what to do if an adverse event occurs; and enabling patients to have copies of their own medical information (discharge summary, lab tests, medication reconciliations).
“In addition, we need to involve the nonmedical caregivers who are going to help the patient recuperate,” he asserts. Physicians can educate patients and their caregivers about what happened while they were in the hospital, what treatments are planned, and what information is pending at discharge. While these efforts might require that hospitalists shift their thinking about doctor-patient roles, they can help to create a more comprehensive approach to patient care.
Inherent Dangers
Ironically, what hospitalists do best—promote effective inpatient management—can also lead to a disconnect when the patient leaves the hospital. “Part of what we do, as hospitalists, is to drive down the patient’s length of stay and get them home sooner,” Dr. Grace says. “While unquestionably beneficial for a variety of reasons, it increases the chance that a patient can leave before a result comes back.”
“This change from the continuity of healthcare [provided by a physician who also saw his or her hospitalized patients] to a division of labor does have some inherent fragmentation,” agrees Dr. Wright. “We need to still look at the patient as a whole and be in communication with [our primary care colleagues] and supporting each other on both ends so that the patient does get this more comprehensive care.” TH
Gretchen Henkel is a medical writer based in California.
Do post-discharge telephone calls to patients reduce the rate of complications?
Case
A 75-year-old male with history of diabetes and heart disease is discharged from the hospital after treatment for pneumonia. He has eight medications on his discharge list and is given two new prescriptions at discharge. He has a primary care provider but will not be able to see her until three weeks after discharge. Will a follow-up call decrease potential complications?
Overview
Medication errors are prevalent, especially during the transition period from discharge to follow-up with primary care physicians. There are more than 700,000 emergency department (ED) visits each year for adverse drug events with nearly 120,000 of these episodes resulting in hospitalization.1
The likelihood of an adverse drug event increases in patients using more than five medications and when there is a lack of understanding of how and why they are taking certain medications, scenarios common on hospital discharge.2 Studies evaluating effective means to reduce medication errors during transitions out of the hospital offer few solutions. One effective method, however, appears to be follow-up telephone calls.
Telephone calls have been looked at in multiple studies and usually are performed in the studies by nurses, nurse practitioners, or pharmacists and occur within days of discharge from the hospital. These calls offer a mechanism to provide answers to questions about their medical condition or medications.
Review of the Data
There is a wide range of studies evaluating the benefit of a post-discharge telephone call. Unfortunately, most of the data are of low methodological quality with low patient numbers and high risk of bias.3
Much of the data are divided into subgroups of patients, including ED patients, cardiac patients, surgical patients, medicine patients, and other small groups. The end points also vary and examine areas such as patient satisfaction, reduction in medication errors, and effect on readmissions or repeat ED visits. The bulk of studies used a standardized script. These calls lasted only minutes, which could make it user-friendly, especially for a busy hospitalist’s schedule. Unfortunately, the effect of these interventions is mixed.
With ED patients, phone calls have been shown to be an effective means of communication between patients and physicians. In a study of 297 patients, the authors were only able to reach half the patients but still were able to identify medical problems needing referral or further intervention in 37% of the patients contacted.4 Another two studies revealed similar results with approximately 40% of the contacted patients requiring further clarification on their discharge instructions.5,6
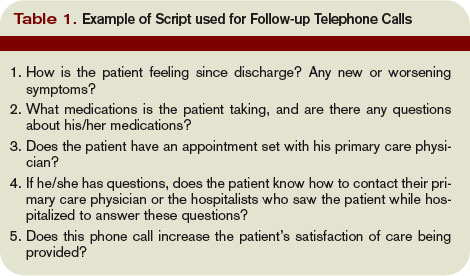
Importantly, 95% of these patients felt the call was beneficial. Thus, more than one-third of patients discharged from an ED are likely to have problems and a follow-up telephone call offers an opportunity to intervene on these potential problems. Another ED study evaluated patients older than 75 and found a nurse liaison could effectively assess the complexity of a patient’s questions and appropriately advise them over the phone or triage them to the correct care provider for further care.7
Post-discharge follow-up telephone calls also can benefit patients discharged from the hospital. A recent paper reported that approximately 12% of patients develop new or worsening symptoms within a few days post-discharge and adverse drug events can occur in between 23% to 49% of people during this transition period.8-10
Another study evaluating resource use in heart failure patients found follow-up telephone calls significantly decreased the average number of hospital days over six months time and readmission rate at six months in the call group, as well as increased patient satisfaction.11
A randomized placebo-controlled trial evaluating follow-up calls from pharmacists to discharged medical patients found the call group patients were more satisfied with their post-discharge care. Additionally, there were less ED visits within 30 days of discharge in the call group compared to placebo or standard care.12
On the other hand, several studies have questioned the utility of follow-up telephone calls for improving transitions of care. A Stanford University group divided medical and surgical patients into three groups with one receiving routine follow-up calls, another requiring a patient-initiated call and a final group without any intervention and found there was no difference between these groups in regards to patient satisfaction or 30-day readmission rates.13
An outpatient trial completed at a South Dakota Veterans Affairs clinic also determined telephone calls had little effect on decreasing resources or hospital admissions.14
Although this study did not include inpatients, it demonstrates the fact that follow-up telephone calls may not be as helpful as shown in other trials and that more thorough and well-designed trials are needed to more definitively answer this question.
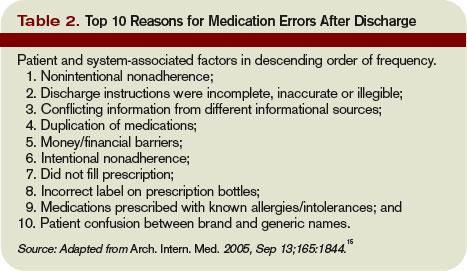
Back to the Case
The hospitalist makes a call to the patient to follow-up after he is discharged, and he says he is glad she called. He had questions about one of his medications that was discontinued while he was hospitalized and wants to know if he should restart it. He also says he is having low-grade fevers again and is not sure if he should come back in for evaluation.
The hospitalist is able to answer his questions about his medication list and instructs him to restart the metformin they had stopped while he was an inpatient. The hospitalist also is able to better explain what symptoms to be aware of and when the patient should come in for re-evaluation. The patient appreciates the five-minute call, and the hospitalist is glad she cleared up the patient’s confusion regarding his medications before a serious error or unnecessary readmission to the hospital occurred. TH
Dr. Moulds is a third-year internal medicine resident at the University of Colorado Denver. Dr. Epstein is director of medical affairs and clinical research at IPC-The Hospitalist Company.
References
- www.cdc.gov.
- Epstein K, Juarez E, Loya K, Gorman MJ, Singer A. Frequency of new or worsening symptoms in the post-hospitalization period. J Hosp Med. 2007 Mar;2(2):58-68.
- Mistiaen P, Poot E. Telephone follow-up, initiated by a hospital-based health professional, for post-discharge problems in patients discharged from hospital to home. Cochrane Database Syst Rev. 2006, Issue 4. Art. No.: CD004510. DOI:10.1002/14651858.CD004510.pub3.
- Shesser R, Smith M, Adams S, Walls R, Paxton M. The effectiveness of an organized follow-up system. Ann Emerg Med. 1986 Aug;15(8):911-915.
- Jones J, Clark W, Bradford J, Dougherty J. Efficacy of a telephone follow-up system in the emergency department. J Emerg Med. 1988 May-June;6(3):249-254.
- Jones JS, Young MS, LaFleur RA, Brown MD. Effectiveness of an organized follow-up system for elder patients released from the emergency department. Acad Emerg Med. 1997 Dec;4(12):1147-1152.
- Poncia HD, Ryan J, Carver M. Next day telephone follow up of the elderly: a needs assessment and critical incident monitoring tool for the accident and emergency department. J Accid Emerg Med. 2000 Sep;17(5):337-340.
- Kripalani S, Price M, Vigil V, Epstein K. Frequency and predictors of prescription-related issues after hospital discharge. J Hosp Med. 2008 Jan/Feb;3(1):12-19.
- Forster A, Murff H, Peterson J, Gandhi T, Bates D. Adverse drug events occurring following hospital discharge. J Gen Intern Med. 2005;20:317-323.
- Forster A, Murff H, Peterson J, Gandhi T, Bates D. The incidence and severity of adverse events affecting patients after discharge from the hospital. Ann Intern Med. 2003;138:161-167.
- Riegel B, Carlson B, Kopp Z, LePetri B, Glaser D, Unger A. Effect of a standardized nurse case-management telephone intervention on resource use in patients with chronic heart failure. Arch Intern Med. 2002 Mar 25;162(6):705-712.
- Dudas V, Bookwalter T, Kerr KM, Pantilat SZ. The impact of follow-up telephone calls to patients after hospitalization. Am J Med. 2001 Dec 21;111(9B):26S-30S.
- Bostrom J, Caldwell J, McGuire K, Everson D. Telephone follow-up after discharge from the hospital: does it make a difference? Appl Nurs Res. 1996 May;9(2):47-52.
- Welch HG, Johnson DJ, Edson R. Telephone care as an adjunct to routine medical follow-up. A negative randomized trial. Eff Clin Pract. 2000 May-June;3(3):123-130.
- Coleman E, Smith J, Raha D, Min S. Posthospital medication discrepancies. Arch Intern Med. 2005;165:1842-1847.
Case
A 75-year-old male with history of diabetes and heart disease is discharged from the hospital after treatment for pneumonia. He has eight medications on his discharge list and is given two new prescriptions at discharge. He has a primary care provider but will not be able to see her until three weeks after discharge. Will a follow-up call decrease potential complications?
Overview
Medication errors are prevalent, especially during the transition period from discharge to follow-up with primary care physicians. There are more than 700,000 emergency department (ED) visits each year for adverse drug events with nearly 120,000 of these episodes resulting in hospitalization.1
The likelihood of an adverse drug event increases in patients using more than five medications and when there is a lack of understanding of how and why they are taking certain medications, scenarios common on hospital discharge.2 Studies evaluating effective means to reduce medication errors during transitions out of the hospital offer few solutions. One effective method, however, appears to be follow-up telephone calls.
Telephone calls have been looked at in multiple studies and usually are performed in the studies by nurses, nurse practitioners, or pharmacists and occur within days of discharge from the hospital. These calls offer a mechanism to provide answers to questions about their medical condition or medications.
Review of the Data
There is a wide range of studies evaluating the benefit of a post-discharge telephone call. Unfortunately, most of the data are of low methodological quality with low patient numbers and high risk of bias.3
Much of the data are divided into subgroups of patients, including ED patients, cardiac patients, surgical patients, medicine patients, and other small groups. The end points also vary and examine areas such as patient satisfaction, reduction in medication errors, and effect on readmissions or repeat ED visits. The bulk of studies used a standardized script. These calls lasted only minutes, which could make it user-friendly, especially for a busy hospitalist’s schedule. Unfortunately, the effect of these interventions is mixed.
With ED patients, phone calls have been shown to be an effective means of communication between patients and physicians. In a study of 297 patients, the authors were only able to reach half the patients but still were able to identify medical problems needing referral or further intervention in 37% of the patients contacted.4 Another two studies revealed similar results with approximately 40% of the contacted patients requiring further clarification on their discharge instructions.5,6
Importantly, 95% of these patients felt the call was beneficial. Thus, more than one-third of patients discharged from an ED are likely to have problems and a follow-up telephone call offers an opportunity to intervene on these potential problems. Another ED study evaluated patients older than 75 and found a nurse liaison could effectively assess the complexity of a patient’s questions and appropriately advise them over the phone or triage them to the correct care provider for further care.7
Post-discharge follow-up telephone calls also can benefit patients discharged from the hospital. A recent paper reported that approximately 12% of patients develop new or worsening symptoms within a few days post-discharge and adverse drug events can occur in between 23% to 49% of people during this transition period.8-10
Another study evaluating resource use in heart failure patients found follow-up telephone calls significantly decreased the average number of hospital days over six months time and readmission rate at six months in the call group, as well as increased patient satisfaction.11
A randomized placebo-controlled trial evaluating follow-up calls from pharmacists to discharged medical patients found the call group patients were more satisfied with their post-discharge care. Additionally, there were less ED visits within 30 days of discharge in the call group compared to placebo or standard care.12
On the other hand, several studies have questioned the utility of follow-up telephone calls for improving transitions of care. A Stanford University group divided medical and surgical patients into three groups with one receiving routine follow-up calls, another requiring a patient-initiated call and a final group without any intervention and found there was no difference between these groups in regards to patient satisfaction or 30-day readmission rates.13
An outpatient trial completed at a South Dakota Veterans Affairs clinic also determined telephone calls had little effect on decreasing resources or hospital admissions.14
Although this study did not include inpatients, it demonstrates the fact that follow-up telephone calls may not be as helpful as shown in other trials and that more thorough and well-designed trials are needed to more definitively answer this question.
Back to the Case
The hospitalist makes a call to the patient to follow-up after he is discharged, and he says he is glad she called. He had questions about one of his medications that was discontinued while he was hospitalized and wants to know if he should restart it. He also says he is having low-grade fevers again and is not sure if he should come back in for evaluation.
The hospitalist is able to answer his questions about his medication list and instructs him to restart the metformin they had stopped while he was an inpatient. The hospitalist also is able to better explain what symptoms to be aware of and when the patient should come in for re-evaluation. The patient appreciates the five-minute call, and the hospitalist is glad she cleared up the patient’s confusion regarding his medications before a serious error or unnecessary readmission to the hospital occurred. TH
Dr. Moulds is a third-year internal medicine resident at the University of Colorado Denver. Dr. Epstein is director of medical affairs and clinical research at IPC-The Hospitalist Company.
References
- www.cdc.gov.
- Epstein K, Juarez E, Loya K, Gorman MJ, Singer A. Frequency of new or worsening symptoms in the post-hospitalization period. J Hosp Med. 2007 Mar;2(2):58-68.
- Mistiaen P, Poot E. Telephone follow-up, initiated by a hospital-based health professional, for post-discharge problems in patients discharged from hospital to home. Cochrane Database Syst Rev. 2006, Issue 4. Art. No.: CD004510. DOI:10.1002/14651858.CD004510.pub3.
- Shesser R, Smith M, Adams S, Walls R, Paxton M. The effectiveness of an organized follow-up system. Ann Emerg Med. 1986 Aug;15(8):911-915.
- Jones J, Clark W, Bradford J, Dougherty J. Efficacy of a telephone follow-up system in the emergency department. J Emerg Med. 1988 May-June;6(3):249-254.
- Jones JS, Young MS, LaFleur RA, Brown MD. Effectiveness of an organized follow-up system for elder patients released from the emergency department. Acad Emerg Med. 1997 Dec;4(12):1147-1152.
- Poncia HD, Ryan J, Carver M. Next day telephone follow up of the elderly: a needs assessment and critical incident monitoring tool for the accident and emergency department. J Accid Emerg Med. 2000 Sep;17(5):337-340.
- Kripalani S, Price M, Vigil V, Epstein K. Frequency and predictors of prescription-related issues after hospital discharge. J Hosp Med. 2008 Jan/Feb;3(1):12-19.
- Forster A, Murff H, Peterson J, Gandhi T, Bates D. Adverse drug events occurring following hospital discharge. J Gen Intern Med. 2005;20:317-323.
- Forster A, Murff H, Peterson J, Gandhi T, Bates D. The incidence and severity of adverse events affecting patients after discharge from the hospital. Ann Intern Med. 2003;138:161-167.
- Riegel B, Carlson B, Kopp Z, LePetri B, Glaser D, Unger A. Effect of a standardized nurse case-management telephone intervention on resource use in patients with chronic heart failure. Arch Intern Med. 2002 Mar 25;162(6):705-712.
- Dudas V, Bookwalter T, Kerr KM, Pantilat SZ. The impact of follow-up telephone calls to patients after hospitalization. Am J Med. 2001 Dec 21;111(9B):26S-30S.
- Bostrom J, Caldwell J, McGuire K, Everson D. Telephone follow-up after discharge from the hospital: does it make a difference? Appl Nurs Res. 1996 May;9(2):47-52.
- Welch HG, Johnson DJ, Edson R. Telephone care as an adjunct to routine medical follow-up. A negative randomized trial. Eff Clin Pract. 2000 May-June;3(3):123-130.
- Coleman E, Smith J, Raha D, Min S. Posthospital medication discrepancies. Arch Intern Med. 2005;165:1842-1847.