User login
Premenopausal osteoporosis, an overlooked consequence of anorexia nervosa
Among the devastating effects of anorexia nervosa, and one that is easily overlooked, is its impact on bone.
Probably more than half of young women with anorexia nervosa develop osteoporosis, and relatively quickly. Baker et al1 obtained bone scans in a series of 56 young women, mean age 27 years, who had had an eating disorder for a mean of about 10 years, and found that the bone mineral density in the femur was below the critical fracture threshold in 42 (75%).
Osteoporosis is particularly common and worrisome in female athletes (and is becoming increasingly common in male athletes as well). Female athletes have a much higher incidence of disordered eating than their peers2 and therefore are at a much higher risk of fractures.
This review summarizes the factors affecting the development of osteoporosis in these patients and discusses potential targets for intervention.
ANOREXIA AND BONE HEALTH: A COMPLEX RELATIONSHIP
Anorexia nervosa is characterized by an intense fear of gaining weight, a body weight less than 85% of expected, a distorted self-image, and, in women, missing three consecutive menstrual periods.3 The lifetime prevalence in women is about 0.5%; it is much lower in men.3 The prevalence of eating disorders in female athletes is much higher, estimated at 15% to 62%.2
The etiology of osteoporosis in patients with anorexia nervosa is complex and multifaceted. In these patients, bone resorption is increased without a concomitant increase in bone formation, resulting in a net loss of bone.4 Thus, markers of bone resorption such as N-teleopeptide and deoxypyridoline are elevated, but markers of bone formation such as osteocalcin are not.4
The loss of bone may be rapid and can occur relatively early in the disease. Some studies suggest that an illness duration longer than 12 months predicts significant loss of bone density.5 Thus, early diagnosis and intervention are important to minimize bone loss.
Women gain from 40% to 60% of their bone mass during the pubertal growth spurt in ages 11 to 14, the time when anorexia nervosa is most prevalent.6 Peak bone mass is attained by the third decade of life, but the rate of growth of bone mass is highest during adolescence and early adulthood.7 Hence, it is important to optimize bone mass during this time, as small differences in bone density can have significant clinical implications later in life: a 5% increase in bone density significantly decreases fracture risk, whereas a 10% decrease in adult bone mineral density is associated with a two to three times higher risk of fracture (reviewed by Rome and Ammerman6).
What is the role of amenorrhea in the development of osteoporosis in premenopausal patients?
Given that two of the most characteristic manifestations of anorexia nervosa are low body weight and the absence of menses, these factors have been hypothesized to be potential causes of osteoporosis.
In general, young women who present with amenorrhea should be evaluated to determine if the amenorrhea is primary or secondary. Primary amenorrhea is the absence of menarche by age 16; secondary amenorrhea is the absence of menses for more than three cycles or more than 6 months in someone who previously had had menses. The most common causes of secondary amenorrhea are ovarian disease, hypothalamic or pituitary disease, and uterine disease. Anorexia nervosa causes hypothalamic dysfunction and is a cause of secondary amenorrhea. In clinical practice, it is also important to remember that pregnancy can occur even in the setting of amenorrhea.
Amenorrhea in patients with anorexia nervosa is related to hypothalamic suppression of the release of gonadotropin-releasing hormone, resulting in lower levels of follicle-stimulating hormone and luteinizing hormone and a resultant prepubertal low-estrogen state.
In a study of 73 women with anorexia nervosa and a mean age of 17.2 years,8 20 months of amenorrhea was the threshold above which the most severe osteopenia was seen, implying that the duration of amenorrhea affects bone health.
Which factors besides amenorrhea influence bone density in premenopausal women?
Undernutrition. Body weight has been suggested to have an independent effect on bone mineral density, and density has been found to increase following weight gain, even before the return of menses.1 Once a regular menstrual cycle has been restored, significant increases in trabecular and cortical bone have been detected.1
Deficiency of insulin-like growth factor 1 (IGF-1). Anorexia nervosa is associated with decreased hepatic synthesis of IGF-I.9 Low levels of IGF-I reduce the levels of osteocalcin, a marker of bone formation, and cause abnormalities in osteoblast function.10 This deficiency is associated with the development of osteopenia in patients with anorexia nervosa.11
Low androgen levels are present in patients with anorexia nervosa, and levels appear to be further reduced by oral contraceptives.12 It remains to be determined whether the further reduction in androgens in women with anorexia nervosa using oral contraceptives is harmful to skeletal health. Low testosterone levels in boys with anorexia nervosa have been associated with lower libido, fewer erections, and potentially lower bone density.13
Hypercortisolemia. Elevated levels of total and free serum cortisol and high 24-hour urinary free cortisol excretion have been noted in anorectic patients. Levels of cortisol are inversely related to levels of osteocalcin, and hypercortisolism has been shown to be associated with osteoporosis.14,15 However, no study has yet shown causality in this population.
Osteoprotegerin has been recognized as an important regulator of bone resorption. Osteoprotegerin inhibits osteoclast differentiation and activation and stimulates osteoclast apoptosis, helping to preserve bone density.
Misra et al16 showed that adolescent girls with anorexia nervosa have higher serum osteoprotegerin levels than controls and that osteoprotegerin levels correlate inversely with markers of nutritional status and lumbar bone density Z scores.16 They and other investigators17 postulate that osteoprotegerin may be released as a compensatory response to the bone loss seen in these patients in an attempt to preserve bone health.
Leptin is an adipocyte-derived hormone that acts on receptors in the hypothalamus, decreasing food intake and increasing energy expenditure. Low leptin levels are a key endocrinologic feature of anorexia nervosa.18 Leptin helps to induce weight loss by stimulating neurons in the hypothalamus that express “weight-loss-inducing” neuropeptides such as pro-opiomelanocortin and inhibiting “weight-gain-inducing” peptides such as neuropeptide Y.19
Although leptin was first believed to be a hormone released to counteract obesity, recent studies19,20 suggest that it is part of a major signaling system that controls adaptation to starvation. These studies have shown that the body senses its corporeal fat through leptin and inhibits ovulation when fat reserves are low.19 In addition, luteinizing hormone and leptin levels have been shown to increase in parallel in patients with anorexia nervosa when weight is restored.20 Thus, rising leptin levels correlate with the resumption of menses in women with anorexia nervosa and in turn have potential consequences for bone health.
Not enough ghrelin, too much obestatin? Ghrelin, a gastric hormone, acts as a natural antagonist to leptin, resulting in an increase in food intake and body weight.19 Circulating ghrelin levels are higher in illness-induced anorexia as well as in anorexia nervosa, and they normalize with weight gain, perhaps as an adaptive mechanism to compensate for a negative energy balance.21
Several in vitro studies suggest that ghrelin directly promotes osteoblast proliferation and differentiation.22 However, human studies of ghrelin’s effects on bone are limited. In a study of healthy younger women, healthy boys, and anorexia nervosa patients, plasma ghrelin levels were only weakly associated with bone mineral density.23
The effects of obestatin, another gastric hormone, are still being investigated. Obestatin was initially shown to oppose the effects of ghrelin by decreasing appetite and weight gain. When given with ghrelin, obestatin appears to work with ghrelin at the hypothalamic level to modulate food intake and growth hormone secretion.24
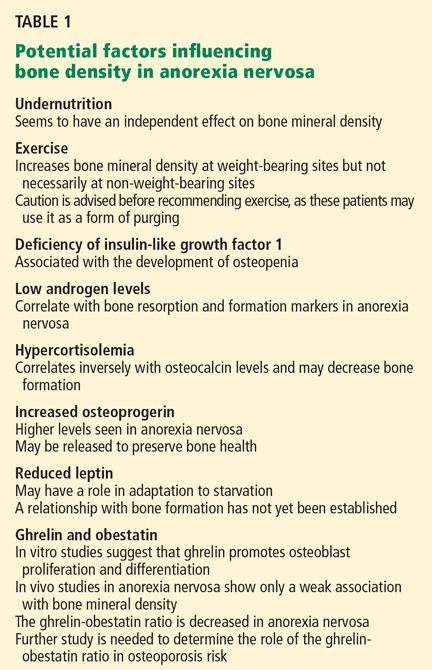
Interestingly, obestatin and the ratio of ghrelin to obestatin are decreased in patients with anorexia nervosa, but the ratio is unchanged in thin women who have an equivalent body mass index but no eating disorder.25 It has been hypothesized that the ghrelin-obestatin ratio may be the key to explaining the eating restriction and reduced motivation to eat despite high ghrelin levels seen in anorexia nervosa.26 Further studies are needed to determine the role of obestatin and the ghrelin-obestatin ratio in the bone health of women with anorexia nervosa.
HOW SHOULD WE DIAGNOSE OSTEOPOROSIS IN PREMENOPAUSAL PATIENTS?
Our approach to screening for and diagnosing osteoporosis is still largely based on measuring bone mineral density, although density by itself is not a perfect tool for predicting who will or will not experience a fracture, particularly in premenopausal women.26,27 Most premenopausal women with low bone mineral density but no other risk factors for fracture such as previous fractures or glucocorticoid therapy are at very low short-term risk of fracture.26
For these reasons, in premenopausal women and adolescents, the International Society for Clinical Densitometry28 advises against diagnosing osteoporosis on the basis of bone mineral density alone. Instead, it should be diagnosed in this population only if the bone mineral density is low (defined as a Z score below −2.0) and the patient has risk factors that suggest a higher short-term risk of bone mineral loss and fracture. Risk factors include chronic malnutrition, eating disorders, hypogonadism, glucocorticoid exposure, and previous fracture.29
A pitfall in interpreting low bone mineral density in premenopausal women younger than age 30 is the possibility that they may not yet have reached their peak bone mass. In addition, small stature and body size (and therefore bone size) also influence the results of dual-energy x-ray absorptiometry. This test may not be able to distinguish bone that is small but of normal density from bone that is of low density.26
Despite its limitations, until newer risk assessment tools are available for this patient population, measuring bone mineral density is still recommended in addition to assessing clinical risk factors to diagnose osteoporosis. Also, changes in bone mineral density over time can help to assess risk and guide treatment.
When should a patient with anorexia be screened for osteoporosis?
Because bone loss may begin early in the course of anorexia and progress rapidly (potentially inexorably), baseline screening is recommended for all patients who have had anorexia nervosa or amenorrhea for more than 6 to 12 months.30 The National Osteoporosis Foundation recommends screening in women under age 65 who have a low body weight.31 The American College of Sports Medicine recommends screening for osteoporosis in athletes with a history of hypoestrogenism or disordered eating for a cumulative total of 6 months or more, or with a history of stress fracture or fracture from minimal trauma.32
Knowledge of low bone mineral density and fracture risk can often guide treatment and prompt behavioral change. Given that most osteoporosis treatments do not lead to detectable changes in bone density until 18 months to 2 years, it is reasonable to repeat testing at this interval.33
NEW AND OLD TREATMENTS FOR LOW BONE DENSITY IN ANOREXIA NERVOSA
Weight restoration is the cornerstone
Restoration of body weight and nutritional rehabilitation remain the cornerstones of treatment. All patients with anorexia nervosa should be referred to a nutritionist to develop a meal plan that is adjusted for the amount of energy expended. The challenges lie in managing the complications of refeeding and the high relapse rate. The treatment goals in disordered eating are to optimize the overall nutritional status, normalize eating behavior, modify unhealthy thought processes that maintain the disorder, and treat possible emotional issues that help create or maintain the disorder.
The younger the patient, the more the family’s involvement is recommended. In addition to nutritional counseling, the care team should include a psychotherapist, a psychiatrist, and a primary care physician to assist with management and screening of medical complications.
Vitamin D for all
Low vitamin D levels have long been associated with low bone mineral density and risk of hip fracture.34
Vitamin D insufficiency is very common. More than 90% of blacks, Hispanics, and Asians and nearly 75% of whites have insufficient levels of vitamin D (25-hydroxyvitamin D3 level < 30 ng/mL).35 In a study of 307 healthy adolescents, vitamin D insufficiency (a 25-hydroxyvitamin D3 level < 20 ng/mL) was found in 42% and vitamin D deficiency (a level < 15 ng/mL) in 24.1%.36 In addition, this study confirmed an inverse correlation between body mass index and serum 25-hydroxyvitamin D3 concentration.
Therefore, while vitamin D supplementation has not been consistently shown to improve bone loss in anorectic patients,9 given the prevalence of vitamin D deficiency and insufficiency, supplementation is almost universally recommended.
There is no consensus as to the amount of supplementation to recommend for women with anorexia nervosa. The American College of Sports Medicine recommends a total daily intake of 800 IU of vitamin D (ie, from diet and supplements). Therapy should be titrated to doses that result in normocalcemia and a serum 25-hydroxyvitamin D3 concentration of at least 30 ng/mL.37,38
Does hormone treatment improve bone density?
In postmenopausal osteoporosis, estrogen therapy maintains or improves bone density and appears to reduce the rate of vertebral fractures.39,40 Perhaps not so with premenopausal osteoporosis due to anorexia nervosa.
Why should this be? In postmenopausal women, estrogen therapy appears to work by impairing osteoclast-mediated bone resorption, but it has only limited effects on bone formation. In premenopausal anorexia, however, bone loss appears to be due to a unique uncoupling of osteoblastic and osteoclastic functions, resulting in both reduced bone formation and increased bone resorption, which estrogen therapy may not improve.5
Despite the documented association between anorexia nervosa and estrogen deficiency and the strong correlation between osteoporosis and the duration of amenorrhea, most studies have found no improvement in bone mass with hormonal therapy.9 In particular, three randomized, placebo-controlled trials have been published to date, and not one showed a significant improvement in bone mineral density with estrogen therapy compared with placebo in patients with anorexia nervosa.41–43
Klibanski et al,41 in the first of these trials, found no significant difference in spinal bone mineral density between treated patients and controls. However, estrogen-treated patients whose initial body weight was very low (< 70% of expected) had a significant increase in their bone mineral density, whereas those in the control group lost bone density.
Baker et al44 suggest that hormone therapy might protect bone mass in athletes with amenorrhea, citing a study that found that women with a history of stress fractures were less likely to have used oral contraceptives previously than athletes without fractures.45 However, no prospective randomized study to date has established that hormone therapy effectively preserves bone mass in athletes with amenorrhea.
Based on the data presented above, we have little evidence for using estrogen to treat or prevent premenopausal osteoporosis.
The American College of Sports Medicine32 recommends consideration of estrogen therapy if there is evidence of a decline in bone mineral density in an athlete over the age of 16 with persistent functional hypothalamic amenorrhea despite adequate nutritional intake and weight. However, it acknowledges that restoring regular menstrual cycles with oral contraceptive pills will not normalize the metabolic factors that impair bone formation, health, and performance and is not likely to fully reverse low bone mineral density in this population.
What is the effect of exercise on bone health in these patients?
Several studies have examined the effect of weight-bearing exercise on bone density.
Young et al46 compared normal teenagers, ballet dancers, and young women with anorexia nervosa and found that weight-bearing exercise protected against osteoporosis, but only at weight-bearing sites. Athletes in weight-bearing sports had a 5% to 15% higher bone mineral density in weight-bearing sites (ie, the femur) compared with nonathletes, but had lower bone mineral density in the spine.
Therefore, a Z score below −1.0 in an athlete, especially in a distal site, warrants further investigation and treatment.32 In general, exercise does not necessarily protect against osteoporosis in this patient population, and it can sometimes mask underlying bone loss. In addition, keep in mind that many of these patients exercise compulsively, using it as a form of purging.
Insulin-like growth factor-1: More study needed
IGF-1 contributes to bone growth by stimulating osteoblasts, and patients with anorexia nervosa have been shown to have low levels of IGF-1.9
Grinspoon et al10 randomized 60 patients with anorexia nervosa to receive IGF-1 alone, IGF-1 plus an oral contraceptive, an oral contraceptive alone, or placebo. All patients were given calcium and vitamin D and were followed for 9 months. Total bone mass increased significantly in those taking IGF-1 compared with those taking placebo. Those taking an IGF-1 and an oral contraceptive had a significant increase in spinal bone mineral density compared with those on placebo group. At other skeletal sites, however, IGF-1 plus an oral contraceptive and IGF-1 alone failed to produce significant increases in bone mineral density compared with placebo.
Further study is needed to determine the role of IGF-1 in treating low bone mineral density in anorexia nervosa.
Bisphosphonates: Not approved for this indication
In premenopausal women, bisphosphonates are approved by the US Food and Drug Administration (FDA) for use only in those taking glucocorticoids. Although bisphosphonates have been shown to significantly increase bone mineral density in young women with anorexia nervosa,26 they should be used with caution in patients of childbearing age because they are teratogenic. Bisphosphonates have a long half-life and may continue to affect bone turnover for up to 2 years after they are discontinued.47 In addition, they are not recommended in patients with a history of purging via vomiting, due to a risk of esophageal ulceration.
Parathyroid hormone therapy: Studies ongoing
The parathyroid hormone fragment teriparatide (Forteo) is widely used for treating postmenopausal osteoporosis.
Before teriparatide was approved, there was concern that it might increase the risk of osteosarcoma, as almost 45% of rats treated with this drug at the highest-tested dose level developed this aggressive form of bone cancer.48 Balancing the proven benefits of teriparatide shown by clinical trials with the theoretic risk of teriparatide-induced osteosarcoma, the FDA mandated a “black-box” warning about this potential effect.
Studies of parathyroid hormone treatment in anorexia nervosa and other premenopausal patients are ongoing.26
Leptin: More study needed
Leptin is a potent stimulator of bone growth and has been shown to increase bone mineral density in vitro and in vivo.19 However, concerns have been raised about giving supra-physiologic doses of leptin to patients with anorexia nervosa, as this may increase the risk of further weight loss and relapse.
More work is needed to determine the role of leptin for the treatment of osteoporosis in anorexia nervosa.
Ghrelin: Probably not effective as a single agent
Pharmacologic use of ghrelin increases food intake in healthy humans,49 and it has been proposed as a treatment for weight restoration and bone health in anorexia nervosa. Preliminary studies have not shown it to increase appetite or weight gain,50 but it did increase slow-wave sleep.
Based on these studies, it is unlikely that ghrelin will be effective as a single agent to stimulate appetite, but it may be helpful in conjunction with other therapies.
Cannabinoids: Little ongoing research
Cannabinoids have been proposed as a treatment for anorexia nervosa in the hope that they would induce weight gain and in turn prevent osteoporosis.
Interest in their use in anorexia nervosa stems from the discovery of two cannabinoid receptors (CB1 and CB2) located in the brain and peripheral organ systems. Anorexia nervosa has been associated with different alleles of the CB1 gene,51 but the therapeutic implications of this are far from clear.
Cannabinoids appear to regulate eating behavior at several levels within the brain and periphery: the hypothalamus and hindbrain (integrative functions), the limbic system (for hedonic evaluation of foods), the intestinal system, and adipose tissue.52 At each of these levels, the endocannabinoid system interacts with a number of better known peptides involved in appetite regulation, including leptin, ghrelin, and the melanocortins. In mouse studies, genetic leptin deficiency is associated with elevated hypothalamic endocannabinoid levels.
Appetite stimulation by cannabinoids has been studied for several decades, particularly in relation to cachexia and malnutrition associated with cancer. Very few trials have studied cannabinoids for anorexia nervosa.
In a 4-week crossover trial in 11 patients with anorexia nervosa,53 tetrahydrocannabinol (THC) treatment resulted in an increase in sleep disturbances and interpersonal sensitivity, but it had no significant effect on weight gain compared with diazepam treatment.53
Another pilot study of nine outpatients with anorexia nervosa treated with THC showed a significant improvement in depression and perfectionism scores without any significant weight gain.19
Although this research was once promising, the risk was felt to outweigh the benefit, as cannabinoids may induce dependency in this patient group, who may already be at high risk of drug addiction, and very few have continued this line of investigation.
WHAT CAN WE DO FOR NOW?
- Weight restoration and nutritional rehabilitation remain the keys to treatment of low bone density to reduce the risk of osteoporosis in patients with anorexia nervosa. However, as many as one-third of patients with anorexia nervosa relapse during their lifetime, and other treatments are needed to stabilize and prevent bone loss.
- Vitamin D deficiency is clearly associated with a risk of osteoporosis and fracture, and patients with vitamin D deficiency should be treated with supplementation.
- Standard therapies in postmenopausal patients (such as bisphosphonates and teriparatide) should be used with caution in premenopausal anorexia nervosa patients because of potential long-term health risks.
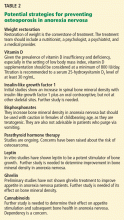
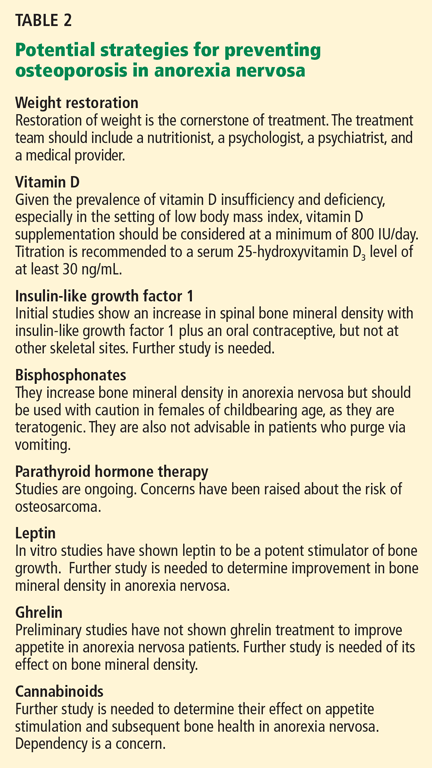
- As we learn more about hormonal factors in anorexia nervosa, we hope to identify interventions that will help restore weight and decrease the risk of osteoporosis. A summary of potential treatment strategies and targets for prevention of osteoporosis in anorexia nervosa is presented in Table 2.
Acknowledgment: The author thanks the General Internal Medicine Works in Progress Group for its editorial comments, and Dr. Ellen Rome for her mentorship and support.
- Baker D, Roberts R, Towell T. Factors predictive of bone mineral density in eating-disordered women: a longitudinal study. Int J Eat Disord 2000; 27:29–35.
- Rome ES. Eating disorders. Obstet Gynecol Clin North Am 2003; 30:353–377.
- First MB, editor. Diagnostic and Statistical Manual of Mental Disorders—4th edition. Washington, DC: American Psychiatric Association, 2000.
- Mehler PS, MacKenzie TD. Treatment of osteopenia and osteoporosis in anorexia nervosa: a systematic review of the literature. Int J Eat Disord 2009; 42:195–201.
- Wong JC, Lewindon P, Mortimer R, Shepherd R. Bone mineral density in adolescent females with recently diagnosed anorexia nervosa. Int J Eat Disord 2001; 29:11–16.
- Rome ES, Ammerman S. Medical complications of eating disorders: an update. J Adolesc Health 2003; 33:418–426.
- Recker RR, Davies KM, Hinders SM, Heaney RP, Stegman MR, Kimmel DB. Bone gain in young adult women. JAMA 1992; 268:2403–2408.
- Sterling WM, Golden NH, Jacobson MS, Ornstein RM, Hertz SM. Metabolic assessment of menstruating and nonmenstruating normal weight adolescents. Int J Eat Disord 2009; 42:658–663.
- Legroux-Gerot I, Vignau J, Collier F, Cortet B. Bone loss associated with anorexia nervosa. Joint Bone Spine 2005; 72:489–495.
- Grinspoon S, Thomas L, Miller K, Herzog D, Klibanski A. Effects of recombinant human IGF-I and oral contraceptive administration on bone density in anorexia nervosa. J Clin Endocrinol Metab 2002; 87:2883–2891.
- Soyka LA, Grinspoon S, Levitsky LL, Herzog DB, Klibanski A. The effects of anorexia nervosa on bone metabolism in female adolescents. J Clin Endocrinol Metab 1999; 84:4489–4496.
- Miller KK, Lawson EA, Mathur V, et al. Androgens in women with anorexia nervosa and normal-weight women with hypothalamic amenorrhea. J Clin Endocrinol Metab 2007; 92:1334–1339.
- Misra M, Katzman DK, Cord J, et al. Bone metabolism in adolescent boys with anorexia nervosa. J Clin Endocrinol Metab 2008; 93:3029–3036.
- Misra M, Miller KK, Almazan C, et al. Alterations in cortisol secretory dynamics in adolescent girls with anorexia nervosa and effects on bone metabolism. J Clin Endocrinol Metab 2004; 89:4972–4980.
- Chiodini I, Mascia ML, Muscarella S, et al. Subclinical hypercortisolism among outpatients referred for osteoporosis. Ann Intern Med 2007; 147:541–548.
- Misra M, Soyka LA, Miller KK, et al. Serum osteoprotegerin in adolescent girls with anorexia nervosa. J Clin Endocrinol Metab 2003; 88:3816–3822.
- Ohwada R, Hotta M, Sato K, Shibasaki T, Takano K. The relationship between serum levels of estradiol and osteoprotegerin in patients with anorexia nervosa. Endocr J 2007; 54:953–959.
- Müller TD, Föcker M, Holtkamp K, Herpertz-Dahlmann B, Hebebrand J. Leptin-mediated neuroendocrine alterations in anorexia nervosa: somatic and behavioral implications. Child Adolesc Psychiatr Clin N Am 2009; 18:117–129.
- Støving RK, Andries A, Brixen K, Flyvbjerg A, Hørder K, Frystyk J. Leptin, ghrelin, and endocannabinoids: potential therapeutic targets in anorexia nervosa. J Psychiatr Res 2009; 43:671–679.
- Audi L, Mantzoros CS, Vidal-Puig A, Vargas D, Gussinye M, Carrascosa A. Leptin in relation to resumption of menses in women with anorexia nervosa. Mol Psychiatry 1998; 3:544–547.
- Wong IP, Baldock PA, Herzog H. Gastrointestinal peptides and bone health. Curr Opin Endocrinol Diabetes Obes 2010; 17:44–50.
- Fukushima N, Hanada R, Teranishi H, et al. Ghrelin directly regulates bone formation. J Bone Miner Res 2005; 20:790–798.
- Makovey J, Naganathan V, Seibel M, Sambrook P. Gender differences in plasma ghrelin and its relations to body composition and bone—an opposite-sex twin study. Clin Endocrinol (Oxf) 2007; 66:530–537.
- Hassouna R, Zizzari P, Tolle V. The ghrelin/obestatin balance in the physiological and pathological control of growth hormone secretion, body composition and food intake. J Neuroendocrinol 2010; 22:793–804.
- Germain N, Galusca B, Grouselle D, et al. Ghrelin/obestatin ratio in two populations with low body weight: constitutional thinness and anorexia nervosa. Psychoneuroendocrinology 2009; 34:413–419.
- Cohen A, Shane E. Treatment of premenopausal women with low bone mineral density. Curr Osteoporos Rep 2008; 6:39–46.
- Licata A. Bone density vs bone quality: what’s a clinician to do? Cleve Clin J Med 2009; 76:331–336.
- Bianchi ML, Baim S, Bishop NJ, et al. Official positions of the International Society for Clinical Densitometry (ISCD) on DXA evaluation in children and adolescents. Pediatr Nephrol 2010; 25:37–47.
- Mendelsohn FA, Warren MP. Anorexia, bulimia, and the female athlete triad: evaluation and management. Endocrinol Metab Clin North Am 2010; 39:155–167.
- Mehler PS, Krantz M. Anorexia nervosa medical issues. J Womens Health (Larchmt) 2003; 12:331–340.
- Watts NB, Lewiecki EM, Miller PD, Baim S. National Osteoporosis Foundation 2008 Clinician’s Guide to Prevention and Treatment of Osteoporosis and the World Health Organization Fracture Risk Assessment Tool (FRAX): what they mean to the bone densitometrist and bone technologist. J Clin Densitom 2008; 11:473–477.
- Nattiv A, Loucks AB, Manore MM, Sanborn CF, Sundgot-Borgen J, Warren MP; American College of Sports Medicine. American College of Sports Medicine position stand. The female athlete triad. Med Sci Sports Exerc 2007; 39:1867–1882.
- Cummings SR, Palermo L, Browner W, et al. Monitoring osteoporosis therapy with bone densitometry: misleading changes and regression to the mean. Fracture Intervention Trial Research Group. JAMA 2000; 283:1318–1321.
- LeBoff MS, Kohlmeier L, Hurwitz S, Franklin J, Wright J, Glowacki J. Occult vitamin D deficiency in postmenopausal US women with acute hip fracture. JAMA 1999; 281:1505–1511.
- Adams JS, Hewison M. Update in vitamin D. J Clin Endocrinol Metab 2010; 95:471–478.
- Gordon CM, DePeter KC, Feldman HA, Grace E, Emans SJ. Prevalence of vitamin D deficiency among healthy adolescents. Arch Pediatr Adolesc Med 2004; 158:531–537.
- Hofbauer LC, Hamann C, Ebeling PR. Approach to the patient with secondary osteoporosis. Eur J Endocrinol 2010; 162:1009–1020.
- Stoffman N, Gordon CM. Vitamin D and adolescents: what do we know? Curr Opin Pediatr 2009; 21:465–471.
- Bone HG, Greenspan SL, McKeever C, et al. Alendronate and estrogen effects in postmenopausal women with low bone mineral density. Alendronate/Estrogen Study Group. J Clin Endocrinol Metab 2000; 85:720–726.
- Barrett-Connor E, Wenger NK, Grady D, et al. Hormone and nonhormone therapy for the maintenance of postmenopausal health: the need for randomized controlled trials of estrogen and raloxifene. J Womens Health 1998; 7:839–847.
- Klibanski A, Biller BM, Schoenfeld DA, Herzog DB, Saxe VC. The effects of estrogen administration on trabecular bone loss in young women with anorexia nervosa. J Clin Endocrinol Metab 1995; 80:898–904.
- Stokosch GR, Friedman AJ, Wu SC, Kamin M. Effects of an oral contraceptive (norgestimate/ethinyl estradiol) on bone mineral density in adolescent females with anorexia nervosa: double-blind, placebo-controlled study. J Adolesc Health 2006; 39:819–827.
- Golden NH, Lanzkowsky L, Schebendach J, Palestro CJ, Jacobson MS, Shenker IR. The effect of estrogen-progestin treatment on bone mineral density in anorexia nervosa. J Pediatr Adolesc Gynecol 2002; 15:135–143.
- Robinson E, Bachrach LK, Katzman DK. Use of hormone replacement therapy to reduce the risk of osteopenia in adolescent girls with anorexia nervosa. J Adolesc Health 2000; 26:343–348.
- Myburgh KH, Hutchins J, Fataar AB, et al. Low bone density is an etiologic factor for stress fractures in athletes. Ann Intern Med 1990; 113:754–759.
- Young N, Formica C, Szmukler G, Seeman E. Bone density at weight-bearing and nonweight-bearing sites in ballet dancers: the effects of exercise, hypogonadism, and body weight. J Clin Endocrinol Metab 1994; 78:449–454.
- Stock JL, Bell NH, Chesnut CH, et al. Increments in bone mineral density of the lumbar spine and hip and suppression of bone turnover are maintained after discontinuation of alendronate in postmenopausal women. Am J Med 1997; 103:291–297.
- Subbiah V, Madsen VS, Raymond AK, Benjamin RS, Ludwig JA. Of mice and men: divergent risks of teriparatide-induced osteosarcoma. Osteoporos Int 2010; 21:1041–1045.
- Wren AM, Seal LJ, Cohen MA, et al. Ghrelin enhances appetite and increases food intake in humans. J Clin Endocrinol Metab 2001; 86:5992.
- Miljic D, Pekic S, Djurovic M, et al. Ghrelin has partial or no effect on appetite, growth hormone, prolactin, and cortisol release in patients with anorexia nervosa. J Clin Endocrinol Metab 2006; 914:1491–1495.
- Siegfried Z, Kanyas K, Latzer Y, et al. Association study of cannabinoid receptor gene (CNR1) alleles and anorexia nervosa: differences between restricting and binging/purging subtypes. Am J Med Genet B Neuropsychiatr Genet 2004; 125B:126–130.
- Cota D, Marsicano G, Lutz B, et al. Endogenous cannabinoid system as a modulator of food intake. Int J Obes Relat Metab Disord 2003; 27:289–301.
- Gross H, Ebert MH, Faden VB, et al. A double-blind trial of delta 9-tetrahydrocannabinol in primary anorexia nervosa. J Clin Psychopharmacol 1983; 3:165–171.
Among the devastating effects of anorexia nervosa, and one that is easily overlooked, is its impact on bone.
Probably more than half of young women with anorexia nervosa develop osteoporosis, and relatively quickly. Baker et al1 obtained bone scans in a series of 56 young women, mean age 27 years, who had had an eating disorder for a mean of about 10 years, and found that the bone mineral density in the femur was below the critical fracture threshold in 42 (75%).
Osteoporosis is particularly common and worrisome in female athletes (and is becoming increasingly common in male athletes as well). Female athletes have a much higher incidence of disordered eating than their peers2 and therefore are at a much higher risk of fractures.
This review summarizes the factors affecting the development of osteoporosis in these patients and discusses potential targets for intervention.
ANOREXIA AND BONE HEALTH: A COMPLEX RELATIONSHIP
Anorexia nervosa is characterized by an intense fear of gaining weight, a body weight less than 85% of expected, a distorted self-image, and, in women, missing three consecutive menstrual periods.3 The lifetime prevalence in women is about 0.5%; it is much lower in men.3 The prevalence of eating disorders in female athletes is much higher, estimated at 15% to 62%.2
The etiology of osteoporosis in patients with anorexia nervosa is complex and multifaceted. In these patients, bone resorption is increased without a concomitant increase in bone formation, resulting in a net loss of bone.4 Thus, markers of bone resorption such as N-teleopeptide and deoxypyridoline are elevated, but markers of bone formation such as osteocalcin are not.4
The loss of bone may be rapid and can occur relatively early in the disease. Some studies suggest that an illness duration longer than 12 months predicts significant loss of bone density.5 Thus, early diagnosis and intervention are important to minimize bone loss.
Women gain from 40% to 60% of their bone mass during the pubertal growth spurt in ages 11 to 14, the time when anorexia nervosa is most prevalent.6 Peak bone mass is attained by the third decade of life, but the rate of growth of bone mass is highest during adolescence and early adulthood.7 Hence, it is important to optimize bone mass during this time, as small differences in bone density can have significant clinical implications later in life: a 5% increase in bone density significantly decreases fracture risk, whereas a 10% decrease in adult bone mineral density is associated with a two to three times higher risk of fracture (reviewed by Rome and Ammerman6).
What is the role of amenorrhea in the development of osteoporosis in premenopausal patients?
Given that two of the most characteristic manifestations of anorexia nervosa are low body weight and the absence of menses, these factors have been hypothesized to be potential causes of osteoporosis.
In general, young women who present with amenorrhea should be evaluated to determine if the amenorrhea is primary or secondary. Primary amenorrhea is the absence of menarche by age 16; secondary amenorrhea is the absence of menses for more than three cycles or more than 6 months in someone who previously had had menses. The most common causes of secondary amenorrhea are ovarian disease, hypothalamic or pituitary disease, and uterine disease. Anorexia nervosa causes hypothalamic dysfunction and is a cause of secondary amenorrhea. In clinical practice, it is also important to remember that pregnancy can occur even in the setting of amenorrhea.
Amenorrhea in patients with anorexia nervosa is related to hypothalamic suppression of the release of gonadotropin-releasing hormone, resulting in lower levels of follicle-stimulating hormone and luteinizing hormone and a resultant prepubertal low-estrogen state.
In a study of 73 women with anorexia nervosa and a mean age of 17.2 years,8 20 months of amenorrhea was the threshold above which the most severe osteopenia was seen, implying that the duration of amenorrhea affects bone health.
Which factors besides amenorrhea influence bone density in premenopausal women?
Undernutrition. Body weight has been suggested to have an independent effect on bone mineral density, and density has been found to increase following weight gain, even before the return of menses.1 Once a regular menstrual cycle has been restored, significant increases in trabecular and cortical bone have been detected.1
Deficiency of insulin-like growth factor 1 (IGF-1). Anorexia nervosa is associated with decreased hepatic synthesis of IGF-I.9 Low levels of IGF-I reduce the levels of osteocalcin, a marker of bone formation, and cause abnormalities in osteoblast function.10 This deficiency is associated with the development of osteopenia in patients with anorexia nervosa.11
Low androgen levels are present in patients with anorexia nervosa, and levels appear to be further reduced by oral contraceptives.12 It remains to be determined whether the further reduction in androgens in women with anorexia nervosa using oral contraceptives is harmful to skeletal health. Low testosterone levels in boys with anorexia nervosa have been associated with lower libido, fewer erections, and potentially lower bone density.13
Hypercortisolemia. Elevated levels of total and free serum cortisol and high 24-hour urinary free cortisol excretion have been noted in anorectic patients. Levels of cortisol are inversely related to levels of osteocalcin, and hypercortisolism has been shown to be associated with osteoporosis.14,15 However, no study has yet shown causality in this population.
Osteoprotegerin has been recognized as an important regulator of bone resorption. Osteoprotegerin inhibits osteoclast differentiation and activation and stimulates osteoclast apoptosis, helping to preserve bone density.
Misra et al16 showed that adolescent girls with anorexia nervosa have higher serum osteoprotegerin levels than controls and that osteoprotegerin levels correlate inversely with markers of nutritional status and lumbar bone density Z scores.16 They and other investigators17 postulate that osteoprotegerin may be released as a compensatory response to the bone loss seen in these patients in an attempt to preserve bone health.
Leptin is an adipocyte-derived hormone that acts on receptors in the hypothalamus, decreasing food intake and increasing energy expenditure. Low leptin levels are a key endocrinologic feature of anorexia nervosa.18 Leptin helps to induce weight loss by stimulating neurons in the hypothalamus that express “weight-loss-inducing” neuropeptides such as pro-opiomelanocortin and inhibiting “weight-gain-inducing” peptides such as neuropeptide Y.19
Although leptin was first believed to be a hormone released to counteract obesity, recent studies19,20 suggest that it is part of a major signaling system that controls adaptation to starvation. These studies have shown that the body senses its corporeal fat through leptin and inhibits ovulation when fat reserves are low.19 In addition, luteinizing hormone and leptin levels have been shown to increase in parallel in patients with anorexia nervosa when weight is restored.20 Thus, rising leptin levels correlate with the resumption of menses in women with anorexia nervosa and in turn have potential consequences for bone health.
Not enough ghrelin, too much obestatin? Ghrelin, a gastric hormone, acts as a natural antagonist to leptin, resulting in an increase in food intake and body weight.19 Circulating ghrelin levels are higher in illness-induced anorexia as well as in anorexia nervosa, and they normalize with weight gain, perhaps as an adaptive mechanism to compensate for a negative energy balance.21
Several in vitro studies suggest that ghrelin directly promotes osteoblast proliferation and differentiation.22 However, human studies of ghrelin’s effects on bone are limited. In a study of healthy younger women, healthy boys, and anorexia nervosa patients, plasma ghrelin levels were only weakly associated with bone mineral density.23
The effects of obestatin, another gastric hormone, are still being investigated. Obestatin was initially shown to oppose the effects of ghrelin by decreasing appetite and weight gain. When given with ghrelin, obestatin appears to work with ghrelin at the hypothalamic level to modulate food intake and growth hormone secretion.24
Interestingly, obestatin and the ratio of ghrelin to obestatin are decreased in patients with anorexia nervosa, but the ratio is unchanged in thin women who have an equivalent body mass index but no eating disorder.25 It has been hypothesized that the ghrelin-obestatin ratio may be the key to explaining the eating restriction and reduced motivation to eat despite high ghrelin levels seen in anorexia nervosa.26 Further studies are needed to determine the role of obestatin and the ghrelin-obestatin ratio in the bone health of women with anorexia nervosa.
HOW SHOULD WE DIAGNOSE OSTEOPOROSIS IN PREMENOPAUSAL PATIENTS?
Our approach to screening for and diagnosing osteoporosis is still largely based on measuring bone mineral density, although density by itself is not a perfect tool for predicting who will or will not experience a fracture, particularly in premenopausal women.26,27 Most premenopausal women with low bone mineral density but no other risk factors for fracture such as previous fractures or glucocorticoid therapy are at very low short-term risk of fracture.26
For these reasons, in premenopausal women and adolescents, the International Society for Clinical Densitometry28 advises against diagnosing osteoporosis on the basis of bone mineral density alone. Instead, it should be diagnosed in this population only if the bone mineral density is low (defined as a Z score below −2.0) and the patient has risk factors that suggest a higher short-term risk of bone mineral loss and fracture. Risk factors include chronic malnutrition, eating disorders, hypogonadism, glucocorticoid exposure, and previous fracture.29
A pitfall in interpreting low bone mineral density in premenopausal women younger than age 30 is the possibility that they may not yet have reached their peak bone mass. In addition, small stature and body size (and therefore bone size) also influence the results of dual-energy x-ray absorptiometry. This test may not be able to distinguish bone that is small but of normal density from bone that is of low density.26
Despite its limitations, until newer risk assessment tools are available for this patient population, measuring bone mineral density is still recommended in addition to assessing clinical risk factors to diagnose osteoporosis. Also, changes in bone mineral density over time can help to assess risk and guide treatment.
When should a patient with anorexia be screened for osteoporosis?
Because bone loss may begin early in the course of anorexia and progress rapidly (potentially inexorably), baseline screening is recommended for all patients who have had anorexia nervosa or amenorrhea for more than 6 to 12 months.30 The National Osteoporosis Foundation recommends screening in women under age 65 who have a low body weight.31 The American College of Sports Medicine recommends screening for osteoporosis in athletes with a history of hypoestrogenism or disordered eating for a cumulative total of 6 months or more, or with a history of stress fracture or fracture from minimal trauma.32
Knowledge of low bone mineral density and fracture risk can often guide treatment and prompt behavioral change. Given that most osteoporosis treatments do not lead to detectable changes in bone density until 18 months to 2 years, it is reasonable to repeat testing at this interval.33
NEW AND OLD TREATMENTS FOR LOW BONE DENSITY IN ANOREXIA NERVOSA
Weight restoration is the cornerstone
Restoration of body weight and nutritional rehabilitation remain the cornerstones of treatment. All patients with anorexia nervosa should be referred to a nutritionist to develop a meal plan that is adjusted for the amount of energy expended. The challenges lie in managing the complications of refeeding and the high relapse rate. The treatment goals in disordered eating are to optimize the overall nutritional status, normalize eating behavior, modify unhealthy thought processes that maintain the disorder, and treat possible emotional issues that help create or maintain the disorder.
The younger the patient, the more the family’s involvement is recommended. In addition to nutritional counseling, the care team should include a psychotherapist, a psychiatrist, and a primary care physician to assist with management and screening of medical complications.
Vitamin D for all
Low vitamin D levels have long been associated with low bone mineral density and risk of hip fracture.34
Vitamin D insufficiency is very common. More than 90% of blacks, Hispanics, and Asians and nearly 75% of whites have insufficient levels of vitamin D (25-hydroxyvitamin D3 level < 30 ng/mL).35 In a study of 307 healthy adolescents, vitamin D insufficiency (a 25-hydroxyvitamin D3 level < 20 ng/mL) was found in 42% and vitamin D deficiency (a level < 15 ng/mL) in 24.1%.36 In addition, this study confirmed an inverse correlation between body mass index and serum 25-hydroxyvitamin D3 concentration.
Therefore, while vitamin D supplementation has not been consistently shown to improve bone loss in anorectic patients,9 given the prevalence of vitamin D deficiency and insufficiency, supplementation is almost universally recommended.
There is no consensus as to the amount of supplementation to recommend for women with anorexia nervosa. The American College of Sports Medicine recommends a total daily intake of 800 IU of vitamin D (ie, from diet and supplements). Therapy should be titrated to doses that result in normocalcemia and a serum 25-hydroxyvitamin D3 concentration of at least 30 ng/mL.37,38
Does hormone treatment improve bone density?
In postmenopausal osteoporosis, estrogen therapy maintains or improves bone density and appears to reduce the rate of vertebral fractures.39,40 Perhaps not so with premenopausal osteoporosis due to anorexia nervosa.
Why should this be? In postmenopausal women, estrogen therapy appears to work by impairing osteoclast-mediated bone resorption, but it has only limited effects on bone formation. In premenopausal anorexia, however, bone loss appears to be due to a unique uncoupling of osteoblastic and osteoclastic functions, resulting in both reduced bone formation and increased bone resorption, which estrogen therapy may not improve.5
Despite the documented association between anorexia nervosa and estrogen deficiency and the strong correlation between osteoporosis and the duration of amenorrhea, most studies have found no improvement in bone mass with hormonal therapy.9 In particular, three randomized, placebo-controlled trials have been published to date, and not one showed a significant improvement in bone mineral density with estrogen therapy compared with placebo in patients with anorexia nervosa.41–43
Klibanski et al,41 in the first of these trials, found no significant difference in spinal bone mineral density between treated patients and controls. However, estrogen-treated patients whose initial body weight was very low (< 70% of expected) had a significant increase in their bone mineral density, whereas those in the control group lost bone density.
Baker et al44 suggest that hormone therapy might protect bone mass in athletes with amenorrhea, citing a study that found that women with a history of stress fractures were less likely to have used oral contraceptives previously than athletes without fractures.45 However, no prospective randomized study to date has established that hormone therapy effectively preserves bone mass in athletes with amenorrhea.
Based on the data presented above, we have little evidence for using estrogen to treat or prevent premenopausal osteoporosis.
The American College of Sports Medicine32 recommends consideration of estrogen therapy if there is evidence of a decline in bone mineral density in an athlete over the age of 16 with persistent functional hypothalamic amenorrhea despite adequate nutritional intake and weight. However, it acknowledges that restoring regular menstrual cycles with oral contraceptive pills will not normalize the metabolic factors that impair bone formation, health, and performance and is not likely to fully reverse low bone mineral density in this population.
What is the effect of exercise on bone health in these patients?
Several studies have examined the effect of weight-bearing exercise on bone density.
Young et al46 compared normal teenagers, ballet dancers, and young women with anorexia nervosa and found that weight-bearing exercise protected against osteoporosis, but only at weight-bearing sites. Athletes in weight-bearing sports had a 5% to 15% higher bone mineral density in weight-bearing sites (ie, the femur) compared with nonathletes, but had lower bone mineral density in the spine.
Therefore, a Z score below −1.0 in an athlete, especially in a distal site, warrants further investigation and treatment.32 In general, exercise does not necessarily protect against osteoporosis in this patient population, and it can sometimes mask underlying bone loss. In addition, keep in mind that many of these patients exercise compulsively, using it as a form of purging.
Insulin-like growth factor-1: More study needed
IGF-1 contributes to bone growth by stimulating osteoblasts, and patients with anorexia nervosa have been shown to have low levels of IGF-1.9
Grinspoon et al10 randomized 60 patients with anorexia nervosa to receive IGF-1 alone, IGF-1 plus an oral contraceptive, an oral contraceptive alone, or placebo. All patients were given calcium and vitamin D and were followed for 9 months. Total bone mass increased significantly in those taking IGF-1 compared with those taking placebo. Those taking an IGF-1 and an oral contraceptive had a significant increase in spinal bone mineral density compared with those on placebo group. At other skeletal sites, however, IGF-1 plus an oral contraceptive and IGF-1 alone failed to produce significant increases in bone mineral density compared with placebo.
Further study is needed to determine the role of IGF-1 in treating low bone mineral density in anorexia nervosa.
Bisphosphonates: Not approved for this indication
In premenopausal women, bisphosphonates are approved by the US Food and Drug Administration (FDA) for use only in those taking glucocorticoids. Although bisphosphonates have been shown to significantly increase bone mineral density in young women with anorexia nervosa,26 they should be used with caution in patients of childbearing age because they are teratogenic. Bisphosphonates have a long half-life and may continue to affect bone turnover for up to 2 years after they are discontinued.47 In addition, they are not recommended in patients with a history of purging via vomiting, due to a risk of esophageal ulceration.
Parathyroid hormone therapy: Studies ongoing
The parathyroid hormone fragment teriparatide (Forteo) is widely used for treating postmenopausal osteoporosis.
Before teriparatide was approved, there was concern that it might increase the risk of osteosarcoma, as almost 45% of rats treated with this drug at the highest-tested dose level developed this aggressive form of bone cancer.48 Balancing the proven benefits of teriparatide shown by clinical trials with the theoretic risk of teriparatide-induced osteosarcoma, the FDA mandated a “black-box” warning about this potential effect.
Studies of parathyroid hormone treatment in anorexia nervosa and other premenopausal patients are ongoing.26
Leptin: More study needed
Leptin is a potent stimulator of bone growth and has been shown to increase bone mineral density in vitro and in vivo.19 However, concerns have been raised about giving supra-physiologic doses of leptin to patients with anorexia nervosa, as this may increase the risk of further weight loss and relapse.
More work is needed to determine the role of leptin for the treatment of osteoporosis in anorexia nervosa.
Ghrelin: Probably not effective as a single agent
Pharmacologic use of ghrelin increases food intake in healthy humans,49 and it has been proposed as a treatment for weight restoration and bone health in anorexia nervosa. Preliminary studies have not shown it to increase appetite or weight gain,50 but it did increase slow-wave sleep.
Based on these studies, it is unlikely that ghrelin will be effective as a single agent to stimulate appetite, but it may be helpful in conjunction with other therapies.
Cannabinoids: Little ongoing research
Cannabinoids have been proposed as a treatment for anorexia nervosa in the hope that they would induce weight gain and in turn prevent osteoporosis.
Interest in their use in anorexia nervosa stems from the discovery of two cannabinoid receptors (CB1 and CB2) located in the brain and peripheral organ systems. Anorexia nervosa has been associated with different alleles of the CB1 gene,51 but the therapeutic implications of this are far from clear.
Cannabinoids appear to regulate eating behavior at several levels within the brain and periphery: the hypothalamus and hindbrain (integrative functions), the limbic system (for hedonic evaluation of foods), the intestinal system, and adipose tissue.52 At each of these levels, the endocannabinoid system interacts with a number of better known peptides involved in appetite regulation, including leptin, ghrelin, and the melanocortins. In mouse studies, genetic leptin deficiency is associated with elevated hypothalamic endocannabinoid levels.
Appetite stimulation by cannabinoids has been studied for several decades, particularly in relation to cachexia and malnutrition associated with cancer. Very few trials have studied cannabinoids for anorexia nervosa.
In a 4-week crossover trial in 11 patients with anorexia nervosa,53 tetrahydrocannabinol (THC) treatment resulted in an increase in sleep disturbances and interpersonal sensitivity, but it had no significant effect on weight gain compared with diazepam treatment.53
Another pilot study of nine outpatients with anorexia nervosa treated with THC showed a significant improvement in depression and perfectionism scores without any significant weight gain.19
Although this research was once promising, the risk was felt to outweigh the benefit, as cannabinoids may induce dependency in this patient group, who may already be at high risk of drug addiction, and very few have continued this line of investigation.
WHAT CAN WE DO FOR NOW?
- Weight restoration and nutritional rehabilitation remain the keys to treatment of low bone density to reduce the risk of osteoporosis in patients with anorexia nervosa. However, as many as one-third of patients with anorexia nervosa relapse during their lifetime, and other treatments are needed to stabilize and prevent bone loss.
- Vitamin D deficiency is clearly associated with a risk of osteoporosis and fracture, and patients with vitamin D deficiency should be treated with supplementation.
- Standard therapies in postmenopausal patients (such as bisphosphonates and teriparatide) should be used with caution in premenopausal anorexia nervosa patients because of potential long-term health risks.
- As we learn more about hormonal factors in anorexia nervosa, we hope to identify interventions that will help restore weight and decrease the risk of osteoporosis. A summary of potential treatment strategies and targets for prevention of osteoporosis in anorexia nervosa is presented in Table 2.
Acknowledgment: The author thanks the General Internal Medicine Works in Progress Group for its editorial comments, and Dr. Ellen Rome for her mentorship and support.
Among the devastating effects of anorexia nervosa, and one that is easily overlooked, is its impact on bone.
Probably more than half of young women with anorexia nervosa develop osteoporosis, and relatively quickly. Baker et al1 obtained bone scans in a series of 56 young women, mean age 27 years, who had had an eating disorder for a mean of about 10 years, and found that the bone mineral density in the femur was below the critical fracture threshold in 42 (75%).
Osteoporosis is particularly common and worrisome in female athletes (and is becoming increasingly common in male athletes as well). Female athletes have a much higher incidence of disordered eating than their peers2 and therefore are at a much higher risk of fractures.
This review summarizes the factors affecting the development of osteoporosis in these patients and discusses potential targets for intervention.
ANOREXIA AND BONE HEALTH: A COMPLEX RELATIONSHIP
Anorexia nervosa is characterized by an intense fear of gaining weight, a body weight less than 85% of expected, a distorted self-image, and, in women, missing three consecutive menstrual periods.3 The lifetime prevalence in women is about 0.5%; it is much lower in men.3 The prevalence of eating disorders in female athletes is much higher, estimated at 15% to 62%.2
The etiology of osteoporosis in patients with anorexia nervosa is complex and multifaceted. In these patients, bone resorption is increased without a concomitant increase in bone formation, resulting in a net loss of bone.4 Thus, markers of bone resorption such as N-teleopeptide and deoxypyridoline are elevated, but markers of bone formation such as osteocalcin are not.4
The loss of bone may be rapid and can occur relatively early in the disease. Some studies suggest that an illness duration longer than 12 months predicts significant loss of bone density.5 Thus, early diagnosis and intervention are important to minimize bone loss.
Women gain from 40% to 60% of their bone mass during the pubertal growth spurt in ages 11 to 14, the time when anorexia nervosa is most prevalent.6 Peak bone mass is attained by the third decade of life, but the rate of growth of bone mass is highest during adolescence and early adulthood.7 Hence, it is important to optimize bone mass during this time, as small differences in bone density can have significant clinical implications later in life: a 5% increase in bone density significantly decreases fracture risk, whereas a 10% decrease in adult bone mineral density is associated with a two to three times higher risk of fracture (reviewed by Rome and Ammerman6).
What is the role of amenorrhea in the development of osteoporosis in premenopausal patients?
Given that two of the most characteristic manifestations of anorexia nervosa are low body weight and the absence of menses, these factors have been hypothesized to be potential causes of osteoporosis.
In general, young women who present with amenorrhea should be evaluated to determine if the amenorrhea is primary or secondary. Primary amenorrhea is the absence of menarche by age 16; secondary amenorrhea is the absence of menses for more than three cycles or more than 6 months in someone who previously had had menses. The most common causes of secondary amenorrhea are ovarian disease, hypothalamic or pituitary disease, and uterine disease. Anorexia nervosa causes hypothalamic dysfunction and is a cause of secondary amenorrhea. In clinical practice, it is also important to remember that pregnancy can occur even in the setting of amenorrhea.
Amenorrhea in patients with anorexia nervosa is related to hypothalamic suppression of the release of gonadotropin-releasing hormone, resulting in lower levels of follicle-stimulating hormone and luteinizing hormone and a resultant prepubertal low-estrogen state.
In a study of 73 women with anorexia nervosa and a mean age of 17.2 years,8 20 months of amenorrhea was the threshold above which the most severe osteopenia was seen, implying that the duration of amenorrhea affects bone health.
Which factors besides amenorrhea influence bone density in premenopausal women?
Undernutrition. Body weight has been suggested to have an independent effect on bone mineral density, and density has been found to increase following weight gain, even before the return of menses.1 Once a regular menstrual cycle has been restored, significant increases in trabecular and cortical bone have been detected.1
Deficiency of insulin-like growth factor 1 (IGF-1). Anorexia nervosa is associated with decreased hepatic synthesis of IGF-I.9 Low levels of IGF-I reduce the levels of osteocalcin, a marker of bone formation, and cause abnormalities in osteoblast function.10 This deficiency is associated with the development of osteopenia in patients with anorexia nervosa.11
Low androgen levels are present in patients with anorexia nervosa, and levels appear to be further reduced by oral contraceptives.12 It remains to be determined whether the further reduction in androgens in women with anorexia nervosa using oral contraceptives is harmful to skeletal health. Low testosterone levels in boys with anorexia nervosa have been associated with lower libido, fewer erections, and potentially lower bone density.13
Hypercortisolemia. Elevated levels of total and free serum cortisol and high 24-hour urinary free cortisol excretion have been noted in anorectic patients. Levels of cortisol are inversely related to levels of osteocalcin, and hypercortisolism has been shown to be associated with osteoporosis.14,15 However, no study has yet shown causality in this population.
Osteoprotegerin has been recognized as an important regulator of bone resorption. Osteoprotegerin inhibits osteoclast differentiation and activation and stimulates osteoclast apoptosis, helping to preserve bone density.
Misra et al16 showed that adolescent girls with anorexia nervosa have higher serum osteoprotegerin levels than controls and that osteoprotegerin levels correlate inversely with markers of nutritional status and lumbar bone density Z scores.16 They and other investigators17 postulate that osteoprotegerin may be released as a compensatory response to the bone loss seen in these patients in an attempt to preserve bone health.
Leptin is an adipocyte-derived hormone that acts on receptors in the hypothalamus, decreasing food intake and increasing energy expenditure. Low leptin levels are a key endocrinologic feature of anorexia nervosa.18 Leptin helps to induce weight loss by stimulating neurons in the hypothalamus that express “weight-loss-inducing” neuropeptides such as pro-opiomelanocortin and inhibiting “weight-gain-inducing” peptides such as neuropeptide Y.19
Although leptin was first believed to be a hormone released to counteract obesity, recent studies19,20 suggest that it is part of a major signaling system that controls adaptation to starvation. These studies have shown that the body senses its corporeal fat through leptin and inhibits ovulation when fat reserves are low.19 In addition, luteinizing hormone and leptin levels have been shown to increase in parallel in patients with anorexia nervosa when weight is restored.20 Thus, rising leptin levels correlate with the resumption of menses in women with anorexia nervosa and in turn have potential consequences for bone health.
Not enough ghrelin, too much obestatin? Ghrelin, a gastric hormone, acts as a natural antagonist to leptin, resulting in an increase in food intake and body weight.19 Circulating ghrelin levels are higher in illness-induced anorexia as well as in anorexia nervosa, and they normalize with weight gain, perhaps as an adaptive mechanism to compensate for a negative energy balance.21
Several in vitro studies suggest that ghrelin directly promotes osteoblast proliferation and differentiation.22 However, human studies of ghrelin’s effects on bone are limited. In a study of healthy younger women, healthy boys, and anorexia nervosa patients, plasma ghrelin levels were only weakly associated with bone mineral density.23
The effects of obestatin, another gastric hormone, are still being investigated. Obestatin was initially shown to oppose the effects of ghrelin by decreasing appetite and weight gain. When given with ghrelin, obestatin appears to work with ghrelin at the hypothalamic level to modulate food intake and growth hormone secretion.24
Interestingly, obestatin and the ratio of ghrelin to obestatin are decreased in patients with anorexia nervosa, but the ratio is unchanged in thin women who have an equivalent body mass index but no eating disorder.25 It has been hypothesized that the ghrelin-obestatin ratio may be the key to explaining the eating restriction and reduced motivation to eat despite high ghrelin levels seen in anorexia nervosa.26 Further studies are needed to determine the role of obestatin and the ghrelin-obestatin ratio in the bone health of women with anorexia nervosa.
HOW SHOULD WE DIAGNOSE OSTEOPOROSIS IN PREMENOPAUSAL PATIENTS?
Our approach to screening for and diagnosing osteoporosis is still largely based on measuring bone mineral density, although density by itself is not a perfect tool for predicting who will or will not experience a fracture, particularly in premenopausal women.26,27 Most premenopausal women with low bone mineral density but no other risk factors for fracture such as previous fractures or glucocorticoid therapy are at very low short-term risk of fracture.26
For these reasons, in premenopausal women and adolescents, the International Society for Clinical Densitometry28 advises against diagnosing osteoporosis on the basis of bone mineral density alone. Instead, it should be diagnosed in this population only if the bone mineral density is low (defined as a Z score below −2.0) and the patient has risk factors that suggest a higher short-term risk of bone mineral loss and fracture. Risk factors include chronic malnutrition, eating disorders, hypogonadism, glucocorticoid exposure, and previous fracture.29
A pitfall in interpreting low bone mineral density in premenopausal women younger than age 30 is the possibility that they may not yet have reached their peak bone mass. In addition, small stature and body size (and therefore bone size) also influence the results of dual-energy x-ray absorptiometry. This test may not be able to distinguish bone that is small but of normal density from bone that is of low density.26
Despite its limitations, until newer risk assessment tools are available for this patient population, measuring bone mineral density is still recommended in addition to assessing clinical risk factors to diagnose osteoporosis. Also, changes in bone mineral density over time can help to assess risk and guide treatment.
When should a patient with anorexia be screened for osteoporosis?
Because bone loss may begin early in the course of anorexia and progress rapidly (potentially inexorably), baseline screening is recommended for all patients who have had anorexia nervosa or amenorrhea for more than 6 to 12 months.30 The National Osteoporosis Foundation recommends screening in women under age 65 who have a low body weight.31 The American College of Sports Medicine recommends screening for osteoporosis in athletes with a history of hypoestrogenism or disordered eating for a cumulative total of 6 months or more, or with a history of stress fracture or fracture from minimal trauma.32
Knowledge of low bone mineral density and fracture risk can often guide treatment and prompt behavioral change. Given that most osteoporosis treatments do not lead to detectable changes in bone density until 18 months to 2 years, it is reasonable to repeat testing at this interval.33
NEW AND OLD TREATMENTS FOR LOW BONE DENSITY IN ANOREXIA NERVOSA
Weight restoration is the cornerstone
Restoration of body weight and nutritional rehabilitation remain the cornerstones of treatment. All patients with anorexia nervosa should be referred to a nutritionist to develop a meal plan that is adjusted for the amount of energy expended. The challenges lie in managing the complications of refeeding and the high relapse rate. The treatment goals in disordered eating are to optimize the overall nutritional status, normalize eating behavior, modify unhealthy thought processes that maintain the disorder, and treat possible emotional issues that help create or maintain the disorder.
The younger the patient, the more the family’s involvement is recommended. In addition to nutritional counseling, the care team should include a psychotherapist, a psychiatrist, and a primary care physician to assist with management and screening of medical complications.
Vitamin D for all
Low vitamin D levels have long been associated with low bone mineral density and risk of hip fracture.34
Vitamin D insufficiency is very common. More than 90% of blacks, Hispanics, and Asians and nearly 75% of whites have insufficient levels of vitamin D (25-hydroxyvitamin D3 level < 30 ng/mL).35 In a study of 307 healthy adolescents, vitamin D insufficiency (a 25-hydroxyvitamin D3 level < 20 ng/mL) was found in 42% and vitamin D deficiency (a level < 15 ng/mL) in 24.1%.36 In addition, this study confirmed an inverse correlation between body mass index and serum 25-hydroxyvitamin D3 concentration.
Therefore, while vitamin D supplementation has not been consistently shown to improve bone loss in anorectic patients,9 given the prevalence of vitamin D deficiency and insufficiency, supplementation is almost universally recommended.
There is no consensus as to the amount of supplementation to recommend for women with anorexia nervosa. The American College of Sports Medicine recommends a total daily intake of 800 IU of vitamin D (ie, from diet and supplements). Therapy should be titrated to doses that result in normocalcemia and a serum 25-hydroxyvitamin D3 concentration of at least 30 ng/mL.37,38
Does hormone treatment improve bone density?
In postmenopausal osteoporosis, estrogen therapy maintains or improves bone density and appears to reduce the rate of vertebral fractures.39,40 Perhaps not so with premenopausal osteoporosis due to anorexia nervosa.
Why should this be? In postmenopausal women, estrogen therapy appears to work by impairing osteoclast-mediated bone resorption, but it has only limited effects on bone formation. In premenopausal anorexia, however, bone loss appears to be due to a unique uncoupling of osteoblastic and osteoclastic functions, resulting in both reduced bone formation and increased bone resorption, which estrogen therapy may not improve.5
Despite the documented association between anorexia nervosa and estrogen deficiency and the strong correlation between osteoporosis and the duration of amenorrhea, most studies have found no improvement in bone mass with hormonal therapy.9 In particular, three randomized, placebo-controlled trials have been published to date, and not one showed a significant improvement in bone mineral density with estrogen therapy compared with placebo in patients with anorexia nervosa.41–43
Klibanski et al,41 in the first of these trials, found no significant difference in spinal bone mineral density between treated patients and controls. However, estrogen-treated patients whose initial body weight was very low (< 70% of expected) had a significant increase in their bone mineral density, whereas those in the control group lost bone density.
Baker et al44 suggest that hormone therapy might protect bone mass in athletes with amenorrhea, citing a study that found that women with a history of stress fractures were less likely to have used oral contraceptives previously than athletes without fractures.45 However, no prospective randomized study to date has established that hormone therapy effectively preserves bone mass in athletes with amenorrhea.
Based on the data presented above, we have little evidence for using estrogen to treat or prevent premenopausal osteoporosis.
The American College of Sports Medicine32 recommends consideration of estrogen therapy if there is evidence of a decline in bone mineral density in an athlete over the age of 16 with persistent functional hypothalamic amenorrhea despite adequate nutritional intake and weight. However, it acknowledges that restoring regular menstrual cycles with oral contraceptive pills will not normalize the metabolic factors that impair bone formation, health, and performance and is not likely to fully reverse low bone mineral density in this population.
What is the effect of exercise on bone health in these patients?
Several studies have examined the effect of weight-bearing exercise on bone density.
Young et al46 compared normal teenagers, ballet dancers, and young women with anorexia nervosa and found that weight-bearing exercise protected against osteoporosis, but only at weight-bearing sites. Athletes in weight-bearing sports had a 5% to 15% higher bone mineral density in weight-bearing sites (ie, the femur) compared with nonathletes, but had lower bone mineral density in the spine.
Therefore, a Z score below −1.0 in an athlete, especially in a distal site, warrants further investigation and treatment.32 In general, exercise does not necessarily protect against osteoporosis in this patient population, and it can sometimes mask underlying bone loss. In addition, keep in mind that many of these patients exercise compulsively, using it as a form of purging.
Insulin-like growth factor-1: More study needed
IGF-1 contributes to bone growth by stimulating osteoblasts, and patients with anorexia nervosa have been shown to have low levels of IGF-1.9
Grinspoon et al10 randomized 60 patients with anorexia nervosa to receive IGF-1 alone, IGF-1 plus an oral contraceptive, an oral contraceptive alone, or placebo. All patients were given calcium and vitamin D and were followed for 9 months. Total bone mass increased significantly in those taking IGF-1 compared with those taking placebo. Those taking an IGF-1 and an oral contraceptive had a significant increase in spinal bone mineral density compared with those on placebo group. At other skeletal sites, however, IGF-1 plus an oral contraceptive and IGF-1 alone failed to produce significant increases in bone mineral density compared with placebo.
Further study is needed to determine the role of IGF-1 in treating low bone mineral density in anorexia nervosa.
Bisphosphonates: Not approved for this indication
In premenopausal women, bisphosphonates are approved by the US Food and Drug Administration (FDA) for use only in those taking glucocorticoids. Although bisphosphonates have been shown to significantly increase bone mineral density in young women with anorexia nervosa,26 they should be used with caution in patients of childbearing age because they are teratogenic. Bisphosphonates have a long half-life and may continue to affect bone turnover for up to 2 years after they are discontinued.47 In addition, they are not recommended in patients with a history of purging via vomiting, due to a risk of esophageal ulceration.
Parathyroid hormone therapy: Studies ongoing
The parathyroid hormone fragment teriparatide (Forteo) is widely used for treating postmenopausal osteoporosis.
Before teriparatide was approved, there was concern that it might increase the risk of osteosarcoma, as almost 45% of rats treated with this drug at the highest-tested dose level developed this aggressive form of bone cancer.48 Balancing the proven benefits of teriparatide shown by clinical trials with the theoretic risk of teriparatide-induced osteosarcoma, the FDA mandated a “black-box” warning about this potential effect.
Studies of parathyroid hormone treatment in anorexia nervosa and other premenopausal patients are ongoing.26
Leptin: More study needed
Leptin is a potent stimulator of bone growth and has been shown to increase bone mineral density in vitro and in vivo.19 However, concerns have been raised about giving supra-physiologic doses of leptin to patients with anorexia nervosa, as this may increase the risk of further weight loss and relapse.
More work is needed to determine the role of leptin for the treatment of osteoporosis in anorexia nervosa.
Ghrelin: Probably not effective as a single agent
Pharmacologic use of ghrelin increases food intake in healthy humans,49 and it has been proposed as a treatment for weight restoration and bone health in anorexia nervosa. Preliminary studies have not shown it to increase appetite or weight gain,50 but it did increase slow-wave sleep.
Based on these studies, it is unlikely that ghrelin will be effective as a single agent to stimulate appetite, but it may be helpful in conjunction with other therapies.
Cannabinoids: Little ongoing research
Cannabinoids have been proposed as a treatment for anorexia nervosa in the hope that they would induce weight gain and in turn prevent osteoporosis.
Interest in their use in anorexia nervosa stems from the discovery of two cannabinoid receptors (CB1 and CB2) located in the brain and peripheral organ systems. Anorexia nervosa has been associated with different alleles of the CB1 gene,51 but the therapeutic implications of this are far from clear.
Cannabinoids appear to regulate eating behavior at several levels within the brain and periphery: the hypothalamus and hindbrain (integrative functions), the limbic system (for hedonic evaluation of foods), the intestinal system, and adipose tissue.52 At each of these levels, the endocannabinoid system interacts with a number of better known peptides involved in appetite regulation, including leptin, ghrelin, and the melanocortins. In mouse studies, genetic leptin deficiency is associated with elevated hypothalamic endocannabinoid levels.
Appetite stimulation by cannabinoids has been studied for several decades, particularly in relation to cachexia and malnutrition associated with cancer. Very few trials have studied cannabinoids for anorexia nervosa.
In a 4-week crossover trial in 11 patients with anorexia nervosa,53 tetrahydrocannabinol (THC) treatment resulted in an increase in sleep disturbances and interpersonal sensitivity, but it had no significant effect on weight gain compared with diazepam treatment.53
Another pilot study of nine outpatients with anorexia nervosa treated with THC showed a significant improvement in depression and perfectionism scores without any significant weight gain.19
Although this research was once promising, the risk was felt to outweigh the benefit, as cannabinoids may induce dependency in this patient group, who may already be at high risk of drug addiction, and very few have continued this line of investigation.
WHAT CAN WE DO FOR NOW?
- Weight restoration and nutritional rehabilitation remain the keys to treatment of low bone density to reduce the risk of osteoporosis in patients with anorexia nervosa. However, as many as one-third of patients with anorexia nervosa relapse during their lifetime, and other treatments are needed to stabilize and prevent bone loss.
- Vitamin D deficiency is clearly associated with a risk of osteoporosis and fracture, and patients with vitamin D deficiency should be treated with supplementation.
- Standard therapies in postmenopausal patients (such as bisphosphonates and teriparatide) should be used with caution in premenopausal anorexia nervosa patients because of potential long-term health risks.
- As we learn more about hormonal factors in anorexia nervosa, we hope to identify interventions that will help restore weight and decrease the risk of osteoporosis. A summary of potential treatment strategies and targets for prevention of osteoporosis in anorexia nervosa is presented in Table 2.
Acknowledgment: The author thanks the General Internal Medicine Works in Progress Group for its editorial comments, and Dr. Ellen Rome for her mentorship and support.
- Baker D, Roberts R, Towell T. Factors predictive of bone mineral density in eating-disordered women: a longitudinal study. Int J Eat Disord 2000; 27:29–35.
- Rome ES. Eating disorders. Obstet Gynecol Clin North Am 2003; 30:353–377.
- First MB, editor. Diagnostic and Statistical Manual of Mental Disorders—4th edition. Washington, DC: American Psychiatric Association, 2000.
- Mehler PS, MacKenzie TD. Treatment of osteopenia and osteoporosis in anorexia nervosa: a systematic review of the literature. Int J Eat Disord 2009; 42:195–201.
- Wong JC, Lewindon P, Mortimer R, Shepherd R. Bone mineral density in adolescent females with recently diagnosed anorexia nervosa. Int J Eat Disord 2001; 29:11–16.
- Rome ES, Ammerman S. Medical complications of eating disorders: an update. J Adolesc Health 2003; 33:418–426.
- Recker RR, Davies KM, Hinders SM, Heaney RP, Stegman MR, Kimmel DB. Bone gain in young adult women. JAMA 1992; 268:2403–2408.
- Sterling WM, Golden NH, Jacobson MS, Ornstein RM, Hertz SM. Metabolic assessment of menstruating and nonmenstruating normal weight adolescents. Int J Eat Disord 2009; 42:658–663.
- Legroux-Gerot I, Vignau J, Collier F, Cortet B. Bone loss associated with anorexia nervosa. Joint Bone Spine 2005; 72:489–495.
- Grinspoon S, Thomas L, Miller K, Herzog D, Klibanski A. Effects of recombinant human IGF-I and oral contraceptive administration on bone density in anorexia nervosa. J Clin Endocrinol Metab 2002; 87:2883–2891.
- Soyka LA, Grinspoon S, Levitsky LL, Herzog DB, Klibanski A. The effects of anorexia nervosa on bone metabolism in female adolescents. J Clin Endocrinol Metab 1999; 84:4489–4496.
- Miller KK, Lawson EA, Mathur V, et al. Androgens in women with anorexia nervosa and normal-weight women with hypothalamic amenorrhea. J Clin Endocrinol Metab 2007; 92:1334–1339.
- Misra M, Katzman DK, Cord J, et al. Bone metabolism in adolescent boys with anorexia nervosa. J Clin Endocrinol Metab 2008; 93:3029–3036.
- Misra M, Miller KK, Almazan C, et al. Alterations in cortisol secretory dynamics in adolescent girls with anorexia nervosa and effects on bone metabolism. J Clin Endocrinol Metab 2004; 89:4972–4980.
- Chiodini I, Mascia ML, Muscarella S, et al. Subclinical hypercortisolism among outpatients referred for osteoporosis. Ann Intern Med 2007; 147:541–548.
- Misra M, Soyka LA, Miller KK, et al. Serum osteoprotegerin in adolescent girls with anorexia nervosa. J Clin Endocrinol Metab 2003; 88:3816–3822.
- Ohwada R, Hotta M, Sato K, Shibasaki T, Takano K. The relationship between serum levels of estradiol and osteoprotegerin in patients with anorexia nervosa. Endocr J 2007; 54:953–959.
- Müller TD, Föcker M, Holtkamp K, Herpertz-Dahlmann B, Hebebrand J. Leptin-mediated neuroendocrine alterations in anorexia nervosa: somatic and behavioral implications. Child Adolesc Psychiatr Clin N Am 2009; 18:117–129.
- Støving RK, Andries A, Brixen K, Flyvbjerg A, Hørder K, Frystyk J. Leptin, ghrelin, and endocannabinoids: potential therapeutic targets in anorexia nervosa. J Psychiatr Res 2009; 43:671–679.
- Audi L, Mantzoros CS, Vidal-Puig A, Vargas D, Gussinye M, Carrascosa A. Leptin in relation to resumption of menses in women with anorexia nervosa. Mol Psychiatry 1998; 3:544–547.
- Wong IP, Baldock PA, Herzog H. Gastrointestinal peptides and bone health. Curr Opin Endocrinol Diabetes Obes 2010; 17:44–50.
- Fukushima N, Hanada R, Teranishi H, et al. Ghrelin directly regulates bone formation. J Bone Miner Res 2005; 20:790–798.
- Makovey J, Naganathan V, Seibel M, Sambrook P. Gender differences in plasma ghrelin and its relations to body composition and bone—an opposite-sex twin study. Clin Endocrinol (Oxf) 2007; 66:530–537.
- Hassouna R, Zizzari P, Tolle V. The ghrelin/obestatin balance in the physiological and pathological control of growth hormone secretion, body composition and food intake. J Neuroendocrinol 2010; 22:793–804.
- Germain N, Galusca B, Grouselle D, et al. Ghrelin/obestatin ratio in two populations with low body weight: constitutional thinness and anorexia nervosa. Psychoneuroendocrinology 2009; 34:413–419.
- Cohen A, Shane E. Treatment of premenopausal women with low bone mineral density. Curr Osteoporos Rep 2008; 6:39–46.
- Licata A. Bone density vs bone quality: what’s a clinician to do? Cleve Clin J Med 2009; 76:331–336.
- Bianchi ML, Baim S, Bishop NJ, et al. Official positions of the International Society for Clinical Densitometry (ISCD) on DXA evaluation in children and adolescents. Pediatr Nephrol 2010; 25:37–47.
- Mendelsohn FA, Warren MP. Anorexia, bulimia, and the female athlete triad: evaluation and management. Endocrinol Metab Clin North Am 2010; 39:155–167.
- Mehler PS, Krantz M. Anorexia nervosa medical issues. J Womens Health (Larchmt) 2003; 12:331–340.
- Watts NB, Lewiecki EM, Miller PD, Baim S. National Osteoporosis Foundation 2008 Clinician’s Guide to Prevention and Treatment of Osteoporosis and the World Health Organization Fracture Risk Assessment Tool (FRAX): what they mean to the bone densitometrist and bone technologist. J Clin Densitom 2008; 11:473–477.
- Nattiv A, Loucks AB, Manore MM, Sanborn CF, Sundgot-Borgen J, Warren MP; American College of Sports Medicine. American College of Sports Medicine position stand. The female athlete triad. Med Sci Sports Exerc 2007; 39:1867–1882.
- Cummings SR, Palermo L, Browner W, et al. Monitoring osteoporosis therapy with bone densitometry: misleading changes and regression to the mean. Fracture Intervention Trial Research Group. JAMA 2000; 283:1318–1321.
- LeBoff MS, Kohlmeier L, Hurwitz S, Franklin J, Wright J, Glowacki J. Occult vitamin D deficiency in postmenopausal US women with acute hip fracture. JAMA 1999; 281:1505–1511.
- Adams JS, Hewison M. Update in vitamin D. J Clin Endocrinol Metab 2010; 95:471–478.
- Gordon CM, DePeter KC, Feldman HA, Grace E, Emans SJ. Prevalence of vitamin D deficiency among healthy adolescents. Arch Pediatr Adolesc Med 2004; 158:531–537.
- Hofbauer LC, Hamann C, Ebeling PR. Approach to the patient with secondary osteoporosis. Eur J Endocrinol 2010; 162:1009–1020.
- Stoffman N, Gordon CM. Vitamin D and adolescents: what do we know? Curr Opin Pediatr 2009; 21:465–471.
- Bone HG, Greenspan SL, McKeever C, et al. Alendronate and estrogen effects in postmenopausal women with low bone mineral density. Alendronate/Estrogen Study Group. J Clin Endocrinol Metab 2000; 85:720–726.
- Barrett-Connor E, Wenger NK, Grady D, et al. Hormone and nonhormone therapy for the maintenance of postmenopausal health: the need for randomized controlled trials of estrogen and raloxifene. J Womens Health 1998; 7:839–847.
- Klibanski A, Biller BM, Schoenfeld DA, Herzog DB, Saxe VC. The effects of estrogen administration on trabecular bone loss in young women with anorexia nervosa. J Clin Endocrinol Metab 1995; 80:898–904.
- Stokosch GR, Friedman AJ, Wu SC, Kamin M. Effects of an oral contraceptive (norgestimate/ethinyl estradiol) on bone mineral density in adolescent females with anorexia nervosa: double-blind, placebo-controlled study. J Adolesc Health 2006; 39:819–827.
- Golden NH, Lanzkowsky L, Schebendach J, Palestro CJ, Jacobson MS, Shenker IR. The effect of estrogen-progestin treatment on bone mineral density in anorexia nervosa. J Pediatr Adolesc Gynecol 2002; 15:135–143.
- Robinson E, Bachrach LK, Katzman DK. Use of hormone replacement therapy to reduce the risk of osteopenia in adolescent girls with anorexia nervosa. J Adolesc Health 2000; 26:343–348.
- Myburgh KH, Hutchins J, Fataar AB, et al. Low bone density is an etiologic factor for stress fractures in athletes. Ann Intern Med 1990; 113:754–759.
- Young N, Formica C, Szmukler G, Seeman E. Bone density at weight-bearing and nonweight-bearing sites in ballet dancers: the effects of exercise, hypogonadism, and body weight. J Clin Endocrinol Metab 1994; 78:449–454.
- Stock JL, Bell NH, Chesnut CH, et al. Increments in bone mineral density of the lumbar spine and hip and suppression of bone turnover are maintained after discontinuation of alendronate in postmenopausal women. Am J Med 1997; 103:291–297.
- Subbiah V, Madsen VS, Raymond AK, Benjamin RS, Ludwig JA. Of mice and men: divergent risks of teriparatide-induced osteosarcoma. Osteoporos Int 2010; 21:1041–1045.
- Wren AM, Seal LJ, Cohen MA, et al. Ghrelin enhances appetite and increases food intake in humans. J Clin Endocrinol Metab 2001; 86:5992.
- Miljic D, Pekic S, Djurovic M, et al. Ghrelin has partial or no effect on appetite, growth hormone, prolactin, and cortisol release in patients with anorexia nervosa. J Clin Endocrinol Metab 2006; 914:1491–1495.
- Siegfried Z, Kanyas K, Latzer Y, et al. Association study of cannabinoid receptor gene (CNR1) alleles and anorexia nervosa: differences between restricting and binging/purging subtypes. Am J Med Genet B Neuropsychiatr Genet 2004; 125B:126–130.
- Cota D, Marsicano G, Lutz B, et al. Endogenous cannabinoid system as a modulator of food intake. Int J Obes Relat Metab Disord 2003; 27:289–301.
- Gross H, Ebert MH, Faden VB, et al. A double-blind trial of delta 9-tetrahydrocannabinol in primary anorexia nervosa. J Clin Psychopharmacol 1983; 3:165–171.
- Baker D, Roberts R, Towell T. Factors predictive of bone mineral density in eating-disordered women: a longitudinal study. Int J Eat Disord 2000; 27:29–35.
- Rome ES. Eating disorders. Obstet Gynecol Clin North Am 2003; 30:353–377.
- First MB, editor. Diagnostic and Statistical Manual of Mental Disorders—4th edition. Washington, DC: American Psychiatric Association, 2000.
- Mehler PS, MacKenzie TD. Treatment of osteopenia and osteoporosis in anorexia nervosa: a systematic review of the literature. Int J Eat Disord 2009; 42:195–201.
- Wong JC, Lewindon P, Mortimer R, Shepherd R. Bone mineral density in adolescent females with recently diagnosed anorexia nervosa. Int J Eat Disord 2001; 29:11–16.
- Rome ES, Ammerman S. Medical complications of eating disorders: an update. J Adolesc Health 2003; 33:418–426.
- Recker RR, Davies KM, Hinders SM, Heaney RP, Stegman MR, Kimmel DB. Bone gain in young adult women. JAMA 1992; 268:2403–2408.
- Sterling WM, Golden NH, Jacobson MS, Ornstein RM, Hertz SM. Metabolic assessment of menstruating and nonmenstruating normal weight adolescents. Int J Eat Disord 2009; 42:658–663.
- Legroux-Gerot I, Vignau J, Collier F, Cortet B. Bone loss associated with anorexia nervosa. Joint Bone Spine 2005; 72:489–495.
- Grinspoon S, Thomas L, Miller K, Herzog D, Klibanski A. Effects of recombinant human IGF-I and oral contraceptive administration on bone density in anorexia nervosa. J Clin Endocrinol Metab 2002; 87:2883–2891.
- Soyka LA, Grinspoon S, Levitsky LL, Herzog DB, Klibanski A. The effects of anorexia nervosa on bone metabolism in female adolescents. J Clin Endocrinol Metab 1999; 84:4489–4496.
- Miller KK, Lawson EA, Mathur V, et al. Androgens in women with anorexia nervosa and normal-weight women with hypothalamic amenorrhea. J Clin Endocrinol Metab 2007; 92:1334–1339.
- Misra M, Katzman DK, Cord J, et al. Bone metabolism in adolescent boys with anorexia nervosa. J Clin Endocrinol Metab 2008; 93:3029–3036.
- Misra M, Miller KK, Almazan C, et al. Alterations in cortisol secretory dynamics in adolescent girls with anorexia nervosa and effects on bone metabolism. J Clin Endocrinol Metab 2004; 89:4972–4980.
- Chiodini I, Mascia ML, Muscarella S, et al. Subclinical hypercortisolism among outpatients referred for osteoporosis. Ann Intern Med 2007; 147:541–548.
- Misra M, Soyka LA, Miller KK, et al. Serum osteoprotegerin in adolescent girls with anorexia nervosa. J Clin Endocrinol Metab 2003; 88:3816–3822.
- Ohwada R, Hotta M, Sato K, Shibasaki T, Takano K. The relationship between serum levels of estradiol and osteoprotegerin in patients with anorexia nervosa. Endocr J 2007; 54:953–959.
- Müller TD, Föcker M, Holtkamp K, Herpertz-Dahlmann B, Hebebrand J. Leptin-mediated neuroendocrine alterations in anorexia nervosa: somatic and behavioral implications. Child Adolesc Psychiatr Clin N Am 2009; 18:117–129.
- Støving RK, Andries A, Brixen K, Flyvbjerg A, Hørder K, Frystyk J. Leptin, ghrelin, and endocannabinoids: potential therapeutic targets in anorexia nervosa. J Psychiatr Res 2009; 43:671–679.
- Audi L, Mantzoros CS, Vidal-Puig A, Vargas D, Gussinye M, Carrascosa A. Leptin in relation to resumption of menses in women with anorexia nervosa. Mol Psychiatry 1998; 3:544–547.
- Wong IP, Baldock PA, Herzog H. Gastrointestinal peptides and bone health. Curr Opin Endocrinol Diabetes Obes 2010; 17:44–50.
- Fukushima N, Hanada R, Teranishi H, et al. Ghrelin directly regulates bone formation. J Bone Miner Res 2005; 20:790–798.
- Makovey J, Naganathan V, Seibel M, Sambrook P. Gender differences in plasma ghrelin and its relations to body composition and bone—an opposite-sex twin study. Clin Endocrinol (Oxf) 2007; 66:530–537.
- Hassouna R, Zizzari P, Tolle V. The ghrelin/obestatin balance in the physiological and pathological control of growth hormone secretion, body composition and food intake. J Neuroendocrinol 2010; 22:793–804.
- Germain N, Galusca B, Grouselle D, et al. Ghrelin/obestatin ratio in two populations with low body weight: constitutional thinness and anorexia nervosa. Psychoneuroendocrinology 2009; 34:413–419.
- Cohen A, Shane E. Treatment of premenopausal women with low bone mineral density. Curr Osteoporos Rep 2008; 6:39–46.
- Licata A. Bone density vs bone quality: what’s a clinician to do? Cleve Clin J Med 2009; 76:331–336.
- Bianchi ML, Baim S, Bishop NJ, et al. Official positions of the International Society for Clinical Densitometry (ISCD) on DXA evaluation in children and adolescents. Pediatr Nephrol 2010; 25:37–47.
- Mendelsohn FA, Warren MP. Anorexia, bulimia, and the female athlete triad: evaluation and management. Endocrinol Metab Clin North Am 2010; 39:155–167.
- Mehler PS, Krantz M. Anorexia nervosa medical issues. J Womens Health (Larchmt) 2003; 12:331–340.
- Watts NB, Lewiecki EM, Miller PD, Baim S. National Osteoporosis Foundation 2008 Clinician’s Guide to Prevention and Treatment of Osteoporosis and the World Health Organization Fracture Risk Assessment Tool (FRAX): what they mean to the bone densitometrist and bone technologist. J Clin Densitom 2008; 11:473–477.
- Nattiv A, Loucks AB, Manore MM, Sanborn CF, Sundgot-Borgen J, Warren MP; American College of Sports Medicine. American College of Sports Medicine position stand. The female athlete triad. Med Sci Sports Exerc 2007; 39:1867–1882.
- Cummings SR, Palermo L, Browner W, et al. Monitoring osteoporosis therapy with bone densitometry: misleading changes and regression to the mean. Fracture Intervention Trial Research Group. JAMA 2000; 283:1318–1321.
- LeBoff MS, Kohlmeier L, Hurwitz S, Franklin J, Wright J, Glowacki J. Occult vitamin D deficiency in postmenopausal US women with acute hip fracture. JAMA 1999; 281:1505–1511.
- Adams JS, Hewison M. Update in vitamin D. J Clin Endocrinol Metab 2010; 95:471–478.
- Gordon CM, DePeter KC, Feldman HA, Grace E, Emans SJ. Prevalence of vitamin D deficiency among healthy adolescents. Arch Pediatr Adolesc Med 2004; 158:531–537.
- Hofbauer LC, Hamann C, Ebeling PR. Approach to the patient with secondary osteoporosis. Eur J Endocrinol 2010; 162:1009–1020.
- Stoffman N, Gordon CM. Vitamin D and adolescents: what do we know? Curr Opin Pediatr 2009; 21:465–471.
- Bone HG, Greenspan SL, McKeever C, et al. Alendronate and estrogen effects in postmenopausal women with low bone mineral density. Alendronate/Estrogen Study Group. J Clin Endocrinol Metab 2000; 85:720–726.
- Barrett-Connor E, Wenger NK, Grady D, et al. Hormone and nonhormone therapy for the maintenance of postmenopausal health: the need for randomized controlled trials of estrogen and raloxifene. J Womens Health 1998; 7:839–847.
- Klibanski A, Biller BM, Schoenfeld DA, Herzog DB, Saxe VC. The effects of estrogen administration on trabecular bone loss in young women with anorexia nervosa. J Clin Endocrinol Metab 1995; 80:898–904.
- Stokosch GR, Friedman AJ, Wu SC, Kamin M. Effects of an oral contraceptive (norgestimate/ethinyl estradiol) on bone mineral density in adolescent females with anorexia nervosa: double-blind, placebo-controlled study. J Adolesc Health 2006; 39:819–827.
- Golden NH, Lanzkowsky L, Schebendach J, Palestro CJ, Jacobson MS, Shenker IR. The effect of estrogen-progestin treatment on bone mineral density in anorexia nervosa. J Pediatr Adolesc Gynecol 2002; 15:135–143.
- Robinson E, Bachrach LK, Katzman DK. Use of hormone replacement therapy to reduce the risk of osteopenia in adolescent girls with anorexia nervosa. J Adolesc Health 2000; 26:343–348.
- Myburgh KH, Hutchins J, Fataar AB, et al. Low bone density is an etiologic factor for stress fractures in athletes. Ann Intern Med 1990; 113:754–759.
- Young N, Formica C, Szmukler G, Seeman E. Bone density at weight-bearing and nonweight-bearing sites in ballet dancers: the effects of exercise, hypogonadism, and body weight. J Clin Endocrinol Metab 1994; 78:449–454.
- Stock JL, Bell NH, Chesnut CH, et al. Increments in bone mineral density of the lumbar spine and hip and suppression of bone turnover are maintained after discontinuation of alendronate in postmenopausal women. Am J Med 1997; 103:291–297.
- Subbiah V, Madsen VS, Raymond AK, Benjamin RS, Ludwig JA. Of mice and men: divergent risks of teriparatide-induced osteosarcoma. Osteoporos Int 2010; 21:1041–1045.
- Wren AM, Seal LJ, Cohen MA, et al. Ghrelin enhances appetite and increases food intake in humans. J Clin Endocrinol Metab 2001; 86:5992.
- Miljic D, Pekic S, Djurovic M, et al. Ghrelin has partial or no effect on appetite, growth hormone, prolactin, and cortisol release in patients with anorexia nervosa. J Clin Endocrinol Metab 2006; 914:1491–1495.
- Siegfried Z, Kanyas K, Latzer Y, et al. Association study of cannabinoid receptor gene (CNR1) alleles and anorexia nervosa: differences between restricting and binging/purging subtypes. Am J Med Genet B Neuropsychiatr Genet 2004; 125B:126–130.
- Cota D, Marsicano G, Lutz B, et al. Endogenous cannabinoid system as a modulator of food intake. Int J Obes Relat Metab Disord 2003; 27:289–301.
- Gross H, Ebert MH, Faden VB, et al. A double-blind trial of delta 9-tetrahydrocannabinol in primary anorexia nervosa. J Clin Psychopharmacol 1983; 3:165–171.
KEY POINTS
- Women gain 40% to 60% of their bone mass during adolescence, a time coinciding with the peak incidence of anorexia nervosa, and they attain their peak bone mass by the time they are in their 20s.
- The etiology of osteoporosis in anorexia nervosa is complex and multifaceted. Early detection and treatment are critical.
- Osteoporosis in premenopausal patients is defined as low bone mineral density (a Z score below −2.0) in combination with risk factors such as chronic malnutrition, eating disorders, hypogonadism, glucocorticoid exposure, and previous fractures.
- Restoring body weight is the key treatment. Vitamin D should be supplemented if low. Estrogen therapy has not been shown to be effective, and exercise may be counterproductive. Bisphosphonates and teriparatide should be used with caution, if at all.
Symptom management: An important part of cancer care
Cancer patients experience many distressing symptoms during the course of their illness. In addition to pain, they commonly suffer from fatigue, anorexia, constipation, dyspnea, nausea, and vomiting.1
Although it is important to diagnose and manage the cancer itself, it is also the physician’s duty to recognize and effectively treat associated symptoms, regardless of the outcome of the underlying disease.
Some of the symptoms are due to the underlying disease, but some are iatrogenic, as many medical interventions have predictable adverse effects, such as nausea and vomiting with chemotherapy or constipation with opioids.
Symptoms of advanced cancer become chronic, and patients usually rate them as moderate or severe.1 Unrelieved suffering causes demoralization and may quickly impair quality of life.2
Understanding the principles of symptom management may help optimize palliation and improve quality of life. In this paper, we outline an approach to the management of cancer-related symptoms.
A HEAVY BURDEN OF SYMPTOMS
In patients with advanced cancer, the prevalence rates of various symptoms are approximately as follows1,3:
- Pain 89%
- Fatigue 69%
- Weakness 66%
- Anorexia 66%
- Lack of energy 61%
- Nausea 60%
- Dry mouth 57%
- Constipation 52%
- Early satiety 51%
- Dyspnea 50%
- Vomiting 30%.
Furthermore, patients with advanced cancer typically have multiple concurrent symptoms. In a survey of patients in a palliative medicine service at our hospital,4 we found that the median number of symptoms per patient was 10 (range 0–25) (Figure 1).
PRINCIPLES OF SYMPTOM MANAGEMENT
Show an interest in the patient’s symptoms. Many patients with advanced cancer believe that suffering is an inevitable part of the disease or of its treatment.
Ask patients about their symptoms in a positive and detailed fashion, starting with open-ended questions and following up with specific questions. Patients may underreport their symptoms or may not mention them if not asked directly. In the survey of palliative care patients at our hospital mentioned above,4 the median number of volunteered symptoms was only 1 (range 0–6), whereas a median of 10 were found by systematic assessment.
The examiner should clarify when necessary and recognize that a layperson’s language may not directly translate to medical language. For example, a patient may not understand the term “anorexia.” Furthermore, “loss of appetite” may mean nausea, vomiting, constipation, or early satiety. “Numbness” may mean a loss of sensation or a pins-and-needles sensation. Symptoms should also be quantified using a consistent measure (ie, numerical or categorical) to facilitate monitoring.
Prioritize the symptoms. Advanced cancer is accompanied by multiple symptoms. Assess which ones are most bothersome, and where therapy should be directed first.
Try to understand the pathophysiology behind the symptom. When possible, choose a drug treatment that targets the likely underlying cause. Nausea and vomiting, for example, can be secondary to gastric outlet obstruction, hypercalcemia, increased intracranial pressure, esophagitis, opioid use, or constipation.
Be specific about the drug, dosing, timing, and route, and keep it simple. If a regimen is cumbersome, compliance suffers. It is better to start one medication for the most bothersome symptom or symptoms and make some progress than it is to overwhelm the patient with a complex list of drugs. Sustained-release formulations are often useful. It is unrealistic to expect most patients to take a medication every 4 hours around the clock. Try the most cost-effective remedies first, and attempt to use one drug that may address multiple symptoms. For example, dexamethasone may have positive effects on energy, pain, and appetite.
Use ‘rescue dosing.’ Rescue drugs are important for expected symptom exacerbations in those on sustained medication. This approach increases efficacy and minimizes adverse effects. In most cases, the rescue medication should be the same as the regularly scheduled one. For example, a prescription to treat nausea may read “metoclopramide (Reglan) 10 mg by mouth before meals and at bedtime and every 4 hours as needed to treat nausea or vomiting.”
Consider the patient’s age and fragility, the cost of the drug, and anticipated adverse effects. Oral or transdermal preparations are preferable to parenteral ones with regard to convenience and compliance, although many transdermal preparations are costly. If parenteral dosing is necessary, the subcutaneous route is an alternative to the intravenous route.
Discontinue drugs that are ineffective or unnecessary. This may help compliance and diminish adverse effects.
Make one change at a time so the response to that change is clear. Titrate one drug to its effective dose, to its maximum dose, or to a level of intolerability before considering another. If one drug of a class is ineffective, another drug in the same class may work.
Reassess often. A follow-up phone call or office visit in 1 to 2 weeks is appropriate. The symptoms of advanced cancer are often progressive, so regular evaluation is important, even if symptoms are controlled on stable drug regimens. Instructions should be both verbal and written and should be communicated to patients and any involved caregiver to ensure compliance. Have a “plan B” if the first plan is ineffective.
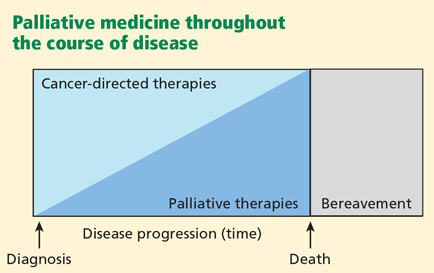
A challenging and important part of symptom management is to assess the goals of care. Every intervention is not appropriate for every patient. Which therapies are used depends on the stage of the disease, the available disease-modifying treatments, and the patient’s condition and preferences. Patients and their loved ones should be engaged in discussions about goals of care early in the disease and should be included in medical decision-making. Both curative treatment and palliative treatment are important, but palliation plays a bigger role towards the later stages of advanced cancer (Figure 2).
CANCER-RELATED FATIGUE: COMMON BUT NOT INEVITABLE
Most cancer patients report fatigue. Although it is one of the most common symptoms in advanced cancer,5 it is not necessarily inevitable or untreatable.6
Cancer-related fatigue is multidimensional and develops over time, diminishing energy, mental capacity, and psychological condition.7 Patients may report feeling tired or being unable to complete their activities of daily living. People who were previously very active may be frustrated by their inability to participate in favorite leisure activities, which has a big impact on quality of life. Fatigue can be physical, emotional, or mental. It is important to distinguish physical weakness from dyspnea on exertion, which is commonly reported as fatigue. Depression may also cause or exacerbate fatigue.
Unlike fatigue in the general population, cancer-related fatigue does not improve with rest, and patients often report large amounts of unrestorative sleep.
Look for reversible causes of fatigue
First, conduct a thorough assessment to identify any reversible causes, such as:
- Anemia
- Insomnia, sleep disturbance
- Malnutrition
- Pain
- Depression
- Medical comorbidities: renal, cardiac, or pulmonary disease
- Hypothyroidism
- Hypogonadism.
In many cases, however, a reversible cause cannot be found.
Treating cancer-related fatigue
Nonpharmacologic interventions have been evaluated for this application, but evidence of efficacy is limited and mixed. The National Cancer Comprehensive Network guidelines8 suggest that energy conservation and education about cancer-related fatigue are central to management. Patients should be advised that fatigue has a fluctuating course and that they have a limited pool of energy, which they should conserve and use judiciously.
In a meta-analysis by Schmitz et al,9 physical activity interventions were found to be beneficial. Sixty-three percent of those studied were undergoing active treatment, so whether this population reflects advanced cancer is unclear. A small pilot study in advanced cancer found a trend toward benefit with exercise.10
Comment. The strategies of rest and exercise are complementary. The key point is to plan them per personal preference.
Psychostimulants include methylphenidate (Ritalin). A randomized placebo-controlled trial in patients with acquired immunodeficiency syndrome (AIDS) found methylphenidate 15 to 60 mg/day to have a positive effect.11 Prospective studies have shown similar results in cancer patients,12 and a Cochrane review in 2008 showed a small but significant benefit in cancer-related fatigue.13
Methylphenidate is usually started at a dose of 5 mg given at 8:00 am and at noon, and then titrated. Benefit, when experienced, is typically noted within 24 to 48 hours. Possible adverse effects include anorexia, insomnia, anxiety, confusion, tremor, and tachycardia.
Stimulants should be used with caution in patients with cardiac disease or delirium.
Modafinil (Provigil), a nonstimulant agent, has been less studied, but it may also help.14,15 The usual dosage is 50 to 200 mg daily.
Corticosteroids may have a role in advanced cancer, as suggested by anecdotal reports.16 They should be used judiciously, as their adverse effects (insomnia, muscle wasting, edema) are themselves burdensome and may outweigh their benefits.
ANOREXIA CAN BE DISTRESSING TO THE FAMILY AND THE PATIENT
Most patients with advanced cancer experience anorexia, which is a marker of poor prognosis.1
Appetite loss may occur in isolation or as a part of the anorexia-cachexia syndrome. This syndrome is a wasting state seen in chronic, advanced diseases including cancer, AIDS, chronic obstructive pulmonary disease, chronic renal insufficiency, and congestive heart failure.17 The associated weight loss is involuntary and includes both muscle and fat.
Appetite loss alone is usually not bothersome. In fact, anorexia frequently causes more distress to the family than to the patient.18 The ramifications of decreased appetite, on the other hand, can be devastating. Decreased caloric intake coupled with the hypermetabolic state of malignancy leads to rapid, dramatic changes in body habitus. This outward sign of the ravages of cancer can be psychologically damaging to patients and their loved ones as they contemplate advanced disease and limited life expectancy. They may be concerned about starvation, in which case education about and attempts to normalize the anorexia-cachexia syndrome are essential.
Look for reversible causes of anorexia
The first step in the management of anorexia is to identify any reversible causes, such as:
- Stomatitis
- Constipation
- Uncontrolled severe symptoms such as pain or dyspnea
- Delirium
- Nausea, vomiting
- Depression
- Gastroparesis.
Managing cancer-related anorexia
Nonpharmacologic measures include nutritional counseling and increased physical activity. Patients may be counseled to eat calorie-dense foods and supplemental high-calorie, high-protein, high-fat drinks. Some may be able to take advantage of a diurnal variation in appetite, usually an increased appetite in the morning.
Megestrol acetate (Megace) improved appetite and induced weight gain when used in a dosage of 800 mg daily in a randomized controlled trial in AIDS patients.19 Case studies have shown doses as low as 80 to 160 mg daily to be beneficial.20 Most of the added weight is fat, not lean muscle mass. Unfortunately, the addition of testosterone to megestrol did not increase the accumulation of lean muscle mass in another randomized trial.21 But the addition of olanzapine (Zyprexa) to megestrol was associated with improved appetite and weight gain in a significant percentage of advanced cancer patients.22 Rates of adverse effects with megestrol are low; the most significant adverse effect is thromboembolism.
Corticosteroids. While much of the support for corticosteroids is anecdotal, a prospective study of dexamethasone 4 to 16 mg daily showed improvement in several symptoms, including appetite.23 Because of the multiple adverse effects of corticosteroids, careful attention to dose, duration, and tolerability is essential. Corticosteroids should be discontinued if the desired positive effects are not observed within 3 to 5 days. If prolonged survival is expected, wean to the lowest effective dose.
Cannabinoids. Dronabinol (Marinol), a synthetic formulation of delta-9-tetrahydrocannabinol (THC), the active agent of marijuana, has been beneficial in AIDS anorexia. Fewer studies have been done in advanced cancer.
In a small, open-label case series, doses of 7.5 to 15 mg of dronabinol daily improved appetite and were well tolerated.24 On the other hand, in a multicenter, randomized, double-blind, placebo-controlled trial, neither cannabis extract nor THC (5 mg daily) significantly improved appetite over a 6-week period.25
A large randomized study found megestrol acetate 800 mg to be superior to dronabinol 5 mg daily for treating anorexia.26
Neurotoxicity, anxiety, nervousness, dizziness, euphoria, and somnolence from dronabinol can be severe and intolerable for some.
Enteral tube feeding and parenteral nutrition do not improve survival or comfort in terminally ill patients.27 On the contrary, they are associated with complications, including aspiration pneumonia, sepsis, abdominal pain, vomiting, and diarrhea. Nevertheless, in some patients with mechanical impediments to nutrition (eg, esophageal fistula, obstruction, or proximal small bowel obstruction) or in those who are hungry and unable to take food by mouth, tube feeding may be appropriate.
CONSTIPATION SHOULD BE ANTICIPATED, AND PREVENTED IF POSSIBLE
Constipation is variably defined by patients and health care professionals, but it usually includes components of the Rome II criteria, ie, two or more of the following symptoms28:
- Straining at least 25% of the time
- Hard stools at least 25% of the time
- Incomplete evacuation at least 25% of the time
- Two or fewer bowel movements per week.
These criteria were intended to describe functional constipation in a healthy population.27
More than 50% of patients with advanced cancer report constipation,1 and in those on opioids, the scope of the problem is larger. In addition to binding central nervous system receptors to mediate pain perception, opioids bind systemic receptors including those in the gut. As a result, opioids interfere with smooth muscle tone and contractility, lengthen transit time, promote dry stools, and increase anal sphincter tone.29 A nursing study found that when patients taking opioids were screened for constipation, 95% identified it as the major adverse effect of their pain regimen.30
Multiple causes of constipation
Factors that can cause or contribute to constipation include:
- Dietary factors such as a generally low intake of food, and specifically of fiber
- Inactivity
- Confusion
- Dehydration
- Intestinal obstruction
- Cormorbidities such as diabetes mellitus, hypothyroidism, hypercalcemia
- Uncomfortable toilet arrangements
- Drugs such as opioids (as noted above), anticholinergics, antihypertensives, antacids, diuretics, and iron supplements.
Take a proactive approach to constipation
Constipation is expected in a number of clinical scenarios, such as with the use of opioids or with limited mobility. Patients often attribute constipation to diminished oral intake. But despite low oral intake, regular, smaller-caliber bowel movements are important to ensure that sloughed bowel endothelium and bacteria are eliminated.
Although little evidence supports the use of one standard bowel regimen, prevention is essential. The goal is a soft bowel movement every 1 to 2 days. Constipation prophylaxis should be started at the initiation of any regular opioid regimen. Encouraging physical activity and oral fluid intake and creating a favorable environment for elimination may also help manage constipation.
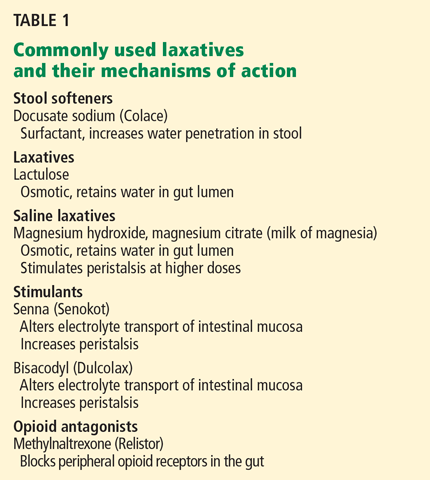
In our practice, we use a softening agent such as docusate sodium (Colace) 100 mg twice daily, and add a laxative agent such as senna (Senokot) or a magnesium-based osmotic agent as needed. Bulking agents such as over-the-counter fiber supplements should be used with caution in opioid-related constipation. If there has been no bowel movement for 48 hours, a rectal suppository or enema is used. Suppositories or enemas can be scheduled regularly for bedbound patients with chronic constipation.
Methylnaltrexone (Relistor), a mu-opioid antagonist, is a new agent that blocks peripheral opioid receptors in the gut. In a randomized study of 133 patients, methylnaltrexone produced laxation within 4 hours of administration in 48%.31 This methylated, charged compound does not significantly cross the blood-brain barrier and therefore does not interfere with analgesia or cause opioid withdrawal. The dose is 8 mg or 12 mg subcutaneously (based on weight), which can be repeated in 48 hours. If laxation does not occur after one to three doses, other causes of constipation should be explored.
Methylnaltrexone is contraindicated in patients with bowel obstruction, even if the obstruction is thought to be secondary to opioids. Adverse effects include abdominal pain, flatulence, and nausea.
NAUSEA AND VOMITING: NOT ALWAYS DUE TO CHEMOTHERAPY
Nausea (the sensation of the need to vomit) and vomiting (the forceful expulsion of gastric contents) are common symptoms in advanced cancer and are not necessarily related to chemotherapy or radiation therapy. About 60% of cancer patients have nausea, and about 30% vomit.32 Both symptoms are very distressing and diminish quality of life.
Look for potentially reversible causes of nausea and vomiting
Identifying the cause, which is sometimes reversible, may help direct treatment. Potentially reversible causes include:
- Drugs
- Uremia
- Infection
- Anxiety
- Constipation
- Gastric irritation
- Proximal gastrointestinal obstruction.
In a prospective study of 121 patients with advanced cancer, the most common causes of nausea and vomiting were impaired gastric emptying, chemical and metabolic factors (drugs, organ failure, electrolyte disturbance, infection), and bowel obstruction.33–35
Management of nausea and vomiting
Management of nausea and vomiting may require multiple antiemetics, which may need to be given intravenously or subcutaneously.33
The choice of drugs depends on the cause of the nausea
The evidence-based choice of drugs for nausea depends on the cause33–35:
- Nausea due to chemical or metabolic factors: haloperidol (Haldol), levomepromazine (another antipsychotic drug, not available in the United States), cyclizine (Marezine)
- Nausea due to gastric stasis, outlet obstruction: metoclopramide, domperidone (a similar drug, not available in the United States), levomepromazine
- Nausea due to regurgitation: metoclopramide, cyclizine, haloperidol, levomepromazine
- Nausea due to bowel obstruction: metoclopramide (if obstruction is not complete), domperidone, cyclizine, levomepromazine, octreotide (Sandostatin), hyoscyamine (Levsin)
- Nausea due to cranial disease: cyclizine, levomepromazine
- Movement-related nausea: cyclizine, levomepromazine, hyoscyamine
- Cause unclear or multiple causes: cyclizine, haloperidol, levomepromazine
- Cortical nausea: lorazepam (Ativan).
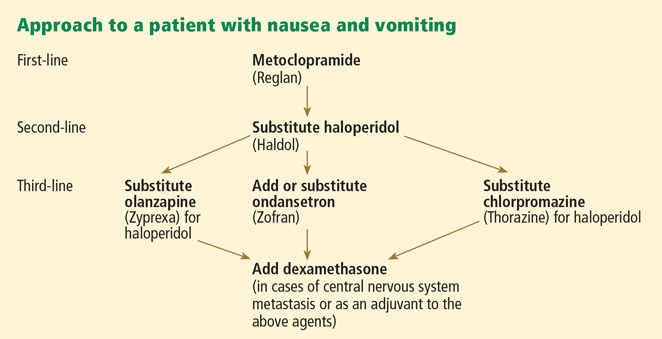
Metoclopramide. If complete bowel obstruction is not suspected, oral metoclopramide, a dopamine antagonist, is our choice for first-line drug therapy.32 Adverse effects include abdominal pain, diarrhea, and sedation.
Haloperidol, another dopamine antagonist, can also be used.32 Haloperidol may cause sedation and is associated with a prolonged QTc interval. Care should be taken in those at risk for dysrhythmia or arrhythmia.
Olanzapine (Zyprexa) is an alternative antipsychotic for patients who cannot tolerate or do not respond to metoclopramide and haloperidol.
Ondansetron (Zofran), a serotonin 5-HT3 receptor antagonist, is usually reserved for nausea and vomiting associated with chemotherapy or radiation, but it can be used in advanced cancer if the above agents fail.37
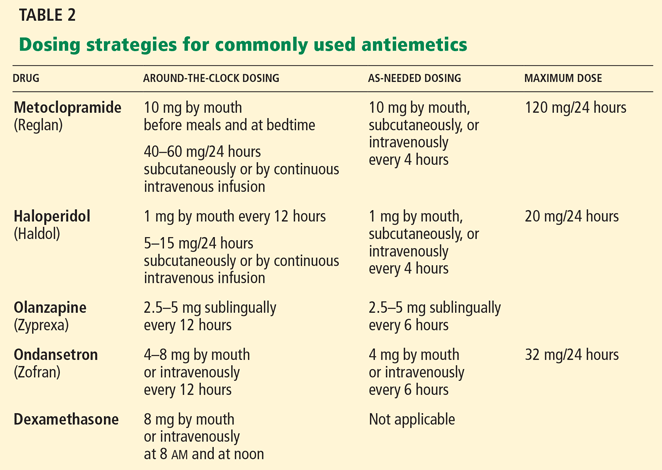
DYSPNEA IS COMMON, EVEN WITHOUT LUNG DISEASE
Dyspnea is the subjective perception of impaired breathing, which may include the sensation of breathlessness, chest tightness, air hunger, suffocation, or increased work of breathing.
At least half of patients with advanced cancer complain of dyspnea.1 Most have primary pulmonary malignancies or metastatic lung disease, but almost 25% have no documented lung involvement or underlying cardiopulmonary diagnosis to which to attribute it.38
Dyspnea is often very distressing. Palliative sedation is used more frequently for the relief of intractable dyspnea than for pain.39
Opioids are effective but underutilized for dyspnea
Although opioids are effective in both oral and parenteral formulations for the symptomatic management of dyspnea,40 the exact mechanism by which they improve dyspnea is unknown. Central control of respiration occurs in the medulla, and perception of dyspnea is mediated by the sensory cortex.
Opioids are underutilized by physicians other than palliative medicine specialists because of concern about respiratory depression. Appropriately titrated, opioids are safe and do not cause clinically significant respiratory depression.41
Allen et al42 showed that an opioid in low doses (diamorphine 2.5 mg subcutaneously) was effective and well tolerated in elderly patients with advanced pulmonary fibrosis who had not received opioids before.
Start low and go slow. An appropriate starting dose for a patient who has not been on opioids before may be morphine sulfate 2 mg intravenously (or a 5-mg immediate-release tablet by mouth) every 2 hours as needed for dyspnea. After 24 to 48 hours of an as-needed regimen, one can evaluate the patient’s response, tolerance, and dose requirement. If needed, parenteral infusion or a long-acting opioid preparation can be started with continued as-needed bolus dosing for breakthrough dyspnea.
We do not recommend writing opioid infusion orders with a “titrate to comfort” clause in the terminally ill. Increasing the rate of a continuous infusion does not provide the prompt symptomatic relief a bolus dose delivers. Dose accumulation and adverse effects are more likely when opioids are titrated in this fashion.
A Cochrane review showed that nebulized opioids are ineffective for dyspnea.43
Oxygen paradoxically does not improve dyspnea
Oxygen is commonly prescribed, although the literature does not indicate that it improves the sensation of breathlessness.44
A study by Clemens et al45 showed no correlation between dyspnea and oxygen saturation. It also found morphine to be superior to oxygen in subjective dyspnea, even in hypoxia.
A double-blind crossover study showed that ambient air delivered via nasal cannula was as effective as oxygen for dyspnea.46 The inexpensive and simple practice of a fan to blow ambient air on the patient’s face may help relieve dyspnea.
- Donnelly S, Walsh D. The symptoms of advanced cancer. Semin Oncol 1995; 22(2 suppl 3):67–72.
- Walsh D, Rybicki L, Nelson KA, Donnelly S. Symptoms and prognosis in advanced cancer. Support Care Cancer 2002; 10:385–388.
- Komurcu S, Nelson KA, Walsh D, Donnelly SM, Homsi J, Abdullah O. Common symptoms in advanced cancer. Semin Oncol 2000; 27:24–33.
- Homsi J, Walsh D, Rivera N, et al. Symptom evaluation in palliative medicine: patient report vs systematic assessment. Support Care Cancer 2006; 14:444–453.
- Donnelly S. Quality-of-life assessment in advanced cancer. Curr Oncol Rep 2000; 2:338–342.
- Stone P, Richardson A, Ream E, Smith AG, Kerr DJ, Kearney N. Cancer-related fatigue: inevitable, unimportant and untreatable? Results of a multi-centre patient survey. Cancer Fatigue Forum. Ann Oncol 2000; 11:971–975.
- Portenoy RK, Itri LM. Cancer-related fatigue: guidelines for evaluation and management. Oncologist 1999; 4:1–10.
- Berger AM, Abernethy AP, Atkinson A, et al. NCCN Clinical Practice Guidelines in Oncology Cancer-related fatigue—v.1.2010. www.nccn.org/professionals/physician_gls/PDF/fatigue.pdf. Accessed November 15, 2010.
- Schmitz KH, Holtzman J, Courneya KS, Mâsse LC, Duval S, Kane R. Controlled physical activity trials in cancer survivors: a systematic review and meta-analysis. Cancer Epidemiol Biomarkers Prev 2005; 14:1588–1595.
- Porock D, Kristjanson LJ, Tinnelly K, Duke T, Blight J. An exercise intervention for advanced cancer patients experiencing fatigue: a pilot study. J Palliat Care 2000 Autumn; 16:30–36.
- Breitbart W, Rosenfeld B, Kaim M, Funesti-Esch J. A randomized, double-blind, placebo-controlled trial of psychostimulants for the treatment of fatigue in ambulatory patients with human immunodeficiency virus disease. Arch Intern Med 2001; 161:411–420.
- Sarhill N, Walsh D, Nelson KA, Homsi J, LeGrand S, Davis MP. Methylphenidate for fatigue in advanced cancer: a prospective open-label pilot study. Am J Hosp Palliat Care 2001; 18:187–192.
- Minton O, Richardson A, Sharpe M, Hotopf M, Stone P. A systematic review and meta-analysis of the pharmacological treatment of cancer-related fatigue. J Natl Cancer Inst 2008; 100:1155–1166.
- Kaleita TA, Wellisch DK, Graham CA, et al. Pilot study of modafinil for treatment of neurobehavioral dysfunction and fatigue in adult patients with brain tumors (abstract). J Clin Oncol 2006; 24(suppl):58s.
- Morrow GR, Jean-Pierre P, Roscoe JA, et al. A phase III randomized, placebo-controlled, double-blind trial of a eugeroic agent in 642 cancer patients reporting fatigue during chemotherapy: a URCC CCOP study (abstract). J Clin Oncol 2008; 26(suppl):504s.
- Tannock I, Gospodarowicz M, Meakin W, Panzarella T, Stewart L, Rider W. Treatment of metastatic prostatic cancer with low-dose prednisone: evaluation of pain and quality of life as pragmatic indices of response. J Clin Oncol 1989; 7:590–597.
- Morley JE, Thomas DR, Wilson MM. Cachexia: pathophysiology and clinical relevance. Am J Clin Nutr 2006; 83:735–743.
- Poole K, Froggatt K. Loss of weight and loss of appetite in advanced cancer: a problem for the patient, the carer, or the health professional? Palliat Med 2002; 16:499–506.
- Von Roenn JH. Randomized trials of megestrol acetate for AIDS-associated anorexia and cachexia. Oncology 1994; 51(suppl 1):19–24.
- Donnelly S, Walsh TD. Low-dose megestrol acetate for appetite stimulation in advanced cancer. J Pain Symptom Manage 1995; 10:182–183.
- Mulligan K, Zackin R, Von Roenn JH, et al; ACTG 313 Study Team. Testosterone supplementation of megestrol therapy does not enhance lean tissue accrual in men with human immunodeficiency virus-associated weight loss: a randomized, double-blind, placebo-controlled, multicenter trial. J Clin Endocrinol Metab 2007; 92:563–570.
- Navari RM, Brenner MC. Treatment of cancer-related anorexia with olanzapine and megestrol acetate: a randomized trial. Support Care Cancer 2010; 18:951–956.
- Mercadante S, Fulfaro F, Casuccio A. The use of corticosteroids in home palliative care. Support Care Cancer 2001; 9:386–389.
- Walsh D, Kirkova J, Davis MP. The efficacy and tolerability of long-term use of dronabinol in cancer-related anorexia: a case series. J Pain Symptom Manage 2005; 30:493–495.
- Cannabis-In-Cachexia-Study-Group; Strasser F, Luftner D, Possinger K, et al. Comparison of orally administered cannabis extract and delta-9-tetrahydrocannabinol in treating patients with cancer-related anorexia-cachexia syndrome: a multicenter, phase III, randomized, double-blind, placebo-controlled clinical trial from the Cannabis-In-Cachexia-Study-Group. J Clin Oncol 2006; 24:3394–3400.
- Jatoi A, Windschitl HE, Loprinzi CL, et al. Dronabinol versus megestrol acetate versus combination therapy for cancer-associated anorexia: a North Central Cancer Treatment Group study. J Clin Oncol 2002; 20:567–573.
- Winter SM. Terminal nutrition: framing the debate for the withdrawal of nutritional support in terminally ill patients. Am J Med 2000; 109:723–726.
- Drossman DA, Sandler RS, McKee DC, Lovitz AJ. Bowel patterns among subjects not seeking health care. Use of a questionnaire to identify a population with bowel dysfunction. Gastroenterology 1982; 83:529–534.
- McMillan SC. Assessing and managing opiate-induced constipation in adults with cancer. Cancer Control 2004; 11(suppl 3):3–9.
- Robinson CB, Fritch M, Hullett L, et al. Development of a protocol to prevent opioid-induced constipation in patients with cancer: a research utilization project. Clin J Oncol Nurs 2000; 4:79–84.
- Thomas J, Karver S, Cooney GA, et al. Methylnaltrexone for opioid-induced constipation in advanced illness. N Engl J Med 2008; 358:2332–2343.
- Davis MP, Walsh D. Treatment of nausea and vomiting in advanced cancer. Support Care Cancer 2000; 8:444–452.
- Stephenson J, Davies A. An assessment of aetiology-based guidelines for the management of nausea and vomiting in patients with advanced cancer. Support Care Cancer 2006; 14:348–353.
- Lichter I. Results of antiemetic management in terminal illness. J Palliat Care 1993; 9:19–21.
- Bentley A, Boyd K. Use of clinical pictures in the management of nausea and vomiting: a prospective audit. Palliat Med 2001; 15:247–253.
- Glare P, Pereira G, Kristjanson LJ, Stockler M, Tattersall M. Systematic review of the efficacy of antiemetics in the treatment of nausea in patients with far-advanced cancer. Support Care Cancer 2004; 12:432–440.
- Currow DC, Coughlan M, Fardell B, Cooney NJ. Use of ondansetron in palliative medicine. J Pain Symptom Manage 1997; 13:302–307.
- Reuben DB, Mor V. Dyspnea in terminally ill cancer patients. Chest 1986; 89:234–236.
- Fainsinger RL, Waller A, Bercovici M, et al. A multicentre international study of sedation for uncontrolled symptoms in terminally ill patients. Palliat Med 2000; 14:257–265.
- Jennings AL, Davies AN, Higgins JP, Broadley K. Opioids for the palliation of breathlessness in terminal illness. Cochrane Database Syst Rev 2001;CD002066.
- Estfan B, Mahmoud F, Shaheen P, et al. Respiratory function during parenteral opioid titration for cancer pain. Palliat Med 2007; 21:81–86.
- Allen S, Raut S, Woollard J, Vassallo M. Low dose diamorphine reduces breathlessness without causing a fall in oxygen saturation in elderly patients with end-stage idiopathic pulmonary fibrosis. Palliat Med 2005; 19:128–130.
- Polosa R, Simidchiev A, Walters EH. Nebulised morphine for severe interstitial lung disease. Cochrane Database Syst Rev 2002;CD002872.
- Currow DC, Agar M, Smith J, Abernethy AP. Does palliative home oxygen improve dyspnoea? A consecutive cohort study. Palliat Med 2009; 23:309–316.
- Clemens KE, Quednau I, Klaschik E. Use of oxygen and opioids in the palliation of dyspnoea in hypoxic and non-hypoxic palliative care patients: a prospective study. Support Care Cancer 2009; 17:367–377.
- Philip J, Gold M, Milner A, Di Iulio J, Miller B, Spruyt O. A randomized, double-blind, crossover trial of the effect of oxygen on dyspnea in patients with advanced cancer. J Pain Symptom Manage 2006; 32:541–550.
Cancer patients experience many distressing symptoms during the course of their illness. In addition to pain, they commonly suffer from fatigue, anorexia, constipation, dyspnea, nausea, and vomiting.1
Although it is important to diagnose and manage the cancer itself, it is also the physician’s duty to recognize and effectively treat associated symptoms, regardless of the outcome of the underlying disease.
Some of the symptoms are due to the underlying disease, but some are iatrogenic, as many medical interventions have predictable adverse effects, such as nausea and vomiting with chemotherapy or constipation with opioids.
Symptoms of advanced cancer become chronic, and patients usually rate them as moderate or severe.1 Unrelieved suffering causes demoralization and may quickly impair quality of life.2
Understanding the principles of symptom management may help optimize palliation and improve quality of life. In this paper, we outline an approach to the management of cancer-related symptoms.
A HEAVY BURDEN OF SYMPTOMS
In patients with advanced cancer, the prevalence rates of various symptoms are approximately as follows1,3:
- Pain 89%
- Fatigue 69%
- Weakness 66%
- Anorexia 66%
- Lack of energy 61%
- Nausea 60%
- Dry mouth 57%
- Constipation 52%
- Early satiety 51%
- Dyspnea 50%
- Vomiting 30%.
Furthermore, patients with advanced cancer typically have multiple concurrent symptoms. In a survey of patients in a palliative medicine service at our hospital,4 we found that the median number of symptoms per patient was 10 (range 0–25) (Figure 1).
PRINCIPLES OF SYMPTOM MANAGEMENT
Show an interest in the patient’s symptoms. Many patients with advanced cancer believe that suffering is an inevitable part of the disease or of its treatment.
Ask patients about their symptoms in a positive and detailed fashion, starting with open-ended questions and following up with specific questions. Patients may underreport their symptoms or may not mention them if not asked directly. In the survey of palliative care patients at our hospital mentioned above,4 the median number of volunteered symptoms was only 1 (range 0–6), whereas a median of 10 were found by systematic assessment.
The examiner should clarify when necessary and recognize that a layperson’s language may not directly translate to medical language. For example, a patient may not understand the term “anorexia.” Furthermore, “loss of appetite” may mean nausea, vomiting, constipation, or early satiety. “Numbness” may mean a loss of sensation or a pins-and-needles sensation. Symptoms should also be quantified using a consistent measure (ie, numerical or categorical) to facilitate monitoring.
Prioritize the symptoms. Advanced cancer is accompanied by multiple symptoms. Assess which ones are most bothersome, and where therapy should be directed first.
Try to understand the pathophysiology behind the symptom. When possible, choose a drug treatment that targets the likely underlying cause. Nausea and vomiting, for example, can be secondary to gastric outlet obstruction, hypercalcemia, increased intracranial pressure, esophagitis, opioid use, or constipation.
Be specific about the drug, dosing, timing, and route, and keep it simple. If a regimen is cumbersome, compliance suffers. It is better to start one medication for the most bothersome symptom or symptoms and make some progress than it is to overwhelm the patient with a complex list of drugs. Sustained-release formulations are often useful. It is unrealistic to expect most patients to take a medication every 4 hours around the clock. Try the most cost-effective remedies first, and attempt to use one drug that may address multiple symptoms. For example, dexamethasone may have positive effects on energy, pain, and appetite.
Use ‘rescue dosing.’ Rescue drugs are important for expected symptom exacerbations in those on sustained medication. This approach increases efficacy and minimizes adverse effects. In most cases, the rescue medication should be the same as the regularly scheduled one. For example, a prescription to treat nausea may read “metoclopramide (Reglan) 10 mg by mouth before meals and at bedtime and every 4 hours as needed to treat nausea or vomiting.”
Consider the patient’s age and fragility, the cost of the drug, and anticipated adverse effects. Oral or transdermal preparations are preferable to parenteral ones with regard to convenience and compliance, although many transdermal preparations are costly. If parenteral dosing is necessary, the subcutaneous route is an alternative to the intravenous route.
Discontinue drugs that are ineffective or unnecessary. This may help compliance and diminish adverse effects.
Make one change at a time so the response to that change is clear. Titrate one drug to its effective dose, to its maximum dose, or to a level of intolerability before considering another. If one drug of a class is ineffective, another drug in the same class may work.
Reassess often. A follow-up phone call or office visit in 1 to 2 weeks is appropriate. The symptoms of advanced cancer are often progressive, so regular evaluation is important, even if symptoms are controlled on stable drug regimens. Instructions should be both verbal and written and should be communicated to patients and any involved caregiver to ensure compliance. Have a “plan B” if the first plan is ineffective.
A challenging and important part of symptom management is to assess the goals of care. Every intervention is not appropriate for every patient. Which therapies are used depends on the stage of the disease, the available disease-modifying treatments, and the patient’s condition and preferences. Patients and their loved ones should be engaged in discussions about goals of care early in the disease and should be included in medical decision-making. Both curative treatment and palliative treatment are important, but palliation plays a bigger role towards the later stages of advanced cancer (Figure 2).
CANCER-RELATED FATIGUE: COMMON BUT NOT INEVITABLE
Most cancer patients report fatigue. Although it is one of the most common symptoms in advanced cancer,5 it is not necessarily inevitable or untreatable.6
Cancer-related fatigue is multidimensional and develops over time, diminishing energy, mental capacity, and psychological condition.7 Patients may report feeling tired or being unable to complete their activities of daily living. People who were previously very active may be frustrated by their inability to participate in favorite leisure activities, which has a big impact on quality of life. Fatigue can be physical, emotional, or mental. It is important to distinguish physical weakness from dyspnea on exertion, which is commonly reported as fatigue. Depression may also cause or exacerbate fatigue.
Unlike fatigue in the general population, cancer-related fatigue does not improve with rest, and patients often report large amounts of unrestorative sleep.
Look for reversible causes of fatigue
First, conduct a thorough assessment to identify any reversible causes, such as:
- Anemia
- Insomnia, sleep disturbance
- Malnutrition
- Pain
- Depression
- Medical comorbidities: renal, cardiac, or pulmonary disease
- Hypothyroidism
- Hypogonadism.
In many cases, however, a reversible cause cannot be found.
Treating cancer-related fatigue
Nonpharmacologic interventions have been evaluated for this application, but evidence of efficacy is limited and mixed. The National Cancer Comprehensive Network guidelines8 suggest that energy conservation and education about cancer-related fatigue are central to management. Patients should be advised that fatigue has a fluctuating course and that they have a limited pool of energy, which they should conserve and use judiciously.
In a meta-analysis by Schmitz et al,9 physical activity interventions were found to be beneficial. Sixty-three percent of those studied were undergoing active treatment, so whether this population reflects advanced cancer is unclear. A small pilot study in advanced cancer found a trend toward benefit with exercise.10
Comment. The strategies of rest and exercise are complementary. The key point is to plan them per personal preference.
Psychostimulants include methylphenidate (Ritalin). A randomized placebo-controlled trial in patients with acquired immunodeficiency syndrome (AIDS) found methylphenidate 15 to 60 mg/day to have a positive effect.11 Prospective studies have shown similar results in cancer patients,12 and a Cochrane review in 2008 showed a small but significant benefit in cancer-related fatigue.13
Methylphenidate is usually started at a dose of 5 mg given at 8:00 am and at noon, and then titrated. Benefit, when experienced, is typically noted within 24 to 48 hours. Possible adverse effects include anorexia, insomnia, anxiety, confusion, tremor, and tachycardia.
Stimulants should be used with caution in patients with cardiac disease or delirium.
Modafinil (Provigil), a nonstimulant agent, has been less studied, but it may also help.14,15 The usual dosage is 50 to 200 mg daily.
Corticosteroids may have a role in advanced cancer, as suggested by anecdotal reports.16 They should be used judiciously, as their adverse effects (insomnia, muscle wasting, edema) are themselves burdensome and may outweigh their benefits.
ANOREXIA CAN BE DISTRESSING TO THE FAMILY AND THE PATIENT
Most patients with advanced cancer experience anorexia, which is a marker of poor prognosis.1
Appetite loss may occur in isolation or as a part of the anorexia-cachexia syndrome. This syndrome is a wasting state seen in chronic, advanced diseases including cancer, AIDS, chronic obstructive pulmonary disease, chronic renal insufficiency, and congestive heart failure.17 The associated weight loss is involuntary and includes both muscle and fat.
Appetite loss alone is usually not bothersome. In fact, anorexia frequently causes more distress to the family than to the patient.18 The ramifications of decreased appetite, on the other hand, can be devastating. Decreased caloric intake coupled with the hypermetabolic state of malignancy leads to rapid, dramatic changes in body habitus. This outward sign of the ravages of cancer can be psychologically damaging to patients and their loved ones as they contemplate advanced disease and limited life expectancy. They may be concerned about starvation, in which case education about and attempts to normalize the anorexia-cachexia syndrome are essential.
Look for reversible causes of anorexia
The first step in the management of anorexia is to identify any reversible causes, such as:
- Stomatitis
- Constipation
- Uncontrolled severe symptoms such as pain or dyspnea
- Delirium
- Nausea, vomiting
- Depression
- Gastroparesis.
Managing cancer-related anorexia
Nonpharmacologic measures include nutritional counseling and increased physical activity. Patients may be counseled to eat calorie-dense foods and supplemental high-calorie, high-protein, high-fat drinks. Some may be able to take advantage of a diurnal variation in appetite, usually an increased appetite in the morning.
Megestrol acetate (Megace) improved appetite and induced weight gain when used in a dosage of 800 mg daily in a randomized controlled trial in AIDS patients.19 Case studies have shown doses as low as 80 to 160 mg daily to be beneficial.20 Most of the added weight is fat, not lean muscle mass. Unfortunately, the addition of testosterone to megestrol did not increase the accumulation of lean muscle mass in another randomized trial.21 But the addition of olanzapine (Zyprexa) to megestrol was associated with improved appetite and weight gain in a significant percentage of advanced cancer patients.22 Rates of adverse effects with megestrol are low; the most significant adverse effect is thromboembolism.
Corticosteroids. While much of the support for corticosteroids is anecdotal, a prospective study of dexamethasone 4 to 16 mg daily showed improvement in several symptoms, including appetite.23 Because of the multiple adverse effects of corticosteroids, careful attention to dose, duration, and tolerability is essential. Corticosteroids should be discontinued if the desired positive effects are not observed within 3 to 5 days. If prolonged survival is expected, wean to the lowest effective dose.
Cannabinoids. Dronabinol (Marinol), a synthetic formulation of delta-9-tetrahydrocannabinol (THC), the active agent of marijuana, has been beneficial in AIDS anorexia. Fewer studies have been done in advanced cancer.
In a small, open-label case series, doses of 7.5 to 15 mg of dronabinol daily improved appetite and were well tolerated.24 On the other hand, in a multicenter, randomized, double-blind, placebo-controlled trial, neither cannabis extract nor THC (5 mg daily) significantly improved appetite over a 6-week period.25
A large randomized study found megestrol acetate 800 mg to be superior to dronabinol 5 mg daily for treating anorexia.26
Neurotoxicity, anxiety, nervousness, dizziness, euphoria, and somnolence from dronabinol can be severe and intolerable for some.
Enteral tube feeding and parenteral nutrition do not improve survival or comfort in terminally ill patients.27 On the contrary, they are associated with complications, including aspiration pneumonia, sepsis, abdominal pain, vomiting, and diarrhea. Nevertheless, in some patients with mechanical impediments to nutrition (eg, esophageal fistula, obstruction, or proximal small bowel obstruction) or in those who are hungry and unable to take food by mouth, tube feeding may be appropriate.
CONSTIPATION SHOULD BE ANTICIPATED, AND PREVENTED IF POSSIBLE
Constipation is variably defined by patients and health care professionals, but it usually includes components of the Rome II criteria, ie, two or more of the following symptoms28:
- Straining at least 25% of the time
- Hard stools at least 25% of the time
- Incomplete evacuation at least 25% of the time
- Two or fewer bowel movements per week.
These criteria were intended to describe functional constipation in a healthy population.27
More than 50% of patients with advanced cancer report constipation,1 and in those on opioids, the scope of the problem is larger. In addition to binding central nervous system receptors to mediate pain perception, opioids bind systemic receptors including those in the gut. As a result, opioids interfere with smooth muscle tone and contractility, lengthen transit time, promote dry stools, and increase anal sphincter tone.29 A nursing study found that when patients taking opioids were screened for constipation, 95% identified it as the major adverse effect of their pain regimen.30
Multiple causes of constipation
Factors that can cause or contribute to constipation include:
- Dietary factors such as a generally low intake of food, and specifically of fiber
- Inactivity
- Confusion
- Dehydration
- Intestinal obstruction
- Cormorbidities such as diabetes mellitus, hypothyroidism, hypercalcemia
- Uncomfortable toilet arrangements
- Drugs such as opioids (as noted above), anticholinergics, antihypertensives, antacids, diuretics, and iron supplements.
Take a proactive approach to constipation
Constipation is expected in a number of clinical scenarios, such as with the use of opioids or with limited mobility. Patients often attribute constipation to diminished oral intake. But despite low oral intake, regular, smaller-caliber bowel movements are important to ensure that sloughed bowel endothelium and bacteria are eliminated.
Although little evidence supports the use of one standard bowel regimen, prevention is essential. The goal is a soft bowel movement every 1 to 2 days. Constipation prophylaxis should be started at the initiation of any regular opioid regimen. Encouraging physical activity and oral fluid intake and creating a favorable environment for elimination may also help manage constipation.
In our practice, we use a softening agent such as docusate sodium (Colace) 100 mg twice daily, and add a laxative agent such as senna (Senokot) or a magnesium-based osmotic agent as needed. Bulking agents such as over-the-counter fiber supplements should be used with caution in opioid-related constipation. If there has been no bowel movement for 48 hours, a rectal suppository or enema is used. Suppositories or enemas can be scheduled regularly for bedbound patients with chronic constipation.
Methylnaltrexone (Relistor), a mu-opioid antagonist, is a new agent that blocks peripheral opioid receptors in the gut. In a randomized study of 133 patients, methylnaltrexone produced laxation within 4 hours of administration in 48%.31 This methylated, charged compound does not significantly cross the blood-brain barrier and therefore does not interfere with analgesia or cause opioid withdrawal. The dose is 8 mg or 12 mg subcutaneously (based on weight), which can be repeated in 48 hours. If laxation does not occur after one to three doses, other causes of constipation should be explored.
Methylnaltrexone is contraindicated in patients with bowel obstruction, even if the obstruction is thought to be secondary to opioids. Adverse effects include abdominal pain, flatulence, and nausea.
NAUSEA AND VOMITING: NOT ALWAYS DUE TO CHEMOTHERAPY
Nausea (the sensation of the need to vomit) and vomiting (the forceful expulsion of gastric contents) are common symptoms in advanced cancer and are not necessarily related to chemotherapy or radiation therapy. About 60% of cancer patients have nausea, and about 30% vomit.32 Both symptoms are very distressing and diminish quality of life.
Look for potentially reversible causes of nausea and vomiting
Identifying the cause, which is sometimes reversible, may help direct treatment. Potentially reversible causes include:
- Drugs
- Uremia
- Infection
- Anxiety
- Constipation
- Gastric irritation
- Proximal gastrointestinal obstruction.
In a prospective study of 121 patients with advanced cancer, the most common causes of nausea and vomiting were impaired gastric emptying, chemical and metabolic factors (drugs, organ failure, electrolyte disturbance, infection), and bowel obstruction.33–35
Management of nausea and vomiting
Management of nausea and vomiting may require multiple antiemetics, which may need to be given intravenously or subcutaneously.33
The choice of drugs depends on the cause of the nausea
The evidence-based choice of drugs for nausea depends on the cause33–35:
- Nausea due to chemical or metabolic factors: haloperidol (Haldol), levomepromazine (another antipsychotic drug, not available in the United States), cyclizine (Marezine)
- Nausea due to gastric stasis, outlet obstruction: metoclopramide, domperidone (a similar drug, not available in the United States), levomepromazine
- Nausea due to regurgitation: metoclopramide, cyclizine, haloperidol, levomepromazine
- Nausea due to bowel obstruction: metoclopramide (if obstruction is not complete), domperidone, cyclizine, levomepromazine, octreotide (Sandostatin), hyoscyamine (Levsin)
- Nausea due to cranial disease: cyclizine, levomepromazine
- Movement-related nausea: cyclizine, levomepromazine, hyoscyamine
- Cause unclear or multiple causes: cyclizine, haloperidol, levomepromazine
- Cortical nausea: lorazepam (Ativan).
Metoclopramide. If complete bowel obstruction is not suspected, oral metoclopramide, a dopamine antagonist, is our choice for first-line drug therapy.32 Adverse effects include abdominal pain, diarrhea, and sedation.
Haloperidol, another dopamine antagonist, can also be used.32 Haloperidol may cause sedation and is associated with a prolonged QTc interval. Care should be taken in those at risk for dysrhythmia or arrhythmia.
Olanzapine (Zyprexa) is an alternative antipsychotic for patients who cannot tolerate or do not respond to metoclopramide and haloperidol.
Ondansetron (Zofran), a serotonin 5-HT3 receptor antagonist, is usually reserved for nausea and vomiting associated with chemotherapy or radiation, but it can be used in advanced cancer if the above agents fail.37
DYSPNEA IS COMMON, EVEN WITHOUT LUNG DISEASE
Dyspnea is the subjective perception of impaired breathing, which may include the sensation of breathlessness, chest tightness, air hunger, suffocation, or increased work of breathing.
At least half of patients with advanced cancer complain of dyspnea.1 Most have primary pulmonary malignancies or metastatic lung disease, but almost 25% have no documented lung involvement or underlying cardiopulmonary diagnosis to which to attribute it.38
Dyspnea is often very distressing. Palliative sedation is used more frequently for the relief of intractable dyspnea than for pain.39
Opioids are effective but underutilized for dyspnea
Although opioids are effective in both oral and parenteral formulations for the symptomatic management of dyspnea,40 the exact mechanism by which they improve dyspnea is unknown. Central control of respiration occurs in the medulla, and perception of dyspnea is mediated by the sensory cortex.
Opioids are underutilized by physicians other than palliative medicine specialists because of concern about respiratory depression. Appropriately titrated, opioids are safe and do not cause clinically significant respiratory depression.41
Allen et al42 showed that an opioid in low doses (diamorphine 2.5 mg subcutaneously) was effective and well tolerated in elderly patients with advanced pulmonary fibrosis who had not received opioids before.
Start low and go slow. An appropriate starting dose for a patient who has not been on opioids before may be morphine sulfate 2 mg intravenously (or a 5-mg immediate-release tablet by mouth) every 2 hours as needed for dyspnea. After 24 to 48 hours of an as-needed regimen, one can evaluate the patient’s response, tolerance, and dose requirement. If needed, parenteral infusion or a long-acting opioid preparation can be started with continued as-needed bolus dosing for breakthrough dyspnea.
We do not recommend writing opioid infusion orders with a “titrate to comfort” clause in the terminally ill. Increasing the rate of a continuous infusion does not provide the prompt symptomatic relief a bolus dose delivers. Dose accumulation and adverse effects are more likely when opioids are titrated in this fashion.
A Cochrane review showed that nebulized opioids are ineffective for dyspnea.43
Oxygen paradoxically does not improve dyspnea
Oxygen is commonly prescribed, although the literature does not indicate that it improves the sensation of breathlessness.44
A study by Clemens et al45 showed no correlation between dyspnea and oxygen saturation. It also found morphine to be superior to oxygen in subjective dyspnea, even in hypoxia.
A double-blind crossover study showed that ambient air delivered via nasal cannula was as effective as oxygen for dyspnea.46 The inexpensive and simple practice of a fan to blow ambient air on the patient’s face may help relieve dyspnea.
Cancer patients experience many distressing symptoms during the course of their illness. In addition to pain, they commonly suffer from fatigue, anorexia, constipation, dyspnea, nausea, and vomiting.1
Although it is important to diagnose and manage the cancer itself, it is also the physician’s duty to recognize and effectively treat associated symptoms, regardless of the outcome of the underlying disease.
Some of the symptoms are due to the underlying disease, but some are iatrogenic, as many medical interventions have predictable adverse effects, such as nausea and vomiting with chemotherapy or constipation with opioids.
Symptoms of advanced cancer become chronic, and patients usually rate them as moderate or severe.1 Unrelieved suffering causes demoralization and may quickly impair quality of life.2
Understanding the principles of symptom management may help optimize palliation and improve quality of life. In this paper, we outline an approach to the management of cancer-related symptoms.
A HEAVY BURDEN OF SYMPTOMS
In patients with advanced cancer, the prevalence rates of various symptoms are approximately as follows1,3:
- Pain 89%
- Fatigue 69%
- Weakness 66%
- Anorexia 66%
- Lack of energy 61%
- Nausea 60%
- Dry mouth 57%
- Constipation 52%
- Early satiety 51%
- Dyspnea 50%
- Vomiting 30%.
Furthermore, patients with advanced cancer typically have multiple concurrent symptoms. In a survey of patients in a palliative medicine service at our hospital,4 we found that the median number of symptoms per patient was 10 (range 0–25) (Figure 1).
PRINCIPLES OF SYMPTOM MANAGEMENT
Show an interest in the patient’s symptoms. Many patients with advanced cancer believe that suffering is an inevitable part of the disease or of its treatment.
Ask patients about their symptoms in a positive and detailed fashion, starting with open-ended questions and following up with specific questions. Patients may underreport their symptoms or may not mention them if not asked directly. In the survey of palliative care patients at our hospital mentioned above,4 the median number of volunteered symptoms was only 1 (range 0–6), whereas a median of 10 were found by systematic assessment.
The examiner should clarify when necessary and recognize that a layperson’s language may not directly translate to medical language. For example, a patient may not understand the term “anorexia.” Furthermore, “loss of appetite” may mean nausea, vomiting, constipation, or early satiety. “Numbness” may mean a loss of sensation or a pins-and-needles sensation. Symptoms should also be quantified using a consistent measure (ie, numerical or categorical) to facilitate monitoring.
Prioritize the symptoms. Advanced cancer is accompanied by multiple symptoms. Assess which ones are most bothersome, and where therapy should be directed first.
Try to understand the pathophysiology behind the symptom. When possible, choose a drug treatment that targets the likely underlying cause. Nausea and vomiting, for example, can be secondary to gastric outlet obstruction, hypercalcemia, increased intracranial pressure, esophagitis, opioid use, or constipation.
Be specific about the drug, dosing, timing, and route, and keep it simple. If a regimen is cumbersome, compliance suffers. It is better to start one medication for the most bothersome symptom or symptoms and make some progress than it is to overwhelm the patient with a complex list of drugs. Sustained-release formulations are often useful. It is unrealistic to expect most patients to take a medication every 4 hours around the clock. Try the most cost-effective remedies first, and attempt to use one drug that may address multiple symptoms. For example, dexamethasone may have positive effects on energy, pain, and appetite.
Use ‘rescue dosing.’ Rescue drugs are important for expected symptom exacerbations in those on sustained medication. This approach increases efficacy and minimizes adverse effects. In most cases, the rescue medication should be the same as the regularly scheduled one. For example, a prescription to treat nausea may read “metoclopramide (Reglan) 10 mg by mouth before meals and at bedtime and every 4 hours as needed to treat nausea or vomiting.”
Consider the patient’s age and fragility, the cost of the drug, and anticipated adverse effects. Oral or transdermal preparations are preferable to parenteral ones with regard to convenience and compliance, although many transdermal preparations are costly. If parenteral dosing is necessary, the subcutaneous route is an alternative to the intravenous route.
Discontinue drugs that are ineffective or unnecessary. This may help compliance and diminish adverse effects.
Make one change at a time so the response to that change is clear. Titrate one drug to its effective dose, to its maximum dose, or to a level of intolerability before considering another. If one drug of a class is ineffective, another drug in the same class may work.
Reassess often. A follow-up phone call or office visit in 1 to 2 weeks is appropriate. The symptoms of advanced cancer are often progressive, so regular evaluation is important, even if symptoms are controlled on stable drug regimens. Instructions should be both verbal and written and should be communicated to patients and any involved caregiver to ensure compliance. Have a “plan B” if the first plan is ineffective.
A challenging and important part of symptom management is to assess the goals of care. Every intervention is not appropriate for every patient. Which therapies are used depends on the stage of the disease, the available disease-modifying treatments, and the patient’s condition and preferences. Patients and their loved ones should be engaged in discussions about goals of care early in the disease and should be included in medical decision-making. Both curative treatment and palliative treatment are important, but palliation plays a bigger role towards the later stages of advanced cancer (Figure 2).
CANCER-RELATED FATIGUE: COMMON BUT NOT INEVITABLE
Most cancer patients report fatigue. Although it is one of the most common symptoms in advanced cancer,5 it is not necessarily inevitable or untreatable.6
Cancer-related fatigue is multidimensional and develops over time, diminishing energy, mental capacity, and psychological condition.7 Patients may report feeling tired or being unable to complete their activities of daily living. People who were previously very active may be frustrated by their inability to participate in favorite leisure activities, which has a big impact on quality of life. Fatigue can be physical, emotional, or mental. It is important to distinguish physical weakness from dyspnea on exertion, which is commonly reported as fatigue. Depression may also cause or exacerbate fatigue.
Unlike fatigue in the general population, cancer-related fatigue does not improve with rest, and patients often report large amounts of unrestorative sleep.
Look for reversible causes of fatigue
First, conduct a thorough assessment to identify any reversible causes, such as:
- Anemia
- Insomnia, sleep disturbance
- Malnutrition
- Pain
- Depression
- Medical comorbidities: renal, cardiac, or pulmonary disease
- Hypothyroidism
- Hypogonadism.
In many cases, however, a reversible cause cannot be found.
Treating cancer-related fatigue
Nonpharmacologic interventions have been evaluated for this application, but evidence of efficacy is limited and mixed. The National Cancer Comprehensive Network guidelines8 suggest that energy conservation and education about cancer-related fatigue are central to management. Patients should be advised that fatigue has a fluctuating course and that they have a limited pool of energy, which they should conserve and use judiciously.
In a meta-analysis by Schmitz et al,9 physical activity interventions were found to be beneficial. Sixty-three percent of those studied were undergoing active treatment, so whether this population reflects advanced cancer is unclear. A small pilot study in advanced cancer found a trend toward benefit with exercise.10
Comment. The strategies of rest and exercise are complementary. The key point is to plan them per personal preference.
Psychostimulants include methylphenidate (Ritalin). A randomized placebo-controlled trial in patients with acquired immunodeficiency syndrome (AIDS) found methylphenidate 15 to 60 mg/day to have a positive effect.11 Prospective studies have shown similar results in cancer patients,12 and a Cochrane review in 2008 showed a small but significant benefit in cancer-related fatigue.13
Methylphenidate is usually started at a dose of 5 mg given at 8:00 am and at noon, and then titrated. Benefit, when experienced, is typically noted within 24 to 48 hours. Possible adverse effects include anorexia, insomnia, anxiety, confusion, tremor, and tachycardia.
Stimulants should be used with caution in patients with cardiac disease or delirium.
Modafinil (Provigil), a nonstimulant agent, has been less studied, but it may also help.14,15 The usual dosage is 50 to 200 mg daily.
Corticosteroids may have a role in advanced cancer, as suggested by anecdotal reports.16 They should be used judiciously, as their adverse effects (insomnia, muscle wasting, edema) are themselves burdensome and may outweigh their benefits.
ANOREXIA CAN BE DISTRESSING TO THE FAMILY AND THE PATIENT
Most patients with advanced cancer experience anorexia, which is a marker of poor prognosis.1
Appetite loss may occur in isolation or as a part of the anorexia-cachexia syndrome. This syndrome is a wasting state seen in chronic, advanced diseases including cancer, AIDS, chronic obstructive pulmonary disease, chronic renal insufficiency, and congestive heart failure.17 The associated weight loss is involuntary and includes both muscle and fat.
Appetite loss alone is usually not bothersome. In fact, anorexia frequently causes more distress to the family than to the patient.18 The ramifications of decreased appetite, on the other hand, can be devastating. Decreased caloric intake coupled with the hypermetabolic state of malignancy leads to rapid, dramatic changes in body habitus. This outward sign of the ravages of cancer can be psychologically damaging to patients and their loved ones as they contemplate advanced disease and limited life expectancy. They may be concerned about starvation, in which case education about and attempts to normalize the anorexia-cachexia syndrome are essential.
Look for reversible causes of anorexia
The first step in the management of anorexia is to identify any reversible causes, such as:
- Stomatitis
- Constipation
- Uncontrolled severe symptoms such as pain or dyspnea
- Delirium
- Nausea, vomiting
- Depression
- Gastroparesis.
Managing cancer-related anorexia
Nonpharmacologic measures include nutritional counseling and increased physical activity. Patients may be counseled to eat calorie-dense foods and supplemental high-calorie, high-protein, high-fat drinks. Some may be able to take advantage of a diurnal variation in appetite, usually an increased appetite in the morning.
Megestrol acetate (Megace) improved appetite and induced weight gain when used in a dosage of 800 mg daily in a randomized controlled trial in AIDS patients.19 Case studies have shown doses as low as 80 to 160 mg daily to be beneficial.20 Most of the added weight is fat, not lean muscle mass. Unfortunately, the addition of testosterone to megestrol did not increase the accumulation of lean muscle mass in another randomized trial.21 But the addition of olanzapine (Zyprexa) to megestrol was associated with improved appetite and weight gain in a significant percentage of advanced cancer patients.22 Rates of adverse effects with megestrol are low; the most significant adverse effect is thromboembolism.
Corticosteroids. While much of the support for corticosteroids is anecdotal, a prospective study of dexamethasone 4 to 16 mg daily showed improvement in several symptoms, including appetite.23 Because of the multiple adverse effects of corticosteroids, careful attention to dose, duration, and tolerability is essential. Corticosteroids should be discontinued if the desired positive effects are not observed within 3 to 5 days. If prolonged survival is expected, wean to the lowest effective dose.
Cannabinoids. Dronabinol (Marinol), a synthetic formulation of delta-9-tetrahydrocannabinol (THC), the active agent of marijuana, has been beneficial in AIDS anorexia. Fewer studies have been done in advanced cancer.
In a small, open-label case series, doses of 7.5 to 15 mg of dronabinol daily improved appetite and were well tolerated.24 On the other hand, in a multicenter, randomized, double-blind, placebo-controlled trial, neither cannabis extract nor THC (5 mg daily) significantly improved appetite over a 6-week period.25
A large randomized study found megestrol acetate 800 mg to be superior to dronabinol 5 mg daily for treating anorexia.26
Neurotoxicity, anxiety, nervousness, dizziness, euphoria, and somnolence from dronabinol can be severe and intolerable for some.
Enteral tube feeding and parenteral nutrition do not improve survival or comfort in terminally ill patients.27 On the contrary, they are associated with complications, including aspiration pneumonia, sepsis, abdominal pain, vomiting, and diarrhea. Nevertheless, in some patients with mechanical impediments to nutrition (eg, esophageal fistula, obstruction, or proximal small bowel obstruction) or in those who are hungry and unable to take food by mouth, tube feeding may be appropriate.
CONSTIPATION SHOULD BE ANTICIPATED, AND PREVENTED IF POSSIBLE
Constipation is variably defined by patients and health care professionals, but it usually includes components of the Rome II criteria, ie, two or more of the following symptoms28:
- Straining at least 25% of the time
- Hard stools at least 25% of the time
- Incomplete evacuation at least 25% of the time
- Two or fewer bowel movements per week.
These criteria were intended to describe functional constipation in a healthy population.27
More than 50% of patients with advanced cancer report constipation,1 and in those on opioids, the scope of the problem is larger. In addition to binding central nervous system receptors to mediate pain perception, opioids bind systemic receptors including those in the gut. As a result, opioids interfere with smooth muscle tone and contractility, lengthen transit time, promote dry stools, and increase anal sphincter tone.29 A nursing study found that when patients taking opioids were screened for constipation, 95% identified it as the major adverse effect of their pain regimen.30
Multiple causes of constipation
Factors that can cause or contribute to constipation include:
- Dietary factors such as a generally low intake of food, and specifically of fiber
- Inactivity
- Confusion
- Dehydration
- Intestinal obstruction
- Cormorbidities such as diabetes mellitus, hypothyroidism, hypercalcemia
- Uncomfortable toilet arrangements
- Drugs such as opioids (as noted above), anticholinergics, antihypertensives, antacids, diuretics, and iron supplements.
Take a proactive approach to constipation
Constipation is expected in a number of clinical scenarios, such as with the use of opioids or with limited mobility. Patients often attribute constipation to diminished oral intake. But despite low oral intake, regular, smaller-caliber bowel movements are important to ensure that sloughed bowel endothelium and bacteria are eliminated.
Although little evidence supports the use of one standard bowel regimen, prevention is essential. The goal is a soft bowel movement every 1 to 2 days. Constipation prophylaxis should be started at the initiation of any regular opioid regimen. Encouraging physical activity and oral fluid intake and creating a favorable environment for elimination may also help manage constipation.
In our practice, we use a softening agent such as docusate sodium (Colace) 100 mg twice daily, and add a laxative agent such as senna (Senokot) or a magnesium-based osmotic agent as needed. Bulking agents such as over-the-counter fiber supplements should be used with caution in opioid-related constipation. If there has been no bowel movement for 48 hours, a rectal suppository or enema is used. Suppositories or enemas can be scheduled regularly for bedbound patients with chronic constipation.
Methylnaltrexone (Relistor), a mu-opioid antagonist, is a new agent that blocks peripheral opioid receptors in the gut. In a randomized study of 133 patients, methylnaltrexone produced laxation within 4 hours of administration in 48%.31 This methylated, charged compound does not significantly cross the blood-brain barrier and therefore does not interfere with analgesia or cause opioid withdrawal. The dose is 8 mg or 12 mg subcutaneously (based on weight), which can be repeated in 48 hours. If laxation does not occur after one to three doses, other causes of constipation should be explored.
Methylnaltrexone is contraindicated in patients with bowel obstruction, even if the obstruction is thought to be secondary to opioids. Adverse effects include abdominal pain, flatulence, and nausea.
NAUSEA AND VOMITING: NOT ALWAYS DUE TO CHEMOTHERAPY
Nausea (the sensation of the need to vomit) and vomiting (the forceful expulsion of gastric contents) are common symptoms in advanced cancer and are not necessarily related to chemotherapy or radiation therapy. About 60% of cancer patients have nausea, and about 30% vomit.32 Both symptoms are very distressing and diminish quality of life.
Look for potentially reversible causes of nausea and vomiting
Identifying the cause, which is sometimes reversible, may help direct treatment. Potentially reversible causes include:
- Drugs
- Uremia
- Infection
- Anxiety
- Constipation
- Gastric irritation
- Proximal gastrointestinal obstruction.
In a prospective study of 121 patients with advanced cancer, the most common causes of nausea and vomiting were impaired gastric emptying, chemical and metabolic factors (drugs, organ failure, electrolyte disturbance, infection), and bowel obstruction.33–35
Management of nausea and vomiting
Management of nausea and vomiting may require multiple antiemetics, which may need to be given intravenously or subcutaneously.33
The choice of drugs depends on the cause of the nausea
The evidence-based choice of drugs for nausea depends on the cause33–35:
- Nausea due to chemical or metabolic factors: haloperidol (Haldol), levomepromazine (another antipsychotic drug, not available in the United States), cyclizine (Marezine)
- Nausea due to gastric stasis, outlet obstruction: metoclopramide, domperidone (a similar drug, not available in the United States), levomepromazine
- Nausea due to regurgitation: metoclopramide, cyclizine, haloperidol, levomepromazine
- Nausea due to bowel obstruction: metoclopramide (if obstruction is not complete), domperidone, cyclizine, levomepromazine, octreotide (Sandostatin), hyoscyamine (Levsin)
- Nausea due to cranial disease: cyclizine, levomepromazine
- Movement-related nausea: cyclizine, levomepromazine, hyoscyamine
- Cause unclear or multiple causes: cyclizine, haloperidol, levomepromazine
- Cortical nausea: lorazepam (Ativan).
Metoclopramide. If complete bowel obstruction is not suspected, oral metoclopramide, a dopamine antagonist, is our choice for first-line drug therapy.32 Adverse effects include abdominal pain, diarrhea, and sedation.
Haloperidol, another dopamine antagonist, can also be used.32 Haloperidol may cause sedation and is associated with a prolonged QTc interval. Care should be taken in those at risk for dysrhythmia or arrhythmia.
Olanzapine (Zyprexa) is an alternative antipsychotic for patients who cannot tolerate or do not respond to metoclopramide and haloperidol.
Ondansetron (Zofran), a serotonin 5-HT3 receptor antagonist, is usually reserved for nausea and vomiting associated with chemotherapy or radiation, but it can be used in advanced cancer if the above agents fail.37
DYSPNEA IS COMMON, EVEN WITHOUT LUNG DISEASE
Dyspnea is the subjective perception of impaired breathing, which may include the sensation of breathlessness, chest tightness, air hunger, suffocation, or increased work of breathing.
At least half of patients with advanced cancer complain of dyspnea.1 Most have primary pulmonary malignancies or metastatic lung disease, but almost 25% have no documented lung involvement or underlying cardiopulmonary diagnosis to which to attribute it.38
Dyspnea is often very distressing. Palliative sedation is used more frequently for the relief of intractable dyspnea than for pain.39
Opioids are effective but underutilized for dyspnea
Although opioids are effective in both oral and parenteral formulations for the symptomatic management of dyspnea,40 the exact mechanism by which they improve dyspnea is unknown. Central control of respiration occurs in the medulla, and perception of dyspnea is mediated by the sensory cortex.
Opioids are underutilized by physicians other than palliative medicine specialists because of concern about respiratory depression. Appropriately titrated, opioids are safe and do not cause clinically significant respiratory depression.41
Allen et al42 showed that an opioid in low doses (diamorphine 2.5 mg subcutaneously) was effective and well tolerated in elderly patients with advanced pulmonary fibrosis who had not received opioids before.
Start low and go slow. An appropriate starting dose for a patient who has not been on opioids before may be morphine sulfate 2 mg intravenously (or a 5-mg immediate-release tablet by mouth) every 2 hours as needed for dyspnea. After 24 to 48 hours of an as-needed regimen, one can evaluate the patient’s response, tolerance, and dose requirement. If needed, parenteral infusion or a long-acting opioid preparation can be started with continued as-needed bolus dosing for breakthrough dyspnea.
We do not recommend writing opioid infusion orders with a “titrate to comfort” clause in the terminally ill. Increasing the rate of a continuous infusion does not provide the prompt symptomatic relief a bolus dose delivers. Dose accumulation and adverse effects are more likely when opioids are titrated in this fashion.
A Cochrane review showed that nebulized opioids are ineffective for dyspnea.43
Oxygen paradoxically does not improve dyspnea
Oxygen is commonly prescribed, although the literature does not indicate that it improves the sensation of breathlessness.44
A study by Clemens et al45 showed no correlation between dyspnea and oxygen saturation. It also found morphine to be superior to oxygen in subjective dyspnea, even in hypoxia.
A double-blind crossover study showed that ambient air delivered via nasal cannula was as effective as oxygen for dyspnea.46 The inexpensive and simple practice of a fan to blow ambient air on the patient’s face may help relieve dyspnea.
- Donnelly S, Walsh D. The symptoms of advanced cancer. Semin Oncol 1995; 22(2 suppl 3):67–72.
- Walsh D, Rybicki L, Nelson KA, Donnelly S. Symptoms and prognosis in advanced cancer. Support Care Cancer 2002; 10:385–388.
- Komurcu S, Nelson KA, Walsh D, Donnelly SM, Homsi J, Abdullah O. Common symptoms in advanced cancer. Semin Oncol 2000; 27:24–33.
- Homsi J, Walsh D, Rivera N, et al. Symptom evaluation in palliative medicine: patient report vs systematic assessment. Support Care Cancer 2006; 14:444–453.
- Donnelly S. Quality-of-life assessment in advanced cancer. Curr Oncol Rep 2000; 2:338–342.
- Stone P, Richardson A, Ream E, Smith AG, Kerr DJ, Kearney N. Cancer-related fatigue: inevitable, unimportant and untreatable? Results of a multi-centre patient survey. Cancer Fatigue Forum. Ann Oncol 2000; 11:971–975.
- Portenoy RK, Itri LM. Cancer-related fatigue: guidelines for evaluation and management. Oncologist 1999; 4:1–10.
- Berger AM, Abernethy AP, Atkinson A, et al. NCCN Clinical Practice Guidelines in Oncology Cancer-related fatigue—v.1.2010. www.nccn.org/professionals/physician_gls/PDF/fatigue.pdf. Accessed November 15, 2010.
- Schmitz KH, Holtzman J, Courneya KS, Mâsse LC, Duval S, Kane R. Controlled physical activity trials in cancer survivors: a systematic review and meta-analysis. Cancer Epidemiol Biomarkers Prev 2005; 14:1588–1595.
- Porock D, Kristjanson LJ, Tinnelly K, Duke T, Blight J. An exercise intervention for advanced cancer patients experiencing fatigue: a pilot study. J Palliat Care 2000 Autumn; 16:30–36.
- Breitbart W, Rosenfeld B, Kaim M, Funesti-Esch J. A randomized, double-blind, placebo-controlled trial of psychostimulants for the treatment of fatigue in ambulatory patients with human immunodeficiency virus disease. Arch Intern Med 2001; 161:411–420.
- Sarhill N, Walsh D, Nelson KA, Homsi J, LeGrand S, Davis MP. Methylphenidate for fatigue in advanced cancer: a prospective open-label pilot study. Am J Hosp Palliat Care 2001; 18:187–192.
- Minton O, Richardson A, Sharpe M, Hotopf M, Stone P. A systematic review and meta-analysis of the pharmacological treatment of cancer-related fatigue. J Natl Cancer Inst 2008; 100:1155–1166.
- Kaleita TA, Wellisch DK, Graham CA, et al. Pilot study of modafinil for treatment of neurobehavioral dysfunction and fatigue in adult patients with brain tumors (abstract). J Clin Oncol 2006; 24(suppl):58s.
- Morrow GR, Jean-Pierre P, Roscoe JA, et al. A phase III randomized, placebo-controlled, double-blind trial of a eugeroic agent in 642 cancer patients reporting fatigue during chemotherapy: a URCC CCOP study (abstract). J Clin Oncol 2008; 26(suppl):504s.
- Tannock I, Gospodarowicz M, Meakin W, Panzarella T, Stewart L, Rider W. Treatment of metastatic prostatic cancer with low-dose prednisone: evaluation of pain and quality of life as pragmatic indices of response. J Clin Oncol 1989; 7:590–597.
- Morley JE, Thomas DR, Wilson MM. Cachexia: pathophysiology and clinical relevance. Am J Clin Nutr 2006; 83:735–743.
- Poole K, Froggatt K. Loss of weight and loss of appetite in advanced cancer: a problem for the patient, the carer, or the health professional? Palliat Med 2002; 16:499–506.
- Von Roenn JH. Randomized trials of megestrol acetate for AIDS-associated anorexia and cachexia. Oncology 1994; 51(suppl 1):19–24.
- Donnelly S, Walsh TD. Low-dose megestrol acetate for appetite stimulation in advanced cancer. J Pain Symptom Manage 1995; 10:182–183.
- Mulligan K, Zackin R, Von Roenn JH, et al; ACTG 313 Study Team. Testosterone supplementation of megestrol therapy does not enhance lean tissue accrual in men with human immunodeficiency virus-associated weight loss: a randomized, double-blind, placebo-controlled, multicenter trial. J Clin Endocrinol Metab 2007; 92:563–570.
- Navari RM, Brenner MC. Treatment of cancer-related anorexia with olanzapine and megestrol acetate: a randomized trial. Support Care Cancer 2010; 18:951–956.
- Mercadante S, Fulfaro F, Casuccio A. The use of corticosteroids in home palliative care. Support Care Cancer 2001; 9:386–389.
- Walsh D, Kirkova J, Davis MP. The efficacy and tolerability of long-term use of dronabinol in cancer-related anorexia: a case series. J Pain Symptom Manage 2005; 30:493–495.
- Cannabis-In-Cachexia-Study-Group; Strasser F, Luftner D, Possinger K, et al. Comparison of orally administered cannabis extract and delta-9-tetrahydrocannabinol in treating patients with cancer-related anorexia-cachexia syndrome: a multicenter, phase III, randomized, double-blind, placebo-controlled clinical trial from the Cannabis-In-Cachexia-Study-Group. J Clin Oncol 2006; 24:3394–3400.
- Jatoi A, Windschitl HE, Loprinzi CL, et al. Dronabinol versus megestrol acetate versus combination therapy for cancer-associated anorexia: a North Central Cancer Treatment Group study. J Clin Oncol 2002; 20:567–573.
- Winter SM. Terminal nutrition: framing the debate for the withdrawal of nutritional support in terminally ill patients. Am J Med 2000; 109:723–726.
- Drossman DA, Sandler RS, McKee DC, Lovitz AJ. Bowel patterns among subjects not seeking health care. Use of a questionnaire to identify a population with bowel dysfunction. Gastroenterology 1982; 83:529–534.
- McMillan SC. Assessing and managing opiate-induced constipation in adults with cancer. Cancer Control 2004; 11(suppl 3):3–9.
- Robinson CB, Fritch M, Hullett L, et al. Development of a protocol to prevent opioid-induced constipation in patients with cancer: a research utilization project. Clin J Oncol Nurs 2000; 4:79–84.
- Thomas J, Karver S, Cooney GA, et al. Methylnaltrexone for opioid-induced constipation in advanced illness. N Engl J Med 2008; 358:2332–2343.
- Davis MP, Walsh D. Treatment of nausea and vomiting in advanced cancer. Support Care Cancer 2000; 8:444–452.
- Stephenson J, Davies A. An assessment of aetiology-based guidelines for the management of nausea and vomiting in patients with advanced cancer. Support Care Cancer 2006; 14:348–353.
- Lichter I. Results of antiemetic management in terminal illness. J Palliat Care 1993; 9:19–21.
- Bentley A, Boyd K. Use of clinical pictures in the management of nausea and vomiting: a prospective audit. Palliat Med 2001; 15:247–253.
- Glare P, Pereira G, Kristjanson LJ, Stockler M, Tattersall M. Systematic review of the efficacy of antiemetics in the treatment of nausea in patients with far-advanced cancer. Support Care Cancer 2004; 12:432–440.
- Currow DC, Coughlan M, Fardell B, Cooney NJ. Use of ondansetron in palliative medicine. J Pain Symptom Manage 1997; 13:302–307.
- Reuben DB, Mor V. Dyspnea in terminally ill cancer patients. Chest 1986; 89:234–236.
- Fainsinger RL, Waller A, Bercovici M, et al. A multicentre international study of sedation for uncontrolled symptoms in terminally ill patients. Palliat Med 2000; 14:257–265.
- Jennings AL, Davies AN, Higgins JP, Broadley K. Opioids for the palliation of breathlessness in terminal illness. Cochrane Database Syst Rev 2001;CD002066.
- Estfan B, Mahmoud F, Shaheen P, et al. Respiratory function during parenteral opioid titration for cancer pain. Palliat Med 2007; 21:81–86.
- Allen S, Raut S, Woollard J, Vassallo M. Low dose diamorphine reduces breathlessness without causing a fall in oxygen saturation in elderly patients with end-stage idiopathic pulmonary fibrosis. Palliat Med 2005; 19:128–130.
- Polosa R, Simidchiev A, Walters EH. Nebulised morphine for severe interstitial lung disease. Cochrane Database Syst Rev 2002;CD002872.
- Currow DC, Agar M, Smith J, Abernethy AP. Does palliative home oxygen improve dyspnoea? A consecutive cohort study. Palliat Med 2009; 23:309–316.
- Clemens KE, Quednau I, Klaschik E. Use of oxygen and opioids in the palliation of dyspnoea in hypoxic and non-hypoxic palliative care patients: a prospective study. Support Care Cancer 2009; 17:367–377.
- Philip J, Gold M, Milner A, Di Iulio J, Miller B, Spruyt O. A randomized, double-blind, crossover trial of the effect of oxygen on dyspnea in patients with advanced cancer. J Pain Symptom Manage 2006; 32:541–550.
- Donnelly S, Walsh D. The symptoms of advanced cancer. Semin Oncol 1995; 22(2 suppl 3):67–72.
- Walsh D, Rybicki L, Nelson KA, Donnelly S. Symptoms and prognosis in advanced cancer. Support Care Cancer 2002; 10:385–388.
- Komurcu S, Nelson KA, Walsh D, Donnelly SM, Homsi J, Abdullah O. Common symptoms in advanced cancer. Semin Oncol 2000; 27:24–33.
- Homsi J, Walsh D, Rivera N, et al. Symptom evaluation in palliative medicine: patient report vs systematic assessment. Support Care Cancer 2006; 14:444–453.
- Donnelly S. Quality-of-life assessment in advanced cancer. Curr Oncol Rep 2000; 2:338–342.
- Stone P, Richardson A, Ream E, Smith AG, Kerr DJ, Kearney N. Cancer-related fatigue: inevitable, unimportant and untreatable? Results of a multi-centre patient survey. Cancer Fatigue Forum. Ann Oncol 2000; 11:971–975.
- Portenoy RK, Itri LM. Cancer-related fatigue: guidelines for evaluation and management. Oncologist 1999; 4:1–10.
- Berger AM, Abernethy AP, Atkinson A, et al. NCCN Clinical Practice Guidelines in Oncology Cancer-related fatigue—v.1.2010. www.nccn.org/professionals/physician_gls/PDF/fatigue.pdf. Accessed November 15, 2010.
- Schmitz KH, Holtzman J, Courneya KS, Mâsse LC, Duval S, Kane R. Controlled physical activity trials in cancer survivors: a systematic review and meta-analysis. Cancer Epidemiol Biomarkers Prev 2005; 14:1588–1595.
- Porock D, Kristjanson LJ, Tinnelly K, Duke T, Blight J. An exercise intervention for advanced cancer patients experiencing fatigue: a pilot study. J Palliat Care 2000 Autumn; 16:30–36.
- Breitbart W, Rosenfeld B, Kaim M, Funesti-Esch J. A randomized, double-blind, placebo-controlled trial of psychostimulants for the treatment of fatigue in ambulatory patients with human immunodeficiency virus disease. Arch Intern Med 2001; 161:411–420.
- Sarhill N, Walsh D, Nelson KA, Homsi J, LeGrand S, Davis MP. Methylphenidate for fatigue in advanced cancer: a prospective open-label pilot study. Am J Hosp Palliat Care 2001; 18:187–192.
- Minton O, Richardson A, Sharpe M, Hotopf M, Stone P. A systematic review and meta-analysis of the pharmacological treatment of cancer-related fatigue. J Natl Cancer Inst 2008; 100:1155–1166.
- Kaleita TA, Wellisch DK, Graham CA, et al. Pilot study of modafinil for treatment of neurobehavioral dysfunction and fatigue in adult patients with brain tumors (abstract). J Clin Oncol 2006; 24(suppl):58s.
- Morrow GR, Jean-Pierre P, Roscoe JA, et al. A phase III randomized, placebo-controlled, double-blind trial of a eugeroic agent in 642 cancer patients reporting fatigue during chemotherapy: a URCC CCOP study (abstract). J Clin Oncol 2008; 26(suppl):504s.
- Tannock I, Gospodarowicz M, Meakin W, Panzarella T, Stewart L, Rider W. Treatment of metastatic prostatic cancer with low-dose prednisone: evaluation of pain and quality of life as pragmatic indices of response. J Clin Oncol 1989; 7:590–597.
- Morley JE, Thomas DR, Wilson MM. Cachexia: pathophysiology and clinical relevance. Am J Clin Nutr 2006; 83:735–743.
- Poole K, Froggatt K. Loss of weight and loss of appetite in advanced cancer: a problem for the patient, the carer, or the health professional? Palliat Med 2002; 16:499–506.
- Von Roenn JH. Randomized trials of megestrol acetate for AIDS-associated anorexia and cachexia. Oncology 1994; 51(suppl 1):19–24.
- Donnelly S, Walsh TD. Low-dose megestrol acetate for appetite stimulation in advanced cancer. J Pain Symptom Manage 1995; 10:182–183.
- Mulligan K, Zackin R, Von Roenn JH, et al; ACTG 313 Study Team. Testosterone supplementation of megestrol therapy does not enhance lean tissue accrual in men with human immunodeficiency virus-associated weight loss: a randomized, double-blind, placebo-controlled, multicenter trial. J Clin Endocrinol Metab 2007; 92:563–570.
- Navari RM, Brenner MC. Treatment of cancer-related anorexia with olanzapine and megestrol acetate: a randomized trial. Support Care Cancer 2010; 18:951–956.
- Mercadante S, Fulfaro F, Casuccio A. The use of corticosteroids in home palliative care. Support Care Cancer 2001; 9:386–389.
- Walsh D, Kirkova J, Davis MP. The efficacy and tolerability of long-term use of dronabinol in cancer-related anorexia: a case series. J Pain Symptom Manage 2005; 30:493–495.
- Cannabis-In-Cachexia-Study-Group; Strasser F, Luftner D, Possinger K, et al. Comparison of orally administered cannabis extract and delta-9-tetrahydrocannabinol in treating patients with cancer-related anorexia-cachexia syndrome: a multicenter, phase III, randomized, double-blind, placebo-controlled clinical trial from the Cannabis-In-Cachexia-Study-Group. J Clin Oncol 2006; 24:3394–3400.
- Jatoi A, Windschitl HE, Loprinzi CL, et al. Dronabinol versus megestrol acetate versus combination therapy for cancer-associated anorexia: a North Central Cancer Treatment Group study. J Clin Oncol 2002; 20:567–573.
- Winter SM. Terminal nutrition: framing the debate for the withdrawal of nutritional support in terminally ill patients. Am J Med 2000; 109:723–726.
- Drossman DA, Sandler RS, McKee DC, Lovitz AJ. Bowel patterns among subjects not seeking health care. Use of a questionnaire to identify a population with bowel dysfunction. Gastroenterology 1982; 83:529–534.
- McMillan SC. Assessing and managing opiate-induced constipation in adults with cancer. Cancer Control 2004; 11(suppl 3):3–9.
- Robinson CB, Fritch M, Hullett L, et al. Development of a protocol to prevent opioid-induced constipation in patients with cancer: a research utilization project. Clin J Oncol Nurs 2000; 4:79–84.
- Thomas J, Karver S, Cooney GA, et al. Methylnaltrexone for opioid-induced constipation in advanced illness. N Engl J Med 2008; 358:2332–2343.
- Davis MP, Walsh D. Treatment of nausea and vomiting in advanced cancer. Support Care Cancer 2000; 8:444–452.
- Stephenson J, Davies A. An assessment of aetiology-based guidelines for the management of nausea and vomiting in patients with advanced cancer. Support Care Cancer 2006; 14:348–353.
- Lichter I. Results of antiemetic management in terminal illness. J Palliat Care 1993; 9:19–21.
- Bentley A, Boyd K. Use of clinical pictures in the management of nausea and vomiting: a prospective audit. Palliat Med 2001; 15:247–253.
- Glare P, Pereira G, Kristjanson LJ, Stockler M, Tattersall M. Systematic review of the efficacy of antiemetics in the treatment of nausea in patients with far-advanced cancer. Support Care Cancer 2004; 12:432–440.
- Currow DC, Coughlan M, Fardell B, Cooney NJ. Use of ondansetron in palliative medicine. J Pain Symptom Manage 1997; 13:302–307.
- Reuben DB, Mor V. Dyspnea in terminally ill cancer patients. Chest 1986; 89:234–236.
- Fainsinger RL, Waller A, Bercovici M, et al. A multicentre international study of sedation for uncontrolled symptoms in terminally ill patients. Palliat Med 2000; 14:257–265.
- Jennings AL, Davies AN, Higgins JP, Broadley K. Opioids for the palliation of breathlessness in terminal illness. Cochrane Database Syst Rev 2001;CD002066.
- Estfan B, Mahmoud F, Shaheen P, et al. Respiratory function during parenteral opioid titration for cancer pain. Palliat Med 2007; 21:81–86.
- Allen S, Raut S, Woollard J, Vassallo M. Low dose diamorphine reduces breathlessness without causing a fall in oxygen saturation in elderly patients with end-stage idiopathic pulmonary fibrosis. Palliat Med 2005; 19:128–130.
- Polosa R, Simidchiev A, Walters EH. Nebulised morphine for severe interstitial lung disease. Cochrane Database Syst Rev 2002;CD002872.
- Currow DC, Agar M, Smith J, Abernethy AP. Does palliative home oxygen improve dyspnoea? A consecutive cohort study. Palliat Med 2009; 23:309–316.
- Clemens KE, Quednau I, Klaschik E. Use of oxygen and opioids in the palliation of dyspnoea in hypoxic and non-hypoxic palliative care patients: a prospective study. Support Care Cancer 2009; 17:367–377.
- Philip J, Gold M, Milner A, Di Iulio J, Miller B, Spruyt O. A randomized, double-blind, crossover trial of the effect of oxygen on dyspnea in patients with advanced cancer. J Pain Symptom Manage 2006; 32:541–550.
KEY POINTS
- Patients with advanced cancer typically suffer from multiple concurrent symptoms, which they rate as moderate or severe.
- The principles of symptom management include taking an aggressive detailed approach, prioritizing, and identifying symptom pathophysiology.
- Prescribed regimens should be specific and simple; physicians should consider the patient’s age and fragility, the cost of the treatment, and anticipated drug side effects.
- To ensure optimal palliation with the fewest possible adverse effects, reassess frequently, make one change at a time, and use rescue doses.
A 31-year-old man with abdominal pain and a rectal nodule
A 31-year-old man presents to the emergency department with abdominal pain and diarrhea, which began 4 days ago. The pain is in both of the lower quadrants, is crampy and persistent, and is relieved with bowel movements. He has been having watery stools five to six times per day, without frank blood.
He reports no fevers, chills, nausea, or vomiting, and he has never travelled outside the country. He underwent laparotomy 6 months ago for a gunshot wound. He takes no prescription drugs. He smokes and he drinks alcohol, and he says he has used heroin and oxycodone recreationally.
His blood pressure is 134/74 mm Hg, and he is afebrile. An abdominal examination reveals no mass or tenderness.
Results of a complete blood count, serum chemistry panel, and serum amylase level are normal. His lipase level is slightly elevated at 80 U/L (reference range 12–70). His stool is negative for Clostridium difficile toxin on enzyme immunoassay.
Computed tomography of the abdomen reveals diffuse pericolonic hyperemia and possible thickening of the rectosigmoid colon, raising the concern that he might have infectious or inflammatory colitis. The patient is admitted for further evaluation.
Colonoscopy to evaluate the abnormalities on computed tomography finds only a 5-mm submucosal nodule in the rectum (Figure 1). Biopsy of the nodule shows it to be a well-differentiated neuroendocrine neoplasm (carcinoid tumor). Random colon biopsy samples are normal.
The patient’s symptoms resolve over the next 24 hours without any treatment.
WHAT EXPLAINS THE PATIENT’S SYMPTOMS?
1. Which of the following best explains the patient’s clinical presentation?
- Narcotic withdrawal
- Carcinoid syndrome
- Viral gastroenteritis
- Acute pancreatitis
Viral gastroenteritis is common and affects people of all ages. The very young and the elderly are at higher risk of adverse outcomes, but few people die of it in the United States.
Our patient’s symptoms were consistent with viral gastroenteritis that resolved spontaneously while he received only supportive care.
Narcotic withdrawal can also cause watery stools and abdominal pain. However, this patient lacked other signs and symptoms of withdrawal, and his symptoms improved without any detoxification or maintenance treatment.
Pancreatitis. Although the patient had a mildly elevated lipase level, his lack of nausea and vomiting and the location of the pain were not consistent with acute pancreatitis.
Carcinoid syndrome. Carcinoid tumors are rare, typically indolent neuroendocrine neoplasms. The carcinoid syndrome consists of cutaneous flushing, gut hypermotility with diarrhea, and bronchospasm.1–5 Our patient did not have the full range of these symptoms. However, the presentation of carcinoid tumors varies broadly depending on the location, morphology, or biology of the tumor.6 Although our patient had diarrhea, his symptoms improved without any specific treatment. Rectal carcinoid tumors rarely cause diarrhea, and therefore the tumor noted on colonoscopy was almost certainly an incidental finding unrelated to his clinical presentation.
The classic symptoms are caused by production of 5-hydroxyindoleacetic acid, typically by a carcinoid tumor of the small bowel. Rectal carcinoids do not produce the 5-hydroxyindoleacetic acid responsible for this “malignant” serotonin-driven syndrome and are typically asymptomatic. When rectal carcinoid tumors are symptomatic, patients may have symptoms of local irritation or obstruction, such as hematochezia, constipation, other changes in bowel habits, rectal pain, pruritis ani, or weight loss.2,7
Nearly 50% of rectal carcinoid tumors are discovered incidentally. The National Cancer Institute’s Surveillance, Epidemiology, and End Results (SEER) registry database documented a 10-fold increase in the incidence of rectal carcinoids in the last 35 years, attributed in part to an increase in screening colonoscopy.8 Furthermore, although studies of large national or multicenter databases have found that 65% to 80% of all rectal carcinoid tumors are smaller than 1.0 cm, 93.3% to 100% of those discovered on screening endoscopy were 1.0 cm or smaller.8
Rectal carcinoid tumors have a characteristic feel on digital examination, with a hard, “buckshot” consistency, and are freely mobile.5 They have also been described as firm, nodular, rubbery, yellow, submucosal, and polypoid.8
WHERE DO CARCINOID TUMORS TEND TO ARISE?
2. Which of the following sites is the most commonly recognized site of a primary carcinoid tumor?
- Small bowel
- Lung
- Liver
- Pancreas
- Rectum
The small bowel is the most common site.
Carcinoid tumors derive from neoplastic proliferation of cells of the diffuse neuroendocrine system. Therefore, they can be found anywhere neuroendocrine cells are present, commonly in the gastrointestinal tract, urogenital tract, and the bronchial epithelium.
Traditionally, neuroendocrine tumors were classified by their embryologic origin: foregut (including the respiratory tract, thymus, stomach, and pancreas), midgut (including the small intestine, appendix, and right colon), and hindgut (including the transverse, descending, and sigmoid colon and rectum). Functionally, this was sensible, as each class of tumors presented similarly due to the similar hormonal secretory products.2,3,9
A 2004 population-based review of the SEER database10 classified incidence rates of carcinoid tumors and their distribution throughout the body. Most (54.5%) were discovered in the gastrointestinal tract, and of these, 44.7% were in the small intestine, 19.6% were in the rectum, 16.7% were in the appendix, 10.6% were in the colon, 7.2% were in the stomach, and the remaining 1.2% were at other gastrointestinal sites. Nongastrointestinal sites included the lungs and bronchi (30.1%), pancreas (2.3%), female reproductive tract and ovaries (1.2%), biliary system (1.1%), and head and neck (0.4%).10
The incidence rates have increased and the distribution of sites in the body has changed over time. For example, the appendix was once considered the site of highest incidence, with tumors often discovered incidentally during surgical resection. However, these data were based on anecdotal or single-institution reports and so may have been subject to reporting bias. According to the SEER data, the small intestine is now the leading site, perhaps because of increased awareness or improved diagnostic technology and imaging.10,11
The liver is a common site of metastasis, but it is an exceptionally rare location for a primary tumor.
HOW SHOULD THIS PATIENT BE MANAGED?
3. What is the appropriate management of rectal carcinoid in this patient?
- Since the nodule is 1.0 cm or smaller, watchful waiting is acceptable
- Since the nodule is 1.0 cm or smaller, local excision is appropriate, and no follow-up is required
- Because all carcinoid tumors are potentially malignant, radical resection (eg, abdominal perineal resection) is appropriate
- Because all carcinoid tumors are potentially malignant, radical resection with chemotherapy with 5-fluorouracil (Adrucil) and doxorubicin (Adriamycin) is required
Since the nodule is 1.0 cm or smaller, local excision is appropriate, and no follow-up will be required. Rectal carcinoid tumors generally have a favorable prognosis, with a 5-year survival rate of 87.5%.10
PROGNOSIS DEPENDS ON TUMOR SIZE, OTHER FACTORS
Many studies have examined risk factors contributing to poor prognosis, and this is an area of active study. Early research categorized rectal carcinoid risk in terms of tumor diameter, and this is still widely used to guide management. As early as 1959, Hanley et al5 recognized that tumors that were likely to metastasize were often larger than 1 cm, had infiltrated the muscularis, or were ulcerated. Today, it is understood that only 3% to 10% of rectal carcinoids smaller than 1 cm metastasize, whereas 17% to 42% of those 1 to 2 cm and 60% to 80% of those larger than 2 cm do.2,8,12,13
However, size is not the only consideration. Wang et al12 showed that muscular invasion is an independent risk factor for survival, and that tumor diameter is a significant predictor of invasion and metastasis. Similarly, a metaanalysis by Mani et al13 recognized tumor size and muscularis invasion as the most important predictors of malignancy in these neoplasms.
To aid in predicting prognosis, staging systems have been developed from institutional or national registries. Landry et al14 developed a TNM (tumor, node, metastasis) staging system for rectal carcinoids, in which the T value was based on tumor size and degree of invasion. A group at Memorial-Sloan Kettering Cancer Center15 developed a system for risk stratification of carcinoid of the rectum that is based on tumor size, muscularis invasion, lymphovascular invasion, and the mitotic rate.
TREATMENT IS BY EXCISION
Despite these new prognostic systems, there is no new guidance on therapeutic management. Surgical therapy is still largely guided by tumor size.
Lesions smaller than 1 cm are resected endoscopically or by another local transanal technique.2,3,15,16 Standard endoscopic mucosal resection is performed, and recent studies have suggested that endoscopic submucosal dissection is as effective17 or even preferred, because it resects to the deeper submucosa (as the name suggests).18 This en bloc technique may be appropriate for lesions with evidence of local invasion.18 Other situations may call for deeper resection, such as transanal resection for higher lesions and full-thickness mucosal-muscularis resection.
Tumors 1 to 2 cm are currently evaluated for other factors such as ulceration and umbilication, which influence the choice of local vs radical resection. Otherwise, there is little guidance for tumors of 1 to 2 cm.
Tumors larger than 2 cm have a high risk of muscularis invasion and metastasis, and hence they are resected with wide margins and imaging is then used to evaluate for metastasis.8,19 In cases of metastasis, local resection is often palliative, providing local symptom relief.19
AN INCIDENTALLY DISCOVERED CASE; PATIENT LOST TO FOLLOW-UP
Our patient’s case is typical of rectal carcinoid in that it was discovered incidentally during colonoscopy. His clinical presentation was likely unrelated to his carcinoid tumor, and he improved without specific treatment. His symptoms resolved within 24 hours with supportive treatment and he was discharged.
Pathologic confirmation of carcinoid tumor occurred after his discharge. Despite persistent attempts to contact the patient, he never returned for a follow-up appointment.
TAKE-HOME POINTS
- Carcinoid tumors are rare neoplasms of neuroendocrine origin.
- Rectal carcinoids are the third most common carcinoid of the gastrointestinal tract.
- Most rectal carcinoids are asymptomatic.
- Diagnosis is most often incidental and histologic.
- Treatment is by excision.
- Prognosis is favorable for smaller carcinoids and depends on size (and therefore, invasion).
- Thorson A, Biorck G, Bjorkman G, Waldenstrom J. Malignant carcinoid of the small intestine with metastases to the liver, valvular disease of the right side of the heart (pulmonary stenosis and tricuspid regurgitation without septal defects), peripheral vasomotor symptoms, bronchoconstriction, and an unusual type of cyanosis; a clinical and pathologic syndrome. Am Heart J 1954; 47:795–817.
- Wang AY, Ahmad NA. Rectal carcinoids. Curr Opin Gastroenterol 2006; 22:529–535.
- Modlin IM, Kidd M, Latich I, Zikusoka MN, Shapiro MD. Current status of gastrointestinal carcinoids. Gastroenterology 2005; 128:1717–1751.
- Aggarwal G, Obideen K, Wehbi M. Carcinoid tumors: what should increase our suspicion? Cleve Clin J Med 2008; 75:849–855.
- Hanley PH, Hines MO, Ray J, Armstrong R. Carcinoid tumors of the rectum. Experience with 26 cases. Proc R Soc Med 1959; 52(suppl):113–117.
- Pasieka JL. Carcinoid tumors. Surg Clin North Am 2009; 89:1123–1137.
- Jetmore AB, Ray JE, Gathright JB, McMullen KM, Hicks TC, Timmcke AE. Rectal carcinoids: the most frequent carcinoid tumor. Dis Colon Rectum 1992; 35:717–725.
- Scherübl H. Rectal carcinoids are on the rise: early detection by screening endoscopy. Endoscopy 2009; 41:162–165.
- Wilander E, Lundqvist M, Oberg K. Gastrointestinal carcinoid tumours. Histogenetic, histochemical, immunohistochemical, clinical and therapeutic aspects. Prog Histochem Cytochem 1989; 19:1–88.
- Maggard MA, O’Connell JB, Ko CY. Updated population-based review of carcinoid tumors. Ann Surg 2004; 240:117–122.
- Modlin IM, Sandor A. An analyisis of 8,305 cases of carcinoid tumors. Cancer 1997; 79:813–829.
- Wang M, Peng J, Yang W, Chen W, Mo S, Cai S. Prognostic analysis for carcinoid tumors of the rectum: a single institutional analysis of 106 cases. Colorectal Dis 2009; Epub ahead of print.
- Mani S, Modlin IM, Ballantyne G, Ahlman H, West B. Carcinoids of the rectum. J Am Coll Surg 1994; 179:231–248.
- Landry CS, Brock G, Scoggins CR, McMasters KM, Martin RC. A proposed staging system for rectal carcinoid tumors based on an analysis of 4701 patients. Surgery 2008; 144:460–466.
- Fahy BN, Tang LH, Klimstra D, et al. Carcinoid of the rectum risk stratification (CaRRs): a strategy for preoperative outcome assessment. Ann Surg Oncol 2007; 14:1735–1743.
- Shirouzu K, Isomoto H, Kakegawa T, Morimatsu M. Treatment of rectal carcinoid tumors. Am J Surg 1990; 160:262–265.
- Baek IH. Endoscopic submucosal dissection or conventional endoscopic mucosal resection is an effective and safe treatment for rectal carcinoid tumors: a retrospective study. J Laparoendosc Adv Surg Tech A 2010; 20:329–331.
- Yamaguchi N, Isomoto H, Nishiyama H, et al. Endoscopic submucosal dissection for rectal carcinoid tumors. Surg Endosc 2010; 24:504–508.
- Ramage JK, Goretzki PE, Manfredi R, et al; Frascati Consensus Conference participants. Consensus guidelines for the management of patients with digestive neuroendocrine tumours: well-differentiated colon and rectum tumour/carcinoma. Neuroendocrinology 2008; 87:31–39.
A 31-year-old man presents to the emergency department with abdominal pain and diarrhea, which began 4 days ago. The pain is in both of the lower quadrants, is crampy and persistent, and is relieved with bowel movements. He has been having watery stools five to six times per day, without frank blood.
He reports no fevers, chills, nausea, or vomiting, and he has never travelled outside the country. He underwent laparotomy 6 months ago for a gunshot wound. He takes no prescription drugs. He smokes and he drinks alcohol, and he says he has used heroin and oxycodone recreationally.
His blood pressure is 134/74 mm Hg, and he is afebrile. An abdominal examination reveals no mass or tenderness.
Results of a complete blood count, serum chemistry panel, and serum amylase level are normal. His lipase level is slightly elevated at 80 U/L (reference range 12–70). His stool is negative for Clostridium difficile toxin on enzyme immunoassay.
Computed tomography of the abdomen reveals diffuse pericolonic hyperemia and possible thickening of the rectosigmoid colon, raising the concern that he might have infectious or inflammatory colitis. The patient is admitted for further evaluation.
Colonoscopy to evaluate the abnormalities on computed tomography finds only a 5-mm submucosal nodule in the rectum (Figure 1). Biopsy of the nodule shows it to be a well-differentiated neuroendocrine neoplasm (carcinoid tumor). Random colon biopsy samples are normal.
The patient’s symptoms resolve over the next 24 hours without any treatment.
WHAT EXPLAINS THE PATIENT’S SYMPTOMS?
1. Which of the following best explains the patient’s clinical presentation?
- Narcotic withdrawal
- Carcinoid syndrome
- Viral gastroenteritis
- Acute pancreatitis
Viral gastroenteritis is common and affects people of all ages. The very young and the elderly are at higher risk of adverse outcomes, but few people die of it in the United States.
Our patient’s symptoms were consistent with viral gastroenteritis that resolved spontaneously while he received only supportive care.
Narcotic withdrawal can also cause watery stools and abdominal pain. However, this patient lacked other signs and symptoms of withdrawal, and his symptoms improved without any detoxification or maintenance treatment.
Pancreatitis. Although the patient had a mildly elevated lipase level, his lack of nausea and vomiting and the location of the pain were not consistent with acute pancreatitis.
Carcinoid syndrome. Carcinoid tumors are rare, typically indolent neuroendocrine neoplasms. The carcinoid syndrome consists of cutaneous flushing, gut hypermotility with diarrhea, and bronchospasm.1–5 Our patient did not have the full range of these symptoms. However, the presentation of carcinoid tumors varies broadly depending on the location, morphology, or biology of the tumor.6 Although our patient had diarrhea, his symptoms improved without any specific treatment. Rectal carcinoid tumors rarely cause diarrhea, and therefore the tumor noted on colonoscopy was almost certainly an incidental finding unrelated to his clinical presentation.
The classic symptoms are caused by production of 5-hydroxyindoleacetic acid, typically by a carcinoid tumor of the small bowel. Rectal carcinoids do not produce the 5-hydroxyindoleacetic acid responsible for this “malignant” serotonin-driven syndrome and are typically asymptomatic. When rectal carcinoid tumors are symptomatic, patients may have symptoms of local irritation or obstruction, such as hematochezia, constipation, other changes in bowel habits, rectal pain, pruritis ani, or weight loss.2,7
Nearly 50% of rectal carcinoid tumors are discovered incidentally. The National Cancer Institute’s Surveillance, Epidemiology, and End Results (SEER) registry database documented a 10-fold increase in the incidence of rectal carcinoids in the last 35 years, attributed in part to an increase in screening colonoscopy.8 Furthermore, although studies of large national or multicenter databases have found that 65% to 80% of all rectal carcinoid tumors are smaller than 1.0 cm, 93.3% to 100% of those discovered on screening endoscopy were 1.0 cm or smaller.8
Rectal carcinoid tumors have a characteristic feel on digital examination, with a hard, “buckshot” consistency, and are freely mobile.5 They have also been described as firm, nodular, rubbery, yellow, submucosal, and polypoid.8
WHERE DO CARCINOID TUMORS TEND TO ARISE?
2. Which of the following sites is the most commonly recognized site of a primary carcinoid tumor?
- Small bowel
- Lung
- Liver
- Pancreas
- Rectum
The small bowel is the most common site.
Carcinoid tumors derive from neoplastic proliferation of cells of the diffuse neuroendocrine system. Therefore, they can be found anywhere neuroendocrine cells are present, commonly in the gastrointestinal tract, urogenital tract, and the bronchial epithelium.
Traditionally, neuroendocrine tumors were classified by their embryologic origin: foregut (including the respiratory tract, thymus, stomach, and pancreas), midgut (including the small intestine, appendix, and right colon), and hindgut (including the transverse, descending, and sigmoid colon and rectum). Functionally, this was sensible, as each class of tumors presented similarly due to the similar hormonal secretory products.2,3,9
A 2004 population-based review of the SEER database10 classified incidence rates of carcinoid tumors and their distribution throughout the body. Most (54.5%) were discovered in the gastrointestinal tract, and of these, 44.7% were in the small intestine, 19.6% were in the rectum, 16.7% were in the appendix, 10.6% were in the colon, 7.2% were in the stomach, and the remaining 1.2% were at other gastrointestinal sites. Nongastrointestinal sites included the lungs and bronchi (30.1%), pancreas (2.3%), female reproductive tract and ovaries (1.2%), biliary system (1.1%), and head and neck (0.4%).10
The incidence rates have increased and the distribution of sites in the body has changed over time. For example, the appendix was once considered the site of highest incidence, with tumors often discovered incidentally during surgical resection. However, these data were based on anecdotal or single-institution reports and so may have been subject to reporting bias. According to the SEER data, the small intestine is now the leading site, perhaps because of increased awareness or improved diagnostic technology and imaging.10,11
The liver is a common site of metastasis, but it is an exceptionally rare location for a primary tumor.
HOW SHOULD THIS PATIENT BE MANAGED?
3. What is the appropriate management of rectal carcinoid in this patient?
- Since the nodule is 1.0 cm or smaller, watchful waiting is acceptable
- Since the nodule is 1.0 cm or smaller, local excision is appropriate, and no follow-up is required
- Because all carcinoid tumors are potentially malignant, radical resection (eg, abdominal perineal resection) is appropriate
- Because all carcinoid tumors are potentially malignant, radical resection with chemotherapy with 5-fluorouracil (Adrucil) and doxorubicin (Adriamycin) is required
Since the nodule is 1.0 cm or smaller, local excision is appropriate, and no follow-up will be required. Rectal carcinoid tumors generally have a favorable prognosis, with a 5-year survival rate of 87.5%.10
PROGNOSIS DEPENDS ON TUMOR SIZE, OTHER FACTORS
Many studies have examined risk factors contributing to poor prognosis, and this is an area of active study. Early research categorized rectal carcinoid risk in terms of tumor diameter, and this is still widely used to guide management. As early as 1959, Hanley et al5 recognized that tumors that were likely to metastasize were often larger than 1 cm, had infiltrated the muscularis, or were ulcerated. Today, it is understood that only 3% to 10% of rectal carcinoids smaller than 1 cm metastasize, whereas 17% to 42% of those 1 to 2 cm and 60% to 80% of those larger than 2 cm do.2,8,12,13
However, size is not the only consideration. Wang et al12 showed that muscular invasion is an independent risk factor for survival, and that tumor diameter is a significant predictor of invasion and metastasis. Similarly, a metaanalysis by Mani et al13 recognized tumor size and muscularis invasion as the most important predictors of malignancy in these neoplasms.
To aid in predicting prognosis, staging systems have been developed from institutional or national registries. Landry et al14 developed a TNM (tumor, node, metastasis) staging system for rectal carcinoids, in which the T value was based on tumor size and degree of invasion. A group at Memorial-Sloan Kettering Cancer Center15 developed a system for risk stratification of carcinoid of the rectum that is based on tumor size, muscularis invasion, lymphovascular invasion, and the mitotic rate.
TREATMENT IS BY EXCISION
Despite these new prognostic systems, there is no new guidance on therapeutic management. Surgical therapy is still largely guided by tumor size.
Lesions smaller than 1 cm are resected endoscopically or by another local transanal technique.2,3,15,16 Standard endoscopic mucosal resection is performed, and recent studies have suggested that endoscopic submucosal dissection is as effective17 or even preferred, because it resects to the deeper submucosa (as the name suggests).18 This en bloc technique may be appropriate for lesions with evidence of local invasion.18 Other situations may call for deeper resection, such as transanal resection for higher lesions and full-thickness mucosal-muscularis resection.
Tumors 1 to 2 cm are currently evaluated for other factors such as ulceration and umbilication, which influence the choice of local vs radical resection. Otherwise, there is little guidance for tumors of 1 to 2 cm.
Tumors larger than 2 cm have a high risk of muscularis invasion and metastasis, and hence they are resected with wide margins and imaging is then used to evaluate for metastasis.8,19 In cases of metastasis, local resection is often palliative, providing local symptom relief.19
AN INCIDENTALLY DISCOVERED CASE; PATIENT LOST TO FOLLOW-UP
Our patient’s case is typical of rectal carcinoid in that it was discovered incidentally during colonoscopy. His clinical presentation was likely unrelated to his carcinoid tumor, and he improved without specific treatment. His symptoms resolved within 24 hours with supportive treatment and he was discharged.
Pathologic confirmation of carcinoid tumor occurred after his discharge. Despite persistent attempts to contact the patient, he never returned for a follow-up appointment.
TAKE-HOME POINTS
- Carcinoid tumors are rare neoplasms of neuroendocrine origin.
- Rectal carcinoids are the third most common carcinoid of the gastrointestinal tract.
- Most rectal carcinoids are asymptomatic.
- Diagnosis is most often incidental and histologic.
- Treatment is by excision.
- Prognosis is favorable for smaller carcinoids and depends on size (and therefore, invasion).
A 31-year-old man presents to the emergency department with abdominal pain and diarrhea, which began 4 days ago. The pain is in both of the lower quadrants, is crampy and persistent, and is relieved with bowel movements. He has been having watery stools five to six times per day, without frank blood.
He reports no fevers, chills, nausea, or vomiting, and he has never travelled outside the country. He underwent laparotomy 6 months ago for a gunshot wound. He takes no prescription drugs. He smokes and he drinks alcohol, and he says he has used heroin and oxycodone recreationally.
His blood pressure is 134/74 mm Hg, and he is afebrile. An abdominal examination reveals no mass or tenderness.
Results of a complete blood count, serum chemistry panel, and serum amylase level are normal. His lipase level is slightly elevated at 80 U/L (reference range 12–70). His stool is negative for Clostridium difficile toxin on enzyme immunoassay.
Computed tomography of the abdomen reveals diffuse pericolonic hyperemia and possible thickening of the rectosigmoid colon, raising the concern that he might have infectious or inflammatory colitis. The patient is admitted for further evaluation.
Colonoscopy to evaluate the abnormalities on computed tomography finds only a 5-mm submucosal nodule in the rectum (Figure 1). Biopsy of the nodule shows it to be a well-differentiated neuroendocrine neoplasm (carcinoid tumor). Random colon biopsy samples are normal.
The patient’s symptoms resolve over the next 24 hours without any treatment.
WHAT EXPLAINS THE PATIENT’S SYMPTOMS?
1. Which of the following best explains the patient’s clinical presentation?
- Narcotic withdrawal
- Carcinoid syndrome
- Viral gastroenteritis
- Acute pancreatitis
Viral gastroenteritis is common and affects people of all ages. The very young and the elderly are at higher risk of adverse outcomes, but few people die of it in the United States.
Our patient’s symptoms were consistent with viral gastroenteritis that resolved spontaneously while he received only supportive care.
Narcotic withdrawal can also cause watery stools and abdominal pain. However, this patient lacked other signs and symptoms of withdrawal, and his symptoms improved without any detoxification or maintenance treatment.
Pancreatitis. Although the patient had a mildly elevated lipase level, his lack of nausea and vomiting and the location of the pain were not consistent with acute pancreatitis.
Carcinoid syndrome. Carcinoid tumors are rare, typically indolent neuroendocrine neoplasms. The carcinoid syndrome consists of cutaneous flushing, gut hypermotility with diarrhea, and bronchospasm.1–5 Our patient did not have the full range of these symptoms. However, the presentation of carcinoid tumors varies broadly depending on the location, morphology, or biology of the tumor.6 Although our patient had diarrhea, his symptoms improved without any specific treatment. Rectal carcinoid tumors rarely cause diarrhea, and therefore the tumor noted on colonoscopy was almost certainly an incidental finding unrelated to his clinical presentation.
The classic symptoms are caused by production of 5-hydroxyindoleacetic acid, typically by a carcinoid tumor of the small bowel. Rectal carcinoids do not produce the 5-hydroxyindoleacetic acid responsible for this “malignant” serotonin-driven syndrome and are typically asymptomatic. When rectal carcinoid tumors are symptomatic, patients may have symptoms of local irritation or obstruction, such as hematochezia, constipation, other changes in bowel habits, rectal pain, pruritis ani, or weight loss.2,7
Nearly 50% of rectal carcinoid tumors are discovered incidentally. The National Cancer Institute’s Surveillance, Epidemiology, and End Results (SEER) registry database documented a 10-fold increase in the incidence of rectal carcinoids in the last 35 years, attributed in part to an increase in screening colonoscopy.8 Furthermore, although studies of large national or multicenter databases have found that 65% to 80% of all rectal carcinoid tumors are smaller than 1.0 cm, 93.3% to 100% of those discovered on screening endoscopy were 1.0 cm or smaller.8
Rectal carcinoid tumors have a characteristic feel on digital examination, with a hard, “buckshot” consistency, and are freely mobile.5 They have also been described as firm, nodular, rubbery, yellow, submucosal, and polypoid.8
WHERE DO CARCINOID TUMORS TEND TO ARISE?
2. Which of the following sites is the most commonly recognized site of a primary carcinoid tumor?
- Small bowel
- Lung
- Liver
- Pancreas
- Rectum
The small bowel is the most common site.
Carcinoid tumors derive from neoplastic proliferation of cells of the diffuse neuroendocrine system. Therefore, they can be found anywhere neuroendocrine cells are present, commonly in the gastrointestinal tract, urogenital tract, and the bronchial epithelium.
Traditionally, neuroendocrine tumors were classified by their embryologic origin: foregut (including the respiratory tract, thymus, stomach, and pancreas), midgut (including the small intestine, appendix, and right colon), and hindgut (including the transverse, descending, and sigmoid colon and rectum). Functionally, this was sensible, as each class of tumors presented similarly due to the similar hormonal secretory products.2,3,9
A 2004 population-based review of the SEER database10 classified incidence rates of carcinoid tumors and their distribution throughout the body. Most (54.5%) were discovered in the gastrointestinal tract, and of these, 44.7% were in the small intestine, 19.6% were in the rectum, 16.7% were in the appendix, 10.6% were in the colon, 7.2% were in the stomach, and the remaining 1.2% were at other gastrointestinal sites. Nongastrointestinal sites included the lungs and bronchi (30.1%), pancreas (2.3%), female reproductive tract and ovaries (1.2%), biliary system (1.1%), and head and neck (0.4%).10
The incidence rates have increased and the distribution of sites in the body has changed over time. For example, the appendix was once considered the site of highest incidence, with tumors often discovered incidentally during surgical resection. However, these data were based on anecdotal or single-institution reports and so may have been subject to reporting bias. According to the SEER data, the small intestine is now the leading site, perhaps because of increased awareness or improved diagnostic technology and imaging.10,11
The liver is a common site of metastasis, but it is an exceptionally rare location for a primary tumor.
HOW SHOULD THIS PATIENT BE MANAGED?
3. What is the appropriate management of rectal carcinoid in this patient?
- Since the nodule is 1.0 cm or smaller, watchful waiting is acceptable
- Since the nodule is 1.0 cm or smaller, local excision is appropriate, and no follow-up is required
- Because all carcinoid tumors are potentially malignant, radical resection (eg, abdominal perineal resection) is appropriate
- Because all carcinoid tumors are potentially malignant, radical resection with chemotherapy with 5-fluorouracil (Adrucil) and doxorubicin (Adriamycin) is required
Since the nodule is 1.0 cm or smaller, local excision is appropriate, and no follow-up will be required. Rectal carcinoid tumors generally have a favorable prognosis, with a 5-year survival rate of 87.5%.10
PROGNOSIS DEPENDS ON TUMOR SIZE, OTHER FACTORS
Many studies have examined risk factors contributing to poor prognosis, and this is an area of active study. Early research categorized rectal carcinoid risk in terms of tumor diameter, and this is still widely used to guide management. As early as 1959, Hanley et al5 recognized that tumors that were likely to metastasize were often larger than 1 cm, had infiltrated the muscularis, or were ulcerated. Today, it is understood that only 3% to 10% of rectal carcinoids smaller than 1 cm metastasize, whereas 17% to 42% of those 1 to 2 cm and 60% to 80% of those larger than 2 cm do.2,8,12,13
However, size is not the only consideration. Wang et al12 showed that muscular invasion is an independent risk factor for survival, and that tumor diameter is a significant predictor of invasion and metastasis. Similarly, a metaanalysis by Mani et al13 recognized tumor size and muscularis invasion as the most important predictors of malignancy in these neoplasms.
To aid in predicting prognosis, staging systems have been developed from institutional or national registries. Landry et al14 developed a TNM (tumor, node, metastasis) staging system for rectal carcinoids, in which the T value was based on tumor size and degree of invasion. A group at Memorial-Sloan Kettering Cancer Center15 developed a system for risk stratification of carcinoid of the rectum that is based on tumor size, muscularis invasion, lymphovascular invasion, and the mitotic rate.
TREATMENT IS BY EXCISION
Despite these new prognostic systems, there is no new guidance on therapeutic management. Surgical therapy is still largely guided by tumor size.
Lesions smaller than 1 cm are resected endoscopically or by another local transanal technique.2,3,15,16 Standard endoscopic mucosal resection is performed, and recent studies have suggested that endoscopic submucosal dissection is as effective17 or even preferred, because it resects to the deeper submucosa (as the name suggests).18 This en bloc technique may be appropriate for lesions with evidence of local invasion.18 Other situations may call for deeper resection, such as transanal resection for higher lesions and full-thickness mucosal-muscularis resection.
Tumors 1 to 2 cm are currently evaluated for other factors such as ulceration and umbilication, which influence the choice of local vs radical resection. Otherwise, there is little guidance for tumors of 1 to 2 cm.
Tumors larger than 2 cm have a high risk of muscularis invasion and metastasis, and hence they are resected with wide margins and imaging is then used to evaluate for metastasis.8,19 In cases of metastasis, local resection is often palliative, providing local symptom relief.19
AN INCIDENTALLY DISCOVERED CASE; PATIENT LOST TO FOLLOW-UP
Our patient’s case is typical of rectal carcinoid in that it was discovered incidentally during colonoscopy. His clinical presentation was likely unrelated to his carcinoid tumor, and he improved without specific treatment. His symptoms resolved within 24 hours with supportive treatment and he was discharged.
Pathologic confirmation of carcinoid tumor occurred after his discharge. Despite persistent attempts to contact the patient, he never returned for a follow-up appointment.
TAKE-HOME POINTS
- Carcinoid tumors are rare neoplasms of neuroendocrine origin.
- Rectal carcinoids are the third most common carcinoid of the gastrointestinal tract.
- Most rectal carcinoids are asymptomatic.
- Diagnosis is most often incidental and histologic.
- Treatment is by excision.
- Prognosis is favorable for smaller carcinoids and depends on size (and therefore, invasion).
- Thorson A, Biorck G, Bjorkman G, Waldenstrom J. Malignant carcinoid of the small intestine with metastases to the liver, valvular disease of the right side of the heart (pulmonary stenosis and tricuspid regurgitation without septal defects), peripheral vasomotor symptoms, bronchoconstriction, and an unusual type of cyanosis; a clinical and pathologic syndrome. Am Heart J 1954; 47:795–817.
- Wang AY, Ahmad NA. Rectal carcinoids. Curr Opin Gastroenterol 2006; 22:529–535.
- Modlin IM, Kidd M, Latich I, Zikusoka MN, Shapiro MD. Current status of gastrointestinal carcinoids. Gastroenterology 2005; 128:1717–1751.
- Aggarwal G, Obideen K, Wehbi M. Carcinoid tumors: what should increase our suspicion? Cleve Clin J Med 2008; 75:849–855.
- Hanley PH, Hines MO, Ray J, Armstrong R. Carcinoid tumors of the rectum. Experience with 26 cases. Proc R Soc Med 1959; 52(suppl):113–117.
- Pasieka JL. Carcinoid tumors. Surg Clin North Am 2009; 89:1123–1137.
- Jetmore AB, Ray JE, Gathright JB, McMullen KM, Hicks TC, Timmcke AE. Rectal carcinoids: the most frequent carcinoid tumor. Dis Colon Rectum 1992; 35:717–725.
- Scherübl H. Rectal carcinoids are on the rise: early detection by screening endoscopy. Endoscopy 2009; 41:162–165.
- Wilander E, Lundqvist M, Oberg K. Gastrointestinal carcinoid tumours. Histogenetic, histochemical, immunohistochemical, clinical and therapeutic aspects. Prog Histochem Cytochem 1989; 19:1–88.
- Maggard MA, O’Connell JB, Ko CY. Updated population-based review of carcinoid tumors. Ann Surg 2004; 240:117–122.
- Modlin IM, Sandor A. An analyisis of 8,305 cases of carcinoid tumors. Cancer 1997; 79:813–829.
- Wang M, Peng J, Yang W, Chen W, Mo S, Cai S. Prognostic analysis for carcinoid tumors of the rectum: a single institutional analysis of 106 cases. Colorectal Dis 2009; Epub ahead of print.
- Mani S, Modlin IM, Ballantyne G, Ahlman H, West B. Carcinoids of the rectum. J Am Coll Surg 1994; 179:231–248.
- Landry CS, Brock G, Scoggins CR, McMasters KM, Martin RC. A proposed staging system for rectal carcinoid tumors based on an analysis of 4701 patients. Surgery 2008; 144:460–466.
- Fahy BN, Tang LH, Klimstra D, et al. Carcinoid of the rectum risk stratification (CaRRs): a strategy for preoperative outcome assessment. Ann Surg Oncol 2007; 14:1735–1743.
- Shirouzu K, Isomoto H, Kakegawa T, Morimatsu M. Treatment of rectal carcinoid tumors. Am J Surg 1990; 160:262–265.
- Baek IH. Endoscopic submucosal dissection or conventional endoscopic mucosal resection is an effective and safe treatment for rectal carcinoid tumors: a retrospective study. J Laparoendosc Adv Surg Tech A 2010; 20:329–331.
- Yamaguchi N, Isomoto H, Nishiyama H, et al. Endoscopic submucosal dissection for rectal carcinoid tumors. Surg Endosc 2010; 24:504–508.
- Ramage JK, Goretzki PE, Manfredi R, et al; Frascati Consensus Conference participants. Consensus guidelines for the management of patients with digestive neuroendocrine tumours: well-differentiated colon and rectum tumour/carcinoma. Neuroendocrinology 2008; 87:31–39.
- Thorson A, Biorck G, Bjorkman G, Waldenstrom J. Malignant carcinoid of the small intestine with metastases to the liver, valvular disease of the right side of the heart (pulmonary stenosis and tricuspid regurgitation without septal defects), peripheral vasomotor symptoms, bronchoconstriction, and an unusual type of cyanosis; a clinical and pathologic syndrome. Am Heart J 1954; 47:795–817.
- Wang AY, Ahmad NA. Rectal carcinoids. Curr Opin Gastroenterol 2006; 22:529–535.
- Modlin IM, Kidd M, Latich I, Zikusoka MN, Shapiro MD. Current status of gastrointestinal carcinoids. Gastroenterology 2005; 128:1717–1751.
- Aggarwal G, Obideen K, Wehbi M. Carcinoid tumors: what should increase our suspicion? Cleve Clin J Med 2008; 75:849–855.
- Hanley PH, Hines MO, Ray J, Armstrong R. Carcinoid tumors of the rectum. Experience with 26 cases. Proc R Soc Med 1959; 52(suppl):113–117.
- Pasieka JL. Carcinoid tumors. Surg Clin North Am 2009; 89:1123–1137.
- Jetmore AB, Ray JE, Gathright JB, McMullen KM, Hicks TC, Timmcke AE. Rectal carcinoids: the most frequent carcinoid tumor. Dis Colon Rectum 1992; 35:717–725.
- Scherübl H. Rectal carcinoids are on the rise: early detection by screening endoscopy. Endoscopy 2009; 41:162–165.
- Wilander E, Lundqvist M, Oberg K. Gastrointestinal carcinoid tumours. Histogenetic, histochemical, immunohistochemical, clinical and therapeutic aspects. Prog Histochem Cytochem 1989; 19:1–88.
- Maggard MA, O’Connell JB, Ko CY. Updated population-based review of carcinoid tumors. Ann Surg 2004; 240:117–122.
- Modlin IM, Sandor A. An analyisis of 8,305 cases of carcinoid tumors. Cancer 1997; 79:813–829.
- Wang M, Peng J, Yang W, Chen W, Mo S, Cai S. Prognostic analysis for carcinoid tumors of the rectum: a single institutional analysis of 106 cases. Colorectal Dis 2009; Epub ahead of print.
- Mani S, Modlin IM, Ballantyne G, Ahlman H, West B. Carcinoids of the rectum. J Am Coll Surg 1994; 179:231–248.
- Landry CS, Brock G, Scoggins CR, McMasters KM, Martin RC. A proposed staging system for rectal carcinoid tumors based on an analysis of 4701 patients. Surgery 2008; 144:460–466.
- Fahy BN, Tang LH, Klimstra D, et al. Carcinoid of the rectum risk stratification (CaRRs): a strategy for preoperative outcome assessment. Ann Surg Oncol 2007; 14:1735–1743.
- Shirouzu K, Isomoto H, Kakegawa T, Morimatsu M. Treatment of rectal carcinoid tumors. Am J Surg 1990; 160:262–265.
- Baek IH. Endoscopic submucosal dissection or conventional endoscopic mucosal resection is an effective and safe treatment for rectal carcinoid tumors: a retrospective study. J Laparoendosc Adv Surg Tech A 2010; 20:329–331.
- Yamaguchi N, Isomoto H, Nishiyama H, et al. Endoscopic submucosal dissection for rectal carcinoid tumors. Surg Endosc 2010; 24:504–508.
- Ramage JK, Goretzki PE, Manfredi R, et al; Frascati Consensus Conference participants. Consensus guidelines for the management of patients with digestive neuroendocrine tumours: well-differentiated colon and rectum tumour/carcinoma. Neuroendocrinology 2008; 87:31–39.
Female Vets' Role Increasing
Conference Examines Emerging Research on Polytrauma Recovery
Grand Rounds: Girl, 6, With Facial Weakness
A 6-year-old girl was brought to a pediatric emergency department (ED) in Atlanta by her mother. The mother stated that during the previous hour, she had noticed that her daughter’s face seemed weaker on the right side.
The night before, the child had said, “I can’t blink my eye”; when her mother asked her to demonstrate, the child seemed to be able to blink both eyes appropriately, and she had no further complaints. The next morning, the child complained of the light being too bright and asked to wear her mother’s sunglasses. In the course of the day, she continued to complain of eye discomfort, which she described as “stinging” and “sore.” The mother could see nothing abnormal, but by late afternoon noticed that her daughter’s smile and facial movements were asymmetrical. She immediately took her to the pediatric ED.
The child had no significant medical history and no surgical history. Her vaccination schedule was current, and she denied any recent illnesses. The mother could recall no exposures to infections or tick bites, no rashes, and no trauma to the face or head. The mother and child were visiting Atlanta from northeastern Florida.
The review of systems was negative for headache, fever, chills, rash, earache, sore throat, cough, rhinorrhea, vision changes, weight loss, or change in appetite or disposition. The child was afebrile, and the other vital signs were within normal limits.
Physical examination revealed an alert child who was calm and conversant. Her height was 45” and weight, 43 lb. Otoscopic exam showed normal ears and tympanic membranes with no sign of otitis media or ear pathology. No throat redness, tonsillar enlargement, or lymphadenopathies were noted. Breath sounds were clear, and heart rhythm and rate were regular without murmur.
The patient’s left eye appeared normal, and the right eye was mildly erythematic without drainage or swelling; since corneal abrasion was not suspected, a slit lamp examination was not performed. Upon neurologic examination, right eye ptosis with incomplete lid closure, asymmetrical mouth movement with smile, and a diminished nasal labial fold crease were noted on the right side. When the child was asked to raise her eyebrows and wrinkle her forehead, asymmetrical forehead creases were apparent. All other cranial nerve functions were intact, and motor and sensory responses, including gait and reflexes, were assessed as normal. Unilateral dysfunction of right-sided cranial nerve VII (CN VII), including forehead involvement, was confirmed, consistent with a grade of III to IV on the House-Brackmann (maximum, VI)1,2 facial nerve grading scale.
Based on the rapid onset of unilateral facial nerve paresis (FNP) and an otherwise normal exam, the patient was diagnosed with Bell’s palsy. No further testing was done, and the child was given a dose of oral prednisolone 40 mg in the ED, with a prescription for four more days of oral prednisolone at 15 mg bid. The need for eye protection and lubrication was emphasized to the mother, who was given lubricating eye drops to administer. The mother was also instructed to follow up with the child’s primary care practitioner upon their return to Florida.
The child was seen by her pediatrician three days later. Her facial paresis had not worsened in the interim, and the pediatrician declined to extend the course of corticosteroids or to add an antiviral medication. At the mother’s request, the child was referred to a pediatric otolaryngologist, who saw her the following day and adjusted the treatment plan. The child was prescribed prednisolone elixir 20 mg bid for one week, followed by a tapering dose for the second week. In addition, she was prescribed oral acyclovir 400 mg qid for 10 days. Her mother was instructed to return with the child in one week for audiometry testing.
Discussion
Idiopathic FNP, commonly referred to as Bell’s palsy, is defined as an acute unilateral paresis of the facial nerve without detectable underlying cause.3,4 It most commonly occurs among persons ages 15 to 45, with a prevalence rate of 15 to 30 cases per 100,000 persons. The peak incidence of Bell’s palsy is in the fourth decade of life. Diabetic patients and pregnant women are disproportionately affected by idiopathic FNP.2,5 About 8% to 10% of patients will experience a recurrence of Bell’s palsy within 10 years.2,6
Pediatric FNP can be congenital or acquired. Congenital FNP is most often associated with birth trauma and occurs at a rate of 2.1 cases per 1,000 births. Rare genetic syndromes can also manifest with FNP and will most often present with other syndromic anomalies noted at birth.7
Acquired FNP is two to four times less common in children than adults, with an estimated prevalence of 2.7 per 100,000 patients younger than 10. Children account for only a small proportion of subjects in published studies that address diagnosis and management of FNP.3 While the presentation of FNP is much the same in adults and children, some notable differences in etiology exist.2,3,7-9 Infectious, traumatic, or neoplastic causes of FNP are more common among children than adults and must be distinguished from idiopathic FNP.7,9-11
Decisions regarding diagnostic testing, pharmacologic treatment, and referral must be guided by the history and physical exam, neurologic exam, and clinical judgment. Being able to identify or exclude alarming causes of FNP, such as neoplasm, will aid the primary care practitioner in treatment and referral practices for this condition.
Pathophysiology
CN VII, the facial nerve, has a broad scope of function that incorporates both sensory and motor pathways. The brachial nerve portion of CN VII controls the muscles of voluntary facial expression. CN VII also autonomically innervates the lacrimal gland and submandibular gland and governs sensation from part of the ear as well as taste from the anterior two-thirds of the tongue.4
The precise pathophysiology involved in FNP remains an area of continuing debate, but infectious, vascular, immunologic, and genetic causes have been hypothesized.7,12 Inflammation and subsequent nerve damage along CN VII caused by an infectious process is thought to be the most likely explanation for the pathogenesis of acquired FNP in both adults and children.5,13
Herpes simplex virus 1 (HSV-1) has been suggested as the virus most commonly linked to FNP in both adults and children, but it is unlikely to be the sole cause.5,6,9 Data from a three-year prospective study of FNP cases in children support a relationship between pediatric FNP and HSV-1 infection.14 Other infectious causes implicated in pediatric FNP are Lyme disease, Epstein-Barr, varicella zoster virus, rubella, coxsackie virus, adenovirus, and otitis media.4,7,9
Presentation, History, and Physical Exam
Most children with idiopathic FNP will present with sudden-onset facial asymmetry and may have decreased tearing, loss of the conjunctival reflex (leading to difficulty closing the eye), an inability to hold the lips tightly together, and difficulty keeping food in the mouth. Complaints of otalgia, speech disturbances, hyperacusis, and altered sense of taste are common.2,7 Recent occurrence of an upper respiratory infection is often reported in the history of a pediatric patient with FNP.3,7,15,16
Idiopathic FNP is essentially a diagnosis of exclusion.3,5 A meticulous history must be conducted, including any recent illnesses, trauma to the face or head, vaccines, rashes, and travel. Assessment of the head, eyes, ears, nose, and throat, and a careful neurologic history must be conducted to identify nonidiopathic causes of FNP (see Table 15-7,9). Facial weakness can progress from mild palsy to complete paralysis over one to two weeks5; therefore, a careful history of the progression of facial weakness should be ascertained and documented.5,17
A full neurologic exam is essential. Cranial nerves I through XII should be evaluated; any malfunction of a cranial nerve other than CN VII could be indicative of a tumor or process other than idiopathic FNP. Assessment of facial nerve function is imperative, as this factor is the most important for predicting recovery; it can also aid in formulating a prognosis and directing treatment.5,9,17
The House-Brackmann facial nerve grading system1,2 is considered the gold standard for grading severity of facial paresis9 (see Table 21,2 ). A clear distinction between paresis (partial or incomplete palsy) and paralysis (complete palsy) must be made. Pediatric patients with an incomplete palsy have an improved chance of full recovery.17,18
Any abnormalities in the peripheral neurologic exam should prompt further testing. FNP not involving the forehead musculature, gradual progression of paresis, and weakness in any extremity could be indicative of a central lesion. FNP has been the presenting symptom in various neoplastic processes, including leukemia, cholesteatoma, and astrocytoma.3,7,9
Otitis media is a frequent cause of FNP among children.9-11 Thus, a thorough examination of the ear canal, tympanic membrane, and hearing should be performed. The throat and oropharynx should be inspected, and the parotid gland palpated. Any swelling or abnormalities warrant further investigation.
Lyme disease presenting with FNP is more common in children than adults. This may be related to the increased likelihood for children to be bitten by ticks in the head and neck areas. Frequently, FNP associated with Lyme disease is bilateral—as often as 25% of the time.19 Headache, onset of symptoms during peak Lyme season, or bilateral FNP should raise the clinician’s suspicion for Lyme disease.7,9,19
An accurate assessment of blood pressure is essential, as severe hypertension may be implicated in FNP in children.3,5,7 One literature review reported that hypertension was the origin of FNP in 3% to 17% of affected children.20 Vascular hemorrhage induced by hypertension is thought to cause nerve compression and subsequent FNP.7
A bilateral eye exam is also important. Irritation is likely, and the patient with any suspected corneal abrasion or damage should be referred to an ophthalmologist.6,18
Laboratory Testing and Imaging
Diagnostic testing that facilitates the exclusion of known causes of FNP should be considered, as there is no specific laboratory test to confirm the diagnosis. A complete blood count, Lyme titers, cerebrospinal fluid analysis, CT, and/or MRI may be warranted, based on the clinical presentation.7-9 In children in whom Lyme disease is suspected (ie, those living in tick-endemic areas or with recent tick bites), serologic testing should be performed. Lumbar puncture and an evaluation of cerebrospinal fluid may be necessary in cases in which meningitis cannot be excluded.7,9
Specialized diagnostic tests are not routinely recommended for patients with paresis that is improving. Audiometry and evaluation of the stapedial reflex may help guide treatment decisions for patients whose condition is not improving. In children, the presence or return of the stapedial reflex within three weeks of disease onset is predictive of complete recovery.5 In patients who experience complete paralysis or unimproved paresis, results of electrodiagnostic testing (in particular, evoked facial nerve electroneuronography) can help forecast recovery of facial nerve function.5,17
Treatment and Management
Treatment for FNP in adults is controversial, and even more so for the pediatric patient. Treatment decisions consist of eye care, corticosteroids, antiviral medications, and appropriate referrals.
Eye care. Eye lubrication and protection should be implemented immediately. Protecting the cornea is paramount; thorough lubrication of the eye is the mainstay of treatment.18 Artificial tears should be used frequently during the day, and an ointment should be applied to the eye at night. Use of eye patches is controversial, as they may actually cause corneal injury.7,9 Taping the eye shut at night may prevent trauma during sleep, but this option must be considered carefully.9,18
Corticosteroids. Early initiation of corticosteroids should be considered for all patients with FNP, including children.2,7,9,17 Studies are inconclusive as to whether steroid therapy is beneficial in children with idiopathic FNP. However, two 2010 reviews of pediatric FNP recommend early initiation of steroids for children with acute-onset FNP, particularly when facial paresis is evaluated at a House-Brackmann grade V or VI.7,9 The American Academy of Family Physicians (AAFP) recommends a tapering course of prednisone for all patients, begun as soon as possible.6 The prednisone dosage for pediatric patients is usually 1.0 mg/kg/d, split into two doses, for six days, followed by a tapering dose for four days.5
Antivirals and antibiotic therapy. When an infectious cause of FNP is known, appropriate antibiotic or antiviral therapy should begin. If the patient lives in or has traveled to an area endemic for Lyme disease, empiric treatment may be appropriate. When Ramsay Hunt syndrome is diagnosed or herpetic lesions are visible, antiviral treatment should be initiated.7
Antiviral therapy for idiopathic FNP is the most controversial of the treatment decisions. In 2001, the American Academy of Neurology concluded that no clear benefit from acyclovir could be ascertained, although it might be effective.13 This was affirmed in a recently updated Cochrane review of antiviral therapy for idiopathic FNP.12 Antiviral therapy alone showed no benefit, compared with placebo; however, combined antiviral and corticosteroid therapy was more effective than placebo alone in recovery outcomes. Antivirals may benefit pediatric patients and should be considered early when the cause of FNP is viral or idiopathic.7,9
Referrals. Initial presentation and course of paresis should guide referral patterns for the pediatric patient presenting with FNP. The American Academy of Pediatrics (AAP) recommends referral to an otolaryngologist for any infant or child with FNP.21 The AAFP recommends referral to a specialist for any patient who does not show improvement within two weeks.6
In patients with complete paralysis, early surgical intervention may be considered, and referral should be made promptly for electrodiagnostic testing and surgical consult. In cases in which otitis media causes FNP, myringotomy and tube insertion are indicated, and appropriate referral should be made.7,9
Outcomes
|The prognosis in children with FNP is good, and most will recover completely.2,9-11,22 Idiopathic and infectious etiologies of FNP seem to have the greatest likelihood for complete recovery.10,11,16,17 Recovery appears to be affected by etiology, degree of paresis, and treatment. How these factors coalesce is not fully understood, and up to 20% of children may have mild to moderate residual facial nerve dysfunction.10,11,19,22
The Case Patient
The child’s facial nerve function gradually returned over a three-week period, with no residual deficit (see Figures 1a, 1b, and 1c). Results of the audiometry screening on day 10 were normal, showing a positive stapedial reflex. An MRI, performed four months after the initial paralysis to rule out any tumors, yielded normal results.
This case highlights the differing management of pediatric Bell’s palsy among emergency, pediatric, and specialized providers. This child was managed more aggressively under the care of an otolaryngologist with a two-week course of steroids, antiviral medication for 10 days, and a follow-up MRI to rule out any evidence of a tumor. The need for further research to guide practice in the pediatric patient with Bell’s palsy is apparent.
Conclusion
FNP in the pediatric population is rare and more likely to have an identifiable cause than among adults. Careful examination should reveal differential diagnoses that warrant treatment and referrals. The main causes of FNP that should not be missed are otitis media, hypertension, varicella zoster virus (Ramsay Hunt syndrome), neoplastic processes, and Lyme disease.
Practitioners should have a high index of suspicion for nonidiopathic causes of FNP when a child has a neurologic exam that includes facial paresis of gradual onset, abnormal function of other cranial nerves, lack of forehead muscle weakness, or peripheral abnormalities. In addition to the history and exam, blood work and radiologic imaging can aid the practitioner in ruling in or out nonidiopathic causes of FNP.
Grading of facial palsy severity using the House-Brackmann scale helps guide prognosis and referral choices. Referral to a specialist in otolaryngology is appropriate and recommended by the AAP. Referral should be made to an ophthalmologist if any suspicion of corneal abrasion exists.
Treatment in children should consist of eye care and steroids. Antiviral therapy should be considered on an individualized basis and when evidence of HSV or varicella exists. Parents should be advised about the importance of eye care in a child with FNP (see Table 35-7,9,17,18,22).
The emotional stress associated with FNP can be significant for both children and adults; fear of lifelong facial deformity can be psychologically debilitating. Yet a favorable prognosis for recovery of facial nerve function can be relayed to anxious parents.
1. House JW, Brackmann DE. Facial nerve grading system. Otolaryngol Head Neck Surg. 1985;93(2): 146-147.
2. Finsterer J. Management of peripheral facial nerve palsy. Eur Arch Otorhinolaryngol. 2008;265(7):743-752.
3. Lunan R, Nagarajan L. Bell’s palsy: a guideline proposal following a review of practice. J Paediatr Child Health. 2008;44(4):219-220.
4. Blosser CG, Reider-Demer M. Neurologic disorders. In: Burns CE, Dunn AM, Brady MA, et al, eds. Pediatric Primary Care. 4th ed. St. Louis: Saunders Elsevier; 2008:634-672.
5. Singhi P, Jain V. Bell’s palsy in children. Semin Pediatr Neurol. 2003;10(4):289-297.
6. Tiemstra JD, Khatkhate N. Bell’s palsy: diagnosis and management. Am Fam Physician. 2007;76(7):997-1002.
7. Lorch M, Teach SJ. Facial nerve palsy: Etiology and approach to diagnosis and treatment. Pediatr Emerg Care. 2010;26(10):763-769.
8. El-Hawrani AS, Eng CY, Ahmed SK, et al. General practitioners’ referral pattern for children with acute facial paralysis. J Laryngol Otol. 2005;119(7):540-542.
9. Shargorodsky J, Lin HW, Gopen Q. Facial nerve palsy in the pediatric population. Clin Pediatr (Phila). 2010;49(5):411-417.
10. Wang CH, Chang YC, Shih HM, et al. Facial palsy in children: emergency department management and outcome. Pediatr Emerg Care. 2010;26(2):121-125.
11. Evans AK, Licameli G, Brietzke S, et al. Pediatric facial nerve paralysis: patients, management and outcomes. Int J Pediatr Otorhinolaryngol. 2005;69(11):1521-1528.
12. Lockhart P, Daly F, Pitkethly M, et al. Antiviral treatment for Bell’s palsy (idiopathic facial paralysis). Cochrane Database Syst Rev. 2009;(4):CD001869.
13. Grogan PM, Gronseth GS. Practice parameter: steroids, acyclovir, and surgery for Bell’s palsy (an evidence-based review): report of the Quality Standards Subcommittee of the American Academy of Neurology. Neurology. 2001;56(7):830-836.
14. Khine H, Mayers M, Avner JR, et al. Association between herpes simplex virus-1 infection and idiopathic unilateral facial paralysis in children and adolescents. Pediatr Infect Dis J. 2008;27(5):468-469.
15. Tsai HS, Chang LY, Lu CY, et al. Epidemiology and treatment of Bell’s palsy in children in northern Taiwan. J Microbiol Immunol Infect. 2009;42(4):351-356.
16. Cha CI, Hong CK, Park MS, Yeo SG. Comparison of facial nerve paralysis in adults and children. Yonsei Med J. 2008;49(5):725-734.
17. Linder TE, Abdelkafy W, Cavero-Vanek S. The management of peripheral facial nerve palsy: “paresis” versus “paralysis” and sources of ambiguity in study designs. Otol Neurotol. 2010;31(2):319-327.
18. Rahman I, Sadiq SA. Ophthalmic management of facial nerve palsy: a review. Surv Ophthalmol. 2007;52(2):121-144.
19. Skogman BH, Croner S, Odkvist L. Acute facial palsy in children: a 2-year follow-up with focus on Lyme neuroborreliosis. Int J Pediatr Otorhinolaryngol. 2003;67(6):597-602.
20. Siegler RL, Brewer ED, Corneli HM, Thompson JA. Hypertension first seen as facial paralysis: case reports and review of the literature. Pediatrics. 1991;87(3):387-389.
21. Surgical Advisory Panel, American Academy of Pediatrics. Guidelines for referral to pediatric surgical specialists. Pediatrics. 2002;110(1 pt 1):187-191.
22. Chen WX, Wong V. Prognosis of Bell’s palsy in children: analysis of 29 cases. Brain Dev. 2005; 27(7):504-508.
A 6-year-old girl was brought to a pediatric emergency department (ED) in Atlanta by her mother. The mother stated that during the previous hour, she had noticed that her daughter’s face seemed weaker on the right side.
The night before, the child had said, “I can’t blink my eye”; when her mother asked her to demonstrate, the child seemed to be able to blink both eyes appropriately, and she had no further complaints. The next morning, the child complained of the light being too bright and asked to wear her mother’s sunglasses. In the course of the day, she continued to complain of eye discomfort, which she described as “stinging” and “sore.” The mother could see nothing abnormal, but by late afternoon noticed that her daughter’s smile and facial movements were asymmetrical. She immediately took her to the pediatric ED.
The child had no significant medical history and no surgical history. Her vaccination schedule was current, and she denied any recent illnesses. The mother could recall no exposures to infections or tick bites, no rashes, and no trauma to the face or head. The mother and child were visiting Atlanta from northeastern Florida.
The review of systems was negative for headache, fever, chills, rash, earache, sore throat, cough, rhinorrhea, vision changes, weight loss, or change in appetite or disposition. The child was afebrile, and the other vital signs were within normal limits.
Physical examination revealed an alert child who was calm and conversant. Her height was 45” and weight, 43 lb. Otoscopic exam showed normal ears and tympanic membranes with no sign of otitis media or ear pathology. No throat redness, tonsillar enlargement, or lymphadenopathies were noted. Breath sounds were clear, and heart rhythm and rate were regular without murmur.
The patient’s left eye appeared normal, and the right eye was mildly erythematic without drainage or swelling; since corneal abrasion was not suspected, a slit lamp examination was not performed. Upon neurologic examination, right eye ptosis with incomplete lid closure, asymmetrical mouth movement with smile, and a diminished nasal labial fold crease were noted on the right side. When the child was asked to raise her eyebrows and wrinkle her forehead, asymmetrical forehead creases were apparent. All other cranial nerve functions were intact, and motor and sensory responses, including gait and reflexes, were assessed as normal. Unilateral dysfunction of right-sided cranial nerve VII (CN VII), including forehead involvement, was confirmed, consistent with a grade of III to IV on the House-Brackmann (maximum, VI)1,2 facial nerve grading scale.
Based on the rapid onset of unilateral facial nerve paresis (FNP) and an otherwise normal exam, the patient was diagnosed with Bell’s palsy. No further testing was done, and the child was given a dose of oral prednisolone 40 mg in the ED, with a prescription for four more days of oral prednisolone at 15 mg bid. The need for eye protection and lubrication was emphasized to the mother, who was given lubricating eye drops to administer. The mother was also instructed to follow up with the child’s primary care practitioner upon their return to Florida.
The child was seen by her pediatrician three days later. Her facial paresis had not worsened in the interim, and the pediatrician declined to extend the course of corticosteroids or to add an antiviral medication. At the mother’s request, the child was referred to a pediatric otolaryngologist, who saw her the following day and adjusted the treatment plan. The child was prescribed prednisolone elixir 20 mg bid for one week, followed by a tapering dose for the second week. In addition, she was prescribed oral acyclovir 400 mg qid for 10 days. Her mother was instructed to return with the child in one week for audiometry testing.
Discussion
Idiopathic FNP, commonly referred to as Bell’s palsy, is defined as an acute unilateral paresis of the facial nerve without detectable underlying cause.3,4 It most commonly occurs among persons ages 15 to 45, with a prevalence rate of 15 to 30 cases per 100,000 persons. The peak incidence of Bell’s palsy is in the fourth decade of life. Diabetic patients and pregnant women are disproportionately affected by idiopathic FNP.2,5 About 8% to 10% of patients will experience a recurrence of Bell’s palsy within 10 years.2,6
Pediatric FNP can be congenital or acquired. Congenital FNP is most often associated with birth trauma and occurs at a rate of 2.1 cases per 1,000 births. Rare genetic syndromes can also manifest with FNP and will most often present with other syndromic anomalies noted at birth.7
Acquired FNP is two to four times less common in children than adults, with an estimated prevalence of 2.7 per 100,000 patients younger than 10. Children account for only a small proportion of subjects in published studies that address diagnosis and management of FNP.3 While the presentation of FNP is much the same in adults and children, some notable differences in etiology exist.2,3,7-9 Infectious, traumatic, or neoplastic causes of FNP are more common among children than adults and must be distinguished from idiopathic FNP.7,9-11
Decisions regarding diagnostic testing, pharmacologic treatment, and referral must be guided by the history and physical exam, neurologic exam, and clinical judgment. Being able to identify or exclude alarming causes of FNP, such as neoplasm, will aid the primary care practitioner in treatment and referral practices for this condition.
Pathophysiology
CN VII, the facial nerve, has a broad scope of function that incorporates both sensory and motor pathways. The brachial nerve portion of CN VII controls the muscles of voluntary facial expression. CN VII also autonomically innervates the lacrimal gland and submandibular gland and governs sensation from part of the ear as well as taste from the anterior two-thirds of the tongue.4
The precise pathophysiology involved in FNP remains an area of continuing debate, but infectious, vascular, immunologic, and genetic causes have been hypothesized.7,12 Inflammation and subsequent nerve damage along CN VII caused by an infectious process is thought to be the most likely explanation for the pathogenesis of acquired FNP in both adults and children.5,13
Herpes simplex virus 1 (HSV-1) has been suggested as the virus most commonly linked to FNP in both adults and children, but it is unlikely to be the sole cause.5,6,9 Data from a three-year prospective study of FNP cases in children support a relationship between pediatric FNP and HSV-1 infection.14 Other infectious causes implicated in pediatric FNP are Lyme disease, Epstein-Barr, varicella zoster virus, rubella, coxsackie virus, adenovirus, and otitis media.4,7,9
Presentation, History, and Physical Exam
Most children with idiopathic FNP will present with sudden-onset facial asymmetry and may have decreased tearing, loss of the conjunctival reflex (leading to difficulty closing the eye), an inability to hold the lips tightly together, and difficulty keeping food in the mouth. Complaints of otalgia, speech disturbances, hyperacusis, and altered sense of taste are common.2,7 Recent occurrence of an upper respiratory infection is often reported in the history of a pediatric patient with FNP.3,7,15,16
Idiopathic FNP is essentially a diagnosis of exclusion.3,5 A meticulous history must be conducted, including any recent illnesses, trauma to the face or head, vaccines, rashes, and travel. Assessment of the head, eyes, ears, nose, and throat, and a careful neurologic history must be conducted to identify nonidiopathic causes of FNP (see Table 15-7,9). Facial weakness can progress from mild palsy to complete paralysis over one to two weeks5; therefore, a careful history of the progression of facial weakness should be ascertained and documented.5,17
A full neurologic exam is essential. Cranial nerves I through XII should be evaluated; any malfunction of a cranial nerve other than CN VII could be indicative of a tumor or process other than idiopathic FNP. Assessment of facial nerve function is imperative, as this factor is the most important for predicting recovery; it can also aid in formulating a prognosis and directing treatment.5,9,17
The House-Brackmann facial nerve grading system1,2 is considered the gold standard for grading severity of facial paresis9 (see Table 21,2 ). A clear distinction between paresis (partial or incomplete palsy) and paralysis (complete palsy) must be made. Pediatric patients with an incomplete palsy have an improved chance of full recovery.17,18
Any abnormalities in the peripheral neurologic exam should prompt further testing. FNP not involving the forehead musculature, gradual progression of paresis, and weakness in any extremity could be indicative of a central lesion. FNP has been the presenting symptom in various neoplastic processes, including leukemia, cholesteatoma, and astrocytoma.3,7,9
Otitis media is a frequent cause of FNP among children.9-11 Thus, a thorough examination of the ear canal, tympanic membrane, and hearing should be performed. The throat and oropharynx should be inspected, and the parotid gland palpated. Any swelling or abnormalities warrant further investigation.
Lyme disease presenting with FNP is more common in children than adults. This may be related to the increased likelihood for children to be bitten by ticks in the head and neck areas. Frequently, FNP associated with Lyme disease is bilateral—as often as 25% of the time.19 Headache, onset of symptoms during peak Lyme season, or bilateral FNP should raise the clinician’s suspicion for Lyme disease.7,9,19
An accurate assessment of blood pressure is essential, as severe hypertension may be implicated in FNP in children.3,5,7 One literature review reported that hypertension was the origin of FNP in 3% to 17% of affected children.20 Vascular hemorrhage induced by hypertension is thought to cause nerve compression and subsequent FNP.7
A bilateral eye exam is also important. Irritation is likely, and the patient with any suspected corneal abrasion or damage should be referred to an ophthalmologist.6,18
Laboratory Testing and Imaging
Diagnostic testing that facilitates the exclusion of known causes of FNP should be considered, as there is no specific laboratory test to confirm the diagnosis. A complete blood count, Lyme titers, cerebrospinal fluid analysis, CT, and/or MRI may be warranted, based on the clinical presentation.7-9 In children in whom Lyme disease is suspected (ie, those living in tick-endemic areas or with recent tick bites), serologic testing should be performed. Lumbar puncture and an evaluation of cerebrospinal fluid may be necessary in cases in which meningitis cannot be excluded.7,9
Specialized diagnostic tests are not routinely recommended for patients with paresis that is improving. Audiometry and evaluation of the stapedial reflex may help guide treatment decisions for patients whose condition is not improving. In children, the presence or return of the stapedial reflex within three weeks of disease onset is predictive of complete recovery.5 In patients who experience complete paralysis or unimproved paresis, results of electrodiagnostic testing (in particular, evoked facial nerve electroneuronography) can help forecast recovery of facial nerve function.5,17
Treatment and Management
Treatment for FNP in adults is controversial, and even more so for the pediatric patient. Treatment decisions consist of eye care, corticosteroids, antiviral medications, and appropriate referrals.
Eye care. Eye lubrication and protection should be implemented immediately. Protecting the cornea is paramount; thorough lubrication of the eye is the mainstay of treatment.18 Artificial tears should be used frequently during the day, and an ointment should be applied to the eye at night. Use of eye patches is controversial, as they may actually cause corneal injury.7,9 Taping the eye shut at night may prevent trauma during sleep, but this option must be considered carefully.9,18
Corticosteroids. Early initiation of corticosteroids should be considered for all patients with FNP, including children.2,7,9,17 Studies are inconclusive as to whether steroid therapy is beneficial in children with idiopathic FNP. However, two 2010 reviews of pediatric FNP recommend early initiation of steroids for children with acute-onset FNP, particularly when facial paresis is evaluated at a House-Brackmann grade V or VI.7,9 The American Academy of Family Physicians (AAFP) recommends a tapering course of prednisone for all patients, begun as soon as possible.6 The prednisone dosage for pediatric patients is usually 1.0 mg/kg/d, split into two doses, for six days, followed by a tapering dose for four days.5
Antivirals and antibiotic therapy. When an infectious cause of FNP is known, appropriate antibiotic or antiviral therapy should begin. If the patient lives in or has traveled to an area endemic for Lyme disease, empiric treatment may be appropriate. When Ramsay Hunt syndrome is diagnosed or herpetic lesions are visible, antiviral treatment should be initiated.7
Antiviral therapy for idiopathic FNP is the most controversial of the treatment decisions. In 2001, the American Academy of Neurology concluded that no clear benefit from acyclovir could be ascertained, although it might be effective.13 This was affirmed in a recently updated Cochrane review of antiviral therapy for idiopathic FNP.12 Antiviral therapy alone showed no benefit, compared with placebo; however, combined antiviral and corticosteroid therapy was more effective than placebo alone in recovery outcomes. Antivirals may benefit pediatric patients and should be considered early when the cause of FNP is viral or idiopathic.7,9
Referrals. Initial presentation and course of paresis should guide referral patterns for the pediatric patient presenting with FNP. The American Academy of Pediatrics (AAP) recommends referral to an otolaryngologist for any infant or child with FNP.21 The AAFP recommends referral to a specialist for any patient who does not show improvement within two weeks.6
In patients with complete paralysis, early surgical intervention may be considered, and referral should be made promptly for electrodiagnostic testing and surgical consult. In cases in which otitis media causes FNP, myringotomy and tube insertion are indicated, and appropriate referral should be made.7,9
Outcomes
|The prognosis in children with FNP is good, and most will recover completely.2,9-11,22 Idiopathic and infectious etiologies of FNP seem to have the greatest likelihood for complete recovery.10,11,16,17 Recovery appears to be affected by etiology, degree of paresis, and treatment. How these factors coalesce is not fully understood, and up to 20% of children may have mild to moderate residual facial nerve dysfunction.10,11,19,22
The Case Patient
The child’s facial nerve function gradually returned over a three-week period, with no residual deficit (see Figures 1a, 1b, and 1c). Results of the audiometry screening on day 10 were normal, showing a positive stapedial reflex. An MRI, performed four months after the initial paralysis to rule out any tumors, yielded normal results.
This case highlights the differing management of pediatric Bell’s palsy among emergency, pediatric, and specialized providers. This child was managed more aggressively under the care of an otolaryngologist with a two-week course of steroids, antiviral medication for 10 days, and a follow-up MRI to rule out any evidence of a tumor. The need for further research to guide practice in the pediatric patient with Bell’s palsy is apparent.
Conclusion
FNP in the pediatric population is rare and more likely to have an identifiable cause than among adults. Careful examination should reveal differential diagnoses that warrant treatment and referrals. The main causes of FNP that should not be missed are otitis media, hypertension, varicella zoster virus (Ramsay Hunt syndrome), neoplastic processes, and Lyme disease.
Practitioners should have a high index of suspicion for nonidiopathic causes of FNP when a child has a neurologic exam that includes facial paresis of gradual onset, abnormal function of other cranial nerves, lack of forehead muscle weakness, or peripheral abnormalities. In addition to the history and exam, blood work and radiologic imaging can aid the practitioner in ruling in or out nonidiopathic causes of FNP.
Grading of facial palsy severity using the House-Brackmann scale helps guide prognosis and referral choices. Referral to a specialist in otolaryngology is appropriate and recommended by the AAP. Referral should be made to an ophthalmologist if any suspicion of corneal abrasion exists.
Treatment in children should consist of eye care and steroids. Antiviral therapy should be considered on an individualized basis and when evidence of HSV or varicella exists. Parents should be advised about the importance of eye care in a child with FNP (see Table 35-7,9,17,18,22).
The emotional stress associated with FNP can be significant for both children and adults; fear of lifelong facial deformity can be psychologically debilitating. Yet a favorable prognosis for recovery of facial nerve function can be relayed to anxious parents.
A 6-year-old girl was brought to a pediatric emergency department (ED) in Atlanta by her mother. The mother stated that during the previous hour, she had noticed that her daughter’s face seemed weaker on the right side.
The night before, the child had said, “I can’t blink my eye”; when her mother asked her to demonstrate, the child seemed to be able to blink both eyes appropriately, and she had no further complaints. The next morning, the child complained of the light being too bright and asked to wear her mother’s sunglasses. In the course of the day, she continued to complain of eye discomfort, which she described as “stinging” and “sore.” The mother could see nothing abnormal, but by late afternoon noticed that her daughter’s smile and facial movements were asymmetrical. She immediately took her to the pediatric ED.
The child had no significant medical history and no surgical history. Her vaccination schedule was current, and she denied any recent illnesses. The mother could recall no exposures to infections or tick bites, no rashes, and no trauma to the face or head. The mother and child were visiting Atlanta from northeastern Florida.
The review of systems was negative for headache, fever, chills, rash, earache, sore throat, cough, rhinorrhea, vision changes, weight loss, or change in appetite or disposition. The child was afebrile, and the other vital signs were within normal limits.
Physical examination revealed an alert child who was calm and conversant. Her height was 45” and weight, 43 lb. Otoscopic exam showed normal ears and tympanic membranes with no sign of otitis media or ear pathology. No throat redness, tonsillar enlargement, or lymphadenopathies were noted. Breath sounds were clear, and heart rhythm and rate were regular without murmur.
The patient’s left eye appeared normal, and the right eye was mildly erythematic without drainage or swelling; since corneal abrasion was not suspected, a slit lamp examination was not performed. Upon neurologic examination, right eye ptosis with incomplete lid closure, asymmetrical mouth movement with smile, and a diminished nasal labial fold crease were noted on the right side. When the child was asked to raise her eyebrows and wrinkle her forehead, asymmetrical forehead creases were apparent. All other cranial nerve functions were intact, and motor and sensory responses, including gait and reflexes, were assessed as normal. Unilateral dysfunction of right-sided cranial nerve VII (CN VII), including forehead involvement, was confirmed, consistent with a grade of III to IV on the House-Brackmann (maximum, VI)1,2 facial nerve grading scale.
Based on the rapid onset of unilateral facial nerve paresis (FNP) and an otherwise normal exam, the patient was diagnosed with Bell’s palsy. No further testing was done, and the child was given a dose of oral prednisolone 40 mg in the ED, with a prescription for four more days of oral prednisolone at 15 mg bid. The need for eye protection and lubrication was emphasized to the mother, who was given lubricating eye drops to administer. The mother was also instructed to follow up with the child’s primary care practitioner upon their return to Florida.
The child was seen by her pediatrician three days later. Her facial paresis had not worsened in the interim, and the pediatrician declined to extend the course of corticosteroids or to add an antiviral medication. At the mother’s request, the child was referred to a pediatric otolaryngologist, who saw her the following day and adjusted the treatment plan. The child was prescribed prednisolone elixir 20 mg bid for one week, followed by a tapering dose for the second week. In addition, she was prescribed oral acyclovir 400 mg qid for 10 days. Her mother was instructed to return with the child in one week for audiometry testing.
Discussion
Idiopathic FNP, commonly referred to as Bell’s palsy, is defined as an acute unilateral paresis of the facial nerve without detectable underlying cause.3,4 It most commonly occurs among persons ages 15 to 45, with a prevalence rate of 15 to 30 cases per 100,000 persons. The peak incidence of Bell’s palsy is in the fourth decade of life. Diabetic patients and pregnant women are disproportionately affected by idiopathic FNP.2,5 About 8% to 10% of patients will experience a recurrence of Bell’s palsy within 10 years.2,6
Pediatric FNP can be congenital or acquired. Congenital FNP is most often associated with birth trauma and occurs at a rate of 2.1 cases per 1,000 births. Rare genetic syndromes can also manifest with FNP and will most often present with other syndromic anomalies noted at birth.7
Acquired FNP is two to four times less common in children than adults, with an estimated prevalence of 2.7 per 100,000 patients younger than 10. Children account for only a small proportion of subjects in published studies that address diagnosis and management of FNP.3 While the presentation of FNP is much the same in adults and children, some notable differences in etiology exist.2,3,7-9 Infectious, traumatic, or neoplastic causes of FNP are more common among children than adults and must be distinguished from idiopathic FNP.7,9-11
Decisions regarding diagnostic testing, pharmacologic treatment, and referral must be guided by the history and physical exam, neurologic exam, and clinical judgment. Being able to identify or exclude alarming causes of FNP, such as neoplasm, will aid the primary care practitioner in treatment and referral practices for this condition.
Pathophysiology
CN VII, the facial nerve, has a broad scope of function that incorporates both sensory and motor pathways. The brachial nerve portion of CN VII controls the muscles of voluntary facial expression. CN VII also autonomically innervates the lacrimal gland and submandibular gland and governs sensation from part of the ear as well as taste from the anterior two-thirds of the tongue.4
The precise pathophysiology involved in FNP remains an area of continuing debate, but infectious, vascular, immunologic, and genetic causes have been hypothesized.7,12 Inflammation and subsequent nerve damage along CN VII caused by an infectious process is thought to be the most likely explanation for the pathogenesis of acquired FNP in both adults and children.5,13
Herpes simplex virus 1 (HSV-1) has been suggested as the virus most commonly linked to FNP in both adults and children, but it is unlikely to be the sole cause.5,6,9 Data from a three-year prospective study of FNP cases in children support a relationship between pediatric FNP and HSV-1 infection.14 Other infectious causes implicated in pediatric FNP are Lyme disease, Epstein-Barr, varicella zoster virus, rubella, coxsackie virus, adenovirus, and otitis media.4,7,9
Presentation, History, and Physical Exam
Most children with idiopathic FNP will present with sudden-onset facial asymmetry and may have decreased tearing, loss of the conjunctival reflex (leading to difficulty closing the eye), an inability to hold the lips tightly together, and difficulty keeping food in the mouth. Complaints of otalgia, speech disturbances, hyperacusis, and altered sense of taste are common.2,7 Recent occurrence of an upper respiratory infection is often reported in the history of a pediatric patient with FNP.3,7,15,16
Idiopathic FNP is essentially a diagnosis of exclusion.3,5 A meticulous history must be conducted, including any recent illnesses, trauma to the face or head, vaccines, rashes, and travel. Assessment of the head, eyes, ears, nose, and throat, and a careful neurologic history must be conducted to identify nonidiopathic causes of FNP (see Table 15-7,9). Facial weakness can progress from mild palsy to complete paralysis over one to two weeks5; therefore, a careful history of the progression of facial weakness should be ascertained and documented.5,17
A full neurologic exam is essential. Cranial nerves I through XII should be evaluated; any malfunction of a cranial nerve other than CN VII could be indicative of a tumor or process other than idiopathic FNP. Assessment of facial nerve function is imperative, as this factor is the most important for predicting recovery; it can also aid in formulating a prognosis and directing treatment.5,9,17
The House-Brackmann facial nerve grading system1,2 is considered the gold standard for grading severity of facial paresis9 (see Table 21,2 ). A clear distinction between paresis (partial or incomplete palsy) and paralysis (complete palsy) must be made. Pediatric patients with an incomplete palsy have an improved chance of full recovery.17,18
Any abnormalities in the peripheral neurologic exam should prompt further testing. FNP not involving the forehead musculature, gradual progression of paresis, and weakness in any extremity could be indicative of a central lesion. FNP has been the presenting symptom in various neoplastic processes, including leukemia, cholesteatoma, and astrocytoma.3,7,9
Otitis media is a frequent cause of FNP among children.9-11 Thus, a thorough examination of the ear canal, tympanic membrane, and hearing should be performed. The throat and oropharynx should be inspected, and the parotid gland palpated. Any swelling or abnormalities warrant further investigation.
Lyme disease presenting with FNP is more common in children than adults. This may be related to the increased likelihood for children to be bitten by ticks in the head and neck areas. Frequently, FNP associated with Lyme disease is bilateral—as often as 25% of the time.19 Headache, onset of symptoms during peak Lyme season, or bilateral FNP should raise the clinician’s suspicion for Lyme disease.7,9,19
An accurate assessment of blood pressure is essential, as severe hypertension may be implicated in FNP in children.3,5,7 One literature review reported that hypertension was the origin of FNP in 3% to 17% of affected children.20 Vascular hemorrhage induced by hypertension is thought to cause nerve compression and subsequent FNP.7
A bilateral eye exam is also important. Irritation is likely, and the patient with any suspected corneal abrasion or damage should be referred to an ophthalmologist.6,18
Laboratory Testing and Imaging
Diagnostic testing that facilitates the exclusion of known causes of FNP should be considered, as there is no specific laboratory test to confirm the diagnosis. A complete blood count, Lyme titers, cerebrospinal fluid analysis, CT, and/or MRI may be warranted, based on the clinical presentation.7-9 In children in whom Lyme disease is suspected (ie, those living in tick-endemic areas or with recent tick bites), serologic testing should be performed. Lumbar puncture and an evaluation of cerebrospinal fluid may be necessary in cases in which meningitis cannot be excluded.7,9
Specialized diagnostic tests are not routinely recommended for patients with paresis that is improving. Audiometry and evaluation of the stapedial reflex may help guide treatment decisions for patients whose condition is not improving. In children, the presence or return of the stapedial reflex within three weeks of disease onset is predictive of complete recovery.5 In patients who experience complete paralysis or unimproved paresis, results of electrodiagnostic testing (in particular, evoked facial nerve electroneuronography) can help forecast recovery of facial nerve function.5,17
Treatment and Management
Treatment for FNP in adults is controversial, and even more so for the pediatric patient. Treatment decisions consist of eye care, corticosteroids, antiviral medications, and appropriate referrals.
Eye care. Eye lubrication and protection should be implemented immediately. Protecting the cornea is paramount; thorough lubrication of the eye is the mainstay of treatment.18 Artificial tears should be used frequently during the day, and an ointment should be applied to the eye at night. Use of eye patches is controversial, as they may actually cause corneal injury.7,9 Taping the eye shut at night may prevent trauma during sleep, but this option must be considered carefully.9,18
Corticosteroids. Early initiation of corticosteroids should be considered for all patients with FNP, including children.2,7,9,17 Studies are inconclusive as to whether steroid therapy is beneficial in children with idiopathic FNP. However, two 2010 reviews of pediatric FNP recommend early initiation of steroids for children with acute-onset FNP, particularly when facial paresis is evaluated at a House-Brackmann grade V or VI.7,9 The American Academy of Family Physicians (AAFP) recommends a tapering course of prednisone for all patients, begun as soon as possible.6 The prednisone dosage for pediatric patients is usually 1.0 mg/kg/d, split into two doses, for six days, followed by a tapering dose for four days.5
Antivirals and antibiotic therapy. When an infectious cause of FNP is known, appropriate antibiotic or antiviral therapy should begin. If the patient lives in or has traveled to an area endemic for Lyme disease, empiric treatment may be appropriate. When Ramsay Hunt syndrome is diagnosed or herpetic lesions are visible, antiviral treatment should be initiated.7
Antiviral therapy for idiopathic FNP is the most controversial of the treatment decisions. In 2001, the American Academy of Neurology concluded that no clear benefit from acyclovir could be ascertained, although it might be effective.13 This was affirmed in a recently updated Cochrane review of antiviral therapy for idiopathic FNP.12 Antiviral therapy alone showed no benefit, compared with placebo; however, combined antiviral and corticosteroid therapy was more effective than placebo alone in recovery outcomes. Antivirals may benefit pediatric patients and should be considered early when the cause of FNP is viral or idiopathic.7,9
Referrals. Initial presentation and course of paresis should guide referral patterns for the pediatric patient presenting with FNP. The American Academy of Pediatrics (AAP) recommends referral to an otolaryngologist for any infant or child with FNP.21 The AAFP recommends referral to a specialist for any patient who does not show improvement within two weeks.6
In patients with complete paralysis, early surgical intervention may be considered, and referral should be made promptly for electrodiagnostic testing and surgical consult. In cases in which otitis media causes FNP, myringotomy and tube insertion are indicated, and appropriate referral should be made.7,9
Outcomes
|The prognosis in children with FNP is good, and most will recover completely.2,9-11,22 Idiopathic and infectious etiologies of FNP seem to have the greatest likelihood for complete recovery.10,11,16,17 Recovery appears to be affected by etiology, degree of paresis, and treatment. How these factors coalesce is not fully understood, and up to 20% of children may have mild to moderate residual facial nerve dysfunction.10,11,19,22
The Case Patient
The child’s facial nerve function gradually returned over a three-week period, with no residual deficit (see Figures 1a, 1b, and 1c). Results of the audiometry screening on day 10 were normal, showing a positive stapedial reflex. An MRI, performed four months after the initial paralysis to rule out any tumors, yielded normal results.
This case highlights the differing management of pediatric Bell’s palsy among emergency, pediatric, and specialized providers. This child was managed more aggressively under the care of an otolaryngologist with a two-week course of steroids, antiviral medication for 10 days, and a follow-up MRI to rule out any evidence of a tumor. The need for further research to guide practice in the pediatric patient with Bell’s palsy is apparent.
Conclusion
FNP in the pediatric population is rare and more likely to have an identifiable cause than among adults. Careful examination should reveal differential diagnoses that warrant treatment and referrals. The main causes of FNP that should not be missed are otitis media, hypertension, varicella zoster virus (Ramsay Hunt syndrome), neoplastic processes, and Lyme disease.
Practitioners should have a high index of suspicion for nonidiopathic causes of FNP when a child has a neurologic exam that includes facial paresis of gradual onset, abnormal function of other cranial nerves, lack of forehead muscle weakness, or peripheral abnormalities. In addition to the history and exam, blood work and radiologic imaging can aid the practitioner in ruling in or out nonidiopathic causes of FNP.
Grading of facial palsy severity using the House-Brackmann scale helps guide prognosis and referral choices. Referral to a specialist in otolaryngology is appropriate and recommended by the AAP. Referral should be made to an ophthalmologist if any suspicion of corneal abrasion exists.
Treatment in children should consist of eye care and steroids. Antiviral therapy should be considered on an individualized basis and when evidence of HSV or varicella exists. Parents should be advised about the importance of eye care in a child with FNP (see Table 35-7,9,17,18,22).
The emotional stress associated with FNP can be significant for both children and adults; fear of lifelong facial deformity can be psychologically debilitating. Yet a favorable prognosis for recovery of facial nerve function can be relayed to anxious parents.
1. House JW, Brackmann DE. Facial nerve grading system. Otolaryngol Head Neck Surg. 1985;93(2): 146-147.
2. Finsterer J. Management of peripheral facial nerve palsy. Eur Arch Otorhinolaryngol. 2008;265(7):743-752.
3. Lunan R, Nagarajan L. Bell’s palsy: a guideline proposal following a review of practice. J Paediatr Child Health. 2008;44(4):219-220.
4. Blosser CG, Reider-Demer M. Neurologic disorders. In: Burns CE, Dunn AM, Brady MA, et al, eds. Pediatric Primary Care. 4th ed. St. Louis: Saunders Elsevier; 2008:634-672.
5. Singhi P, Jain V. Bell’s palsy in children. Semin Pediatr Neurol. 2003;10(4):289-297.
6. Tiemstra JD, Khatkhate N. Bell’s palsy: diagnosis and management. Am Fam Physician. 2007;76(7):997-1002.
7. Lorch M, Teach SJ. Facial nerve palsy: Etiology and approach to diagnosis and treatment. Pediatr Emerg Care. 2010;26(10):763-769.
8. El-Hawrani AS, Eng CY, Ahmed SK, et al. General practitioners’ referral pattern for children with acute facial paralysis. J Laryngol Otol. 2005;119(7):540-542.
9. Shargorodsky J, Lin HW, Gopen Q. Facial nerve palsy in the pediatric population. Clin Pediatr (Phila). 2010;49(5):411-417.
10. Wang CH, Chang YC, Shih HM, et al. Facial palsy in children: emergency department management and outcome. Pediatr Emerg Care. 2010;26(2):121-125.
11. Evans AK, Licameli G, Brietzke S, et al. Pediatric facial nerve paralysis: patients, management and outcomes. Int J Pediatr Otorhinolaryngol. 2005;69(11):1521-1528.
12. Lockhart P, Daly F, Pitkethly M, et al. Antiviral treatment for Bell’s palsy (idiopathic facial paralysis). Cochrane Database Syst Rev. 2009;(4):CD001869.
13. Grogan PM, Gronseth GS. Practice parameter: steroids, acyclovir, and surgery for Bell’s palsy (an evidence-based review): report of the Quality Standards Subcommittee of the American Academy of Neurology. Neurology. 2001;56(7):830-836.
14. Khine H, Mayers M, Avner JR, et al. Association between herpes simplex virus-1 infection and idiopathic unilateral facial paralysis in children and adolescents. Pediatr Infect Dis J. 2008;27(5):468-469.
15. Tsai HS, Chang LY, Lu CY, et al. Epidemiology and treatment of Bell’s palsy in children in northern Taiwan. J Microbiol Immunol Infect. 2009;42(4):351-356.
16. Cha CI, Hong CK, Park MS, Yeo SG. Comparison of facial nerve paralysis in adults and children. Yonsei Med J. 2008;49(5):725-734.
17. Linder TE, Abdelkafy W, Cavero-Vanek S. The management of peripheral facial nerve palsy: “paresis” versus “paralysis” and sources of ambiguity in study designs. Otol Neurotol. 2010;31(2):319-327.
18. Rahman I, Sadiq SA. Ophthalmic management of facial nerve palsy: a review. Surv Ophthalmol. 2007;52(2):121-144.
19. Skogman BH, Croner S, Odkvist L. Acute facial palsy in children: a 2-year follow-up with focus on Lyme neuroborreliosis. Int J Pediatr Otorhinolaryngol. 2003;67(6):597-602.
20. Siegler RL, Brewer ED, Corneli HM, Thompson JA. Hypertension first seen as facial paralysis: case reports and review of the literature. Pediatrics. 1991;87(3):387-389.
21. Surgical Advisory Panel, American Academy of Pediatrics. Guidelines for referral to pediatric surgical specialists. Pediatrics. 2002;110(1 pt 1):187-191.
22. Chen WX, Wong V. Prognosis of Bell’s palsy in children: analysis of 29 cases. Brain Dev. 2005; 27(7):504-508.
1. House JW, Brackmann DE. Facial nerve grading system. Otolaryngol Head Neck Surg. 1985;93(2): 146-147.
2. Finsterer J. Management of peripheral facial nerve palsy. Eur Arch Otorhinolaryngol. 2008;265(7):743-752.
3. Lunan R, Nagarajan L. Bell’s palsy: a guideline proposal following a review of practice. J Paediatr Child Health. 2008;44(4):219-220.
4. Blosser CG, Reider-Demer M. Neurologic disorders. In: Burns CE, Dunn AM, Brady MA, et al, eds. Pediatric Primary Care. 4th ed. St. Louis: Saunders Elsevier; 2008:634-672.
5. Singhi P, Jain V. Bell’s palsy in children. Semin Pediatr Neurol. 2003;10(4):289-297.
6. Tiemstra JD, Khatkhate N. Bell’s palsy: diagnosis and management. Am Fam Physician. 2007;76(7):997-1002.
7. Lorch M, Teach SJ. Facial nerve palsy: Etiology and approach to diagnosis and treatment. Pediatr Emerg Care. 2010;26(10):763-769.
8. El-Hawrani AS, Eng CY, Ahmed SK, et al. General practitioners’ referral pattern for children with acute facial paralysis. J Laryngol Otol. 2005;119(7):540-542.
9. Shargorodsky J, Lin HW, Gopen Q. Facial nerve palsy in the pediatric population. Clin Pediatr (Phila). 2010;49(5):411-417.
10. Wang CH, Chang YC, Shih HM, et al. Facial palsy in children: emergency department management and outcome. Pediatr Emerg Care. 2010;26(2):121-125.
11. Evans AK, Licameli G, Brietzke S, et al. Pediatric facial nerve paralysis: patients, management and outcomes. Int J Pediatr Otorhinolaryngol. 2005;69(11):1521-1528.
12. Lockhart P, Daly F, Pitkethly M, et al. Antiviral treatment for Bell’s palsy (idiopathic facial paralysis). Cochrane Database Syst Rev. 2009;(4):CD001869.
13. Grogan PM, Gronseth GS. Practice parameter: steroids, acyclovir, and surgery for Bell’s palsy (an evidence-based review): report of the Quality Standards Subcommittee of the American Academy of Neurology. Neurology. 2001;56(7):830-836.
14. Khine H, Mayers M, Avner JR, et al. Association between herpes simplex virus-1 infection and idiopathic unilateral facial paralysis in children and adolescents. Pediatr Infect Dis J. 2008;27(5):468-469.
15. Tsai HS, Chang LY, Lu CY, et al. Epidemiology and treatment of Bell’s palsy in children in northern Taiwan. J Microbiol Immunol Infect. 2009;42(4):351-356.
16. Cha CI, Hong CK, Park MS, Yeo SG. Comparison of facial nerve paralysis in adults and children. Yonsei Med J. 2008;49(5):725-734.
17. Linder TE, Abdelkafy W, Cavero-Vanek S. The management of peripheral facial nerve palsy: “paresis” versus “paralysis” and sources of ambiguity in study designs. Otol Neurotol. 2010;31(2):319-327.
18. Rahman I, Sadiq SA. Ophthalmic management of facial nerve palsy: a review. Surv Ophthalmol. 2007;52(2):121-144.
19. Skogman BH, Croner S, Odkvist L. Acute facial palsy in children: a 2-year follow-up with focus on Lyme neuroborreliosis. Int J Pediatr Otorhinolaryngol. 2003;67(6):597-602.
20. Siegler RL, Brewer ED, Corneli HM, Thompson JA. Hypertension first seen as facial paralysis: case reports and review of the literature. Pediatrics. 1991;87(3):387-389.
21. Surgical Advisory Panel, American Academy of Pediatrics. Guidelines for referral to pediatric surgical specialists. Pediatrics. 2002;110(1 pt 1):187-191.
22. Chen WX, Wong V. Prognosis of Bell’s palsy in children: analysis of 29 cases. Brain Dev. 2005; 27(7):504-508.
Pathologic Grooming Behavior: Facial Dermatillomania
What's Eating You? Tarantulas (Theraphosidae)
Unilateral Eyelid Angioedema With Congestion of the Right Bulbar Conjunctiva Due to Loxoprofen Sodium
Routine checkups don’t ensure that seniors get preventive services
Background A small number of preventive services are recommended for all adults ages 65 years and older. It is well established that the combined delivery or being “up to date” on these measures is low. However, the effect of routine checkups on being up to date is not known. We examined the association between routine checkups and the delivery of a group of recommended clinical preventive services for US adults ages 65 and older.
Methods In 2006 the Behavioral Risk Factor Surveillance System conducted telephone surveys. Participants ages 65 years and older were randomly selected in 50 states and the District of Columbia. Sample sizes were 32,243 male respondents and 58,762 female respondents. A composite measure was used that includes screening for colorectal, cervical, and breast cancers, and vaccinations against influenza and pneumococcal disease. The measure quantifies the percentage of adults who are up to date according to recommended schedules.
Results Most adults ages 65 and older were fully insured, had a personal health care provider, reported no cost barrier to seeing a doctor in the past year, and had recently received a routine checkup. Associations between high health care access and checkups and the increased likelihood of being up to date on clinical preventive services were statistically significant. Although a large percentage of the population had high access to care and reported having a recent checkup, the percentage of all those who were up to date was low, and it was only slightly greater for those with high access or a recent checkup (42.6%, 45.1%, and 44.8%, respectively, for men; 35.2%, 37.0%, and 36.8%, respectively for women). For both sexes, the results varied by education, race/ethnicity, marriage, insurance, health, and state.
Conclusions Our study indicates that increasing the use of routine medical checkups will have a negligible impact on the delivery of preventive services.
Just because elderly patients are having regular checkups does not necessarily mean they are receiving needed preventive services. For individuals who are ages 65 and older, such services include vaccinations against influenza and pneumonia, screenings for hypertension and hypercholesterolemia, and screenings for breast, cervical, and colorectal cancers.1
Recently analyzed state and national data for a cluster of 5 of these services indicate that fewer than 41% of men and 32.5% of women ages 65 and older were up to date.2 Time constraints on health care providers and a lack of knowledge about guidelines are perhaps 2 of the biggest barriers to widespread provision of disease prevention services. In this study we extended an earlier analysis and examined, for individuals 65 years of age and older, the association between having a recent checkup and being up to date on a cluster of recommended preventive services. We also propose steps that will likely be needed to increase receipt of preventive services.
Methods
Data source
The Behavioral Risk Factor Surveillance System (BRFSS), coordinated by the Centers for Disease Control and Prevention (CDC), conducts annual state-based telephone surveys of noninstitutionalized US adults ages 18 years or older concerning health practices.3 We used data from 2006 BRFSS participants ages 65 years or older at the time they participated (32,243 male respondents and 58,762 female respondents). All results were based on weighted data that accounted for different probabilities of selection and were adjusted to reflect the population distribution in each state by age and sex, or by age, race, and sex.
Respondents queried about preventive services
We analyzed responses to BRFSS questions about the receipt of clinical preventive services recommended by the US Preventive Services Task Force (USPSTF) or by the Advisory Committee on Immunization Practices for all adults ages 65 or older.* Services included colorectal cancer screening, influenza immunization, pneumococcal immunization, and, for women, mammography and the Papanicolaou (Pap) test. The USPSTF grades these measures* as A or B, meaning it finds “good” or at least “fair” evidence that a service improves important health outcomes and concludes that benefits substantially outweigh harms.4 Questions about these services were asked in all 50 states in 2006.
*The recommendations and grading systems discussed here reflect those that were in place in 2006. There have been changes to both since this study was conducted.
Cardiovascular services excluded. The BRFSS has not asked questions about hypertension screening since 1999, when more than 95% of older adults reported they had their blood pressure checked in the past 2 years.5 Questions about cholesterol screening were not asked in all states in 2006 and were not incorporated into the composite measure. However, analysis from a prior study suggests that including cholesterol screening levels in such a composite measure would not have made a large difference in the percentage of older Americans up to date on all services.2
Were scheduled intervals for services met? Adults could meet the recommendation for colorectal cancer screening by either having a fecal occult blood test (FOBT) within 1 year or colonoscopy or sigmoidoscopy within 10 years. The USPSTF and other national guidelines recommend a 5-year interval for sigmoidoscopy and a 10-year interval for colonoscopy.6,7 However, no direct evidence has determined the optimal interval for either test,8 and the BRFSS question did not distinguish between the 2 interventions. Because either FOBT or endoscopy satisfies screening recommendations, we did not exclude respondents with missing values for 1 test if they had the other test within the recommended interval.
Other services and recommended intervals were pneumococcal vaccination (ever), influenza vaccination (in past year), and, for women, mammogram (within 2 years) and Pap test (within 3 years).
Assigning Yes or No to responses. If respondents had never received a particular preventive service or had received it outside the interval recommended by the USPSTF,4 we included them in the group answering No. We eliminated 3324 men and 6295 women with missing values for 1 or more measures.
Final determination of being “up to date.” After noting how many of the recommended services each individual had received according to age and sex, we dichotomized the sample according to whether all recommendations had been met—3 clinical preventive services for men 65 years and older (colorectal cancer screening, influenza, and pneumonia vaccination) and 5 for women (adding mammography and Pap test), with a single exception. Because Pap testing is often reported only for women with an intact cervix,9 we excused the lack of a Pap test for women who had undergone hysterectomy (47% of all women ages 65+, or 27,243). We required only that they meet 4 clinical preventive services to be considered up to date. A prior study revealed that excluding the Pap test entirely from the up-to-date measure for women 65 years and older had a minimal effect on up-to-date rates (34.2% when excluding the Pap test vs 32.5% including the Pap test).10
One of the strengths of the up-to-date measure is that it assesses the proportion of those fully up to date and thus allows for variability within subgroups, such as women who have had hysterectomies, without eliminating them arbitrarily from the sample.
Additional participant characteristics. We divided respondents into 4 racial/ethnic categories based on responses to BRFSS questions: White (non-Hispanic); Black (non-Hispanic); Hispanic of any race; or “Other” (American Indians, Asians, Pacific Islanders, and individuals of other or multiple race categories). Age categories were 65 to 69 years, 70 to 74 years, 75 to 79 years, or >80 years. Education categories: less than high school, high school graduate or general equivalency diploma recipient, some college, or college graduate. We further dichotomized the sample according to marital status, having 1 or more personal health care providers (vs none), and health status (fair/poor or good/very good/excellent). Given the amount of missing data (20%), household income was not included in the analysis.
Quantifying health care access. We created a measure of health care access using 3 factors:
- health insurance (“Do you have any kind of health care coverage, including health insurance, prepaid plans such as HMOs, or government plans such as Medicare?”)
- one or more personal health care providers (see above)
- no cost barrier to seeing a doctor (“Was there a time in the past 12 months when you needed to see a doctor but could not because of cost?”).
To measure relative health care access, we scored each of the above items 1 for affirmative or 0 for negative. The sum (0, 1, 2, or 3) represented level of access. Lower numbers indicated more barriers and higher numbers represented greater access. Because only 48 older men and 59 older women had total scores of 0, the lower 2 levels were combined and the resulting 3 levels were termed “low” (0 & 1), “medium” (2) and “high” (3) access. Two of the measures used for health care access were also used to define 3 mutually exclusive health insurance categories: uninsured, fully insured, and underinsured (insured but reporting a cost barrier).2
We determined whether a routine checkup had occurred in the past 2 years by asking, “About how long has it been since you last visited a doctor for a routine checkup? A routine checkup is a general physical exam, not an exam for a specific injury, illness, or condition.”
Statistical analysis
We conducted statistical analysis using Stata, version 9.0 (Stata Corp; College Station, Tex). We used Pearson chi-square tests to determine whether selected demographic factors were associated with being up to date on all recommended services. We also used Stata in a logistic regression analysis to control simultaneously for age, education, race/ethnicity, marital status, insurance coverage, health care access, having one or more personal health care providers, having a routine checkup within 2 years, current smoking, and health status. We computed odds ratios and 95% confidence intervals for each variable in the model.
Results
Most adults ages 65 years and older were fully insured, had a personal health care provider, and reported no cost barrier to seeing a doctor in the past year (TABLE 1). Breaking out these measures into 3 levels of relative health care access, 88.6% of men and 90.2% of women were at the highest level. More than 90% of respondents reported having a routine checkup in the past 2 years. More than 60% reported receiving each of the separate immunizations and cancer screenings recommended for their age and sex, and almost all had received at least 1 service.
TABLE 2 shows the prevalence of being up to date by demographic group. Only 42.6% of all older men and 35.2% of all older women were up to date, with rates marginally better for those with high access to care (45.1% for men, 37% for women) or those reporting a recent routine checkup (44.8% for men, 36.8% for women). Low access to care yielded dramatically worse up-to-date rates (14.8% for men, 9.1% for women). Similarly, those reporting no recent routine checkup had poor up-to-date rates (20.5% for men, 15.4% for women). The highest rates of being up to date belonged to those with a college degree (49% for men, 42.1% for women). Higher rates were also found among the oldest age groups.
Results of the logistic regression analysis are shown in TABLE 3. Among men and women, being up to date was more likely for those who were older, married, better educated, had high access to health care, and had had a routine checkup in the past 2 years. The latter 2 groups had the highest odds ratios of all groups in the model. Less likely to be up to date were those who were Black, Hispanic, or of a race other than white, those who smoked cigarettes, and (for men) those who were in good or better health. For women, health status had no effect on being up to date.
Table 1
Characteristics of US adults ≥65 years, 2006 Behavioral Risk Factor Surveillance System
| Men | Women | |||
|---|---|---|---|---|
| Percent | n | Percent | n | |
| Total | 100 | 32,243 | 100 | 58,762 |
| Age (y) | ||||
| 65-69 | 30.7 | 10,286 | 27.1 | 16,184 |
| 70-74 | 25.8 | 8410 | 21.2 | 14,005 |
| 75-79 | 22.9 | 6685 | 24.6 | 12,562 |
| ≥80 | 20.7 | 6862 | 27.1 | 16,011 |
| Race/ethnicity | ||||
| White | 81.7 | 27,720 | 81.5 | 50,270 |
| Black | 7.3 | 1631 | 8.0 | 3656 |
| Hispanic | 6.0 | 931 | 6.4 | 1824 |
| Other* | 5.0 | 1423 | 4.2 | 2218 |
| Education | ||||
| < High school | 15.0 | 5010 | 17.6 | 9931 |
| High school | 29.3 | 9905 | 39.0 | 22,978 |
| Some college | 20.9 | 6552 | 23.6 | 14,372 |
| College grad | 34.9 | 10,664 | 19.7 | 11,226 |
| Married | 74.0 | 20,593 | 44.5 | 20,551 |
| Insurance | ||||
| Fully insured | 94.2 | 30,147 | 94.0 | 55,066 |
| Underinsured† | 3.5 | 1173 | 4.3 | 2385 |
| Not insured | 2.3 | 754 | 1.7 | 993 |
| Has a personal health care provider | 93.1 | 29,657 | 95.3 | 55,586 |
| No cost barrier | 96.2 | 30,838 | 95.4 | 56,021 |
| Health care access‡ | ||||
| Low | 1.4 | 450 | 0.9 | 561 |
| Medium | 10.0 | 3521 | 8.8 | 5271 |
| High | 88.6 | 27,996 | 90.2 | 52,430 |
| Fair/poor health | 27.6 | 8957 | 29.7 | 16,727 |
| Clinical preventive services | ||||
| Flu shot past year | 68.3 | 21,725 | 67.0 | 39,205 |
| Pneumococcal polysaccharide vaccine | 63.6 | 19,531 | 66.7 | 38,442 |
| Colon cancer screen | 71.3 | 21,395 | 67.9 | 37,112 |
| Pap test in 3 years (women with cervix) | 70.8 | 19,700 | ||
| Pap test in 3 years (credit for hysterectomy) | 84.8 | 46,943 | ||
| Mammogram in 2 years | 79.1 | 43,874 | ||
| Number of health care services received | ||||
| 0 | 9.6 | 2993 | 3.0 | 1615 |
| 1 | 19.3 | 5335 | 5.0 | 2659 |
| 2 | 28.5 | 8085 | 10.9 | 5679 |
| 3§ | 42.6 | 12,506 | 19.2 | 10,108 |
| 4 | 26.8 | 13,935 | ||
| 5§ | 35.2 | 18,471 | ||
| Total|| | 100 | 28,919 | 100.0 | 52,467 |
| Routine checkup¶ | 91.5 | 28,845 | 93.1 | 53,037 |
| *Includes American Indian, Asian, Pacific Islander, and individuals of other or multiple race categories. †Underinsurance includes individuals with coverage who indicated there was a time in the past year when they needed to see a doctor but could not due to cost (cost barrier). ‡Determined from 3 measures: having health insurance, having a personal health care provider, and not reporting a cost barrier. Levels 0 and 1 were combined. Resulting levels were low, medium, and high. §To be up to date, men required colon cancer screening (fecal occult blood test in past year or endoscopy within 10 years), a flu shot in the past year, and a pneumonia vaccination ever. Women required those same services plus a mammogram within 2 years and Pap test within 3 years (unless prior hysterectomy). ||Total n excludes 3324 men and 6295 women with missing values for one or more tests. ¶Respondents who indicated they had a routine “checkup” in the past 2 years. | ||||
Table 2
Prevalence of being up to date* by demographic characteristics, US adults ≥65 years, 2006 Behavioral Risk Factor Surveillance System
| Men | Women | |||
|---|---|---|---|---|
| Percent | 95% CI | Percent | 95% CI | |
| Total | 42.6 | 41.6-43.7 | 35.2 | 34.4-36.0 |
| Age (y) | ||||
| 65-69 | 32.0 | 30.3-33.7 | 29.8 | 28.4-31.3 |
| 70-74 | 44.9 | 42.7-47.2 | 39.1 | 37.5-40.8 |
| 75-79 | 48.7 | 46.2-51.2 | 40.2 | 38.5-41.9 |
| ≥80 | 48.9 | 46.5-51.2 | 32.9 | 31.4-34.5 |
| P value | <.0001 | <.0001 | ||
| Race/ethnicity | ||||
| White | 46.2 | 45.1-47.3 | 37.9 | 37.1-38.7 |
| Black | 27.8 | 23.7-32.3 | 22.4 | 19.7-25.4 |
| Hispanic | 20.8 | 15.7-27.0 | 22.1 | 17.7-27.2 |
| Other† | 31.0 | 25.7-36.9 | 24.1 | 19.7-29.0 |
| P value | <.0001 | <.0001 | ||
| Married | ||||
| Yes | 44.3 | 43.0-45.7 | 39.3 | 38.1-40.6 |
| No | 37.7 | 35.9-39.5 | 31.7 | 30.7-32.7 |
| P value | <.0001 | <.0001 | ||
| Education | ||||
| < High school | 30.9 | 28.2-33.8 | 25.0 | 23.1-26.9 |
| High school | 39.5 | 37.7-41.4 | 34.2 | 33.0-35.4 |
| Some college | 44.3 | 41.9-46.8 | 38.2 | 36.6-39.7 |
| College grad | 49.0 | 47.2-50.9 | 42.1 | 40.2-44.1 |
| P value | <.0001 | <.0001 | ||
| Insurance | ||||
| Not insured | 19.9 | 15.1-25.8 | 17.9 | 13.2-23.9 |
| Underinsured | 29.3 | 25.0-34.0 | 24.3 | 20.7-28.2 |
| Fully insured | 43.7 | 42.5-44.8 | 36.0 | 35.2-36.8 |
| P value | <.0001 | <.0001 | ||
| Personal health care provider | ||||
| Has 1 or more | 44.4 | 43.3-45.5 | 36.3 | 35.5-37.1 |
| None | 18.8 | 16.1-21.9 | 11.4 | 9.3-14.0 |
| P value | <.0001 | <.0001 | ||
| Health status | ||||
| Fair/poor health | 44.3 | 42.1-46.5 | 33.2 | 31.7-34.8 |
| Ex/v good health | 41.9 | 40.7-43.2 | 36.0 | 35.1-37.0 |
| P value | .066 | .002 | ||
| Health access‡ | ||||
| “Low” | 14.8 | 9.1-23.1 | 9.1 | 5.9-13.7 |
| “Medium” | 24.7 | 22.2-27.4 | 19.3 | 17.1-21.8 |
| “High” | 45.1 | 43.9-46.3 | 37.0 | 36.2-37.9 |
| P value | <.0001 | <.0001 | ||
| Routine checkup§ | ||||
| Yes | 44.8 | 43.6-45.9 | 36.8 | 35.9-37.6 |
| No | 20.5 | 17.6-23.7 | 15.4 | 12.9-18.4 |
| P value | <.0001 | <.0001 | ||
| CI, confidence interval. *To be up to date, men required colon cancer screening (fecal occult blood test in past year or endoscopy within 10 years), a flu shot in the past year, and a pneumonia vaccination ever. Women required those same services plus a mammogram within 2 years and Pap test within 3 years (unless prior hysterectomy). †Other race includes American Indian, Asian, Pacific Islander, and individuals of other or multiple race categories. ‡Determined from 3 measures: having health insurance, having a personal health care provider, and not reporting a cost barrier. Levels 0 and 1 were combined. Resulting levels were low, medium, and high. §Respondents who indicated they had a routine “checkup” in the past 2 years. | ||||
TABLE 3
Results of multiple logistic regression modeling* for being up to date†for cancer screening and adult immunization, by sex and demographic characteristics: 2006 Behavioral Risk Factor Surveillance System, adults ≥65 years
| Men | Women | |||||
|---|---|---|---|---|---|---|
| OR | 95% CI | P value | OR | 95% CI | P value | |
| Age 65-69 y (referent) | ||||||
| 70-74 | 1.74 | 1.54-1.97 | <.001 | 1.54 | 1.39-1.70 | <.0001 |
| 75-79 | 2.04 | 1.79-2.32 | <.001 | 1.56 | 1.40-1.74 | <.0001 |
| ≥80 | 1.96 | 1.72-2.23 | <.001 | 1.19 | 1.06-1.32 | .002 |
| White (referent) | ||||||
| Black | 0.52 | 0.41-0.66 | <.001 | 0.55 | 0.46-0.66 | <.0001 |
| Hispanic | 0.37 | 0.26-0.53 | <.001 | 0.56 | 0.42-0.76 | <.0001 |
| Other | 0.53 | 0.40-0.71 | <.001 | 0.55 | 0.43-0.72 | <.0001 |
| Not married (referent) | ||||||
| Married | 1.23 | 1.12-1.37 | <.001 | 1.28 | 1.18-1.38 | <.0001 |
| <high></high></high> | ||||||
| High school | 1.28 | 1.10-1.50 | .002 | 1.28 | 1.14-1.44 | <.0001 |
| Some college | 1.54 | 1.30-1.83 | <.001 | 1.50 | 1.32-1.69 | <.0001 |
| College grad | 1.82 | 1.55-2.13 | <.001 | 1.79 | 1.57-2.05 | <.0001 |
| Health access‡ (“Low” is referent) | ||||||
| Medium | 1.32 | 0.71-2.45 | .378 | 1.72 | 1.03-2.87 | .038 |
| High | 2.41 | 1.32-4.41 | .004 | 3.08 | 1.88-5.05 | <.0001 |
| No checkup§ (referent) | ||||||
| Checkup 2 yr | 2.53 | 2.07-3.10 | <.001 | 2.72 | 2.18-3.40 | <.0001 |
| Fair/poor health (referent) | ||||||
| Ex/v good health | 0.76 | 0.68-0.85 | <.001 | 0.94 | 0.87-1.03 | .167 |
| Nonsmoker (referent) | ||||||
| Current smoker | 0.59 | 0.48-0.72 | <.001 | 0.68 | 0.58-0.79 | <.0001 |
| CI, confidence interval; OR, odds ratio. *N=27,632 for men and 50,024 for women. Includes 50 states plus the District of Columbia and excludes 3324 male respondents and 6295 female respondents with missing values for one or more measures. There were 2 separate models, one for men and one for women. †To be up to date, men required colon cancer screening (fecal occult blood test in past year or endoscopy within 10 years), a flu shot in the past year, and a pneumonia vaccination ever. Women required those same services plus a mammogram within 2 years and Pap test within 3 years (unless prior hysterectomy). ‡Determined from 3 measures: having health insurance, having a personal health care provider, and not reporting a cost barrier. Levels 0 and 1 were combined. Resulting levels were low, medium, and high. | ||||||
Discussion
The key finding in this study is that, although most adults ages 65 and older had high access to health care and recent routine checkups, their rates of being up to date with a recommended cluster of preventive services were only about 45% for men and 37% for women.
More than 91% of men and 93% of women reported they had a routine checkup during this timeframe, and 88.6% of men and 90.2% of women also reported they had high access to health care—ie, they had health insurance, at least 1 personal health care provider, and no cost barrier to seeing a doctor. Improving access to health care or increasing the use of routine medical checkups—even to 100%—would likely have a negligible impact on the delivery of recommended services. Despite the very modest composite delivery rates of recommended preventive services in this group, the rates were still 2 to 4 times higher than those of adults with low health care access or no recent routine checkup.
We also found that being up to date generally improves with age. Granted, there is uncertainty as to the appropriate age at which to stop specific screenings. And very elderly Americans may be receiving some services no longer of benefit. But the significance of our finding is that composite delivery rates were lowest among adults at the age for which broad consensus says services are beneficial. For example, the up-to-date rates for men and women ages 65 to 69 were 32% and 29.8%, respectively, compared with 48.7% and 40.2% for adults ages 75 to 79 (TABLE 2).
Our findings are consistent with research documenting inadequate time to incorporate preventive services into the typical office visit.11,12 Similar barriers have been identified by general practitioners in the United Kingdom.13,14 The time constraint is particularly consequential in high-volume primary care practices.15 Some investigations have calculated the actual or necessary time needed to deliver multiple recommended prevention and health promotion services and have found the requirement to be unrealistically high.16-20 Our study suggests that increased access to and use of health care services is a necessary but insufficient condition for achieving high up-to-date levels.
To improve up-to-date rates, likely actions will include more efficient use of office time, increased reliance on nonphysician clinicians, greater use of electronic medical records, and prioritizing services for a routine checkup. External policy changes, such as pay-for-performance, may also enhance preventive service delivery rates. We hope that, in time, the composite measure used in this analysis will be adopted by both primary care clinicians and public health practitioners in the same way that tracking composite children’s vaccination levels are helpful to family practitioners, pediatricians, and local health departments. However, there is probably no easy answer; even the prompts enabled by electronic medical records are useless when ignored by providers.21 Improving delivery of preventive services in office settings will require multiple strategies sustained over many years.22
Community-based efforts. There is a strong rationale for a more determined policy to expand community-based access. Many community-based approaches to individual preventive services have been developed over the last 10 years.23 For example, the CDC’s National Breast and Cervical Cancer Early Detection Program represents one model of a state-based program that can make local assistance available for uninsured women.24 In addition, an evidence-based model developed by the nonprofit agency SPARC (Sickness Prevention Achieved through Regional Collaboration) suggests ways of creating community-based points of access for multiple preventive services.25-27
Questions still unanswered. Although BRFSS data suggest older adults are regularly receiving “routine checkups,” it is not clear what kind of intervention this refers to beyond its nonacute nature. What characterizes routine checkups in patients’ minds, and how might such visits be limited as venues for providing preventive services? Furthermore, what are the characteristics of providers associated with different types of checkup services? How do primary care providers differ from subspecialists in the kinds of preventive services they provide? Answers to these questions have important implications for physician training and for targeted outreach to subspecialty groups. From a community standpoint, it would be helpful to know if there are specific untapped opportunities for delivering preventive services, particularly in underserved and minority communities where coverage rates are very low.
This study’s limitations. Because the BRFSS relies on self-reports, our findings are subject to various biases, including “telescoping,”28 the tendency of people to remember events as having occurred more recently than they actually did.29 Moreover, because BRFSS surveys exclude people in households without telephones (who are more likely to be poor and thus also less likely to have access to health care and preventive services), our estimates may be slightly higher than the true rates.30 People with cell phone service only were not sampled; however, this had little impact on estimates for older adults, since just an estimated 2.2% use cell phones exclusively.31 People in institutions, such as nursing homes, which account for 3% to 4% of adults 65 and older were also excluded.32
The strength of this study is that, based on a large sample of randomly selected respondents, it is the first report on the adoption of clinical preventive services in all states in relation to the use of routine checkups and a composite measure. However, as noted in the methods, although the interviewer provided a definition for the term routine checkup, the description may have been interpreted differently by survey respondents.
The provider’s office and medical home should remain at the center of a national strategy to increase the delivery of these services, but expanding these efforts to include community access is critical to improving overall rates of preventive services. We need more determined and strategic collaborations between medicine and public health that will facilitate access to, and use of, preventive services for all Americans.
CORRESPONDENCE
Douglas Shenson, MD, MPH, 76 Prince Street, Newton, MA 02465; [email protected]
1. U.S. Preventive Services Task Force. Guide to Clinical Preventive Services: Report of the U.S. Preventive Services Task Force. 3rd ed. Baltimore, Md: Williams and Wilkins; 2004.
2. Shenson D, Bolen J, Adams M. Receipt of preventive services by elders based on composite measures, 1997-2004. Am J Prev Med. 2007;32:11-18.
3. Behavioral Risk Factor Surveillance System operational and users guide version 3.0, March 2005. Available at: http://www.cdc.gov/brfss/pdf/userguide.pdf. Access December 14, 2010.
4. US Preventive Services Task Force The Guide to Clinical Preventive Services, 2007: Recommendations of the US Preventive Services Task Force. Rockville, Md: Agency for Healthcare Research and Quality; September 2007: 23, 26, 32, 204-205, 232. AHRQ publication 07-05100. Available at: https://www.oxhp.com/secure/materials/member/adult_preventive.pdf. Accessed December 21, 2010.
5. Centers for Disease Control and Prevention State-specific trends in self-reported blood pressure screening and high blood pressure—United States, 1991–1999. MMWR Morb Mortal Wkly Rep. 2002;51(21):456-460.
6. US Preventive Services Task Force The Guide to Clinical Preventive Services 2007: Recommendations of the US Preventive Services Task Force. Rockville, Md: Agency for Healthcare Research and Quality; September 2007: 32-33. AHRQ publication 07-05100. Available at: https://www.oxhp.com/secure/materials/member/adult_preventive.pdf. Accessed December 21, 2010.
7. Byers T, Levin B, Rothenberger D, et al. American Cancer Society guidelines for screening and surveillance for early detection of colorectal polyps and cancer: update 1997. CA Cancer J Clin. 1997;47:154-160.
8. U.S. Preventive Services Task Force. Screening for colorectal cancer: recommendation and rational. Ann Intern Med. 2002;137:129-131.
9. US. Preventive Services Task Force. Screening for cervical cancer: recommendations and rationale. January 2003. AHRQ Publication 03-515A. Available at: www.uspreventiveservicestaskforce.org/uspstf/uspscerv.htm. Accessed December 21, 2010.
10. Shenson D, Bolen J, Adams M. Receipt of preventive services by elders based on composite measures, 1997–2004. Am J Prev Med. 2007;32:11-18.
11. Burack RC. Barriers to clinical preventive medicine. Prim Care. 1989;116:245-250.
12. Kottke TE, Brekke ML, Solberg LI. Making “time” for preventive services. Mayo Clin Proc. 1993;68:786-791.
13. Waller D, Agass M, Mant D, et al. Health checks in general practice: another example of inverse care law? BMJ. 1990;300:1115-1118.
14. Fowler G, Mant D. Health checks for adults. BMJ. 1990;300:1318-1320.
15. Zyzanski SJ, Stange KC, Langa D, et al. Trade-offs in high-volume primary care practices. J Fam Pract. 1998;46:397-402.
16. Yarnall KSH, Pollak KI, Ostbye T, et al. Primary care: is there enough time for prevention? Am J Public Health. 2003;93:635-641.
17. Carney PA, Dietrich AJ, Freeman DH Jr, et al. The periodic health examination provided to asymptomatic older women: an assessment using standardized patients. Ann Intern Med. 1993;119:129-135.
18. Stange KC, Flocke SA, Goodwin MA. Opportunistic preventive services delivery. Are time limitations and patient satisfaction barriers? J Fam Pract. 1998;46:419-424.
19. Russell NK, Roter DL. Health promotion counseling of chronic-disease patients during primary care visits. Am J Public Health. 1993;83:979-982.
20. Rafferty M. Prevention services in primary care: taking time, setting priorities. West J Med. 1998;169:269-275.
21. Schellhase KG, Koepsell TD, Norris TE. Providers’ reactions to an automated health maintenance reminder system incorporated into the patient’s electronic medical record. J Am Board Fam Pract. 2003;16:350-351.
22. Ballard DJ, Nicewander DA, Qin H, et al. Improving delivery of clinical preventive services: a multi-year journey. Am J Prev Med. 2007;33:492-497.
23. Shenson D. Putting prevention in its place: the shift from clinic to community. Health Aff (Millwood). 2006;25:1012-1015.
24. Centers for Disease Control and Prevention. National Breast and Cervical Early Detection Program. Available at: www.cdc.gov/cancer/NBCCEDP/. Accessed: June 20, 2008.
25. Shenson D, Benson W, Harris A. Expanding the delivery of preventive services through community collaboration: the SPARC model. Prev Chronic Dis. 2008;5(1). Available at http://www.cdc.gov/pcd/issues/2008/jan/07_0139.htm. Accessed December 14, 2010.
26. Shenson D, Quinley J, DiMartino D, et al. Pneumococcal immunizations at flu clinics: the impact of community-wide outreach. J Community Health. 2001;26:191-201.
27. Shenson D, Cassarino L, DiMartino D, et al. Improving access to mammography through community-based influenza clinics: a quasi-experimental study. Am J Prev Med. 2001;20:97-102.
28. Sudman SN, Bradburn NM. Effects of time and memory on response in surveys. J Am Stat Assoc. 1973;68:805-815.
29. Newell SA, Girgis A, Sanson-Fisher RW, et al. The accuracy of self-reported health behaviors and risk factors relating to cancer and cardiovascular disease in the general population: a critical review. Am J Prev Med. 1999;17:211-229.
30. Thornberry OT, Massey JT. Trends in the United States telephone coverage across time and subgroup. In: Groves RM, Biemer PP, Lyberg LR, et al, eds. Telephone Survey Methodology. New York, NY: John Wiley & Sons; 1988:25–49.
31. Blumberg SJ, Luke JV. Wireless substitution: Early release of estimates from the National Health Interview Survey, July-December 2007. National Center for Health Statistics. Available at: http://www.cdc.gov/nchs/data/nhis/earlyrelease/wireless200805.htm. Accessed: May 13, 2008.
32. National Center for Health Statistics. Health, United States, 2002. Special excerpt: trend tables on 65 and older population. Washington, DC: Department of Health and Human Services; 2003. Publication 03-1030. Available at: www.cdc.gov/nchs/data/hushus02.pdf. Accessed December 21, 2010.
Background A small number of preventive services are recommended for all adults ages 65 years and older. It is well established that the combined delivery or being “up to date” on these measures is low. However, the effect of routine checkups on being up to date is not known. We examined the association between routine checkups and the delivery of a group of recommended clinical preventive services for US adults ages 65 and older.
Methods In 2006 the Behavioral Risk Factor Surveillance System conducted telephone surveys. Participants ages 65 years and older were randomly selected in 50 states and the District of Columbia. Sample sizes were 32,243 male respondents and 58,762 female respondents. A composite measure was used that includes screening for colorectal, cervical, and breast cancers, and vaccinations against influenza and pneumococcal disease. The measure quantifies the percentage of adults who are up to date according to recommended schedules.
Results Most adults ages 65 and older were fully insured, had a personal health care provider, reported no cost barrier to seeing a doctor in the past year, and had recently received a routine checkup. Associations between high health care access and checkups and the increased likelihood of being up to date on clinical preventive services were statistically significant. Although a large percentage of the population had high access to care and reported having a recent checkup, the percentage of all those who were up to date was low, and it was only slightly greater for those with high access or a recent checkup (42.6%, 45.1%, and 44.8%, respectively, for men; 35.2%, 37.0%, and 36.8%, respectively for women). For both sexes, the results varied by education, race/ethnicity, marriage, insurance, health, and state.
Conclusions Our study indicates that increasing the use of routine medical checkups will have a negligible impact on the delivery of preventive services.
Just because elderly patients are having regular checkups does not necessarily mean they are receiving needed preventive services. For individuals who are ages 65 and older, such services include vaccinations against influenza and pneumonia, screenings for hypertension and hypercholesterolemia, and screenings for breast, cervical, and colorectal cancers.1
Recently analyzed state and national data for a cluster of 5 of these services indicate that fewer than 41% of men and 32.5% of women ages 65 and older were up to date.2 Time constraints on health care providers and a lack of knowledge about guidelines are perhaps 2 of the biggest barriers to widespread provision of disease prevention services. In this study we extended an earlier analysis and examined, for individuals 65 years of age and older, the association between having a recent checkup and being up to date on a cluster of recommended preventive services. We also propose steps that will likely be needed to increase receipt of preventive services.
Methods
Data source
The Behavioral Risk Factor Surveillance System (BRFSS), coordinated by the Centers for Disease Control and Prevention (CDC), conducts annual state-based telephone surveys of noninstitutionalized US adults ages 18 years or older concerning health practices.3 We used data from 2006 BRFSS participants ages 65 years or older at the time they participated (32,243 male respondents and 58,762 female respondents). All results were based on weighted data that accounted for different probabilities of selection and were adjusted to reflect the population distribution in each state by age and sex, or by age, race, and sex.
Respondents queried about preventive services
We analyzed responses to BRFSS questions about the receipt of clinical preventive services recommended by the US Preventive Services Task Force (USPSTF) or by the Advisory Committee on Immunization Practices for all adults ages 65 or older.* Services included colorectal cancer screening, influenza immunization, pneumococcal immunization, and, for women, mammography and the Papanicolaou (Pap) test. The USPSTF grades these measures* as A or B, meaning it finds “good” or at least “fair” evidence that a service improves important health outcomes and concludes that benefits substantially outweigh harms.4 Questions about these services were asked in all 50 states in 2006.
*The recommendations and grading systems discussed here reflect those that were in place in 2006. There have been changes to both since this study was conducted.
Cardiovascular services excluded. The BRFSS has not asked questions about hypertension screening since 1999, when more than 95% of older adults reported they had their blood pressure checked in the past 2 years.5 Questions about cholesterol screening were not asked in all states in 2006 and were not incorporated into the composite measure. However, analysis from a prior study suggests that including cholesterol screening levels in such a composite measure would not have made a large difference in the percentage of older Americans up to date on all services.2
Were scheduled intervals for services met? Adults could meet the recommendation for colorectal cancer screening by either having a fecal occult blood test (FOBT) within 1 year or colonoscopy or sigmoidoscopy within 10 years. The USPSTF and other national guidelines recommend a 5-year interval for sigmoidoscopy and a 10-year interval for colonoscopy.6,7 However, no direct evidence has determined the optimal interval for either test,8 and the BRFSS question did not distinguish between the 2 interventions. Because either FOBT or endoscopy satisfies screening recommendations, we did not exclude respondents with missing values for 1 test if they had the other test within the recommended interval.
Other services and recommended intervals were pneumococcal vaccination (ever), influenza vaccination (in past year), and, for women, mammogram (within 2 years) and Pap test (within 3 years).
Assigning Yes or No to responses. If respondents had never received a particular preventive service or had received it outside the interval recommended by the USPSTF,4 we included them in the group answering No. We eliminated 3324 men and 6295 women with missing values for 1 or more measures.
Final determination of being “up to date.” After noting how many of the recommended services each individual had received according to age and sex, we dichotomized the sample according to whether all recommendations had been met—3 clinical preventive services for men 65 years and older (colorectal cancer screening, influenza, and pneumonia vaccination) and 5 for women (adding mammography and Pap test), with a single exception. Because Pap testing is often reported only for women with an intact cervix,9 we excused the lack of a Pap test for women who had undergone hysterectomy (47% of all women ages 65+, or 27,243). We required only that they meet 4 clinical preventive services to be considered up to date. A prior study revealed that excluding the Pap test entirely from the up-to-date measure for women 65 years and older had a minimal effect on up-to-date rates (34.2% when excluding the Pap test vs 32.5% including the Pap test).10
One of the strengths of the up-to-date measure is that it assesses the proportion of those fully up to date and thus allows for variability within subgroups, such as women who have had hysterectomies, without eliminating them arbitrarily from the sample.
Additional participant characteristics. We divided respondents into 4 racial/ethnic categories based on responses to BRFSS questions: White (non-Hispanic); Black (non-Hispanic); Hispanic of any race; or “Other” (American Indians, Asians, Pacific Islanders, and individuals of other or multiple race categories). Age categories were 65 to 69 years, 70 to 74 years, 75 to 79 years, or >80 years. Education categories: less than high school, high school graduate or general equivalency diploma recipient, some college, or college graduate. We further dichotomized the sample according to marital status, having 1 or more personal health care providers (vs none), and health status (fair/poor or good/very good/excellent). Given the amount of missing data (20%), household income was not included in the analysis.
Quantifying health care access. We created a measure of health care access using 3 factors:
- health insurance (“Do you have any kind of health care coverage, including health insurance, prepaid plans such as HMOs, or government plans such as Medicare?”)
- one or more personal health care providers (see above)
- no cost barrier to seeing a doctor (“Was there a time in the past 12 months when you needed to see a doctor but could not because of cost?”).
To measure relative health care access, we scored each of the above items 1 for affirmative or 0 for negative. The sum (0, 1, 2, or 3) represented level of access. Lower numbers indicated more barriers and higher numbers represented greater access. Because only 48 older men and 59 older women had total scores of 0, the lower 2 levels were combined and the resulting 3 levels were termed “low” (0 & 1), “medium” (2) and “high” (3) access. Two of the measures used for health care access were also used to define 3 mutually exclusive health insurance categories: uninsured, fully insured, and underinsured (insured but reporting a cost barrier).2
We determined whether a routine checkup had occurred in the past 2 years by asking, “About how long has it been since you last visited a doctor for a routine checkup? A routine checkup is a general physical exam, not an exam for a specific injury, illness, or condition.”
Statistical analysis
We conducted statistical analysis using Stata, version 9.0 (Stata Corp; College Station, Tex). We used Pearson chi-square tests to determine whether selected demographic factors were associated with being up to date on all recommended services. We also used Stata in a logistic regression analysis to control simultaneously for age, education, race/ethnicity, marital status, insurance coverage, health care access, having one or more personal health care providers, having a routine checkup within 2 years, current smoking, and health status. We computed odds ratios and 95% confidence intervals for each variable in the model.
Results
Most adults ages 65 years and older were fully insured, had a personal health care provider, and reported no cost barrier to seeing a doctor in the past year (TABLE 1). Breaking out these measures into 3 levels of relative health care access, 88.6% of men and 90.2% of women were at the highest level. More than 90% of respondents reported having a routine checkup in the past 2 years. More than 60% reported receiving each of the separate immunizations and cancer screenings recommended for their age and sex, and almost all had received at least 1 service.
TABLE 2 shows the prevalence of being up to date by demographic group. Only 42.6% of all older men and 35.2% of all older women were up to date, with rates marginally better for those with high access to care (45.1% for men, 37% for women) or those reporting a recent routine checkup (44.8% for men, 36.8% for women). Low access to care yielded dramatically worse up-to-date rates (14.8% for men, 9.1% for women). Similarly, those reporting no recent routine checkup had poor up-to-date rates (20.5% for men, 15.4% for women). The highest rates of being up to date belonged to those with a college degree (49% for men, 42.1% for women). Higher rates were also found among the oldest age groups.
Results of the logistic regression analysis are shown in TABLE 3. Among men and women, being up to date was more likely for those who were older, married, better educated, had high access to health care, and had had a routine checkup in the past 2 years. The latter 2 groups had the highest odds ratios of all groups in the model. Less likely to be up to date were those who were Black, Hispanic, or of a race other than white, those who smoked cigarettes, and (for men) those who were in good or better health. For women, health status had no effect on being up to date.
Table 1
Characteristics of US adults ≥65 years, 2006 Behavioral Risk Factor Surveillance System
| Men | Women | |||
|---|---|---|---|---|
| Percent | n | Percent | n | |
| Total | 100 | 32,243 | 100 | 58,762 |
| Age (y) | ||||
| 65-69 | 30.7 | 10,286 | 27.1 | 16,184 |
| 70-74 | 25.8 | 8410 | 21.2 | 14,005 |
| 75-79 | 22.9 | 6685 | 24.6 | 12,562 |
| ≥80 | 20.7 | 6862 | 27.1 | 16,011 |
| Race/ethnicity | ||||
| White | 81.7 | 27,720 | 81.5 | 50,270 |
| Black | 7.3 | 1631 | 8.0 | 3656 |
| Hispanic | 6.0 | 931 | 6.4 | 1824 |
| Other* | 5.0 | 1423 | 4.2 | 2218 |
| Education | ||||
| < High school | 15.0 | 5010 | 17.6 | 9931 |
| High school | 29.3 | 9905 | 39.0 | 22,978 |
| Some college | 20.9 | 6552 | 23.6 | 14,372 |
| College grad | 34.9 | 10,664 | 19.7 | 11,226 |
| Married | 74.0 | 20,593 | 44.5 | 20,551 |
| Insurance | ||||
| Fully insured | 94.2 | 30,147 | 94.0 | 55,066 |
| Underinsured† | 3.5 | 1173 | 4.3 | 2385 |
| Not insured | 2.3 | 754 | 1.7 | 993 |
| Has a personal health care provider | 93.1 | 29,657 | 95.3 | 55,586 |
| No cost barrier | 96.2 | 30,838 | 95.4 | 56,021 |
| Health care access‡ | ||||
| Low | 1.4 | 450 | 0.9 | 561 |
| Medium | 10.0 | 3521 | 8.8 | 5271 |
| High | 88.6 | 27,996 | 90.2 | 52,430 |
| Fair/poor health | 27.6 | 8957 | 29.7 | 16,727 |
| Clinical preventive services | ||||
| Flu shot past year | 68.3 | 21,725 | 67.0 | 39,205 |
| Pneumococcal polysaccharide vaccine | 63.6 | 19,531 | 66.7 | 38,442 |
| Colon cancer screen | 71.3 | 21,395 | 67.9 | 37,112 |
| Pap test in 3 years (women with cervix) | 70.8 | 19,700 | ||
| Pap test in 3 years (credit for hysterectomy) | 84.8 | 46,943 | ||
| Mammogram in 2 years | 79.1 | 43,874 | ||
| Number of health care services received | ||||
| 0 | 9.6 | 2993 | 3.0 | 1615 |
| 1 | 19.3 | 5335 | 5.0 | 2659 |
| 2 | 28.5 | 8085 | 10.9 | 5679 |
| 3§ | 42.6 | 12,506 | 19.2 | 10,108 |
| 4 | 26.8 | 13,935 | ||
| 5§ | 35.2 | 18,471 | ||
| Total|| | 100 | 28,919 | 100.0 | 52,467 |
| Routine checkup¶ | 91.5 | 28,845 | 93.1 | 53,037 |
| *Includes American Indian, Asian, Pacific Islander, and individuals of other or multiple race categories. †Underinsurance includes individuals with coverage who indicated there was a time in the past year when they needed to see a doctor but could not due to cost (cost barrier). ‡Determined from 3 measures: having health insurance, having a personal health care provider, and not reporting a cost barrier. Levels 0 and 1 were combined. Resulting levels were low, medium, and high. §To be up to date, men required colon cancer screening (fecal occult blood test in past year or endoscopy within 10 years), a flu shot in the past year, and a pneumonia vaccination ever. Women required those same services plus a mammogram within 2 years and Pap test within 3 years (unless prior hysterectomy). ||Total n excludes 3324 men and 6295 women with missing values for one or more tests. ¶Respondents who indicated they had a routine “checkup” in the past 2 years. | ||||
Table 2
Prevalence of being up to date* by demographic characteristics, US adults ≥65 years, 2006 Behavioral Risk Factor Surveillance System
| Men | Women | |||
|---|---|---|---|---|
| Percent | 95% CI | Percent | 95% CI | |
| Total | 42.6 | 41.6-43.7 | 35.2 | 34.4-36.0 |
| Age (y) | ||||
| 65-69 | 32.0 | 30.3-33.7 | 29.8 | 28.4-31.3 |
| 70-74 | 44.9 | 42.7-47.2 | 39.1 | 37.5-40.8 |
| 75-79 | 48.7 | 46.2-51.2 | 40.2 | 38.5-41.9 |
| ≥80 | 48.9 | 46.5-51.2 | 32.9 | 31.4-34.5 |
| P value | <.0001 | <.0001 | ||
| Race/ethnicity | ||||
| White | 46.2 | 45.1-47.3 | 37.9 | 37.1-38.7 |
| Black | 27.8 | 23.7-32.3 | 22.4 | 19.7-25.4 |
| Hispanic | 20.8 | 15.7-27.0 | 22.1 | 17.7-27.2 |
| Other† | 31.0 | 25.7-36.9 | 24.1 | 19.7-29.0 |
| P value | <.0001 | <.0001 | ||
| Married | ||||
| Yes | 44.3 | 43.0-45.7 | 39.3 | 38.1-40.6 |
| No | 37.7 | 35.9-39.5 | 31.7 | 30.7-32.7 |
| P value | <.0001 | <.0001 | ||
| Education | ||||
| < High school | 30.9 | 28.2-33.8 | 25.0 | 23.1-26.9 |
| High school | 39.5 | 37.7-41.4 | 34.2 | 33.0-35.4 |
| Some college | 44.3 | 41.9-46.8 | 38.2 | 36.6-39.7 |
| College grad | 49.0 | 47.2-50.9 | 42.1 | 40.2-44.1 |
| P value | <.0001 | <.0001 | ||
| Insurance | ||||
| Not insured | 19.9 | 15.1-25.8 | 17.9 | 13.2-23.9 |
| Underinsured | 29.3 | 25.0-34.0 | 24.3 | 20.7-28.2 |
| Fully insured | 43.7 | 42.5-44.8 | 36.0 | 35.2-36.8 |
| P value | <.0001 | <.0001 | ||
| Personal health care provider | ||||
| Has 1 or more | 44.4 | 43.3-45.5 | 36.3 | 35.5-37.1 |
| None | 18.8 | 16.1-21.9 | 11.4 | 9.3-14.0 |
| P value | <.0001 | <.0001 | ||
| Health status | ||||
| Fair/poor health | 44.3 | 42.1-46.5 | 33.2 | 31.7-34.8 |
| Ex/v good health | 41.9 | 40.7-43.2 | 36.0 | 35.1-37.0 |
| P value | .066 | .002 | ||
| Health access‡ | ||||
| “Low” | 14.8 | 9.1-23.1 | 9.1 | 5.9-13.7 |
| “Medium” | 24.7 | 22.2-27.4 | 19.3 | 17.1-21.8 |
| “High” | 45.1 | 43.9-46.3 | 37.0 | 36.2-37.9 |
| P value | <.0001 | <.0001 | ||
| Routine checkup§ | ||||
| Yes | 44.8 | 43.6-45.9 | 36.8 | 35.9-37.6 |
| No | 20.5 | 17.6-23.7 | 15.4 | 12.9-18.4 |
| P value | <.0001 | <.0001 | ||
| CI, confidence interval. *To be up to date, men required colon cancer screening (fecal occult blood test in past year or endoscopy within 10 years), a flu shot in the past year, and a pneumonia vaccination ever. Women required those same services plus a mammogram within 2 years and Pap test within 3 years (unless prior hysterectomy). †Other race includes American Indian, Asian, Pacific Islander, and individuals of other or multiple race categories. ‡Determined from 3 measures: having health insurance, having a personal health care provider, and not reporting a cost barrier. Levels 0 and 1 were combined. Resulting levels were low, medium, and high. §Respondents who indicated they had a routine “checkup” in the past 2 years. | ||||
TABLE 3
Results of multiple logistic regression modeling* for being up to date†for cancer screening and adult immunization, by sex and demographic characteristics: 2006 Behavioral Risk Factor Surveillance System, adults ≥65 years
| Men | Women | |||||
|---|---|---|---|---|---|---|
| OR | 95% CI | P value | OR | 95% CI | P value | |
| Age 65-69 y (referent) | ||||||
| 70-74 | 1.74 | 1.54-1.97 | <.001 | 1.54 | 1.39-1.70 | <.0001 |
| 75-79 | 2.04 | 1.79-2.32 | <.001 | 1.56 | 1.40-1.74 | <.0001 |
| ≥80 | 1.96 | 1.72-2.23 | <.001 | 1.19 | 1.06-1.32 | .002 |
| White (referent) | ||||||
| Black | 0.52 | 0.41-0.66 | <.001 | 0.55 | 0.46-0.66 | <.0001 |
| Hispanic | 0.37 | 0.26-0.53 | <.001 | 0.56 | 0.42-0.76 | <.0001 |
| Other | 0.53 | 0.40-0.71 | <.001 | 0.55 | 0.43-0.72 | <.0001 |
| Not married (referent) | ||||||
| Married | 1.23 | 1.12-1.37 | <.001 | 1.28 | 1.18-1.38 | <.0001 |
| <high></high></high> | ||||||
| High school | 1.28 | 1.10-1.50 | .002 | 1.28 | 1.14-1.44 | <.0001 |
| Some college | 1.54 | 1.30-1.83 | <.001 | 1.50 | 1.32-1.69 | <.0001 |
| College grad | 1.82 | 1.55-2.13 | <.001 | 1.79 | 1.57-2.05 | <.0001 |
| Health access‡ (“Low” is referent) | ||||||
| Medium | 1.32 | 0.71-2.45 | .378 | 1.72 | 1.03-2.87 | .038 |
| High | 2.41 | 1.32-4.41 | .004 | 3.08 | 1.88-5.05 | <.0001 |
| No checkup§ (referent) | ||||||
| Checkup 2 yr | 2.53 | 2.07-3.10 | <.001 | 2.72 | 2.18-3.40 | <.0001 |
| Fair/poor health (referent) | ||||||
| Ex/v good health | 0.76 | 0.68-0.85 | <.001 | 0.94 | 0.87-1.03 | .167 |
| Nonsmoker (referent) | ||||||
| Current smoker | 0.59 | 0.48-0.72 | <.001 | 0.68 | 0.58-0.79 | <.0001 |
| CI, confidence interval; OR, odds ratio. *N=27,632 for men and 50,024 for women. Includes 50 states plus the District of Columbia and excludes 3324 male respondents and 6295 female respondents with missing values for one or more measures. There were 2 separate models, one for men and one for women. †To be up to date, men required colon cancer screening (fecal occult blood test in past year or endoscopy within 10 years), a flu shot in the past year, and a pneumonia vaccination ever. Women required those same services plus a mammogram within 2 years and Pap test within 3 years (unless prior hysterectomy). ‡Determined from 3 measures: having health insurance, having a personal health care provider, and not reporting a cost barrier. Levels 0 and 1 were combined. Resulting levels were low, medium, and high. | ||||||
Discussion
The key finding in this study is that, although most adults ages 65 and older had high access to health care and recent routine checkups, their rates of being up to date with a recommended cluster of preventive services were only about 45% for men and 37% for women.
More than 91% of men and 93% of women reported they had a routine checkup during this timeframe, and 88.6% of men and 90.2% of women also reported they had high access to health care—ie, they had health insurance, at least 1 personal health care provider, and no cost barrier to seeing a doctor. Improving access to health care or increasing the use of routine medical checkups—even to 100%—would likely have a negligible impact on the delivery of recommended services. Despite the very modest composite delivery rates of recommended preventive services in this group, the rates were still 2 to 4 times higher than those of adults with low health care access or no recent routine checkup.
We also found that being up to date generally improves with age. Granted, there is uncertainty as to the appropriate age at which to stop specific screenings. And very elderly Americans may be receiving some services no longer of benefit. But the significance of our finding is that composite delivery rates were lowest among adults at the age for which broad consensus says services are beneficial. For example, the up-to-date rates for men and women ages 65 to 69 were 32% and 29.8%, respectively, compared with 48.7% and 40.2% for adults ages 75 to 79 (TABLE 2).
Our findings are consistent with research documenting inadequate time to incorporate preventive services into the typical office visit.11,12 Similar barriers have been identified by general practitioners in the United Kingdom.13,14 The time constraint is particularly consequential in high-volume primary care practices.15 Some investigations have calculated the actual or necessary time needed to deliver multiple recommended prevention and health promotion services and have found the requirement to be unrealistically high.16-20 Our study suggests that increased access to and use of health care services is a necessary but insufficient condition for achieving high up-to-date levels.
To improve up-to-date rates, likely actions will include more efficient use of office time, increased reliance on nonphysician clinicians, greater use of electronic medical records, and prioritizing services for a routine checkup. External policy changes, such as pay-for-performance, may also enhance preventive service delivery rates. We hope that, in time, the composite measure used in this analysis will be adopted by both primary care clinicians and public health practitioners in the same way that tracking composite children’s vaccination levels are helpful to family practitioners, pediatricians, and local health departments. However, there is probably no easy answer; even the prompts enabled by electronic medical records are useless when ignored by providers.21 Improving delivery of preventive services in office settings will require multiple strategies sustained over many years.22
Community-based efforts. There is a strong rationale for a more determined policy to expand community-based access. Many community-based approaches to individual preventive services have been developed over the last 10 years.23 For example, the CDC’s National Breast and Cervical Cancer Early Detection Program represents one model of a state-based program that can make local assistance available for uninsured women.24 In addition, an evidence-based model developed by the nonprofit agency SPARC (Sickness Prevention Achieved through Regional Collaboration) suggests ways of creating community-based points of access for multiple preventive services.25-27
Questions still unanswered. Although BRFSS data suggest older adults are regularly receiving “routine checkups,” it is not clear what kind of intervention this refers to beyond its nonacute nature. What characterizes routine checkups in patients’ minds, and how might such visits be limited as venues for providing preventive services? Furthermore, what are the characteristics of providers associated with different types of checkup services? How do primary care providers differ from subspecialists in the kinds of preventive services they provide? Answers to these questions have important implications for physician training and for targeted outreach to subspecialty groups. From a community standpoint, it would be helpful to know if there are specific untapped opportunities for delivering preventive services, particularly in underserved and minority communities where coverage rates are very low.
This study’s limitations. Because the BRFSS relies on self-reports, our findings are subject to various biases, including “telescoping,”28 the tendency of people to remember events as having occurred more recently than they actually did.29 Moreover, because BRFSS surveys exclude people in households without telephones (who are more likely to be poor and thus also less likely to have access to health care and preventive services), our estimates may be slightly higher than the true rates.30 People with cell phone service only were not sampled; however, this had little impact on estimates for older adults, since just an estimated 2.2% use cell phones exclusively.31 People in institutions, such as nursing homes, which account for 3% to 4% of adults 65 and older were also excluded.32
The strength of this study is that, based on a large sample of randomly selected respondents, it is the first report on the adoption of clinical preventive services in all states in relation to the use of routine checkups and a composite measure. However, as noted in the methods, although the interviewer provided a definition for the term routine checkup, the description may have been interpreted differently by survey respondents.
The provider’s office and medical home should remain at the center of a national strategy to increase the delivery of these services, but expanding these efforts to include community access is critical to improving overall rates of preventive services. We need more determined and strategic collaborations between medicine and public health that will facilitate access to, and use of, preventive services for all Americans.
CORRESPONDENCE
Douglas Shenson, MD, MPH, 76 Prince Street, Newton, MA 02465; [email protected]
Background A small number of preventive services are recommended for all adults ages 65 years and older. It is well established that the combined delivery or being “up to date” on these measures is low. However, the effect of routine checkups on being up to date is not known. We examined the association between routine checkups and the delivery of a group of recommended clinical preventive services for US adults ages 65 and older.
Methods In 2006 the Behavioral Risk Factor Surveillance System conducted telephone surveys. Participants ages 65 years and older were randomly selected in 50 states and the District of Columbia. Sample sizes were 32,243 male respondents and 58,762 female respondents. A composite measure was used that includes screening for colorectal, cervical, and breast cancers, and vaccinations against influenza and pneumococcal disease. The measure quantifies the percentage of adults who are up to date according to recommended schedules.
Results Most adults ages 65 and older were fully insured, had a personal health care provider, reported no cost barrier to seeing a doctor in the past year, and had recently received a routine checkup. Associations between high health care access and checkups and the increased likelihood of being up to date on clinical preventive services were statistically significant. Although a large percentage of the population had high access to care and reported having a recent checkup, the percentage of all those who were up to date was low, and it was only slightly greater for those with high access or a recent checkup (42.6%, 45.1%, and 44.8%, respectively, for men; 35.2%, 37.0%, and 36.8%, respectively for women). For both sexes, the results varied by education, race/ethnicity, marriage, insurance, health, and state.
Conclusions Our study indicates that increasing the use of routine medical checkups will have a negligible impact on the delivery of preventive services.
Just because elderly patients are having regular checkups does not necessarily mean they are receiving needed preventive services. For individuals who are ages 65 and older, such services include vaccinations against influenza and pneumonia, screenings for hypertension and hypercholesterolemia, and screenings for breast, cervical, and colorectal cancers.1
Recently analyzed state and national data for a cluster of 5 of these services indicate that fewer than 41% of men and 32.5% of women ages 65 and older were up to date.2 Time constraints on health care providers and a lack of knowledge about guidelines are perhaps 2 of the biggest barriers to widespread provision of disease prevention services. In this study we extended an earlier analysis and examined, for individuals 65 years of age and older, the association between having a recent checkup and being up to date on a cluster of recommended preventive services. We also propose steps that will likely be needed to increase receipt of preventive services.
Methods
Data source
The Behavioral Risk Factor Surveillance System (BRFSS), coordinated by the Centers for Disease Control and Prevention (CDC), conducts annual state-based telephone surveys of noninstitutionalized US adults ages 18 years or older concerning health practices.3 We used data from 2006 BRFSS participants ages 65 years or older at the time they participated (32,243 male respondents and 58,762 female respondents). All results were based on weighted data that accounted for different probabilities of selection and were adjusted to reflect the population distribution in each state by age and sex, or by age, race, and sex.
Respondents queried about preventive services
We analyzed responses to BRFSS questions about the receipt of clinical preventive services recommended by the US Preventive Services Task Force (USPSTF) or by the Advisory Committee on Immunization Practices for all adults ages 65 or older.* Services included colorectal cancer screening, influenza immunization, pneumococcal immunization, and, for women, mammography and the Papanicolaou (Pap) test. The USPSTF grades these measures* as A or B, meaning it finds “good” or at least “fair” evidence that a service improves important health outcomes and concludes that benefits substantially outweigh harms.4 Questions about these services were asked in all 50 states in 2006.
*The recommendations and grading systems discussed here reflect those that were in place in 2006. There have been changes to both since this study was conducted.
Cardiovascular services excluded. The BRFSS has not asked questions about hypertension screening since 1999, when more than 95% of older adults reported they had their blood pressure checked in the past 2 years.5 Questions about cholesterol screening were not asked in all states in 2006 and were not incorporated into the composite measure. However, analysis from a prior study suggests that including cholesterol screening levels in such a composite measure would not have made a large difference in the percentage of older Americans up to date on all services.2
Were scheduled intervals for services met? Adults could meet the recommendation for colorectal cancer screening by either having a fecal occult blood test (FOBT) within 1 year or colonoscopy or sigmoidoscopy within 10 years. The USPSTF and other national guidelines recommend a 5-year interval for sigmoidoscopy and a 10-year interval for colonoscopy.6,7 However, no direct evidence has determined the optimal interval for either test,8 and the BRFSS question did not distinguish between the 2 interventions. Because either FOBT or endoscopy satisfies screening recommendations, we did not exclude respondents with missing values for 1 test if they had the other test within the recommended interval.
Other services and recommended intervals were pneumococcal vaccination (ever), influenza vaccination (in past year), and, for women, mammogram (within 2 years) and Pap test (within 3 years).
Assigning Yes or No to responses. If respondents had never received a particular preventive service or had received it outside the interval recommended by the USPSTF,4 we included them in the group answering No. We eliminated 3324 men and 6295 women with missing values for 1 or more measures.
Final determination of being “up to date.” After noting how many of the recommended services each individual had received according to age and sex, we dichotomized the sample according to whether all recommendations had been met—3 clinical preventive services for men 65 years and older (colorectal cancer screening, influenza, and pneumonia vaccination) and 5 for women (adding mammography and Pap test), with a single exception. Because Pap testing is often reported only for women with an intact cervix,9 we excused the lack of a Pap test for women who had undergone hysterectomy (47% of all women ages 65+, or 27,243). We required only that they meet 4 clinical preventive services to be considered up to date. A prior study revealed that excluding the Pap test entirely from the up-to-date measure for women 65 years and older had a minimal effect on up-to-date rates (34.2% when excluding the Pap test vs 32.5% including the Pap test).10
One of the strengths of the up-to-date measure is that it assesses the proportion of those fully up to date and thus allows for variability within subgroups, such as women who have had hysterectomies, without eliminating them arbitrarily from the sample.
Additional participant characteristics. We divided respondents into 4 racial/ethnic categories based on responses to BRFSS questions: White (non-Hispanic); Black (non-Hispanic); Hispanic of any race; or “Other” (American Indians, Asians, Pacific Islanders, and individuals of other or multiple race categories). Age categories were 65 to 69 years, 70 to 74 years, 75 to 79 years, or >80 years. Education categories: less than high school, high school graduate or general equivalency diploma recipient, some college, or college graduate. We further dichotomized the sample according to marital status, having 1 or more personal health care providers (vs none), and health status (fair/poor or good/very good/excellent). Given the amount of missing data (20%), household income was not included in the analysis.
Quantifying health care access. We created a measure of health care access using 3 factors:
- health insurance (“Do you have any kind of health care coverage, including health insurance, prepaid plans such as HMOs, or government plans such as Medicare?”)
- one or more personal health care providers (see above)
- no cost barrier to seeing a doctor (“Was there a time in the past 12 months when you needed to see a doctor but could not because of cost?”).
To measure relative health care access, we scored each of the above items 1 for affirmative or 0 for negative. The sum (0, 1, 2, or 3) represented level of access. Lower numbers indicated more barriers and higher numbers represented greater access. Because only 48 older men and 59 older women had total scores of 0, the lower 2 levels were combined and the resulting 3 levels were termed “low” (0 & 1), “medium” (2) and “high” (3) access. Two of the measures used for health care access were also used to define 3 mutually exclusive health insurance categories: uninsured, fully insured, and underinsured (insured but reporting a cost barrier).2
We determined whether a routine checkup had occurred in the past 2 years by asking, “About how long has it been since you last visited a doctor for a routine checkup? A routine checkup is a general physical exam, not an exam for a specific injury, illness, or condition.”
Statistical analysis
We conducted statistical analysis using Stata, version 9.0 (Stata Corp; College Station, Tex). We used Pearson chi-square tests to determine whether selected demographic factors were associated with being up to date on all recommended services. We also used Stata in a logistic regression analysis to control simultaneously for age, education, race/ethnicity, marital status, insurance coverage, health care access, having one or more personal health care providers, having a routine checkup within 2 years, current smoking, and health status. We computed odds ratios and 95% confidence intervals for each variable in the model.
Results
Most adults ages 65 years and older were fully insured, had a personal health care provider, and reported no cost barrier to seeing a doctor in the past year (TABLE 1). Breaking out these measures into 3 levels of relative health care access, 88.6% of men and 90.2% of women were at the highest level. More than 90% of respondents reported having a routine checkup in the past 2 years. More than 60% reported receiving each of the separate immunizations and cancer screenings recommended for their age and sex, and almost all had received at least 1 service.
TABLE 2 shows the prevalence of being up to date by demographic group. Only 42.6% of all older men and 35.2% of all older women were up to date, with rates marginally better for those with high access to care (45.1% for men, 37% for women) or those reporting a recent routine checkup (44.8% for men, 36.8% for women). Low access to care yielded dramatically worse up-to-date rates (14.8% for men, 9.1% for women). Similarly, those reporting no recent routine checkup had poor up-to-date rates (20.5% for men, 15.4% for women). The highest rates of being up to date belonged to those with a college degree (49% for men, 42.1% for women). Higher rates were also found among the oldest age groups.
Results of the logistic regression analysis are shown in TABLE 3. Among men and women, being up to date was more likely for those who were older, married, better educated, had high access to health care, and had had a routine checkup in the past 2 years. The latter 2 groups had the highest odds ratios of all groups in the model. Less likely to be up to date were those who were Black, Hispanic, or of a race other than white, those who smoked cigarettes, and (for men) those who were in good or better health. For women, health status had no effect on being up to date.
Table 1
Characteristics of US adults ≥65 years, 2006 Behavioral Risk Factor Surveillance System
| Men | Women | |||
|---|---|---|---|---|
| Percent | n | Percent | n | |
| Total | 100 | 32,243 | 100 | 58,762 |
| Age (y) | ||||
| 65-69 | 30.7 | 10,286 | 27.1 | 16,184 |
| 70-74 | 25.8 | 8410 | 21.2 | 14,005 |
| 75-79 | 22.9 | 6685 | 24.6 | 12,562 |
| ≥80 | 20.7 | 6862 | 27.1 | 16,011 |
| Race/ethnicity | ||||
| White | 81.7 | 27,720 | 81.5 | 50,270 |
| Black | 7.3 | 1631 | 8.0 | 3656 |
| Hispanic | 6.0 | 931 | 6.4 | 1824 |
| Other* | 5.0 | 1423 | 4.2 | 2218 |
| Education | ||||
| < High school | 15.0 | 5010 | 17.6 | 9931 |
| High school | 29.3 | 9905 | 39.0 | 22,978 |
| Some college | 20.9 | 6552 | 23.6 | 14,372 |
| College grad | 34.9 | 10,664 | 19.7 | 11,226 |
| Married | 74.0 | 20,593 | 44.5 | 20,551 |
| Insurance | ||||
| Fully insured | 94.2 | 30,147 | 94.0 | 55,066 |
| Underinsured† | 3.5 | 1173 | 4.3 | 2385 |
| Not insured | 2.3 | 754 | 1.7 | 993 |
| Has a personal health care provider | 93.1 | 29,657 | 95.3 | 55,586 |
| No cost barrier | 96.2 | 30,838 | 95.4 | 56,021 |
| Health care access‡ | ||||
| Low | 1.4 | 450 | 0.9 | 561 |
| Medium | 10.0 | 3521 | 8.8 | 5271 |
| High | 88.6 | 27,996 | 90.2 | 52,430 |
| Fair/poor health | 27.6 | 8957 | 29.7 | 16,727 |
| Clinical preventive services | ||||
| Flu shot past year | 68.3 | 21,725 | 67.0 | 39,205 |
| Pneumococcal polysaccharide vaccine | 63.6 | 19,531 | 66.7 | 38,442 |
| Colon cancer screen | 71.3 | 21,395 | 67.9 | 37,112 |
| Pap test in 3 years (women with cervix) | 70.8 | 19,700 | ||
| Pap test in 3 years (credit for hysterectomy) | 84.8 | 46,943 | ||
| Mammogram in 2 years | 79.1 | 43,874 | ||
| Number of health care services received | ||||
| 0 | 9.6 | 2993 | 3.0 | 1615 |
| 1 | 19.3 | 5335 | 5.0 | 2659 |
| 2 | 28.5 | 8085 | 10.9 | 5679 |
| 3§ | 42.6 | 12,506 | 19.2 | 10,108 |
| 4 | 26.8 | 13,935 | ||
| 5§ | 35.2 | 18,471 | ||
| Total|| | 100 | 28,919 | 100.0 | 52,467 |
| Routine checkup¶ | 91.5 | 28,845 | 93.1 | 53,037 |
| *Includes American Indian, Asian, Pacific Islander, and individuals of other or multiple race categories. †Underinsurance includes individuals with coverage who indicated there was a time in the past year when they needed to see a doctor but could not due to cost (cost barrier). ‡Determined from 3 measures: having health insurance, having a personal health care provider, and not reporting a cost barrier. Levels 0 and 1 were combined. Resulting levels were low, medium, and high. §To be up to date, men required colon cancer screening (fecal occult blood test in past year or endoscopy within 10 years), a flu shot in the past year, and a pneumonia vaccination ever. Women required those same services plus a mammogram within 2 years and Pap test within 3 years (unless prior hysterectomy). ||Total n excludes 3324 men and 6295 women with missing values for one or more tests. ¶Respondents who indicated they had a routine “checkup” in the past 2 years. | ||||
Table 2
Prevalence of being up to date* by demographic characteristics, US adults ≥65 years, 2006 Behavioral Risk Factor Surveillance System
| Men | Women | |||
|---|---|---|---|---|
| Percent | 95% CI | Percent | 95% CI | |
| Total | 42.6 | 41.6-43.7 | 35.2 | 34.4-36.0 |
| Age (y) | ||||
| 65-69 | 32.0 | 30.3-33.7 | 29.8 | 28.4-31.3 |
| 70-74 | 44.9 | 42.7-47.2 | 39.1 | 37.5-40.8 |
| 75-79 | 48.7 | 46.2-51.2 | 40.2 | 38.5-41.9 |
| ≥80 | 48.9 | 46.5-51.2 | 32.9 | 31.4-34.5 |
| P value | <.0001 | <.0001 | ||
| Race/ethnicity | ||||
| White | 46.2 | 45.1-47.3 | 37.9 | 37.1-38.7 |
| Black | 27.8 | 23.7-32.3 | 22.4 | 19.7-25.4 |
| Hispanic | 20.8 | 15.7-27.0 | 22.1 | 17.7-27.2 |
| Other† | 31.0 | 25.7-36.9 | 24.1 | 19.7-29.0 |
| P value | <.0001 | <.0001 | ||
| Married | ||||
| Yes | 44.3 | 43.0-45.7 | 39.3 | 38.1-40.6 |
| No | 37.7 | 35.9-39.5 | 31.7 | 30.7-32.7 |
| P value | <.0001 | <.0001 | ||
| Education | ||||
| < High school | 30.9 | 28.2-33.8 | 25.0 | 23.1-26.9 |
| High school | 39.5 | 37.7-41.4 | 34.2 | 33.0-35.4 |
| Some college | 44.3 | 41.9-46.8 | 38.2 | 36.6-39.7 |
| College grad | 49.0 | 47.2-50.9 | 42.1 | 40.2-44.1 |
| P value | <.0001 | <.0001 | ||
| Insurance | ||||
| Not insured | 19.9 | 15.1-25.8 | 17.9 | 13.2-23.9 |
| Underinsured | 29.3 | 25.0-34.0 | 24.3 | 20.7-28.2 |
| Fully insured | 43.7 | 42.5-44.8 | 36.0 | 35.2-36.8 |
| P value | <.0001 | <.0001 | ||
| Personal health care provider | ||||
| Has 1 or more | 44.4 | 43.3-45.5 | 36.3 | 35.5-37.1 |
| None | 18.8 | 16.1-21.9 | 11.4 | 9.3-14.0 |
| P value | <.0001 | <.0001 | ||
| Health status | ||||
| Fair/poor health | 44.3 | 42.1-46.5 | 33.2 | 31.7-34.8 |
| Ex/v good health | 41.9 | 40.7-43.2 | 36.0 | 35.1-37.0 |
| P value | .066 | .002 | ||
| Health access‡ | ||||
| “Low” | 14.8 | 9.1-23.1 | 9.1 | 5.9-13.7 |
| “Medium” | 24.7 | 22.2-27.4 | 19.3 | 17.1-21.8 |
| “High” | 45.1 | 43.9-46.3 | 37.0 | 36.2-37.9 |
| P value | <.0001 | <.0001 | ||
| Routine checkup§ | ||||
| Yes | 44.8 | 43.6-45.9 | 36.8 | 35.9-37.6 |
| No | 20.5 | 17.6-23.7 | 15.4 | 12.9-18.4 |
| P value | <.0001 | <.0001 | ||
| CI, confidence interval. *To be up to date, men required colon cancer screening (fecal occult blood test in past year or endoscopy within 10 years), a flu shot in the past year, and a pneumonia vaccination ever. Women required those same services plus a mammogram within 2 years and Pap test within 3 years (unless prior hysterectomy). †Other race includes American Indian, Asian, Pacific Islander, and individuals of other or multiple race categories. ‡Determined from 3 measures: having health insurance, having a personal health care provider, and not reporting a cost barrier. Levels 0 and 1 were combined. Resulting levels were low, medium, and high. §Respondents who indicated they had a routine “checkup” in the past 2 years. | ||||
TABLE 3
Results of multiple logistic regression modeling* for being up to date†for cancer screening and adult immunization, by sex and demographic characteristics: 2006 Behavioral Risk Factor Surveillance System, adults ≥65 years
| Men | Women | |||||
|---|---|---|---|---|---|---|
| OR | 95% CI | P value | OR | 95% CI | P value | |
| Age 65-69 y (referent) | ||||||
| 70-74 | 1.74 | 1.54-1.97 | <.001 | 1.54 | 1.39-1.70 | <.0001 |
| 75-79 | 2.04 | 1.79-2.32 | <.001 | 1.56 | 1.40-1.74 | <.0001 |
| ≥80 | 1.96 | 1.72-2.23 | <.001 | 1.19 | 1.06-1.32 | .002 |
| White (referent) | ||||||
| Black | 0.52 | 0.41-0.66 | <.001 | 0.55 | 0.46-0.66 | <.0001 |
| Hispanic | 0.37 | 0.26-0.53 | <.001 | 0.56 | 0.42-0.76 | <.0001 |
| Other | 0.53 | 0.40-0.71 | <.001 | 0.55 | 0.43-0.72 | <.0001 |
| Not married (referent) | ||||||
| Married | 1.23 | 1.12-1.37 | <.001 | 1.28 | 1.18-1.38 | <.0001 |
| <high></high></high> | ||||||
| High school | 1.28 | 1.10-1.50 | .002 | 1.28 | 1.14-1.44 | <.0001 |
| Some college | 1.54 | 1.30-1.83 | <.001 | 1.50 | 1.32-1.69 | <.0001 |
| College grad | 1.82 | 1.55-2.13 | <.001 | 1.79 | 1.57-2.05 | <.0001 |
| Health access‡ (“Low” is referent) | ||||||
| Medium | 1.32 | 0.71-2.45 | .378 | 1.72 | 1.03-2.87 | .038 |
| High | 2.41 | 1.32-4.41 | .004 | 3.08 | 1.88-5.05 | <.0001 |
| No checkup§ (referent) | ||||||
| Checkup 2 yr | 2.53 | 2.07-3.10 | <.001 | 2.72 | 2.18-3.40 | <.0001 |
| Fair/poor health (referent) | ||||||
| Ex/v good health | 0.76 | 0.68-0.85 | <.001 | 0.94 | 0.87-1.03 | .167 |
| Nonsmoker (referent) | ||||||
| Current smoker | 0.59 | 0.48-0.72 | <.001 | 0.68 | 0.58-0.79 | <.0001 |
| CI, confidence interval; OR, odds ratio. *N=27,632 for men and 50,024 for women. Includes 50 states plus the District of Columbia and excludes 3324 male respondents and 6295 female respondents with missing values for one or more measures. There were 2 separate models, one for men and one for women. †To be up to date, men required colon cancer screening (fecal occult blood test in past year or endoscopy within 10 years), a flu shot in the past year, and a pneumonia vaccination ever. Women required those same services plus a mammogram within 2 years and Pap test within 3 years (unless prior hysterectomy). ‡Determined from 3 measures: having health insurance, having a personal health care provider, and not reporting a cost barrier. Levels 0 and 1 were combined. Resulting levels were low, medium, and high. | ||||||
Discussion
The key finding in this study is that, although most adults ages 65 and older had high access to health care and recent routine checkups, their rates of being up to date with a recommended cluster of preventive services were only about 45% for men and 37% for women.
More than 91% of men and 93% of women reported they had a routine checkup during this timeframe, and 88.6% of men and 90.2% of women also reported they had high access to health care—ie, they had health insurance, at least 1 personal health care provider, and no cost barrier to seeing a doctor. Improving access to health care or increasing the use of routine medical checkups—even to 100%—would likely have a negligible impact on the delivery of recommended services. Despite the very modest composite delivery rates of recommended preventive services in this group, the rates were still 2 to 4 times higher than those of adults with low health care access or no recent routine checkup.
We also found that being up to date generally improves with age. Granted, there is uncertainty as to the appropriate age at which to stop specific screenings. And very elderly Americans may be receiving some services no longer of benefit. But the significance of our finding is that composite delivery rates were lowest among adults at the age for which broad consensus says services are beneficial. For example, the up-to-date rates for men and women ages 65 to 69 were 32% and 29.8%, respectively, compared with 48.7% and 40.2% for adults ages 75 to 79 (TABLE 2).
Our findings are consistent with research documenting inadequate time to incorporate preventive services into the typical office visit.11,12 Similar barriers have been identified by general practitioners in the United Kingdom.13,14 The time constraint is particularly consequential in high-volume primary care practices.15 Some investigations have calculated the actual or necessary time needed to deliver multiple recommended prevention and health promotion services and have found the requirement to be unrealistically high.16-20 Our study suggests that increased access to and use of health care services is a necessary but insufficient condition for achieving high up-to-date levels.
To improve up-to-date rates, likely actions will include more efficient use of office time, increased reliance on nonphysician clinicians, greater use of electronic medical records, and prioritizing services for a routine checkup. External policy changes, such as pay-for-performance, may also enhance preventive service delivery rates. We hope that, in time, the composite measure used in this analysis will be adopted by both primary care clinicians and public health practitioners in the same way that tracking composite children’s vaccination levels are helpful to family practitioners, pediatricians, and local health departments. However, there is probably no easy answer; even the prompts enabled by electronic medical records are useless when ignored by providers.21 Improving delivery of preventive services in office settings will require multiple strategies sustained over many years.22
Community-based efforts. There is a strong rationale for a more determined policy to expand community-based access. Many community-based approaches to individual preventive services have been developed over the last 10 years.23 For example, the CDC’s National Breast and Cervical Cancer Early Detection Program represents one model of a state-based program that can make local assistance available for uninsured women.24 In addition, an evidence-based model developed by the nonprofit agency SPARC (Sickness Prevention Achieved through Regional Collaboration) suggests ways of creating community-based points of access for multiple preventive services.25-27
Questions still unanswered. Although BRFSS data suggest older adults are regularly receiving “routine checkups,” it is not clear what kind of intervention this refers to beyond its nonacute nature. What characterizes routine checkups in patients’ minds, and how might such visits be limited as venues for providing preventive services? Furthermore, what are the characteristics of providers associated with different types of checkup services? How do primary care providers differ from subspecialists in the kinds of preventive services they provide? Answers to these questions have important implications for physician training and for targeted outreach to subspecialty groups. From a community standpoint, it would be helpful to know if there are specific untapped opportunities for delivering preventive services, particularly in underserved and minority communities where coverage rates are very low.
This study’s limitations. Because the BRFSS relies on self-reports, our findings are subject to various biases, including “telescoping,”28 the tendency of people to remember events as having occurred more recently than they actually did.29 Moreover, because BRFSS surveys exclude people in households without telephones (who are more likely to be poor and thus also less likely to have access to health care and preventive services), our estimates may be slightly higher than the true rates.30 People with cell phone service only were not sampled; however, this had little impact on estimates for older adults, since just an estimated 2.2% use cell phones exclusively.31 People in institutions, such as nursing homes, which account for 3% to 4% of adults 65 and older were also excluded.32
The strength of this study is that, based on a large sample of randomly selected respondents, it is the first report on the adoption of clinical preventive services in all states in relation to the use of routine checkups and a composite measure. However, as noted in the methods, although the interviewer provided a definition for the term routine checkup, the description may have been interpreted differently by survey respondents.
The provider’s office and medical home should remain at the center of a national strategy to increase the delivery of these services, but expanding these efforts to include community access is critical to improving overall rates of preventive services. We need more determined and strategic collaborations between medicine and public health that will facilitate access to, and use of, preventive services for all Americans.
CORRESPONDENCE
Douglas Shenson, MD, MPH, 76 Prince Street, Newton, MA 02465; [email protected]
1. U.S. Preventive Services Task Force. Guide to Clinical Preventive Services: Report of the U.S. Preventive Services Task Force. 3rd ed. Baltimore, Md: Williams and Wilkins; 2004.
2. Shenson D, Bolen J, Adams M. Receipt of preventive services by elders based on composite measures, 1997-2004. Am J Prev Med. 2007;32:11-18.
3. Behavioral Risk Factor Surveillance System operational and users guide version 3.0, March 2005. Available at: http://www.cdc.gov/brfss/pdf/userguide.pdf. Access December 14, 2010.
4. US Preventive Services Task Force The Guide to Clinical Preventive Services, 2007: Recommendations of the US Preventive Services Task Force. Rockville, Md: Agency for Healthcare Research and Quality; September 2007: 23, 26, 32, 204-205, 232. AHRQ publication 07-05100. Available at: https://www.oxhp.com/secure/materials/member/adult_preventive.pdf. Accessed December 21, 2010.
5. Centers for Disease Control and Prevention State-specific trends in self-reported blood pressure screening and high blood pressure—United States, 1991–1999. MMWR Morb Mortal Wkly Rep. 2002;51(21):456-460.
6. US Preventive Services Task Force The Guide to Clinical Preventive Services 2007: Recommendations of the US Preventive Services Task Force. Rockville, Md: Agency for Healthcare Research and Quality; September 2007: 32-33. AHRQ publication 07-05100. Available at: https://www.oxhp.com/secure/materials/member/adult_preventive.pdf. Accessed December 21, 2010.
7. Byers T, Levin B, Rothenberger D, et al. American Cancer Society guidelines for screening and surveillance for early detection of colorectal polyps and cancer: update 1997. CA Cancer J Clin. 1997;47:154-160.
8. U.S. Preventive Services Task Force. Screening for colorectal cancer: recommendation and rational. Ann Intern Med. 2002;137:129-131.
9. US. Preventive Services Task Force. Screening for cervical cancer: recommendations and rationale. January 2003. AHRQ Publication 03-515A. Available at: www.uspreventiveservicestaskforce.org/uspstf/uspscerv.htm. Accessed December 21, 2010.
10. Shenson D, Bolen J, Adams M. Receipt of preventive services by elders based on composite measures, 1997–2004. Am J Prev Med. 2007;32:11-18.
11. Burack RC. Barriers to clinical preventive medicine. Prim Care. 1989;116:245-250.
12. Kottke TE, Brekke ML, Solberg LI. Making “time” for preventive services. Mayo Clin Proc. 1993;68:786-791.
13. Waller D, Agass M, Mant D, et al. Health checks in general practice: another example of inverse care law? BMJ. 1990;300:1115-1118.
14. Fowler G, Mant D. Health checks for adults. BMJ. 1990;300:1318-1320.
15. Zyzanski SJ, Stange KC, Langa D, et al. Trade-offs in high-volume primary care practices. J Fam Pract. 1998;46:397-402.
16. Yarnall KSH, Pollak KI, Ostbye T, et al. Primary care: is there enough time for prevention? Am J Public Health. 2003;93:635-641.
17. Carney PA, Dietrich AJ, Freeman DH Jr, et al. The periodic health examination provided to asymptomatic older women: an assessment using standardized patients. Ann Intern Med. 1993;119:129-135.
18. Stange KC, Flocke SA, Goodwin MA. Opportunistic preventive services delivery. Are time limitations and patient satisfaction barriers? J Fam Pract. 1998;46:419-424.
19. Russell NK, Roter DL. Health promotion counseling of chronic-disease patients during primary care visits. Am J Public Health. 1993;83:979-982.
20. Rafferty M. Prevention services in primary care: taking time, setting priorities. West J Med. 1998;169:269-275.
21. Schellhase KG, Koepsell TD, Norris TE. Providers’ reactions to an automated health maintenance reminder system incorporated into the patient’s electronic medical record. J Am Board Fam Pract. 2003;16:350-351.
22. Ballard DJ, Nicewander DA, Qin H, et al. Improving delivery of clinical preventive services: a multi-year journey. Am J Prev Med. 2007;33:492-497.
23. Shenson D. Putting prevention in its place: the shift from clinic to community. Health Aff (Millwood). 2006;25:1012-1015.
24. Centers for Disease Control and Prevention. National Breast and Cervical Early Detection Program. Available at: www.cdc.gov/cancer/NBCCEDP/. Accessed: June 20, 2008.
25. Shenson D, Benson W, Harris A. Expanding the delivery of preventive services through community collaboration: the SPARC model. Prev Chronic Dis. 2008;5(1). Available at http://www.cdc.gov/pcd/issues/2008/jan/07_0139.htm. Accessed December 14, 2010.
26. Shenson D, Quinley J, DiMartino D, et al. Pneumococcal immunizations at flu clinics: the impact of community-wide outreach. J Community Health. 2001;26:191-201.
27. Shenson D, Cassarino L, DiMartino D, et al. Improving access to mammography through community-based influenza clinics: a quasi-experimental study. Am J Prev Med. 2001;20:97-102.
28. Sudman SN, Bradburn NM. Effects of time and memory on response in surveys. J Am Stat Assoc. 1973;68:805-815.
29. Newell SA, Girgis A, Sanson-Fisher RW, et al. The accuracy of self-reported health behaviors and risk factors relating to cancer and cardiovascular disease in the general population: a critical review. Am J Prev Med. 1999;17:211-229.
30. Thornberry OT, Massey JT. Trends in the United States telephone coverage across time and subgroup. In: Groves RM, Biemer PP, Lyberg LR, et al, eds. Telephone Survey Methodology. New York, NY: John Wiley & Sons; 1988:25–49.
31. Blumberg SJ, Luke JV. Wireless substitution: Early release of estimates from the National Health Interview Survey, July-December 2007. National Center for Health Statistics. Available at: http://www.cdc.gov/nchs/data/nhis/earlyrelease/wireless200805.htm. Accessed: May 13, 2008.
32. National Center for Health Statistics. Health, United States, 2002. Special excerpt: trend tables on 65 and older population. Washington, DC: Department of Health and Human Services; 2003. Publication 03-1030. Available at: www.cdc.gov/nchs/data/hushus02.pdf. Accessed December 21, 2010.
1. U.S. Preventive Services Task Force. Guide to Clinical Preventive Services: Report of the U.S. Preventive Services Task Force. 3rd ed. Baltimore, Md: Williams and Wilkins; 2004.
2. Shenson D, Bolen J, Adams M. Receipt of preventive services by elders based on composite measures, 1997-2004. Am J Prev Med. 2007;32:11-18.
3. Behavioral Risk Factor Surveillance System operational and users guide version 3.0, March 2005. Available at: http://www.cdc.gov/brfss/pdf/userguide.pdf. Access December 14, 2010.
4. US Preventive Services Task Force The Guide to Clinical Preventive Services, 2007: Recommendations of the US Preventive Services Task Force. Rockville, Md: Agency for Healthcare Research and Quality; September 2007: 23, 26, 32, 204-205, 232. AHRQ publication 07-05100. Available at: https://www.oxhp.com/secure/materials/member/adult_preventive.pdf. Accessed December 21, 2010.
5. Centers for Disease Control and Prevention State-specific trends in self-reported blood pressure screening and high blood pressure—United States, 1991–1999. MMWR Morb Mortal Wkly Rep. 2002;51(21):456-460.
6. US Preventive Services Task Force The Guide to Clinical Preventive Services 2007: Recommendations of the US Preventive Services Task Force. Rockville, Md: Agency for Healthcare Research and Quality; September 2007: 32-33. AHRQ publication 07-05100. Available at: https://www.oxhp.com/secure/materials/member/adult_preventive.pdf. Accessed December 21, 2010.
7. Byers T, Levin B, Rothenberger D, et al. American Cancer Society guidelines for screening and surveillance for early detection of colorectal polyps and cancer: update 1997. CA Cancer J Clin. 1997;47:154-160.
8. U.S. Preventive Services Task Force. Screening for colorectal cancer: recommendation and rational. Ann Intern Med. 2002;137:129-131.
9. US. Preventive Services Task Force. Screening for cervical cancer: recommendations and rationale. January 2003. AHRQ Publication 03-515A. Available at: www.uspreventiveservicestaskforce.org/uspstf/uspscerv.htm. Accessed December 21, 2010.
10. Shenson D, Bolen J, Adams M. Receipt of preventive services by elders based on composite measures, 1997–2004. Am J Prev Med. 2007;32:11-18.
11. Burack RC. Barriers to clinical preventive medicine. Prim Care. 1989;116:245-250.
12. Kottke TE, Brekke ML, Solberg LI. Making “time” for preventive services. Mayo Clin Proc. 1993;68:786-791.
13. Waller D, Agass M, Mant D, et al. Health checks in general practice: another example of inverse care law? BMJ. 1990;300:1115-1118.
14. Fowler G, Mant D. Health checks for adults. BMJ. 1990;300:1318-1320.
15. Zyzanski SJ, Stange KC, Langa D, et al. Trade-offs in high-volume primary care practices. J Fam Pract. 1998;46:397-402.
16. Yarnall KSH, Pollak KI, Ostbye T, et al. Primary care: is there enough time for prevention? Am J Public Health. 2003;93:635-641.
17. Carney PA, Dietrich AJ, Freeman DH Jr, et al. The periodic health examination provided to asymptomatic older women: an assessment using standardized patients. Ann Intern Med. 1993;119:129-135.
18. Stange KC, Flocke SA, Goodwin MA. Opportunistic preventive services delivery. Are time limitations and patient satisfaction barriers? J Fam Pract. 1998;46:419-424.
19. Russell NK, Roter DL. Health promotion counseling of chronic-disease patients during primary care visits. Am J Public Health. 1993;83:979-982.
20. Rafferty M. Prevention services in primary care: taking time, setting priorities. West J Med. 1998;169:269-275.
21. Schellhase KG, Koepsell TD, Norris TE. Providers’ reactions to an automated health maintenance reminder system incorporated into the patient’s electronic medical record. J Am Board Fam Pract. 2003;16:350-351.
22. Ballard DJ, Nicewander DA, Qin H, et al. Improving delivery of clinical preventive services: a multi-year journey. Am J Prev Med. 2007;33:492-497.
23. Shenson D. Putting prevention in its place: the shift from clinic to community. Health Aff (Millwood). 2006;25:1012-1015.
24. Centers for Disease Control and Prevention. National Breast and Cervical Early Detection Program. Available at: www.cdc.gov/cancer/NBCCEDP/. Accessed: June 20, 2008.
25. Shenson D, Benson W, Harris A. Expanding the delivery of preventive services through community collaboration: the SPARC model. Prev Chronic Dis. 2008;5(1). Available at http://www.cdc.gov/pcd/issues/2008/jan/07_0139.htm. Accessed December 14, 2010.
26. Shenson D, Quinley J, DiMartino D, et al. Pneumococcal immunizations at flu clinics: the impact of community-wide outreach. J Community Health. 2001;26:191-201.
27. Shenson D, Cassarino L, DiMartino D, et al. Improving access to mammography through community-based influenza clinics: a quasi-experimental study. Am J Prev Med. 2001;20:97-102.
28. Sudman SN, Bradburn NM. Effects of time and memory on response in surveys. J Am Stat Assoc. 1973;68:805-815.
29. Newell SA, Girgis A, Sanson-Fisher RW, et al. The accuracy of self-reported health behaviors and risk factors relating to cancer and cardiovascular disease in the general population: a critical review. Am J Prev Med. 1999;17:211-229.
30. Thornberry OT, Massey JT. Trends in the United States telephone coverage across time and subgroup. In: Groves RM, Biemer PP, Lyberg LR, et al, eds. Telephone Survey Methodology. New York, NY: John Wiley & Sons; 1988:25–49.
31. Blumberg SJ, Luke JV. Wireless substitution: Early release of estimates from the National Health Interview Survey, July-December 2007. National Center for Health Statistics. Available at: http://www.cdc.gov/nchs/data/nhis/earlyrelease/wireless200805.htm. Accessed: May 13, 2008.
32. National Center for Health Statistics. Health, United States, 2002. Special excerpt: trend tables on 65 and older population. Washington, DC: Department of Health and Human Services; 2003. Publication 03-1030. Available at: www.cdc.gov/nchs/data/hushus02.pdf. Accessed December 21, 2010.