User login
Suicide factors: UNSAFE or SAFER?
The basic function of a suicide assessment is to identify fixed and modifiable risk factors for suicide and existing or amendable protective factors.1 Epidemiologic studies have defined a range of suicide risk and protective factors for the general population.2 Other research has delineated suicide risk and protective factors for individuals with specific psychiatric disorders.3 The presence of disorder-specific risk and protective factors for suicide must be identified during suicide risk assessment.
Risk factors
Lack of support from family, peers, or the community is a critical concern. Noncompliance with treatment may be associated with onset of suicidality. Help-seeking is impeded by stigma associated with suicide and shame for past attempts. History of physical, sexual, or psychological abuse is tied to subsequent suicidal behavior. Alcohol abuse plays a role in suicide. Many patients who attempt suicide have backgrounds involving suicide loss or attempts by family members. Recurring psychiatric symptoms—particularly depression, anxiety, and panic—can trigger suicidality. Symptom relapse may lead to hospitalization, which is followed by a high-risk period after discharge.
These suicide risk factors can be summarized by the mnemonic UNSAFE:
Unconnected—no support; sense of not belonging or being a burden
Nonadherence—unmanaged mental illness or co-occurring disorders
Stigma/shame related to past attempts or suicidal behavior
Abuse history and/or alcohol misuse; prior attempt
Family history of suicide or suicide attempts
Exacerbations—worsened mental illness, hospitalizations
Protective factors
The presence of a personal crisis or safety self-help plan shows patient insight. Maintaining prescribed treatment indicates a patient’s likelihood of complying with clinical and self-care measures to avert future suicidality. Accessible support from family, peers, and the community demonstrates social integration. The recovery concept promotes these factors as well as wellness and resilience. Awareness of the warning signs of suicide and personal risk factors and precipitants is essential for self-help and help-seeking.
Protective factors for suicide can be summarized by the mnemonic SAFER:
Self-help skills, personal crisis/suicide prevention plan
Adherence to treatment plan
Family and community support
Education about risk factors, warning signs, and triggers for suicide
Recovery and resilience
In our emergency psychiatric facility the UNSAFE and SAFE mnemonics are posted next to the desk of the on-duty psychiatrist. Crisis center staff use these mnemonics to screen patients during psychiatric evaluations. Allied therapists use them during in-patient psychoeducation about suicidality. Peer specialists use them to help patients prepare personal safety plans.
Disclosure
The authors report no financial relationship with any company whose products are mentioned in this article or with manufactures of competing products.
These mnemonics were developed by Tony Salvatore in consultation with Rocio Nell, MD, CPE.
1. Simon R, Shuman DW. The standard of care in suicide risk assessment: an elusive concept. CNS Spectr. 2006;11(6):442-445.
2. Goldsmith SK, Pellmar TC, Kleinman AM, et al. eds. Reducing suicide: a national imperative. Washington, DC: The National Academies Press; 2002.
3. Harris EC, Barraclough B. Suicide as an outcome for mental disorders. A meta-analysis. Br J Psychiatry. 1997;170(3):205-228.
The basic function of a suicide assessment is to identify fixed and modifiable risk factors for suicide and existing or amendable protective factors.1 Epidemiologic studies have defined a range of suicide risk and protective factors for the general population.2 Other research has delineated suicide risk and protective factors for individuals with specific psychiatric disorders.3 The presence of disorder-specific risk and protective factors for suicide must be identified during suicide risk assessment.
Risk factors
Lack of support from family, peers, or the community is a critical concern. Noncompliance with treatment may be associated with onset of suicidality. Help-seeking is impeded by stigma associated with suicide and shame for past attempts. History of physical, sexual, or psychological abuse is tied to subsequent suicidal behavior. Alcohol abuse plays a role in suicide. Many patients who attempt suicide have backgrounds involving suicide loss or attempts by family members. Recurring psychiatric symptoms—particularly depression, anxiety, and panic—can trigger suicidality. Symptom relapse may lead to hospitalization, which is followed by a high-risk period after discharge.
These suicide risk factors can be summarized by the mnemonic UNSAFE:
Unconnected—no support; sense of not belonging or being a burden
Nonadherence—unmanaged mental illness or co-occurring disorders
Stigma/shame related to past attempts or suicidal behavior
Abuse history and/or alcohol misuse; prior attempt
Family history of suicide or suicide attempts
Exacerbations—worsened mental illness, hospitalizations
Protective factors
The presence of a personal crisis or safety self-help plan shows patient insight. Maintaining prescribed treatment indicates a patient’s likelihood of complying with clinical and self-care measures to avert future suicidality. Accessible support from family, peers, and the community demonstrates social integration. The recovery concept promotes these factors as well as wellness and resilience. Awareness of the warning signs of suicide and personal risk factors and precipitants is essential for self-help and help-seeking.
Protective factors for suicide can be summarized by the mnemonic SAFER:
Self-help skills, personal crisis/suicide prevention plan
Adherence to treatment plan
Family and community support
Education about risk factors, warning signs, and triggers for suicide
Recovery and resilience
In our emergency psychiatric facility the UNSAFE and SAFE mnemonics are posted next to the desk of the on-duty psychiatrist. Crisis center staff use these mnemonics to screen patients during psychiatric evaluations. Allied therapists use them during in-patient psychoeducation about suicidality. Peer specialists use them to help patients prepare personal safety plans.
Disclosure
The authors report no financial relationship with any company whose products are mentioned in this article or with manufactures of competing products.
These mnemonics were developed by Tony Salvatore in consultation with Rocio Nell, MD, CPE.
The basic function of a suicide assessment is to identify fixed and modifiable risk factors for suicide and existing or amendable protective factors.1 Epidemiologic studies have defined a range of suicide risk and protective factors for the general population.2 Other research has delineated suicide risk and protective factors for individuals with specific psychiatric disorders.3 The presence of disorder-specific risk and protective factors for suicide must be identified during suicide risk assessment.
Risk factors
Lack of support from family, peers, or the community is a critical concern. Noncompliance with treatment may be associated with onset of suicidality. Help-seeking is impeded by stigma associated with suicide and shame for past attempts. History of physical, sexual, or psychological abuse is tied to subsequent suicidal behavior. Alcohol abuse plays a role in suicide. Many patients who attempt suicide have backgrounds involving suicide loss or attempts by family members. Recurring psychiatric symptoms—particularly depression, anxiety, and panic—can trigger suicidality. Symptom relapse may lead to hospitalization, which is followed by a high-risk period after discharge.
These suicide risk factors can be summarized by the mnemonic UNSAFE:
Unconnected—no support; sense of not belonging or being a burden
Nonadherence—unmanaged mental illness or co-occurring disorders
Stigma/shame related to past attempts or suicidal behavior
Abuse history and/or alcohol misuse; prior attempt
Family history of suicide or suicide attempts
Exacerbations—worsened mental illness, hospitalizations
Protective factors
The presence of a personal crisis or safety self-help plan shows patient insight. Maintaining prescribed treatment indicates a patient’s likelihood of complying with clinical and self-care measures to avert future suicidality. Accessible support from family, peers, and the community demonstrates social integration. The recovery concept promotes these factors as well as wellness and resilience. Awareness of the warning signs of suicide and personal risk factors and precipitants is essential for self-help and help-seeking.
Protective factors for suicide can be summarized by the mnemonic SAFER:
Self-help skills, personal crisis/suicide prevention plan
Adherence to treatment plan
Family and community support
Education about risk factors, warning signs, and triggers for suicide
Recovery and resilience
In our emergency psychiatric facility the UNSAFE and SAFE mnemonics are posted next to the desk of the on-duty psychiatrist. Crisis center staff use these mnemonics to screen patients during psychiatric evaluations. Allied therapists use them during in-patient psychoeducation about suicidality. Peer specialists use them to help patients prepare personal safety plans.
Disclosure
The authors report no financial relationship with any company whose products are mentioned in this article or with manufactures of competing products.
These mnemonics were developed by Tony Salvatore in consultation with Rocio Nell, MD, CPE.
1. Simon R, Shuman DW. The standard of care in suicide risk assessment: an elusive concept. CNS Spectr. 2006;11(6):442-445.
2. Goldsmith SK, Pellmar TC, Kleinman AM, et al. eds. Reducing suicide: a national imperative. Washington, DC: The National Academies Press; 2002.
3. Harris EC, Barraclough B. Suicide as an outcome for mental disorders. A meta-analysis. Br J Psychiatry. 1997;170(3):205-228.
1. Simon R, Shuman DW. The standard of care in suicide risk assessment: an elusive concept. CNS Spectr. 2006;11(6):442-445.
2. Goldsmith SK, Pellmar TC, Kleinman AM, et al. eds. Reducing suicide: a national imperative. Washington, DC: The National Academies Press; 2002.
3. Harris EC, Barraclough B. Suicide as an outcome for mental disorders. A meta-analysis. Br J Psychiatry. 1997;170(3):205-228.
Contraception Counseling for Adolescent Girls
Adolescents value confidentiality with their health care clinicians very highly. To support the opportunity for confidentiality, you should speak with female adolescents without a parent in the room for at least part of each visit. This fosters an honest conversation about the sensitive issues around contraception, including any intimate relationships, current or planned sexual activity, and the safety and protection afforded by contraception.
Girls are allowed to discuss sexually transmitted infections confidentially with their physicians, and hopefully can be offered a confidential discussion of their sexual activity as well. Ideally, a girl also feels comfortable talking with a parent about her concerns, but this scenario may not be an option for all your patients.
Begin with a discussion about relationships. Avoid preaching to them or asking blunt questions such as: “Hey, are you having sex?” Acknowledge that “sex” can refer to activities beyond sexual intercourse as well.
Ask your patients if they are in a relationship with a girl, a boy, or both. A teenager who is not heterosexual or is unsure will then know you are willing to discuss any specific concerns.
Make sure the teenager knows that abstinence is always the best protection against sexually transmitted infection and/or pregnancy.
Once you ascertain she is heterosexual or bisexual, is sexually active, and needs contraception, focus next on safety. Ask the patient: Are you doing anything to protect yourself against the consequences of sexual activity? Also ensure her participation in the intimate relationship is voluntary and free of any coercion, particularly among younger teenage girls.
There are multiple means of protection against sexually transmitted infections. Educate her that, aside from abstinence, the use of condoms is her best strategy. Make sure the girl understands that she is equally responsible for the proper use of condoms. If you take care of a lot of adolescents, it is reasonable to have a supply of condoms on hand so you can provide them.
Also consider providing a patient who is sexually active (or contemplating sexual activity) with a prescription for emergency, postcoital contraception. She could fill the prescription as needed, within 72 hours of sexual intercourse, to decrease the likelihood of pregnancy considerably. Even if she regularly uses a birth control method, this prescription provides a good backup plan.
Keep the child's developmental level in mind when discussing contraception and sexuality. In general, a 14-year-old girl who is sexually active or considering sex is vastly different from a 17-year-old patient. Also consider the patient and family's culture, ethnic, and/or religious background. For example, there are some religious groups where the kids cannot tell parents they have become sexually active – it could mortify the parents and be dangerous for the teenager.
Title X–funded projects are an option if a girl cannot tell her parent she wants to use contraception and/or if a third party (such as an insurance company) makes confidentiality impossible. Become familiar with the Title X–funded contraception projects in your area, which are frequently run through Planned Parenthood or a university obstetrics and gynecology program (www.hhs.gov/opa/familyplanning/index.html
You really should get to the point where you feel moderately comfortable talking about the basics of contraception and sexuality. There are not enough adolescent medicine specialists in the world to take care of all the teenagers out there, and most ob. gyns. do not see very many teenagers.
Some pediatricians may be comfortable prescribing the birth control pill, but they may not know much about the patch, the contraceptive ring, the implant, or the IUD. If a patient is interested in one of these options, you can refer her to a gynecologist or a family practitioner in your area who is particularly adept at young women's health issues. Planned Parenthood also is a good resource.
The birth control pill and the patch are the two most common birth control methods for first-time users. You do not need to know all the different types of birth control pills; it is sufficient to become comfortable prescribing one or two brands.
Check for any contraindications, such as a history of migraine headache with aura or a clotting abnormality (personal or in a first-degree relative) before prescribing oral contraception. If your patient is having regular, monthly periods, and she's had a period in the last month, some pediatricians still will feel comfortable prescribing only if they get a urine pregnancy test. On the other hand, if you give contraception without the test and the girl does miss her next period, you can always give the pregnancy test then.
If you prescribe contraception for sexual activity only, keep in mind that most teenagers have a passionate relationship that lasts a few months, followed by an interval without a relationship, followed by involvement with another person. These intermittent relationships mean that they are likely to start and stop contraception. Keep this in mind when discussing contraception options and monitor compliance with less-permanent options over time.
Children's Hospital of Boston produces www.youngwomenshealth.orgwww.acog.org/publications/patient_education/ab020.cfmaappolicy.aappublications.org/cgi/content/full/pediatrics;120/5/1135
Adolescents value confidentiality with their health care clinicians very highly. To support the opportunity for confidentiality, you should speak with female adolescents without a parent in the room for at least part of each visit. This fosters an honest conversation about the sensitive issues around contraception, including any intimate relationships, current or planned sexual activity, and the safety and protection afforded by contraception.
Girls are allowed to discuss sexually transmitted infections confidentially with their physicians, and hopefully can be offered a confidential discussion of their sexual activity as well. Ideally, a girl also feels comfortable talking with a parent about her concerns, but this scenario may not be an option for all your patients.
Begin with a discussion about relationships. Avoid preaching to them or asking blunt questions such as: “Hey, are you having sex?” Acknowledge that “sex” can refer to activities beyond sexual intercourse as well.
Ask your patients if they are in a relationship with a girl, a boy, or both. A teenager who is not heterosexual or is unsure will then know you are willing to discuss any specific concerns.
Make sure the teenager knows that abstinence is always the best protection against sexually transmitted infection and/or pregnancy.
Once you ascertain she is heterosexual or bisexual, is sexually active, and needs contraception, focus next on safety. Ask the patient: Are you doing anything to protect yourself against the consequences of sexual activity? Also ensure her participation in the intimate relationship is voluntary and free of any coercion, particularly among younger teenage girls.
There are multiple means of protection against sexually transmitted infections. Educate her that, aside from abstinence, the use of condoms is her best strategy. Make sure the girl understands that she is equally responsible for the proper use of condoms. If you take care of a lot of adolescents, it is reasonable to have a supply of condoms on hand so you can provide them.
Also consider providing a patient who is sexually active (or contemplating sexual activity) with a prescription for emergency, postcoital contraception. She could fill the prescription as needed, within 72 hours of sexual intercourse, to decrease the likelihood of pregnancy considerably. Even if she regularly uses a birth control method, this prescription provides a good backup plan.
Keep the child's developmental level in mind when discussing contraception and sexuality. In general, a 14-year-old girl who is sexually active or considering sex is vastly different from a 17-year-old patient. Also consider the patient and family's culture, ethnic, and/or religious background. For example, there are some religious groups where the kids cannot tell parents they have become sexually active – it could mortify the parents and be dangerous for the teenager.
Title X–funded projects are an option if a girl cannot tell her parent she wants to use contraception and/or if a third party (such as an insurance company) makes confidentiality impossible. Become familiar with the Title X–funded contraception projects in your area, which are frequently run through Planned Parenthood or a university obstetrics and gynecology program (www.hhs.gov/opa/familyplanning/index.html
You really should get to the point where you feel moderately comfortable talking about the basics of contraception and sexuality. There are not enough adolescent medicine specialists in the world to take care of all the teenagers out there, and most ob. gyns. do not see very many teenagers.
Some pediatricians may be comfortable prescribing the birth control pill, but they may not know much about the patch, the contraceptive ring, the implant, or the IUD. If a patient is interested in one of these options, you can refer her to a gynecologist or a family practitioner in your area who is particularly adept at young women's health issues. Planned Parenthood also is a good resource.
The birth control pill and the patch are the two most common birth control methods for first-time users. You do not need to know all the different types of birth control pills; it is sufficient to become comfortable prescribing one or two brands.
Check for any contraindications, such as a history of migraine headache with aura or a clotting abnormality (personal or in a first-degree relative) before prescribing oral contraception. If your patient is having regular, monthly periods, and she's had a period in the last month, some pediatricians still will feel comfortable prescribing only if they get a urine pregnancy test. On the other hand, if you give contraception without the test and the girl does miss her next period, you can always give the pregnancy test then.
If you prescribe contraception for sexual activity only, keep in mind that most teenagers have a passionate relationship that lasts a few months, followed by an interval without a relationship, followed by involvement with another person. These intermittent relationships mean that they are likely to start and stop contraception. Keep this in mind when discussing contraception options and monitor compliance with less-permanent options over time.
Children's Hospital of Boston produces www.youngwomenshealth.orgwww.acog.org/publications/patient_education/ab020.cfmaappolicy.aappublications.org/cgi/content/full/pediatrics;120/5/1135
Adolescents value confidentiality with their health care clinicians very highly. To support the opportunity for confidentiality, you should speak with female adolescents without a parent in the room for at least part of each visit. This fosters an honest conversation about the sensitive issues around contraception, including any intimate relationships, current or planned sexual activity, and the safety and protection afforded by contraception.
Girls are allowed to discuss sexually transmitted infections confidentially with their physicians, and hopefully can be offered a confidential discussion of their sexual activity as well. Ideally, a girl also feels comfortable talking with a parent about her concerns, but this scenario may not be an option for all your patients.
Begin with a discussion about relationships. Avoid preaching to them or asking blunt questions such as: “Hey, are you having sex?” Acknowledge that “sex” can refer to activities beyond sexual intercourse as well.
Ask your patients if they are in a relationship with a girl, a boy, or both. A teenager who is not heterosexual or is unsure will then know you are willing to discuss any specific concerns.
Make sure the teenager knows that abstinence is always the best protection against sexually transmitted infection and/or pregnancy.
Once you ascertain she is heterosexual or bisexual, is sexually active, and needs contraception, focus next on safety. Ask the patient: Are you doing anything to protect yourself against the consequences of sexual activity? Also ensure her participation in the intimate relationship is voluntary and free of any coercion, particularly among younger teenage girls.
There are multiple means of protection against sexually transmitted infections. Educate her that, aside from abstinence, the use of condoms is her best strategy. Make sure the girl understands that she is equally responsible for the proper use of condoms. If you take care of a lot of adolescents, it is reasonable to have a supply of condoms on hand so you can provide them.
Also consider providing a patient who is sexually active (or contemplating sexual activity) with a prescription for emergency, postcoital contraception. She could fill the prescription as needed, within 72 hours of sexual intercourse, to decrease the likelihood of pregnancy considerably. Even if she regularly uses a birth control method, this prescription provides a good backup plan.
Keep the child's developmental level in mind when discussing contraception and sexuality. In general, a 14-year-old girl who is sexually active or considering sex is vastly different from a 17-year-old patient. Also consider the patient and family's culture, ethnic, and/or religious background. For example, there are some religious groups where the kids cannot tell parents they have become sexually active – it could mortify the parents and be dangerous for the teenager.
Title X–funded projects are an option if a girl cannot tell her parent she wants to use contraception and/or if a third party (such as an insurance company) makes confidentiality impossible. Become familiar with the Title X–funded contraception projects in your area, which are frequently run through Planned Parenthood or a university obstetrics and gynecology program (www.hhs.gov/opa/familyplanning/index.html
You really should get to the point where you feel moderately comfortable talking about the basics of contraception and sexuality. There are not enough adolescent medicine specialists in the world to take care of all the teenagers out there, and most ob. gyns. do not see very many teenagers.
Some pediatricians may be comfortable prescribing the birth control pill, but they may not know much about the patch, the contraceptive ring, the implant, or the IUD. If a patient is interested in one of these options, you can refer her to a gynecologist or a family practitioner in your area who is particularly adept at young women's health issues. Planned Parenthood also is a good resource.
The birth control pill and the patch are the two most common birth control methods for first-time users. You do not need to know all the different types of birth control pills; it is sufficient to become comfortable prescribing one or two brands.
Check for any contraindications, such as a history of migraine headache with aura or a clotting abnormality (personal or in a first-degree relative) before prescribing oral contraception. If your patient is having regular, monthly periods, and she's had a period in the last month, some pediatricians still will feel comfortable prescribing only if they get a urine pregnancy test. On the other hand, if you give contraception without the test and the girl does miss her next period, you can always give the pregnancy test then.
If you prescribe contraception for sexual activity only, keep in mind that most teenagers have a passionate relationship that lasts a few months, followed by an interval without a relationship, followed by involvement with another person. These intermittent relationships mean that they are likely to start and stop contraception. Keep this in mind when discussing contraception options and monitor compliance with less-permanent options over time.
Children's Hospital of Boston produces www.youngwomenshealth.orgwww.acog.org/publications/patient_education/ab020.cfmaappolicy.aappublications.org/cgi/content/full/pediatrics;120/5/1135
Pneumonia Challenges Hospitalists on Multiple Fronts
Pneumonia is one of the most common diagnoses encountered by hospitalists, if not the most common, and its presentation continues to become more complicated, says Scott Flanders, MD, SFHM, professor of medicine and director of the hospitalist program at the University of Michigan Health System in Ann Arbor. Dr. Flanders has published on pneumonia (J Hosp Med. 2006;1(3):177-190), and this past fall he gave presentations on the subject at hospitalist conferences in San Francisco and Chicago—with a particular emphasis on how to prevent its recurrence in hospitalized patients at risk.
“The causative agents for community-acquired pneumonia (CAP) evolve over time,” even though the actual source of a hospitalized patient’s pneumonia may never be known, says Dr. Flanders, past president of SHM. The swine flu (H1N1) and community-acquired MRSA “are two examples of etiologic agents that were not even a consideration five years ago—and now are something hospitalists have to be aware of, understand, and recognize that they can cause pneumonia in patients who are admitted to the hospital from the community,” he says. “They need to be considered as potential etiologic agents first and foremost, because the treatments for them differ from usual empiric pneumonia treatments.

—Scott Flanders, MD, SFHM, professor of medicine and director of the hospitalist program at the University of Michigan Health System, Ann Arbor, SHM past president
“As hospitalists, we spend a lot of time trying to think what we can do to prevent recurrent pneumonia episodes in our patients and looking for what could have caused the initial incident,” Dr. Flanders says. “Pneumococcal vaccination is not as good as we’d like it to be in preventing recurrent pneumonia. We have to look to see if there’s anything else we can do to help prevent it.”
One simple step is to review the patient’s medication list, see if proton pump inhibitors (PPI) for reducing gastric acid or antipsychotic medications are on the list, then ask whether they can be discontinued; both treatments are associated in the medical literature with higher rates of pneumonia recurrence. Patients often receive PPIs for empiric prevention of gastrointestinal bleeding in the ICU, a risk that might have ceased.
“There is a subset of patients with bad reflux disease, history of GI bleeds, on anticoagulants, who have more potential benefit than harm from PPIs,” Dr. Flanders explains. “Hospitalists should see if their patients fall into these categories and, if they don’t, consider discontinuing these medications.”
Dr. Flanders also points out hospitalists should keep an eye out for antipsychotic medications. “Many patients absolutely need these medications and are functional because they are on them,” he says. “We’d never consider stopping them for those patients. But some patients get them started for episodes of delirium in the hospital that have resolved or to enhance their sleep. I’d strongly recommend considering stopping them in that case.”
By contrast, statin use might improve outcomes associated with pneumonia.
Antibiotic selection is another big issue, and Dr. Flanders says hospitalists will be judged by how closely they stick to the recommended treatment guidelines. “They should be familiar with what the guidelines recommend, and recognize the types of variables they need to document if they are going to deviate from the recommendations,” he says. The evidence also says to stop routinely treating pneumonia with antibiotics beyond seven days, he adds.
Larry Beresford is a freelance writer based in Oakland, Calif.
Recommended REading
For managing community-acquired pneumonia, Dr. Flanders recommends the Infectious Diseases Society of America and American Thoracic Society Consensus Guidelines, issued in 2007.
Pneumonia is one of the most common diagnoses encountered by hospitalists, if not the most common, and its presentation continues to become more complicated, says Scott Flanders, MD, SFHM, professor of medicine and director of the hospitalist program at the University of Michigan Health System in Ann Arbor. Dr. Flanders has published on pneumonia (J Hosp Med. 2006;1(3):177-190), and this past fall he gave presentations on the subject at hospitalist conferences in San Francisco and Chicago—with a particular emphasis on how to prevent its recurrence in hospitalized patients at risk.
“The causative agents for community-acquired pneumonia (CAP) evolve over time,” even though the actual source of a hospitalized patient’s pneumonia may never be known, says Dr. Flanders, past president of SHM. The swine flu (H1N1) and community-acquired MRSA “are two examples of etiologic agents that were not even a consideration five years ago—and now are something hospitalists have to be aware of, understand, and recognize that they can cause pneumonia in patients who are admitted to the hospital from the community,” he says. “They need to be considered as potential etiologic agents first and foremost, because the treatments for them differ from usual empiric pneumonia treatments.
—Scott Flanders, MD, SFHM, professor of medicine and director of the hospitalist program at the University of Michigan Health System, Ann Arbor, SHM past president
“As hospitalists, we spend a lot of time trying to think what we can do to prevent recurrent pneumonia episodes in our patients and looking for what could have caused the initial incident,” Dr. Flanders says. “Pneumococcal vaccination is not as good as we’d like it to be in preventing recurrent pneumonia. We have to look to see if there’s anything else we can do to help prevent it.”
One simple step is to review the patient’s medication list, see if proton pump inhibitors (PPI) for reducing gastric acid or antipsychotic medications are on the list, then ask whether they can be discontinued; both treatments are associated in the medical literature with higher rates of pneumonia recurrence. Patients often receive PPIs for empiric prevention of gastrointestinal bleeding in the ICU, a risk that might have ceased.
“There is a subset of patients with bad reflux disease, history of GI bleeds, on anticoagulants, who have more potential benefit than harm from PPIs,” Dr. Flanders explains. “Hospitalists should see if their patients fall into these categories and, if they don’t, consider discontinuing these medications.”
Dr. Flanders also points out hospitalists should keep an eye out for antipsychotic medications. “Many patients absolutely need these medications and are functional because they are on them,” he says. “We’d never consider stopping them for those patients. But some patients get them started for episodes of delirium in the hospital that have resolved or to enhance their sleep. I’d strongly recommend considering stopping them in that case.”
By contrast, statin use might improve outcomes associated with pneumonia.
Antibiotic selection is another big issue, and Dr. Flanders says hospitalists will be judged by how closely they stick to the recommended treatment guidelines. “They should be familiar with what the guidelines recommend, and recognize the types of variables they need to document if they are going to deviate from the recommendations,” he says. The evidence also says to stop routinely treating pneumonia with antibiotics beyond seven days, he adds.
Larry Beresford is a freelance writer based in Oakland, Calif.
Recommended REading
For managing community-acquired pneumonia, Dr. Flanders recommends the Infectious Diseases Society of America and American Thoracic Society Consensus Guidelines, issued in 2007.
Pneumonia is one of the most common diagnoses encountered by hospitalists, if not the most common, and its presentation continues to become more complicated, says Scott Flanders, MD, SFHM, professor of medicine and director of the hospitalist program at the University of Michigan Health System in Ann Arbor. Dr. Flanders has published on pneumonia (J Hosp Med. 2006;1(3):177-190), and this past fall he gave presentations on the subject at hospitalist conferences in San Francisco and Chicago—with a particular emphasis on how to prevent its recurrence in hospitalized patients at risk.
“The causative agents for community-acquired pneumonia (CAP) evolve over time,” even though the actual source of a hospitalized patient’s pneumonia may never be known, says Dr. Flanders, past president of SHM. The swine flu (H1N1) and community-acquired MRSA “are two examples of etiologic agents that were not even a consideration five years ago—and now are something hospitalists have to be aware of, understand, and recognize that they can cause pneumonia in patients who are admitted to the hospital from the community,” he says. “They need to be considered as potential etiologic agents first and foremost, because the treatments for them differ from usual empiric pneumonia treatments.
—Scott Flanders, MD, SFHM, professor of medicine and director of the hospitalist program at the University of Michigan Health System, Ann Arbor, SHM past president
“As hospitalists, we spend a lot of time trying to think what we can do to prevent recurrent pneumonia episodes in our patients and looking for what could have caused the initial incident,” Dr. Flanders says. “Pneumococcal vaccination is not as good as we’d like it to be in preventing recurrent pneumonia. We have to look to see if there’s anything else we can do to help prevent it.”
One simple step is to review the patient’s medication list, see if proton pump inhibitors (PPI) for reducing gastric acid or antipsychotic medications are on the list, then ask whether they can be discontinued; both treatments are associated in the medical literature with higher rates of pneumonia recurrence. Patients often receive PPIs for empiric prevention of gastrointestinal bleeding in the ICU, a risk that might have ceased.
“There is a subset of patients with bad reflux disease, history of GI bleeds, on anticoagulants, who have more potential benefit than harm from PPIs,” Dr. Flanders explains. “Hospitalists should see if their patients fall into these categories and, if they don’t, consider discontinuing these medications.”
Dr. Flanders also points out hospitalists should keep an eye out for antipsychotic medications. “Many patients absolutely need these medications and are functional because they are on them,” he says. “We’d never consider stopping them for those patients. But some patients get them started for episodes of delirium in the hospital that have resolved or to enhance their sleep. I’d strongly recommend considering stopping them in that case.”
By contrast, statin use might improve outcomes associated with pneumonia.
Antibiotic selection is another big issue, and Dr. Flanders says hospitalists will be judged by how closely they stick to the recommended treatment guidelines. “They should be familiar with what the guidelines recommend, and recognize the types of variables they need to document if they are going to deviate from the recommendations,” he says. The evidence also says to stop routinely treating pneumonia with antibiotics beyond seven days, he adds.
Larry Beresford is a freelance writer based in Oakland, Calif.
Recommended REading
For managing community-acquired pneumonia, Dr. Flanders recommends the Infectious Diseases Society of America and American Thoracic Society Consensus Guidelines, issued in 2007.
Captain of the Ship
About a year ago, Ira Horowitz, MD, chief medical officer at Emory University Hospital in Atlanta, went to his COO and said, “Something is happening.”
While this would usually be cause for concern, Dr. Horowitz was referring to the landmark changes occurring in the Emory Healthcare System as a result of quality initiatives like the venous thromboembolism (VTE) dashboard, a computerized system that allows hospital staff, in real time, to identify patients on prophylaxis at any of Emory’s three hospitals.
Because VTE is one of the most preventable causes of death in hospitals, the dashboard allows nurses to “take the lead” and build monitoring into their workflow, Dr. Horowitz says. Nurses can begin their shifts by identifying which patients are on prophylaxis. The dashboard also gives them the opportunity, when the physicians are rounding, to discuss whether prophylaxis is appropriate.
Emory hospitalist Jason Stein, MD, SFHM, spearheaded the VTE dashboard team, which included 24 other hospitalists, nurses, pharmacists, and IT personnel. The new system was initiated during Dr. Stein’s research in HM process improvement, at the time Dr. Horowitz and others were doing parallel work in VTE prevention.
“What’s really exciting is having the troops on the ground, so to speak—having the physicians intimately involved with the patients, and the nurses really taking the lead. That’s what this study or this process improvement really illustrates,” says Dr. Horowitz, who cosponsored the research that won SHM’s 2010 Award of Excellence in Teamwork in Quality Improvement. The award was given for both the creation of the dashboard and the monumental changes the new system inspired in Emory’s approach to QI.
Sharlene Toney, RN, PhD, associate chief nursing officer for research and executive director for Emory’s professional nursing practice, says that while the dashboard concept focused on how to prepare physicians and nurses to make a difference in patience outcomes, the QI movement has spread to all parts of the Emory system.
“We actually have housekeeping staff who have had a discussion with patients about the importance of wearing [sequential compression devices],” she says. “This is really about an organizational culture. … You’re in this as a team, and this research is about the synergistic relationship of every employee. You can’t see it as hierarchal; it’s truly partnerships.”
While the dashboard is a start, Drs. Horowitz and Toney say that the positive shift happening at Emory can only be reproduced by first establishing a level of respect among and for all hospital employees, and by breaking down silos.
“I think in medicine, in order for us to provide the best and the safest care for our patients, the physicians have to start realizing they’re not captain of a ship, they’re captain of a team,” Dr. Horowitz says, “and with that comes very different behaviors.”
For more information about SHM's Awards of Excellence winners, visit our website.
About a year ago, Ira Horowitz, MD, chief medical officer at Emory University Hospital in Atlanta, went to his COO and said, “Something is happening.”
While this would usually be cause for concern, Dr. Horowitz was referring to the landmark changes occurring in the Emory Healthcare System as a result of quality initiatives like the venous thromboembolism (VTE) dashboard, a computerized system that allows hospital staff, in real time, to identify patients on prophylaxis at any of Emory’s three hospitals.
Because VTE is one of the most preventable causes of death in hospitals, the dashboard allows nurses to “take the lead” and build monitoring into their workflow, Dr. Horowitz says. Nurses can begin their shifts by identifying which patients are on prophylaxis. The dashboard also gives them the opportunity, when the physicians are rounding, to discuss whether prophylaxis is appropriate.
Emory hospitalist Jason Stein, MD, SFHM, spearheaded the VTE dashboard team, which included 24 other hospitalists, nurses, pharmacists, and IT personnel. The new system was initiated during Dr. Stein’s research in HM process improvement, at the time Dr. Horowitz and others were doing parallel work in VTE prevention.
“What’s really exciting is having the troops on the ground, so to speak—having the physicians intimately involved with the patients, and the nurses really taking the lead. That’s what this study or this process improvement really illustrates,” says Dr. Horowitz, who cosponsored the research that won SHM’s 2010 Award of Excellence in Teamwork in Quality Improvement. The award was given for both the creation of the dashboard and the monumental changes the new system inspired in Emory’s approach to QI.
Sharlene Toney, RN, PhD, associate chief nursing officer for research and executive director for Emory’s professional nursing practice, says that while the dashboard concept focused on how to prepare physicians and nurses to make a difference in patience outcomes, the QI movement has spread to all parts of the Emory system.
“We actually have housekeeping staff who have had a discussion with patients about the importance of wearing [sequential compression devices],” she says. “This is really about an organizational culture. … You’re in this as a team, and this research is about the synergistic relationship of every employee. You can’t see it as hierarchal; it’s truly partnerships.”
While the dashboard is a start, Drs. Horowitz and Toney say that the positive shift happening at Emory can only be reproduced by first establishing a level of respect among and for all hospital employees, and by breaking down silos.
“I think in medicine, in order for us to provide the best and the safest care for our patients, the physicians have to start realizing they’re not captain of a ship, they’re captain of a team,” Dr. Horowitz says, “and with that comes very different behaviors.”
For more information about SHM's Awards of Excellence winners, visit our website.
About a year ago, Ira Horowitz, MD, chief medical officer at Emory University Hospital in Atlanta, went to his COO and said, “Something is happening.”
While this would usually be cause for concern, Dr. Horowitz was referring to the landmark changes occurring in the Emory Healthcare System as a result of quality initiatives like the venous thromboembolism (VTE) dashboard, a computerized system that allows hospital staff, in real time, to identify patients on prophylaxis at any of Emory’s three hospitals.
Because VTE is one of the most preventable causes of death in hospitals, the dashboard allows nurses to “take the lead” and build monitoring into their workflow, Dr. Horowitz says. Nurses can begin their shifts by identifying which patients are on prophylaxis. The dashboard also gives them the opportunity, when the physicians are rounding, to discuss whether prophylaxis is appropriate.
Emory hospitalist Jason Stein, MD, SFHM, spearheaded the VTE dashboard team, which included 24 other hospitalists, nurses, pharmacists, and IT personnel. The new system was initiated during Dr. Stein’s research in HM process improvement, at the time Dr. Horowitz and others were doing parallel work in VTE prevention.
“What’s really exciting is having the troops on the ground, so to speak—having the physicians intimately involved with the patients, and the nurses really taking the lead. That’s what this study or this process improvement really illustrates,” says Dr. Horowitz, who cosponsored the research that won SHM’s 2010 Award of Excellence in Teamwork in Quality Improvement. The award was given for both the creation of the dashboard and the monumental changes the new system inspired in Emory’s approach to QI.
Sharlene Toney, RN, PhD, associate chief nursing officer for research and executive director for Emory’s professional nursing practice, says that while the dashboard concept focused on how to prepare physicians and nurses to make a difference in patience outcomes, the QI movement has spread to all parts of the Emory system.
“We actually have housekeeping staff who have had a discussion with patients about the importance of wearing [sequential compression devices],” she says. “This is really about an organizational culture. … You’re in this as a team, and this research is about the synergistic relationship of every employee. You can’t see it as hierarchal; it’s truly partnerships.”
While the dashboard is a start, Drs. Horowitz and Toney say that the positive shift happening at Emory can only be reproduced by first establishing a level of respect among and for all hospital employees, and by breaking down silos.
“I think in medicine, in order for us to provide the best and the safest care for our patients, the physicians have to start realizing they’re not captain of a ship, they’re captain of a team,” Dr. Horowitz says, “and with that comes very different behaviors.”
For more information about SHM's Awards of Excellence winners, visit our website.
In the Literature: Research You Need to Know
Clinical question: In the era of combination antiretroviral therapy, what is the incidence of PcP among patients with CD4 counts less than 200 cells/µL across a spectrum of virologic suppression?
Background: The incidence of Pneumocystis jiroveci pneumonia (PcP) has decreased significantly with the advent of effective combination antiretroviral therapy (cART). Guidelines have historically recommended PcP prophylaxis for HIV patients once the CD4 cell count drops below 200 cells/µL. The incidence of PcP in the era of cART, and by extension the ongoing applicability of this traditional prophylaxis guideline, is uncertain.
Study design: Prospective observational cohort.
Setting: Twelve European HIV cohorts.
Synopsis: The investigators combined data from 12 prospective HIV cohorts representing 107,016 patient-years of follow-up (PYFU), with a median of 4.7 years. There were 11,932 PYFU for those with CD4 cell counts below 200 cells/µL. Across all CD4 cell counts, 76% of PcP infections occurred among patients with viral loads >10,000 copies/mL. Among all patients with CD4 cell counts from 101 cells/µL and 200 cells/µL, there was a nonsignificant trend towards lower PcP rates with prophylaxis. For the subset of patients with CD4 cell counts from 101 cells/µL and 200 cells/µL and viral load <400 copies/mL, PcP rates were quite low and no different among those taking and not taking prophylaxis.
Bottom line: PcP is uncommon in HIV patients taking cART with CD4 cell counts from 101 cells/µL and 200 cells/µL and viral load <400 copies/mL. Discontinuing prophylaxis might be safe in these well-controlled patients.
Citation: The Opportunistic Infections Project Team of the Collaboration of Observational HIV Epidemiological Research in Europe (COHERE), Mocroft A, Reiss P, Kirk O, et al. Is it safe to discontinue primary Pneumocystis jiroveci prophylaxis in patients with virologically suppressed HIV infection and a CD4 cell count <200 cells/microL? Clin Infect Dis. 2010;51(5):611-619.
Reviewed for TH eWire by Alexis E. Shanahan, MD, Chad R. Stickrath, MD, Mel L. Anderson, MD, Section of Hospital Medicine, Denver VA Medical Center, Division of General Internal Medicine, University of Colorado
For more physician reviews of HM-related research, visit our website.
Clinical question: In the era of combination antiretroviral therapy, what is the incidence of PcP among patients with CD4 counts less than 200 cells/µL across a spectrum of virologic suppression?
Background: The incidence of Pneumocystis jiroveci pneumonia (PcP) has decreased significantly with the advent of effective combination antiretroviral therapy (cART). Guidelines have historically recommended PcP prophylaxis for HIV patients once the CD4 cell count drops below 200 cells/µL. The incidence of PcP in the era of cART, and by extension the ongoing applicability of this traditional prophylaxis guideline, is uncertain.
Study design: Prospective observational cohort.
Setting: Twelve European HIV cohorts.
Synopsis: The investigators combined data from 12 prospective HIV cohorts representing 107,016 patient-years of follow-up (PYFU), with a median of 4.7 years. There were 11,932 PYFU for those with CD4 cell counts below 200 cells/µL. Across all CD4 cell counts, 76% of PcP infections occurred among patients with viral loads >10,000 copies/mL. Among all patients with CD4 cell counts from 101 cells/µL and 200 cells/µL, there was a nonsignificant trend towards lower PcP rates with prophylaxis. For the subset of patients with CD4 cell counts from 101 cells/µL and 200 cells/µL and viral load <400 copies/mL, PcP rates were quite low and no different among those taking and not taking prophylaxis.
Bottom line: PcP is uncommon in HIV patients taking cART with CD4 cell counts from 101 cells/µL and 200 cells/µL and viral load <400 copies/mL. Discontinuing prophylaxis might be safe in these well-controlled patients.
Citation: The Opportunistic Infections Project Team of the Collaboration of Observational HIV Epidemiological Research in Europe (COHERE), Mocroft A, Reiss P, Kirk O, et al. Is it safe to discontinue primary Pneumocystis jiroveci prophylaxis in patients with virologically suppressed HIV infection and a CD4 cell count <200 cells/microL? Clin Infect Dis. 2010;51(5):611-619.
Reviewed for TH eWire by Alexis E. Shanahan, MD, Chad R. Stickrath, MD, Mel L. Anderson, MD, Section of Hospital Medicine, Denver VA Medical Center, Division of General Internal Medicine, University of Colorado
For more physician reviews of HM-related research, visit our website.
Clinical question: In the era of combination antiretroviral therapy, what is the incidence of PcP among patients with CD4 counts less than 200 cells/µL across a spectrum of virologic suppression?
Background: The incidence of Pneumocystis jiroveci pneumonia (PcP) has decreased significantly with the advent of effective combination antiretroviral therapy (cART). Guidelines have historically recommended PcP prophylaxis for HIV patients once the CD4 cell count drops below 200 cells/µL. The incidence of PcP in the era of cART, and by extension the ongoing applicability of this traditional prophylaxis guideline, is uncertain.
Study design: Prospective observational cohort.
Setting: Twelve European HIV cohorts.
Synopsis: The investigators combined data from 12 prospective HIV cohorts representing 107,016 patient-years of follow-up (PYFU), with a median of 4.7 years. There were 11,932 PYFU for those with CD4 cell counts below 200 cells/µL. Across all CD4 cell counts, 76% of PcP infections occurred among patients with viral loads >10,000 copies/mL. Among all patients with CD4 cell counts from 101 cells/µL and 200 cells/µL, there was a nonsignificant trend towards lower PcP rates with prophylaxis. For the subset of patients with CD4 cell counts from 101 cells/µL and 200 cells/µL and viral load <400 copies/mL, PcP rates were quite low and no different among those taking and not taking prophylaxis.
Bottom line: PcP is uncommon in HIV patients taking cART with CD4 cell counts from 101 cells/µL and 200 cells/µL and viral load <400 copies/mL. Discontinuing prophylaxis might be safe in these well-controlled patients.
Citation: The Opportunistic Infections Project Team of the Collaboration of Observational HIV Epidemiological Research in Europe (COHERE), Mocroft A, Reiss P, Kirk O, et al. Is it safe to discontinue primary Pneumocystis jiroveci prophylaxis in patients with virologically suppressed HIV infection and a CD4 cell count <200 cells/microL? Clin Infect Dis. 2010;51(5):611-619.
Reviewed for TH eWire by Alexis E. Shanahan, MD, Chad R. Stickrath, MD, Mel L. Anderson, MD, Section of Hospital Medicine, Denver VA Medical Center, Division of General Internal Medicine, University of Colorado
For more physician reviews of HM-related research, visit our website.
Gainsharing: A Bigger Piece of the Pie
HM leaders are in a position to advocate for the potential cost savings and care efficiencies associated with gainsharing, according to a hospitalist who coauthored a study on the topic in this month’s Journal of Hospital Medicine. Gainsharing is a pay-for-performance model that tabulates the cost savings achieved via the adoption of best practices, then pays physicians bonuses with a portion of the savings.
The study found that in a three-year period ending June 2009, Beth Israel Medical Center in New York City reported a $25.1 million reduction in hospital costs, $16 million of which was attributed to physicians participating in the gainsharing program and $9.1 million from nonparticipating doctors (P<0.01) (DOI: 10.1002/jhm.788). In the same time frame, delinquent medical records dropped an average of 43% (P<0.0001).
Latha Sivaprasad, MD, FACP, FHM, medical director of quality management and patient safety and an internal-medicine attending at Beth Israel, says the data shows the viability of pay-for-performance programs.
“Gainsharing essentially aligns the incentives of physicians and hospitals to provide cost-efficient care without compromising patient safety,” says Dr. Sivaprasad. “Who better in the hospital to understand those principles than the hospitalist?”
Dr. Sivaprasad, who has been a hospitalist for eight years and is also an assistant professor at Albert Einstein College of Medicine in New York, says the majority of eligible physicians are now participating in Beth Israel’s gainsharing program, which started in 2006. She says that the validation by the Centers for Medicare & Medicaid Services (CMS)—evidenced by the Medicare demonstration project, which started in 2008—counters arguments about ethical concerns over pay for performance, as does the level of buy-in by physicians.
As it relates to HM groups, she adds, most already have some level of pay-for-performance budgeting in place.
“Pieces of it are there, even though they don’t call it gainsharing,” Dr. Sivaprasad says. “If hospitalists are incentivized for appropriate testing or streamlining throughput, pieces of this program are in place because efficient utilization of healthcare dollars is the heart of gainsharing. … Don’t excessively use precious resources you don’t need to in order to deliver quality medical care.”
HM leaders are in a position to advocate for the potential cost savings and care efficiencies associated with gainsharing, according to a hospitalist who coauthored a study on the topic in this month’s Journal of Hospital Medicine. Gainsharing is a pay-for-performance model that tabulates the cost savings achieved via the adoption of best practices, then pays physicians bonuses with a portion of the savings.
The study found that in a three-year period ending June 2009, Beth Israel Medical Center in New York City reported a $25.1 million reduction in hospital costs, $16 million of which was attributed to physicians participating in the gainsharing program and $9.1 million from nonparticipating doctors (P<0.01) (DOI: 10.1002/jhm.788). In the same time frame, delinquent medical records dropped an average of 43% (P<0.0001).
Latha Sivaprasad, MD, FACP, FHM, medical director of quality management and patient safety and an internal-medicine attending at Beth Israel, says the data shows the viability of pay-for-performance programs.
“Gainsharing essentially aligns the incentives of physicians and hospitals to provide cost-efficient care without compromising patient safety,” says Dr. Sivaprasad. “Who better in the hospital to understand those principles than the hospitalist?”
Dr. Sivaprasad, who has been a hospitalist for eight years and is also an assistant professor at Albert Einstein College of Medicine in New York, says the majority of eligible physicians are now participating in Beth Israel’s gainsharing program, which started in 2006. She says that the validation by the Centers for Medicare & Medicaid Services (CMS)—evidenced by the Medicare demonstration project, which started in 2008—counters arguments about ethical concerns over pay for performance, as does the level of buy-in by physicians.
As it relates to HM groups, she adds, most already have some level of pay-for-performance budgeting in place.
“Pieces of it are there, even though they don’t call it gainsharing,” Dr. Sivaprasad says. “If hospitalists are incentivized for appropriate testing or streamlining throughput, pieces of this program are in place because efficient utilization of healthcare dollars is the heart of gainsharing. … Don’t excessively use precious resources you don’t need to in order to deliver quality medical care.”
HM leaders are in a position to advocate for the potential cost savings and care efficiencies associated with gainsharing, according to a hospitalist who coauthored a study on the topic in this month’s Journal of Hospital Medicine. Gainsharing is a pay-for-performance model that tabulates the cost savings achieved via the adoption of best practices, then pays physicians bonuses with a portion of the savings.
The study found that in a three-year period ending June 2009, Beth Israel Medical Center in New York City reported a $25.1 million reduction in hospital costs, $16 million of which was attributed to physicians participating in the gainsharing program and $9.1 million from nonparticipating doctors (P<0.01) (DOI: 10.1002/jhm.788). In the same time frame, delinquent medical records dropped an average of 43% (P<0.0001).
Latha Sivaprasad, MD, FACP, FHM, medical director of quality management and patient safety and an internal-medicine attending at Beth Israel, says the data shows the viability of pay-for-performance programs.
“Gainsharing essentially aligns the incentives of physicians and hospitals to provide cost-efficient care without compromising patient safety,” says Dr. Sivaprasad. “Who better in the hospital to understand those principles than the hospitalist?”
Dr. Sivaprasad, who has been a hospitalist for eight years and is also an assistant professor at Albert Einstein College of Medicine in New York, says the majority of eligible physicians are now participating in Beth Israel’s gainsharing program, which started in 2006. She says that the validation by the Centers for Medicare & Medicaid Services (CMS)—evidenced by the Medicare demonstration project, which started in 2008—counters arguments about ethical concerns over pay for performance, as does the level of buy-in by physicians.
As it relates to HM groups, she adds, most already have some level of pay-for-performance budgeting in place.
“Pieces of it are there, even though they don’t call it gainsharing,” Dr. Sivaprasad says. “If hospitalists are incentivized for appropriate testing or streamlining throughput, pieces of this program are in place because efficient utilization of healthcare dollars is the heart of gainsharing. … Don’t excessively use precious resources you don’t need to in order to deliver quality medical care.”
Sobering News on Quality Front
Last month, the Office of Inspector General (OIG) issued a report (PDF) that estimates 15,000 Medicare patient deaths each month are attributable at least in part to the care they received in hospitals.
The federal watchdog agency tallied adverse events from the National Quality Forum’s list of serious reportable events and other hospital-acquired conditions in the charts of 780 Medicare patients from 2008, then extrapolated the proportions harmed through hospital care (13.5%) or who die as a result of that care (1.5%).
“Because many adverse events we identified were preventable, our study confirms the need and opportunity for hospitals to significantly reduce the incidence of events,” the report concludes. It recommends that the Agency for Healthcare Research and Quality (AHRQ) broadens patient-safety efforts and that the Centers for Medicaid & Medicare Services (CMS) provides further incentives for hospitals to reduce their incidences through its payment and oversight functions.
Confirmation of hospital safety concerns comes from a study published in the New England Journal of Medicine (2010;2363:2124-2134) that found harm to patients in North Carolina hospitals was common and did not decrease from 2002 to 2007.
Christopher Landrigan, MD, of Harvard Medical School and coauthors concluded that 18% of hospitalized patients were harmed through their medical care and, for 2.4%, it caused or contributed to their deaths.
The results of the OIG study are not surprising and might even underestimate the extent of the problem, says Gregory Seymann, MD, a hospitalist at the University of California at San Diego and a member of the Society of Hospital Medicine’s Performance and Standards Committee. The report doesn’t address what proportion of the harmed patients was on a service managed by hospitalists, “but we are in the best position to impact quality and safety—to go to our hospital administrators and get resources earmarked for quality,” he says.
Such results also mirror findings from the Institute of Medicine’s landmark 1999 report To Err is Human, adds Andrew Dunn, MD, a hospitalist at Mount Sinai Medical Center in New York City. “They suggest that medical errors are rampant in hospitals,” he says. “Because the incidence of harm is so broad across the elderly population, quality-improvement efforts in hospitals need to be across the board.”
Every hospitalist should be involved with these efforts, Dr. Dunn says. “There’s no putting your feet up. There’s always room to improve quality,” he adds. He predicts that safety outcomes will increasingly be tied to hospital reimbursement, “which is a good thing. It’s very motivational.”
Last month, the Office of Inspector General (OIG) issued a report (PDF) that estimates 15,000 Medicare patient deaths each month are attributable at least in part to the care they received in hospitals.
The federal watchdog agency tallied adverse events from the National Quality Forum’s list of serious reportable events and other hospital-acquired conditions in the charts of 780 Medicare patients from 2008, then extrapolated the proportions harmed through hospital care (13.5%) or who die as a result of that care (1.5%).
“Because many adverse events we identified were preventable, our study confirms the need and opportunity for hospitals to significantly reduce the incidence of events,” the report concludes. It recommends that the Agency for Healthcare Research and Quality (AHRQ) broadens patient-safety efforts and that the Centers for Medicaid & Medicare Services (CMS) provides further incentives for hospitals to reduce their incidences through its payment and oversight functions.
Confirmation of hospital safety concerns comes from a study published in the New England Journal of Medicine (2010;2363:2124-2134) that found harm to patients in North Carolina hospitals was common and did not decrease from 2002 to 2007.
Christopher Landrigan, MD, of Harvard Medical School and coauthors concluded that 18% of hospitalized patients were harmed through their medical care and, for 2.4%, it caused or contributed to their deaths.
The results of the OIG study are not surprising and might even underestimate the extent of the problem, says Gregory Seymann, MD, a hospitalist at the University of California at San Diego and a member of the Society of Hospital Medicine’s Performance and Standards Committee. The report doesn’t address what proportion of the harmed patients was on a service managed by hospitalists, “but we are in the best position to impact quality and safety—to go to our hospital administrators and get resources earmarked for quality,” he says.
Such results also mirror findings from the Institute of Medicine’s landmark 1999 report To Err is Human, adds Andrew Dunn, MD, a hospitalist at Mount Sinai Medical Center in New York City. “They suggest that medical errors are rampant in hospitals,” he says. “Because the incidence of harm is so broad across the elderly population, quality-improvement efforts in hospitals need to be across the board.”
Every hospitalist should be involved with these efforts, Dr. Dunn says. “There’s no putting your feet up. There’s always room to improve quality,” he adds. He predicts that safety outcomes will increasingly be tied to hospital reimbursement, “which is a good thing. It’s very motivational.”
Last month, the Office of Inspector General (OIG) issued a report (PDF) that estimates 15,000 Medicare patient deaths each month are attributable at least in part to the care they received in hospitals.
The federal watchdog agency tallied adverse events from the National Quality Forum’s list of serious reportable events and other hospital-acquired conditions in the charts of 780 Medicare patients from 2008, then extrapolated the proportions harmed through hospital care (13.5%) or who die as a result of that care (1.5%).
“Because many adverse events we identified were preventable, our study confirms the need and opportunity for hospitals to significantly reduce the incidence of events,” the report concludes. It recommends that the Agency for Healthcare Research and Quality (AHRQ) broadens patient-safety efforts and that the Centers for Medicaid & Medicare Services (CMS) provides further incentives for hospitals to reduce their incidences through its payment and oversight functions.
Confirmation of hospital safety concerns comes from a study published in the New England Journal of Medicine (2010;2363:2124-2134) that found harm to patients in North Carolina hospitals was common and did not decrease from 2002 to 2007.
Christopher Landrigan, MD, of Harvard Medical School and coauthors concluded that 18% of hospitalized patients were harmed through their medical care and, for 2.4%, it caused or contributed to their deaths.
The results of the OIG study are not surprising and might even underestimate the extent of the problem, says Gregory Seymann, MD, a hospitalist at the University of California at San Diego and a member of the Society of Hospital Medicine’s Performance and Standards Committee. The report doesn’t address what proportion of the harmed patients was on a service managed by hospitalists, “but we are in the best position to impact quality and safety—to go to our hospital administrators and get resources earmarked for quality,” he says.
Such results also mirror findings from the Institute of Medicine’s landmark 1999 report To Err is Human, adds Andrew Dunn, MD, a hospitalist at Mount Sinai Medical Center in New York City. “They suggest that medical errors are rampant in hospitals,” he says. “Because the incidence of harm is so broad across the elderly population, quality-improvement efforts in hospitals need to be across the board.”
Every hospitalist should be involved with these efforts, Dr. Dunn says. “There’s no putting your feet up. There’s always room to improve quality,” he adds. He predicts that safety outcomes will increasingly be tied to hospital reimbursement, “which is a good thing. It’s very motivational.”
Intra‐Hospital Transfer to a Higher Level of Care
Considerable research and public attention is being paid to the quantification, risk adjustment, and reporting of inpatient mortality.15 Inpatient mortality is reported as aggregate mortality (for all hospitalized patients or those with a specific diagnosis3, 6) or intensive care unit (ICU) mortality.7, 8 While reporting aggregate hospital or aggregate ICU mortality rates is useful, it is also important to develop reporting strategies that go beyond simply using data elements found in administrative databases (eg, diagnosis and procedure codes) to quantify practice variation. Ideally, such strategies would permit delineating processes of careparticularly those potentially under the control of hospitalists, not only intensiviststo identify improvement opportunities. One such process, which can be tracked using the bed history component of a patient's electronic medical record, is the transfer of patients between different units within the same hospital.
Several studies have documented that risk of ICU death is highest among patients transferred from general medical‐surgical wards, intermediate among direct admissions from the emergency department, and lowest among surgical admissions.911 Opportunities to reduce subsequent ICU mortality have been studied among ward patients who develop sepsis and are then transferred to the ICU,12 among patients who experience cardiac arrest,13, 14 as well as among patients with any physiological deterioration (eg, through the use of rapid response teams).1517 Most of these studies have been single‐center studies and/or studies reporting only an ICU denominator. While useful in some respects, such studies are less helpful to hospitalists, who would benefit from better understanding of the types of patients transferred and the total impact that transfers to a higher level of care make on general medical‐surgical wards. In addition, entities such as the Institute for Healthcare Improvement recommend the manual review of records of patients who were transferred from the ward to the ICU18 to identify performance improvement opportunities. While laudable, such approaches do not lend themselves to automated reporting strategies.
We recently described a new risk adjustment methodology for inpatient mortality based entirely on automated data preceding hospital admission and not restricted to ICU patients. This methodology, which has been externally validated in Ottawa, Canada, after development in the Kaiser Permanente Medical Care Program (KPMCP), permits quantification of a patient's pre‐existing comorbidity burden, physiologic derangement at the time of admission, and overall inpatient mortality risk.19, 20 The primary purpose of this study was to combine this methodology with bed history analysis to quantify the in‐hospital mortality and length of stay (LOS) of patients who experienced intra‐hospital transfers in a large, multihospital system. As a secondary goal, we also wanted to assess the degree to which these transfers could be predicted based on information available prior to a patient's admission.
ABBREVIATIONS AND TERMS USED IN TEXT
COPS: COmorbidity Point Score. Point score based on a patient's health care utilization diagnoses (during the year preceding admission to the hospital. Analogous to POA (present on admission) coding. Scores can range from 0 to a theoretical maximum of 701 but scores >200 are rare. With respect to a patient's pre‐existing comorbidity burden, the unadjusted relationship of COPS and inpatient mortality is as follows: a COPS <50 is associated with a mortality risk of <1%, <100 with a mortality risk of <5%, 100 to 145 with a mortality risk of 5% to 10%, and >145 with a mortality risk of 10% or more.
ICU: Intensive Care Unit. In this study, all ICUs have a minimum registered nurse to patient ratio of 1:2.
LAPS: Laboratory Acute Physiology Score. Point score based on 14 laboratory test results obtained in the 72 hours preceding hospitalization. With respect to a patient's physiologic derangement, the unadjusted relationship of LAPS and inpatient mortality is as follows: a LAPS <7 is associated with a mortality risk of <1%, <7 to 30 with a mortality risk of <5%, 30 to 60 with a mortality risk of 5% to 9%, and >60 with a mortality risk of 10% or more.
LOS: Exact hospital Length Of Stay. LOS is calculated from admission until first discharge home (i.e., it may span more than one hospital stay if a patient experienced inter‐hospital transport).
Predicted (expected) mortality risk: the % risk of death for a given patient based on his/her age, sex, admission diagnosis, COPS, and LAPS.
OEMR: Observed to Expected Mortality Ratio. For a given patient subset, the ratio of the actual mortality experienced by the subset to the expected (predicted) mortality for the subset. Predicted mortality is based on patients' age, sex, admission diagnosis, COPS, and LAPS.
OMELOS: Observed Minus Expected LOS. For a given patient subset, the difference between the actual number of hospital days experienced by the subset and the expected (predicted) number of hospital days for the subset. Predicted LOS is based on patients' age, sex, admission diagnosis, COPS, and LAPS.
TCU: Transitional Care Unit (also called intermediate care unit or stepdown unit). In this study, TCUs have variable nurse to patient ratios ranging from 1:2.5 to 1:3 and did not provide assisted ventilation, continuous pressor infusions, or invasive monitoring.
Materials and Methods
This project was approved by the Northern California KPMCP Institutional Review Board for the Protection of Human Subjects.
The Northern California KPMCP serves a total population of approximately 3.3 million members. Under a mutual exclusivity arrangement, physicians of The Permanente Medical Group, Inc., care for Kaiser Foundation Health Plan, Inc. members at facilities owned by Kaiser Foundation Hospitals, Inc. All Northern California KPMCP hospitals and clinics employ the same information systems with a common medical record number and can track care covered by the plan but delivered elsewhere. Databases maintained by the KPMCP capture admission and discharge times, admission and discharge diagnoses and procedures (assigned by professional coders), bed histories, inter‐hospital transfers, as well as the results of all inpatient and outpatient laboratory tests. The use of these databases for research has been described in multiple reports.2124
Our setting consisted of all 19 hospitals owned and operated by the KPMCP, whose characteristics are summarized in the Supporting Information Appendix available to interested readers. These include the 17 described in our previous report19 as well as 2 new hospitals (Antioch and Manteca) which are similar in size and type of population served. Our study population consisted of all patients admitted to these 19 hospitals who met these criteria: 1) hospitalization began from November 1st, 2006 through January 31st, 2008; 2) initial hospitalization occurred at a Northern California KPMCP hospital (ie, for inter‐hospital transfers, the first hospital stay occurred within the KPMCP); 3) age 15 years; and 4) hospitalization was not for childbirth.
We defined a linked hospitalization as the time period that began with a patient's admission to the hospital and ended with the patient's discharge (home, to a nursing home, or death). Linked hospitalizations can thus involve more than 1 hospital stay and could include a patient transfer from one hospital to another prior to definitive discharge. For linked hospitalizations, mortality was attributed to the admitting KPMCP hospital (ie, if a patient was admitted to hospital A, transferred to B, and died at hospital B, mortality was attributed to hospital A). We defined total LOS as the exact time in hours from when a patient was first admitted to the hospital until death or final discharge home or to a nursing home, while total ICU or transitional care unit (TCU, referred to as stepdown unit in some hospitals) LOS was calculated for all individual ICU or TCU stays during the hospital stay.
Intra‐Hospital Transfers
We grouped all possible hospital units into four types: general medical‐surgical ward (henceforth, ward); operating room (OR)/post‐anesthesia recovery (PAR); TCU; and ICU. In 2003, the KPMCP implemented a mandatory minimum staffing ratio of one registered nurse for every four patients in all its hospital units; in addition, staffing levels for designated ICUs adhered to the previously mandated minimum of one nurse for every 2 patients. So long as they adhere to these minimum ratios, individual hospitals have considerable autonomy with respect to how they staff or designate individual hospital units. Registered nurse‐to‐patient ratios during the time of this study were as follows: ward patients, 1:3.5 to 1:4; TCU patients, 1:2.5 to 1:3; and ICU patients, 1:1 to 1:2. Staffing ratios for the OR and PAR are more variable, depending on the surgical procedures involved. Current KPMCP databases do not permit accurate quantification of physician staffing. All 19 study hospitals had designated ICUs, 6 were teaching hospitals, and 11 had designated TCUs. None of the study hospitals had closed ICUs (units where only intensivists admit patients) and none had continuous coverage of the ICU by intensivists. While we were not able to employ electronic data to determine who made the decision to transfer, we did find considerable variation with respect to how intensivists covered the ICUs and how they interfaced with hospitalists. Staffing levels for specialized coronary care units and non‐ICU monitored beds were not standardized. All study hospitals had rapid response teams as well as code blue teams during the time period covered by this report. Respiratory care practitioners were available to patients in all hospital units, but considerable variation existed with respect to other services available (eg, cardiac catheterization units, provision of noninvasive positive pressure ventilation outside the ICU, etc.).
This report focuses on intra‐hospital transfers to the ICU and TCU, with special emphasis on nonsurgical transfers (due to space limitations, we are not reporting on the outcomes of patients whose first hospital unit was the OR; additional details on these patients are provided in the Supporting Information Appendix). For the purposes of this report, we defined the following admission types: direct admits (patients admitted to the ICU or TCU whose first hospital unit on admission was the ICU or TCU); and nonsurgical transfers to a higher level of care. These latter transfers could be of 3 types: ward to ICU, ward to TCU, and TCU to ICU. We also quantified the effect of inter‐hospital transfers.
Independent Variables
In addition to patients' age and sex, we employed the following independent variables to predict transfer to a higher level of care. These variables are part of the risk adjustment model described in greater detail in our previous report19 and were available electronically for all patients in the cohort. We grouped admission diagnoses into 44 broad diagnostic categories (Primary Conditions), and admission types into 4 groups (emergency medical, emergency surgical, elective medical, and elective surgical). We quantified patients' degree of physiologic derangement using a Laboratory‐based Acute Physiology Score (LAPS) using laboratory test results prior to hospitalization. We quantified patients' comorbid illness burden using a Comorbidity Point Score (COPS) based on patients' pre‐existing diagnoses over the 12‐month period preceding hospitalization. Lastly, we assigned each patient a predicted mortality risk (%) and LOS based on the above predictors,19 permitting calculation of observed to expected mortality ratios (OEMRs) and observed minus expected LOS (OMELOS).
Statistical Methods
All analyses were performed in SAS.25 We calculated standard descriptive statistics (medians, means, standard deviations) and compared different patient groupings using t and chi‐square tests. We employed a similar approach to that reported by Render et al.7 to calculate OEMR and OMELOS.
To determine the degree to which transfers to a higher level of care from the ward or TCU would be predictable using information available at the time of admission, we performed 4 sets of logistic regression analyses using the above‐mentioned predictors in which the outcome variables were as follows: 1) transfer occurring in the first 48 hours after admission (time frame by which point approximately half of the transferred patients experienced a transfer) among ward or TCU patients and 2) transfer occurring after 48 hours among ward or TCU patients. We evaluated the discrimination and calibration of these models using the same methods described in our original report (measuring the area under the receiver operator characteristic curve, or c statistic, and visually examining observed and expected mortality rates among predicted risk bands as well as risk deciles) as well as additional statistical tests recommended by Cook.19, 26
Results
During the study period, a total of 249,129 individual hospital stays involving 170,151 patients occurred at these 19 hospitals. After concatenation of inter‐hospital transfers, we were left with 237,208 linked hospitalizations. We excluded 26,738 linked hospitalizations that began at a non‐KPMCP hospital (ie, they were transported in), leaving a total of 210,470 linked hospitalizations involving 150,495 patients. The overall linked hospitalization mortality rate was 3.30%.
Table 1 summarizes cohort characteristics based on initial hospital location. On admission, ICU patients had the highest degree of physiologic derangement as well as the highest predicted mortality. Considerable inter‐hospital variation was present in both predictors and outcomes; details on these variations are provided in the Supporting Information Appendix.
| Ward | TCU | ICU | All* | |
|---|---|---|---|---|
| ||||
| n | 121,237 | 20,556 | 16,001 | 210,470 |
| Admitted via emergency department, n (%) | 99,909 (82.4) | 18,612 (90.5) | 13,847 (86.5) | 139,036 (66.1) |
| % range across hospitals | 55.0‐94.2 | 64.7‐97.6 | 49.5‐97.4 | 53.6‐76.9 |
| Male, n (%) | 53,744 (44.3) | 10,362 (50.4) | 8,378 (52.4) | 94,451 (44.9) |
| Age in years (mean SD) | 64.5 19.2 | 69.0 15.6 | 63.7 17.8 | 63.2 18.6 |
| LAPS (mean SD) | 19.2 18.0 | 23.3 19.5 | 31.7 25.7 | 16.7 19.0 |
| COPS (mean SD) | 90.4 64.0 | 99.2 65.9 | 94.5 67.5 | 84.7 61.8 |
| % predicted mortality (mean SD) | 4.0 7.1 | 4.6 7.3 | 8.7 12.8 | 3.6 7.3 |
| Observed in‐hospital deaths (n, %) | 3,793 (3.1) | 907 (4.4) | 1,995 (12.5) | 6,952 (3.3) |
| Observed to expected mortality ratio | 0.79 (0.77‐0.82) | 0.95 (0.89‐1.02) | 1.43 (1.36‐1.49) | 0.92 (0.89‐0.94) |
| Total hospital LOS, days (mean SD) | 4.6 7.5 | 5.3 10.0 | 7.8 14.0 | 4.6 8.1 |
Table 2 summarizes data from 3 groups of patients: patients initially admitted to the ward, or TCU, who did not experience a transfer to a higher level of care and patients admitted to these 2 units who did experience such a transfer. Patients who experienced a transfer constituted 5.3% (6,484/121,237) of ward patients and 6.7% (1,384/20,556) of TCU patients. Transferred patients tended to be older, have more acute physiologic derangement (higher LAPS), a greater pre‐existing illness burden (higher COPS), and a higher predicted mortality risk. Among ward patients, those with the following admission diagnoses were most likely to experience a transfer to a higher level of care: gastrointestinal bleeding (10.8% of all transfers), pneumonia (8.7%), and other infections (8.2%). The diagnoses most likely to be associated with death following transfer were cancer (death rate among transferred patients, 48%), renal disease (death rate, 36%), and liver disease (33%). Similar distributions were observed for TCU patients.
| Patients Initially Admitted to Ward, Remained There | Patients Initially Admitted to TCU, Remained There | Patients Transferred to Higher Level of Care | All | |
|---|---|---|---|---|
| ||||
| n | 114,753 | 19,172 | 7,868 | 141,793 |
| Male, n (%) | 50,586 (44.1) | 9,626 (50.2) | 3,894 (49.5) | 64,106 (45.2) |
| Age (mean SD) | 64.3 19.4 | 69.0 15.7 | 68.1 16.1 | 65.2 18.8 |
| LAPS (mean SD) | 18.9 17.8 | 22.7 19.1 | 26.7 21.0 | 19.8 18.3 |
| COPS (mean SD) | 89.4 63.7 | 98.3 65.5 | 107.9 67.6 | 91.7 64.4 |
| % predicted mortality risk (mean SD) | 3.8 7.0 | 4.4 7.0 | 6.5 8.8 | 4.1 7.1 |
| Admission diagnosis of pneumonia, n (%) | 5,624 (4.9) | 865 (4.5) | 684 (8.7) | 7,173 (5.1) |
| Admission diagnosis of sepsis, n (%) | 1,181 (1.0) | 227 (1.2) | 168 (2.1) | 1,576 (1.1) |
| Admission diagnosis of GI bleed, n (%) | 13,615 (11.9) | 1,448 (7.6) | 851 (10.8) | 15,914 (11.2) |
| Admission diagnosis of cancer, n (%) | 2,406 (2.1) | 80 (0.4) | 186 (2.4) | 2,672 (1.9) |
Table 3 compares outcomes among ward and TCU patients who did and did not experience a transfer to a higher level of care. The table shows that transferred patients were almost 3 times as likely to die, even after controlling for severity of illness, and that their hospital LOS was 9 days higher than expected. This increased risk was seen in all hospitals and among all transfer types (ward to ICU, ward to TCU, and TCU to ICU).
| Patients Initially Admitted to Ward, Remained There | Patients Initially Admitted to TCU, Remained There | Patients Transferred to Higher Level of Care | |
|---|---|---|---|
| |||
| n | 114,753 | 19,172 | 7,868 |
| Admitted to ICU, n (%) | 0 (0.0) | 0 (0.0) | 5,245 (66.7) |
| Ventilated, n (%) | 0 (0.0) | 0 (0.0) | 1,346 (17.1) |
| Died in the hospital, n (%) | 2,619 (2.3) | 572 (3.0) | 1,509 (19.2) |
| Length of stay, in days, at time of death (mean SD) | 7.0 11.9 | 8.3 12.4 | 16.2 23.7 |
| Observed to expected mortality ratio (95% CI) | 0.60 (0.57‐0.62) | 0.68 (0.63‐0.74) | 2.93 (2.79‐3.09) |
| Total hospital length of stay, days (mean SD) | 4.0 5.7 | 4.4 6.9 | 14.3 21.3 |
| Observed minus expected length of stay (95% CI) | 0.4 (0.3‐0.4) | 0.8 (0.7‐0.9) | 9.1 (8.6‐9.5) |
| Length of stay, in hours, at time of transfer (mean SD) | 80.8 167.2 | ||
Table 3 also shows that, among decedent patients, those who never left the ward or TCU died much sooner than those who died following transfer. Among direct admits to the ICU, the median LOS at time of death was 3.9 days, with a mean of 9.4 standard deviation of 19.9 days, while the corresponding times for TCU direct admits were a median and mean LOS of 6.5 and 11.7 19.5 days.
Table 4 summarizes outcomes among different patient subgroups that did and did not experience a transfer to a higher level of care. Based on location, patients who experienced a transfer from the TCU to the ICU had the highest crude death rate, but patients transferred from the ward to the ICU had the highest OEMR. On the other hand, if one divides patients by the degree of physiologic derangement, patients with low LAPS who experienced a transfer had the highest OEMR. With respect to LOS, patients transferred from the TCU to the ICU had the highest OMELOS (13.4 extra days).
| n (%)* | Death Rate (%) | OEMR | LOS (mean SD) | OMELOS | |
|---|---|---|---|---|---|
| |||||
| Never admitted to TCU or ICU | 157,632 (74.9) | 1.6 | 0.55 (0.53‐0.57) | 3.6 4.6 | 0.04 (0.02‐0.07) |
| Direct admit to TCU | 18,464 (8.8) | 2.9 | 0.66 (0.61‐0.72) | 4.2 5.8 | 0.60 (0.52‐0.68) |
| Direct admit to ICU | 14,655 (7.0) | 11.9 | 1.38 (1.32‐1.45) | 6.4 9.4 | 2.28 (2.14‐2.43) |
| Transferred from ward to ICU | 5,145 (2.4) | 21.5 | 3.23 (3.04‐3.42) | 15.7 21.6 | 10.33 (9.70‐10.96) |
| Transferred from ward to TCU | 3,144 (1.5) | 11.9 | 1.99 (1.79‐2.20) | 13.6 23.2 | 8.02 (7.23‐8.82) |
| Transferred from TCU to ICU | 1,107 (0.5) | 25.7 | 2.94 (2.61‐3.31) | 18.0 28.2 | 13.35 (11.49‐15.21) |
| Admitted to ward, COPS 80, no transfer to ICU or TCU | 55,405 (26.3) | 3.4 | 0.59 (0.56‐0.62) | 4.5 5.9 | 0.29 (0.24‐0.34) |
| Admitted to ward, COPS 80, did experience transfer to ICU or TCU | 4,851 (2.3) | 19.3 | 2.72 (2.55‐2.90) | 14.2 20.0 | 8.14 (7.56‐8.71) |
| Admitted to ward, COPS <80, no transfer to ICU or TCU | 57,421 (27.3) | 1.1 | 0.55 (0.51‐0.59) | 3.4 4.2 | 0.23 (0.19‐0.26) |
| Admitted to ward, COPS <80, did experience transfer to ICU or TCU | 3,560 (1.7) | 9.8 | 2.93 (2.63‐3.26) | 12.0 19.0 | 7.52 (6.89‐8.15) |
| Admitted to ward, LAPS 20, no transfer to ICU or TCU | 46,492 (22.1) | 4.2 | 0.59 (0.56‐0.61) | 4.6 5.4 | 0.16 (0.12‐0.21) |
| Admitted to ward, LAPS 20, did experience transfer to ICU or TCU | 4,070 (1.9) | 21.4 | 2.37 (2.22‐2.54) | 14.8 21.0 | 8.76 (8.06‐9.47) |
| Admitted to ward, LAPS <20, no transfer to ICU or TCU | 66,334 (31.5) | 0.9 | 0.55 (0.51‐0.60) | 3.5 4.9 | 0.32 (0.28‐0.36) |
| Admitted to ward, LAPS <20, did experience transfer to ICU or TCU | 4,341 (2.1) | 9.5 | 4.31 (3.90‐4.74) | 11.8 18.1 | 7.12 (6.61‐7.64) |
Transfers to a higher level of care at a different hospital, which in the KPMCP are usually planned, experienced lower mortality than transfers within the same hospital. For ward to TCU transfers, intra‐hospital transfers had a mortality of 12.1% while inter‐hospital transfers had a mortality of 5.7%. Corresponding rates for ward to ICU transfers were 21.7% and 11.2%, and for TCU to ICU transfers the rates were 25.9% and 12.5%, respectively.
Among patients initially admitted to the ward, a model to predict the occurrence of a transfer to a higher level of care (within 48 hours after admission) that included age, sex, admission type, primary condition, LAPS, COPS, and interaction terms had poor discrimination, with an area under the receiver operator characteristic (c statistic) of only 0.64. The c statistic for a model to predict transfer after 48 hours was 0.66. The corresponding models for TCU admits had c statistics of 0.67 and 0.68. All four models had poor calibration.
Discussion
Using automated bed history data permits characterizing a patient population with disproportionate mortality and LOS: intra‐hospital transfers to special care units (ICUs or TCUs). Indeed, the largest subset of these patients (those initially admitted to the ward or TCU) constituted only 3.7% of all admissions, but accounted for 24.2% of all ICU admissions, 21.7% of all hospital deaths, and 13.2% of all hospital days. These patients also had very elevated OEMRs and OMELOS. Models based on age, sex, preadmission laboratory test results, and comorbidities did not predict the occurrence of these transfers.
We performed multivariate analyses to explore the degree to which electronically assigned preadmission severity scores could predict these transfers. These analyses found that, compared to our ability to predict inpatient or 30‐day mortality at the time of admission, which is excellent, our ability to predict the occurrence of transfer after admission is much more limited. These results highlight the limitations of severity scores that rely on automated data, which may not have adequate discrimination when it comes to determining the risk of an adverse outcome within a narrow time frame. For example, among the 121,237 patients initially admitted to the ward who did not experience an intra‐hospital transfer, the mean LAPS was 18.9, while the mean LAPS among the 6,484 ward patients who did experience a transfer was 25.5. Differences between the mean and median LAPS, COPS, and predicted mortality risk among transferred and non‐transferred patients were significant (P < 0.0001 for all comparisons). However, examination of the distribution of LAPS, COPS, and predicted mortality risk between these two groups of patients showed considerable overlap.
Our methodology resembles Silber et al.'s27, 28 concept of failure to rescue in that it focuses on events occurring after hospitalization. Silber et al. argue that a hospital's quality can be measured by quantifying the degree to which patients who experience new problems are successfully rescued. Furthermore, quantification of those situations where rescue attempts are unsuccessful is felt to be superior to simply comparing raw or adjusted mortality rates because these are primarily determined by underlying case mix. The primary difference between Silber et al.'s approach and ours is at the level of detailthey specified a specific set of complications, whereas our measure is more generic and would include patients with many of the complications specified by Silber et al.27, 28
Most of the patients transferred to a higher level of care in our cohort survived (ie, were rescued), indicating that intensive care is beneficial. However, the fact that these patients had elevated OEMRs and OMELOS indicates that the real challenge facing hospitalists involves the timing of provision of a beneficial intervention. In theory, improved timing could result from earlier detection of problems, which is the underlying rationale for employing rapid response teams. However, the fact that our electronic tools (LAPS, COPS) cannot predict patient deteriorations within a narrow time frame suggests that early detection will remain a major challenge. Manually assigned vital signs scores designed for this purpose do not have good discrimination either.29, 30 This raises the possibility that, though patient groups may differ in terms of overall illness severity and mortality risk, differences at the individual patient level may be too subtle for clinicians to detect. Future research may thus need to focus on scores that combine laboratory data, vital signs, trends in data,31, 32 and newer proteomic markers (eg, procalcitonin).33 We also found that most transfers occurred early (within <72 hours), raising the possibility that at least some of these transfers may involve issues around triage rather than sudden deterioration.
Our study has important limitations. Due to resource constraints and limited data availability, we could not characterize the patients as well as might be desirable; in particular, we could not make full determinations of the actual reasons for patients' transfer for all patients. Broadly speaking, transfer to a higher level of care could be due to inappropriate triage, appropriate (preventive) transfer (which could include transfer to a more richly staffed unit for a specific procedure), relentless progression of disease despite maximal therapy, the occurrence of management errors, patient and family uncertainty about goals of care or inadequate understanding of treatment options and prognoses, or a combination of these factors. We could not make these distinctions with currently available electronic data. This is also true of postsurgical patients, in whom it is difficult to determine which transfers to intensive care might be planned (eg, in the case of surgical procedures where ICU care is anticipated) as opposed to the occurrence of a deterioration during or following surgery. Another major limitation of this study is our inability to identify code or no code status electronically. The elapsed LOS at time of death among patients who experienced a transfer to a higher level of care (as compared to patients who died in the ward without ever experiencing intra‐hospital transfer) suggests, but does not prove, that prolonged efforts were being made to keep them alive. We were also limited in terms of having access to other process data (eg, physician staffing levels, provision and timing of palliative care). Having ICU severity of illness scores would have permitted us to compare our cohort to those of other recent studies showing elevated mortality rates among transfer patients,911 but we have not yet developed that capability.
Consideration of our study findings suggests a possible research agenda that could be implemented by hospitalist researchers. This agenda should emphasize three areas: detection, intervention, and reflection.
With respect to detection, attention needs to be paid to better tools for quantifying patient risk at the time a decision to admit to the ward is made. It is likely that such tools will need to combine the attributes of our severity score (LAPS) with those of the manually assigned scores.30, 34 In some cases, use of these tools could lead a physician to change the locus of admission from the ward to the TCU or ICU, which could improve outcomes by ensuring more timely provision of intensive care. Since problems with initial triage could be due to factors other than the failure to suspect or anticipate impending instability, future research should also include a cognitive component (eg, quantifying what proportion of subsequent patient deteriorations could be ascribed to missed diagnoses35). Additional work also needs to be done on developing mathematical models that can inform electronic monitoring of ward (not just ICU) patients.
Research on interventions that hospitalists can use to prevent the need for intensive care or to improve the rescue rate should take two routes. The first is a disease‐specific route, which builds on the fact that a relatively small set of conditions (pneumonia, sepsis, gastrointestinal bleeding) account for most transfers to a higher level of care. Condition‐specific protocols, checklists, and bundles36 tailored to a ward environment (as opposed to the ICU or to the entire hospital) might prevent deteriorations in these patients, as has been reported for sepsis.37 The second route is to improve the overall capabilities of rapid response and code blue teams. Such research would need to include a more careful assessment of what commonalities exist among patients who were and were not successfully rescued by these teams. This approach would probably yield more insights than the current literature, which focuses on whether rapid response teams are a good thing or not.
Finally, research also needs to be performed on how hospitalists reflect on adverse outcomes among ward patients. Greater emphasis needs to be placed on moving beyond trigger tool approaches that rely on manual chart review. In an era of expanding use of electronic medical record systems, more work needs to be done on how to harness these to provide hospitalists with better quantitative and risk‐adjusted information. This information should not be limited to simply reporting rates of transfers and deaths. Rather, finer distinctions must be provided with respect of the type of patients (ie, more diagnostic detail), the clinical status of patients (ie, more physiologic detail), as well as the effects of including or excluding patients in whom therapeutic options may be limited (ie, do not resuscitate and comfort care patients) on reported rates. Ideally, researchers should develop better process and outcomes measures that could be tested in collaborative networks that include multiple nonacademic general medical‐surgical wards.
Acknowledgements
The authors thank Drs. Paul Feigenbaum, Alan Whippy, Joseph V. Selby, and Philip Madvig for reviewing the manuscript and Ms. Jennifer Calhoun for formatting the manuscript.
- ,,.To Err is Human: Building a Safer Health System.Washington, D. C.:National Academy Press;2000.
- Institute for Healthcare Improvement. Protecting 5 million lives from harm. Available at: http://www.ihi.org/IHI/Programs/Campaign. Accessed June2010.
- ,.Identifying poor‐quality hospitals. Can hospital mortality rates detect quality problems for medical diagnoses?Med Care.1996;34(8):737–753.
- ,,.Surgical mortality as an indicator of hospital quality: the problem with small sample size.JAMA.2004;292(7):847–851.
- State of California Office of Statewide Health Planning and Development. AHRQ ‐ Inpatient quality indicators (IQIs) hospital inpatient mortality indicators for California. Available at: http://www.oshpd.ca.gov/HID/Products/PatDischargeData/AHRQ/iqi‐imi_overview.html. Accessed June2010.
- ,,, et al.Enhancement of claims data to improve risk adjustment of hospital mortality.JAMA.2007;297(1):71–76.
- ,,, et al.Variation in outcomes in Veterans Affairs intensive care units with a computerized severity measure.Crit Care Med.2005;33(5):930–939.
- ,,,.Acute Physiology and Chronic Health Evaluation (APACHE) IV: hospital mortality assessment for today's critically ill patients.Crit Care Med.2006;34(5):1297–1310.
- ,,,.Day of the week of intensive care admission and patient outcomes: a multisite regional evaluation.Med Care.2002;40(6):530–539.
- ,,, et al.The hospital mortality of patients admitted to the ICU on weekends.Chest.2004;126(4):1292–1298.
- ,,, et al.Mortality among patients admitted to intensive care units during weekday day shifts compared with “off” hours.Crit Care Med.2007;35(1):3–11.
- ,,, et al.Septic shock: an analysis of outcomes for patients with onset on hospital wards versus intensive care units.Crit Care Med.1998;26(6):1020–1024.
- ,,,,.Clinical antecedents to in‐hospital cardiopulmonary arrest.Chest.1990;98(6):1388–1392.
- ,.Developing strategies to prevent inhospital cardiac arrest: analyzing responses of physicians and nurses in the hours before the event.Crit Care Med.1994;22(2):244–247.
- MERIT Study Investigators.Introduction of the medical emergency team (MET) system: a cluster‐randomized controlled trial.Lancet.2005;365(9477):2091–2097.
- Institute for Healthcare Improvement.The “MERIT” Trial of Medical Emergency Teams in Australia: An Analysis of Findings and Implications.Boston, MA:2005. Available on www.ihi.org
- ,,.Rapid response teams‐‐walk, don't run.JAMA.2006;296(13):1645–1647.
- ,.IHI Global Trigger Tool for Measuring Adverse Events.2nd ed.Cambridge, Massachusetts:Institute for Healthcare Improvement;2009.
- ,,,,,.Risk adjusting hospital inpatient mortality using automated inpatient, outpatient, and laboratory databases.Medical Care.2008;46(3):232–239.
- ,,,.The Kaiser Permanente inpatient risk adjustment methodology was valid in an external patient population.J Clin Epidemiol.2010;63(7):798–803.
- .Linking automated databases for research in managed care settings.Ann Intern Med.1997;127(8 Pt 2):719–724.
- ,,, et al.Anticoagulation therapy for stroke prevention in atrial fibrillation: how well do randomized trials translate into clinical practice?JAMA.2003;290(20):2685–2692.
- ,,, et al.Richardson score predicts short‐term adverse respiratory outcomes in newborns >/=34 weeks gestation.J Pediatr.2004;145(6):754–760.
- ,,, et al.Risk adjusting community‐acquired pneumonia hospital outcomes using automated databases.Am J Manag Care.2008;14(3):158–166.
- Statistical Analysis Software [computer program]. Version 8.Cary, NC:SAS Institute, Inc.;2000.
- .Use and misuse of the receiver operating characteristic curve in risk prediction.Circulation.2007;115(7):928–935.
- ,,,.Hospital and patient characteristics associated with death after surgery. A study of adverse occurrence and failure to rescue.Med Care.1992;30(7):615–629.
- ,,.Comparing the contributions of groups of predictors: which outcomes vary with hospital rather than patient characteristics?J Am Stat Assoc.1995;90(429):7–18.
- ,.Beyond the intensive care unit: A review of interventions aimed at anticipating and preventing in‐hospital cardiopulmonary arrest.Resuscitation.2005;67(1):13–23.
- ,,.Reproducibility of physiological track‐and‐trigger warning systems for identifying at‐risk patients on the ward.Intensive Care Med.2007;33(4):619–624.
- ,,,,.Serial evaluation of the SOFA score to predict outcome in critically ill patients.JAMA.2001;286(14):1754–1758.
- ,,.Incorporation of Physiologic Trend and Interaction Effects in Neonatal Severity of Illness Scores: An Experiment Using a Variant of the Richardson Score.Intensive Care Med.2007;33(9):1602–1608.
- ,,, et al.Diagnostic and prognostic value of procalcitonin in patients with septic shock.Crit Care Med.2004;32(5):1166–1169.
- ,,, et al.Identifying the sick: can biochemical measurements be used to aid decision making on presentation to the accident and emergency department.Br J Anaesth.2005;94(6):735–741.
- .Improving patient care. The cognitive psychology of missed diagnoses.Ann Intern Med.2005;142(2):115–120.
- ,,,,,.Using care bundles to reduce in‐hospital mortality: quantitative survey.BMJ.2010;340:c1234.
- ,,, et al.Effect of a rapid response system for patients in shock on time to treatment and mortality during 5 years.Crit Care Med.2007;35(11):2568–2575.
Considerable research and public attention is being paid to the quantification, risk adjustment, and reporting of inpatient mortality.15 Inpatient mortality is reported as aggregate mortality (for all hospitalized patients or those with a specific diagnosis3, 6) or intensive care unit (ICU) mortality.7, 8 While reporting aggregate hospital or aggregate ICU mortality rates is useful, it is also important to develop reporting strategies that go beyond simply using data elements found in administrative databases (eg, diagnosis and procedure codes) to quantify practice variation. Ideally, such strategies would permit delineating processes of careparticularly those potentially under the control of hospitalists, not only intensiviststo identify improvement opportunities. One such process, which can be tracked using the bed history component of a patient's electronic medical record, is the transfer of patients between different units within the same hospital.
Several studies have documented that risk of ICU death is highest among patients transferred from general medical‐surgical wards, intermediate among direct admissions from the emergency department, and lowest among surgical admissions.911 Opportunities to reduce subsequent ICU mortality have been studied among ward patients who develop sepsis and are then transferred to the ICU,12 among patients who experience cardiac arrest,13, 14 as well as among patients with any physiological deterioration (eg, through the use of rapid response teams).1517 Most of these studies have been single‐center studies and/or studies reporting only an ICU denominator. While useful in some respects, such studies are less helpful to hospitalists, who would benefit from better understanding of the types of patients transferred and the total impact that transfers to a higher level of care make on general medical‐surgical wards. In addition, entities such as the Institute for Healthcare Improvement recommend the manual review of records of patients who were transferred from the ward to the ICU18 to identify performance improvement opportunities. While laudable, such approaches do not lend themselves to automated reporting strategies.
We recently described a new risk adjustment methodology for inpatient mortality based entirely on automated data preceding hospital admission and not restricted to ICU patients. This methodology, which has been externally validated in Ottawa, Canada, after development in the Kaiser Permanente Medical Care Program (KPMCP), permits quantification of a patient's pre‐existing comorbidity burden, physiologic derangement at the time of admission, and overall inpatient mortality risk.19, 20 The primary purpose of this study was to combine this methodology with bed history analysis to quantify the in‐hospital mortality and length of stay (LOS) of patients who experienced intra‐hospital transfers in a large, multihospital system. As a secondary goal, we also wanted to assess the degree to which these transfers could be predicted based on information available prior to a patient's admission.
ABBREVIATIONS AND TERMS USED IN TEXT
COPS: COmorbidity Point Score. Point score based on a patient's health care utilization diagnoses (during the year preceding admission to the hospital. Analogous to POA (present on admission) coding. Scores can range from 0 to a theoretical maximum of 701 but scores >200 are rare. With respect to a patient's pre‐existing comorbidity burden, the unadjusted relationship of COPS and inpatient mortality is as follows: a COPS <50 is associated with a mortality risk of <1%, <100 with a mortality risk of <5%, 100 to 145 with a mortality risk of 5% to 10%, and >145 with a mortality risk of 10% or more.
ICU: Intensive Care Unit. In this study, all ICUs have a minimum registered nurse to patient ratio of 1:2.
LAPS: Laboratory Acute Physiology Score. Point score based on 14 laboratory test results obtained in the 72 hours preceding hospitalization. With respect to a patient's physiologic derangement, the unadjusted relationship of LAPS and inpatient mortality is as follows: a LAPS <7 is associated with a mortality risk of <1%, <7 to 30 with a mortality risk of <5%, 30 to 60 with a mortality risk of 5% to 9%, and >60 with a mortality risk of 10% or more.
LOS: Exact hospital Length Of Stay. LOS is calculated from admission until first discharge home (i.e., it may span more than one hospital stay if a patient experienced inter‐hospital transport).
Predicted (expected) mortality risk: the % risk of death for a given patient based on his/her age, sex, admission diagnosis, COPS, and LAPS.
OEMR: Observed to Expected Mortality Ratio. For a given patient subset, the ratio of the actual mortality experienced by the subset to the expected (predicted) mortality for the subset. Predicted mortality is based on patients' age, sex, admission diagnosis, COPS, and LAPS.
OMELOS: Observed Minus Expected LOS. For a given patient subset, the difference between the actual number of hospital days experienced by the subset and the expected (predicted) number of hospital days for the subset. Predicted LOS is based on patients' age, sex, admission diagnosis, COPS, and LAPS.
TCU: Transitional Care Unit (also called intermediate care unit or stepdown unit). In this study, TCUs have variable nurse to patient ratios ranging from 1:2.5 to 1:3 and did not provide assisted ventilation, continuous pressor infusions, or invasive monitoring.
Materials and Methods
This project was approved by the Northern California KPMCP Institutional Review Board for the Protection of Human Subjects.
The Northern California KPMCP serves a total population of approximately 3.3 million members. Under a mutual exclusivity arrangement, physicians of The Permanente Medical Group, Inc., care for Kaiser Foundation Health Plan, Inc. members at facilities owned by Kaiser Foundation Hospitals, Inc. All Northern California KPMCP hospitals and clinics employ the same information systems with a common medical record number and can track care covered by the plan but delivered elsewhere. Databases maintained by the KPMCP capture admission and discharge times, admission and discharge diagnoses and procedures (assigned by professional coders), bed histories, inter‐hospital transfers, as well as the results of all inpatient and outpatient laboratory tests. The use of these databases for research has been described in multiple reports.2124
Our setting consisted of all 19 hospitals owned and operated by the KPMCP, whose characteristics are summarized in the Supporting Information Appendix available to interested readers. These include the 17 described in our previous report19 as well as 2 new hospitals (Antioch and Manteca) which are similar in size and type of population served. Our study population consisted of all patients admitted to these 19 hospitals who met these criteria: 1) hospitalization began from November 1st, 2006 through January 31st, 2008; 2) initial hospitalization occurred at a Northern California KPMCP hospital (ie, for inter‐hospital transfers, the first hospital stay occurred within the KPMCP); 3) age 15 years; and 4) hospitalization was not for childbirth.
We defined a linked hospitalization as the time period that began with a patient's admission to the hospital and ended with the patient's discharge (home, to a nursing home, or death). Linked hospitalizations can thus involve more than 1 hospital stay and could include a patient transfer from one hospital to another prior to definitive discharge. For linked hospitalizations, mortality was attributed to the admitting KPMCP hospital (ie, if a patient was admitted to hospital A, transferred to B, and died at hospital B, mortality was attributed to hospital A). We defined total LOS as the exact time in hours from when a patient was first admitted to the hospital until death or final discharge home or to a nursing home, while total ICU or transitional care unit (TCU, referred to as stepdown unit in some hospitals) LOS was calculated for all individual ICU or TCU stays during the hospital stay.
Intra‐Hospital Transfers
We grouped all possible hospital units into four types: general medical‐surgical ward (henceforth, ward); operating room (OR)/post‐anesthesia recovery (PAR); TCU; and ICU. In 2003, the KPMCP implemented a mandatory minimum staffing ratio of one registered nurse for every four patients in all its hospital units; in addition, staffing levels for designated ICUs adhered to the previously mandated minimum of one nurse for every 2 patients. So long as they adhere to these minimum ratios, individual hospitals have considerable autonomy with respect to how they staff or designate individual hospital units. Registered nurse‐to‐patient ratios during the time of this study were as follows: ward patients, 1:3.5 to 1:4; TCU patients, 1:2.5 to 1:3; and ICU patients, 1:1 to 1:2. Staffing ratios for the OR and PAR are more variable, depending on the surgical procedures involved. Current KPMCP databases do not permit accurate quantification of physician staffing. All 19 study hospitals had designated ICUs, 6 were teaching hospitals, and 11 had designated TCUs. None of the study hospitals had closed ICUs (units where only intensivists admit patients) and none had continuous coverage of the ICU by intensivists. While we were not able to employ electronic data to determine who made the decision to transfer, we did find considerable variation with respect to how intensivists covered the ICUs and how they interfaced with hospitalists. Staffing levels for specialized coronary care units and non‐ICU monitored beds were not standardized. All study hospitals had rapid response teams as well as code blue teams during the time period covered by this report. Respiratory care practitioners were available to patients in all hospital units, but considerable variation existed with respect to other services available (eg, cardiac catheterization units, provision of noninvasive positive pressure ventilation outside the ICU, etc.).
This report focuses on intra‐hospital transfers to the ICU and TCU, with special emphasis on nonsurgical transfers (due to space limitations, we are not reporting on the outcomes of patients whose first hospital unit was the OR; additional details on these patients are provided in the Supporting Information Appendix). For the purposes of this report, we defined the following admission types: direct admits (patients admitted to the ICU or TCU whose first hospital unit on admission was the ICU or TCU); and nonsurgical transfers to a higher level of care. These latter transfers could be of 3 types: ward to ICU, ward to TCU, and TCU to ICU. We also quantified the effect of inter‐hospital transfers.
Independent Variables
In addition to patients' age and sex, we employed the following independent variables to predict transfer to a higher level of care. These variables are part of the risk adjustment model described in greater detail in our previous report19 and were available electronically for all patients in the cohort. We grouped admission diagnoses into 44 broad diagnostic categories (Primary Conditions), and admission types into 4 groups (emergency medical, emergency surgical, elective medical, and elective surgical). We quantified patients' degree of physiologic derangement using a Laboratory‐based Acute Physiology Score (LAPS) using laboratory test results prior to hospitalization. We quantified patients' comorbid illness burden using a Comorbidity Point Score (COPS) based on patients' pre‐existing diagnoses over the 12‐month period preceding hospitalization. Lastly, we assigned each patient a predicted mortality risk (%) and LOS based on the above predictors,19 permitting calculation of observed to expected mortality ratios (OEMRs) and observed minus expected LOS (OMELOS).
Statistical Methods
All analyses were performed in SAS.25 We calculated standard descriptive statistics (medians, means, standard deviations) and compared different patient groupings using t and chi‐square tests. We employed a similar approach to that reported by Render et al.7 to calculate OEMR and OMELOS.
To determine the degree to which transfers to a higher level of care from the ward or TCU would be predictable using information available at the time of admission, we performed 4 sets of logistic regression analyses using the above‐mentioned predictors in which the outcome variables were as follows: 1) transfer occurring in the first 48 hours after admission (time frame by which point approximately half of the transferred patients experienced a transfer) among ward or TCU patients and 2) transfer occurring after 48 hours among ward or TCU patients. We evaluated the discrimination and calibration of these models using the same methods described in our original report (measuring the area under the receiver operator characteristic curve, or c statistic, and visually examining observed and expected mortality rates among predicted risk bands as well as risk deciles) as well as additional statistical tests recommended by Cook.19, 26
Results
During the study period, a total of 249,129 individual hospital stays involving 170,151 patients occurred at these 19 hospitals. After concatenation of inter‐hospital transfers, we were left with 237,208 linked hospitalizations. We excluded 26,738 linked hospitalizations that began at a non‐KPMCP hospital (ie, they were transported in), leaving a total of 210,470 linked hospitalizations involving 150,495 patients. The overall linked hospitalization mortality rate was 3.30%.
Table 1 summarizes cohort characteristics based on initial hospital location. On admission, ICU patients had the highest degree of physiologic derangement as well as the highest predicted mortality. Considerable inter‐hospital variation was present in both predictors and outcomes; details on these variations are provided in the Supporting Information Appendix.
| Ward | TCU | ICU | All* | |
|---|---|---|---|---|
| ||||
| n | 121,237 | 20,556 | 16,001 | 210,470 |
| Admitted via emergency department, n (%) | 99,909 (82.4) | 18,612 (90.5) | 13,847 (86.5) | 139,036 (66.1) |
| % range across hospitals | 55.0‐94.2 | 64.7‐97.6 | 49.5‐97.4 | 53.6‐76.9 |
| Male, n (%) | 53,744 (44.3) | 10,362 (50.4) | 8,378 (52.4) | 94,451 (44.9) |
| Age in years (mean SD) | 64.5 19.2 | 69.0 15.6 | 63.7 17.8 | 63.2 18.6 |
| LAPS (mean SD) | 19.2 18.0 | 23.3 19.5 | 31.7 25.7 | 16.7 19.0 |
| COPS (mean SD) | 90.4 64.0 | 99.2 65.9 | 94.5 67.5 | 84.7 61.8 |
| % predicted mortality (mean SD) | 4.0 7.1 | 4.6 7.3 | 8.7 12.8 | 3.6 7.3 |
| Observed in‐hospital deaths (n, %) | 3,793 (3.1) | 907 (4.4) | 1,995 (12.5) | 6,952 (3.3) |
| Observed to expected mortality ratio | 0.79 (0.77‐0.82) | 0.95 (0.89‐1.02) | 1.43 (1.36‐1.49) | 0.92 (0.89‐0.94) |
| Total hospital LOS, days (mean SD) | 4.6 7.5 | 5.3 10.0 | 7.8 14.0 | 4.6 8.1 |
Table 2 summarizes data from 3 groups of patients: patients initially admitted to the ward, or TCU, who did not experience a transfer to a higher level of care and patients admitted to these 2 units who did experience such a transfer. Patients who experienced a transfer constituted 5.3% (6,484/121,237) of ward patients and 6.7% (1,384/20,556) of TCU patients. Transferred patients tended to be older, have more acute physiologic derangement (higher LAPS), a greater pre‐existing illness burden (higher COPS), and a higher predicted mortality risk. Among ward patients, those with the following admission diagnoses were most likely to experience a transfer to a higher level of care: gastrointestinal bleeding (10.8% of all transfers), pneumonia (8.7%), and other infections (8.2%). The diagnoses most likely to be associated with death following transfer were cancer (death rate among transferred patients, 48%), renal disease (death rate, 36%), and liver disease (33%). Similar distributions were observed for TCU patients.
| Patients Initially Admitted to Ward, Remained There | Patients Initially Admitted to TCU, Remained There | Patients Transferred to Higher Level of Care | All | |
|---|---|---|---|---|
| ||||
| n | 114,753 | 19,172 | 7,868 | 141,793 |
| Male, n (%) | 50,586 (44.1) | 9,626 (50.2) | 3,894 (49.5) | 64,106 (45.2) |
| Age (mean SD) | 64.3 19.4 | 69.0 15.7 | 68.1 16.1 | 65.2 18.8 |
| LAPS (mean SD) | 18.9 17.8 | 22.7 19.1 | 26.7 21.0 | 19.8 18.3 |
| COPS (mean SD) | 89.4 63.7 | 98.3 65.5 | 107.9 67.6 | 91.7 64.4 |
| % predicted mortality risk (mean SD) | 3.8 7.0 | 4.4 7.0 | 6.5 8.8 | 4.1 7.1 |
| Admission diagnosis of pneumonia, n (%) | 5,624 (4.9) | 865 (4.5) | 684 (8.7) | 7,173 (5.1) |
| Admission diagnosis of sepsis, n (%) | 1,181 (1.0) | 227 (1.2) | 168 (2.1) | 1,576 (1.1) |
| Admission diagnosis of GI bleed, n (%) | 13,615 (11.9) | 1,448 (7.6) | 851 (10.8) | 15,914 (11.2) |
| Admission diagnosis of cancer, n (%) | 2,406 (2.1) | 80 (0.4) | 186 (2.4) | 2,672 (1.9) |
Table 3 compares outcomes among ward and TCU patients who did and did not experience a transfer to a higher level of care. The table shows that transferred patients were almost 3 times as likely to die, even after controlling for severity of illness, and that their hospital LOS was 9 days higher than expected. This increased risk was seen in all hospitals and among all transfer types (ward to ICU, ward to TCU, and TCU to ICU).
| Patients Initially Admitted to Ward, Remained There | Patients Initially Admitted to TCU, Remained There | Patients Transferred to Higher Level of Care | |
|---|---|---|---|
| |||
| n | 114,753 | 19,172 | 7,868 |
| Admitted to ICU, n (%) | 0 (0.0) | 0 (0.0) | 5,245 (66.7) |
| Ventilated, n (%) | 0 (0.0) | 0 (0.0) | 1,346 (17.1) |
| Died in the hospital, n (%) | 2,619 (2.3) | 572 (3.0) | 1,509 (19.2) |
| Length of stay, in days, at time of death (mean SD) | 7.0 11.9 | 8.3 12.4 | 16.2 23.7 |
| Observed to expected mortality ratio (95% CI) | 0.60 (0.57‐0.62) | 0.68 (0.63‐0.74) | 2.93 (2.79‐3.09) |
| Total hospital length of stay, days (mean SD) | 4.0 5.7 | 4.4 6.9 | 14.3 21.3 |
| Observed minus expected length of stay (95% CI) | 0.4 (0.3‐0.4) | 0.8 (0.7‐0.9) | 9.1 (8.6‐9.5) |
| Length of stay, in hours, at time of transfer (mean SD) | 80.8 167.2 | ||
Table 3 also shows that, among decedent patients, those who never left the ward or TCU died much sooner than those who died following transfer. Among direct admits to the ICU, the median LOS at time of death was 3.9 days, with a mean of 9.4 standard deviation of 19.9 days, while the corresponding times for TCU direct admits were a median and mean LOS of 6.5 and 11.7 19.5 days.
Table 4 summarizes outcomes among different patient subgroups that did and did not experience a transfer to a higher level of care. Based on location, patients who experienced a transfer from the TCU to the ICU had the highest crude death rate, but patients transferred from the ward to the ICU had the highest OEMR. On the other hand, if one divides patients by the degree of physiologic derangement, patients with low LAPS who experienced a transfer had the highest OEMR. With respect to LOS, patients transferred from the TCU to the ICU had the highest OMELOS (13.4 extra days).
| n (%)* | Death Rate (%) | OEMR | LOS (mean SD) | OMELOS | |
|---|---|---|---|---|---|
| |||||
| Never admitted to TCU or ICU | 157,632 (74.9) | 1.6 | 0.55 (0.53‐0.57) | 3.6 4.6 | 0.04 (0.02‐0.07) |
| Direct admit to TCU | 18,464 (8.8) | 2.9 | 0.66 (0.61‐0.72) | 4.2 5.8 | 0.60 (0.52‐0.68) |
| Direct admit to ICU | 14,655 (7.0) | 11.9 | 1.38 (1.32‐1.45) | 6.4 9.4 | 2.28 (2.14‐2.43) |
| Transferred from ward to ICU | 5,145 (2.4) | 21.5 | 3.23 (3.04‐3.42) | 15.7 21.6 | 10.33 (9.70‐10.96) |
| Transferred from ward to TCU | 3,144 (1.5) | 11.9 | 1.99 (1.79‐2.20) | 13.6 23.2 | 8.02 (7.23‐8.82) |
| Transferred from TCU to ICU | 1,107 (0.5) | 25.7 | 2.94 (2.61‐3.31) | 18.0 28.2 | 13.35 (11.49‐15.21) |
| Admitted to ward, COPS 80, no transfer to ICU or TCU | 55,405 (26.3) | 3.4 | 0.59 (0.56‐0.62) | 4.5 5.9 | 0.29 (0.24‐0.34) |
| Admitted to ward, COPS 80, did experience transfer to ICU or TCU | 4,851 (2.3) | 19.3 | 2.72 (2.55‐2.90) | 14.2 20.0 | 8.14 (7.56‐8.71) |
| Admitted to ward, COPS <80, no transfer to ICU or TCU | 57,421 (27.3) | 1.1 | 0.55 (0.51‐0.59) | 3.4 4.2 | 0.23 (0.19‐0.26) |
| Admitted to ward, COPS <80, did experience transfer to ICU or TCU | 3,560 (1.7) | 9.8 | 2.93 (2.63‐3.26) | 12.0 19.0 | 7.52 (6.89‐8.15) |
| Admitted to ward, LAPS 20, no transfer to ICU or TCU | 46,492 (22.1) | 4.2 | 0.59 (0.56‐0.61) | 4.6 5.4 | 0.16 (0.12‐0.21) |
| Admitted to ward, LAPS 20, did experience transfer to ICU or TCU | 4,070 (1.9) | 21.4 | 2.37 (2.22‐2.54) | 14.8 21.0 | 8.76 (8.06‐9.47) |
| Admitted to ward, LAPS <20, no transfer to ICU or TCU | 66,334 (31.5) | 0.9 | 0.55 (0.51‐0.60) | 3.5 4.9 | 0.32 (0.28‐0.36) |
| Admitted to ward, LAPS <20, did experience transfer to ICU or TCU | 4,341 (2.1) | 9.5 | 4.31 (3.90‐4.74) | 11.8 18.1 | 7.12 (6.61‐7.64) |
Transfers to a higher level of care at a different hospital, which in the KPMCP are usually planned, experienced lower mortality than transfers within the same hospital. For ward to TCU transfers, intra‐hospital transfers had a mortality of 12.1% while inter‐hospital transfers had a mortality of 5.7%. Corresponding rates for ward to ICU transfers were 21.7% and 11.2%, and for TCU to ICU transfers the rates were 25.9% and 12.5%, respectively.
Among patients initially admitted to the ward, a model to predict the occurrence of a transfer to a higher level of care (within 48 hours after admission) that included age, sex, admission type, primary condition, LAPS, COPS, and interaction terms had poor discrimination, with an area under the receiver operator characteristic (c statistic) of only 0.64. The c statistic for a model to predict transfer after 48 hours was 0.66. The corresponding models for TCU admits had c statistics of 0.67 and 0.68. All four models had poor calibration.
Discussion
Using automated bed history data permits characterizing a patient population with disproportionate mortality and LOS: intra‐hospital transfers to special care units (ICUs or TCUs). Indeed, the largest subset of these patients (those initially admitted to the ward or TCU) constituted only 3.7% of all admissions, but accounted for 24.2% of all ICU admissions, 21.7% of all hospital deaths, and 13.2% of all hospital days. These patients also had very elevated OEMRs and OMELOS. Models based on age, sex, preadmission laboratory test results, and comorbidities did not predict the occurrence of these transfers.
We performed multivariate analyses to explore the degree to which electronically assigned preadmission severity scores could predict these transfers. These analyses found that, compared to our ability to predict inpatient or 30‐day mortality at the time of admission, which is excellent, our ability to predict the occurrence of transfer after admission is much more limited. These results highlight the limitations of severity scores that rely on automated data, which may not have adequate discrimination when it comes to determining the risk of an adverse outcome within a narrow time frame. For example, among the 121,237 patients initially admitted to the ward who did not experience an intra‐hospital transfer, the mean LAPS was 18.9, while the mean LAPS among the 6,484 ward patients who did experience a transfer was 25.5. Differences between the mean and median LAPS, COPS, and predicted mortality risk among transferred and non‐transferred patients were significant (P < 0.0001 for all comparisons). However, examination of the distribution of LAPS, COPS, and predicted mortality risk between these two groups of patients showed considerable overlap.
Our methodology resembles Silber et al.'s27, 28 concept of failure to rescue in that it focuses on events occurring after hospitalization. Silber et al. argue that a hospital's quality can be measured by quantifying the degree to which patients who experience new problems are successfully rescued. Furthermore, quantification of those situations where rescue attempts are unsuccessful is felt to be superior to simply comparing raw or adjusted mortality rates because these are primarily determined by underlying case mix. The primary difference between Silber et al.'s approach and ours is at the level of detailthey specified a specific set of complications, whereas our measure is more generic and would include patients with many of the complications specified by Silber et al.27, 28
Most of the patients transferred to a higher level of care in our cohort survived (ie, were rescued), indicating that intensive care is beneficial. However, the fact that these patients had elevated OEMRs and OMELOS indicates that the real challenge facing hospitalists involves the timing of provision of a beneficial intervention. In theory, improved timing could result from earlier detection of problems, which is the underlying rationale for employing rapid response teams. However, the fact that our electronic tools (LAPS, COPS) cannot predict patient deteriorations within a narrow time frame suggests that early detection will remain a major challenge. Manually assigned vital signs scores designed for this purpose do not have good discrimination either.29, 30 This raises the possibility that, though patient groups may differ in terms of overall illness severity and mortality risk, differences at the individual patient level may be too subtle for clinicians to detect. Future research may thus need to focus on scores that combine laboratory data, vital signs, trends in data,31, 32 and newer proteomic markers (eg, procalcitonin).33 We also found that most transfers occurred early (within <72 hours), raising the possibility that at least some of these transfers may involve issues around triage rather than sudden deterioration.
Our study has important limitations. Due to resource constraints and limited data availability, we could not characterize the patients as well as might be desirable; in particular, we could not make full determinations of the actual reasons for patients' transfer for all patients. Broadly speaking, transfer to a higher level of care could be due to inappropriate triage, appropriate (preventive) transfer (which could include transfer to a more richly staffed unit for a specific procedure), relentless progression of disease despite maximal therapy, the occurrence of management errors, patient and family uncertainty about goals of care or inadequate understanding of treatment options and prognoses, or a combination of these factors. We could not make these distinctions with currently available electronic data. This is also true of postsurgical patients, in whom it is difficult to determine which transfers to intensive care might be planned (eg, in the case of surgical procedures where ICU care is anticipated) as opposed to the occurrence of a deterioration during or following surgery. Another major limitation of this study is our inability to identify code or no code status electronically. The elapsed LOS at time of death among patients who experienced a transfer to a higher level of care (as compared to patients who died in the ward without ever experiencing intra‐hospital transfer) suggests, but does not prove, that prolonged efforts were being made to keep them alive. We were also limited in terms of having access to other process data (eg, physician staffing levels, provision and timing of palliative care). Having ICU severity of illness scores would have permitted us to compare our cohort to those of other recent studies showing elevated mortality rates among transfer patients,911 but we have not yet developed that capability.
Consideration of our study findings suggests a possible research agenda that could be implemented by hospitalist researchers. This agenda should emphasize three areas: detection, intervention, and reflection.
With respect to detection, attention needs to be paid to better tools for quantifying patient risk at the time a decision to admit to the ward is made. It is likely that such tools will need to combine the attributes of our severity score (LAPS) with those of the manually assigned scores.30, 34 In some cases, use of these tools could lead a physician to change the locus of admission from the ward to the TCU or ICU, which could improve outcomes by ensuring more timely provision of intensive care. Since problems with initial triage could be due to factors other than the failure to suspect or anticipate impending instability, future research should also include a cognitive component (eg, quantifying what proportion of subsequent patient deteriorations could be ascribed to missed diagnoses35). Additional work also needs to be done on developing mathematical models that can inform electronic monitoring of ward (not just ICU) patients.
Research on interventions that hospitalists can use to prevent the need for intensive care or to improve the rescue rate should take two routes. The first is a disease‐specific route, which builds on the fact that a relatively small set of conditions (pneumonia, sepsis, gastrointestinal bleeding) account for most transfers to a higher level of care. Condition‐specific protocols, checklists, and bundles36 tailored to a ward environment (as opposed to the ICU or to the entire hospital) might prevent deteriorations in these patients, as has been reported for sepsis.37 The second route is to improve the overall capabilities of rapid response and code blue teams. Such research would need to include a more careful assessment of what commonalities exist among patients who were and were not successfully rescued by these teams. This approach would probably yield more insights than the current literature, which focuses on whether rapid response teams are a good thing or not.
Finally, research also needs to be performed on how hospitalists reflect on adverse outcomes among ward patients. Greater emphasis needs to be placed on moving beyond trigger tool approaches that rely on manual chart review. In an era of expanding use of electronic medical record systems, more work needs to be done on how to harness these to provide hospitalists with better quantitative and risk‐adjusted information. This information should not be limited to simply reporting rates of transfers and deaths. Rather, finer distinctions must be provided with respect of the type of patients (ie, more diagnostic detail), the clinical status of patients (ie, more physiologic detail), as well as the effects of including or excluding patients in whom therapeutic options may be limited (ie, do not resuscitate and comfort care patients) on reported rates. Ideally, researchers should develop better process and outcomes measures that could be tested in collaborative networks that include multiple nonacademic general medical‐surgical wards.
Acknowledgements
The authors thank Drs. Paul Feigenbaum, Alan Whippy, Joseph V. Selby, and Philip Madvig for reviewing the manuscript and Ms. Jennifer Calhoun for formatting the manuscript.
Considerable research and public attention is being paid to the quantification, risk adjustment, and reporting of inpatient mortality.15 Inpatient mortality is reported as aggregate mortality (for all hospitalized patients or those with a specific diagnosis3, 6) or intensive care unit (ICU) mortality.7, 8 While reporting aggregate hospital or aggregate ICU mortality rates is useful, it is also important to develop reporting strategies that go beyond simply using data elements found in administrative databases (eg, diagnosis and procedure codes) to quantify practice variation. Ideally, such strategies would permit delineating processes of careparticularly those potentially under the control of hospitalists, not only intensiviststo identify improvement opportunities. One such process, which can be tracked using the bed history component of a patient's electronic medical record, is the transfer of patients between different units within the same hospital.
Several studies have documented that risk of ICU death is highest among patients transferred from general medical‐surgical wards, intermediate among direct admissions from the emergency department, and lowest among surgical admissions.911 Opportunities to reduce subsequent ICU mortality have been studied among ward patients who develop sepsis and are then transferred to the ICU,12 among patients who experience cardiac arrest,13, 14 as well as among patients with any physiological deterioration (eg, through the use of rapid response teams).1517 Most of these studies have been single‐center studies and/or studies reporting only an ICU denominator. While useful in some respects, such studies are less helpful to hospitalists, who would benefit from better understanding of the types of patients transferred and the total impact that transfers to a higher level of care make on general medical‐surgical wards. In addition, entities such as the Institute for Healthcare Improvement recommend the manual review of records of patients who were transferred from the ward to the ICU18 to identify performance improvement opportunities. While laudable, such approaches do not lend themselves to automated reporting strategies.
We recently described a new risk adjustment methodology for inpatient mortality based entirely on automated data preceding hospital admission and not restricted to ICU patients. This methodology, which has been externally validated in Ottawa, Canada, after development in the Kaiser Permanente Medical Care Program (KPMCP), permits quantification of a patient's pre‐existing comorbidity burden, physiologic derangement at the time of admission, and overall inpatient mortality risk.19, 20 The primary purpose of this study was to combine this methodology with bed history analysis to quantify the in‐hospital mortality and length of stay (LOS) of patients who experienced intra‐hospital transfers in a large, multihospital system. As a secondary goal, we also wanted to assess the degree to which these transfers could be predicted based on information available prior to a patient's admission.
ABBREVIATIONS AND TERMS USED IN TEXT
COPS: COmorbidity Point Score. Point score based on a patient's health care utilization diagnoses (during the year preceding admission to the hospital. Analogous to POA (present on admission) coding. Scores can range from 0 to a theoretical maximum of 701 but scores >200 are rare. With respect to a patient's pre‐existing comorbidity burden, the unadjusted relationship of COPS and inpatient mortality is as follows: a COPS <50 is associated with a mortality risk of <1%, <100 with a mortality risk of <5%, 100 to 145 with a mortality risk of 5% to 10%, and >145 with a mortality risk of 10% or more.
ICU: Intensive Care Unit. In this study, all ICUs have a minimum registered nurse to patient ratio of 1:2.
LAPS: Laboratory Acute Physiology Score. Point score based on 14 laboratory test results obtained in the 72 hours preceding hospitalization. With respect to a patient's physiologic derangement, the unadjusted relationship of LAPS and inpatient mortality is as follows: a LAPS <7 is associated with a mortality risk of <1%, <7 to 30 with a mortality risk of <5%, 30 to 60 with a mortality risk of 5% to 9%, and >60 with a mortality risk of 10% or more.
LOS: Exact hospital Length Of Stay. LOS is calculated from admission until first discharge home (i.e., it may span more than one hospital stay if a patient experienced inter‐hospital transport).
Predicted (expected) mortality risk: the % risk of death for a given patient based on his/her age, sex, admission diagnosis, COPS, and LAPS.
OEMR: Observed to Expected Mortality Ratio. For a given patient subset, the ratio of the actual mortality experienced by the subset to the expected (predicted) mortality for the subset. Predicted mortality is based on patients' age, sex, admission diagnosis, COPS, and LAPS.
OMELOS: Observed Minus Expected LOS. For a given patient subset, the difference between the actual number of hospital days experienced by the subset and the expected (predicted) number of hospital days for the subset. Predicted LOS is based on patients' age, sex, admission diagnosis, COPS, and LAPS.
TCU: Transitional Care Unit (also called intermediate care unit or stepdown unit). In this study, TCUs have variable nurse to patient ratios ranging from 1:2.5 to 1:3 and did not provide assisted ventilation, continuous pressor infusions, or invasive monitoring.
Materials and Methods
This project was approved by the Northern California KPMCP Institutional Review Board for the Protection of Human Subjects.
The Northern California KPMCP serves a total population of approximately 3.3 million members. Under a mutual exclusivity arrangement, physicians of The Permanente Medical Group, Inc., care for Kaiser Foundation Health Plan, Inc. members at facilities owned by Kaiser Foundation Hospitals, Inc. All Northern California KPMCP hospitals and clinics employ the same information systems with a common medical record number and can track care covered by the plan but delivered elsewhere. Databases maintained by the KPMCP capture admission and discharge times, admission and discharge diagnoses and procedures (assigned by professional coders), bed histories, inter‐hospital transfers, as well as the results of all inpatient and outpatient laboratory tests. The use of these databases for research has been described in multiple reports.2124
Our setting consisted of all 19 hospitals owned and operated by the KPMCP, whose characteristics are summarized in the Supporting Information Appendix available to interested readers. These include the 17 described in our previous report19 as well as 2 new hospitals (Antioch and Manteca) which are similar in size and type of population served. Our study population consisted of all patients admitted to these 19 hospitals who met these criteria: 1) hospitalization began from November 1st, 2006 through January 31st, 2008; 2) initial hospitalization occurred at a Northern California KPMCP hospital (ie, for inter‐hospital transfers, the first hospital stay occurred within the KPMCP); 3) age 15 years; and 4) hospitalization was not for childbirth.
We defined a linked hospitalization as the time period that began with a patient's admission to the hospital and ended with the patient's discharge (home, to a nursing home, or death). Linked hospitalizations can thus involve more than 1 hospital stay and could include a patient transfer from one hospital to another prior to definitive discharge. For linked hospitalizations, mortality was attributed to the admitting KPMCP hospital (ie, if a patient was admitted to hospital A, transferred to B, and died at hospital B, mortality was attributed to hospital A). We defined total LOS as the exact time in hours from when a patient was first admitted to the hospital until death or final discharge home or to a nursing home, while total ICU or transitional care unit (TCU, referred to as stepdown unit in some hospitals) LOS was calculated for all individual ICU or TCU stays during the hospital stay.
Intra‐Hospital Transfers
We grouped all possible hospital units into four types: general medical‐surgical ward (henceforth, ward); operating room (OR)/post‐anesthesia recovery (PAR); TCU; and ICU. In 2003, the KPMCP implemented a mandatory minimum staffing ratio of one registered nurse for every four patients in all its hospital units; in addition, staffing levels for designated ICUs adhered to the previously mandated minimum of one nurse for every 2 patients. So long as they adhere to these minimum ratios, individual hospitals have considerable autonomy with respect to how they staff or designate individual hospital units. Registered nurse‐to‐patient ratios during the time of this study were as follows: ward patients, 1:3.5 to 1:4; TCU patients, 1:2.5 to 1:3; and ICU patients, 1:1 to 1:2. Staffing ratios for the OR and PAR are more variable, depending on the surgical procedures involved. Current KPMCP databases do not permit accurate quantification of physician staffing. All 19 study hospitals had designated ICUs, 6 were teaching hospitals, and 11 had designated TCUs. None of the study hospitals had closed ICUs (units where only intensivists admit patients) and none had continuous coverage of the ICU by intensivists. While we were not able to employ electronic data to determine who made the decision to transfer, we did find considerable variation with respect to how intensivists covered the ICUs and how they interfaced with hospitalists. Staffing levels for specialized coronary care units and non‐ICU monitored beds were not standardized. All study hospitals had rapid response teams as well as code blue teams during the time period covered by this report. Respiratory care practitioners were available to patients in all hospital units, but considerable variation existed with respect to other services available (eg, cardiac catheterization units, provision of noninvasive positive pressure ventilation outside the ICU, etc.).
This report focuses on intra‐hospital transfers to the ICU and TCU, with special emphasis on nonsurgical transfers (due to space limitations, we are not reporting on the outcomes of patients whose first hospital unit was the OR; additional details on these patients are provided in the Supporting Information Appendix). For the purposes of this report, we defined the following admission types: direct admits (patients admitted to the ICU or TCU whose first hospital unit on admission was the ICU or TCU); and nonsurgical transfers to a higher level of care. These latter transfers could be of 3 types: ward to ICU, ward to TCU, and TCU to ICU. We also quantified the effect of inter‐hospital transfers.
Independent Variables
In addition to patients' age and sex, we employed the following independent variables to predict transfer to a higher level of care. These variables are part of the risk adjustment model described in greater detail in our previous report19 and were available electronically for all patients in the cohort. We grouped admission diagnoses into 44 broad diagnostic categories (Primary Conditions), and admission types into 4 groups (emergency medical, emergency surgical, elective medical, and elective surgical). We quantified patients' degree of physiologic derangement using a Laboratory‐based Acute Physiology Score (LAPS) using laboratory test results prior to hospitalization. We quantified patients' comorbid illness burden using a Comorbidity Point Score (COPS) based on patients' pre‐existing diagnoses over the 12‐month period preceding hospitalization. Lastly, we assigned each patient a predicted mortality risk (%) and LOS based on the above predictors,19 permitting calculation of observed to expected mortality ratios (OEMRs) and observed minus expected LOS (OMELOS).
Statistical Methods
All analyses were performed in SAS.25 We calculated standard descriptive statistics (medians, means, standard deviations) and compared different patient groupings using t and chi‐square tests. We employed a similar approach to that reported by Render et al.7 to calculate OEMR and OMELOS.
To determine the degree to which transfers to a higher level of care from the ward or TCU would be predictable using information available at the time of admission, we performed 4 sets of logistic regression analyses using the above‐mentioned predictors in which the outcome variables were as follows: 1) transfer occurring in the first 48 hours after admission (time frame by which point approximately half of the transferred patients experienced a transfer) among ward or TCU patients and 2) transfer occurring after 48 hours among ward or TCU patients. We evaluated the discrimination and calibration of these models using the same methods described in our original report (measuring the area under the receiver operator characteristic curve, or c statistic, and visually examining observed and expected mortality rates among predicted risk bands as well as risk deciles) as well as additional statistical tests recommended by Cook.19, 26
Results
During the study period, a total of 249,129 individual hospital stays involving 170,151 patients occurred at these 19 hospitals. After concatenation of inter‐hospital transfers, we were left with 237,208 linked hospitalizations. We excluded 26,738 linked hospitalizations that began at a non‐KPMCP hospital (ie, they were transported in), leaving a total of 210,470 linked hospitalizations involving 150,495 patients. The overall linked hospitalization mortality rate was 3.30%.
Table 1 summarizes cohort characteristics based on initial hospital location. On admission, ICU patients had the highest degree of physiologic derangement as well as the highest predicted mortality. Considerable inter‐hospital variation was present in both predictors and outcomes; details on these variations are provided in the Supporting Information Appendix.
| Ward | TCU | ICU | All* | |
|---|---|---|---|---|
| ||||
| n | 121,237 | 20,556 | 16,001 | 210,470 |
| Admitted via emergency department, n (%) | 99,909 (82.4) | 18,612 (90.5) | 13,847 (86.5) | 139,036 (66.1) |
| % range across hospitals | 55.0‐94.2 | 64.7‐97.6 | 49.5‐97.4 | 53.6‐76.9 |
| Male, n (%) | 53,744 (44.3) | 10,362 (50.4) | 8,378 (52.4) | 94,451 (44.9) |
| Age in years (mean SD) | 64.5 19.2 | 69.0 15.6 | 63.7 17.8 | 63.2 18.6 |
| LAPS (mean SD) | 19.2 18.0 | 23.3 19.5 | 31.7 25.7 | 16.7 19.0 |
| COPS (mean SD) | 90.4 64.0 | 99.2 65.9 | 94.5 67.5 | 84.7 61.8 |
| % predicted mortality (mean SD) | 4.0 7.1 | 4.6 7.3 | 8.7 12.8 | 3.6 7.3 |
| Observed in‐hospital deaths (n, %) | 3,793 (3.1) | 907 (4.4) | 1,995 (12.5) | 6,952 (3.3) |
| Observed to expected mortality ratio | 0.79 (0.77‐0.82) | 0.95 (0.89‐1.02) | 1.43 (1.36‐1.49) | 0.92 (0.89‐0.94) |
| Total hospital LOS, days (mean SD) | 4.6 7.5 | 5.3 10.0 | 7.8 14.0 | 4.6 8.1 |
Table 2 summarizes data from 3 groups of patients: patients initially admitted to the ward, or TCU, who did not experience a transfer to a higher level of care and patients admitted to these 2 units who did experience such a transfer. Patients who experienced a transfer constituted 5.3% (6,484/121,237) of ward patients and 6.7% (1,384/20,556) of TCU patients. Transferred patients tended to be older, have more acute physiologic derangement (higher LAPS), a greater pre‐existing illness burden (higher COPS), and a higher predicted mortality risk. Among ward patients, those with the following admission diagnoses were most likely to experience a transfer to a higher level of care: gastrointestinal bleeding (10.8% of all transfers), pneumonia (8.7%), and other infections (8.2%). The diagnoses most likely to be associated with death following transfer were cancer (death rate among transferred patients, 48%), renal disease (death rate, 36%), and liver disease (33%). Similar distributions were observed for TCU patients.
| Patients Initially Admitted to Ward, Remained There | Patients Initially Admitted to TCU, Remained There | Patients Transferred to Higher Level of Care | All | |
|---|---|---|---|---|
| ||||
| n | 114,753 | 19,172 | 7,868 | 141,793 |
| Male, n (%) | 50,586 (44.1) | 9,626 (50.2) | 3,894 (49.5) | 64,106 (45.2) |
| Age (mean SD) | 64.3 19.4 | 69.0 15.7 | 68.1 16.1 | 65.2 18.8 |
| LAPS (mean SD) | 18.9 17.8 | 22.7 19.1 | 26.7 21.0 | 19.8 18.3 |
| COPS (mean SD) | 89.4 63.7 | 98.3 65.5 | 107.9 67.6 | 91.7 64.4 |
| % predicted mortality risk (mean SD) | 3.8 7.0 | 4.4 7.0 | 6.5 8.8 | 4.1 7.1 |
| Admission diagnosis of pneumonia, n (%) | 5,624 (4.9) | 865 (4.5) | 684 (8.7) | 7,173 (5.1) |
| Admission diagnosis of sepsis, n (%) | 1,181 (1.0) | 227 (1.2) | 168 (2.1) | 1,576 (1.1) |
| Admission diagnosis of GI bleed, n (%) | 13,615 (11.9) | 1,448 (7.6) | 851 (10.8) | 15,914 (11.2) |
| Admission diagnosis of cancer, n (%) | 2,406 (2.1) | 80 (0.4) | 186 (2.4) | 2,672 (1.9) |
Table 3 compares outcomes among ward and TCU patients who did and did not experience a transfer to a higher level of care. The table shows that transferred patients were almost 3 times as likely to die, even after controlling for severity of illness, and that their hospital LOS was 9 days higher than expected. This increased risk was seen in all hospitals and among all transfer types (ward to ICU, ward to TCU, and TCU to ICU).
| Patients Initially Admitted to Ward, Remained There | Patients Initially Admitted to TCU, Remained There | Patients Transferred to Higher Level of Care | |
|---|---|---|---|
| |||
| n | 114,753 | 19,172 | 7,868 |
| Admitted to ICU, n (%) | 0 (0.0) | 0 (0.0) | 5,245 (66.7) |
| Ventilated, n (%) | 0 (0.0) | 0 (0.0) | 1,346 (17.1) |
| Died in the hospital, n (%) | 2,619 (2.3) | 572 (3.0) | 1,509 (19.2) |
| Length of stay, in days, at time of death (mean SD) | 7.0 11.9 | 8.3 12.4 | 16.2 23.7 |
| Observed to expected mortality ratio (95% CI) | 0.60 (0.57‐0.62) | 0.68 (0.63‐0.74) | 2.93 (2.79‐3.09) |
| Total hospital length of stay, days (mean SD) | 4.0 5.7 | 4.4 6.9 | 14.3 21.3 |
| Observed minus expected length of stay (95% CI) | 0.4 (0.3‐0.4) | 0.8 (0.7‐0.9) | 9.1 (8.6‐9.5) |
| Length of stay, in hours, at time of transfer (mean SD) | 80.8 167.2 | ||
Table 3 also shows that, among decedent patients, those who never left the ward or TCU died much sooner than those who died following transfer. Among direct admits to the ICU, the median LOS at time of death was 3.9 days, with a mean of 9.4 standard deviation of 19.9 days, while the corresponding times for TCU direct admits were a median and mean LOS of 6.5 and 11.7 19.5 days.
Table 4 summarizes outcomes among different patient subgroups that did and did not experience a transfer to a higher level of care. Based on location, patients who experienced a transfer from the TCU to the ICU had the highest crude death rate, but patients transferred from the ward to the ICU had the highest OEMR. On the other hand, if one divides patients by the degree of physiologic derangement, patients with low LAPS who experienced a transfer had the highest OEMR. With respect to LOS, patients transferred from the TCU to the ICU had the highest OMELOS (13.4 extra days).
| n (%)* | Death Rate (%) | OEMR | LOS (mean SD) | OMELOS | |
|---|---|---|---|---|---|
| |||||
| Never admitted to TCU or ICU | 157,632 (74.9) | 1.6 | 0.55 (0.53‐0.57) | 3.6 4.6 | 0.04 (0.02‐0.07) |
| Direct admit to TCU | 18,464 (8.8) | 2.9 | 0.66 (0.61‐0.72) | 4.2 5.8 | 0.60 (0.52‐0.68) |
| Direct admit to ICU | 14,655 (7.0) | 11.9 | 1.38 (1.32‐1.45) | 6.4 9.4 | 2.28 (2.14‐2.43) |
| Transferred from ward to ICU | 5,145 (2.4) | 21.5 | 3.23 (3.04‐3.42) | 15.7 21.6 | 10.33 (9.70‐10.96) |
| Transferred from ward to TCU | 3,144 (1.5) | 11.9 | 1.99 (1.79‐2.20) | 13.6 23.2 | 8.02 (7.23‐8.82) |
| Transferred from TCU to ICU | 1,107 (0.5) | 25.7 | 2.94 (2.61‐3.31) | 18.0 28.2 | 13.35 (11.49‐15.21) |
| Admitted to ward, COPS 80, no transfer to ICU or TCU | 55,405 (26.3) | 3.4 | 0.59 (0.56‐0.62) | 4.5 5.9 | 0.29 (0.24‐0.34) |
| Admitted to ward, COPS 80, did experience transfer to ICU or TCU | 4,851 (2.3) | 19.3 | 2.72 (2.55‐2.90) | 14.2 20.0 | 8.14 (7.56‐8.71) |
| Admitted to ward, COPS <80, no transfer to ICU or TCU | 57,421 (27.3) | 1.1 | 0.55 (0.51‐0.59) | 3.4 4.2 | 0.23 (0.19‐0.26) |
| Admitted to ward, COPS <80, did experience transfer to ICU or TCU | 3,560 (1.7) | 9.8 | 2.93 (2.63‐3.26) | 12.0 19.0 | 7.52 (6.89‐8.15) |
| Admitted to ward, LAPS 20, no transfer to ICU or TCU | 46,492 (22.1) | 4.2 | 0.59 (0.56‐0.61) | 4.6 5.4 | 0.16 (0.12‐0.21) |
| Admitted to ward, LAPS 20, did experience transfer to ICU or TCU | 4,070 (1.9) | 21.4 | 2.37 (2.22‐2.54) | 14.8 21.0 | 8.76 (8.06‐9.47) |
| Admitted to ward, LAPS <20, no transfer to ICU or TCU | 66,334 (31.5) | 0.9 | 0.55 (0.51‐0.60) | 3.5 4.9 | 0.32 (0.28‐0.36) |
| Admitted to ward, LAPS <20, did experience transfer to ICU or TCU | 4,341 (2.1) | 9.5 | 4.31 (3.90‐4.74) | 11.8 18.1 | 7.12 (6.61‐7.64) |
Transfers to a higher level of care at a different hospital, which in the KPMCP are usually planned, experienced lower mortality than transfers within the same hospital. For ward to TCU transfers, intra‐hospital transfers had a mortality of 12.1% while inter‐hospital transfers had a mortality of 5.7%. Corresponding rates for ward to ICU transfers were 21.7% and 11.2%, and for TCU to ICU transfers the rates were 25.9% and 12.5%, respectively.
Among patients initially admitted to the ward, a model to predict the occurrence of a transfer to a higher level of care (within 48 hours after admission) that included age, sex, admission type, primary condition, LAPS, COPS, and interaction terms had poor discrimination, with an area under the receiver operator characteristic (c statistic) of only 0.64. The c statistic for a model to predict transfer after 48 hours was 0.66. The corresponding models for TCU admits had c statistics of 0.67 and 0.68. All four models had poor calibration.
Discussion
Using automated bed history data permits characterizing a patient population with disproportionate mortality and LOS: intra‐hospital transfers to special care units (ICUs or TCUs). Indeed, the largest subset of these patients (those initially admitted to the ward or TCU) constituted only 3.7% of all admissions, but accounted for 24.2% of all ICU admissions, 21.7% of all hospital deaths, and 13.2% of all hospital days. These patients also had very elevated OEMRs and OMELOS. Models based on age, sex, preadmission laboratory test results, and comorbidities did not predict the occurrence of these transfers.
We performed multivariate analyses to explore the degree to which electronically assigned preadmission severity scores could predict these transfers. These analyses found that, compared to our ability to predict inpatient or 30‐day mortality at the time of admission, which is excellent, our ability to predict the occurrence of transfer after admission is much more limited. These results highlight the limitations of severity scores that rely on automated data, which may not have adequate discrimination when it comes to determining the risk of an adverse outcome within a narrow time frame. For example, among the 121,237 patients initially admitted to the ward who did not experience an intra‐hospital transfer, the mean LAPS was 18.9, while the mean LAPS among the 6,484 ward patients who did experience a transfer was 25.5. Differences between the mean and median LAPS, COPS, and predicted mortality risk among transferred and non‐transferred patients were significant (P < 0.0001 for all comparisons). However, examination of the distribution of LAPS, COPS, and predicted mortality risk between these two groups of patients showed considerable overlap.
Our methodology resembles Silber et al.'s27, 28 concept of failure to rescue in that it focuses on events occurring after hospitalization. Silber et al. argue that a hospital's quality can be measured by quantifying the degree to which patients who experience new problems are successfully rescued. Furthermore, quantification of those situations where rescue attempts are unsuccessful is felt to be superior to simply comparing raw or adjusted mortality rates because these are primarily determined by underlying case mix. The primary difference between Silber et al.'s approach and ours is at the level of detailthey specified a specific set of complications, whereas our measure is more generic and would include patients with many of the complications specified by Silber et al.27, 28
Most of the patients transferred to a higher level of care in our cohort survived (ie, were rescued), indicating that intensive care is beneficial. However, the fact that these patients had elevated OEMRs and OMELOS indicates that the real challenge facing hospitalists involves the timing of provision of a beneficial intervention. In theory, improved timing could result from earlier detection of problems, which is the underlying rationale for employing rapid response teams. However, the fact that our electronic tools (LAPS, COPS) cannot predict patient deteriorations within a narrow time frame suggests that early detection will remain a major challenge. Manually assigned vital signs scores designed for this purpose do not have good discrimination either.29, 30 This raises the possibility that, though patient groups may differ in terms of overall illness severity and mortality risk, differences at the individual patient level may be too subtle for clinicians to detect. Future research may thus need to focus on scores that combine laboratory data, vital signs, trends in data,31, 32 and newer proteomic markers (eg, procalcitonin).33 We also found that most transfers occurred early (within <72 hours), raising the possibility that at least some of these transfers may involve issues around triage rather than sudden deterioration.
Our study has important limitations. Due to resource constraints and limited data availability, we could not characterize the patients as well as might be desirable; in particular, we could not make full determinations of the actual reasons for patients' transfer for all patients. Broadly speaking, transfer to a higher level of care could be due to inappropriate triage, appropriate (preventive) transfer (which could include transfer to a more richly staffed unit for a specific procedure), relentless progression of disease despite maximal therapy, the occurrence of management errors, patient and family uncertainty about goals of care or inadequate understanding of treatment options and prognoses, or a combination of these factors. We could not make these distinctions with currently available electronic data. This is also true of postsurgical patients, in whom it is difficult to determine which transfers to intensive care might be planned (eg, in the case of surgical procedures where ICU care is anticipated) as opposed to the occurrence of a deterioration during or following surgery. Another major limitation of this study is our inability to identify code or no code status electronically. The elapsed LOS at time of death among patients who experienced a transfer to a higher level of care (as compared to patients who died in the ward without ever experiencing intra‐hospital transfer) suggests, but does not prove, that prolonged efforts were being made to keep them alive. We were also limited in terms of having access to other process data (eg, physician staffing levels, provision and timing of palliative care). Having ICU severity of illness scores would have permitted us to compare our cohort to those of other recent studies showing elevated mortality rates among transfer patients,911 but we have not yet developed that capability.
Consideration of our study findings suggests a possible research agenda that could be implemented by hospitalist researchers. This agenda should emphasize three areas: detection, intervention, and reflection.
With respect to detection, attention needs to be paid to better tools for quantifying patient risk at the time a decision to admit to the ward is made. It is likely that such tools will need to combine the attributes of our severity score (LAPS) with those of the manually assigned scores.30, 34 In some cases, use of these tools could lead a physician to change the locus of admission from the ward to the TCU or ICU, which could improve outcomes by ensuring more timely provision of intensive care. Since problems with initial triage could be due to factors other than the failure to suspect or anticipate impending instability, future research should also include a cognitive component (eg, quantifying what proportion of subsequent patient deteriorations could be ascribed to missed diagnoses35). Additional work also needs to be done on developing mathematical models that can inform electronic monitoring of ward (not just ICU) patients.
Research on interventions that hospitalists can use to prevent the need for intensive care or to improve the rescue rate should take two routes. The first is a disease‐specific route, which builds on the fact that a relatively small set of conditions (pneumonia, sepsis, gastrointestinal bleeding) account for most transfers to a higher level of care. Condition‐specific protocols, checklists, and bundles36 tailored to a ward environment (as opposed to the ICU or to the entire hospital) might prevent deteriorations in these patients, as has been reported for sepsis.37 The second route is to improve the overall capabilities of rapid response and code blue teams. Such research would need to include a more careful assessment of what commonalities exist among patients who were and were not successfully rescued by these teams. This approach would probably yield more insights than the current literature, which focuses on whether rapid response teams are a good thing or not.
Finally, research also needs to be performed on how hospitalists reflect on adverse outcomes among ward patients. Greater emphasis needs to be placed on moving beyond trigger tool approaches that rely on manual chart review. In an era of expanding use of electronic medical record systems, more work needs to be done on how to harness these to provide hospitalists with better quantitative and risk‐adjusted information. This information should not be limited to simply reporting rates of transfers and deaths. Rather, finer distinctions must be provided with respect of the type of patients (ie, more diagnostic detail), the clinical status of patients (ie, more physiologic detail), as well as the effects of including or excluding patients in whom therapeutic options may be limited (ie, do not resuscitate and comfort care patients) on reported rates. Ideally, researchers should develop better process and outcomes measures that could be tested in collaborative networks that include multiple nonacademic general medical‐surgical wards.
Acknowledgements
The authors thank Drs. Paul Feigenbaum, Alan Whippy, Joseph V. Selby, and Philip Madvig for reviewing the manuscript and Ms. Jennifer Calhoun for formatting the manuscript.
- ,,.To Err is Human: Building a Safer Health System.Washington, D. C.:National Academy Press;2000.
- Institute for Healthcare Improvement. Protecting 5 million lives from harm. Available at: http://www.ihi.org/IHI/Programs/Campaign. Accessed June2010.
- ,.Identifying poor‐quality hospitals. Can hospital mortality rates detect quality problems for medical diagnoses?Med Care.1996;34(8):737–753.
- ,,.Surgical mortality as an indicator of hospital quality: the problem with small sample size.JAMA.2004;292(7):847–851.
- State of California Office of Statewide Health Planning and Development. AHRQ ‐ Inpatient quality indicators (IQIs) hospital inpatient mortality indicators for California. Available at: http://www.oshpd.ca.gov/HID/Products/PatDischargeData/AHRQ/iqi‐imi_overview.html. Accessed June2010.
- ,,, et al.Enhancement of claims data to improve risk adjustment of hospital mortality.JAMA.2007;297(1):71–76.
- ,,, et al.Variation in outcomes in Veterans Affairs intensive care units with a computerized severity measure.Crit Care Med.2005;33(5):930–939.
- ,,,.Acute Physiology and Chronic Health Evaluation (APACHE) IV: hospital mortality assessment for today's critically ill patients.Crit Care Med.2006;34(5):1297–1310.
- ,,,.Day of the week of intensive care admission and patient outcomes: a multisite regional evaluation.Med Care.2002;40(6):530–539.
- ,,, et al.The hospital mortality of patients admitted to the ICU on weekends.Chest.2004;126(4):1292–1298.
- ,,, et al.Mortality among patients admitted to intensive care units during weekday day shifts compared with “off” hours.Crit Care Med.2007;35(1):3–11.
- ,,, et al.Septic shock: an analysis of outcomes for patients with onset on hospital wards versus intensive care units.Crit Care Med.1998;26(6):1020–1024.
- ,,,,.Clinical antecedents to in‐hospital cardiopulmonary arrest.Chest.1990;98(6):1388–1392.
- ,.Developing strategies to prevent inhospital cardiac arrest: analyzing responses of physicians and nurses in the hours before the event.Crit Care Med.1994;22(2):244–247.
- MERIT Study Investigators.Introduction of the medical emergency team (MET) system: a cluster‐randomized controlled trial.Lancet.2005;365(9477):2091–2097.
- Institute for Healthcare Improvement.The “MERIT” Trial of Medical Emergency Teams in Australia: An Analysis of Findings and Implications.Boston, MA:2005. Available on www.ihi.org
- ,,.Rapid response teams‐‐walk, don't run.JAMA.2006;296(13):1645–1647.
- ,.IHI Global Trigger Tool for Measuring Adverse Events.2nd ed.Cambridge, Massachusetts:Institute for Healthcare Improvement;2009.
- ,,,,,.Risk adjusting hospital inpatient mortality using automated inpatient, outpatient, and laboratory databases.Medical Care.2008;46(3):232–239.
- ,,,.The Kaiser Permanente inpatient risk adjustment methodology was valid in an external patient population.J Clin Epidemiol.2010;63(7):798–803.
- .Linking automated databases for research in managed care settings.Ann Intern Med.1997;127(8 Pt 2):719–724.
- ,,, et al.Anticoagulation therapy for stroke prevention in atrial fibrillation: how well do randomized trials translate into clinical practice?JAMA.2003;290(20):2685–2692.
- ,,, et al.Richardson score predicts short‐term adverse respiratory outcomes in newborns >/=34 weeks gestation.J Pediatr.2004;145(6):754–760.
- ,,, et al.Risk adjusting community‐acquired pneumonia hospital outcomes using automated databases.Am J Manag Care.2008;14(3):158–166.
- Statistical Analysis Software [computer program]. Version 8.Cary, NC:SAS Institute, Inc.;2000.
- .Use and misuse of the receiver operating characteristic curve in risk prediction.Circulation.2007;115(7):928–935.
- ,,,.Hospital and patient characteristics associated with death after surgery. A study of adverse occurrence and failure to rescue.Med Care.1992;30(7):615–629.
- ,,.Comparing the contributions of groups of predictors: which outcomes vary with hospital rather than patient characteristics?J Am Stat Assoc.1995;90(429):7–18.
- ,.Beyond the intensive care unit: A review of interventions aimed at anticipating and preventing in‐hospital cardiopulmonary arrest.Resuscitation.2005;67(1):13–23.
- ,,.Reproducibility of physiological track‐and‐trigger warning systems for identifying at‐risk patients on the ward.Intensive Care Med.2007;33(4):619–624.
- ,,,,.Serial evaluation of the SOFA score to predict outcome in critically ill patients.JAMA.2001;286(14):1754–1758.
- ,,.Incorporation of Physiologic Trend and Interaction Effects in Neonatal Severity of Illness Scores: An Experiment Using a Variant of the Richardson Score.Intensive Care Med.2007;33(9):1602–1608.
- ,,, et al.Diagnostic and prognostic value of procalcitonin in patients with septic shock.Crit Care Med.2004;32(5):1166–1169.
- ,,, et al.Identifying the sick: can biochemical measurements be used to aid decision making on presentation to the accident and emergency department.Br J Anaesth.2005;94(6):735–741.
- .Improving patient care. The cognitive psychology of missed diagnoses.Ann Intern Med.2005;142(2):115–120.
- ,,,,,.Using care bundles to reduce in‐hospital mortality: quantitative survey.BMJ.2010;340:c1234.
- ,,, et al.Effect of a rapid response system for patients in shock on time to treatment and mortality during 5 years.Crit Care Med.2007;35(11):2568–2575.
- ,,.To Err is Human: Building a Safer Health System.Washington, D. C.:National Academy Press;2000.
- Institute for Healthcare Improvement. Protecting 5 million lives from harm. Available at: http://www.ihi.org/IHI/Programs/Campaign. Accessed June2010.
- ,.Identifying poor‐quality hospitals. Can hospital mortality rates detect quality problems for medical diagnoses?Med Care.1996;34(8):737–753.
- ,,.Surgical mortality as an indicator of hospital quality: the problem with small sample size.JAMA.2004;292(7):847–851.
- State of California Office of Statewide Health Planning and Development. AHRQ ‐ Inpatient quality indicators (IQIs) hospital inpatient mortality indicators for California. Available at: http://www.oshpd.ca.gov/HID/Products/PatDischargeData/AHRQ/iqi‐imi_overview.html. Accessed June2010.
- ,,, et al.Enhancement of claims data to improve risk adjustment of hospital mortality.JAMA.2007;297(1):71–76.
- ,,, et al.Variation in outcomes in Veterans Affairs intensive care units with a computerized severity measure.Crit Care Med.2005;33(5):930–939.
- ,,,.Acute Physiology and Chronic Health Evaluation (APACHE) IV: hospital mortality assessment for today's critically ill patients.Crit Care Med.2006;34(5):1297–1310.
- ,,,.Day of the week of intensive care admission and patient outcomes: a multisite regional evaluation.Med Care.2002;40(6):530–539.
- ,,, et al.The hospital mortality of patients admitted to the ICU on weekends.Chest.2004;126(4):1292–1298.
- ,,, et al.Mortality among patients admitted to intensive care units during weekday day shifts compared with “off” hours.Crit Care Med.2007;35(1):3–11.
- ,,, et al.Septic shock: an analysis of outcomes for patients with onset on hospital wards versus intensive care units.Crit Care Med.1998;26(6):1020–1024.
- ,,,,.Clinical antecedents to in‐hospital cardiopulmonary arrest.Chest.1990;98(6):1388–1392.
- ,.Developing strategies to prevent inhospital cardiac arrest: analyzing responses of physicians and nurses in the hours before the event.Crit Care Med.1994;22(2):244–247.
- MERIT Study Investigators.Introduction of the medical emergency team (MET) system: a cluster‐randomized controlled trial.Lancet.2005;365(9477):2091–2097.
- Institute for Healthcare Improvement.The “MERIT” Trial of Medical Emergency Teams in Australia: An Analysis of Findings and Implications.Boston, MA:2005. Available on www.ihi.org
- ,,.Rapid response teams‐‐walk, don't run.JAMA.2006;296(13):1645–1647.
- ,.IHI Global Trigger Tool for Measuring Adverse Events.2nd ed.Cambridge, Massachusetts:Institute for Healthcare Improvement;2009.
- ,,,,,.Risk adjusting hospital inpatient mortality using automated inpatient, outpatient, and laboratory databases.Medical Care.2008;46(3):232–239.
- ,,,.The Kaiser Permanente inpatient risk adjustment methodology was valid in an external patient population.J Clin Epidemiol.2010;63(7):798–803.
- .Linking automated databases for research in managed care settings.Ann Intern Med.1997;127(8 Pt 2):719–724.
- ,,, et al.Anticoagulation therapy for stroke prevention in atrial fibrillation: how well do randomized trials translate into clinical practice?JAMA.2003;290(20):2685–2692.
- ,,, et al.Richardson score predicts short‐term adverse respiratory outcomes in newborns >/=34 weeks gestation.J Pediatr.2004;145(6):754–760.
- ,,, et al.Risk adjusting community‐acquired pneumonia hospital outcomes using automated databases.Am J Manag Care.2008;14(3):158–166.
- Statistical Analysis Software [computer program]. Version 8.Cary, NC:SAS Institute, Inc.;2000.
- .Use and misuse of the receiver operating characteristic curve in risk prediction.Circulation.2007;115(7):928–935.
- ,,,.Hospital and patient characteristics associated with death after surgery. A study of adverse occurrence and failure to rescue.Med Care.1992;30(7):615–629.
- ,,.Comparing the contributions of groups of predictors: which outcomes vary with hospital rather than patient characteristics?J Am Stat Assoc.1995;90(429):7–18.
- ,.Beyond the intensive care unit: A review of interventions aimed at anticipating and preventing in‐hospital cardiopulmonary arrest.Resuscitation.2005;67(1):13–23.
- ,,.Reproducibility of physiological track‐and‐trigger warning systems for identifying at‐risk patients on the ward.Intensive Care Med.2007;33(4):619–624.
- ,,,,.Serial evaluation of the SOFA score to predict outcome in critically ill patients.JAMA.2001;286(14):1754–1758.
- ,,.Incorporation of Physiologic Trend and Interaction Effects in Neonatal Severity of Illness Scores: An Experiment Using a Variant of the Richardson Score.Intensive Care Med.2007;33(9):1602–1608.
- ,,, et al.Diagnostic and prognostic value of procalcitonin in patients with septic shock.Crit Care Med.2004;32(5):1166–1169.
- ,,, et al.Identifying the sick: can biochemical measurements be used to aid decision making on presentation to the accident and emergency department.Br J Anaesth.2005;94(6):735–741.
- .Improving patient care. The cognitive psychology of missed diagnoses.Ann Intern Med.2005;142(2):115–120.
- ,,,,,.Using care bundles to reduce in‐hospital mortality: quantitative survey.BMJ.2010;340:c1234.
- ,,, et al.Effect of a rapid response system for patients in shock on time to treatment and mortality during 5 years.Crit Care Med.2007;35(11):2568–2575.
Copyright © 2010 Society of Hospital Medicine
Four Nephrology Myths Debunked
There are many controversial topics relating to renal disease in hospitalized patients. The aim of this review is to shed light on some important and often debated issues. We will first discuss topics related to electrolytes disorder commonly seen in hospitalized patients (hyponatremia, hyperkalemia, metabolic acidosis) then the use of diuretics in patients with allergy to sulfa containing antibiotics.
Hypothyroidism and Hyponatremia
Hyponatremia is common in hospitalized patients and is associated with worse outcomes.1 It can be seen with a variety of conditions ranging from congestive heart failure to volume depletion. Careful history and physical examination are paramount and the initial work‐up usually includes serum and urine osmolality and urine sodium concentration.
For euvolemic hyponatremia, the differential diagnosis includes the syndrome of inappropriate adenine dinucleotide (ADH) secretion (SIADH), hypoadrenalism, and beer potomania. Additionally, many authorities also include hypothyroidism.
Although the simultaneous finding of hypothyroidism and hyponatremia can occur in patients as both diseases are widely prevalent in the general population, causation has yet to be convincingly demonstrated.
ADH is released in response to effective volume depletion; consequently when hypothyroidism is encountered in the setting of complete pituitary failure there is often hyponatremia.2, 3 Alternatively, with myxedema, the ability of the kidney to handle a water load and concentrate urine can be impaired.4
However, the observation that thyroid hormone administration did not raise sodium values in newborns with congenital hypothyroidism or in adults supports the absence of causal effect.5, 6And in addition, large studies done in the hospital and outpatient setting showed no differences between the serum sodium values of hypothyroid patients and that of controls.7, 8 In the study of outpatients, among those with hypothyroidism, for every increase of 10 mU/L of thyroid‐stimulating hormone (TSH), there was a drop of only 0.14 mmol/L of Na concentration.8 Thus, the elevation of TSH required for a clinically meaningful drop in sodium to occur was considerable.
Hence in patients with hyponatremia, the hospitalist should look for etiologies other than hypothyroidism and should only consider thyroid hypofunction as a culprit in cases of myxedema, or panhypopituitarism.
Sodium Bicarbonate for Hyperkalemia
Hyperkalemia is one of the most feared electrolyte disorders encountered in hospitalized patients and can lead to dire outcomes.9, 10
Potassium (K+) homeostasis is maintained in the body by 2 complimentary systems: a short‐term system that regulates K+ variation by modifying translocation across the cellular membrane and a long‐term system that adjusts overall K+ balance. The translocation system is regulated primarily by insulin and ‐2 stimulation. Overall K+ balance is mainly controlled by the kidney (90‐95%) although the gastrointestinal (GI) tract can have a more preponderant role in anephric patients.
Hyperkalemia can ensue by either a dysregulation of the translocation system (as in diabetic Ketoacidosis secondary to insulin deficiency) or impairment of K+ elimination.
Acid‐base status was previously thought to have a prominent influence on K+ concentration, based on studies that demonstrated that. However, studies looking at metabolic acidosis revealed that contrary to the effect of mineral acidosis (excess of nonmetabolizable anions)11 where there is an inverse correlation between potassium concentration and pH; organic acidosis (excess of metabolizable anions)11 was not associated with hyperkalemia.1214 However, organic acidosis can be seen simultaneously and induced by a same underlying disease (such as organ ischemia with lactic acidosis or insulin deficiency complicated by ketoacidosis). Also, when changes in pH are induced by respiratory variations or with alkalosis, the impact on serum K+ concentration is less remarkable.15 Hence, it seems that it is the nature of the acid‐base disturbance that impacts K+ concentration more than the change in pH itself.
In the kidney, the main site for regulation of K+ balance is the collecting duct. Factors that affect elimination include urinary sodium delivery, urine flow, and aldosterone.16 In order to adequately eliminate K+ these factors must be optimized in conjunction.
Treatment of hyperkalemia includes the sequential administration of agents that stabilize the cardiac membrane (calcium gluconate), shift the potassium intracellularly (insulin, ‐2 agonists), and remove the potassium (diuretics, sodium polystyrene, or dialysis).
The use of sodium bicarbonate for treatment of hyperkalemia has been long advocated.17 It was thought to act by translocation of potassium hence could be used to quickly lower K+ concentration. However, this dogma has been challenged recently.
To assess the true impact of sodium bicarbonate on potassium translocation, studies have been conducted on anephric patients with hyperkalemia. Bicarbonate infusion failed to elicit a significant rapid change in serum K+ concentration despite increase in bicarbonate concentration, arguing against a translocation mechanism.1821 After 60 minutes of treatment, neither isotonic nor hypertonic bicarbonate infusion affected Serum K+ levels in end‐stage renal disease (ESRD) patients.19, 20 On the contrary, hypertonic sodium bicarbonate increased the K+ concentration after 180 minutes of treatment,20 and it took a prolonged infusion of 4 hours to see a significant decrease in K+ concentration (0.6 mmol/L); half of which could be accounted for solely by volume administration. Moreover, this reduction was highly variable.
Rather, sodium bicarbonate seems to enhance potassium elimination by increasing sodium delivery to the distal tubule, increasing urinary pH and negative luminal charge and potentiating the action of diuretics.23 In an elegant study on normovolemic patients, the induction of bicarbonaturia practically doubled potassium excretion.23 However, such an effect is heterogeneous and usually takes place over 4 hours to 6 hours.17
At the cellular level, 2 ion exchange pumps cooperate to handle Na/K/H movement across the cellular membrane: an Na+/H+ exchanger (NHE) and the Na+/K+ ATP‐ase pump (Figure 1). The NHE is normally inactive and is only upregulated in cases of severe intracellular acidosis.24 The infusion of sodium bicarbonate to patients with severe metabolic acidosis could possibly decrease the serum potassium concentration by translocation if the NHE was significantly upregulated. However, this treatment can be associated with a drop in the ionized calcium level, a worsening of the intracellular acidosis, and a decreased peripheral oxygen delivery.25 Thus, the benefits should be balanced with the potential adverse effects and, even in cases of severe metabolic acidosis with hyperkalemia, we would advise the clinician to restrictively administer sodium bicarbonate.
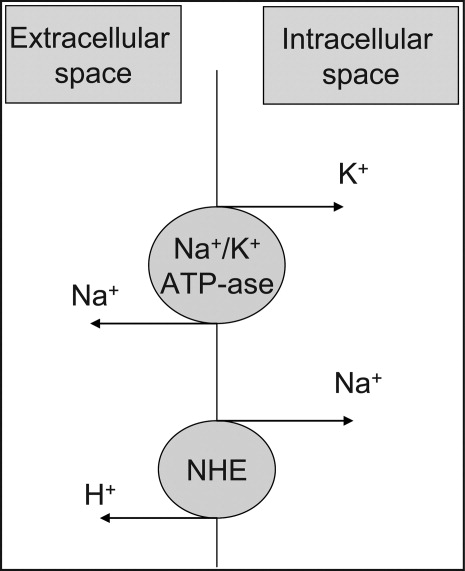
In addition, in ESRD patients, the administration of sodium bicarbonate can be problematic owing to the osmotic and volume burden it carries. It should also be avoided in patients who are volume overload or in those with decreased ability to eliminate potassium.
When treating hyperkalemic patients, hospitalists should use sodium bicarbonate to potentiate urinary elimination of potassium and should consider administering it either with acetazolamide or a loop diuretic, anticipating a lowering effect after a few hours.26 It should be avoided in patients with volume overload and anuria. Immediate translocation of potassium into cells is best achieved by insulin and ‐2 agonists.
5‐Oxoprolinuria: A Newly Recognized Cause of High Anion Gap Metabolic Acidosis
There are several causes of metabolic high anion gap acidosis in hospitalized patients. However, despite careful investigations, the cause of that disorder is not always apparent.27 Recently, 5‐oxoprolinuria (also called pyroglutamic acidosis) has become increasingly recognized as a potential etiology.2832
The metabolism of glutamate (though the ‐Glutamyl cycle) generates glutathione which provides negative feedback to the ‐Glutamyl‐cysteine synthetase enzyme. The depletion of glutathione increases 5‐oxoproline production owing to the loss of that inhibition (Figures 2 and 3). Low glutathione levels can be seen with liver disease,33 chronic alcohol intake,34 acetaminophen use,35 malnutrition,36 renal dysfunction,29 use of vigabatrim (an antiepileptic that received Food and Drug Administration [FDA] approval for use in April 2009)37 and sepsis.38 Most of the reported cases were female and had more than one risk factor.39
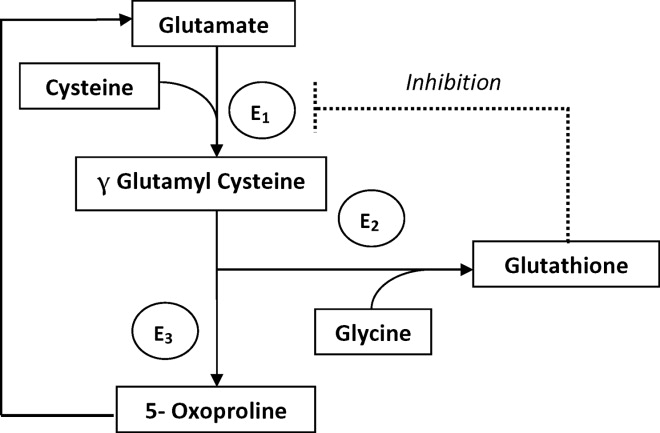
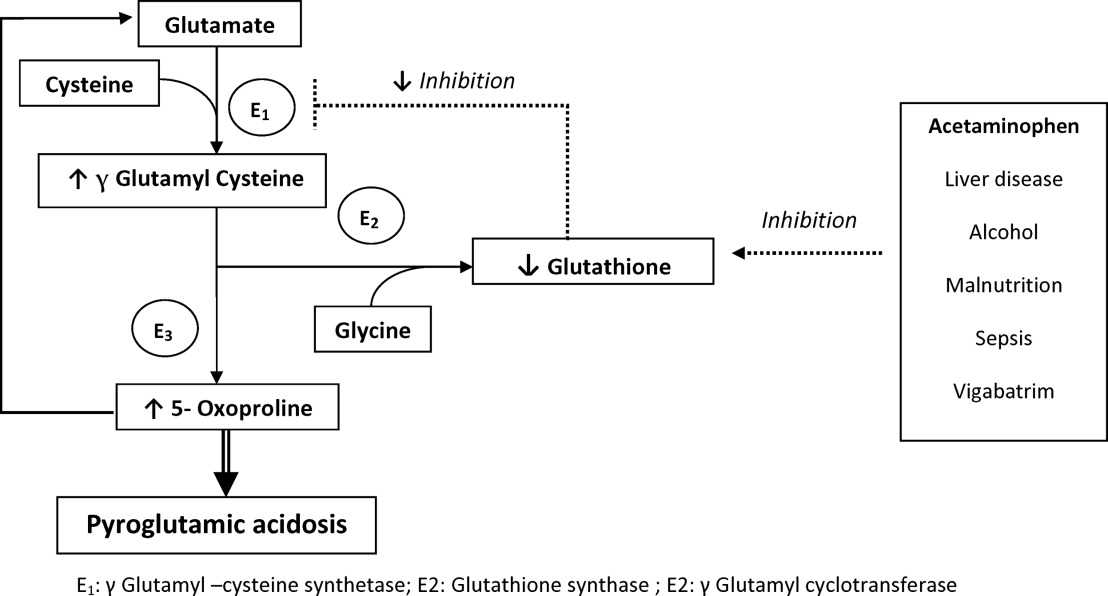
Typically, patients present with high anion gap acidosis (often more than 20)28 with normal acetaminophen levels and all usual tests being negative. A history of chronic acetaminophen use with or without other risk factors can frequently be found. The true independent impact of this type of acidosis on outcomes is difficult to determine as all of the reported cases had many confounding factors.
A urinary organic acid level is diagnostic and will reveal increased levels of pyroglutamic acid. Alternatively, the finding of a positive urinary anion gap (UNa +UK UCl) with a positive urinary osmolar gap (Uosmmeasured‐Uosmcalculated) in the appropriate clinical setting (unexplained high anion gap acidosis with negative workup and presence of risk factors for 5‐oxoproliniuria) can point towards the diagnosis.40
A study of patients with unexplained metabolic acidosis did not find any cases of 5‐oxoprolinuria.41 Although this might suggest that the incidence of this disease is low, very few of those patients were actually taking acetaminophen (therefore had a reduced propensity for developing pyroglutamic acidosis).41 Thus, the actual incidence of 5‐oxoprolinuria is hard to determine.
Once recognized, acetaminophen should be withheld and N‐acetylcysteine (NAC) can be used to replete glutathione levels although there is no convincing evidence for this use.42 It is important for hospitalists to be aware of this disorder as it can pose a diagnostic challenge (negative usual work‐up), is easy to treat by stopping acetaminophen, and can (possibly) negatively affect outcomes.
Furosemide and Patients With Sulfa Allergy
Allergic reactions are a common occurrence with sulfa‐containing antibiotics (SCA) and reports estimates the incidence to be approximately 3% to 5%.43, 44
One misbelief is that patients who are allergic to SCAs should not receive sulfa containing diuretics or other sulfa‐containing medications.45 This leads some physicians to substitute commonly used diuretics (such as furosemide or thiazides) for ethacrynic acid. The use of ethacrynic acid has several challenges: the limited supply of the intravenous form, the discontinuation of the oral form, the increased cost, and the risk of permanent ototoxicity.
The evidence for potential allergic cross‐reactivity among medications containing the sulfa moiety has been primarily derived from Case Reports.4649
The molecular structures of sulfamethoxazole and furosemide are shown below. The allergic antigen is most often the N1 component,45 and sometimes N4 but not the sulfa moiety. Both of the incriminated antigens are not present in the furosemide structure (as well as all other sulfa containing diuretics) (Figures 4 and 5).
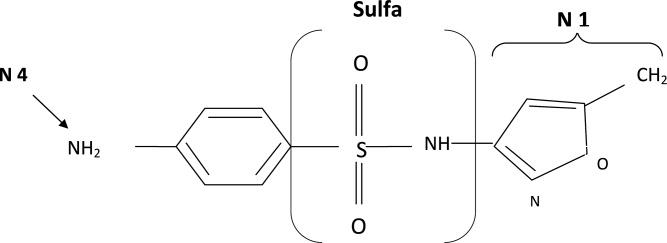
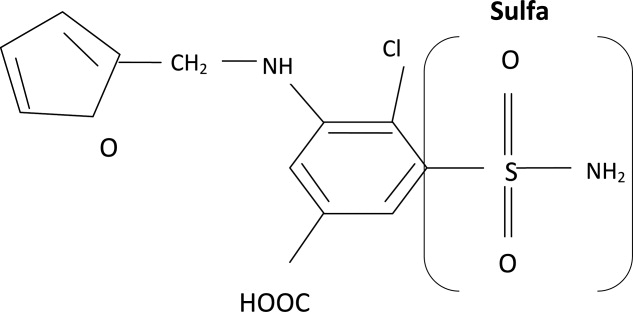
Experimental data showed that serum from patients allergic to SCAs did not bind to diuretics.50 In addition, clinical reports failed to demonstrate cross‐reactivity.5153 In a large clinical trial, Strom et al.53 showed that although there was a higher risk for allergic reaction to sulfa containing medications (SCM) in patients allergic to SCA (compared to those who were not), it was lower among patients with an allergy to sulfa antibiotic than among patients with a history of hypersensitivity to penicillins, suggesting this was due to a predisposition to allergic reactions in general rather than true cross‐reactivity. In another report, patients who were receiving ethacrynic acid for many years were successfully and uneventfully switched to furosemide.54
Taken together, these findings suggest that there is no evidence for withholding sulfa nonantibiotics in patients allergic to sulfa containing antibiotics.
Conclusion
Hypothyroidism, unlike myxedema, is not a cause of hyponatremia (although it can be sometimes seen in conjunction with the latter) and additional investigations should be done to determine its etiology. Sodium bicarbonate is effective for treatment of hyperkalemia by enhancing renal potassium elimination, rather than from shifting potassium into cells. The 5‐oxoprolinuria is a newly recognized cause of high anion‐gap metabolic acidosis and should be considered in patients who have taken acetaminophen. Furosemide (and sulfa containing diuretics) can be used safely in patients with an allergy to SCA.
- ,,.Mortality after hospitalization with mild, moderate, and severe hyponatremia.Am J Med.2009;122(9):857–865.
- ,.Hyponatremia as the presenting manifestation of Sheehan's syndrome in elderly patients.Aging Clin Exp Res.2006;18(6):536–539.
- ,,.Sodium and water disturbances in patients with Sheehan's syndrome.Am J Kidney Dis.2001;38(3):E14.
- ,,,,,.Effect of acute water loading on plasma levels of antidiuretic hormone AVP aldosterone, ANP fractional excretion of sodium and plasma and urine osmolalities in myxedema.Chin Med J (Engl).1990;103(9):704–708.
- ,.Sodium handling in congenitally hypothyroid neonates.Acta Paediatr.2004;93(1):22–24.
- ,,.Prevalence and severity of hyponatremia and hypercreatininemia in short‐term uncomplicated hypothyroidism.J Endocrinol Invest.1999;22(1):35–39.
- ,,,,.Absence of relation between hyponatraemia and hypothyroidism.Lancet.1997;350(9088):1402.
- ,,.The effect of newly diagnosed hypothyroidism on serum sodium concentrations: a retrospective study.Clin Endocrinol (Oxf).2006;64(5):598–599.
- .Disorders of potassium homeostasis. Hypokalemia and hyperkalemia.Crit Care Clin.2002;18(2):273–288,vi.
- ,.Hyperkalemia in hospitalized patients.Int Urol Nephrol.2000;32(2):177–180.
- ,.Treatment of metabolic acidosis.Curr Opin Crit Care.2003;9(4):260–265.
- ,,,.Natural history of lactic acidosis after grand‐mal seizures. A model for the study of an anion‐gap acidosis not associated with hyperkalemia.N Engl J Med.1977;297(15):796–799.
- ,,,,.The plasma potassium concentration in metabolic acidosis: a re‐evaluation.Am J Kidney Dis.1988;11(3):220–224.
- ,,,.Determinants of plasma potassium levels in diabetic ketoacidosis.Medicine (Baltimore).1986;65(3):163–172.
- ,.Changes in plasma potassium concentration during acute acid‐base disturbances.Am J Med.1981;71(3):456–467.
- ,,.New aspects of renal potassium transport.Pflugers Arch.2003;446(3):289–297.
- ,.Correction of hyperkalemia by bicarbonate despite constant blood pH.Kidney Int.1977;12(5):354–360.
- ,,,.Effect of various therapeutic approaches on plasma potassium and major regulating factors in terminal renal failure.Am J Med.1988;85(4):507–512.
- ,.Effect of bicarbonate administration on plasma potassium in dialysis patients: interactions with insulin and albuterol.Am J Kidney Dis.1996;28(4):508–514.
- ,,,,.Effect of hypertonic versus isotonic sodium bicarbonate on plasma potassium concentration in patients with end‐stage renal disease.Miner Electrolyte Metab.1991;17(5):297–302.
- .Combined effect of bicarbonate and insulin with glucose in acute therapy of hyperkalemia in end‐stage renal disease patients.Nephron.1996;72(3):476–482.
- ,,.Effect of prolonged bicarbonate administration on plasma potassium in terminal renal failure.Kidney Int.1992;41(2):369–374.
- ,,, et al.Modulation of the secretion of potassium by accompanying anions in humans.Kidney Int.1991;39(6):1206–1212.
- ,.Controversial issues in the treatment of hyperkalaemia.Nephrol Dial Transplant.2003;18(11):2215–2218.
- ,.Sodium bicarbonate for the treatment of lactic acidosis.Chest.2000;117(1):260–267.
- .Management of severe hyperkalemia.Crit Care Med.2008;36(12):3246–3251.
- ,.Pyroglutamic acid and high anion gap: looking through the keyhole?Crit Care Med.2000;28(6):2140–2141.
- ,,,,.Increased anion gap metabolic acidosis as a result of 5‐oxoproline (pyroglutamic acid): a role for acetaminophen.Clin J Am Soc Nephrol.2006;1(3):441–447.
- ,,,.Pyroglutamic acidemia: a cause of high anion gap metabolic acidosis.Crit Care Med.2000;28(6):1803–1807.
- ,,,,,.Acetaminophen‐induced anion gap metabolic acidosis and 5‐oxoprolinuria (pyroglutamic aciduria) acquired in hospital.Am J Kidney Dis.2005;46(1):143–146.
- ,.Anion gap acidosis associated with acetaminophen.Ann Intern Med.2000;133(9):752–753.
- ,,.Pyroglutamic acidosis in a renal transplant patient.Nephrol Dial Transplant.2005;20(12):2836–2838.
- ,,.Hepatic glutathione content in patients with alcoholic and non alcoholic liver diseases.Life Sci.1988;43(12):991–998.
- ,,,,,.Decreased hepatic glutathione in chronic alcoholic patients.J Hepatol.1986;3(1):1–6.
- ,.Intracellular signaling mechanisms of acetaminophen‐induced liver cell death.Toxicol Sci.2006;89(1):31–41.
- ,,.Urinary excretion of 5‐L‐oxoproline (pyroglutamic acid) is increased during recovery from severe childhood malnutrition and responds to supplemental glycine.J Nutr.1996;126(11):2823–2830.
- ,,,.Pyroglutamicaciduria from vigabatrin.Lancet.1989;1(8652):1452–1453.
- ,,, et al.Cysteine metabolism and whole blood glutathione synthesis in septic pediatric patients.Crit Care Med.2001;29(4):870–877.
- ,.Transient 5‐oxoprolinuria and high anion gap metabolic acidosis: clinical and biochemical findings in eleven subjects.Clin Chem.1998;44(7):1497–1503.
- ,,,.Guilty as charged: unmeasured urinary anions in a case of pyroglutamic acidosis.Neth J Med.2008;66(8):351–353.
- ,,.Unexplained metabolic acidosis in critically ill patients: the role of pyroglutamic acid.Intensive Care Med.2004;30(3):502–505.
- ,,.A therapeutic trial with N‐acetylcysteine in subjects with hereditary glutathione synthetase deficiency (5‐oxoprolinuria).J Inherit Metab Dis.1989;12(2):120–130.
- .Diagnosis of allergic reactions to sulfonamides.Allergy.1999;54Suppl 58:28–32.
- .Practical issues in the management of hypersensitivity reactions: sulfonamides.South Med J.2001;94(8):817–824.
- ,,.Should celecoxib be contraindicated in patients who are allergic to sulfonamides? Revisiting the meaning of ‘sulfa’ allergy.Drug Saf.2001;24(4):239–247.
- .Thrombocytopenia due to sulfonamide cross‐sensitivity.Wis Med J.1982;81(6):21–23.
- ,,.Leukocytoclastic vasculitis induced by use of glyburide: a case of possible cross‐reaction of a sulfonamide and a sulfonylurea.Cutis.2003;71(3):235–238.
- ,.Celecoxib‐induced erythema multiforme with glyburide cross‐reactivity.Pharmacotherapy.2002;22(5):637–640.
- ,.Vesiculobullous rash in a patient with systemic lupus erythematosus.Ann Allergy.1993;70(3):196–203.
- ,,, et al.Use of optical biosensor technology to study immunological cross‐reactivity between different sulfonamide drugs.Anal Biochem.2002;300(2):177–184.
- ,,,.Adverse reactions to sulphonamide and sulphonamide‐trimethoprim antimicrobials: clinical syndromes and pathogenesis.Adverse Drug React Toxicol Rev.1996;15(1):9–50.
- ,,.Cross‐reactivity in HIV‐infected patients switched from trimethoprim‐sulfamethoxazole to dapsone.Pharmacotherapy.1998;18(4):831–835.
- ,,, et al.Absence of cross‐reactivity between sulfonamide antibiotics and sulfonamide nonantibiotics.N Engl J Med.2003;349(17):1628–1635.
- ,,.Furosemide challenge in patients with heart failure and adverse reactions to sulfa‐containing diuretics.Ann Intern Med.2003;138(4):358–359.
There are many controversial topics relating to renal disease in hospitalized patients. The aim of this review is to shed light on some important and often debated issues. We will first discuss topics related to electrolytes disorder commonly seen in hospitalized patients (hyponatremia, hyperkalemia, metabolic acidosis) then the use of diuretics in patients with allergy to sulfa containing antibiotics.
Hypothyroidism and Hyponatremia
Hyponatremia is common in hospitalized patients and is associated with worse outcomes.1 It can be seen with a variety of conditions ranging from congestive heart failure to volume depletion. Careful history and physical examination are paramount and the initial work‐up usually includes serum and urine osmolality and urine sodium concentration.
For euvolemic hyponatremia, the differential diagnosis includes the syndrome of inappropriate adenine dinucleotide (ADH) secretion (SIADH), hypoadrenalism, and beer potomania. Additionally, many authorities also include hypothyroidism.
Although the simultaneous finding of hypothyroidism and hyponatremia can occur in patients as both diseases are widely prevalent in the general population, causation has yet to be convincingly demonstrated.
ADH is released in response to effective volume depletion; consequently when hypothyroidism is encountered in the setting of complete pituitary failure there is often hyponatremia.2, 3 Alternatively, with myxedema, the ability of the kidney to handle a water load and concentrate urine can be impaired.4
However, the observation that thyroid hormone administration did not raise sodium values in newborns with congenital hypothyroidism or in adults supports the absence of causal effect.5, 6And in addition, large studies done in the hospital and outpatient setting showed no differences between the serum sodium values of hypothyroid patients and that of controls.7, 8 In the study of outpatients, among those with hypothyroidism, for every increase of 10 mU/L of thyroid‐stimulating hormone (TSH), there was a drop of only 0.14 mmol/L of Na concentration.8 Thus, the elevation of TSH required for a clinically meaningful drop in sodium to occur was considerable.
Hence in patients with hyponatremia, the hospitalist should look for etiologies other than hypothyroidism and should only consider thyroid hypofunction as a culprit in cases of myxedema, or panhypopituitarism.
Sodium Bicarbonate for Hyperkalemia
Hyperkalemia is one of the most feared electrolyte disorders encountered in hospitalized patients and can lead to dire outcomes.9, 10
Potassium (K+) homeostasis is maintained in the body by 2 complimentary systems: a short‐term system that regulates K+ variation by modifying translocation across the cellular membrane and a long‐term system that adjusts overall K+ balance. The translocation system is regulated primarily by insulin and ‐2 stimulation. Overall K+ balance is mainly controlled by the kidney (90‐95%) although the gastrointestinal (GI) tract can have a more preponderant role in anephric patients.
Hyperkalemia can ensue by either a dysregulation of the translocation system (as in diabetic Ketoacidosis secondary to insulin deficiency) or impairment of K+ elimination.
Acid‐base status was previously thought to have a prominent influence on K+ concentration, based on studies that demonstrated that. However, studies looking at metabolic acidosis revealed that contrary to the effect of mineral acidosis (excess of nonmetabolizable anions)11 where there is an inverse correlation between potassium concentration and pH; organic acidosis (excess of metabolizable anions)11 was not associated with hyperkalemia.1214 However, organic acidosis can be seen simultaneously and induced by a same underlying disease (such as organ ischemia with lactic acidosis or insulin deficiency complicated by ketoacidosis). Also, when changes in pH are induced by respiratory variations or with alkalosis, the impact on serum K+ concentration is less remarkable.15 Hence, it seems that it is the nature of the acid‐base disturbance that impacts K+ concentration more than the change in pH itself.
In the kidney, the main site for regulation of K+ balance is the collecting duct. Factors that affect elimination include urinary sodium delivery, urine flow, and aldosterone.16 In order to adequately eliminate K+ these factors must be optimized in conjunction.
Treatment of hyperkalemia includes the sequential administration of agents that stabilize the cardiac membrane (calcium gluconate), shift the potassium intracellularly (insulin, ‐2 agonists), and remove the potassium (diuretics, sodium polystyrene, or dialysis).
The use of sodium bicarbonate for treatment of hyperkalemia has been long advocated.17 It was thought to act by translocation of potassium hence could be used to quickly lower K+ concentration. However, this dogma has been challenged recently.
To assess the true impact of sodium bicarbonate on potassium translocation, studies have been conducted on anephric patients with hyperkalemia. Bicarbonate infusion failed to elicit a significant rapid change in serum K+ concentration despite increase in bicarbonate concentration, arguing against a translocation mechanism.1821 After 60 minutes of treatment, neither isotonic nor hypertonic bicarbonate infusion affected Serum K+ levels in end‐stage renal disease (ESRD) patients.19, 20 On the contrary, hypertonic sodium bicarbonate increased the K+ concentration after 180 minutes of treatment,20 and it took a prolonged infusion of 4 hours to see a significant decrease in K+ concentration (0.6 mmol/L); half of which could be accounted for solely by volume administration. Moreover, this reduction was highly variable.
Rather, sodium bicarbonate seems to enhance potassium elimination by increasing sodium delivery to the distal tubule, increasing urinary pH and negative luminal charge and potentiating the action of diuretics.23 In an elegant study on normovolemic patients, the induction of bicarbonaturia practically doubled potassium excretion.23 However, such an effect is heterogeneous and usually takes place over 4 hours to 6 hours.17
At the cellular level, 2 ion exchange pumps cooperate to handle Na/K/H movement across the cellular membrane: an Na+/H+ exchanger (NHE) and the Na+/K+ ATP‐ase pump (Figure 1). The NHE is normally inactive and is only upregulated in cases of severe intracellular acidosis.24 The infusion of sodium bicarbonate to patients with severe metabolic acidosis could possibly decrease the serum potassium concentration by translocation if the NHE was significantly upregulated. However, this treatment can be associated with a drop in the ionized calcium level, a worsening of the intracellular acidosis, and a decreased peripheral oxygen delivery.25 Thus, the benefits should be balanced with the potential adverse effects and, even in cases of severe metabolic acidosis with hyperkalemia, we would advise the clinician to restrictively administer sodium bicarbonate.
In addition, in ESRD patients, the administration of sodium bicarbonate can be problematic owing to the osmotic and volume burden it carries. It should also be avoided in patients who are volume overload or in those with decreased ability to eliminate potassium.
When treating hyperkalemic patients, hospitalists should use sodium bicarbonate to potentiate urinary elimination of potassium and should consider administering it either with acetazolamide or a loop diuretic, anticipating a lowering effect after a few hours.26 It should be avoided in patients with volume overload and anuria. Immediate translocation of potassium into cells is best achieved by insulin and ‐2 agonists.
5‐Oxoprolinuria: A Newly Recognized Cause of High Anion Gap Metabolic Acidosis
There are several causes of metabolic high anion gap acidosis in hospitalized patients. However, despite careful investigations, the cause of that disorder is not always apparent.27 Recently, 5‐oxoprolinuria (also called pyroglutamic acidosis) has become increasingly recognized as a potential etiology.2832
The metabolism of glutamate (though the ‐Glutamyl cycle) generates glutathione which provides negative feedback to the ‐Glutamyl‐cysteine synthetase enzyme. The depletion of glutathione increases 5‐oxoproline production owing to the loss of that inhibition (Figures 2 and 3). Low glutathione levels can be seen with liver disease,33 chronic alcohol intake,34 acetaminophen use,35 malnutrition,36 renal dysfunction,29 use of vigabatrim (an antiepileptic that received Food and Drug Administration [FDA] approval for use in April 2009)37 and sepsis.38 Most of the reported cases were female and had more than one risk factor.39
Typically, patients present with high anion gap acidosis (often more than 20)28 with normal acetaminophen levels and all usual tests being negative. A history of chronic acetaminophen use with or without other risk factors can frequently be found. The true independent impact of this type of acidosis on outcomes is difficult to determine as all of the reported cases had many confounding factors.
A urinary organic acid level is diagnostic and will reveal increased levels of pyroglutamic acid. Alternatively, the finding of a positive urinary anion gap (UNa +UK UCl) with a positive urinary osmolar gap (Uosmmeasured‐Uosmcalculated) in the appropriate clinical setting (unexplained high anion gap acidosis with negative workup and presence of risk factors for 5‐oxoproliniuria) can point towards the diagnosis.40
A study of patients with unexplained metabolic acidosis did not find any cases of 5‐oxoprolinuria.41 Although this might suggest that the incidence of this disease is low, very few of those patients were actually taking acetaminophen (therefore had a reduced propensity for developing pyroglutamic acidosis).41 Thus, the actual incidence of 5‐oxoprolinuria is hard to determine.
Once recognized, acetaminophen should be withheld and N‐acetylcysteine (NAC) can be used to replete glutathione levels although there is no convincing evidence for this use.42 It is important for hospitalists to be aware of this disorder as it can pose a diagnostic challenge (negative usual work‐up), is easy to treat by stopping acetaminophen, and can (possibly) negatively affect outcomes.
Furosemide and Patients With Sulfa Allergy
Allergic reactions are a common occurrence with sulfa‐containing antibiotics (SCA) and reports estimates the incidence to be approximately 3% to 5%.43, 44
One misbelief is that patients who are allergic to SCAs should not receive sulfa containing diuretics or other sulfa‐containing medications.45 This leads some physicians to substitute commonly used diuretics (such as furosemide or thiazides) for ethacrynic acid. The use of ethacrynic acid has several challenges: the limited supply of the intravenous form, the discontinuation of the oral form, the increased cost, and the risk of permanent ototoxicity.
The evidence for potential allergic cross‐reactivity among medications containing the sulfa moiety has been primarily derived from Case Reports.4649
The molecular structures of sulfamethoxazole and furosemide are shown below. The allergic antigen is most often the N1 component,45 and sometimes N4 but not the sulfa moiety. Both of the incriminated antigens are not present in the furosemide structure (as well as all other sulfa containing diuretics) (Figures 4 and 5).
Experimental data showed that serum from patients allergic to SCAs did not bind to diuretics.50 In addition, clinical reports failed to demonstrate cross‐reactivity.5153 In a large clinical trial, Strom et al.53 showed that although there was a higher risk for allergic reaction to sulfa containing medications (SCM) in patients allergic to SCA (compared to those who were not), it was lower among patients with an allergy to sulfa antibiotic than among patients with a history of hypersensitivity to penicillins, suggesting this was due to a predisposition to allergic reactions in general rather than true cross‐reactivity. In another report, patients who were receiving ethacrynic acid for many years were successfully and uneventfully switched to furosemide.54
Taken together, these findings suggest that there is no evidence for withholding sulfa nonantibiotics in patients allergic to sulfa containing antibiotics.
Conclusion
Hypothyroidism, unlike myxedema, is not a cause of hyponatremia (although it can be sometimes seen in conjunction with the latter) and additional investigations should be done to determine its etiology. Sodium bicarbonate is effective for treatment of hyperkalemia by enhancing renal potassium elimination, rather than from shifting potassium into cells. The 5‐oxoprolinuria is a newly recognized cause of high anion‐gap metabolic acidosis and should be considered in patients who have taken acetaminophen. Furosemide (and sulfa containing diuretics) can be used safely in patients with an allergy to SCA.
There are many controversial topics relating to renal disease in hospitalized patients. The aim of this review is to shed light on some important and often debated issues. We will first discuss topics related to electrolytes disorder commonly seen in hospitalized patients (hyponatremia, hyperkalemia, metabolic acidosis) then the use of diuretics in patients with allergy to sulfa containing antibiotics.
Hypothyroidism and Hyponatremia
Hyponatremia is common in hospitalized patients and is associated with worse outcomes.1 It can be seen with a variety of conditions ranging from congestive heart failure to volume depletion. Careful history and physical examination are paramount and the initial work‐up usually includes serum and urine osmolality and urine sodium concentration.
For euvolemic hyponatremia, the differential diagnosis includes the syndrome of inappropriate adenine dinucleotide (ADH) secretion (SIADH), hypoadrenalism, and beer potomania. Additionally, many authorities also include hypothyroidism.
Although the simultaneous finding of hypothyroidism and hyponatremia can occur in patients as both diseases are widely prevalent in the general population, causation has yet to be convincingly demonstrated.
ADH is released in response to effective volume depletion; consequently when hypothyroidism is encountered in the setting of complete pituitary failure there is often hyponatremia.2, 3 Alternatively, with myxedema, the ability of the kidney to handle a water load and concentrate urine can be impaired.4
However, the observation that thyroid hormone administration did not raise sodium values in newborns with congenital hypothyroidism or in adults supports the absence of causal effect.5, 6And in addition, large studies done in the hospital and outpatient setting showed no differences between the serum sodium values of hypothyroid patients and that of controls.7, 8 In the study of outpatients, among those with hypothyroidism, for every increase of 10 mU/L of thyroid‐stimulating hormone (TSH), there was a drop of only 0.14 mmol/L of Na concentration.8 Thus, the elevation of TSH required for a clinically meaningful drop in sodium to occur was considerable.
Hence in patients with hyponatremia, the hospitalist should look for etiologies other than hypothyroidism and should only consider thyroid hypofunction as a culprit in cases of myxedema, or panhypopituitarism.
Sodium Bicarbonate for Hyperkalemia
Hyperkalemia is one of the most feared electrolyte disorders encountered in hospitalized patients and can lead to dire outcomes.9, 10
Potassium (K+) homeostasis is maintained in the body by 2 complimentary systems: a short‐term system that regulates K+ variation by modifying translocation across the cellular membrane and a long‐term system that adjusts overall K+ balance. The translocation system is regulated primarily by insulin and ‐2 stimulation. Overall K+ balance is mainly controlled by the kidney (90‐95%) although the gastrointestinal (GI) tract can have a more preponderant role in anephric patients.
Hyperkalemia can ensue by either a dysregulation of the translocation system (as in diabetic Ketoacidosis secondary to insulin deficiency) or impairment of K+ elimination.
Acid‐base status was previously thought to have a prominent influence on K+ concentration, based on studies that demonstrated that. However, studies looking at metabolic acidosis revealed that contrary to the effect of mineral acidosis (excess of nonmetabolizable anions)11 where there is an inverse correlation between potassium concentration and pH; organic acidosis (excess of metabolizable anions)11 was not associated with hyperkalemia.1214 However, organic acidosis can be seen simultaneously and induced by a same underlying disease (such as organ ischemia with lactic acidosis or insulin deficiency complicated by ketoacidosis). Also, when changes in pH are induced by respiratory variations or with alkalosis, the impact on serum K+ concentration is less remarkable.15 Hence, it seems that it is the nature of the acid‐base disturbance that impacts K+ concentration more than the change in pH itself.
In the kidney, the main site for regulation of K+ balance is the collecting duct. Factors that affect elimination include urinary sodium delivery, urine flow, and aldosterone.16 In order to adequately eliminate K+ these factors must be optimized in conjunction.
Treatment of hyperkalemia includes the sequential administration of agents that stabilize the cardiac membrane (calcium gluconate), shift the potassium intracellularly (insulin, ‐2 agonists), and remove the potassium (diuretics, sodium polystyrene, or dialysis).
The use of sodium bicarbonate for treatment of hyperkalemia has been long advocated.17 It was thought to act by translocation of potassium hence could be used to quickly lower K+ concentration. However, this dogma has been challenged recently.
To assess the true impact of sodium bicarbonate on potassium translocation, studies have been conducted on anephric patients with hyperkalemia. Bicarbonate infusion failed to elicit a significant rapid change in serum K+ concentration despite increase in bicarbonate concentration, arguing against a translocation mechanism.1821 After 60 minutes of treatment, neither isotonic nor hypertonic bicarbonate infusion affected Serum K+ levels in end‐stage renal disease (ESRD) patients.19, 20 On the contrary, hypertonic sodium bicarbonate increased the K+ concentration after 180 minutes of treatment,20 and it took a prolonged infusion of 4 hours to see a significant decrease in K+ concentration (0.6 mmol/L); half of which could be accounted for solely by volume administration. Moreover, this reduction was highly variable.
Rather, sodium bicarbonate seems to enhance potassium elimination by increasing sodium delivery to the distal tubule, increasing urinary pH and negative luminal charge and potentiating the action of diuretics.23 In an elegant study on normovolemic patients, the induction of bicarbonaturia practically doubled potassium excretion.23 However, such an effect is heterogeneous and usually takes place over 4 hours to 6 hours.17
At the cellular level, 2 ion exchange pumps cooperate to handle Na/K/H movement across the cellular membrane: an Na+/H+ exchanger (NHE) and the Na+/K+ ATP‐ase pump (Figure 1). The NHE is normally inactive and is only upregulated in cases of severe intracellular acidosis.24 The infusion of sodium bicarbonate to patients with severe metabolic acidosis could possibly decrease the serum potassium concentration by translocation if the NHE was significantly upregulated. However, this treatment can be associated with a drop in the ionized calcium level, a worsening of the intracellular acidosis, and a decreased peripheral oxygen delivery.25 Thus, the benefits should be balanced with the potential adverse effects and, even in cases of severe metabolic acidosis with hyperkalemia, we would advise the clinician to restrictively administer sodium bicarbonate.
In addition, in ESRD patients, the administration of sodium bicarbonate can be problematic owing to the osmotic and volume burden it carries. It should also be avoided in patients who are volume overload or in those with decreased ability to eliminate potassium.
When treating hyperkalemic patients, hospitalists should use sodium bicarbonate to potentiate urinary elimination of potassium and should consider administering it either with acetazolamide or a loop diuretic, anticipating a lowering effect after a few hours.26 It should be avoided in patients with volume overload and anuria. Immediate translocation of potassium into cells is best achieved by insulin and ‐2 agonists.
5‐Oxoprolinuria: A Newly Recognized Cause of High Anion Gap Metabolic Acidosis
There are several causes of metabolic high anion gap acidosis in hospitalized patients. However, despite careful investigations, the cause of that disorder is not always apparent.27 Recently, 5‐oxoprolinuria (also called pyroglutamic acidosis) has become increasingly recognized as a potential etiology.2832
The metabolism of glutamate (though the ‐Glutamyl cycle) generates glutathione which provides negative feedback to the ‐Glutamyl‐cysteine synthetase enzyme. The depletion of glutathione increases 5‐oxoproline production owing to the loss of that inhibition (Figures 2 and 3). Low glutathione levels can be seen with liver disease,33 chronic alcohol intake,34 acetaminophen use,35 malnutrition,36 renal dysfunction,29 use of vigabatrim (an antiepileptic that received Food and Drug Administration [FDA] approval for use in April 2009)37 and sepsis.38 Most of the reported cases were female and had more than one risk factor.39
Typically, patients present with high anion gap acidosis (often more than 20)28 with normal acetaminophen levels and all usual tests being negative. A history of chronic acetaminophen use with or without other risk factors can frequently be found. The true independent impact of this type of acidosis on outcomes is difficult to determine as all of the reported cases had many confounding factors.
A urinary organic acid level is diagnostic and will reveal increased levels of pyroglutamic acid. Alternatively, the finding of a positive urinary anion gap (UNa +UK UCl) with a positive urinary osmolar gap (Uosmmeasured‐Uosmcalculated) in the appropriate clinical setting (unexplained high anion gap acidosis with negative workup and presence of risk factors for 5‐oxoproliniuria) can point towards the diagnosis.40
A study of patients with unexplained metabolic acidosis did not find any cases of 5‐oxoprolinuria.41 Although this might suggest that the incidence of this disease is low, very few of those patients were actually taking acetaminophen (therefore had a reduced propensity for developing pyroglutamic acidosis).41 Thus, the actual incidence of 5‐oxoprolinuria is hard to determine.
Once recognized, acetaminophen should be withheld and N‐acetylcysteine (NAC) can be used to replete glutathione levels although there is no convincing evidence for this use.42 It is important for hospitalists to be aware of this disorder as it can pose a diagnostic challenge (negative usual work‐up), is easy to treat by stopping acetaminophen, and can (possibly) negatively affect outcomes.
Furosemide and Patients With Sulfa Allergy
Allergic reactions are a common occurrence with sulfa‐containing antibiotics (SCA) and reports estimates the incidence to be approximately 3% to 5%.43, 44
One misbelief is that patients who are allergic to SCAs should not receive sulfa containing diuretics or other sulfa‐containing medications.45 This leads some physicians to substitute commonly used diuretics (such as furosemide or thiazides) for ethacrynic acid. The use of ethacrynic acid has several challenges: the limited supply of the intravenous form, the discontinuation of the oral form, the increased cost, and the risk of permanent ototoxicity.
The evidence for potential allergic cross‐reactivity among medications containing the sulfa moiety has been primarily derived from Case Reports.4649
The molecular structures of sulfamethoxazole and furosemide are shown below. The allergic antigen is most often the N1 component,45 and sometimes N4 but not the sulfa moiety. Both of the incriminated antigens are not present in the furosemide structure (as well as all other sulfa containing diuretics) (Figures 4 and 5).
Experimental data showed that serum from patients allergic to SCAs did not bind to diuretics.50 In addition, clinical reports failed to demonstrate cross‐reactivity.5153 In a large clinical trial, Strom et al.53 showed that although there was a higher risk for allergic reaction to sulfa containing medications (SCM) in patients allergic to SCA (compared to those who were not), it was lower among patients with an allergy to sulfa antibiotic than among patients with a history of hypersensitivity to penicillins, suggesting this was due to a predisposition to allergic reactions in general rather than true cross‐reactivity. In another report, patients who were receiving ethacrynic acid for many years were successfully and uneventfully switched to furosemide.54
Taken together, these findings suggest that there is no evidence for withholding sulfa nonantibiotics in patients allergic to sulfa containing antibiotics.
Conclusion
Hypothyroidism, unlike myxedema, is not a cause of hyponatremia (although it can be sometimes seen in conjunction with the latter) and additional investigations should be done to determine its etiology. Sodium bicarbonate is effective for treatment of hyperkalemia by enhancing renal potassium elimination, rather than from shifting potassium into cells. The 5‐oxoprolinuria is a newly recognized cause of high anion‐gap metabolic acidosis and should be considered in patients who have taken acetaminophen. Furosemide (and sulfa containing diuretics) can be used safely in patients with an allergy to SCA.
- ,,.Mortality after hospitalization with mild, moderate, and severe hyponatremia.Am J Med.2009;122(9):857–865.
- ,.Hyponatremia as the presenting manifestation of Sheehan's syndrome in elderly patients.Aging Clin Exp Res.2006;18(6):536–539.
- ,,.Sodium and water disturbances in patients with Sheehan's syndrome.Am J Kidney Dis.2001;38(3):E14.
- ,,,,,.Effect of acute water loading on plasma levels of antidiuretic hormone AVP aldosterone, ANP fractional excretion of sodium and plasma and urine osmolalities in myxedema.Chin Med J (Engl).1990;103(9):704–708.
- ,.Sodium handling in congenitally hypothyroid neonates.Acta Paediatr.2004;93(1):22–24.
- ,,.Prevalence and severity of hyponatremia and hypercreatininemia in short‐term uncomplicated hypothyroidism.J Endocrinol Invest.1999;22(1):35–39.
- ,,,,.Absence of relation between hyponatraemia and hypothyroidism.Lancet.1997;350(9088):1402.
- ,,.The effect of newly diagnosed hypothyroidism on serum sodium concentrations: a retrospective study.Clin Endocrinol (Oxf).2006;64(5):598–599.
- .Disorders of potassium homeostasis. Hypokalemia and hyperkalemia.Crit Care Clin.2002;18(2):273–288,vi.
- ,.Hyperkalemia in hospitalized patients.Int Urol Nephrol.2000;32(2):177–180.
- ,.Treatment of metabolic acidosis.Curr Opin Crit Care.2003;9(4):260–265.
- ,,,.Natural history of lactic acidosis after grand‐mal seizures. A model for the study of an anion‐gap acidosis not associated with hyperkalemia.N Engl J Med.1977;297(15):796–799.
- ,,,,.The plasma potassium concentration in metabolic acidosis: a re‐evaluation.Am J Kidney Dis.1988;11(3):220–224.
- ,,,.Determinants of plasma potassium levels in diabetic ketoacidosis.Medicine (Baltimore).1986;65(3):163–172.
- ,.Changes in plasma potassium concentration during acute acid‐base disturbances.Am J Med.1981;71(3):456–467.
- ,,.New aspects of renal potassium transport.Pflugers Arch.2003;446(3):289–297.
- ,.Correction of hyperkalemia by bicarbonate despite constant blood pH.Kidney Int.1977;12(5):354–360.
- ,,,.Effect of various therapeutic approaches on plasma potassium and major regulating factors in terminal renal failure.Am J Med.1988;85(4):507–512.
- ,.Effect of bicarbonate administration on plasma potassium in dialysis patients: interactions with insulin and albuterol.Am J Kidney Dis.1996;28(4):508–514.
- ,,,,.Effect of hypertonic versus isotonic sodium bicarbonate on plasma potassium concentration in patients with end‐stage renal disease.Miner Electrolyte Metab.1991;17(5):297–302.
- .Combined effect of bicarbonate and insulin with glucose in acute therapy of hyperkalemia in end‐stage renal disease patients.Nephron.1996;72(3):476–482.
- ,,.Effect of prolonged bicarbonate administration on plasma potassium in terminal renal failure.Kidney Int.1992;41(2):369–374.
- ,,, et al.Modulation of the secretion of potassium by accompanying anions in humans.Kidney Int.1991;39(6):1206–1212.
- ,.Controversial issues in the treatment of hyperkalaemia.Nephrol Dial Transplant.2003;18(11):2215–2218.
- ,.Sodium bicarbonate for the treatment of lactic acidosis.Chest.2000;117(1):260–267.
- .Management of severe hyperkalemia.Crit Care Med.2008;36(12):3246–3251.
- ,.Pyroglutamic acid and high anion gap: looking through the keyhole?Crit Care Med.2000;28(6):2140–2141.
- ,,,,.Increased anion gap metabolic acidosis as a result of 5‐oxoproline (pyroglutamic acid): a role for acetaminophen.Clin J Am Soc Nephrol.2006;1(3):441–447.
- ,,,.Pyroglutamic acidemia: a cause of high anion gap metabolic acidosis.Crit Care Med.2000;28(6):1803–1807.
- ,,,,,.Acetaminophen‐induced anion gap metabolic acidosis and 5‐oxoprolinuria (pyroglutamic aciduria) acquired in hospital.Am J Kidney Dis.2005;46(1):143–146.
- ,.Anion gap acidosis associated with acetaminophen.Ann Intern Med.2000;133(9):752–753.
- ,,.Pyroglutamic acidosis in a renal transplant patient.Nephrol Dial Transplant.2005;20(12):2836–2838.
- ,,.Hepatic glutathione content in patients with alcoholic and non alcoholic liver diseases.Life Sci.1988;43(12):991–998.
- ,,,,,.Decreased hepatic glutathione in chronic alcoholic patients.J Hepatol.1986;3(1):1–6.
- ,.Intracellular signaling mechanisms of acetaminophen‐induced liver cell death.Toxicol Sci.2006;89(1):31–41.
- ,,.Urinary excretion of 5‐L‐oxoproline (pyroglutamic acid) is increased during recovery from severe childhood malnutrition and responds to supplemental glycine.J Nutr.1996;126(11):2823–2830.
- ,,,.Pyroglutamicaciduria from vigabatrin.Lancet.1989;1(8652):1452–1453.
- ,,, et al.Cysteine metabolism and whole blood glutathione synthesis in septic pediatric patients.Crit Care Med.2001;29(4):870–877.
- ,.Transient 5‐oxoprolinuria and high anion gap metabolic acidosis: clinical and biochemical findings in eleven subjects.Clin Chem.1998;44(7):1497–1503.
- ,,,.Guilty as charged: unmeasured urinary anions in a case of pyroglutamic acidosis.Neth J Med.2008;66(8):351–353.
- ,,.Unexplained metabolic acidosis in critically ill patients: the role of pyroglutamic acid.Intensive Care Med.2004;30(3):502–505.
- ,,.A therapeutic trial with N‐acetylcysteine in subjects with hereditary glutathione synthetase deficiency (5‐oxoprolinuria).J Inherit Metab Dis.1989;12(2):120–130.
- .Diagnosis of allergic reactions to sulfonamides.Allergy.1999;54Suppl 58:28–32.
- .Practical issues in the management of hypersensitivity reactions: sulfonamides.South Med J.2001;94(8):817–824.
- ,,.Should celecoxib be contraindicated in patients who are allergic to sulfonamides? Revisiting the meaning of ‘sulfa’ allergy.Drug Saf.2001;24(4):239–247.
- .Thrombocytopenia due to sulfonamide cross‐sensitivity.Wis Med J.1982;81(6):21–23.
- ,,.Leukocytoclastic vasculitis induced by use of glyburide: a case of possible cross‐reaction of a sulfonamide and a sulfonylurea.Cutis.2003;71(3):235–238.
- ,.Celecoxib‐induced erythema multiforme with glyburide cross‐reactivity.Pharmacotherapy.2002;22(5):637–640.
- ,.Vesiculobullous rash in a patient with systemic lupus erythematosus.Ann Allergy.1993;70(3):196–203.
- ,,, et al.Use of optical biosensor technology to study immunological cross‐reactivity between different sulfonamide drugs.Anal Biochem.2002;300(2):177–184.
- ,,,.Adverse reactions to sulphonamide and sulphonamide‐trimethoprim antimicrobials: clinical syndromes and pathogenesis.Adverse Drug React Toxicol Rev.1996;15(1):9–50.
- ,,.Cross‐reactivity in HIV‐infected patients switched from trimethoprim‐sulfamethoxazole to dapsone.Pharmacotherapy.1998;18(4):831–835.
- ,,, et al.Absence of cross‐reactivity between sulfonamide antibiotics and sulfonamide nonantibiotics.N Engl J Med.2003;349(17):1628–1635.
- ,,.Furosemide challenge in patients with heart failure and adverse reactions to sulfa‐containing diuretics.Ann Intern Med.2003;138(4):358–359.
- ,,.Mortality after hospitalization with mild, moderate, and severe hyponatremia.Am J Med.2009;122(9):857–865.
- ,.Hyponatremia as the presenting manifestation of Sheehan's syndrome in elderly patients.Aging Clin Exp Res.2006;18(6):536–539.
- ,,.Sodium and water disturbances in patients with Sheehan's syndrome.Am J Kidney Dis.2001;38(3):E14.
- ,,,,,.Effect of acute water loading on plasma levels of antidiuretic hormone AVP aldosterone, ANP fractional excretion of sodium and plasma and urine osmolalities in myxedema.Chin Med J (Engl).1990;103(9):704–708.
- ,.Sodium handling in congenitally hypothyroid neonates.Acta Paediatr.2004;93(1):22–24.
- ,,.Prevalence and severity of hyponatremia and hypercreatininemia in short‐term uncomplicated hypothyroidism.J Endocrinol Invest.1999;22(1):35–39.
- ,,,,.Absence of relation between hyponatraemia and hypothyroidism.Lancet.1997;350(9088):1402.
- ,,.The effect of newly diagnosed hypothyroidism on serum sodium concentrations: a retrospective study.Clin Endocrinol (Oxf).2006;64(5):598–599.
- .Disorders of potassium homeostasis. Hypokalemia and hyperkalemia.Crit Care Clin.2002;18(2):273–288,vi.
- ,.Hyperkalemia in hospitalized patients.Int Urol Nephrol.2000;32(2):177–180.
- ,.Treatment of metabolic acidosis.Curr Opin Crit Care.2003;9(4):260–265.
- ,,,.Natural history of lactic acidosis after grand‐mal seizures. A model for the study of an anion‐gap acidosis not associated with hyperkalemia.N Engl J Med.1977;297(15):796–799.
- ,,,,.The plasma potassium concentration in metabolic acidosis: a re‐evaluation.Am J Kidney Dis.1988;11(3):220–224.
- ,,,.Determinants of plasma potassium levels in diabetic ketoacidosis.Medicine (Baltimore).1986;65(3):163–172.
- ,.Changes in plasma potassium concentration during acute acid‐base disturbances.Am J Med.1981;71(3):456–467.
- ,,.New aspects of renal potassium transport.Pflugers Arch.2003;446(3):289–297.
- ,.Correction of hyperkalemia by bicarbonate despite constant blood pH.Kidney Int.1977;12(5):354–360.
- ,,,.Effect of various therapeutic approaches on plasma potassium and major regulating factors in terminal renal failure.Am J Med.1988;85(4):507–512.
- ,.Effect of bicarbonate administration on plasma potassium in dialysis patients: interactions with insulin and albuterol.Am J Kidney Dis.1996;28(4):508–514.
- ,,,,.Effect of hypertonic versus isotonic sodium bicarbonate on plasma potassium concentration in patients with end‐stage renal disease.Miner Electrolyte Metab.1991;17(5):297–302.
- .Combined effect of bicarbonate and insulin with glucose in acute therapy of hyperkalemia in end‐stage renal disease patients.Nephron.1996;72(3):476–482.
- ,,.Effect of prolonged bicarbonate administration on plasma potassium in terminal renal failure.Kidney Int.1992;41(2):369–374.
- ,,, et al.Modulation of the secretion of potassium by accompanying anions in humans.Kidney Int.1991;39(6):1206–1212.
- ,.Controversial issues in the treatment of hyperkalaemia.Nephrol Dial Transplant.2003;18(11):2215–2218.
- ,.Sodium bicarbonate for the treatment of lactic acidosis.Chest.2000;117(1):260–267.
- .Management of severe hyperkalemia.Crit Care Med.2008;36(12):3246–3251.
- ,.Pyroglutamic acid and high anion gap: looking through the keyhole?Crit Care Med.2000;28(6):2140–2141.
- ,,,,.Increased anion gap metabolic acidosis as a result of 5‐oxoproline (pyroglutamic acid): a role for acetaminophen.Clin J Am Soc Nephrol.2006;1(3):441–447.
- ,,,.Pyroglutamic acidemia: a cause of high anion gap metabolic acidosis.Crit Care Med.2000;28(6):1803–1807.
- ,,,,,.Acetaminophen‐induced anion gap metabolic acidosis and 5‐oxoprolinuria (pyroglutamic aciduria) acquired in hospital.Am J Kidney Dis.2005;46(1):143–146.
- ,.Anion gap acidosis associated with acetaminophen.Ann Intern Med.2000;133(9):752–753.
- ,,.Pyroglutamic acidosis in a renal transplant patient.Nephrol Dial Transplant.2005;20(12):2836–2838.
- ,,.Hepatic glutathione content in patients with alcoholic and non alcoholic liver diseases.Life Sci.1988;43(12):991–998.
- ,,,,,.Decreased hepatic glutathione in chronic alcoholic patients.J Hepatol.1986;3(1):1–6.
- ,.Intracellular signaling mechanisms of acetaminophen‐induced liver cell death.Toxicol Sci.2006;89(1):31–41.
- ,,.Urinary excretion of 5‐L‐oxoproline (pyroglutamic acid) is increased during recovery from severe childhood malnutrition and responds to supplemental glycine.J Nutr.1996;126(11):2823–2830.
- ,,,.Pyroglutamicaciduria from vigabatrin.Lancet.1989;1(8652):1452–1453.
- ,,, et al.Cysteine metabolism and whole blood glutathione synthesis in septic pediatric patients.Crit Care Med.2001;29(4):870–877.
- ,.Transient 5‐oxoprolinuria and high anion gap metabolic acidosis: clinical and biochemical findings in eleven subjects.Clin Chem.1998;44(7):1497–1503.
- ,,,.Guilty as charged: unmeasured urinary anions in a case of pyroglutamic acidosis.Neth J Med.2008;66(8):351–353.
- ,,.Unexplained metabolic acidosis in critically ill patients: the role of pyroglutamic acid.Intensive Care Med.2004;30(3):502–505.
- ,,.A therapeutic trial with N‐acetylcysteine in subjects with hereditary glutathione synthetase deficiency (5‐oxoprolinuria).J Inherit Metab Dis.1989;12(2):120–130.
- .Diagnosis of allergic reactions to sulfonamides.Allergy.1999;54Suppl 58:28–32.
- .Practical issues in the management of hypersensitivity reactions: sulfonamides.South Med J.2001;94(8):817–824.
- ,,.Should celecoxib be contraindicated in patients who are allergic to sulfonamides? Revisiting the meaning of ‘sulfa’ allergy.Drug Saf.2001;24(4):239–247.
- .Thrombocytopenia due to sulfonamide cross‐sensitivity.Wis Med J.1982;81(6):21–23.
- ,,.Leukocytoclastic vasculitis induced by use of glyburide: a case of possible cross‐reaction of a sulfonamide and a sulfonylurea.Cutis.2003;71(3):235–238.
- ,.Celecoxib‐induced erythema multiforme with glyburide cross‐reactivity.Pharmacotherapy.2002;22(5):637–640.
- ,.Vesiculobullous rash in a patient with systemic lupus erythematosus.Ann Allergy.1993;70(3):196–203.
- ,,, et al.Use of optical biosensor technology to study immunological cross‐reactivity between different sulfonamide drugs.Anal Biochem.2002;300(2):177–184.
- ,,,.Adverse reactions to sulphonamide and sulphonamide‐trimethoprim antimicrobials: clinical syndromes and pathogenesis.Adverse Drug React Toxicol Rev.1996;15(1):9–50.
- ,,.Cross‐reactivity in HIV‐infected patients switched from trimethoprim‐sulfamethoxazole to dapsone.Pharmacotherapy.1998;18(4):831–835.
- ,,, et al.Absence of cross‐reactivity between sulfonamide antibiotics and sulfonamide nonantibiotics.N Engl J Med.2003;349(17):1628–1635.
- ,,.Furosemide challenge in patients with heart failure and adverse reactions to sulfa‐containing diuretics.Ann Intern Med.2003;138(4):358–359.
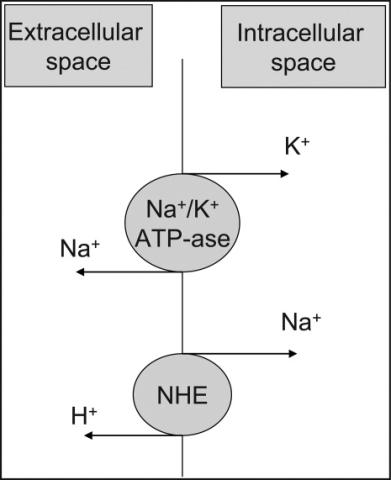
Report Supports Telemedicine Use in ICU
A new report that outlines the potential care delivery improvements and cost savings of telemedicine might also be a road map to increased efficiency for hospitalists, according to one of the study’s authors and a former SHM president.
Telemedicine "simplifies their life," says Mitchell Adams, AB, MBA, executive director of the Massachusetts Technology Collaborative (MTC) in Boston, which coauthored "Critical Care, Critical Choices: The Case for Tele-ICUs in Intensive Care" with the New England Healthcare Institute (NEHI) in Cambridge. "It means you have you less complications, you have less work. You have an intensivist looking over your shoulder, making sure you’re doing it right."
As the population ages and hospitalists become more entrenched in their institutions, they could end up spending more time on ICU cases. The use of telemedicine—where an intensivist at a remote “command center” oversees the delivery of care—could foster higher-quality and more efficient care, which would subsequently allow HM practitioners to focus on the rest of the census, according to Mary Jo Gorman, MD, MBA, FHM, former SHM president and CEO of St. Louis-based Advanced ICU Care, which provides intensivists to community hospitals using telemedicine.
The study, based on a demonstration project at the University of Massachusetts Memorial Medical Center and two associated community hospitals, reported a 20% drop in ICU mortality at the academic medical center (P=0.01). When adjusted for the severity of ICU illnesses, one community hospital reported a 36% drop in mortality (P=0.83); the other reported a 142% increase (P<0.001). All three centers also reported a reduction in length of stay (LOS) of at least 12 hours.
Dr. Gorman and Adams agree that it will take more evidence-based studies showing the efficacy of telemedicine before the practice becomes widespread, a phenomenon Adams attributes to the "inherent inertia and viscosity in the system to maintain the status quo."
"Everybody might know the right answer," Dr. Gorman adds. "It's still going to take a long time. That’s just the pace at which we move in healthcare."
A new report that outlines the potential care delivery improvements and cost savings of telemedicine might also be a road map to increased efficiency for hospitalists, according to one of the study’s authors and a former SHM president.
Telemedicine "simplifies their life," says Mitchell Adams, AB, MBA, executive director of the Massachusetts Technology Collaborative (MTC) in Boston, which coauthored "Critical Care, Critical Choices: The Case for Tele-ICUs in Intensive Care" with the New England Healthcare Institute (NEHI) in Cambridge. "It means you have you less complications, you have less work. You have an intensivist looking over your shoulder, making sure you’re doing it right."
As the population ages and hospitalists become more entrenched in their institutions, they could end up spending more time on ICU cases. The use of telemedicine—where an intensivist at a remote “command center” oversees the delivery of care—could foster higher-quality and more efficient care, which would subsequently allow HM practitioners to focus on the rest of the census, according to Mary Jo Gorman, MD, MBA, FHM, former SHM president and CEO of St. Louis-based Advanced ICU Care, which provides intensivists to community hospitals using telemedicine.
The study, based on a demonstration project at the University of Massachusetts Memorial Medical Center and two associated community hospitals, reported a 20% drop in ICU mortality at the academic medical center (P=0.01). When adjusted for the severity of ICU illnesses, one community hospital reported a 36% drop in mortality (P=0.83); the other reported a 142% increase (P<0.001). All three centers also reported a reduction in length of stay (LOS) of at least 12 hours.
Dr. Gorman and Adams agree that it will take more evidence-based studies showing the efficacy of telemedicine before the practice becomes widespread, a phenomenon Adams attributes to the "inherent inertia and viscosity in the system to maintain the status quo."
"Everybody might know the right answer," Dr. Gorman adds. "It's still going to take a long time. That’s just the pace at which we move in healthcare."
A new report that outlines the potential care delivery improvements and cost savings of telemedicine might also be a road map to increased efficiency for hospitalists, according to one of the study’s authors and a former SHM president.
Telemedicine "simplifies their life," says Mitchell Adams, AB, MBA, executive director of the Massachusetts Technology Collaborative (MTC) in Boston, which coauthored "Critical Care, Critical Choices: The Case for Tele-ICUs in Intensive Care" with the New England Healthcare Institute (NEHI) in Cambridge. "It means you have you less complications, you have less work. You have an intensivist looking over your shoulder, making sure you’re doing it right."
As the population ages and hospitalists become more entrenched in their institutions, they could end up spending more time on ICU cases. The use of telemedicine—where an intensivist at a remote “command center” oversees the delivery of care—could foster higher-quality and more efficient care, which would subsequently allow HM practitioners to focus on the rest of the census, according to Mary Jo Gorman, MD, MBA, FHM, former SHM president and CEO of St. Louis-based Advanced ICU Care, which provides intensivists to community hospitals using telemedicine.
The study, based on a demonstration project at the University of Massachusetts Memorial Medical Center and two associated community hospitals, reported a 20% drop in ICU mortality at the academic medical center (P=0.01). When adjusted for the severity of ICU illnesses, one community hospital reported a 36% drop in mortality (P=0.83); the other reported a 142% increase (P<0.001). All three centers also reported a reduction in length of stay (LOS) of at least 12 hours.
Dr. Gorman and Adams agree that it will take more evidence-based studies showing the efficacy of telemedicine before the practice becomes widespread, a phenomenon Adams attributes to the "inherent inertia and viscosity in the system to maintain the status quo."
"Everybody might know the right answer," Dr. Gorman adds. "It's still going to take a long time. That’s just the pace at which we move in healthcare."