User login
Elbow injuries: Getting kids back in the game
• Administer the valgus stress test, the “milking maneuver,” and the moving valgus stress test to athletes suspected of having ulnar collateral ligament injury. C
• Treat Little League elbow with nonsteroidal anti-inflammatory drugs, ice, brief immobilization, and a 4- to 6-week “break” from throwing. A
• Advise young baseball players (and their parents) to avoid pitching year-round, and to get 3 months of rest per year. A
Strength of recommendation (SOR)
A Good-quality patient-oriented evidence
B Inconsistent or limited-quality patient-oriented evidence
C Consensus, usual practice, opinion, disease-oriented evidence, case series
The growing popularity of club teams and year-round participation in sports has spawned an epidemic of elbow injuries in primary and secondary school students and young adults alike. The incidence of elbow pain in children engaged in sports that require overhead throwing, such as baseball, football, volleyball, tennis, and javelin, ranges from 45% to 78%.1
Fortunately, acute traumatic elbow injury, with pain severe enough to force the athlete to cease participation entirely, is relatively rare, accounting for only 1% to 5% of cases.1,2 Far more often, elbow pain is associated with overuse, resulting in a gradual onset of medial elbow soreness that does not prevent the athlete from playing.
When an athlete seeks care for elbow pain, there are a number of things to consider, including the patient’s age, skeletal maturity, and type and frequency of throwing. Younger “throwers” typically incur injuries related to the physes, while adolescents and adults are more likely to sustain injuries to the ligaments and tendons.3 In both cases, repetitive valgus stress is the mechanism of injury. This review—of elbow anatomy (see the box),4-6 injury, differential diagnosis, and treatment—will make it easier for you to get injured athletes back in the game.

The elbow has 3 articulations—ulnohumeral, radiocapitellar, and proximal radioulnar—that provide primary stability to valgus stress. The elbow’s soft tissue restraints include 2 ligament complexes (medial and lateral collateral), 4 muscle groups (flexors, extensors, pronators, supinators), and 3 major nerves (radial, median, ulnar) and their branches.
The ulnar collateral ligament (UCL) complex—which consists of the anterior and posterior bundles and the transverse ligament—is the main source of medial elbow stability. 4 Mechanical stability for overhead throwing is provided by both bony and soft tissue restraints. During the pitching motion, the forces generated exceed the UCL’s tensile strength, and protective flexor muscles are activated.5,6
And the pitch…There are 6 stages of throwing: windup, early cocking, late cocking, acceleration, deceleration, and follow-through. Elbow pain is most likely during the late-cocking or early acceleration phase of a throw, the point of ball/javelin release, or the moment the racquet hits the ball.4
Is it Little League elbow? Start with a targeted history
In skeletally immature athletes, open physes result in the epicondylar apophysis being the weakest structure on the medial aspect of the elbow. Thus, repetitive valgus stress and tension overload often lead to “Little League elbow”—an umbrella term with a differential diagnosis that encompasses medial epicondylar fragmentation, delayed or accelerated growth of the medial epicondyle, and delayed closure of its growth plate, among other conditions (TABLE 1).3,7,8
In more mature athletes, repetitive microtrauma to the ulnar collateral ligament (UCL) leads to its gradual attenuation or complete failure.7 This increases the stress on the radiocapitellar joint and olecranon, and can lead to edema, scarring, calcification, osteophyte formation, medial epicondylitis, ulnar nerve neurapraxia, or radiocapitellar chondral damage.9 Extended practices and tournaments, with no substantial rest period throughout the year, put adolescents at increased risk for UCL injuries.10
Regardless of age, the medical history of an athlete with elbow pain should elicit information about the mechanism of injury; the location, duration, and quality of the pain; factors that alleviate or exacerbate the pain; the presence of weakness or paresthesias; and the extent to which the pain has affected the patient’s ability to throw. Patients with chronic UCL injuries, for example, often report a loss of arm control and decrease in throwing speed. It is also important to address hand dominance, level of participation, the position played, changes in technique or training regimen, prior injuries, and the effects of any previous treatment.11
TABLE 1
Differential diagnosis of elbow injuries
| Location | Differential diagnosis |
|---|---|
| Medial | Little League elbow
|
| Anterior | Anterior capsule strain Biceps tendon rupture Biceps tendonitis Dislocation Median nerve compression (pronator) syndrome |
| Posterior | Olecranon bursitis Olecranon process or tip stress fracture Triceps rupture/olecranon avulsion Triceps tendonitis Trochlear rupture Valgus overload syndrome (posterior olecranon impingement syndrome) |
| Lateral | Capitellum fracture Lateral epicondylitis Lateral ulnar collateral ligament injury Osteochondritis dissecans Posterior interosseous nerve syndrome Posterolateral rotary instability Radial head fracture Radiocapitellar chondromalacia |
| Adapted from: McKeag DB, Moeller JL. ACSM’s Primary Care Sports Medicine. 2nd ed.3 | |
Compare the affected and uninjured extremities
Inspect, palpate, and assess the active and passive range of motion, strength, and neurovascular status of both arms, with the uninjured side serving as a comparison. The scapula, shoulder, and wrist are also involved in throwing, so these joints should be examined along with the elbow.
Measure range of motion. Normal ranges for the flexion-extension arc are 0 to 140°, with 75° of pronation and 82° of supination.12 Use a goniometer, if available, to ensure accuracy and reproducibility,1 and pay close attention to the position that elicits pain.
In medial epicondylitis, the full range of motion should be preserved. Patients experience pain at the medial epicondyle and overlying flexor-pronator mass proximately, and pain or weakness with resisted wrist flexion, and resisted pronation, at full extension.4,11 Flexor-pronator strain will produce similar findings, but edema or ecchymosis may be present and there may be pain immediately distal to the medial epicondyle.11
Pain associated with injury to the UCL—which courses distal and slightly posterior to the medial epicondyle—typically occurs 2 cm distal to the medial epicondyle over the anterior bundle. Tenderness over the UCL has a sensitivity of 81% to 94% for UCL tears, but a specificity of only 22%.13
Physical maneuvers can help identify source of elbow pain
A complete UCL tear can cause valgus gapping as small as 3 mm, which makes it difficult to detect on physical exam alone.4 Orthopedic and sports medicine literature recommend that 3 maneuvers be used to identify UCL pathology:4,14,15
The valgus stress test (FIGURE 1) assesses the effects of valgus stress on the UCL. Gapping >3 mm signifies UCL instability. The test has a sensitivity of 66% and a specificity of 60% for detecting a UCL strain or tear.13,16
The milking maneuver (FIGURE 2), performed by the patient (or by a clinician if the patient lacks flexibility), reproduces a common pitching exercise. Medial elbow pain or apprehension indicates UCL injury.13,16
The moving valgus stress test (FIGURE 3A-C) is done in an effort to recreate the flexion angles of the elbow during the late cocking and early acceleration phases of throwing. Pain anywhere in the arc of motion suggests a UCL injury; pain elicited at 45° of flexion suggests osteochondrosis of the humeral capitellum, while pain closer to full extension suggests osteochondrosis of the trochlea.13,16
FIGURE 1
Valgus stress test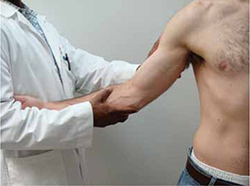
With the injured elbow at 30° of flexion, the shoulder abducted and fully externally rotated, and the patient’s wrist under your arm, place one hand laterally over the elbow. Place the other hand under the ulna and the thumb over the ulnar collateral ligament and apply valgus stress. Gapping >3 mm is abnormal.
FIGURE 2
Milking maneuver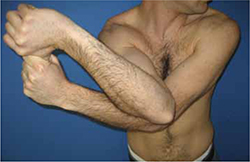
The patient grasps the thumb of the affected arm and pulls downward, with the affected elbow positioned as shown, stressing the ulnar collateral ligament (UCL). Elbow pain or apprehension is positive for UCL injury.
FIGURE 3
Moving valgus stress test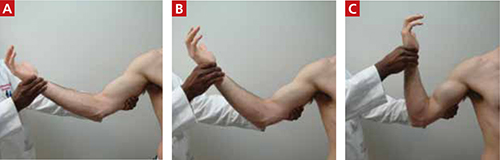
With the shoulder in abduction and maximum external rotation (A), place the elbow in maximum flexion and apply valgus force (B), and extend the elbow from full flexion to full extension (C) in an attempt to reproduce the medial pain.
Does your patient have 2 positive valgus tests and posterior pain?
Valgus extension overload syndrome, which is caused by repetitive stress and results in osteophytes, chondromalacia of the medial olecranon fossa, tension in the UCL, and compression of the radiocapitellar joint, will also produce positive valgus stress and positive moving valgus stress tests. Keep in mind, however, that patients with valgus extension overload often have loss of full extension and posterior elbow pain with forced elbow hyperextension.17
Look for ulnar nerve injury
The physical examination should also be used to test for ulnar nerve injury. The elbow flexion test—a provocative maneuver in which the patient flexes the elbow as far as possible and reports any tingling or numbness of the hand—should be included in the work-up. Symptoms that develop in <60 seconds indicate a positive test for ulnar nerve compression, with the pinky and ulnar half of the ring finger most likely to have loss of vibration and light touch perception. A positive Tinel’s sign over the cubital tunnel is an indication of ulnar neuritis.18
If the ulnar nerve moves out of the ulnar groove when the groove is palpated as the elbow is flexed and extended, subluxating ulnar nerve is the likely diagnosis. If 2 structures displace over the medial epicondyle with elbow flexion, the first will be the ulnar nerve and the second will be the medial head of the triceps—an indication of a snapping medial head of triceps.18
Imaging studies may require a second look
Imaging studies are sometimes used to further aid in diagnosis of elbow injury. However, standard elbow x-rays, including an anteroposterior view in full extension, an oblique view, and a lateral view at 90° flexion, can be deceiving, as they often appear normal in conditions causing medial elbow pain associated with overhead throwing.
Careful review of the images may be needed to rule out fracture and other conditions, keeping the following factors in mind:
- A supracondylar fracture is likely if the anterior humeral line that is drawn along the anterior surface of the humeral cortex (on a lateral view) does not transect the middle third of the midcapitellum.3,11,18
- Dislocation of the radial head is suggested if the radiocapitellar line (drawn through the center of the radial head and neck) does not transect the midcapitellum on a lateral view.3,11,18
- Intra-articular injury with a joint effusion is indicated when an enlarged anterior fat pad, which is slightly anterior to the distal humeral diaphysis, is visible (the “sail sign”) on a normal elbow radiograph.3,11,18
- A fracture is likely if a posterior fat pad (which lies in the olecranon fossa and is not usually visible unless an effusion elevates the fat pad away from the cortex) is visible on an elbow x-ray. 3,11,18
- A chronic UCL tear is suggested by heterotropic calcification of the UCL.19
It is useful to x-ray both the injured and the unaffected elbows in skeletally immature athletes to compare secondary ossification centers. Little League elbow demonstrates a widening of the medial epicondyle physis, for example, when the x-rays are compared.3 Secondary ossification centers of the elbow appear first at the capitellum (age 2), followed by the radial head (age 5), medial epicondyle (age 7), trochlea (age 9), and lateral epicondyle (age 11). Most ossification centers fuse between 14 and 17 years of age.3
Computed tomography arthrograms, magnetic resonance imaging (MRI), and ultrasonography are also used to identify UCL tears. MRI, which can reveal injuries to cartilage and tendons as well, is the most commonly used imaging technique for musculoskeletal diagnosis of the elbow.16,20
Treatment gets most athletes back on track
Most medial elbow injuries respond to conservative treatment—typically, with some combination of activity modification, nonsteroidal anti-inflammatory drugs (NSAIDs), icing, physical therapy aimed at flexor-pronator strengthening, and counterforce bracing.11 Medial epicondylosis and flexor-pronator strain injuries have an excellent prognosis, with more than 90% of patients back to their previous level of activity at 1 year. Initial treatment consists of a 2- to 3-week rest period, followed by a 6- to 12-week rehabilitation protocol.11
Randomized controlled trials have found limited evidence of short-term improvement in symptoms with corticosteroid injections compared with placebo or no treatment, local anesthetic, orthosis, physical therapy, and NSAIDs. However, corticosteroids were less effective than physiotherapy or oral NSAIDs in improving long-term outcomes.21 Despite a paucity of well-designed studies to prove their use, autologous blood, platelet-rich plasma, and botulinum toxin are sometimes used for refractory elbow pain.21
Treatment of Little League elbow consists of cessation of throwing for at least 4 to 6 weeks, with a gradual return to throwing and emphasis on proper throwing mechanics after the pain resolves. Most throwers are out of competition for 2 to 3 months, but fully recover with nonoperative management.21
UCL injuries, too, are initially treated with rest, NSAIDs, icing, bracing, and physical therapy, typically with 2 to 3 months of no throwing. Some patients also use a splint at 90° flexion at night and as needed for pain during the day. Patients whose symptoms last more than a year despite treatment may be candidates for arthroscopic debridement.11
Consider reconstruction when nonsurgical management fails
UCL reconstruction was introduced in 1974, when reconstruction was performed on professional pitcher Tommy John, who went on to win 164 games.4,9 The procedure has since undergone numerous modifications. Surgery is indicated for acute rupture, significant chronic instability, insufficient UCL tissue after debridement, or recurrent pain and valgus instability with throwing after rehabilitation.2,4,6,9
Reconstruction generally entails fixing a tendon graft through bone tunnels in the medial epicondyle of the humerus and sublime tubercle of the ulna to reestablish valgus stability. A recent systematic review of reconstruction methods found a 76% to 95% rate of excellent results, with patients returned to their prior level of activity at a mean follow-up of 1 year.22 Rehabilitation typically begins 7 days postop; throwing (without windup) may begin in 4 to 5 months, with a gradual increase in speed and force and a return to the game at 12 months.
A stepped-up focus on prevention
The increase in UCL injuries in adolescents highlights the need for greater emphasis on prevention.10 Several governing bodies, including USA Baseball and the American Academy of Pediatrics, have developed research-based guidelines for young athletes (TABLE 2).1,10,23-25
One of the easiest to follow is to limit an athlete’s weekly pitch count to 10 times his age. Thus, a 10 year old should pitch no more than 100 pitches in a given 7-day period. Another important measure—in addition to ensuring that young athletes receive instruction in proper pitching mechanics (see http://www.littleleague.org/Little_League_Online.htm)—is to urge coaches and parents to require players to get at least 3 months of rest after each season and to stop throwing if they have pain or fatigue.24
TABLE 2
Keeping young pitchers injury-free1,10,23-25
| Recommendations for coaches and parents |
|---|
| Record the number of pitches thrown at each outing/sports event for all young pitchers |
| Avoid allowing young athletes to pitch competitively >8 months per year |
| Limit the number of pitches to ≤2500 per year and 10 × the pitcher’s age per week, or 90 per outing |
| Ensure that young pitchers are instructed in proper pitching mechanics |
| Restrict throwing breaking ball pitches* prior to puberty |
| Ensure that young pitchers get 3 months of rest per year. |
| *A pitch that changes direction either sideways or downwards as it approaches the batter, eg, a slider or curve ball. |
CORRESPONDENCE
Jennifer A. Southard, MD, MSc, Saint Alphonsus Medical Group, 6533 Emerald Street, Boise, ID 83704; [email protected]
1. American Academy of Pediatrics Committee on Sports Medicine and Fitness. Risk of injury from baseball and softball in children. Pediatrics. 2001;107:782-784.
2. Maloney MD, Morhr KJ, el Attrache NS, et al. Elbow injuries in the throwing athlete. Clin Sports Med. 1999;18:795-809.
3. McKeag DB, Moeller JL. ACSM’s Primary Care Sports Medicine. 2nd ed. Philadelphia, PA: Lippincott Williams & Wilkins; 2007:387–402.
4. Hariri S, Safran MR. Ulnar collateral ligament injury in the overhead athlete. Clin Sports Med. 2010;29:619-644.
5. Park MJ, Kim HG, Lee JY. Surgical treatment of post-traumatic stiffness of the elbow. J Bone Joint Surg Br. 2004;86:1158-1162.
6. Lin F, Kohli N, Perlmutter S, et al. Muscle contribution to elbow joint valgus stability. J Shoulder Elbow Surg. 2007;16:795-802.
7. Fleisig GS, Andrews JR, Dillman CJ, et al. Kinetics of baseball pitching with implications about injury mechanisms. Am J Sports Med. 1995;23:233-239.
8. Baker CL, Romero AA. Osteochondritis dissecans of the capitellum. Am J Sports Med. 2010;38:1917-1928.
9. Cain EL, Andrews JR, Dugas JR, et al. Outcome of ulnar collateral ligament reconstruction of the elbow in 1281 athletes: results in 743 athletes with minimum 2-year follow-up. Am J Sports Med. 2010;38:2426-2434.
10. Fleisig GS, Andrews JR, Cutter GR, et al. Prevention of elbow injuries in youth baseball pitchers. Curr Sports Med Rep. 2009;8:250-254.
11. Madden CC, Putukian M, McCarty E, et al. Netter’s Sports Medicine. Philadelphia, PA: Saunders Elsevier; 2010:360–367.
12. Boone DC, Azen SP. Normal range of motion of joints in male subjects. J Bone Joint Surg Am. 1979;61:756-759.
13. Timmerman LA, Schwartz ML, Andrews JR. Preoperative evaluation of the ulnar collateral ligament by magnetic resonance imaging and computed tomography arthrography. Evaluation in 25 baseball players with surgical confirmation. Am J Sports Med. 1994;22:26-31.
14. Mehlhoff TL, Bennet JB. Elbow injuries. In: Mellion MB, Walsh WM, Shelton GI, eds. The Team Physician’s Handbook. 2nd ed. Philadelphia, PA: Hanley & Belfus; 1997:461–473.
15. O’Connor FG, Ollivierre CO, Nirschl RP. Elbow and forearm injuries. In: Lillegard WA, Butcher KS, eds. Handbook of Sports Medicine: A Symptom-Oriented Approach. 2nd ed. Boston, MA: Butterworth-Heinemann; 1999:141–157.
16. Safran MR, Greene H, Lee TQ. Comparison of elbow valgus laxity using radiographic and non-radiographic objective measurement. 73rd Annual Meeting of the American Academy of Orthopaedic Surgeons; May 22, 2006; Chicago, IL.
17. Ahmad CS, El Attrache NS. Valgus extension overload syndrome and stress injury of the olecranon. Clin Sports Med. 2004;23:665-676.
18. Sarwart JF. Essentials of Musculoskeletal Care. 4th ed. Rosemont, IL: American Academy of Orthopaedic Surgeons; 2010:384–387.
19. Mulligan SA, Schwartz ML, Broussard MF, et al. Heterotopic calcification and tears of the ulnar collateral ligament: radiographic and MR imaging findings. AJR Am J Roentgenol. 2000;175:1099-1102.
20. Tuite MJ, Kijowski R. Sports related injures of the elbow: an approach to MRI interpretation. Clin Sports Med. 2006;25:387-408.
21. Rineer CA, Ruch DS. Elbow tendinopathy and tendon ruptures: epicondylitis, biceps and triceps ruptures. J Hand Surg Am. 2009;34:566-576.
22. Vitale MA, Ahmad CS. The outcome of elbow ulnar collateral ligament reconstruction in overhead athletes: a systematic review. Am J Sports Med. 2008;36:1993-205.
23. Olsen SJ, Fleisig GS, Dun S, et al. Risk factors for shoulder and elbow injuries in adolescent baseball pitchers. Am J Sports Med. 2006;34:905-912.
24. Lyman S, Fleisig GS, Andrews JR, et al. Effect of pitch type, pitch count, and pitching mechanics on risk of elbow and shoulder pain in youth baseball pitchers. Am J Sports Med. 2002;30:463-468.
25. Fleisig GS, Andrews JR, Cutter GR, et al. Risk of serious injury for young baseball pitchers: a 10-year prospective study. Am J Sports Med. 2011;39:253-257.
• Administer the valgus stress test, the “milking maneuver,” and the moving valgus stress test to athletes suspected of having ulnar collateral ligament injury. C
• Treat Little League elbow with nonsteroidal anti-inflammatory drugs, ice, brief immobilization, and a 4- to 6-week “break” from throwing. A
• Advise young baseball players (and their parents) to avoid pitching year-round, and to get 3 months of rest per year. A
Strength of recommendation (SOR)
A Good-quality patient-oriented evidence
B Inconsistent or limited-quality patient-oriented evidence
C Consensus, usual practice, opinion, disease-oriented evidence, case series
The growing popularity of club teams and year-round participation in sports has spawned an epidemic of elbow injuries in primary and secondary school students and young adults alike. The incidence of elbow pain in children engaged in sports that require overhead throwing, such as baseball, football, volleyball, tennis, and javelin, ranges from 45% to 78%.1
Fortunately, acute traumatic elbow injury, with pain severe enough to force the athlete to cease participation entirely, is relatively rare, accounting for only 1% to 5% of cases.1,2 Far more often, elbow pain is associated with overuse, resulting in a gradual onset of medial elbow soreness that does not prevent the athlete from playing.
When an athlete seeks care for elbow pain, there are a number of things to consider, including the patient’s age, skeletal maturity, and type and frequency of throwing. Younger “throwers” typically incur injuries related to the physes, while adolescents and adults are more likely to sustain injuries to the ligaments and tendons.3 In both cases, repetitive valgus stress is the mechanism of injury. This review—of elbow anatomy (see the box),4-6 injury, differential diagnosis, and treatment—will make it easier for you to get injured athletes back in the game.
The elbow has 3 articulations—ulnohumeral, radiocapitellar, and proximal radioulnar—that provide primary stability to valgus stress. The elbow’s soft tissue restraints include 2 ligament complexes (medial and lateral collateral), 4 muscle groups (flexors, extensors, pronators, supinators), and 3 major nerves (radial, median, ulnar) and their branches.
The ulnar collateral ligament (UCL) complex—which consists of the anterior and posterior bundles and the transverse ligament—is the main source of medial elbow stability. 4 Mechanical stability for overhead throwing is provided by both bony and soft tissue restraints. During the pitching motion, the forces generated exceed the UCL’s tensile strength, and protective flexor muscles are activated.5,6
And the pitch…There are 6 stages of throwing: windup, early cocking, late cocking, acceleration, deceleration, and follow-through. Elbow pain is most likely during the late-cocking or early acceleration phase of a throw, the point of ball/javelin release, or the moment the racquet hits the ball.4
Is it Little League elbow? Start with a targeted history
In skeletally immature athletes, open physes result in the epicondylar apophysis being the weakest structure on the medial aspect of the elbow. Thus, repetitive valgus stress and tension overload often lead to “Little League elbow”—an umbrella term with a differential diagnosis that encompasses medial epicondylar fragmentation, delayed or accelerated growth of the medial epicondyle, and delayed closure of its growth plate, among other conditions (TABLE 1).3,7,8
In more mature athletes, repetitive microtrauma to the ulnar collateral ligament (UCL) leads to its gradual attenuation or complete failure.7 This increases the stress on the radiocapitellar joint and olecranon, and can lead to edema, scarring, calcification, osteophyte formation, medial epicondylitis, ulnar nerve neurapraxia, or radiocapitellar chondral damage.9 Extended practices and tournaments, with no substantial rest period throughout the year, put adolescents at increased risk for UCL injuries.10
Regardless of age, the medical history of an athlete with elbow pain should elicit information about the mechanism of injury; the location, duration, and quality of the pain; factors that alleviate or exacerbate the pain; the presence of weakness or paresthesias; and the extent to which the pain has affected the patient’s ability to throw. Patients with chronic UCL injuries, for example, often report a loss of arm control and decrease in throwing speed. It is also important to address hand dominance, level of participation, the position played, changes in technique or training regimen, prior injuries, and the effects of any previous treatment.11
TABLE 1
Differential diagnosis of elbow injuries
| Location | Differential diagnosis |
|---|---|
| Medial | Little League elbow
|
| Anterior | Anterior capsule strain Biceps tendon rupture Biceps tendonitis Dislocation Median nerve compression (pronator) syndrome |
| Posterior | Olecranon bursitis Olecranon process or tip stress fracture Triceps rupture/olecranon avulsion Triceps tendonitis Trochlear rupture Valgus overload syndrome (posterior olecranon impingement syndrome) |
| Lateral | Capitellum fracture Lateral epicondylitis Lateral ulnar collateral ligament injury Osteochondritis dissecans Posterior interosseous nerve syndrome Posterolateral rotary instability Radial head fracture Radiocapitellar chondromalacia |
| Adapted from: McKeag DB, Moeller JL. ACSM’s Primary Care Sports Medicine. 2nd ed.3 | |
Compare the affected and uninjured extremities
Inspect, palpate, and assess the active and passive range of motion, strength, and neurovascular status of both arms, with the uninjured side serving as a comparison. The scapula, shoulder, and wrist are also involved in throwing, so these joints should be examined along with the elbow.
Measure range of motion. Normal ranges for the flexion-extension arc are 0 to 140°, with 75° of pronation and 82° of supination.12 Use a goniometer, if available, to ensure accuracy and reproducibility,1 and pay close attention to the position that elicits pain.
In medial epicondylitis, the full range of motion should be preserved. Patients experience pain at the medial epicondyle and overlying flexor-pronator mass proximately, and pain or weakness with resisted wrist flexion, and resisted pronation, at full extension.4,11 Flexor-pronator strain will produce similar findings, but edema or ecchymosis may be present and there may be pain immediately distal to the medial epicondyle.11
Pain associated with injury to the UCL—which courses distal and slightly posterior to the medial epicondyle—typically occurs 2 cm distal to the medial epicondyle over the anterior bundle. Tenderness over the UCL has a sensitivity of 81% to 94% for UCL tears, but a specificity of only 22%.13
Physical maneuvers can help identify source of elbow pain
A complete UCL tear can cause valgus gapping as small as 3 mm, which makes it difficult to detect on physical exam alone.4 Orthopedic and sports medicine literature recommend that 3 maneuvers be used to identify UCL pathology:4,14,15
The valgus stress test (FIGURE 1) assesses the effects of valgus stress on the UCL. Gapping >3 mm signifies UCL instability. The test has a sensitivity of 66% and a specificity of 60% for detecting a UCL strain or tear.13,16
The milking maneuver (FIGURE 2), performed by the patient (or by a clinician if the patient lacks flexibility), reproduces a common pitching exercise. Medial elbow pain or apprehension indicates UCL injury.13,16
The moving valgus stress test (FIGURE 3A-C) is done in an effort to recreate the flexion angles of the elbow during the late cocking and early acceleration phases of throwing. Pain anywhere in the arc of motion suggests a UCL injury; pain elicited at 45° of flexion suggests osteochondrosis of the humeral capitellum, while pain closer to full extension suggests osteochondrosis of the trochlea.13,16
FIGURE 1
Valgus stress test
With the injured elbow at 30° of flexion, the shoulder abducted and fully externally rotated, and the patient’s wrist under your arm, place one hand laterally over the elbow. Place the other hand under the ulna and the thumb over the ulnar collateral ligament and apply valgus stress. Gapping >3 mm is abnormal.
FIGURE 2
Milking maneuver
The patient grasps the thumb of the affected arm and pulls downward, with the affected elbow positioned as shown, stressing the ulnar collateral ligament (UCL). Elbow pain or apprehension is positive for UCL injury.
FIGURE 3
Moving valgus stress test
With the shoulder in abduction and maximum external rotation (A), place the elbow in maximum flexion and apply valgus force (B), and extend the elbow from full flexion to full extension (C) in an attempt to reproduce the medial pain.
Does your patient have 2 positive valgus tests and posterior pain?
Valgus extension overload syndrome, which is caused by repetitive stress and results in osteophytes, chondromalacia of the medial olecranon fossa, tension in the UCL, and compression of the radiocapitellar joint, will also produce positive valgus stress and positive moving valgus stress tests. Keep in mind, however, that patients with valgus extension overload often have loss of full extension and posterior elbow pain with forced elbow hyperextension.17
Look for ulnar nerve injury
The physical examination should also be used to test for ulnar nerve injury. The elbow flexion test—a provocative maneuver in which the patient flexes the elbow as far as possible and reports any tingling or numbness of the hand—should be included in the work-up. Symptoms that develop in <60 seconds indicate a positive test for ulnar nerve compression, with the pinky and ulnar half of the ring finger most likely to have loss of vibration and light touch perception. A positive Tinel’s sign over the cubital tunnel is an indication of ulnar neuritis.18
If the ulnar nerve moves out of the ulnar groove when the groove is palpated as the elbow is flexed and extended, subluxating ulnar nerve is the likely diagnosis. If 2 structures displace over the medial epicondyle with elbow flexion, the first will be the ulnar nerve and the second will be the medial head of the triceps—an indication of a snapping medial head of triceps.18
Imaging studies may require a second look
Imaging studies are sometimes used to further aid in diagnosis of elbow injury. However, standard elbow x-rays, including an anteroposterior view in full extension, an oblique view, and a lateral view at 90° flexion, can be deceiving, as they often appear normal in conditions causing medial elbow pain associated with overhead throwing.
Careful review of the images may be needed to rule out fracture and other conditions, keeping the following factors in mind:
- A supracondylar fracture is likely if the anterior humeral line that is drawn along the anterior surface of the humeral cortex (on a lateral view) does not transect the middle third of the midcapitellum.3,11,18
- Dislocation of the radial head is suggested if the radiocapitellar line (drawn through the center of the radial head and neck) does not transect the midcapitellum on a lateral view.3,11,18
- Intra-articular injury with a joint effusion is indicated when an enlarged anterior fat pad, which is slightly anterior to the distal humeral diaphysis, is visible (the “sail sign”) on a normal elbow radiograph.3,11,18
- A fracture is likely if a posterior fat pad (which lies in the olecranon fossa and is not usually visible unless an effusion elevates the fat pad away from the cortex) is visible on an elbow x-ray. 3,11,18
- A chronic UCL tear is suggested by heterotropic calcification of the UCL.19
It is useful to x-ray both the injured and the unaffected elbows in skeletally immature athletes to compare secondary ossification centers. Little League elbow demonstrates a widening of the medial epicondyle physis, for example, when the x-rays are compared.3 Secondary ossification centers of the elbow appear first at the capitellum (age 2), followed by the radial head (age 5), medial epicondyle (age 7), trochlea (age 9), and lateral epicondyle (age 11). Most ossification centers fuse between 14 and 17 years of age.3
Computed tomography arthrograms, magnetic resonance imaging (MRI), and ultrasonography are also used to identify UCL tears. MRI, which can reveal injuries to cartilage and tendons as well, is the most commonly used imaging technique for musculoskeletal diagnosis of the elbow.16,20
Treatment gets most athletes back on track
Most medial elbow injuries respond to conservative treatment—typically, with some combination of activity modification, nonsteroidal anti-inflammatory drugs (NSAIDs), icing, physical therapy aimed at flexor-pronator strengthening, and counterforce bracing.11 Medial epicondylosis and flexor-pronator strain injuries have an excellent prognosis, with more than 90% of patients back to their previous level of activity at 1 year. Initial treatment consists of a 2- to 3-week rest period, followed by a 6- to 12-week rehabilitation protocol.11
Randomized controlled trials have found limited evidence of short-term improvement in symptoms with corticosteroid injections compared with placebo or no treatment, local anesthetic, orthosis, physical therapy, and NSAIDs. However, corticosteroids were less effective than physiotherapy or oral NSAIDs in improving long-term outcomes.21 Despite a paucity of well-designed studies to prove their use, autologous blood, platelet-rich plasma, and botulinum toxin are sometimes used for refractory elbow pain.21
Treatment of Little League elbow consists of cessation of throwing for at least 4 to 6 weeks, with a gradual return to throwing and emphasis on proper throwing mechanics after the pain resolves. Most throwers are out of competition for 2 to 3 months, but fully recover with nonoperative management.21
UCL injuries, too, are initially treated with rest, NSAIDs, icing, bracing, and physical therapy, typically with 2 to 3 months of no throwing. Some patients also use a splint at 90° flexion at night and as needed for pain during the day. Patients whose symptoms last more than a year despite treatment may be candidates for arthroscopic debridement.11
Consider reconstruction when nonsurgical management fails
UCL reconstruction was introduced in 1974, when reconstruction was performed on professional pitcher Tommy John, who went on to win 164 games.4,9 The procedure has since undergone numerous modifications. Surgery is indicated for acute rupture, significant chronic instability, insufficient UCL tissue after debridement, or recurrent pain and valgus instability with throwing after rehabilitation.2,4,6,9
Reconstruction generally entails fixing a tendon graft through bone tunnels in the medial epicondyle of the humerus and sublime tubercle of the ulna to reestablish valgus stability. A recent systematic review of reconstruction methods found a 76% to 95% rate of excellent results, with patients returned to their prior level of activity at a mean follow-up of 1 year.22 Rehabilitation typically begins 7 days postop; throwing (without windup) may begin in 4 to 5 months, with a gradual increase in speed and force and a return to the game at 12 months.
A stepped-up focus on prevention
The increase in UCL injuries in adolescents highlights the need for greater emphasis on prevention.10 Several governing bodies, including USA Baseball and the American Academy of Pediatrics, have developed research-based guidelines for young athletes (TABLE 2).1,10,23-25
One of the easiest to follow is to limit an athlete’s weekly pitch count to 10 times his age. Thus, a 10 year old should pitch no more than 100 pitches in a given 7-day period. Another important measure—in addition to ensuring that young athletes receive instruction in proper pitching mechanics (see http://www.littleleague.org/Little_League_Online.htm)—is to urge coaches and parents to require players to get at least 3 months of rest after each season and to stop throwing if they have pain or fatigue.24
TABLE 2
Keeping young pitchers injury-free1,10,23-25
| Recommendations for coaches and parents |
|---|
| Record the number of pitches thrown at each outing/sports event for all young pitchers |
| Avoid allowing young athletes to pitch competitively >8 months per year |
| Limit the number of pitches to ≤2500 per year and 10 × the pitcher’s age per week, or 90 per outing |
| Ensure that young pitchers are instructed in proper pitching mechanics |
| Restrict throwing breaking ball pitches* prior to puberty |
| Ensure that young pitchers get 3 months of rest per year. |
| *A pitch that changes direction either sideways or downwards as it approaches the batter, eg, a slider or curve ball. |
CORRESPONDENCE
Jennifer A. Southard, MD, MSc, Saint Alphonsus Medical Group, 6533 Emerald Street, Boise, ID 83704; [email protected]
1. American Academy of Pediatrics Committee on Sports Medicine and Fitness. Risk of injury from baseball and softball in children. Pediatrics. 2001;107:782-784.
2. Maloney MD, Morhr KJ, el Attrache NS, et al. Elbow injuries in the throwing athlete. Clin Sports Med. 1999;18:795-809.
3. McKeag DB, Moeller JL. ACSM’s Primary Care Sports Medicine. 2nd ed. Philadelphia, PA: Lippincott Williams & Wilkins; 2007:387–402.
4. Hariri S, Safran MR. Ulnar collateral ligament injury in the overhead athlete. Clin Sports Med. 2010;29:619-644.
5. Park MJ, Kim HG, Lee JY. Surgical treatment of post-traumatic stiffness of the elbow. J Bone Joint Surg Br. 2004;86:1158-1162.
6. Lin F, Kohli N, Perlmutter S, et al. Muscle contribution to elbow joint valgus stability. J Shoulder Elbow Surg. 2007;16:795-802.
7. Fleisig GS, Andrews JR, Dillman CJ, et al. Kinetics of baseball pitching with implications about injury mechanisms. Am J Sports Med. 1995;23:233-239.
8. Baker CL, Romero AA. Osteochondritis dissecans of the capitellum. Am J Sports Med. 2010;38:1917-1928.
9. Cain EL, Andrews JR, Dugas JR, et al. Outcome of ulnar collateral ligament reconstruction of the elbow in 1281 athletes: results in 743 athletes with minimum 2-year follow-up. Am J Sports Med. 2010;38:2426-2434.
10. Fleisig GS, Andrews JR, Cutter GR, et al. Prevention of elbow injuries in youth baseball pitchers. Curr Sports Med Rep. 2009;8:250-254.
11. Madden CC, Putukian M, McCarty E, et al. Netter’s Sports Medicine. Philadelphia, PA: Saunders Elsevier; 2010:360–367.
12. Boone DC, Azen SP. Normal range of motion of joints in male subjects. J Bone Joint Surg Am. 1979;61:756-759.
13. Timmerman LA, Schwartz ML, Andrews JR. Preoperative evaluation of the ulnar collateral ligament by magnetic resonance imaging and computed tomography arthrography. Evaluation in 25 baseball players with surgical confirmation. Am J Sports Med. 1994;22:26-31.
14. Mehlhoff TL, Bennet JB. Elbow injuries. In: Mellion MB, Walsh WM, Shelton GI, eds. The Team Physician’s Handbook. 2nd ed. Philadelphia, PA: Hanley & Belfus; 1997:461–473.
15. O’Connor FG, Ollivierre CO, Nirschl RP. Elbow and forearm injuries. In: Lillegard WA, Butcher KS, eds. Handbook of Sports Medicine: A Symptom-Oriented Approach. 2nd ed. Boston, MA: Butterworth-Heinemann; 1999:141–157.
16. Safran MR, Greene H, Lee TQ. Comparison of elbow valgus laxity using radiographic and non-radiographic objective measurement. 73rd Annual Meeting of the American Academy of Orthopaedic Surgeons; May 22, 2006; Chicago, IL.
17. Ahmad CS, El Attrache NS. Valgus extension overload syndrome and stress injury of the olecranon. Clin Sports Med. 2004;23:665-676.
18. Sarwart JF. Essentials of Musculoskeletal Care. 4th ed. Rosemont, IL: American Academy of Orthopaedic Surgeons; 2010:384–387.
19. Mulligan SA, Schwartz ML, Broussard MF, et al. Heterotopic calcification and tears of the ulnar collateral ligament: radiographic and MR imaging findings. AJR Am J Roentgenol. 2000;175:1099-1102.
20. Tuite MJ, Kijowski R. Sports related injures of the elbow: an approach to MRI interpretation. Clin Sports Med. 2006;25:387-408.
21. Rineer CA, Ruch DS. Elbow tendinopathy and tendon ruptures: epicondylitis, biceps and triceps ruptures. J Hand Surg Am. 2009;34:566-576.
22. Vitale MA, Ahmad CS. The outcome of elbow ulnar collateral ligament reconstruction in overhead athletes: a systematic review. Am J Sports Med. 2008;36:1993-205.
23. Olsen SJ, Fleisig GS, Dun S, et al. Risk factors for shoulder and elbow injuries in adolescent baseball pitchers. Am J Sports Med. 2006;34:905-912.
24. Lyman S, Fleisig GS, Andrews JR, et al. Effect of pitch type, pitch count, and pitching mechanics on risk of elbow and shoulder pain in youth baseball pitchers. Am J Sports Med. 2002;30:463-468.
25. Fleisig GS, Andrews JR, Cutter GR, et al. Risk of serious injury for young baseball pitchers: a 10-year prospective study. Am J Sports Med. 2011;39:253-257.
The Where and Why of Postsurgical Adhesions
The prevention of postsurgical adhesions is one of the greatest unmet needs in medicine today. Surgical series have shown that adhesions are present after 80%-90% of abdominal and pelvic surgeries, and that these abnormal fibrous connections have a tremendous propensity to reform after adhesiolysis. (We will define adhesions here as “attachments between surfaces at nonanatomical locations.”)
In gynecologic surgery, postoperative adhesions are a frequent cause of infertility, pain, bowel obstruction, and difficulty in later procedures. Adhesions can occur after minimally invasive procedures, which have the potential for trocar injury to structures adherent to the anterior abdominal wall. Other intraoperative injuries can occur due to obscured normal anatomy or restricted access. A significant number of patients also undergo second surgeries to treat sequelae that are directly related to adhesions.
The literature is replete with studies of adhesion development and reports of its incidence and its consequences. Still, the problem of postoperative adhesion development often goes underestimated or unrecognized. This is because we don't routinely perform early second-look operations to assess adhesion development, and because there are no serum markers or sensitive imaging techniques to allow their identification. In addition, we do not follow our patients who seek care from other providers as insurance coverage changes or as other health problems arise, such as bowel obstruction being treated by a general surgeon.
As gynecologic surgeons, we must appreciate that while infections, endometriosis, and other peritoneal insults may contribute to adhesion development, surgery is the most common cause. We also must appreciate how tissue injury leads to the development of adhesions, and why adhesion reformation so commonly occurs.
This understanding is critical to our consideration and use of the “barrier” products currently available for reducing postsurgical adhesions — and critical to our efforts to employ the tenets of gynecologic microsurgery and to achieve as optimal a surgical outcome as possible. At this point in time, use of approved surgical adjuvants in combination with good surgical technique offers the best chance at adhesion reduction and prevention.
Incidence of Adhesions
A series of reports published in the early to mid-1980s documented how commonly adhesions develop after various types of reproductive pelvic surgery. Through early second-look laparoscopy, postoperative adhesions were found to occur, in these studies, in 55%–100% of patients after their primary gynecologic surgery.
In a multicenter study published in 1987, my colleagues and I also showed that gynecologic surgeries performed at the time of laparotomy are frequently complicated by both adhesion reformation and de novo adhesion formation. More than half of the 161 women (51%) who had a second-look laparoscopy 1–12 weeks after reproductive pelvic surgery were found to have de novo adhesion formation (adhesions in at least one new location). Adhesion reformation was also widespread: At the initial laparotomy, 121 of the patients (all of whom were treated for infertility) were noted to have some form of adhesion, and adhesion reformation subsequently occurred at the site of adhesiolysis in 85% of these women, with no differences with respect to adhesion type (Fertil. Steril. 1987;47;864–6).
It was hoped, and largely expected, that the growth of laparoscopy and minimally invasive surgery approaches in more recent years would reduce postoperative adhesion development — that minimally invasive techniques would prove to be less adhesiogenic than laparotomy. Questions remain, but thus far, such hopes have diminished and our expectations for significant improvement have gone unsubstantiated.
One multicenter study on adhesion development after initial laparoscopic procedures found that the incidence of adhesions at an early second-look procedure was 97% — no lower than in prior reports of second-look laparoscopy after laparotomy.
In this study, 68 women underwent operative laparoscopic procedures, including adhesiolysis, and had second-look procedures within 90 days. The good news was that de novo adhesion formation between the two laparoscopic procedures occurred in only 8 of the women (12%) and at 11 of 47 possible sites — much less frequently than after laparotomy. Adhesion scores also decreased at the second look compared with the status of the pelvis at the initial procedure. Still, with the high rate of adhesion reformation, almost all of the women developed postoperative adhesions.
Thus, even when the initial procedure was performed laparoscopically, adhesion development was an all-too-common occurrence, and appeared to be independent of the character of the initial adhesion (Fertil. Steril. 1991;55:700–4).
More recently, data from randomized studies of various adhesion barriers and potential anti-adhesion adjuvants have further dashed hopes that laparoscopy per se can reduce adhesion development.
For instance, in a recent small pilot study of a fibrin-based product called Adhexil, “control” ovaries that were not treated had a 27% increase in the mean adhesion score between an initial laparoscopic procedure and second-look laparoscopy. The women in the study had undergone bilateral ovarian surgery, with ovaries randomized for application of the product or no treatment (Fertil. Steril. 2011;95:1086–90). Clearly, a laparoscopic approach to their procedures did not prevent the development of adhesions.
Many of the initial studies on adhesion development were comprised of patients with infertility, but more recent observations have been extended to women without infertility and to men. Studies have covered patients undergoing colectomies, for instance, as well as neonates undergoing cardiothoracic procedures.
In a recent review article on adhesion prevention and reduction, members of an interdisciplinary consensus conference stated that adhesions develop after “nearly all” abdominal and pelvic procedures performed through either standard laparotomy or laparoscopic approaches. With respect to gynecologic surgery, they point out, research has shown that the most common site for postsurgical adhesion development is the ovary (Surg. Innov. 2010;17:183–8).
Consequences
Pelvic adhesions are a well-recognized cause of infertility, contributing to up to an estimated 40% of the cases of infertility in women. Adhesions are also a leading cause of bowel obstruction and a significant cause of chronic or recurrent pelvic pain.
The contribution of pelvic adhesions to chronic pelvic pain is not completely understood. Adhesions may be the cause of pain in some women, and in other women, an incidental finding that is not contributing to pain. In patients who have endometriosis as well, the question remains as to the contribution of endometriosis per se, or adhesions, to the pain. Endometriosis can cause adhesions and chronic pelvic pain, presumably through the cyclic generation of inflammatory molecules.
The relationship between chronic pain and adhesions is further complicated by ensuing questions about the efficacy of adhesiolysis. The two randomized trials that have thus far examined the role of adhesiolysis in the reduction of chronic pelvic pain failed to demonstrate a significant improvement in pain after adhesiolysis; however, the high failure rates after follow-up may be due to adhesion reformation and de novo adhesion formation (Fertil. Steril. 2004;82:1483–91). Performance of more randomized comparisons in the future may yield improved outcomes when adhesiolysis is paired with postprocedure use of anti-adhesion adjuvants.
Despite the uncertainties, multiple studies support the current estimation that adhesions cause or significantly contribute to chronic pelvic pain in up to 30% of women with the problem. As the Ovarian Adhesion Study Group noted in one of its reports, adhesions have been reported as a primary cause of chronic pelvic pain in 13%-36% of women, depending on the study (Obstet. Gynecol. 1995;86:335–40). Economic analyses also have quantified the impact of adhesion-related hospital readmissions. A study done in the United Kingdom, for instance, concluded that 6% of all hospital readmissions in patients who had undergone abdominal or pelvic surgery were directly related to adhesions (Lancet 1999;353:1476–80).httother report on hospitalizations for lower abdominal adhesiolysis in the United States estimated that in 1988, the cost of adhesions stemming from gynecologic procedures alone was almost $1.2 billion. This estimate did not include outpatient and indirect costs (Surg. Gynecol. Obstet. 1993;176:271–6).
Why, How Adhesions Develop
Our current understanding is that adhesions develop as a result of injury to and devascularization of the peritoneum, and the subsequent inflammatory response and peritoneal wound healing process. Tissue hypoxia triggers a cascade of intracellular responses that, in combination with the fibrinous collection of blood and serosanguinous fluid at the tissue surface, may result in adhesion development.
In the initial postsurgical period, either overt bleeding or oozing may occur at the site(s) of tissue injury, forming clots. In combination with serosanguinous fluid, which may leak from damaged peritoneal surfaces, a fibrinous mass thus develops at the surgical sites and sites of tissue injury. This represents an initial step in peritoneal repair.
When surrounding tissue is normal and there is a sufficient amount of plasminogen activator present in the peritoneum — and when numerous other events and conditions are optimal — the resulting fibrinous mass can be degraded. As that occurs, and tissue healing continues, fibroblasts are recruited to the surface of the injury site from underlying tissues.
If the fibrinous mass is no longer present, fibroblasts “stop” at the tissue surfaces, and become covered by mesothelial cells which line the peritoneal surface as the process of remesothelialization occurs. This process appears to be initiated within hours after surgery and is generally believed to be completed in 3–5 days. (In such instances, healing would have occurred without adhesions, although subperitoneal fibrosis may have occurred.)
Various hypoxia-driven responses, however, such as a reduction in plasminogen activator activity, can cause the fibrinous mass to persist during the healing process, before remesothelialization occurs. In this case, fibroblasts migrate not only to, but through, the injury site, and into the persisting fibrinous mass. This is subsequently followed by deposition of collagen, fibronectin, and other extracellular matrix materials — creating the beginnings of a true adhesion.
In such cases, remesothelialization still occurs, but the mesothelial cells cover the adhesion as well as the normal tissue surfaces, forming adhesive bands and other types of connections between opposing serosal tissue surfaces. Angiogenesis then occurs as the hypoxic tissue in the adhesion sends signals (such as vascular endothelial growth factor) in an attempt to reestablish a supply of oxygen and nutrients to the injured and devascularized tissues. Subsequently, as the tissue remodels, there is a propensity for the adhesion to become more vascular and denser.
Understanding this process is important because the products currently available for reducing adhesions act as barriers during this critical period of remesothelialization, keeping peritoneal surfaces apart and minimizing the potential development of a fibrinous mass that bridges tissue surfaces. If an adhesion does not form during the 3–5-day period of remesothelialization, it is theorized that there will not be any adhesion development — unless there's new injury to the tissue surfaces.
Once an adhesion forms, however, it has acquired a particular “adhesion phenotype” — different from that of normal peritoneum — that appears to be irreversible. This is likely why it is so difficult to prevent adhesion reformation after adhesiolysis. Rates of adhesion reformation — even in the best of surgical hands — run between 80% and 90%, compared with a 50% chance of de novo adhesion development after surgery (at new sites of injury).
The identification of an adhesion phenotype came originally from comparisons of normal peritoneal and adhesion tissues harvested from the same patient, and were later confirmed in cell culture studies in which normal peritoneal fibroblasts were subjected to hypoxia (2% O2 conditions). Fibroblasts cultured under hypoxic conditions were subsequently found to have developed particular molecular biologic characterizations that are different from those of normal peritoneal fibroblasts.
When exposed to normal amounts of oxygen again, the fibroblasts did not go back to being normal fibroblasts — they continued to manifest the adhesion phenotype (J. Am Assoc. Gynecol. Laparosc. 2004;11:307–14). These findings have been confirmed in animal and human studies, and such relationships have also been identified in other peritoneal tissue types such as mesothelial cells and macrophages.
Further research on the pathogenesis of adhesions and the molecular biologic differences between normal peritoneum and adhesions may allow identification of which patients, and which sites within a patient, are most at risk for adhesion development, as well as the discovery of new ways to reduce the development of postoperative adhesions and their clinical sequelae.
It is possible that a future generation of barrier products not only will work as a barrier separating surfaces prior to remesothelialization, but will also have local biologic effects — delivering adhesion-reducing drugs or biologics, for instance, to specific localized tissue sites. A personalized approach to adhesion prevention also might be possible, with particular factors deemed to increase adhesion risk in individual patients (a deficiency of plasminogen activator, for instance) being corrected.
In the meantime, as we've learned more about the pathophysiological state under which adhesions develop, we have found that adhesion development may occur faster than we had thought. In one recent rodent study, we identified postoperative tissue attachments as early as 2 hours after cecal abrasion. We noted considerable local edema and vessel dilatation within 2 hours of injury, angiogenesis and fibrin deposition at 8 hours, and cell proliferation at 24 hours (Fertil. Steril. 2010;93:2734–7). And interestingly, recent studies in mice have shown that laparoscopic insufflation per se can induce peritoneal adhesions, with the adhesions increasing proportionally with both increasing duration of insufflation and an increase in intraperitoneal pressure.
Prevention in Practice
During the past decade a variety of surgical adjuvants — from procoagulants and fibrinolytic agents to anti-inflammatory drugs and antibiotics — have been investigated for use in reducing the occurrence, extent, and severity of adhesions. Unfortunately, most approaches seemingly have been futile. Some products have shown trends toward efficacy in animal or early human studies and need further investigation.
The three synthetic products that are approved by the Food and Drug Administration—Gynecare Interceed, Seprafilm, and Adept — can help reduce postoperative adhesions after gynecologic procedures, and should be considered as potentially useful surgical adjuvants. A meta-analysis of studies of Gynecare Interceed, for instance, found that approximately twice as many operative sites were adhesion free after use of the barrier than after surgery alone (J. Reprod. Med. 1999;44:325–31).
Gynecare Interceed (Johnson & Johnson) and Seprafilm (Genzyme) are approved for use only at laparotomy, while Adept (Baxter International), an icodextrin solution that disperses throughout the abdominopelvic cavity, is approved for use only in laparoscopic surgery.
The key consideration to make when using Interceed — a biodegradable woven fabric composed of oxidized, regenerated cellulose — is the importance of achieving meticulous hemostasis. Its efficacy is reduced, or can even be lost, in the presence of blood. Care also must be taken not to stretch the material or alter its shape and the spacing between the weaves. Otherwise, the material, once gelated, will have a greater potential for spaces in which the tissue surfaces would not be separated and thus a greater potential for blood coagulation and fibroblast in-growth. Multiple pieces of the material may be overlapped, but there have been no benefits demonstrated (at least in animal studies) to using double layers.
Care in application also is critically important for Seprafilm, a film composed of modified hyaluronic acid and carboxymethylcellulose. Seprafilm is brittle and is difficult to apply through small incisions. While it's not impossible to deliver the product laparoscopically, many surgeons have found this very difficult. And in the United States, it is approved for use with laparotomy only.
In applying Seprafilm, it is critical to first get good exposure of the field and then position the film very carefully. Attempts to reposition the product will often result in tears or breaks. Of course, just as with Interceed, this device is believed to work primarily by separating tissue surfaces, and thus it has little to no chance of success if it does not completely separate the surgically injured tissue from other tissue surfaces in the initial postoperative period while remesothelialization is occurring.
The use of adjuvants, moreover, is no substitute for good surgical technique that aims to minimize tissue injury, tissue devascularization, and inflammation. This is easier to achieve, of course, during a microsurgical procedure such as a tubal anastomosis than in a patient with severe endometriosis or many large fibroids. Still, to the extent possible for the procedure being conducted, the tenets of gynecologic microsurgery should always be considered:
▸ Handle as little tissue as possible, as minimally as possible. To the extent possible, handle only those portions that will subsequently be excised.
▸ Keep tissues moist. Tissue drying leads to injury and loss of mesothelial cells. Raw surfaces are more prone to develop adhesions.
▸ Take special care in the use of suture. Consider whether clinical situations will allow use of less reactive and smaller-caliber suture. When using suture to tie off blood vessels, skeletonize the vessels so as to minimize the amount of tissue distal to the suture that will become hypoxic and serve as a nidus to adhesion development.
▸ Target the use of electrosurgery and other energy sources. Use it in specific localized sites where it's needed, such as to stop bleeding, but avoid widely dispersed use, when possible, again to minimize the amount of residual devitalized tissue remaining in the pelvis at the conclusion of the surgical procedure.
Pelvic Adhesions — An Update
“A number of human interventional trials and animal studies have evaluated techniques and materials designed to prevent and reduce postsurgical adhesions. The results have been inconclusive and sometimes contradictory. Thus, preventing postsurgical adhesions remains an art, rather than a science.” So I began my introduction to the program on adhesion prevention at the 2010 Congress of the Society of Laparoscopic Surgeons in New York City.
Patients with adhesions can present with small bowel obstruction or with complaints of infertility, chronic pain, or dyspareunia. Unfortunately, adhesive disease is problematic. Four percent of the patients undergoing abdominal and pelvic surgery will be readmitted due to adhesion-related complications. In excess of 400,000 surgical procedures are performed annually in the United States for lysis of adhesions. In a Scottish National Health Service Study of nearly 9,000 women who previously underwent open gynecologic surgery, just less than 3% were readmitted secondary to adhesions; the highest readmit rate was ovarian surgery (BJOG 2000;107:855–62).
While one would expect a reduction in the number of patients undergoing laparoscopic surgery, in reality, the verdict is not yet clear. A 1998 meta-analysis showed a decrease in both reformed (26.6% vs. 14.3%) and de novo adhesions (45.2% vs. 37.2%) in the laparoscopic group, compared with laparotomy (Fertil. Steril. 1998;70:702–11).
Despite this, other authors cite pneumoperitoneum, prolonged surgery, high insufflation pressure, and overzealous use of energy to cut and coagulate as reasons why laparoscopic surgery increases risk of adhesions.
The economic impact of adhesions is staggering, in excess of $1.3 billion in the United States per year.
For this current excerpt of the Master Class in Gynecologic Surgery, I have solicited the wisdom of Dr. Michael Diamond. He is the Kamran S. Moghissi Professor of Obstetrics and Gynecology and associate chairman of the department of obstetrics and gynecology at Wayne State University, Detroit. Dr. Diamond also is director of the division of reproductive endocrinology and infertility and assistant dean for clinical and translational research at the university. Dr. Diamond has spent much of his academic career involved in the pathogenesis, prevention, and treatment of pelvic adhesions. He is truly considered the world's leader in this area, and we are honored to have Dr. Diamond as guest author of this important area of our surgical arena.
Who Should Run Our Hospitals?
Over the past century, the management of American hospitals has changed dramatically. These changes have occurred as a result of major shifts in the social and financial environment and have had a major effect on how medicine was practiced in the past and how it will be practiced in the future.
The American hospital as we know it today was established in the late 19th and early 20th centuries largely by the Catholic, Protestant, and Jewish communities to provide care for the elderly and chronically ill patients who otherwise would not be cared for at home.
With the development of surgical techniques from tonsillectomies to cholecystectomies in the mid-20th century, they became the workshop of general surgeons, who largely controlled the hospitals. With the subsequent development of antibiotics and medical treatment for cardiovascular disease, the internal medicine specialties demanded a larger role in institutional management.
The increased complexity and expense of medical care led to concerns about how to provide a financial base for medical care and led to the establishment of private medical insurance programs, and ultimately, to Medicare and Medicaid. Hospitals were no longer concerned about being a health resource but suddenly became a profit center. Community hospitals expanded in order to meet the needs of new technologies with the support of grants and loans from the federal government.
With this growth, the management of the hospital of the 20th century required the creation of a new breed of hospital staff: the hospital administrator. They were hired to manage the financial and administrative aspects of these new and growing organizations. Although the hospital administration was structured to provide equipoise between the medical and financial priorities of the hospital, that balance was not easily maintained, and as the financial aspects became central, the hospital administrator became supreme and physicians lost control.
Today, the American hospital has become central to the support of nonprofit and for-profit regional and national health care conglomerates, and control has become the province of boards of directors with little medical input and larger community control. As a consequence, the physician has now become a real or quasi-employee of the hospital.
In a recent perspective paper, Dr. Richard Gunderson (Acad. Med. 2009;84:1348-51) emphasizes the need to train physicians to provide leadership for the future management of the hospital. He points out that in 1935, physicians were in charge of 35% of the nation's hospitals, but that number has shrunk to 4% of our current 6,500 U.S. hospitals. The academic medical community has largely ignored its role in preparing medical students for administrative leadership as it focused on the clinical knowledge required for the medical competence.
Dr. Gunderson, of Indiana University in Indianapolis, advocates the identification of student leaders in the selection of medical students and proposes the inclusion of courses in medical finance and social issues in the medical school curriculum in order to prepare them for a leadership role in redefining the future of medical care and hospital management.
Amanda Goodall, Ph.D., a senior research fellow at the Institute for the Study of Labor in Bonn, Germany, provides an even more challenging analysis of the importance of medical leadership at the hospital (Social Science Med. 2011;73:535-9). She notes that these changes in leadership are not unique to the United States but also have taken place in European hospitals. Using a quality scoring system, she analyzed the quality performance of 100 of the U.S. News and World Report's Best Hospitals 2009 in the fields of cancer, digestive disorders, and heart and heart surgery. She found a positive correlation between hospital quality ranking and physician CEO leadership.
Those of us who have grown up through this management evolution have seen its real impact on the care of hospital patients. Some of the changes have been positive, while others have proved frustrating for both patients and physicians who practice in the new environment.
The need for leadership by those of us who have direct patient care responsibilities is essential for an inclusive decision-making process. When patient care comes to discussion at the board meeting, physicians and nurses bring to the process a perspective that only they can provide. It is essential that their voices be heard.
Team corrects SCD mutation with iPS cells

Credit: James Thomson
Using induced pluripotent stem (iPS) cells, researchers have corrected the genetic alteration that causes sickle cell disease (SCD).
The corrected stem cells were coaxed in vitro into immature red blood cells that then turned on a normal version of the gene.
The researchers caution that the work is years away from clinical use in patients, but it should provide tools for developing gene therapies for SCD and a variety of other hematologic disorders.
“We’re now one step closer to developing a combination cell and gene therapy method that will allow us to use patients’ own cells to treat them,” said lead study author Linzhao Cheng, PhD, of The Johns Hopkins School of Medicine.
Using an adult patient at The Johns Hopkins Hospital as their first case, the researchers isolated the patient’s bone marrow cells. After generating iPS cells from the bone marrow, the team put a normal copy of the hemoglobin gene in place of the defective one using genetic engineering techniques.
The researchers sequenced the DNA from 300 different samples of iPS cells to identify those that contained correct copies of the hemoglobin gene and found 4. Three of these iPS cell lines didn’t pass muster in subsequent tests.
“The beauty of iPS cells is that we can grow a lot of them and then coax them into becoming cells of any kind, including red blood cells,” Dr Cheng said.
In their process, his team converted the corrected iPS cells into immature red blood cells by giving them growth factors. Further testing showed that the normal hemoglobin gene was turned on properly in these cells, although at less than half of normal levels.
“We think these immature red blood cells still behave like embryonic cells and, as a result, are unable to turn on high enough levels of the adult hemoglobin gene,” Dr Cheng said. “We next have to learn how to properly convert these cells into mature red blood cells.”
This research was recently published online in Blood. ![]()
AD Myths in Healthcare Debate
All new legislation concerning advance care planning was removed from the Affordable Care Act, signed into law in March 2010. However, through a Medicare payment regulation, Centers for Medicare and Medicaid Services (CMS) was able to add a provision allowing compensation to physicians for advance directive (AD) discussions as part of the annual Medicare wellness exam. Previously, under President George W. Bush, funding for AD discussions was already part of the Welcome to Medicare visit. Once again, the provision was misrepresented and distorted in the media, talk radio shows, and social networking sites. Within days of the announcement, the White House removed the regulation stating that the controversy surrounding the provision was distracting from the overall debate about healthcare. The term death panels has now entered our national lexicon and serves to undermine the efforts of the palliative care field which, through discussions with patients and families, attempts to provide care consistent with patients' goals.
In fact, ADs have been a cornerstone of ethical decision making, by supporting patient autonomy and allowing patient wishes to be respected when decisional capacity is lacking. Advance directives may include a living will, a Medical Durable Power of Attorney, or may be a broader more comprehensive document outlining goals, values, and preferences for care in the event of decisional incapacity. ADs allow patients to express preferences that incorporate both quantity and quality of life, as there are times when interventions at the end of life may increase length of life to the detriment of quality of life. In this context, patients may chose to value quality of life and request the interventions be withdrawn that focus on maintaining life without hope for quality of life. ADs also permit patients who prefer quantity over quality of life to communicate these wishes. These conversations are complex and time‐consuming. Patients may have profound misperceptions about the benefits offered by interventions at the end of life. Having detailed conversations with healthcare providers about actual benefits, risks, and alternatives has been shown to impact that decision‐making process.1 In our current payment system, these time‐consuming conversations are not compensated by private or public insurers, and are incompatible with 20‐minute appointments, so they rarely occur.24 While Nancy Cruzan and Terri Schiavo brought national attention to the issue for a brief time, recent data suggest that only 30% of adults have completed an AD,57 however, 93% of adults would like to discuss ADs with their physician.8 Furthermore, Silveira et al. showed that older adults with ADs are more likely than those without ADs to receive care that is consistent with their preferences at the end of life.9 ADs were the sole predictor of concordance between preferred and actual site of death in a cohort of seriously ill, hospitalized patients.10 Patients with advanced cancer who discussed their end of life wishes with their physician were more likely to receive care consistent with their preferences.11
Advance directives are based on the ethical principle of autonomy and, with the growing evidence that ADs may improve care at the end of life, public understanding of the issue is critical. We had presented early preliminary data in a letter to the editor showing that having had an advance directive discussion or an AD in the medical record was not associated with an increased risk of death.12 This research, along with the work of Silveira and colleagues,9 was cited by the Obama administration when they decided to add the regulation for including advance care planning as part of the annual Medicare wellness exams. This brief report presents a more comprehensive examination of the relationship of AD discussions and AD documentation with survival in a group of hospitalized patients.
METHODS
Study Sites and Participant Recruitment
This was a multisite, prospective study of patients admitted to the hospital for medical illness. The Colorado Multi‐Institutional Review Board approved this study.
Over a 17‐month period starting in February 2004, participants were recruited from 3 hospitals affiliated with the University of ColoradoDenver Internal Medicine Residency program: the Denver Veterans' Administration Center (DVAMC); Denver Health Medical Center (DHMC), the city's safety net hospital; and University of Colorado Hospital (UCH), an academic tertiary, specialty care and referral center. Exclusion criteria included: admission <24 hours, pregnancy, age <18 years, incarceration, spoke neither English nor Spanish, lack of decisional capacity. Recruitment was done on the day following admission to the hospital throughout the year, to reduce potential bias due to seasonal trends. A trained assistant recruited on variable weekdays (to allow inclusion of weekend admissions). Of 842 admissions occurring during the recruitment, 331 (39%) were ineligible (175 discharged and 2 died within 24 hours postadmission; 76 lacked decisional capacity; and 78 met other exclusion criteria listed above). All other patients (n = 511) were invited to participate and 458 patients consented.
Participant Interview and Measures
Fifty‐three (10%) refused; 458 gave informed consent and participated in a bedside interview, including questions related to advance care planning. In this interview, participants were first asked to define an AD. Their response was either confirmed or corrected using a standard simple explanation that defined and described ADs:
An advance directive is a document that lets your healthcare providers know who you would want to make decisions for you if you were unable to make them for yourself. It can also tell your healthcare providers what types of medical treatments you would and would not want if you were unable to speak for yourself.
They were then asked if any healthcare provider had ever discussed ADs with them (AD discussion is a primary variable of interest).
Chart Review and Vital Records Data Collection
We reviewed each medical record to determine admitting diagnoses, CARING criteria (a set of simple criteria developed by our group to score the need for palliative care, which has been shown to predict death at 1 year),13 socioeconomic and demographic information, and the presence of ADs in the medical record (documentation of AD is a primary variable of interest). We defined ADs broadly, including: living will, durable power of attorney for healthcare, or a comprehensive advance care planning document (eg, Five Wishes). The CARING criteria are validated criteria that accurately predict death at 1 year, and were developed to identify patients who would be appropriate for a palliative care intervention. It is based on the following variables: Cancer as a primary admitting diagnosis, Admitted 2 times to the hospital in the past year for a chronic medical illness, Resident of a nursing home, ICU admission with >2 organ systems in failure, and 2 Non‐Cancer hospice Guidelines as well as age. Scores range from 4 = low risk of death, 5‐12 = medium risk of death, and 13 = high risk of death at 1 year. We accessed hospital records and state Vital Records from 2003 to 2009 to determine which patients died within a 12‐month follow‐up period, and their date of death (primary outcome).
Cohort Risk Stratification
Based on their CARING score, participants were classified as being at low, medium, or high risk of death at 1 year.13 The probability of imminent death in the group of high‐risk patients is the main indication for an advance directive, and therefore the analysis of this high‐risk group would be confounded. Therefore, those at high (and unclassified) risk of death (89 [and 13] out of 458 interviewed patients) were excluded from the survival analysis. Including persons at high risk of death in this analysis would lead to confounding by indicationthat physicians are most likely to address ADs with patients that they perceive are likely to die in the near future. An example of this in the literature is the timing of do‐not‐attempt‐resuscitation orders (DNAR). It is well documented that most DNAR orders are written within 1 to 2 days of death.1416 The DNAR orders do not cause or lead to death, they are simply finally written for patients that are actively dying.
Statistical Analysis
SAS 9.1 (SAS Institute, Cary, NC) was used for all analyses. Survival analysis was conducted to examine time to death. Interaction effects of the variable of interest with patient risk were assessed by estimating Kaplan‐Meier survival curves for low and medium risk groups separately. The Wilcoxon and log‐rank tests were employed to compare those with and without AD discussions (and accounting for clustering within hospitals) and documentation. Since the stratification into risk groups involves the use of the CARING criteria, which were the main confounders, additional risk adjustment in each risk group was not performed. Post hoc power analysis showed an ability to detect a 13 percentage points difference in mortality rate, with 80% power for a 2‐sided test and alpha = 0.05, assuming a 20% death rate for the group without AD discussion (adjusting for the covariate distribution difference between those with and without AD discussion).
RESULTS
Characteristics of the 356 study subjects are listed in Table 1. Overall, the sample population was ethnically diverse, slightly above middle‐aged, mostly male, and of lower socioeconomic status, reflecting the hospitals' populations. Using the CARING criteria, 297 subjects were found to be at low risk, and 59 subjects at medium risk, of death at 1 year.
| Percent (n) or Mean SD | |
|---|---|
| |
| Ethnicity | |
| African American | 19% (69) |
| Caucasian | 55% (194) |
| Latino | 19% (66) |
| Other | 8% (27) |
| Age (years) | 57.2 15 |
| Female gender | 34% (122) |
| Admitted to | |
| DVAMC | 41% (147) |
| DHMC | 34% (122) |
| UCH | 24% (87) |
| CARING criteria | |
| Cancer diagnosis | 4% (15) |
| Admitted to hospital 2 times in the past year for chronic illness | 31% (109) |
| Resident in a nursing home | 2% (7) |
| Non‐cancer hospice guidelines (meeting 2) | 1% (4) |
| Income less than $30,000/yr | 81% (284) |
| No greater than high school education | 53% (188) |
| Living situation | |
| Home owner | 36% (125) |
| Rents home | 38% (132) |
| Unstable living situation | 27% (94) |
| Low social support | 37% (169) |
| Uninsured | 14% (51) |
| Regular primary care provider | 72% (254) |
Overall, 206 (45%) reported a discussion about ADs with a healthcare provider. However, we found that only 56 (10%) had an AD document on their chart. Twenty‐eight (6%) had a living will, 43 (9%) had a durable power of attorney, and 30 (7%) had a broader AD document. Between 2003 and 2009, 121 (26%) patients died. Unadjusted mortality rates for those with and without documentation and discussions of ADs are displayed in Figure 1.
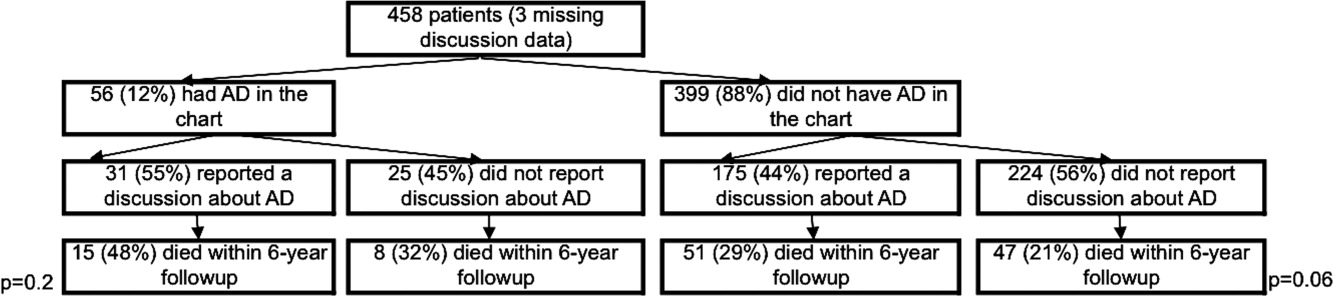
Kaplan‐Meier survival curves showed that, for subjects with a low or medium risk of death at 1 year, having had an AD discussion or having an AD in the medical record did not affect survival in subjects (Figures 2 and 3). Cox proportional hazards models adjusting for other covariates confirmed the results of the survival analysis (data not shown). Minimal intraclass correlation coefficients (0.005) were observed for the outcomes. Therefore, no models accounting for clustering within hospitals were developed.
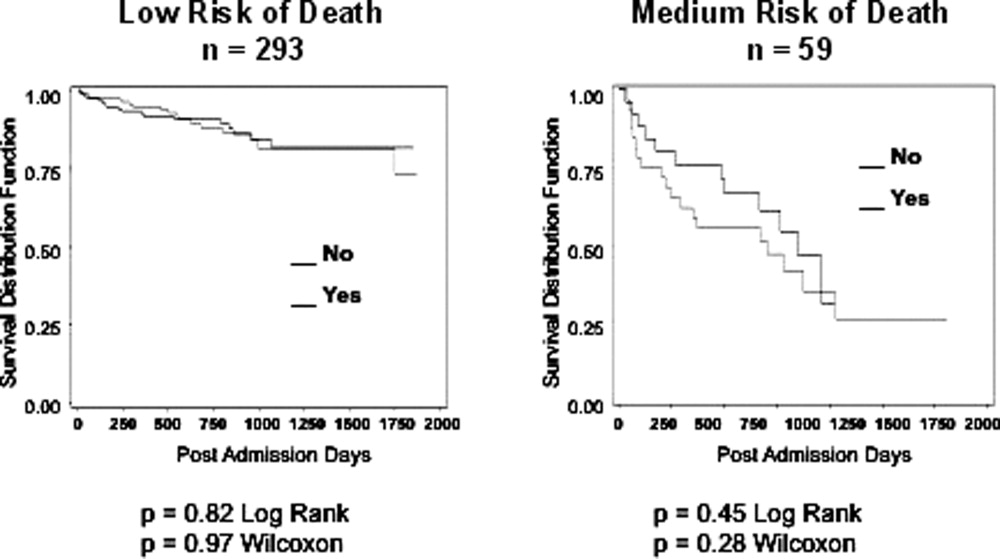
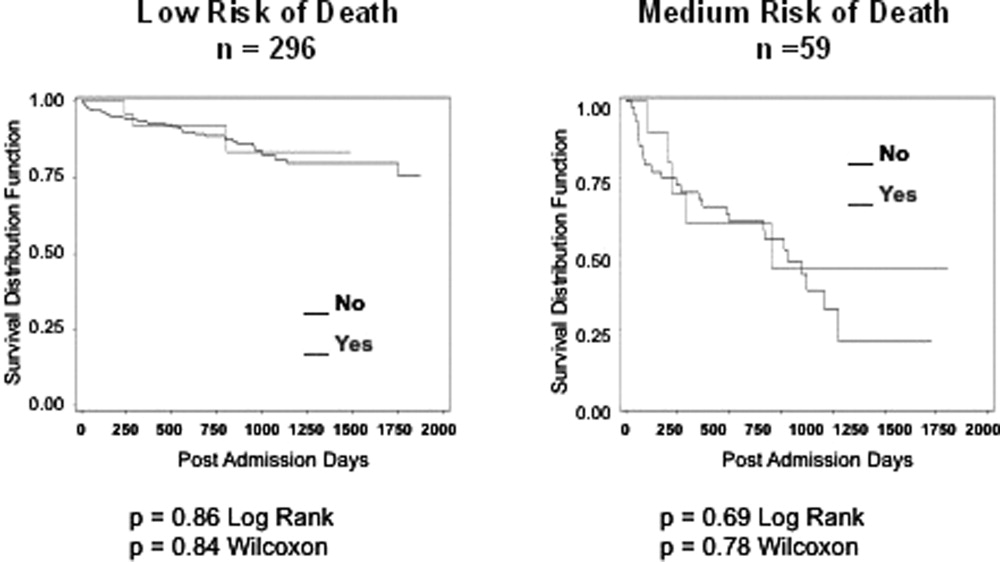
DISCUSSION
We found no decrease in survival for patients at low and medium 1‐year risk of death who reported having discussed ADs or who had an AD in their medical record, providing important evidence that having advance care planning discussions do not hasten death in this group of adults. However, it is possible that ADs, when implemented properly, may dictate withdrawal or withholding of interventions that may extend quantity of life at a quality unacceptable for the person executing the directive. For example, a feeding tube delivering artificial nutrition and hydration may grant years to someone in a persistent vegetative state, but those years, without the ability to be aware or interact with surroundings and loved ones, may not be a life worth living for some individuals. One explanation for our negative findings may be that the circumstances in which an AD may have an effect on outcomes may not yet have occurred among this lower risk population.
Opposition to the process of advance care planning may be considered unethical, by removing the opportunity for individuals to express their desires in the event of decisional incapacity, therefore disregarding patient autonomy. Furthermore, with the growing evidence that AD discussions and documentation help patients achieve care consistent with their wishes at the end of life,9, 11, 17 preventing advance care planning may worsen end of life outcomes.
Another important finding in our study was that only about 10% of the patients interviewed had completed an AD document, although nearly half reported they had discussed ADs with a healthcare provider. The patients we interviewed in this study had been admitted to the hospital in the previous 24 hours. As part of the Patient Self‐Determination Act, all patients admitted to a healthcare facility should receive information and counseling on AD. Less than half of our cohort reported any discussions about ADs and only 10% had completed an AD, suggesting that huge opportunities exist for improvement in advance care planning. As this study demonstrates, there was no increased mortality from advance care planning among those at low and medium risk of death, and others have shown benefits from the process. AD discussions and documentation should be fostered, especially as the burden of chronic disease increases and the population ages. In targeted studies to improve advance care planning, completion rates of up to 85% have been achieved.17
Our decision to focus solely on patients at low or medium risk of death, and exclude those at a high risk of death, is based on both clinical and methodological judgment. First, it is important to note that ADs are important even for those at lower risk of deaththe 3 critical cases that have shaped AD policy in this country, Karen Ann Quinlan, Nancy Cruzan, and Terry Schiavo, were all otherwise healthy young women.
Our study does have limitations. First, the sample size is small and not powered to detect small differences in survival. In addition, we only examined Vital Records within Colorado, although all participants had either a date of death or recent date of last contact. It is also conceivable that some patients discussed or completed ADs at a later time in their illness trajectory. However, the generalizability of this study is a major strength, by including a population and healthcare settings that are ethnically and socioeconomically diverse. Generalization of results beyond the three types of hospitals should be limited even with the low intraclass correlation. The major limitation of this research is that we do not have data on participant quality of life or whether completing an AD led to increased use of palliative care. During the time the research was conducted, 2 of the 3 hospitals involved had small palliative care services and the third remains without a palliative care service.
In conclusion, our study provides limited data to counteract the misleading claims of those opposed to the advance care planning process. Our results underscore the importance of educating the public on the importance of ADs and cast doubt on the death myth surrounding advance care planning. However, further, preferably longitudinal, study is needed to prospectively understand both the benefits and risks of advance care planning.
- ,,.The influence of the probability of survival on patient's preferences regarding cardiopulmonary resuscitation.N Engl J Med.1994;330:545–549.
- ,,.Physician reluctance to discuss advance directives. An empiric investigation of potential barriers.Arch Intern Med.1994;154(20):2311–2318.
- Advance directives and advance care planning: report to Congress. US Department of Health 82(12):1487–1490.
- Facts on dying: policy relevant data on care at the end of life, USA and state statistics. Dartmouth Atlas of Health Care Web site. Available at: http://www.chcr.brown.edu/dying/usastatistics.htm. Accessed September 20,2010.
- ,.The quest to reform end of life care: rethinking assumptions and setting new directions.Hastings Cent Rep. November—December2005;S52–S57.
- ,,, et al.End‐of‐life care and outcomes.Summary, Evidence Report/Technology Assessment No 110.Rockville, MD:Agency for Healthcare Research and Quality; December2004;1–6.
- ,,,,.Advance directives for medical care—a case for greater use.N Engl J Med.1991;324(13):889–895.
- ,,.Advance directives and outcomes of surrogate decision making before death.N Engl J Med.2010;362(13):1211–1218.
- ,,.Advance directives: the best predictor of congruence between preferred and actual site of death [Research Poster Abstracts].Journal of Hospital Medicine2010;5(S1):1–81.
- ,,,,.End‐of‐life discussions, goal attainment, and distress at the end of life: predictors and outcomes of receipt of care consistent with preferences.J Clin Oncol2010;28(7):1203–1208.
- ,,.Advance directive discussions do not lead to death.J Am Geriatr Soc.2010;58(2):400–401.
- ,,,,,.Practical tool to identify patients who may benefit from a palliative approach: the CARING criteria.J Pain Symptom Manage.2005;31(4):285–292.
- ,,.Do not resuscitate orders and the cost of death.Arch Intern Med.1993;153(10):1249–1253.
- ,,,,.The do‐not‐resuscitate order: associations with advance directives, physician specialty and documentation of discussion 15 years after the Patient Self‐Determination Act.J Med Ethics.2008;34(9):642–647.
- ,,, et al.Factors associated with do‐not‐resuscitate orders: patients' preferences, prognoses, and physicians' judgments. SUPPORT Investigators. Study to Understand Prognoses and Preferences for Outcomes and Risks of Treatment.Ann Intern Med.1996;125(4):284–293.
- ,.Death and end‐of‐life planning in one midwestern community.Arch Intern Med.1998;158(4):383–390.
All new legislation concerning advance care planning was removed from the Affordable Care Act, signed into law in March 2010. However, through a Medicare payment regulation, Centers for Medicare and Medicaid Services (CMS) was able to add a provision allowing compensation to physicians for advance directive (AD) discussions as part of the annual Medicare wellness exam. Previously, under President George W. Bush, funding for AD discussions was already part of the Welcome to Medicare visit. Once again, the provision was misrepresented and distorted in the media, talk radio shows, and social networking sites. Within days of the announcement, the White House removed the regulation stating that the controversy surrounding the provision was distracting from the overall debate about healthcare. The term death panels has now entered our national lexicon and serves to undermine the efforts of the palliative care field which, through discussions with patients and families, attempts to provide care consistent with patients' goals.
In fact, ADs have been a cornerstone of ethical decision making, by supporting patient autonomy and allowing patient wishes to be respected when decisional capacity is lacking. Advance directives may include a living will, a Medical Durable Power of Attorney, or may be a broader more comprehensive document outlining goals, values, and preferences for care in the event of decisional incapacity. ADs allow patients to express preferences that incorporate both quantity and quality of life, as there are times when interventions at the end of life may increase length of life to the detriment of quality of life. In this context, patients may chose to value quality of life and request the interventions be withdrawn that focus on maintaining life without hope for quality of life. ADs also permit patients who prefer quantity over quality of life to communicate these wishes. These conversations are complex and time‐consuming. Patients may have profound misperceptions about the benefits offered by interventions at the end of life. Having detailed conversations with healthcare providers about actual benefits, risks, and alternatives has been shown to impact that decision‐making process.1 In our current payment system, these time‐consuming conversations are not compensated by private or public insurers, and are incompatible with 20‐minute appointments, so they rarely occur.24 While Nancy Cruzan and Terri Schiavo brought national attention to the issue for a brief time, recent data suggest that only 30% of adults have completed an AD,57 however, 93% of adults would like to discuss ADs with their physician.8 Furthermore, Silveira et al. showed that older adults with ADs are more likely than those without ADs to receive care that is consistent with their preferences at the end of life.9 ADs were the sole predictor of concordance between preferred and actual site of death in a cohort of seriously ill, hospitalized patients.10 Patients with advanced cancer who discussed their end of life wishes with their physician were more likely to receive care consistent with their preferences.11
Advance directives are based on the ethical principle of autonomy and, with the growing evidence that ADs may improve care at the end of life, public understanding of the issue is critical. We had presented early preliminary data in a letter to the editor showing that having had an advance directive discussion or an AD in the medical record was not associated with an increased risk of death.12 This research, along with the work of Silveira and colleagues,9 was cited by the Obama administration when they decided to add the regulation for including advance care planning as part of the annual Medicare wellness exams. This brief report presents a more comprehensive examination of the relationship of AD discussions and AD documentation with survival in a group of hospitalized patients.
METHODS
Study Sites and Participant Recruitment
This was a multisite, prospective study of patients admitted to the hospital for medical illness. The Colorado Multi‐Institutional Review Board approved this study.
Over a 17‐month period starting in February 2004, participants were recruited from 3 hospitals affiliated with the University of ColoradoDenver Internal Medicine Residency program: the Denver Veterans' Administration Center (DVAMC); Denver Health Medical Center (DHMC), the city's safety net hospital; and University of Colorado Hospital (UCH), an academic tertiary, specialty care and referral center. Exclusion criteria included: admission <24 hours, pregnancy, age <18 years, incarceration, spoke neither English nor Spanish, lack of decisional capacity. Recruitment was done on the day following admission to the hospital throughout the year, to reduce potential bias due to seasonal trends. A trained assistant recruited on variable weekdays (to allow inclusion of weekend admissions). Of 842 admissions occurring during the recruitment, 331 (39%) were ineligible (175 discharged and 2 died within 24 hours postadmission; 76 lacked decisional capacity; and 78 met other exclusion criteria listed above). All other patients (n = 511) were invited to participate and 458 patients consented.
Participant Interview and Measures
Fifty‐three (10%) refused; 458 gave informed consent and participated in a bedside interview, including questions related to advance care planning. In this interview, participants were first asked to define an AD. Their response was either confirmed or corrected using a standard simple explanation that defined and described ADs:
An advance directive is a document that lets your healthcare providers know who you would want to make decisions for you if you were unable to make them for yourself. It can also tell your healthcare providers what types of medical treatments you would and would not want if you were unable to speak for yourself.
They were then asked if any healthcare provider had ever discussed ADs with them (AD discussion is a primary variable of interest).
Chart Review and Vital Records Data Collection
We reviewed each medical record to determine admitting diagnoses, CARING criteria (a set of simple criteria developed by our group to score the need for palliative care, which has been shown to predict death at 1 year),13 socioeconomic and demographic information, and the presence of ADs in the medical record (documentation of AD is a primary variable of interest). We defined ADs broadly, including: living will, durable power of attorney for healthcare, or a comprehensive advance care planning document (eg, Five Wishes). The CARING criteria are validated criteria that accurately predict death at 1 year, and were developed to identify patients who would be appropriate for a palliative care intervention. It is based on the following variables: Cancer as a primary admitting diagnosis, Admitted 2 times to the hospital in the past year for a chronic medical illness, Resident of a nursing home, ICU admission with >2 organ systems in failure, and 2 Non‐Cancer hospice Guidelines as well as age. Scores range from 4 = low risk of death, 5‐12 = medium risk of death, and 13 = high risk of death at 1 year. We accessed hospital records and state Vital Records from 2003 to 2009 to determine which patients died within a 12‐month follow‐up period, and their date of death (primary outcome).
Cohort Risk Stratification
Based on their CARING score, participants were classified as being at low, medium, or high risk of death at 1 year.13 The probability of imminent death in the group of high‐risk patients is the main indication for an advance directive, and therefore the analysis of this high‐risk group would be confounded. Therefore, those at high (and unclassified) risk of death (89 [and 13] out of 458 interviewed patients) were excluded from the survival analysis. Including persons at high risk of death in this analysis would lead to confounding by indicationthat physicians are most likely to address ADs with patients that they perceive are likely to die in the near future. An example of this in the literature is the timing of do‐not‐attempt‐resuscitation orders (DNAR). It is well documented that most DNAR orders are written within 1 to 2 days of death.1416 The DNAR orders do not cause or lead to death, they are simply finally written for patients that are actively dying.
Statistical Analysis
SAS 9.1 (SAS Institute, Cary, NC) was used for all analyses. Survival analysis was conducted to examine time to death. Interaction effects of the variable of interest with patient risk were assessed by estimating Kaplan‐Meier survival curves for low and medium risk groups separately. The Wilcoxon and log‐rank tests were employed to compare those with and without AD discussions (and accounting for clustering within hospitals) and documentation. Since the stratification into risk groups involves the use of the CARING criteria, which were the main confounders, additional risk adjustment in each risk group was not performed. Post hoc power analysis showed an ability to detect a 13 percentage points difference in mortality rate, with 80% power for a 2‐sided test and alpha = 0.05, assuming a 20% death rate for the group without AD discussion (adjusting for the covariate distribution difference between those with and without AD discussion).
RESULTS
Characteristics of the 356 study subjects are listed in Table 1. Overall, the sample population was ethnically diverse, slightly above middle‐aged, mostly male, and of lower socioeconomic status, reflecting the hospitals' populations. Using the CARING criteria, 297 subjects were found to be at low risk, and 59 subjects at medium risk, of death at 1 year.
| Percent (n) or Mean SD | |
|---|---|
| |
| Ethnicity | |
| African American | 19% (69) |
| Caucasian | 55% (194) |
| Latino | 19% (66) |
| Other | 8% (27) |
| Age (years) | 57.2 15 |
| Female gender | 34% (122) |
| Admitted to | |
| DVAMC | 41% (147) |
| DHMC | 34% (122) |
| UCH | 24% (87) |
| CARING criteria | |
| Cancer diagnosis | 4% (15) |
| Admitted to hospital 2 times in the past year for chronic illness | 31% (109) |
| Resident in a nursing home | 2% (7) |
| Non‐cancer hospice guidelines (meeting 2) | 1% (4) |
| Income less than $30,000/yr | 81% (284) |
| No greater than high school education | 53% (188) |
| Living situation | |
| Home owner | 36% (125) |
| Rents home | 38% (132) |
| Unstable living situation | 27% (94) |
| Low social support | 37% (169) |
| Uninsured | 14% (51) |
| Regular primary care provider | 72% (254) |
Overall, 206 (45%) reported a discussion about ADs with a healthcare provider. However, we found that only 56 (10%) had an AD document on their chart. Twenty‐eight (6%) had a living will, 43 (9%) had a durable power of attorney, and 30 (7%) had a broader AD document. Between 2003 and 2009, 121 (26%) patients died. Unadjusted mortality rates for those with and without documentation and discussions of ADs are displayed in Figure 1.
Kaplan‐Meier survival curves showed that, for subjects with a low or medium risk of death at 1 year, having had an AD discussion or having an AD in the medical record did not affect survival in subjects (Figures 2 and 3). Cox proportional hazards models adjusting for other covariates confirmed the results of the survival analysis (data not shown). Minimal intraclass correlation coefficients (0.005) were observed for the outcomes. Therefore, no models accounting for clustering within hospitals were developed.
DISCUSSION
We found no decrease in survival for patients at low and medium 1‐year risk of death who reported having discussed ADs or who had an AD in their medical record, providing important evidence that having advance care planning discussions do not hasten death in this group of adults. However, it is possible that ADs, when implemented properly, may dictate withdrawal or withholding of interventions that may extend quantity of life at a quality unacceptable for the person executing the directive. For example, a feeding tube delivering artificial nutrition and hydration may grant years to someone in a persistent vegetative state, but those years, without the ability to be aware or interact with surroundings and loved ones, may not be a life worth living for some individuals. One explanation for our negative findings may be that the circumstances in which an AD may have an effect on outcomes may not yet have occurred among this lower risk population.
Opposition to the process of advance care planning may be considered unethical, by removing the opportunity for individuals to express their desires in the event of decisional incapacity, therefore disregarding patient autonomy. Furthermore, with the growing evidence that AD discussions and documentation help patients achieve care consistent with their wishes at the end of life,9, 11, 17 preventing advance care planning may worsen end of life outcomes.
Another important finding in our study was that only about 10% of the patients interviewed had completed an AD document, although nearly half reported they had discussed ADs with a healthcare provider. The patients we interviewed in this study had been admitted to the hospital in the previous 24 hours. As part of the Patient Self‐Determination Act, all patients admitted to a healthcare facility should receive information and counseling on AD. Less than half of our cohort reported any discussions about ADs and only 10% had completed an AD, suggesting that huge opportunities exist for improvement in advance care planning. As this study demonstrates, there was no increased mortality from advance care planning among those at low and medium risk of death, and others have shown benefits from the process. AD discussions and documentation should be fostered, especially as the burden of chronic disease increases and the population ages. In targeted studies to improve advance care planning, completion rates of up to 85% have been achieved.17
Our decision to focus solely on patients at low or medium risk of death, and exclude those at a high risk of death, is based on both clinical and methodological judgment. First, it is important to note that ADs are important even for those at lower risk of deaththe 3 critical cases that have shaped AD policy in this country, Karen Ann Quinlan, Nancy Cruzan, and Terry Schiavo, were all otherwise healthy young women.
Our study does have limitations. First, the sample size is small and not powered to detect small differences in survival. In addition, we only examined Vital Records within Colorado, although all participants had either a date of death or recent date of last contact. It is also conceivable that some patients discussed or completed ADs at a later time in their illness trajectory. However, the generalizability of this study is a major strength, by including a population and healthcare settings that are ethnically and socioeconomically diverse. Generalization of results beyond the three types of hospitals should be limited even with the low intraclass correlation. The major limitation of this research is that we do not have data on participant quality of life or whether completing an AD led to increased use of palliative care. During the time the research was conducted, 2 of the 3 hospitals involved had small palliative care services and the third remains without a palliative care service.
In conclusion, our study provides limited data to counteract the misleading claims of those opposed to the advance care planning process. Our results underscore the importance of educating the public on the importance of ADs and cast doubt on the death myth surrounding advance care planning. However, further, preferably longitudinal, study is needed to prospectively understand both the benefits and risks of advance care planning.
- ,,.The influence of the probability of survival on patient's preferences regarding cardiopulmonary resuscitation.N Engl J Med.1994;330:545–549.
- ,,.Physician reluctance to discuss advance directives. An empiric investigation of potential barriers.Arch Intern Med.1994;154(20):2311–2318.
- Advance directives and advance care planning: report to Congress. US Department of Health 82(12):1487–1490.
- Facts on dying: policy relevant data on care at the end of life, USA and state statistics. Dartmouth Atlas of Health Care Web site. Available at: http://www.chcr.brown.edu/dying/usastatistics.htm. Accessed September 20,2010.
- ,.The quest to reform end of life care: rethinking assumptions and setting new directions.Hastings Cent Rep. November—December2005;S52–S57.
- ,,, et al.End‐of‐life care and outcomes.Summary, Evidence Report/Technology Assessment No 110.Rockville, MD:Agency for Healthcare Research and Quality; December2004;1–6.
- ,,,,.Advance directives for medical care—a case for greater use.N Engl J Med.1991;324(13):889–895.
- ,,.Advance directives and outcomes of surrogate decision making before death.N Engl J Med.2010;362(13):1211–1218.
- ,,.Advance directives: the best predictor of congruence between preferred and actual site of death [Research Poster Abstracts].Journal of Hospital Medicine2010;5(S1):1–81.
- ,,,,.End‐of‐life discussions, goal attainment, and distress at the end of life: predictors and outcomes of receipt of care consistent with preferences.J Clin Oncol2010;28(7):1203–1208.
- ,,.Advance directive discussions do not lead to death.J Am Geriatr Soc.2010;58(2):400–401.
- ,,,,,.Practical tool to identify patients who may benefit from a palliative approach: the CARING criteria.J Pain Symptom Manage.2005;31(4):285–292.
- ,,.Do not resuscitate orders and the cost of death.Arch Intern Med.1993;153(10):1249–1253.
- ,,,,.The do‐not‐resuscitate order: associations with advance directives, physician specialty and documentation of discussion 15 years after the Patient Self‐Determination Act.J Med Ethics.2008;34(9):642–647.
- ,,, et al.Factors associated with do‐not‐resuscitate orders: patients' preferences, prognoses, and physicians' judgments. SUPPORT Investigators. Study to Understand Prognoses and Preferences for Outcomes and Risks of Treatment.Ann Intern Med.1996;125(4):284–293.
- ,.Death and end‐of‐life planning in one midwestern community.Arch Intern Med.1998;158(4):383–390.
Copyright © 2011 Society of Hospital Medicine

Tackling Readmissions Together
A new report in the Journal of Hospital Medicine suggests that more than 60% of 30-day readmissions are viewed as potentially preventable by hospitalists.
The study, “Hospitalists Assess the Causes of Early Hospital Readmissions,” found that of 298 cases reviewed, 15% were deemed “preventable” by a team of 17 hospitalist reviewers at Providence Health & Services in Portland, Ore. (DOI: 10.1002/jhm.909). Another 40% were tagged as “possibly preventable,” the authors reported.
When the reviewers analyzed cases to determine what interventions could have prevented readmissions, team-based approaches were the answer much of the time, says lead author and hospitalist Douglas Koekkoek, MD. Those potential answers included earlier follow-up conversations with primary-care physicians (PCPs), palliative care-consults, and more education about home-care management.
“When a physician looks at just his locus of control, they tend to be a little pessimistic,” Dr. Koekkoek says. “When they take a systems approach ... then they gain that optimism.”
The report found that in 23% of the cases, hospitalists found that extending length of stay by a day or two could have prevented a readmission. Dr. Koekkoek says that inherent conflict?balancing the cost of every hospitalized day against keeping patients long enough to prevent readmission?is “the bread and butter of hospitalist care.”
“There is going to be a natural conflict of ‘I can’t keep people in the hospital forever,’” he adds.
Given that the federal government is likely to start reducing reimbursements for unnecessary readmissions, Dr. Koekkoek says HM groups have to view their work as one front in the battle to keep patients from returning. And that has to include outpatient physicians, patient education, and other techniques.
“The take-home is we are part of a care team,” he adds. “And the team extends beyond the hospital’s walls.”
Dr. Wachter Named ABIM's Chair-Elect
In a career with many HM “firsts," Robert M. Wachter, MD, MHM, is in line to become the first hospitalist to chair the American Board of Internal Medicine (ABIM), which provides certification for the majority of working hospitalists. Dr. Wachter, chief of the 50-faculty Division of Hospital Medicine at the University of California at San Francisco, was elected chair-elect by ABIM’s board on July 1, and is expected to become chair in July 2012.
“Bob Wachter becoming chair-elect of the ABIM is certainly an important milestone for our field,” says Scott Flanders, MD, SFHM, a hospitalist at the University of Michigan Health System and past president of SHM. “The ABIM recognized the importance of hospital medicine several years ago when they decided to add a hospitalist to the board. It should come as no surprise that they reached out to the man who is viewed as the father of hospital medicine.”
Christine K. Cassel, MD, ABIM’s president and CEO, says the election is less about recognition for the specialty and more about recognizing Dr. Wachter's transformational leadership in a number of areas, including hospital medicine.
“He has done the same kind of thing in the areas of patient safety and medical errors, and is now focusing on diagnostic accuracy,” she adds. According to Dr. Cassel, Dr. Wachter has helped ABIM focus on the need for transparency in physician performance information and report cards. “But it does indicate the maturity of the [HM] field that you have leaders like Bob—and he’s not the only one. Many emerging national leaders in healthcare are hospitalists,” she says.
ABIM sets standards and certifies physicians practicing in internal medicine and its 19 subspecialties. The board, whose members are all board-certified and represent those various subspecialties, guides the overall mission and direction in improving healthcare quality by the way it sets standards for certification, Dr. Cassel says. “The chair’s specific power and responsibility is to make sure the board runs effectively,” she adds.
In the first year of a Maintenance of Certification (MOC) program for physicians focused in hospital medicine offered by ABIM, 93 hospitalists completed the requirement and earned that designation.
Vorinostat Fails as Second-Line Therapy for Mesothelioma
STOCKHOLM – The results of the largest clinical trial to date in malignant pleural mesothelioma have left patients still without a standard second-line-treatment for this deadly tumor in the chest lining.
"Vorinostat [Zolinza] did not improve survival compared with placebo," Dr. Lee M. Krug said at the European Multidisciplinary Cancer Congress, where he reported outcomes of the disappointing phase III VANTAGE 014 trial.
Overall survival was not significantly different with a median of 31 weeks in patients on vorinostat and 27 weeks in those on placebo (hazard ratio, 0.98; P = 0.858). Planned analyses found no subgroups had any advantage in overall survival from vorinostat, said Dr. Krug of Memorial Sloan-Kettering Cancer Center in New York City.
Discussant Dr. Rolf A. Stahel of the University Hospital Zurich lamented, "This has been the largest study ever in mesothelioma. ... Despite this huge effort, the result is negative."
Patients were included if they had a diagnosis of malignant pleural mesothelioma with a pleural lesion at least 1 cm in thickness. They could have received up to two prior systemic regimens with pemetrexed (Alimta) and a platinum. They had to have a Karnofsky performance status of at least 70 and adequate organ function.
Vorinostat is a histone deacetylase (HDAC) inhibitor. In all, 660 patients were randomized to vorinostat (300 mg) or placebo. Both were given orally twice daily for 3 days out of 7 days in a 3-week cycle. The population was predominantly male, with a slightly greater percentage in the vorinostat arm (86% vs. 81%). Almost all patients (90%) had stage III-IV disease.

Researchers were puzzled by a change in survival rates in patients who were measured at the time of the third interim analysis, compared with those who were enrolled after the third interim analysis, said Dr. Krug.
At the third interim analysis, the hazard ratio for overall survival was 0.86, "which was just shy of the 0.83 hazard ratio required for this to be a positive trial." After the interim analysis – which occurred halfway through the study – the hazard ratio was 1.32.
The test of interaction between survival effect and time of enrollment, suggested that there was a less-than-2% chance that this switch occurred randomly. "As yet, we have not identified any causes," Dr. Krug said.
Median progression-free survival (determined by independent radiologic review) was significantly improved statistically in the vorinostat arm but not in a clinically-significant way: 6.3 weeks for vorinostat vs. 6.1 weeks for placebo (HR, 0.75; P less than 0.001).
Secondary end points (overall objective response rate, the dyspnea score on the Lung Cancer Symptom Scale as modified for mesothelioma, and forced vital capacity – were no better with vorinostat than with placebo. There were two confirmed radiologic responses, one in each arm.
"The adverse events were comparable between the two arms. ... [S]erious adverse events were slightly increased for some toxicities that you might expect to see with vorinostat," said Dr. Krug. These included fatigue, nausea, and dehydration. Tumor pain was greater in the placebo arm.
Despite the negative results, just by its sheer size, the trial "provides an excellent source of information with regards to this patient population, such as data on their pulmonary function, [symptomatology], serum markers, and also the large tumor bank that was collected," Dr. Krug told attendees at the joint congress of the European Cancer Organization (ECCO), the European Society For Medical Oncology (ESMO) and the European Society for Radiotherapy and Oncology (ESTRO).
The study was supported by Merck Laboratories. No conflicts were reported at the meeting. Dr. Krug previously reported relationships with numerous companies, including receiving research funding from Merck.
STOCKHOLM – The results of the largest clinical trial to date in malignant pleural mesothelioma have left patients still without a standard second-line-treatment for this deadly tumor in the chest lining.
"Vorinostat [Zolinza] did not improve survival compared with placebo," Dr. Lee M. Krug said at the European Multidisciplinary Cancer Congress, where he reported outcomes of the disappointing phase III VANTAGE 014 trial.
Overall survival was not significantly different with a median of 31 weeks in patients on vorinostat and 27 weeks in those on placebo (hazard ratio, 0.98; P = 0.858). Planned analyses found no subgroups had any advantage in overall survival from vorinostat, said Dr. Krug of Memorial Sloan-Kettering Cancer Center in New York City.
Discussant Dr. Rolf A. Stahel of the University Hospital Zurich lamented, "This has been the largest study ever in mesothelioma. ... Despite this huge effort, the result is negative."
Patients were included if they had a diagnosis of malignant pleural mesothelioma with a pleural lesion at least 1 cm in thickness. They could have received up to two prior systemic regimens with pemetrexed (Alimta) and a platinum. They had to have a Karnofsky performance status of at least 70 and adequate organ function.
Vorinostat is a histone deacetylase (HDAC) inhibitor. In all, 660 patients were randomized to vorinostat (300 mg) or placebo. Both were given orally twice daily for 3 days out of 7 days in a 3-week cycle. The population was predominantly male, with a slightly greater percentage in the vorinostat arm (86% vs. 81%). Almost all patients (90%) had stage III-IV disease.
Researchers were puzzled by a change in survival rates in patients who were measured at the time of the third interim analysis, compared with those who were enrolled after the third interim analysis, said Dr. Krug.
At the third interim analysis, the hazard ratio for overall survival was 0.86, "which was just shy of the 0.83 hazard ratio required for this to be a positive trial." After the interim analysis – which occurred halfway through the study – the hazard ratio was 1.32.
The test of interaction between survival effect and time of enrollment, suggested that there was a less-than-2% chance that this switch occurred randomly. "As yet, we have not identified any causes," Dr. Krug said.
Median progression-free survival (determined by independent radiologic review) was significantly improved statistically in the vorinostat arm but not in a clinically-significant way: 6.3 weeks for vorinostat vs. 6.1 weeks for placebo (HR, 0.75; P less than 0.001).
Secondary end points (overall objective response rate, the dyspnea score on the Lung Cancer Symptom Scale as modified for mesothelioma, and forced vital capacity – were no better with vorinostat than with placebo. There were two confirmed radiologic responses, one in each arm.
"The adverse events were comparable between the two arms. ... [S]erious adverse events were slightly increased for some toxicities that you might expect to see with vorinostat," said Dr. Krug. These included fatigue, nausea, and dehydration. Tumor pain was greater in the placebo arm.
Despite the negative results, just by its sheer size, the trial "provides an excellent source of information with regards to this patient population, such as data on their pulmonary function, [symptomatology], serum markers, and also the large tumor bank that was collected," Dr. Krug told attendees at the joint congress of the European Cancer Organization (ECCO), the European Society For Medical Oncology (ESMO) and the European Society for Radiotherapy and Oncology (ESTRO).
The study was supported by Merck Laboratories. No conflicts were reported at the meeting. Dr. Krug previously reported relationships with numerous companies, including receiving research funding from Merck.
FROM THE EUROPEAN MULTIDISCIPLINARY CANCER CONGRESS
Finding: Overall survival was not significantly different at a median of 31 weeks with vorinostat and 27 weeks with placebo (HR, 0.98; P = .858).
Source: A phase III trial of 660 patients with mesothelioma who were randomized to receive vorinostat or placebo as second-line therapy.
Disclosures: The study was supported by Merck Laboratories. No conflicts were reported at the meeting. Dr. Krug previously reported relationships with numerous companies, including receiving research funding from Merck.
Guiding Patients Facing Decisions about “Futile” Chemotherapy
Volume 9, Issue 5, September-October 2011, Pages 184-187
| doi:10.1016/j.suponc.2011.04.001 |
| Permissions & Reprints |
How We Do It
Received 4 April 2011; Accepted 16 December 2011. Available online 24 September 2011.
Case Presentation
Ms. G is a 71-year-old woman with metastatic gastric adenocarcinoma recently diagnosed after an extensive surgical resection for a small bowel obstruction (SBO). She was admitted from the surgery clinic with intractable nausea and vomiting. An abdominal computerized tomographic (CT) scan revealed a partial SBO and peritoneal carcinomatosis. Given her recent surgery, the extent of her disease, and high likelihood of recurrent SBO, the surgical team decided that Ms. G was no longer a surgical candidate. When her symptoms did not improve with conservative measures, both oncology and palliative medicine were consulted to assist with symptom management and goals of care. The oncology team stated that Ms. G was still a chemotherapy candidate and suggested that she attend her new patient evaluation in oncology clinic the following week. The palliative medicine team then met with the patient to discuss management options and her preferences for care. The palliative care team explained ways to control her nausea and vomiting without using a nasogastric tube, and the patient agreed to transfer to their service for symptom management. The palliative team explained that her cancer was incurable but that chemotherapy options existed to help control her disease and possibly prolong her life. They also explained that the chemotherapy has side effects and that the patient would need to decide if she wanted to undergo treatment and accept potential side effects for the possibility of prolonging her life by weeks to months and improving her symptoms. As an alternative, she was told that she could focus solely on symptom control with medications and allow her disease to take its natural course. Ms. G was asked to think about how she wanted to spend the time she had left. Prior to discharge, as her symptoms improved, Ms. G was evaluated by another oncologist, who, after consulting the expert gastrointestinal cancer team, explained to her that the current chemotherapy options available for metastatic gastric cancer were rarely, if ever, successful at reversing malignant obstruction. With this information, the patient decided to be discharged home with hospice and spend time with her family. She died peacefully at her home approximately two weeks later.
Article Outline
- Futile Is as Futile Does
- Palliative Care: It's Not Just Giving Up on People
- Oncology: Palliative Care Is Giving Up
- Take-Home Messages
- Acknowledgments
- References
Futile Is as Futile Does
When deciding whether or not chemotherapy is “futile,” the concept of medical futility must be explored.[1] Though it remains difficult to adequately define, the qualitative and quantitative descriptions offered by Schneiderman et al[2] are widely used. Qualitatively, futile treatment “merely preserves permanent unconsciousness or cannot end dependence on intensive medical care.” More precisely, it is a medical treatment “that in the last 100 cases … has been useless.”[2] A useful, albeit imprecise, definition of futile chemotherapy is that in which the burdens and risks outweigh the benefits. As an example, studies on chemotherapy for advanced non-small-cell lung cancer (NSCLC) have shown that patients with poor performance status or chemotherapy-unresponsive disease receive little benefit in terms of response rates and survival. [3] and [4] A retrospective analysis by Massarelli et al3 showed dismal response rates for third- and fourth-line NSCLC chemotherapy of 2.3% and 0%, respectively. Additionally, an observational study by Zietemann and Duell[4] showed that 40% and 50% of patients receiving second- and third-line chemotherapy for NSCLC die during or soon after treatment, respectively, and that over 20% receive chemotherapy within 14 days of death. Neither study commented on quality of life experienced by patients. However, a recent study by Temel et al[5] demonstrated that NSCLC patients receiving concurrent palliative care and standard oncologic care had better quality of life and even longer survival than patients receiving only standard oncologic care, despite being less likely to receive aggressive end-of-life care. Though limited to patients with NSCLC, these studies illustrate that chemotherapy in advanced cancer is often futile, especially when less aggressive care can improve quality of life as well as survival.
Addressing the futility of chemotherapy with patients is challenging for most oncologists. Although defining treatments as “futile” is suitable in the medical literature, it is a word that may carry negative connotations, such as hopelessness or abandonment, to patients. A more descriptive and less negative term, “nonbeneficial,” may be used when discussing futile chemotherapy with patients. The point when chemotherapy becomes nonbeneficial, and thus futile, is different for each patient and might even change over time. Addressing the patient's definition of nonbeneficial chemotherapy regularly during treatment ensures that the patient's goals are clear and allows the oncologist to direct conversation toward alternative options, such as palliative and hospice care, when chemotherapy cannot provide the benefits sought by the patient. This can be as simple as asking the patient, “Do you think the chemotherapy is giving you enough benefit to continue?”
Palliative Care: It's Not Just Giving Up on People
Both the physician and the patient face several decisions when considering whether or not to pursue chemotherapy for advanced cancer. First of all, the patient must decide how much information he or she wants from the oncologist. If the patient is the decision maker, he or she must choose to accept chemotherapy that is palliative, not curative. After a frank discussion about the anticipated outcomes and symptoms associated with chemotherapy, the patient must consider whether he or she can accept the burden of treatment for the potential of prolonging life by days, weeks, or months. On the other hand, the oncologist must decide if chemotherapy should even be offered, based on patient performance status, known therapeutic outcomes, and patient values and goals. The oncologist can reassure patients that the best available data show that patients who use hospice for even one day actually live longer than those who do not.[6] Once informed about what palliative care and hospice offer, the patient may determine whether or not alternatives to chemotherapy are more favorable. If the patient qualifies for clinical trials, he or she must decide to accept treatment with uncertain outcome. When reflecting upon such difficult issues, both the patient and oncologist should involve others to help guide decision making. Oncologists can consult trusted colleagues for their expertise and to ensure that they are using the best information available. Patients should involve loved ones whom they trust to help make decisions in their best interest. Table 1 provides key questions that the oncologist faces when making these decisions and how to approach them.
| Table 1: Questions to discuss with the patient when chemotherapy may be futile | ||
| Question | Leading prompts | Comment |
| What is the patient’s current understanding of the disease? | How much do you know about your cancer at this point?
How much do you want to know? | Be sure the patient is ready to discuss this issue and that you have enough time for discussion.
Ask if there are others who should receive this information simultaneously, afterwards, or instead of the patient. |
| What are the patient’s goals? | Knowing that we can’t cure your cancer, what are your goals, wishes, or hopes for the future? | Treatment decisions may be impacted greatly by a patient’s personal goals (e.g. patient wants to live to child’s graduation, or patient wants to be as comfortable as possible) |
| If chemotherapy is an option and the patient is interested, is he/she aware of potential risks and benefits? | Although everyone responds differently, these are the likely side effects and outcomes of this treatment… | Be specific in terms of likelihood of response, type of response (palliation instead of cure, extent of life prolongation expected, symptom relief, etc.) and how likely it is that treatment will help achieve patient’s goals.
Discuss potential symptom burden from treatment in detail.
Patient needs to be able to make informed decision about risks vs. benefits involved in potential treatment. |
| If the patient declines chemotherapy, treatment is not indicated, or treatment fails, what other options are available? | Let’s talk about options to make sure that you are comfortable and enjoy the highest quality of life possible in the time that you have left. | Focus on pain and symptom management. Discuss hospice options (home vs. inpatient) and make referrals when appropriate.
Stress that you will continue your relationship with the patient (possibly as their hospice provider) and that you will ensure that their symptoms are managed, either directly or through hospice nurses. |
As an alternative to addressing the above issues with the patient independently, oncologists may involve a palliative care specialist to facilitate this conversation.[7] Particularly in cases where the oncologist decides that chemotherapy is no longer a viable option, it may be easier, from both the patient and the provider perspectives, for the palliative care specialist to have this discussion. In a recent survey of patients on our oncology ward, the great majority did not want to discuss advance directives (ADs) with their oncologist—these patients thought ADs were important and should be discussed but were more comfortable discussing them with the admitting provider than the oncologist.[8] Patients may feel that they are disappointing their oncologist by being unable to take further treatment or by admitting that treatment has failed them. Similarly, oncologists might view having this discussion as an admission of their failure as a provider. The palliative care specialist, on the other hand, has no responsibility for chemotherapy and possibly no prior relationship with the patient, thus alleviating this type of emotional association between provider and patient. Furthermore, the conversation about nonbeneficial chemotherapy provides a segue for the palliative care provider to discuss with patients what he or she does best: establishing goals of care, managing symptoms, and maintaining comfort. For the palliative care specialist, providing symptom management and the best possible quality of life for patients are the fundamental goals. Death is generally not viewed with a sense of failure when palliation is the focus of care.
Oncology: Palliative Care Is Giving Up
We still hear from oncologists like ourselves the dreaded words “What do you want me to do, give up on the patient?” or, to the patient, “What, are you giving up? I thought you'd keep fighting!” We would argue that current best practices include knowing when the risks and harms of chemotherapy outweigh any potential chance of benefit. Physicians and patients should follow current National Comprehensive Cancer Network (NCCN) guidelines for solid tumors such as breast9 and lung10 cancer and stop chemotherapy when the chance of success is minimal. If the doctor cannot describe a specific, substantial benefit that outweighs the toxicity, he or she should not recommend it.[11] And all the relevant guidelines call for considering a switch to nonchemotherapy palliative care when the patient's performance status is Eastern Cooperative Oncology Group (ECOG) ≥3, defined as “3 = Capable of only limited self-care, confined to bed or chair more than 50% of waking hours.”[12] Such a simple threshold could dramatically reduce the use of chemotherapy at the end of life and lessen downstream toxicities.
Oncologists can implement several strategies to help facilitate the transition from aggressive care to comfort care (Table 2). For patients with incurable cancer, oncologists can hold early discussions about palliative and hospice options that will need to be implemented when chemotherapy is no longer able to control their disease. This discussion introduces palliative medicine as part of the care plan for incurable disease and allows the patient to anticipate such a transition. Oncologists can also provide reassurance that they will continue to be involved in their patient's care and to support them, even if the patient does not undergo further chemotherapy. There are at least four studies that show equal[13] or better[6] survival, smoother transitions to hospice when death is inevitable, less intensive end-of-life care, and superior patient and family outcomes with concurrent palliative care. [14] and [15] By helping patients establish legal documents, such as ADs and power of attorney, oncologists and palliative care specialists can alleviate some of the stress related to the end of life and make the transition to comfort care easier. Finally, oncologists can review guidelines such as those from the NCCN and American Society of Clinical Oncology, which call for a switch to palliative care when the cancer has grown on three regimens or the patient's ECOG performance status is three or above. [11] and [12]
| Table 2: Things that help ONCOLOGISTS and their patients | ||
| Item | How it helps | Comments |
| Early discussion of palliative and hospice care when chemotherapy may no longer help. | Hospice (and eventual death) will not come as a complete surprise. | “We will do our best to help you with this cancer, but at some point there may not be any treatments known to help….” “Remember the conversation we had when we first met?...” |
| Reassurance that the oncologist will not abandon the patient if concurrent care is given. | This major fear may keep oncology patients at the same practice they have known for years – it is familiar – when they would be better served by transition. | There are now at least 4 randomized trials showing that most patients will accept concurrent palliative care if offered, and that outcomes are equal or better, at less cost.6,13,14,15 |
| Legal documents such as Advance Medical Directives, Durable Medical Power of Attorney | Reinforces the seriousness and “now” aspect of care. | These are readily available in all states at no cost. They are not the final word on how to live one’s remaining time, but will get the conversation started. |
| Best nationally recognized information showing that further chemotherapy will not help due to 3 prior failures, or is not indicated due to poor performance status.9,10 | The oncologist can point to the right page and say “The best national guidelines call for a switch away from chemo…because it will do no good and will cause harmful side effects.” | Readily accessed from the Internet. |
| Use decision aids, similar to Adjuvant!. | Increases the amount of truthful information given, even when the news is bad, and helps with transition points. | An increasing number of these are available[i],[ii],[iii],[iv] and will soon be offered as smart phone applications (aps). |
Communication tools, such as the National Cancer Institute's Oncotalk and EPEC-O, are useful for oncologists seeking to further enhance their communication skills.
Take-Home Messages
Guiding patients in making decisions about nonbeneficial, or futile, chemotherapy presents a challenge for many oncologists as well as their patients and families. Though futility is difficult to define, oncologists and their patients can decide through regular, open discussion if the burdens of chemotherapy outweigh the benefits and whether or not chemotherapy can achieve the reasonable benefits desired by the patient. “Your cancer is advancing despite our best efforts to keep it from growing. Let's talk about what options we have at this point and see what will work best for you.” To make such decisions, oncologists must obtain the most current information and convey it to patients (or their designated decision makers) as clearly as possible. “Based on the latest evidence, there is a 20% chance that the cancer will shrink or stay the same size with this treatment and an 80% chance that it will continue to grow despite treatment.” Both oncologists and their patients should involve those whom they trust to help with decision making. In cases where chemotherapy is nonbeneficial, oncologists may prefer to involve palliative and hospice care specialists to discuss the transition to comfort care with the patient. “At this time, I do not have any treatments that are likely to help you live longer or more comfortably, but I want to make sure that we get the most out of the rest of your life. I have asked a palliative care specialist to help us make this possible.” In order to ease the transition from aggressive or curative care to comfort care, oncologists can employ approaches such as early discussion of palliative and hospice care, assuring the patient of continued involvement in their care, and helping patients with ADs. These approaches not only benefit patients and their families but also strengthen the relationship between the oncologist and the patients and their families.
Acknowledgments
This research was supported by grants GO8 LM0095259 from the National Library of Medicine and R01CA116227-01 (both to T. J. S.) from the National Cancer Institute.
References [PubMed ID in brackets]
1 P.R. Helft, M. Siegler and J. Lantos, The rise and fall of the medical futility movement, . N Engl J Med, 343 (2000), pp. 293–296 [10911014].
2 L.J. Schneiderman, N.S. Jecker and A.R. Jonsen, Medical futility: its meaning and ethical implications, . Ann Intern Med, 112 (1990), pp. 949–954 [2187394].
3 E. Massarelli, F. Andre, D.D. Liu, J.J. Lee, M. Wolf, A. Fandi, J. Ochs, T. Le Chevalier, F. Fossella and R.S. Herbst, A retrospective analysis of the outcome of patients who have received two prior chemotherapy regimens including platinum and docetaxel for recurrent non-small-cell lung cancer, . Lung Cancer, 39 1 (2003), pp. 55–61 [12499095].
4 V. Zietemann and T. Duell, Every-day clinical practice in patients with advanced non-small-cell lung cancer, . Lung Cancer, 68 2 (2010), pp. 273–277 [19632737].
5 J.S. Temel, J.A. Greer, A. Muzikansky, E.R. Gallagher, S. Admane, V.A. Jackson, C.M. Dahlin, C.D. Blinderman, J. Jacobsen, W.F. Pirl, J.A. Billings and T.J. Lynch, Early palliative care for patients with metastatic non-small-cell lung cancer, . N Engl J Med, 363 (2010), pp. 733–742 [20818875].
6 S.R. Connor, B. Pyenson, K. Fitch, C. Spence and K. Iwasaki, Comparing hospice and nonhospice patient survival among patients who die within a three-year window. J Pain Symptom Manage, 33 3 (2007), pp. 238–246.
7 S.E. Harrington and T.J. Smith, The role of chemotherapy at the end of life: “when is enough, enough?”. JAMA, 299 22 (2008), pp. 2667–2678.
8 L. Dow, R. Matsuyama, L. Kuhn, L. Lyckholm, E.B. Lamont and T.J. Smith, Paradoxes in advance care planning. J Clin Oncol, 28 2 (2010), pp. 299–304.
9 NCCN Breast Cancer Clinical Practice Guidelines Panel, R.W. Carlson, D.C. Allred, B.O. Anderson, H.J. Burstein, W.B. Carter, S.B. Edge, J.K. Erban, W.B. Farrar, L.J. Goldstein, W.J. Gradishar, D.F. Hayes, C.A. Hudis, M. Jahanzeb, K. Kiel, B.M. Ljung, P.K. Marcom, I.A. Mayer, B. McCormick, L.M. Nabell, L.J. Pierce, E.C. Reed, M.L. Smith, G. Somlo, R.L. Theriault, N.S. Topham, J.H. Ward, E.P. Winer and A.C. Wolff, Breast cancer. J Natl Compr Canc Netw, 7 2 (2009), pp. 122–192.
10 NCCN Non-Small Cell Lung Cancer Panel Members, D.S. Ettinger, W. Akerley, G. Bepler, M.G. Blum, A. Chang, R.T. Cheney, L.R. Chirieac, T.A. D'Amico, T.L. Demmy, A.K. Ganti, R. Govindan, F.W. Grannis, T. Jahan, M. Jahanzeb, D.H. Johnson, A. Kessinger, R. Komaki, F.M. Kong, M.G. Kris, L.M. Krug, Q.T. Le, I.T. Lennes, R. Martins, J. O'Malley, R.U. Osarogiagbon, G.A. Otterson, J.D. Patel, K.M. Pisters, K. Reckamp, G.J. Riely, E. Rohren, G.R. Simon, S.J. Swanson, D.E. Wood and S.C. Yang, Non-small cell lung cancer. J Natl Compr Canc Netw, 8 7 (2010), pp. 740–801.
11 American Society of Clinical Oncology Outcomes Working Group, Outcomes of cancer treatment for technology assessment and cancer treatment guidelines. J Clin Oncol, 14 (1996), pp. 671–679.
12 Eastern Cooperative Oncology Group, ECOG Performance Status, http://ecog.dfci.harvard.edu/general/perf_stat.html Accessed November 30, 2010.
13 J. Finn, K. Pienta and J. Parzuchowski, Bridging cancer treatment and hospice care. Proc Am Soc Clin Oncol, 21 (2002), p. 1452.
14 G. Gade, I. Venohr, D. Conner, K. McGrady, J. Beane, R.H. Richardson, M.P. Williams, M. Liberson, M. Blum and R. Della Penna, Impact of an inpatient palliative care team: a randomized control trial. J Palliat Med, 11 2 (2008), pp. 180–190.
Copyright © 2011 Elsevier Inc. All rights reserved.
Daughters and Sons
Editors’ Note: Patients are part of family systems, and understanding these systems can help psychiatrists advance treatment. That’s why we’re launching a new column we are calling Families in Psychiatry. In this column, Dr. Alison M. Heru will examine issues faced by psychiatrists who are involved in family therapy and psychoeducation. She will also look at family research and at the impact that caring for patients with mental illness has on caregivers. Often, she will also offer a global perspective on these issues. If you have an idea for Dr. Heru, e-mail her at [email protected].
At age 7, Maggie Jarry watched her mother "walk around the apartment trying to catch her eyes because she believed they had floated out of her face." Her mother often locked herself in the bathroom and talked to herself in the mirror because she believed that had telepathic powers.
"We lived like this for a year, until a babysitter and her mother figured out what was going on" and got professional help for Maggie’s mother. Her mother was diagnosed with schizoaffective disorder, and after she died in 2007, Maggie Jarry felt free to share her experience (Psychiatr. Serv. 2009;60:1587-8). "During these years, no one asked me about my experiences of living with my mom while she was ill. I was expected to just go play and be a child while she was in the hospital," Maggie wrote.
Maggie, now a community organizer, is part of a new consumer organization that seeks to provide support and resources to those who have a parent with mental illness. In the organization’s blog, called "Daughters and Sons," one writer expressed the burden of children living with parents with mental illness this way:
"People can be told that your family member is ‘sick’ but until they have concrete examples of how a day becomes an eternity as a child sits unknowingly, waiting for a storm to pass that has no time limit, they really have no idea what it is like. Until people ‘get it,’ they won’t be inclined to help change it and deal with it on a societal level. Unlike the adults who can get away from dysfunction, the child growing up in a crooked house has no escape."
In Maggie’s case, when her mother was doing well, the two had a good relationship. The bond that existed between the two underscores the essential human role that parenting can have in helping patients with mental illness reach wellness.
Many resources are available for children of parents with mental illness, although there are more in Europe, Australia, and New Zealand than in the United States. In the Netherlands, an online group course for Parents With Mental Illness has been piloted, and in Finland, clinician training has been studied. In the United States, the National Research Council and the Institute of Medicine produced a report on Depression in Parents, Parenting and Children: Opportunities to Improve Identification, Treatment, and Prevention. In addition, excellent web resources are listed at end of the column.
What can individual adult psychiatrists do? We can include children in family meetings about the parent’s illness. We can answer their questions about psychiatric illness. Children can also provide great insight into family functioning – strengths and weaknesses. We can provide age-appropriate literature when they visit the hospital or come with their parent to our office. We can ask our patients, their spouses, and other caregiving adults about their children. We can ask if they need help with parenting, and provide appropriate resources. We can reassure our patients that we want to help them become better parents, not remove their children! Families can be referred for help and support. If you see your patient as being part of a family, then you have a family or systems perspective of health care.
There are many family psychiatrists and many of us are members of the Association of Family Psychiatrists, which is an organization allied with the American Psychiatric Association. We have a website and a newsletter. Family psychiatrists are found in diverse settings, such as child and adolescent inpatient units, geriatric clinics, and psychosomatic medicine services. Those of us in outpatient practice may use family therapy as a single modality. Most of us, however, incorporate a family approach in our care of the patient. We use medication, individual therapy, and family interventions.
Several international family psychiatry resources are available online. Among them are the "Mental Health and Growing Up" leaflets, the "Children of Parents With a Mental Illness" website, and the Effective Family Programme.
I look forward to bringing you updates on family psychiatry, the latest in evidence-based family interventions, and other information aimed at helping you keep an updated family systems approach in your practice. Let me hear from you.