User login
Hospitalists See Value in Palliative Care
HM groups looking for a new revenue stream would be well served to keep an eye on the explosive growth of palliative care, according to a former SHM president who also runs a palliative service.
Steven Pantilat, MD, FACP, SFHM, director of the Palliative Care Leadership Center at the University of California at San Francisco, says data released this summer by the Center to Advance Palliative Care (CAPC) show that 63% of hospitals have palliative-care teams, up from 24.5% in 2000. But growth is lagging in both smaller hospitals and hospitals in the South.
"Hospitals that are looking to improve the systems of care, hospitals that are looking to be more cutting-edge, looking to be adopters of new models of care are going to pursue both hospital medicine and palliative care," Dr. Pantilat says. "That is another way that hospitalists can demonstrate added value."
Dr. Pantilat, who helped create SHM's Palliative-Care Task Force, says hospitalists can provide primary palliative care and should be mindful to identify patients who should be referred to palliative teams. Hospitalists interested in learning more about palliative skills can pursue training programs through CAPC or the American Academy of Hospice and Palliative Medicine.
The growth of HM and palliative care have followed similar tracks in the past decade, and the business case for both services is similar, Dr. Pantilat says. Because demand still outweighs supply in both specialties, many institutions looking for palliative expertise would be pleased to have their HM group take that mantle, particularly as hospitalists are now caring for the majority of inpatients that would benefit from those services, he adds.
"Hospitalists are the ones taking care of those people with advanced, serious, and life-threatening illnesses," Dr. Pantilat says. "De facto, they are already doing this work."
To Friend or Not to Friend?
Social networking is nothing new, but with more doctors logging on, it is important to recognize the inherent professional risks.
To help their physicians manage their online reputations, the British Medical Association recently issued social media guidelines reminding their doctors that "ethical and legal duties apply just as much on the Internet as when they are offline." U.S.-based physicians are also encouraged to take precautions.
As a mentor for young hospitalists, Paul Grant, MD, assistant professor at University of Michigan Health System and chair of the SHM Early Career Hospitalist committee, agrees that while there is value in using sites like Facebook and Twitter, it's important to keep the conversation professional.
"While the issue of patient friend requests is probably more common with long-term-care physicians, our group has been encouraged to be aware of our Internet profiles, and to Google ourselves periodically to see what’s out there," he says. Dr. Grant admits he occasionally receives requests from colleagues, but he declines.
"That's the nice thing about Facebook: You treat it like you would any other relationship," says Glenn Lombardi, president of Officite, a Downers Grove, Ill.-based medical website and web-marketing firm that manages more than 1,000 Facebook accounts for medical practices. "You share certain things with certain people, and it's not anything bigger that that."
Lombardi and Dr. Grant offer the following social-networking tips:
- Maintain privacy. Don't accept personal friend requests from patients or colleagues.
- Be proactive. Have a search-engine-optimized website. Make sure your patients know it's the best place to go for information.
- Wait on trends. New social-networking sites, such as Google+, have great potential, Lombardi says, but it is better to see what experts identify as their best and safest purposes before creating a profile.
New Beginnings

They both were working the day the planes crashed into the World Trade Center in New York City. They saw the twin towers crash to the ground, the soot and debris covering lower Manhattan, and the puzzled faces of loved ones searching for information in the EDs of their hospitals. And while the memories are vivid and the shock of the terror still resides in them, they have chosen distinctly different paths since the 9/11 attacks 10 years ago.
Born and raised in Queens, Adam Trosterman, MD, grew up looking at the World Trade Center from his apartment window, studied medicine at Albert Einstein Medical Center in Manhattan, and was the intern on call for trauma surgery at NYU Bellevue the day of the attack. Today, he works as a hospitalist in Colorado and plans to spend Sept. 11 biking in the peaceful altitudes of the Rocky Mountains.
“I will probably go for a bike ride with my wife and enjoy some fresh air,” Dr. Trosterman says. “I don’t plan anything special, but I think about [Sept. 11] and I don’t think about October 11.”
A mere 10 blocks south of NYU Bellevue, straight down First Avenue, Dahlia Rizk, DO, was the hospitalist program director at Beth Israel Medical Center and in the middle of grand rounds when she first heard about the attacks on the twin towers. She has since moved to Battery Park, just a few blocks from the construction site for the new World Trade Center, and plans to participate in the 9/11 anniversary ceremony.
“I think that the memorial, the new building, and that whole area is just coming alive again. It is a real testament to the resilience of New Yorkers. Honoring the victims and their families is just so important. It’s such an incredible thing,” Dr. Rizk says. “I’m looking forward to the remembrance and celebrating the human spirit.”
Two physicians, two hospitalists, two human beings: They look back at 9/11 in diverse yet illuminating ways. These are their stories.
The Intern
A self-described New Yorker, Dr. Trosterman remembers Sept. 11, 2001, as a “beautiful, gorgeous morning” in which the sun was high and the temperature was pleasant. He, however, was in poor spirits, as everyone at NYU Bellevue “hated to be on trauma surgery” rotation. He was 29, single, and, as he puts it, “having a very good time” living in Manhattan.
He arrived at work at 6 a.m. and went about the basic duties of every first-year resident on trauma surgery rotation, rounding with two of his colleagues on 15 patients. At about 8:30 a.m., he ran into another surgery intern who informed him there was a “big trauma coming, something to do with a plane, you might want to check it out.”
Big traumas in New York City are a regular occurrence, and after nearly three months on, he says, he was “pretty well versed in how to run the trauma service. You grow up fast.”
“Back in 2001, you grew up really fast,” he adds. “There were no work-hour regulations; I was working 115 hours per week.”
Dr. Trosterman ran to his trauma slots in the ED—they were “acting weird,” he notes—and began setting up the four trauma beds for the unknown mass-casualty incident (MCI). “It took maybe five minutes,” he says. “Then I got a call from one of my colleagues who was a neurosurgery intern. He starts describing to me what happened, and tells me to come up to the ICU.”
—Adam Trosterman, MD, University of Colorado Denver
Bellevue’s ICU is on the 15th floor, with an unobstructed view of lower Manhattan. When he got there, Dr. Trosterman had a perfect view of the horror at the World Trade Center. “I was like, ‘Oh, my God,’ ” he recalls. “There was a humongous hole in the tower. At that point, I almost started laughing to myself. Not really, of course, but … we had to mobilize a whole different system, which, of course, I was a part of. But it was no longer my typical role for trauma.”
The first patient Dr. Trosterman saw that morning was pronounced dead on arrival. Ironically, he says, the patient looked a lot like his best friend’s stepfather, who worked in the World Trade Center. “They were like parents to me,” he says. “I couldn’t get through. It wasn’t until the second day that I could make a call. I don’t think I spoke to them until Sept. 13.” (Fortunately, everyone Dr. Trosterman knew who worked in the towers survived.)
The next patient Dr. Trosterman saw was a police officer who had a dislocated shoulder and a small fracture. He was screaming and it was difficult to tell if his outbursts were pain-related, Dr. Trosterman says. “He was ranting about what had happened—appropriately ranting,” he says. “He was saying, ‘My partner was at my side and I was trying to save him, but I knew I couldn’t get him out and save myself. I just had to run or I would’ve died. I left my partner to die. I left my partner to die.’ It was horrible. He probably still feels guilty about it right now.”
Contrary to some reports, Dr. Trosterman says, Bellevue and other New York City hospitals were overwhelmed with work, if not injured patients. Much of the work following the attacks was moving inpatients to free up space for casualties. The trauma service ballooned by 40 patients. “We saw more people than we ever see,” he says, “and, literally, the same number of doctors. I was, physically, unbelievably busy. I was emotionally worried about my friend and his family, and I hadn’t had contact with anyone for 48 hours. … I was frustrated that all I kept hearing on the radio was that there were no patients. I was like, ‘You need to come visit me and see what I’m doing!’ It was nonstop and nobody was alive.”

—Dahlia Rizk, DO, hospitalist program director, Beth Israel Medical Center, New York City
Dr. Trosterman cared for dozens of patients on 9/11, working into the wee hours of the night (see “The Most Interesting Patient,” below). He was told to go home at 3:30 a.m. but had to return to work at 6 a.m. He says walking out of the hospital that night was like walking through the morgue.
“Manhattan is one of the most happening places, and downtown Manhattan, it doesn’t matter what time of day it is, there’s always somebody in the street and there’s always something open,” he says. “Everything was closed, dead, silent, scary, barren. It was the most surreal thing I can ever remember in my life.”
In the midst of the chaos and confusion, loneliness and isolation replaced communication.
“Everyone was working, working, working, but no one was talking,” Dr. Trosterman says. “When I look back on that day, I feel angry, frustrated, scared, weird....While there weren’t 1,000 people [to save], those 10 or 15 lives that were saved, that were critically ill, were unbelievably important to the doctors who were taking care of them—no one knows about that.”
The Optimist
Ten years ago, Dr. Rizk was director of a three-hospitalist HM service at Beth Israel Medical Center; now the program has 26 FTE hospitalists and 15 physician assistants on staff. She was running late to grand rounds that day, coffee in hand as she passed a television and saw the first news reports of an airplane crashing into the first tower. Moments later, the hospital activated its disaster protocol, and Dr. Rizk rounded up her hospitalists.
“We very rapidly started discharging patients,” she recalls. “I actually went up to the 11th floor of our hospital and could see at that time that the second tower had been hit. It was almost like a dream, like a horrible nightmare. We could see the skyline changing when the first tower dropped. I could hear the sirens and see the smoke that was filling the air.
“We started to create triage stations outside our ED, and we had all the physicians at the hospital available. The ED was pretty chaotic in terms of the throughput. There wasn’t clear instruction; we didn’t know what was happening. ... There was a lot of debris and scratches and fractures that came through our ED.
continued below...
The MOST Interesting Patient

Although his 9/11 was chaotic, stressful, and exhausting, Dr. Trosterman didn’t perform many miracles on survivors. Even so, he does have an interesting story to tell about Port Authority officer John McLoughlin.
“He was buried under the rubble. They found him and dug him out” on Sept. 12, says Dr. Trosterman, who was the on-call intern for trauma surgery at NYU Bellevue. “He had massive crush injuries to his leg. … He was brought into the hospital and taken to the operating room.”
The surgical team saved McLoughlin’s limbs, but he slipped into a coma. Dr. Trosterman was in charge of the post-care unit in which the officer was assigned.
“I remember being yelled at by multiple trauma surgeons, telling me what to do,” he recalls. “I had to watch this guy and make sure he didn’t die overnight. That was the most traumatic patient, but he was also the most famous, celebrated man in New York City at the time.”
McLoughlin would stay in the coma for six weeks and endure 27 additional surgeries. After about six weeks of recovery and rehab, he was discharged. Then-Mayor Rudy Giuliani visited, taking pictures as he walked out of the hospital. McLoughlin’s story was portrayed in the Oliver Stone movie World Trade Center.
“His entire first night, when he was on death’s door, it was probably the only thing I actually did to save anyone during 9/11,” Dr. Trosterman says. “The only thing I really did was stay with him all night long. I did everything I could to make sure he stayed alive.
“And he did. I just paid super-close attention to him.” —JC
I remember very clearly standing outside of the ED as well, mostly greeting families who were looking for loved ones throughout the course of the day and collecting photographs that we posted on the wall for missing loved ones. And I remember these chilling feelings; there were so few people that were coming in that were in critical condition. I knew that this was not where they would find these patients.”
Beth Israel was not the Level 1 trauma center for lower Manhattan at the time; the now-shuttered St. Vincent’s Hospital was the go-to ED for mass casualty incidents. “They probably got the brunt of those patients, if there were any,” Dr. Rizk says. “I don’t know how many, but I can tell you from the hospitalist standpoint on the inpatient side, there was very little that was done.”
Most of the patients at Beth Israel were wheezing, needing eyewashes, or tending to scrapes and cuts. Dr. Rizk says many of the beds cleared for traumas sat empty. “We were ready, but so little happened in terms of activity on the inpatient side,” she says. “The saddest part really was the faces. I remember a college friend of mine actually coming and looking for his girlfriend’s family member at the time, and I just remember how horrified these family members were going from hospital to hospital throughout the city looking for loved ones.”
In the days and weeks that followed 9/11, Dr. Rizk says, a heavy feeling permeated the city. “Simple things like groceries and shops and restaurants—not that anyone felt like doing that—they just weren’t available,” she says. “Everybody was on foot trying to sort out what happened.”
Her brother-in-law, who worked in the building next to the towers, survived. Others she knew did not. An elementary school friend—a firefighter who rushed into the towers after the attacks—did not make it out. A close friend had an uncle, the head of the Brooklyn fire battalion, who lost his life, too. She attended his funeral.
The months that followed the attacks were “chilling” and “empty,” she says, as the soot covered the community and sorrow pierced those who lived and worked near ground zero.
Since then, Dr. Rizk has watched an “amazing” transformation in lower Manhattan. And it’s not just construction on the new 104-story Freedom Tower or the names of victims etched into the marble fountain walls, but the trees and momentum building for the 10-year anniversary.
“Just to see that renewed hope—it’s exciting,” she says. “I live down there now and am constantly reminded, every day, as I pass ground zero. I am amazed by how resilient the city is. The whole area is coming alive again.”
Dr. Rizk hopes to attend the 9/11 memorial service this month to honor the heroes and applaud New York’s future.
“[It’s] just a symbol of strength and hope for the future of people living together,” she says, “and to recognize that we all have the fundamental human commonality, and we really need to focus on how to move forward as a society—working together as a common goal.”
Jason Carris is editor of The Hospitalist.
Memorial Plaza Opening Highlights 9/11 Anniversary

President Obama and former President George W. Bush will participate in the 10th anniversary ceremony of the Sept. 11 attacks, which will mark the first time the names of all the people killed at the World Trade Center, the Pentagon, and the field in Shanksville, Pa., will be read aloud during the ceremony. Obama, Bush, former mayor Rudy Giuliani, and others will give pre-selected readings; no dignitaries will make speeches, according to New York City Mayor Michael Bloomberg.
The memorial plaza, which features two large squares where the World Trade Center stood, is set to open on the anniversary for families and dignitaries only, and to the public the following day. The names of all of the approximately 3,000 victims are etched into the walls of the memorial.
An underground museum at the site will open in late 2012.
Eighty of the 104 stories in the office tower that will be known as One World Trade Center are expected to be complete for the anniversary. It will be the tallest building in Manhattan. An underground transit center is under construction, as are privately developed office towers in the area. —JC
They both were working the day the planes crashed into the World Trade Center in New York City. They saw the twin towers crash to the ground, the soot and debris covering lower Manhattan, and the puzzled faces of loved ones searching for information in the EDs of their hospitals. And while the memories are vivid and the shock of the terror still resides in them, they have chosen distinctly different paths since the 9/11 attacks 10 years ago.
Born and raised in Queens, Adam Trosterman, MD, grew up looking at the World Trade Center from his apartment window, studied medicine at Albert Einstein Medical Center in Manhattan, and was the intern on call for trauma surgery at NYU Bellevue the day of the attack. Today, he works as a hospitalist in Colorado and plans to spend Sept. 11 biking in the peaceful altitudes of the Rocky Mountains.
“I will probably go for a bike ride with my wife and enjoy some fresh air,” Dr. Trosterman says. “I don’t plan anything special, but I think about [Sept. 11] and I don’t think about October 11.”
A mere 10 blocks south of NYU Bellevue, straight down First Avenue, Dahlia Rizk, DO, was the hospitalist program director at Beth Israel Medical Center and in the middle of grand rounds when she first heard about the attacks on the twin towers. She has since moved to Battery Park, just a few blocks from the construction site for the new World Trade Center, and plans to participate in the 9/11 anniversary ceremony.
“I think that the memorial, the new building, and that whole area is just coming alive again. It is a real testament to the resilience of New Yorkers. Honoring the victims and their families is just so important. It’s such an incredible thing,” Dr. Rizk says. “I’m looking forward to the remembrance and celebrating the human spirit.”
Two physicians, two hospitalists, two human beings: They look back at 9/11 in diverse yet illuminating ways. These are their stories.
The Intern
A self-described New Yorker, Dr. Trosterman remembers Sept. 11, 2001, as a “beautiful, gorgeous morning” in which the sun was high and the temperature was pleasant. He, however, was in poor spirits, as everyone at NYU Bellevue “hated to be on trauma surgery” rotation. He was 29, single, and, as he puts it, “having a very good time” living in Manhattan.
He arrived at work at 6 a.m. and went about the basic duties of every first-year resident on trauma surgery rotation, rounding with two of his colleagues on 15 patients. At about 8:30 a.m., he ran into another surgery intern who informed him there was a “big trauma coming, something to do with a plane, you might want to check it out.”
Big traumas in New York City are a regular occurrence, and after nearly three months on, he says, he was “pretty well versed in how to run the trauma service. You grow up fast.”
“Back in 2001, you grew up really fast,” he adds. “There were no work-hour regulations; I was working 115 hours per week.”
Dr. Trosterman ran to his trauma slots in the ED—they were “acting weird,” he notes—and began setting up the four trauma beds for the unknown mass-casualty incident (MCI). “It took maybe five minutes,” he says. “Then I got a call from one of my colleagues who was a neurosurgery intern. He starts describing to me what happened, and tells me to come up to the ICU.”
—Adam Trosterman, MD, University of Colorado Denver
Bellevue’s ICU is on the 15th floor, with an unobstructed view of lower Manhattan. When he got there, Dr. Trosterman had a perfect view of the horror at the World Trade Center. “I was like, ‘Oh, my God,’ ” he recalls. “There was a humongous hole in the tower. At that point, I almost started laughing to myself. Not really, of course, but … we had to mobilize a whole different system, which, of course, I was a part of. But it was no longer my typical role for trauma.”
The first patient Dr. Trosterman saw that morning was pronounced dead on arrival. Ironically, he says, the patient looked a lot like his best friend’s stepfather, who worked in the World Trade Center. “They were like parents to me,” he says. “I couldn’t get through. It wasn’t until the second day that I could make a call. I don’t think I spoke to them until Sept. 13.” (Fortunately, everyone Dr. Trosterman knew who worked in the towers survived.)
The next patient Dr. Trosterman saw was a police officer who had a dislocated shoulder and a small fracture. He was screaming and it was difficult to tell if his outbursts were pain-related, Dr. Trosterman says. “He was ranting about what had happened—appropriately ranting,” he says. “He was saying, ‘My partner was at my side and I was trying to save him, but I knew I couldn’t get him out and save myself. I just had to run or I would’ve died. I left my partner to die. I left my partner to die.’ It was horrible. He probably still feels guilty about it right now.”
Contrary to some reports, Dr. Trosterman says, Bellevue and other New York City hospitals were overwhelmed with work, if not injured patients. Much of the work following the attacks was moving inpatients to free up space for casualties. The trauma service ballooned by 40 patients. “We saw more people than we ever see,” he says, “and, literally, the same number of doctors. I was, physically, unbelievably busy. I was emotionally worried about my friend and his family, and I hadn’t had contact with anyone for 48 hours. … I was frustrated that all I kept hearing on the radio was that there were no patients. I was like, ‘You need to come visit me and see what I’m doing!’ It was nonstop and nobody was alive.”
—Dahlia Rizk, DO, hospitalist program director, Beth Israel Medical Center, New York City
Dr. Trosterman cared for dozens of patients on 9/11, working into the wee hours of the night (see “The Most Interesting Patient,” below). He was told to go home at 3:30 a.m. but had to return to work at 6 a.m. He says walking out of the hospital that night was like walking through the morgue.
“Manhattan is one of the most happening places, and downtown Manhattan, it doesn’t matter what time of day it is, there’s always somebody in the street and there’s always something open,” he says. “Everything was closed, dead, silent, scary, barren. It was the most surreal thing I can ever remember in my life.”
In the midst of the chaos and confusion, loneliness and isolation replaced communication.
“Everyone was working, working, working, but no one was talking,” Dr. Trosterman says. “When I look back on that day, I feel angry, frustrated, scared, weird....While there weren’t 1,000 people [to save], those 10 or 15 lives that were saved, that were critically ill, were unbelievably important to the doctors who were taking care of them—no one knows about that.”
The Optimist
Ten years ago, Dr. Rizk was director of a three-hospitalist HM service at Beth Israel Medical Center; now the program has 26 FTE hospitalists and 15 physician assistants on staff. She was running late to grand rounds that day, coffee in hand as she passed a television and saw the first news reports of an airplane crashing into the first tower. Moments later, the hospital activated its disaster protocol, and Dr. Rizk rounded up her hospitalists.
“We very rapidly started discharging patients,” she recalls. “I actually went up to the 11th floor of our hospital and could see at that time that the second tower had been hit. It was almost like a dream, like a horrible nightmare. We could see the skyline changing when the first tower dropped. I could hear the sirens and see the smoke that was filling the air.
“We started to create triage stations outside our ED, and we had all the physicians at the hospital available. The ED was pretty chaotic in terms of the throughput. There wasn’t clear instruction; we didn’t know what was happening. ... There was a lot of debris and scratches and fractures that came through our ED.
continued below...
The MOST Interesting Patient
Although his 9/11 was chaotic, stressful, and exhausting, Dr. Trosterman didn’t perform many miracles on survivors. Even so, he does have an interesting story to tell about Port Authority officer John McLoughlin.
“He was buried under the rubble. They found him and dug him out” on Sept. 12, says Dr. Trosterman, who was the on-call intern for trauma surgery at NYU Bellevue. “He had massive crush injuries to his leg. … He was brought into the hospital and taken to the operating room.”
The surgical team saved McLoughlin’s limbs, but he slipped into a coma. Dr. Trosterman was in charge of the post-care unit in which the officer was assigned.
“I remember being yelled at by multiple trauma surgeons, telling me what to do,” he recalls. “I had to watch this guy and make sure he didn’t die overnight. That was the most traumatic patient, but he was also the most famous, celebrated man in New York City at the time.”
McLoughlin would stay in the coma for six weeks and endure 27 additional surgeries. After about six weeks of recovery and rehab, he was discharged. Then-Mayor Rudy Giuliani visited, taking pictures as he walked out of the hospital. McLoughlin’s story was portrayed in the Oliver Stone movie World Trade Center.
“His entire first night, when he was on death’s door, it was probably the only thing I actually did to save anyone during 9/11,” Dr. Trosterman says. “The only thing I really did was stay with him all night long. I did everything I could to make sure he stayed alive.
“And he did. I just paid super-close attention to him.” —JC
I remember very clearly standing outside of the ED as well, mostly greeting families who were looking for loved ones throughout the course of the day and collecting photographs that we posted on the wall for missing loved ones. And I remember these chilling feelings; there were so few people that were coming in that were in critical condition. I knew that this was not where they would find these patients.”
Beth Israel was not the Level 1 trauma center for lower Manhattan at the time; the now-shuttered St. Vincent’s Hospital was the go-to ED for mass casualty incidents. “They probably got the brunt of those patients, if there were any,” Dr. Rizk says. “I don’t know how many, but I can tell you from the hospitalist standpoint on the inpatient side, there was very little that was done.”
Most of the patients at Beth Israel were wheezing, needing eyewashes, or tending to scrapes and cuts. Dr. Rizk says many of the beds cleared for traumas sat empty. “We were ready, but so little happened in terms of activity on the inpatient side,” she says. “The saddest part really was the faces. I remember a college friend of mine actually coming and looking for his girlfriend’s family member at the time, and I just remember how horrified these family members were going from hospital to hospital throughout the city looking for loved ones.”
In the days and weeks that followed 9/11, Dr. Rizk says, a heavy feeling permeated the city. “Simple things like groceries and shops and restaurants—not that anyone felt like doing that—they just weren’t available,” she says. “Everybody was on foot trying to sort out what happened.”
Her brother-in-law, who worked in the building next to the towers, survived. Others she knew did not. An elementary school friend—a firefighter who rushed into the towers after the attacks—did not make it out. A close friend had an uncle, the head of the Brooklyn fire battalion, who lost his life, too. She attended his funeral.
The months that followed the attacks were “chilling” and “empty,” she says, as the soot covered the community and sorrow pierced those who lived and worked near ground zero.
Since then, Dr. Rizk has watched an “amazing” transformation in lower Manhattan. And it’s not just construction on the new 104-story Freedom Tower or the names of victims etched into the marble fountain walls, but the trees and momentum building for the 10-year anniversary.
“Just to see that renewed hope—it’s exciting,” she says. “I live down there now and am constantly reminded, every day, as I pass ground zero. I am amazed by how resilient the city is. The whole area is coming alive again.”
Dr. Rizk hopes to attend the 9/11 memorial service this month to honor the heroes and applaud New York’s future.
“[It’s] just a symbol of strength and hope for the future of people living together,” she says, “and to recognize that we all have the fundamental human commonality, and we really need to focus on how to move forward as a society—working together as a common goal.”
Jason Carris is editor of The Hospitalist.
Memorial Plaza Opening Highlights 9/11 Anniversary
President Obama and former President George W. Bush will participate in the 10th anniversary ceremony of the Sept. 11 attacks, which will mark the first time the names of all the people killed at the World Trade Center, the Pentagon, and the field in Shanksville, Pa., will be read aloud during the ceremony. Obama, Bush, former mayor Rudy Giuliani, and others will give pre-selected readings; no dignitaries will make speeches, according to New York City Mayor Michael Bloomberg.
The memorial plaza, which features two large squares where the World Trade Center stood, is set to open on the anniversary for families and dignitaries only, and to the public the following day. The names of all of the approximately 3,000 victims are etched into the walls of the memorial.
An underground museum at the site will open in late 2012.
Eighty of the 104 stories in the office tower that will be known as One World Trade Center are expected to be complete for the anniversary. It will be the tallest building in Manhattan. An underground transit center is under construction, as are privately developed office towers in the area. —JC
HM@15 - Are You Living Up to High Expectations of Efficiency?
In 2002, a summary article in the Journal of the American Medical Association helped put the relatively small but rapidly growing HM profession on the map. Reviewing the available data, Robert Wachter, MD, MHM, and Lee Goldman, MD, MPH, of the University of California at San Francisco (UCSF) concluded that implementing a hospitalist program yielded an average savings of 13.4% in hospital costs and a 16.6% reduction in the length of stay (LOS).1
A decade later, the idea of efficiency has become so intertwined with hospitalists that SHM has included the concept in its definition of a profession that now comprises more than 30,000 doctors, nurses, and other care providers. HM practitioners work to enhance hospital and healthcare performance, in part, through “efficient use of hospital and healthcare resources,” according to SHM.
The growth of any profession can create exceptions and outliers, and observers point out that HM programs have become as varied as the hospitals in which they reside, complicating any attempt at broad generalizations. As a core part of the job description, though, efficiency and its implied benefit on costs have been widely promoted as arguments for expanding HM’s reach.
So are hospitalists meeting the lofty expectations?
A Look at the Evidence
A large retrospective study that examined outcomes of care for nearly 77,000 patients in 45 hospitals found that those cared for by hospitalists had a “modestly shorter” stay (by 0.4 days) in the hospital than those cared for by either general internists or family physicians.2 Hospitalists saved about $270 per hospitalization compared with general internists but only about $125 per stay compared with family physicians, the latter of which was not deemed statistically significant.
A more recent review of 33 studies found general agreement that hospitalist care led to reduced costs and length of stay but revealed less uniformity in the impacts on quality and patient outcomes.3
A more dramatic—albeit smaller—affirmation of HM as an efficient force has come from a study of patients admitted to 200-bed Olive View-UCLA Medical Center in Sylmar, Calif. The study, led by assistant medical director Scott Lundberg, MD, concluded that the arrival of an academic hospitalist program led to a one-year increase of $2.3 million in reimbursements from Medi-Cal, California’s Medicaid program.4
“Most other places that have demonstrated the cost-effectiveness of hospitalists generally point to reducing length of stay, which therefore reduces the costs,” Dr. Lundberg says. Under Medicare’s diagnosis-based reimbursement (DRG) system, hospitals could get paid the same amount whether the patient stays one day or five.
Medi-Cal, however, uses a straight-up per diem reimbursement system. “So reducing someone’s length of stay is not necessarily desirable if Medi-Cal would have paid you for all of those days,” Dr. Lundberg says. The state’s Medicare program also can deny coverage for days deemed medically unnecessary after a review of patient charts.
Hospitalists, he says, helped boost revenue in two ways. First, the program helped the hospital avoid denied coverage days by ensuring that patients stayed only as long as necessary. Average LOS, in fact, dropped to 1.92 days from 2.48 days, decreasing the Medi-Cal denial rate to 31.8% (from 43.8%) and bumping up the average reimbursement per inpatient day to $955 from $787.
Hospitalists also helped alleviate the work-hour limits for residents imposed by the Accreditation Council for Graduate Medical Education (ACGME), which had effectively capped the number of inpatients the center could admit. Because Olive View-UCLA receives per diem payments from Medi-Cal, making room to accept more patients into the hospital has meant increased revenues. Among the other benefits, the program has improved patient satisfaction and relieved some of the pressure on teaching teams.
With $310,000 for salary outlay in the hospitalist program’s first year, the study found a net cost benefit of $2 million. “One of the real challenges in getting this hospitalist thing going was getting our administrators to shell out the money for the salaries,” Dr. Lundberg says. The study demonstrated that a hospitalist program not only pays for itself, but also can substantially ramp up revenue. “I’m guessing that others, especially at public hospitals, face the same challenges,” he says. “I’m hoping they can point to this analysis and say, ‘Look, here’s what L.A. County did. They were able to show a net increase in revenue from this hospitalist service.’ ”
On the opposite side of the country, hospitalists are pointing to a success story in pediatric care. At the 120-bed Children’s Hospital at Montefiore at Albert Einstein College of Medicine in the Bronx, N.Y., a recent study concluded that establishing a pediatric HM program led to a significant reduction in LOS for patients with asthma or bronchiolitis.5 Nora Esteban-Cruciani, MD, MS, assistant director of pediatric hospital medicine and lead author of the report, which was presented at HM11, says it’s the first study to demonstrate such an effect for asthma in an inner-city academic setting.
Compared to a traditional resident-attending team, care administered by a resident-physician’s assistant-hospitalist team reduced LOS for bronchiolitis by 15.5% and asthma by 11.8%. With the 378 hospital-bed days saved annually, Children’s Hospital at Montefiore achieved an estimated savings of about $944,000 before taking salaries into account. “We anticipate seeing similar benefits in other groups of patients, and the total savings will far exceed the hospitalist salaries,” Dr. Esteban-Cruciani says.
After the pediatric HM program launched, her study also documented a 17% to 25% decrease in rehospitalizations among asthmatic children at four, six, and 12 months after their initial hospital discharge. As a result of the demonstrated value, Dr. Esteban-Cruciani says, the children’s hospital is expanding its HM program and hiring another 4.5 full-time equivalents.
So how did hospitalists achieve the positive results?
“Knowing the most up-to-date and evidence-based treatment plans, understanding how to use the hospital systems in the most efficient manner, being on the ward for eight to 12 hours per day to respond to issues that arise, as well as 24-hour availability by phone for the residents,” she says. “The day-to-day continuity, as well as the ability to consistently improve systems of care, are distinctive advantages to hospital medicine.”
The case for HM as a model of efficiency comes with a major caveat, however. David Meltzer, MD, PhD, FHM, chief of the section of hospital medicine and an economist and public-policy expert at the University of Chicago, points out that healthcare costs don’t end with a patient’s hospital discharge. Could savings achieved during inpatient care be offset by greater costs afterward?
A new study in the Annals of Internal Medicine by researchers at the University of Texas Medical Branch in Galveston has sharpened that question with the suggestion that, at least in some cases, hospitalist-procured savings might not last.6 When compared to care delivered by primary-care physicians (PCPs), the researchers found that hospitalist care yielded an average inpatient savings of $282 per Medicare beneficiary. But that reduction was wiped out by an extra $332 average cost in the month after discharge, due to higher readmissions, more emergency department visits, and more patients sent to nursing facilities instead of to their own homes. An accompanying editorial raises the uncomfortable question: “Are hospitalists discharging their patients more quickly but less appropriately, such that some of their patients bounce back?”7

—David Meltzer, MD, PhD, FHM, chief, section of hospital medicine, economist, University of Chicago
The study itself has its own share of caveats: Data were collected only until 2006, before reducing 30-day readmissions became a widespread focal point. The editorial also highlights the possibility that hospitalists might care for patients whose weaker relationships with outpatient providers could be the true driver of increased readmissions. In a statement, SHM President Joe Li, MD, SFHM, adds that constructive talks about healthcare costs must include the notion of quality, something the organization has worked to improve with interventions like Project BOOST.
At the very least, the new research highlights the importance of context when considering HM impacts on cost and quality. Separate studies, meanwhile, suggest that the jury is still out on whether other hospitalist-led models can consistently improve outcomes and costs. At academic centers, for instance, work-hour limits for medical residents have provided a strong impetus for joint-care arrangements, such as comanagement systems. A 2004 study found that an orthopedics-hospitalist comanagement structure led to a modest reduction in complications after elective hip and knee surgery. But the report documented no difference in costs or actual length of stay.8

More recently, a study of nearly 7,600 patients at UCSF Medical Center found that an HM-neurosurgery comanagement model had no significant impact on the center’s patient mortality, readmissions, LOS, or patient satisfaction. The comanagement system, however, yielded an average savings of $1,439 per hospitalization and boosted physicians’ perceptions of quality and safety.9
Andrew Auerbach, MD, MPH, SFHM, associate professor of medicine at UCSF Medical Center, says the savings, while not dramatic, nevertheless can add up when applied to the thousands of patients seen by the service every year. “That’s compelling because I think one of the things that you’re arguing when you’re doing these services is what the return on investment is going to be,” he says. “Traditionally, these have been implemented without any specific financial return on investment being applied, but the large expectation that clinical improvement is going to happen.”
His study at UCSF found just the opposite: no clinical improvement but a net cost benefit. “We were a little disappointed in some ways, but in other ways not surprised because there are very few data out in the community that suggest comanagement improves any outcomes,” Dr. Auerbach says. Among complicated neurosurgery patients, the strongest determinants of outcome might be beyond the scope of hospitalist-aided medical care.
With hospitals nervously eyeing their bottom lines, however, any financial improvement that does not adversely affect quality can still be seen as a positive development, and Dr. Auerbach says his study was the first to demonstrate that benefit. At UCSF Medical Center, at least, comanagement has proven compelling enough to spur plans for extending the service to orthopedic surgery patients.
Regardless of the care model, other studies suggest that specific interventions at key moments can yield substantial savings. A small, randomized controlled study led by hospitalists at Johns Hopkins University in Baltimore, for example, supports the idea that “simply showing providers the cost of some diagnostic tests at the time of order entry can affect behavior.”10 Although the study didn’t focus exclusively on hospitalists, experts say they’re in the best position to take the lead in curbing unnecessary costs.
“Hospitalists, I think, have a better understanding of the impact of resource utilization on the total cost of care and can be more prudent in the use of technologies,” says Kenneth Epstein, MD, MBA, FHM, FACP, chief medical officer for Traverse City, Mich.-based Hospitalist Consultants Inc. One reason is that hospitalists aren’t beholden to any specific technology, whether endoscopies or cardiac catheterization.

—Scott Lundberg, MD, assistant medical director, Olive View-UCLA Medical Center, Sylmar, Calif.
Mark Graban, author of the book “Lean Hospitals: Improving Quality, Patient Safety, and Employee Satisfaction,” says hospitalists can play another critical role in controlling costs by mapping out and simplifying the discharge processes. He recalls how hospitalists helped coordinate the effort by one of his hospital clients to prevent discharge delays that would have unnecessarily kept patients in the hospital for an additional night or two.
“That length-of-stay reduction, especially in a fixed-reimbursement setting, can have a huge financial impact,” Graban says. “And, inarguably, it’s the right thing to do for the patient, because it’s patients that are medically ready to be discharged. It gets them home and it reduces their increased risk of picking up infections or being involved in hospital errors.”
Focusing on patient safety could translate into big cost savings under the new Medicare system that penalizes providers for certain hospital-acquired conditions, such as skin ulcers and urinary tract infections, Dr. Epstein says. “There’s an emphasis by hospitalists in understanding the system and being willing to put energy into things like documenting ‘present on admission,’ which then has a huge impact on the hospital,” he says. Close monitoring of patients and developing standardization of care can likewise minimize the risk of conditions, such as catheter-associated infections, from cropping up in the hospital.
Dr. Meltzer says his own research suggests that experienced hospitalists are most effective at controlling costs. “So a program that is structured in such a way as to hire or retain experienced hospitalists is likely to have a higher cost savings than one that doesn’t,” he says.
In a broader sense, the maturation of the HM model and more widespread adoption of effective methods by practitioners might be boosting the overall impact of hospitalist care. A study that examined nearly 2 million Medicare admissions over six years found that the effects of the hospitalist care model on LOS became progressively more pronounced over time, from an average reduction of only 0.02 inpatient days in 2001-2002 to a decrease of 0.35 days by 2005-2006.11
Interestingly, the study’s authors suggest that effects attributable to hospitalists were most pronounced among older, complicated, nonsurgical patients cared for at nonprofit community hospitals.
The Verdict
Despite the variable design and scope of individual programs, experts say, HM’s overall net positive on the efficiency of inpatient care is fairly well documented. Future considerations of hospitalists’ true effects on costs, however, will demand an accounting of healthcare across an entire system, where the HM impact is decidedly less certain. “The right comparison in some sense is, What are the total costs of care for a patient cared for in a system that uses hospitalists versus the totals costs of similar patients cared for in a system that doesn’t use hospitalists?” Dr. Meltzer says.
David Mitchell, MD, PhD, a hospitalist at Sibley Memorial Hospital in Washington, D.C., and a member of SHM’s Performance Standards Committee, is among those with an additional concern: Providers may not be taking full advantage of their position to control costs.
“The reason is primarily that the reimbursement structure is not set up to incentivize us to cut costs,” he says. Dr. Mitchell, who has worked in 12 hospitals in six states, argues that hospitalists still are too detached from the true price of ordered tests. “That’s what I fear in hospital medicine, that we just become robots: chest pain means CT scan without thinking,” he says. “This just doesn’t make sense.” Dr. Mitchell also contends that the focus of some HM programs on seeing as many patients as possible to maximize reimbursements is leading to less efficiency. At HM11 in May, he met another hospitalist who said he regularly saw 40 to 45 patients every day. “I know there’s absolutely no way you can see that many patients and do an efficient job,” Dr. Mitchell says.
If one of the clearest areas of success for hospitalists has been in reducing length of stay within a hospital, experts acknowledge that it may no longer be enough. “In the new payment model, success is going to be defined differently, and it will be in terms of reducing the total cost of care,” Dr. Meltzer says.
Over the next decade, hospitalists will need to respond to new set of incentives. “And I think one of the really interesting questions will be how hospitalists can best do that, and the extent to which it causes them to rethink the ways in which they organize their practice,” he says.
Bryn Nelson is a freelance medical writer based in Seattle.
References
- Wachter RM, Goldman L. The hospitalist movement 5 years later. JAMA. 2002;287(4):487-494.
- Lindenauer PK, Rothberg MB, Pekow PS, Kenwood C, Benjamin EM, Auerbach AD. Outcomes of care by hospitalists, general internists, and family physicians. N Engl J Med. 2007;357:2589-2600.
- Peterson MC. A systematic review of outcomes and quality measures in adult patients cared for by hospitalists vs nonhospitalists. Mayo Clin Proc. 2009;84(3): 248-254.
- Lundberg S, Balingit P, Wali S, Cope D. Cost-effectiveness of a hospitalist service in a public teaching hospital. Acad Med. 2010;85(8):1312-1315.
- Esteban-Cruciani N, Montejo J, Azzarone G, Douglas L, et al. Impact of a pediatric hospital medicine program on resource utilization for children with respiratory disorders. J Hosp Med. 2011;6(4)Supp 2:S27.
- Kuo Y-F, Goodwin JS. Association of hospitalist care with medical utilization after discharge: evidence of cost shift from a cohort study. Ann Intern Med. 2011;155(3): 152-159.
- Chen LM, Saint S. Moments in time. Ann Intern Med. 2011;155(3):194-195.
- Huddleston JM, Long KH, Naessens JM, et al. Medical and surgical comanagement after elective hip and knee arthroplasty: a randomized, controlled trial. Ann Intern Med. 2004;141(1):28-38.
- Auerbach AD, Wachter RM, Cheng HQ, et al. Comanagement of surgical patients between neurosurgeons and hospitalists. Arch Intern Med. 2010;170(22): 2004-2010.
- Feldman L, Thiemann D, Brotman D. Financial impact of presenting lab cost data to providers at the time of order entry: a randomized controlled clinical trial. J Hosp Med. 2011;6(4)Supp 2:S93.
- Kuo Y-F, Goodwin JS. Effect of hospitalists on length of stay in the Medicare population: variation according to hospital and patient characteristics. J Am Geriatr Soc. 2010;58:1649-1657.
- Epstein K, Juarez E, Epstein A, Loya K, Singer A. The impact of fragmentation of hospitalist care on length of stay. J Hosp Med. 2010;5(6):335-8.
- Chandra S, Howell E, Wright S. CICLE: Creating incentives and continuity leading to efficiency. J Hosp Med. 2011;6(4)Supp 2:S17
In 2002, a summary article in the Journal of the American Medical Association helped put the relatively small but rapidly growing HM profession on the map. Reviewing the available data, Robert Wachter, MD, MHM, and Lee Goldman, MD, MPH, of the University of California at San Francisco (UCSF) concluded that implementing a hospitalist program yielded an average savings of 13.4% in hospital costs and a 16.6% reduction in the length of stay (LOS).1
A decade later, the idea of efficiency has become so intertwined with hospitalists that SHM has included the concept in its definition of a profession that now comprises more than 30,000 doctors, nurses, and other care providers. HM practitioners work to enhance hospital and healthcare performance, in part, through “efficient use of hospital and healthcare resources,” according to SHM.
The growth of any profession can create exceptions and outliers, and observers point out that HM programs have become as varied as the hospitals in which they reside, complicating any attempt at broad generalizations. As a core part of the job description, though, efficiency and its implied benefit on costs have been widely promoted as arguments for expanding HM’s reach.
So are hospitalists meeting the lofty expectations?
A Look at the Evidence
A large retrospective study that examined outcomes of care for nearly 77,000 patients in 45 hospitals found that those cared for by hospitalists had a “modestly shorter” stay (by 0.4 days) in the hospital than those cared for by either general internists or family physicians.2 Hospitalists saved about $270 per hospitalization compared with general internists but only about $125 per stay compared with family physicians, the latter of which was not deemed statistically significant.
A more recent review of 33 studies found general agreement that hospitalist care led to reduced costs and length of stay but revealed less uniformity in the impacts on quality and patient outcomes.3
A more dramatic—albeit smaller—affirmation of HM as an efficient force has come from a study of patients admitted to 200-bed Olive View-UCLA Medical Center in Sylmar, Calif. The study, led by assistant medical director Scott Lundberg, MD, concluded that the arrival of an academic hospitalist program led to a one-year increase of $2.3 million in reimbursements from Medi-Cal, California’s Medicaid program.4
“Most other places that have demonstrated the cost-effectiveness of hospitalists generally point to reducing length of stay, which therefore reduces the costs,” Dr. Lundberg says. Under Medicare’s diagnosis-based reimbursement (DRG) system, hospitals could get paid the same amount whether the patient stays one day or five.
Medi-Cal, however, uses a straight-up per diem reimbursement system. “So reducing someone’s length of stay is not necessarily desirable if Medi-Cal would have paid you for all of those days,” Dr. Lundberg says. The state’s Medicare program also can deny coverage for days deemed medically unnecessary after a review of patient charts.
Hospitalists, he says, helped boost revenue in two ways. First, the program helped the hospital avoid denied coverage days by ensuring that patients stayed only as long as necessary. Average LOS, in fact, dropped to 1.92 days from 2.48 days, decreasing the Medi-Cal denial rate to 31.8% (from 43.8%) and bumping up the average reimbursement per inpatient day to $955 from $787.
Hospitalists also helped alleviate the work-hour limits for residents imposed by the Accreditation Council for Graduate Medical Education (ACGME), which had effectively capped the number of inpatients the center could admit. Because Olive View-UCLA receives per diem payments from Medi-Cal, making room to accept more patients into the hospital has meant increased revenues. Among the other benefits, the program has improved patient satisfaction and relieved some of the pressure on teaching teams.
With $310,000 for salary outlay in the hospitalist program’s first year, the study found a net cost benefit of $2 million. “One of the real challenges in getting this hospitalist thing going was getting our administrators to shell out the money for the salaries,” Dr. Lundberg says. The study demonstrated that a hospitalist program not only pays for itself, but also can substantially ramp up revenue. “I’m guessing that others, especially at public hospitals, face the same challenges,” he says. “I’m hoping they can point to this analysis and say, ‘Look, here’s what L.A. County did. They were able to show a net increase in revenue from this hospitalist service.’ ”
On the opposite side of the country, hospitalists are pointing to a success story in pediatric care. At the 120-bed Children’s Hospital at Montefiore at Albert Einstein College of Medicine in the Bronx, N.Y., a recent study concluded that establishing a pediatric HM program led to a significant reduction in LOS for patients with asthma or bronchiolitis.5 Nora Esteban-Cruciani, MD, MS, assistant director of pediatric hospital medicine and lead author of the report, which was presented at HM11, says it’s the first study to demonstrate such an effect for asthma in an inner-city academic setting.
Compared to a traditional resident-attending team, care administered by a resident-physician’s assistant-hospitalist team reduced LOS for bronchiolitis by 15.5% and asthma by 11.8%. With the 378 hospital-bed days saved annually, Children’s Hospital at Montefiore achieved an estimated savings of about $944,000 before taking salaries into account. “We anticipate seeing similar benefits in other groups of patients, and the total savings will far exceed the hospitalist salaries,” Dr. Esteban-Cruciani says.
After the pediatric HM program launched, her study also documented a 17% to 25% decrease in rehospitalizations among asthmatic children at four, six, and 12 months after their initial hospital discharge. As a result of the demonstrated value, Dr. Esteban-Cruciani says, the children’s hospital is expanding its HM program and hiring another 4.5 full-time equivalents.
So how did hospitalists achieve the positive results?
“Knowing the most up-to-date and evidence-based treatment plans, understanding how to use the hospital systems in the most efficient manner, being on the ward for eight to 12 hours per day to respond to issues that arise, as well as 24-hour availability by phone for the residents,” she says. “The day-to-day continuity, as well as the ability to consistently improve systems of care, are distinctive advantages to hospital medicine.”
The case for HM as a model of efficiency comes with a major caveat, however. David Meltzer, MD, PhD, FHM, chief of the section of hospital medicine and an economist and public-policy expert at the University of Chicago, points out that healthcare costs don’t end with a patient’s hospital discharge. Could savings achieved during inpatient care be offset by greater costs afterward?
A new study in the Annals of Internal Medicine by researchers at the University of Texas Medical Branch in Galveston has sharpened that question with the suggestion that, at least in some cases, hospitalist-procured savings might not last.6 When compared to care delivered by primary-care physicians (PCPs), the researchers found that hospitalist care yielded an average inpatient savings of $282 per Medicare beneficiary. But that reduction was wiped out by an extra $332 average cost in the month after discharge, due to higher readmissions, more emergency department visits, and more patients sent to nursing facilities instead of to their own homes. An accompanying editorial raises the uncomfortable question: “Are hospitalists discharging their patients more quickly but less appropriately, such that some of their patients bounce back?”7
—David Meltzer, MD, PhD, FHM, chief, section of hospital medicine, economist, University of Chicago
The study itself has its own share of caveats: Data were collected only until 2006, before reducing 30-day readmissions became a widespread focal point. The editorial also highlights the possibility that hospitalists might care for patients whose weaker relationships with outpatient providers could be the true driver of increased readmissions. In a statement, SHM President Joe Li, MD, SFHM, adds that constructive talks about healthcare costs must include the notion of quality, something the organization has worked to improve with interventions like Project BOOST.
At the very least, the new research highlights the importance of context when considering HM impacts on cost and quality. Separate studies, meanwhile, suggest that the jury is still out on whether other hospitalist-led models can consistently improve outcomes and costs. At academic centers, for instance, work-hour limits for medical residents have provided a strong impetus for joint-care arrangements, such as comanagement systems. A 2004 study found that an orthopedics-hospitalist comanagement structure led to a modest reduction in complications after elective hip and knee surgery. But the report documented no difference in costs or actual length of stay.8
More recently, a study of nearly 7,600 patients at UCSF Medical Center found that an HM-neurosurgery comanagement model had no significant impact on the center’s patient mortality, readmissions, LOS, or patient satisfaction. The comanagement system, however, yielded an average savings of $1,439 per hospitalization and boosted physicians’ perceptions of quality and safety.9
Andrew Auerbach, MD, MPH, SFHM, associate professor of medicine at UCSF Medical Center, says the savings, while not dramatic, nevertheless can add up when applied to the thousands of patients seen by the service every year. “That’s compelling because I think one of the things that you’re arguing when you’re doing these services is what the return on investment is going to be,” he says. “Traditionally, these have been implemented without any specific financial return on investment being applied, but the large expectation that clinical improvement is going to happen.”
His study at UCSF found just the opposite: no clinical improvement but a net cost benefit. “We were a little disappointed in some ways, but in other ways not surprised because there are very few data out in the community that suggest comanagement improves any outcomes,” Dr. Auerbach says. Among complicated neurosurgery patients, the strongest determinants of outcome might be beyond the scope of hospitalist-aided medical care.
With hospitals nervously eyeing their bottom lines, however, any financial improvement that does not adversely affect quality can still be seen as a positive development, and Dr. Auerbach says his study was the first to demonstrate that benefit. At UCSF Medical Center, at least, comanagement has proven compelling enough to spur plans for extending the service to orthopedic surgery patients.
Regardless of the care model, other studies suggest that specific interventions at key moments can yield substantial savings. A small, randomized controlled study led by hospitalists at Johns Hopkins University in Baltimore, for example, supports the idea that “simply showing providers the cost of some diagnostic tests at the time of order entry can affect behavior.”10 Although the study didn’t focus exclusively on hospitalists, experts say they’re in the best position to take the lead in curbing unnecessary costs.
“Hospitalists, I think, have a better understanding of the impact of resource utilization on the total cost of care and can be more prudent in the use of technologies,” says Kenneth Epstein, MD, MBA, FHM, FACP, chief medical officer for Traverse City, Mich.-based Hospitalist Consultants Inc. One reason is that hospitalists aren’t beholden to any specific technology, whether endoscopies or cardiac catheterization.
—Scott Lundberg, MD, assistant medical director, Olive View-UCLA Medical Center, Sylmar, Calif.
Mark Graban, author of the book “Lean Hospitals: Improving Quality, Patient Safety, and Employee Satisfaction,” says hospitalists can play another critical role in controlling costs by mapping out and simplifying the discharge processes. He recalls how hospitalists helped coordinate the effort by one of his hospital clients to prevent discharge delays that would have unnecessarily kept patients in the hospital for an additional night or two.
“That length-of-stay reduction, especially in a fixed-reimbursement setting, can have a huge financial impact,” Graban says. “And, inarguably, it’s the right thing to do for the patient, because it’s patients that are medically ready to be discharged. It gets them home and it reduces their increased risk of picking up infections or being involved in hospital errors.”
Focusing on patient safety could translate into big cost savings under the new Medicare system that penalizes providers for certain hospital-acquired conditions, such as skin ulcers and urinary tract infections, Dr. Epstein says. “There’s an emphasis by hospitalists in understanding the system and being willing to put energy into things like documenting ‘present on admission,’ which then has a huge impact on the hospital,” he says. Close monitoring of patients and developing standardization of care can likewise minimize the risk of conditions, such as catheter-associated infections, from cropping up in the hospital.
Dr. Meltzer says his own research suggests that experienced hospitalists are most effective at controlling costs. “So a program that is structured in such a way as to hire or retain experienced hospitalists is likely to have a higher cost savings than one that doesn’t,” he says.
In a broader sense, the maturation of the HM model and more widespread adoption of effective methods by practitioners might be boosting the overall impact of hospitalist care. A study that examined nearly 2 million Medicare admissions over six years found that the effects of the hospitalist care model on LOS became progressively more pronounced over time, from an average reduction of only 0.02 inpatient days in 2001-2002 to a decrease of 0.35 days by 2005-2006.11
Interestingly, the study’s authors suggest that effects attributable to hospitalists were most pronounced among older, complicated, nonsurgical patients cared for at nonprofit community hospitals.
The Verdict
Despite the variable design and scope of individual programs, experts say, HM’s overall net positive on the efficiency of inpatient care is fairly well documented. Future considerations of hospitalists’ true effects on costs, however, will demand an accounting of healthcare across an entire system, where the HM impact is decidedly less certain. “The right comparison in some sense is, What are the total costs of care for a patient cared for in a system that uses hospitalists versus the totals costs of similar patients cared for in a system that doesn’t use hospitalists?” Dr. Meltzer says.
David Mitchell, MD, PhD, a hospitalist at Sibley Memorial Hospital in Washington, D.C., and a member of SHM’s Performance Standards Committee, is among those with an additional concern: Providers may not be taking full advantage of their position to control costs.
“The reason is primarily that the reimbursement structure is not set up to incentivize us to cut costs,” he says. Dr. Mitchell, who has worked in 12 hospitals in six states, argues that hospitalists still are too detached from the true price of ordered tests. “That’s what I fear in hospital medicine, that we just become robots: chest pain means CT scan without thinking,” he says. “This just doesn’t make sense.” Dr. Mitchell also contends that the focus of some HM programs on seeing as many patients as possible to maximize reimbursements is leading to less efficiency. At HM11 in May, he met another hospitalist who said he regularly saw 40 to 45 patients every day. “I know there’s absolutely no way you can see that many patients and do an efficient job,” Dr. Mitchell says.
If one of the clearest areas of success for hospitalists has been in reducing length of stay within a hospital, experts acknowledge that it may no longer be enough. “In the new payment model, success is going to be defined differently, and it will be in terms of reducing the total cost of care,” Dr. Meltzer says.
Over the next decade, hospitalists will need to respond to new set of incentives. “And I think one of the really interesting questions will be how hospitalists can best do that, and the extent to which it causes them to rethink the ways in which they organize their practice,” he says.
Bryn Nelson is a freelance medical writer based in Seattle.
References
- Wachter RM, Goldman L. The hospitalist movement 5 years later. JAMA. 2002;287(4):487-494.
- Lindenauer PK, Rothberg MB, Pekow PS, Kenwood C, Benjamin EM, Auerbach AD. Outcomes of care by hospitalists, general internists, and family physicians. N Engl J Med. 2007;357:2589-2600.
- Peterson MC. A systematic review of outcomes and quality measures in adult patients cared for by hospitalists vs nonhospitalists. Mayo Clin Proc. 2009;84(3): 248-254.
- Lundberg S, Balingit P, Wali S, Cope D. Cost-effectiveness of a hospitalist service in a public teaching hospital. Acad Med. 2010;85(8):1312-1315.
- Esteban-Cruciani N, Montejo J, Azzarone G, Douglas L, et al. Impact of a pediatric hospital medicine program on resource utilization for children with respiratory disorders. J Hosp Med. 2011;6(4)Supp 2:S27.
- Kuo Y-F, Goodwin JS. Association of hospitalist care with medical utilization after discharge: evidence of cost shift from a cohort study. Ann Intern Med. 2011;155(3): 152-159.
- Chen LM, Saint S. Moments in time. Ann Intern Med. 2011;155(3):194-195.
- Huddleston JM, Long KH, Naessens JM, et al. Medical and surgical comanagement after elective hip and knee arthroplasty: a randomized, controlled trial. Ann Intern Med. 2004;141(1):28-38.
- Auerbach AD, Wachter RM, Cheng HQ, et al. Comanagement of surgical patients between neurosurgeons and hospitalists. Arch Intern Med. 2010;170(22): 2004-2010.
- Feldman L, Thiemann D, Brotman D. Financial impact of presenting lab cost data to providers at the time of order entry: a randomized controlled clinical trial. J Hosp Med. 2011;6(4)Supp 2:S93.
- Kuo Y-F, Goodwin JS. Effect of hospitalists on length of stay in the Medicare population: variation according to hospital and patient characteristics. J Am Geriatr Soc. 2010;58:1649-1657.
- Epstein K, Juarez E, Epstein A, Loya K, Singer A. The impact of fragmentation of hospitalist care on length of stay. J Hosp Med. 2010;5(6):335-8.
- Chandra S, Howell E, Wright S. CICLE: Creating incentives and continuity leading to efficiency. J Hosp Med. 2011;6(4)Supp 2:S17
Hospitalists On The Move -- September 2011

Eardly K. Wickramasinghe, MD, has been named the 2011 recipient of the Pennsylvania Medical Society’s Physician Award for Community Voluntary Service. Dr. Wickramasinghe, a general practitioner and hospitalist with Erie Physicians Network who works at Saint Vincent Health Center, was chosen for the award after the statewide organization’s board of trustees voted unanimously to award him the honor. Dr. Wickramasinghe has a long history of volunteerism in the Erie community. He organized the Start Your Day Right breakfast food collection drive. He also initiated the Sheltering the Community program, which created and administered a team of area physicians to conduct bimonthly medical clinics at homeless shelters.
Robert M. Wachter, MD, MHM, professor of medicine at the University of California at San Francisco (UCSF), associate chairman of UCSF’s Department of Medicine, chief of the medical service at UCSF Medical Center, and chief of UCSF’s division of hospital medicine, has been named chair-elect of the American Board of Internal Medicine’s (ABIM) board of directors. He also serves on ABIM’s executive committee.
Hospitalist Adeeb Jaber, MD, recently was chosen as Outstanding Physician of the Year at Anne Arundel Medical Center in Maryland—an honor bestowed by the hospital’s nurses. Dr. Jaber was the top vote-getter out of 1,000 cast by the center’s nurses, who were asked to nominate a doctor considered a role model and who “collaborates and communicates for care.” He has been on staff at the hospital since July 2008.
Tosha B. Wetterneck, MD, MS, FACP, has been named president-elect of the Wisconsin Medical Society. Dr. Wetterneck is associate professor of medicine at the University of Wisconsin School of Medicine and Public Health, and a general internist and hospitalist at UW Hospital and Clinics.
Julie Coffman Barnes, MD, has been named chief medical officer at Redmond Regional Medical Center in Georgia. Dr. Barnes will work alongside hospital personnel in patient safety and quality initiatives as well as evaluation of new clinical programs and technologies.
In Memoriam
Ryan L. Moore, MD, 36, a hospitalist at St. Francis Regional Medical Center in Topeka, Kan., died last month while kayaking along the Kansas River. Dr. Moore had recently accepted an appointment to become chief of staff at the hospital.
Dr. Moore was board-certified in internal medicine and pediatrics, and previously worked with Emergency Medical Services at Cushing Memorial Hospital in Leavenworth, Kan., and Emergency Medicine at Lawrence Memorial Hospital.
Personalized Privileges

Every SHM member signs up for different reasons. For some, it’s career development. For others, it’s discounts on industry-leading resources like SHM’s annual meeting or access to quality-improvement (QI) resources like SHM’s new SQUINT (see “SQUINT Is Looking Out for You,” July 2011, p. 6).
But a common theme emerges, even among a variety of hospitalists across the country: For hospitalists, SHM is home.
HM has grown and evolved at a breakneck pace over the past 15 years, going from a few hundred hospitalists in 1996 to an estimated 30,000-plus today. The growth of a previously undefined specialty, coupled with the very public tumult and change in healthcare delivery, has made thousands of hospitalists eager for a community to call their own.
“It’s important for hospitalists to know that there’s an organization that can help and support them,” says Gopal Sarker, MD, a Springfield, Mass. -based hospitalist and chief medical officer of Accountable Care Associates in Springfield. When Sarker first became an SHM member in 2003, he signed up for the added credibility that membership brought to his new career as a hospitalist.
—Kim Dickinson, chief operating officer of hospital medicine, HCA Physician Services, Nashville, Tenn.
His new membership, he says, implied increased recognition for his own career and the specialty. “At the time, there weren’t that many hospitalists around,” he says. “We knew we needed to get more organized and involved. That’s why I got involved.”
Not every member uses every product, service, and benefit SHM offers, but many hospitalists who integrate SHM’s offerings into their professional lives have forged new career paths, formed valuable relationships, and created their own sense of personal and professional reward.
“I joined because I was a newly minted hospitalist, having just joined the group at Hopkins,” says Lenny Feldman, MD, FACP, FAAP, SFHM, the Med-Peds Urban Health Residency program director at Johns Hopkins School of Medicine in Baltimore. “I heard that this was our society, and I wanted to be involved with the society for hospital medicine. It seemed like it was a perfect fit. I had been to other meetings, and it seemed that SHM was destined to be my home organization.”
SHM: Moving Hospitalist Careers Up
In the early days, individual hospitalists largely were responsible for making the case for the specialty and their own careers. Today, SHM membership programs help hospitalists make their case getting hired and promoted, in addition to their individual commitment and accomplishments.
Even in a hiring environment in which hospitalists are in high demand, SHM membership and involvement can help a hospitalist’s resume rise to the top of the stack.
“We’re a growing hospitalist program and I’m always impressed when I see someone that’s an SHM member,” says Erik DeLue, MD, MBA, SFHM, who, as medical director of the hospitalist program at Virtua Memorial in Mount Holly, N.J., makes hiring and promotion decisions. “That tells me that they’re serious about being a hospitalist. Especially if they’re a resident, it tells me that this is someone that is really looking at this as a career. It’s almost a deficit if they’ve been doing hospital medicine and they’re not a member.”

To many hospitalists, career development doesn’t stop at the hospital door. SHM has provided a national platform for great ideas that improve the specialty and advance careers at the same time.
Dr. Feldman saw the need to provide more education to hospitalists involved in the comanagement of surgical patients and led the effort to create SHMConsults.com, a new online consultative and perioperative curriculum. The ability to collaborate with SHM on the project gave his concept additional reach and authority throughout the specialty.
“Clearly, having the backing of the society of our educational materials gives it that much more prominence and, hopefully, will entice more hospitalists to use it,” he says. “I’m very hopeful that it will continue to grow and be an important part of the society’s education.”
Though he joined seven years ago, Dr. Feldman still considers himself one of the new members.
“I see all the folks who have been involved with SHM much longer and am amazed by their involvement,” he adds. “It’s a testament to the agility of an organization like this that it’s not so large that newer members can still have an impact.”
Dr. DeLue, who has been a member for more than 10 years, tells the same thing to future SHM members.
“I hire hospitalists all the time and I say, ‘Look, this is the one society that reflects what you’re doing,’ ” he says, “ ‘and if you have any interest in being heard on things that you think are important, this is the place for you.’ I can’t imagine becoming a hospitalist and not becoming a member.”
Connections Improve the Specialty
As change leaders in hospitals, hospitalists thrive on information from other hospitals and the connections that transfer that information. For hospitalist Sabrena Tangri, MD, and HM executive Kim Dickinson, one of SHM’s greatest resources is the connection to other hospitalists.
Dr. Tangri, an academic hospitalist at Inova Fairfax Hospital in northern Virginia, is actively developing a new SHM chapter for the Washington, D.C., area. Even before completing residency in 2009, she had interest in the big-picture issues of patient satisfaction and providing efficient, effective care to inpatients.
In addition to building a support structure for hospitalists working near the nation’s capital, she uses SHM as a connection to relevant information in other hospitals—and to offer up her own experiences to other hospitalists throughout the country. “It’s a joint partnership between the physician and the organization,” she says.
Dickinson, chief operating officer of hospital medicine at Nashville, Tenn.-based HCA Physician Services, has been an SHM member for long enough that she doesn’t remember the year she joined. What she does remember is the feeling of excitement that permeated her first annual meeting more than a decade ago: “There were a couple hundred people there in a hotel basement and I remember thinking, ‘This is something,’ ” she says.
Back then, Dickinson’s membership in SHM was equal parts credibility and commitment to the specialty. “As the society was growing, it felt like an obligation to stand beside colleagues and say, ‘This is important.’ In the beginning, it felt important to stand up and be counted,” she says.
That commitment still resonates with her today. It’s something that she has communicated to others over the years.
“I always told people, ‘If you can’t wake up excited about being the future of medicine, then you shouldn’t work here.’ It’s an absolute privilege to work in hospital medicine,” Dickinson says. “We’re at a very privileged place in history.”
Today, she uses that passion and the connections she has developed through SHM to improve HCA Physician Services and the entire specialty.
“I’ve developed friendships with others outside my organization in the field, which is good for sharing information,” she says. “There are no secrets about providing the best care. Everybody has the same version of the special sauce; sharing it doesn’t dilute it, it makes the industry better.
“Being a part of SHM and being part of hospital medicine is an opportunity to create the direction of medicine. We do that every day. You can’t be cooler that.”
Brendon Shank is associate vice president of communications for SHM.
Every SHM member signs up for different reasons. For some, it’s career development. For others, it’s discounts on industry-leading resources like SHM’s annual meeting or access to quality-improvement (QI) resources like SHM’s new SQUINT (see “SQUINT Is Looking Out for You,” July 2011, p. 6).
But a common theme emerges, even among a variety of hospitalists across the country: For hospitalists, SHM is home.
HM has grown and evolved at a breakneck pace over the past 15 years, going from a few hundred hospitalists in 1996 to an estimated 30,000-plus today. The growth of a previously undefined specialty, coupled with the very public tumult and change in healthcare delivery, has made thousands of hospitalists eager for a community to call their own.
“It’s important for hospitalists to know that there’s an organization that can help and support them,” says Gopal Sarker, MD, a Springfield, Mass. -based hospitalist and chief medical officer of Accountable Care Associates in Springfield. When Sarker first became an SHM member in 2003, he signed up for the added credibility that membership brought to his new career as a hospitalist.
—Kim Dickinson, chief operating officer of hospital medicine, HCA Physician Services, Nashville, Tenn.
His new membership, he says, implied increased recognition for his own career and the specialty. “At the time, there weren’t that many hospitalists around,” he says. “We knew we needed to get more organized and involved. That’s why I got involved.”
Not every member uses every product, service, and benefit SHM offers, but many hospitalists who integrate SHM’s offerings into their professional lives have forged new career paths, formed valuable relationships, and created their own sense of personal and professional reward.
“I joined because I was a newly minted hospitalist, having just joined the group at Hopkins,” says Lenny Feldman, MD, FACP, FAAP, SFHM, the Med-Peds Urban Health Residency program director at Johns Hopkins School of Medicine in Baltimore. “I heard that this was our society, and I wanted to be involved with the society for hospital medicine. It seemed like it was a perfect fit. I had been to other meetings, and it seemed that SHM was destined to be my home organization.”
SHM: Moving Hospitalist Careers Up
In the early days, individual hospitalists largely were responsible for making the case for the specialty and their own careers. Today, SHM membership programs help hospitalists make their case getting hired and promoted, in addition to their individual commitment and accomplishments.
Even in a hiring environment in which hospitalists are in high demand, SHM membership and involvement can help a hospitalist’s resume rise to the top of the stack.
“We’re a growing hospitalist program and I’m always impressed when I see someone that’s an SHM member,” says Erik DeLue, MD, MBA, SFHM, who, as medical director of the hospitalist program at Virtua Memorial in Mount Holly, N.J., makes hiring and promotion decisions. “That tells me that they’re serious about being a hospitalist. Especially if they’re a resident, it tells me that this is someone that is really looking at this as a career. It’s almost a deficit if they’ve been doing hospital medicine and they’re not a member.”
To many hospitalists, career development doesn’t stop at the hospital door. SHM has provided a national platform for great ideas that improve the specialty and advance careers at the same time.
Dr. Feldman saw the need to provide more education to hospitalists involved in the comanagement of surgical patients and led the effort to create SHMConsults.com, a new online consultative and perioperative curriculum. The ability to collaborate with SHM on the project gave his concept additional reach and authority throughout the specialty.
“Clearly, having the backing of the society of our educational materials gives it that much more prominence and, hopefully, will entice more hospitalists to use it,” he says. “I’m very hopeful that it will continue to grow and be an important part of the society’s education.”
Though he joined seven years ago, Dr. Feldman still considers himself one of the new members.
“I see all the folks who have been involved with SHM much longer and am amazed by their involvement,” he adds. “It’s a testament to the agility of an organization like this that it’s not so large that newer members can still have an impact.”
Dr. DeLue, who has been a member for more than 10 years, tells the same thing to future SHM members.
“I hire hospitalists all the time and I say, ‘Look, this is the one society that reflects what you’re doing,’ ” he says, “ ‘and if you have any interest in being heard on things that you think are important, this is the place for you.’ I can’t imagine becoming a hospitalist and not becoming a member.”
Connections Improve the Specialty
As change leaders in hospitals, hospitalists thrive on information from other hospitals and the connections that transfer that information. For hospitalist Sabrena Tangri, MD, and HM executive Kim Dickinson, one of SHM’s greatest resources is the connection to other hospitalists.
Dr. Tangri, an academic hospitalist at Inova Fairfax Hospital in northern Virginia, is actively developing a new SHM chapter for the Washington, D.C., area. Even before completing residency in 2009, she had interest in the big-picture issues of patient satisfaction and providing efficient, effective care to inpatients.
In addition to building a support structure for hospitalists working near the nation’s capital, she uses SHM as a connection to relevant information in other hospitals—and to offer up her own experiences to other hospitalists throughout the country. “It’s a joint partnership between the physician and the organization,” she says.
Dickinson, chief operating officer of hospital medicine at Nashville, Tenn.-based HCA Physician Services, has been an SHM member for long enough that she doesn’t remember the year she joined. What she does remember is the feeling of excitement that permeated her first annual meeting more than a decade ago: “There were a couple hundred people there in a hotel basement and I remember thinking, ‘This is something,’ ” she says.
Back then, Dickinson’s membership in SHM was equal parts credibility and commitment to the specialty. “As the society was growing, it felt like an obligation to stand beside colleagues and say, ‘This is important.’ In the beginning, it felt important to stand up and be counted,” she says.
That commitment still resonates with her today. It’s something that she has communicated to others over the years.
“I always told people, ‘If you can’t wake up excited about being the future of medicine, then you shouldn’t work here.’ It’s an absolute privilege to work in hospital medicine,” Dickinson says. “We’re at a very privileged place in history.”
Today, she uses that passion and the connections she has developed through SHM to improve HCA Physician Services and the entire specialty.
“I’ve developed friendships with others outside my organization in the field, which is good for sharing information,” she says. “There are no secrets about providing the best care. Everybody has the same version of the special sauce; sharing it doesn’t dilute it, it makes the industry better.
“Being a part of SHM and being part of hospital medicine is an opportunity to create the direction of medicine. We do that every day. You can’t be cooler that.”
Brendon Shank is associate vice president of communications for SHM.
Nocturnists’ Compensation Puzzles Practice Leaders
Welcome to “Survey Insights,” a new section devoted to exploring and interpreting information from the survey conducted jointly by SHM and the Medical Group Management Association (MGMA). Each month we will focus on a specific topic, providing not only the survey results, but also background information and commentary from members of SHM’s Practice Analysis Committee.
With this month’s release of the 2010-2011 State of Hospital Medicine report, we now have several useful data points regarding the work of nocturnists in HM. In the survey, nocturnist was defined as an individual hospitalist who predominantly works a schedule providing in-house night coverage for inpatients. The question “Does your practice include nocturnists?” was part of the survey’s HM Supplement, and was answered by 238 of the 307 supplement respondents. As was the case last year, 41% of HM practices responding to the survey reported having nocturnists working in their group.
Although less than half of respondent groups reported having nocturnists, more than 55% of the individual hospitalists in the data set worked in groups with nocturnists. This suggests that nocturnists tend to be found more often in larger HM groups.
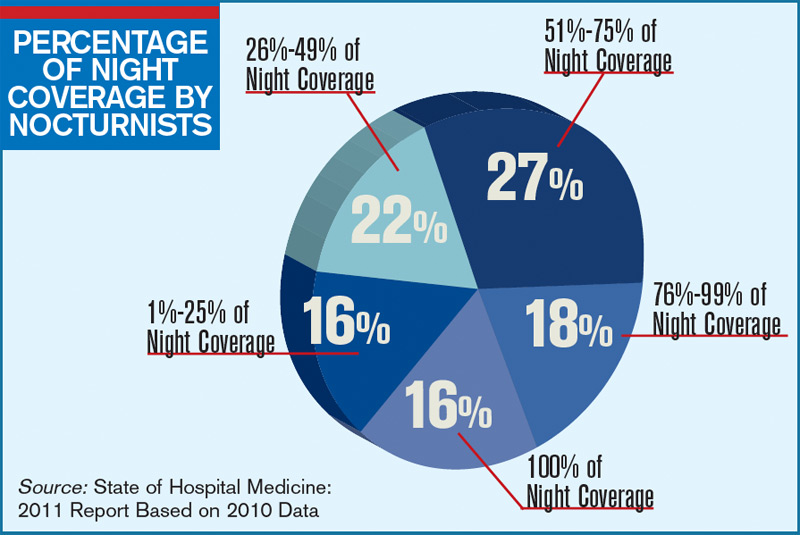
The proportion of night coverage provided by nocturnists varied widely among groups, as can be seen in the chart (see “Percentage of Night Coverage by Nocturnists,” p. 11). Only 16% of the groups with nocturnists used them for all of their night coverage. For about half the groups, the nocturnists provide from one-quarter to three-quarters of the night coverage. This year, data were also obtained on compensation and productivity for 131 nocturnists. Perhaps the most surprising finding is that the median compensation reported for nocturnists in practices that care for adults was $215,000, about 2.5% lower than the median compensation reported for all adult hospitalists. (There was not enough pediatric nocturnist data to report results.)
It’s no surprise, however, that median annual nocturnist productivity was 3,058 wRVUs, about 27% lower than the productivity reported for all adult hospitalists. This suggests that even though median compensation for nocturnists is a bit lower, the “juice to squeeze” ratio for working exclusively at night remains higher than for daytime work.
According to committee member Dan Fuller, president and cofounder of Alpharetta, Ga.-based InCompass Health Inc., “this data supports what we already know: that nocturnists are not as productive as the typical rounding hospitalist. However, they are necessary in most of the larger models, given the need for a physician to be in-house at night for both admissions and emergencies.”
Committee members weren’t sure how to interpret the lower nocturnist compensation, because for many the finding differs from the situation in their own practices. Chris Frost, MD, FHM, vice president of operations for Knoxville, Tenn.-based TeamHealth, postulates that “unless productivity thresholds are adjusted for nocturnists, they will rarely achieve productivity incentives” earned by daytime hospitalists. And PAC member John Nelson, MD, MHM, points out, “There’s more than one way of compensating nocturnists for the inconvenience of working at night. The three nocturnists in our practice, for example, make about the same as everyone else but only work 10 nights a month.”
Leslie Flores, SHM senior advisor, practice management
Welcome to “Survey Insights,” a new section devoted to exploring and interpreting information from the survey conducted jointly by SHM and the Medical Group Management Association (MGMA). Each month we will focus on a specific topic, providing not only the survey results, but also background information and commentary from members of SHM’s Practice Analysis Committee.
With this month’s release of the 2010-2011 State of Hospital Medicine report, we now have several useful data points regarding the work of nocturnists in HM. In the survey, nocturnist was defined as an individual hospitalist who predominantly works a schedule providing in-house night coverage for inpatients. The question “Does your practice include nocturnists?” was part of the survey’s HM Supplement, and was answered by 238 of the 307 supplement respondents. As was the case last year, 41% of HM practices responding to the survey reported having nocturnists working in their group.
Although less than half of respondent groups reported having nocturnists, more than 55% of the individual hospitalists in the data set worked in groups with nocturnists. This suggests that nocturnists tend to be found more often in larger HM groups.
The proportion of night coverage provided by nocturnists varied widely among groups, as can be seen in the chart (see “Percentage of Night Coverage by Nocturnists,” p. 11). Only 16% of the groups with nocturnists used them for all of their night coverage. For about half the groups, the nocturnists provide from one-quarter to three-quarters of the night coverage. This year, data were also obtained on compensation and productivity for 131 nocturnists. Perhaps the most surprising finding is that the median compensation reported for nocturnists in practices that care for adults was $215,000, about 2.5% lower than the median compensation reported for all adult hospitalists. (There was not enough pediatric nocturnist data to report results.)
It’s no surprise, however, that median annual nocturnist productivity was 3,058 wRVUs, about 27% lower than the productivity reported for all adult hospitalists. This suggests that even though median compensation for nocturnists is a bit lower, the “juice to squeeze” ratio for working exclusively at night remains higher than for daytime work.
According to committee member Dan Fuller, president and cofounder of Alpharetta, Ga.-based InCompass Health Inc., “this data supports what we already know: that nocturnists are not as productive as the typical rounding hospitalist. However, they are necessary in most of the larger models, given the need for a physician to be in-house at night for both admissions and emergencies.”
Committee members weren’t sure how to interpret the lower nocturnist compensation, because for many the finding differs from the situation in their own practices. Chris Frost, MD, FHM, vice president of operations for Knoxville, Tenn.-based TeamHealth, postulates that “unless productivity thresholds are adjusted for nocturnists, they will rarely achieve productivity incentives” earned by daytime hospitalists. And PAC member John Nelson, MD, MHM, points out, “There’s more than one way of compensating nocturnists for the inconvenience of working at night. The three nocturnists in our practice, for example, make about the same as everyone else but only work 10 nights a month.”
Leslie Flores, SHM senior advisor, practice management
In the Literature: The latest research you need to know
In This Edition
Literature At A Glance
A guide to this month’s studies
- High-dose vs. low-dose clopidogrel after cardiac stenting
- Rates of overdiagnosis of PE with CTPA
- Outcomes of hospitalists with PAs or residents
- White coats and MRSA
- Correlation of vital signs and pain
- Rate of asymptomatic perioperative MI
- Relationship of opioid prescription patterns and overdose
- Interdisciplinary rounds and rates of adverse events
High-Dose Clopidogrel Is Not Superior to Standard-Dose Clopidogrel in Patients with High On-Treatment Platelet Activity after Percutaneous Corona
Clinical question: In patients with high on-treatment platelet activity, does the use of high-dose clopidogrel after percutaneous coronary intervention (PCI) decrease the risk of cardiovascular events?
Background: In patients receiving clopidogrel, high platelet reactivity after PCI is associated with an increase in cardiovascular events. At present, treatments targeted at this population are not well-defined.
Study design: Randomized, double-blind, active-control trial.
Setting: Eighty-three centers in North America.
Synopsis: Researchers randomized 2,214 patients with drug-eluting stents to receive either high-dose clopidogrel (600 mg initial dose, 150 mg daily thereafter) or standard-dose clopidogrel (no additional loading dose, 75 mg daily). At six months, the primary endpoint of death from cardiovascular causes, nonfatal myocardial infarction, or stent thrombosis was no different in the two groups (2.3% in the high-dose group versus 2.3% in the standard-dose group; hazard ratio 1.01).
Bottom line: High-dose clopidogrel adds no benefit over standard-dose clopidogrel in patients with high platelet reactivity who have undergone PCI with drug-eluting stent placement.
Citation: Price MJ, Berger PB, Teirstein PS, et al. Standard- vs. high-dose clopidogrel based on platelet function testing after percutaneous coronary intervention: the GRAVITAS randomized trial. JAMA. 2011;305(11):1097-1105.
Computed Tomographic Pulmonary Angiography (CTPA) Is Associated with Overdiagnosis and Overtreatment of Pulmonary Embolism (PE)
Clinical question: Is the use of CTPA associated with increased incidence of PE and increased complications from anticoagulation treatment?
Background: CTPA is a sensitive, noninvasive test for diagnosing PE that could have a drawback: identifying potentially clinically unimportant (small) pulmonary emboli that subsequently are treated. Overtreatment might be associated with patient harm due to increased complications of anticoagulation therapy.
Study design: Time-trend analysis of PE between the pre-CTPA period (1993 to 1998) and the post-CTPA period (1998 to 2006).
Setting: Nongovernmental U.S. hospitals.
Synopsis: The Nationwide Inpatient Sample and Multiple Cause-of-Death databases were used to determine national estimates of hospitalization for PE, along with morbidity and mortality from PE.
The age-adjusted analysis revealed a statistically significant increase in the incidence of PE diagnosis after introduction of CTPA (to 112 per 100,000 from 62 per 100,000), with minimal change in overall PE mortality. This was accompanied by a substantial reduction in PE case-fatality rate, the rate of hospital deaths among patients with a diagnosis of pulmonary embolism.
Availability of CTPA was associated with a significant increase in anticoagulation complication rates (to 5.3 per 100,000 from 3.1 per 100,000), including statistically significant increases in gastrointestinal hemorrhage and secondary thrombocytopenia, and a trend toward higher rates of intracranial hemorrhage.
Bottom line: Introduction of CTPA was associated with changes suggestive of overdiagnosis (increased incidence, relatively unchanged mortality) and overtreatment (increased complication rates) of PE, but it remains unknown which small PEs are clinically significant.
Citation: Wiener RS, Schwartz LM, Woloshin S. Time trends in pulmonary embolism in the United States: evidence of overdiagnosis. Arch Intern Med. 2011;171(9):831-837.
Hospitalist-Physician Assistant Teams Associated with Longer Length of Stay, No Change in Mortality, Readmission Rates
Clinical question: Do length of stay (LOS), hospital mortality, or readmission rate change if hospitalists and physician assistants, or the traditional resident-hospitalist teams, provide the patient care?
Background: Resident work-hour limitations require new models of care for hospitalized patients. Many academic medical centers have hired physician assistants to work with hospitalists to provide care. Little is known about how these models affect such outcomes as LOS, inpatient mortality rates, and readmission rates.
Study design: Retrospective cohort.
Setting: A 430-bed urban academic medical center in Milwaukee.
Synopsis: Administrative data were gathered on 9,681 patients admitted to the general medical service. Of those enrolled, 2,171 were cared for by a hospitalist-physician assistant (H-PA) team, while resident-hospitalist teams cared for 7,510 patients. Patient assignment was dependent on time of admission but not on patient complexity. Patients admitted overnight after the resident team capped were assigned to the H-PA team the next morning, resulting in increased transitions of care for the H-PA team.
Adjusted analyses revealed a 6.45% increase in LOS for the H-PA team compared with the resident team. Charges, inpatient mortality, and readmission rates at seven, 14, and 30 days were unchanged. Subgroup analyses revealed smaller differences in LOS for H-PA teams and resident-hospitalist teams with the same hospitalist (LOS 5.44% higher, P=0.081).
Conclusions from this study are limited due to lack of randomization of assignment, the retrospective design, and the use of administrative data at one institution.
Bottom line: Hospitalist-PA teams might result in a slightly increased LOS compared with the traditional resident teams; however, inpatient mortality and readmission rates are similar.
Citation: Singh S, Fletcher KE, Schapira MM, et al. A comparison of outcomes of general medical inpatient care provided by a hospitalist-physician assistant model vs a traditional resident-based model. J Hosp Med. 2011;6:122-130.
Washing White Coats Does Not Lower MRSA Bacterial Contamination
Clinical question: Are clean, short-sleeved uniforms less likely to carry MRSA than regularly laundered long-sleeved white coats?
Background: Studies have shown that bacteria frequently colonize in physician garments. However, evidence that short-sleeved garments or newly laundered garments are less likely to be contaminated has been lacking. Despite the paucity of evidence, the British Department of Health barred the use of traditional white coats and long-sleeved garments in 2007.
Study design: Prospective, randomized, controlled trial.
Setting: Urban U.S. hospital.
Synopsis: Study authors randomized 100 internal-medicine residents and hospitalists to their own long-sleeved white coats or freshly laundered short-sleeved uniforms from August 2008 to November 2009. Swabs were taken from the sleeves of the white coats or uniform, the breast pocket, and the volar wrist surface of the dominant hand. Swabs were cultured for MRSA and for general colony count.
Results showed no significant difference in colony counts or MRSA colonization in any of the sites tested between the newly laundered uniforms and the white coats. Additionally, there was no effect in relation to the frequency of laundering the white coats. Notably, within three hours of donning freshly laundered uniforms, bacterial counts approached 50% of the total bacterial counts seen at eight hours.
Bottom line: Laundering of uniforms does not affect MRSA colonization rate or general bacterial burden on physician uniforms or skin surfaces, though the effect on nosocomial infection has not been established.
Citation: Burden M, Cervantes L, Weed D, Keniston A, Price CS, Albert RK. Newly cleaned physician uniforms and infrequently washed white coats have similar rates of bacterial contamination after an 8-hour workday: a randomized controlled trial. J Hosp Med. 2011;6:177-182.
Self-Reported Pain Severity Does Not Correlate with Heart Rate or Blood Pressure Measurements in Pre-Hospital Setting
Clinical question: Do measured vital signs, including heart rate, blood pressure, and respiratory rate, correlate with the degree of self-reported pain?
Background: Because pain often can be associated with alterations in autonomic tone, it has been hypothesized that alterations in vital signs will occur in patients who report pain.
Study design: Retrospective cohort study.
Setting: Pre-hospital in Melbourne, Australia.
Synopsis: The authors reviewed all ambulance patient care records for patients age >14 years with a Glasgow Coma Score (GCS) >12 transported to a hospital during a seven-day period in 2005. Patients were selected for analysis if their patient care record included an initial assessment of pain severity, as measured by a numeric rating scale (NRS), in which patients rate their pain from 0 to 10.
More than half of the 3,357 patients transported by paramedics during the period were included in this analysis (n=1286). There was no correlation between heart rate or systolic blood pressure with the degree of self-reported pain. Although an increased respiratory rate was statistically correlated with a higher rating of pain, this relationship was not clinically significant, as each one-point increase in the pain rating scale was associated with a 0.16-breaths-per-minute increase in the respiratory rate.
Limitations included the large number of records excluded from analysis because pain was not evaluated, as well as numerous unmeasured confounders, including active disease processes such as sepsis, that were not accounted for.
Bottom line: Severity of pain did not correlate with heart rate or systolic blood pressure in the pre-hospital setting.
Citation: Lord B, Woollard M. The reliability of vital signs in estimating pain severity among adult patients treated by paramedics. Emerg Med J. 2011;28:147-150.
Asymptomatic Perioperative Myocardial Infarction Is Common in Patients Undergoing Noncardiac Surgery
Clinical question: In patients undergoing noncardiac surgery, what is the incidence and clinical characteristics of perioperative myocardial infarction (MI)?
Background: Though millions of patients experience perioperative MI after noncardiac surgery, little is known about the characteristics and outcomes of these patients.
Study design: Cohort study.
Setting: One hundred ninety centers in 23 countries.
Synopsis: Using data from the 8,351 patients in the POISE (PeriOperative ISchemic Evaluation) trial, this study showed that perioperative MI occurred in 5% of patients; 65% were asymptomatic. Patients who experienced postoperative MI were older and had more cardiovascular risk factors when compared to those who did not. The 30-day mortality was higher in patients with a perioperative MI (11.6%) compared with those who did not (2.2%); the presence or absence of ischemic symptoms was not associated with mortality rate.
Of the 8.3% of patients who experienced an elevation in cardiac biomarkers but who did not meet the definition of MI, there was an increased risk of nonfatal cardiac arrest and nonacute coronary revascularization. Those in the highest quartile also had increased 30-day mortality.
Bottom line: Given the high proportion of asymptomatic MIs and isolated elevations in cardiac biomarkers and the association between these events and increased risk of death, hospitalists should consider routine monitoring of troponin in at-risk patients undergoing noncardiac surgery.
Citation: Devereaux PJ, Xavier D, Pogue J, et al. Characteristics and short-term prognosis of perioperative myocardial infarction in patients undergoing noncardiac surgery: a cohort study. Ann Intern Med. 2011;154(8):523-528.
Patients Prescribed Higher Opioid Doses Are at Increased Risk of Opioid Overdose Death
Clinical question: What is the association between opioid prescribing patterns and fatal opioid overdose?
Background: In the past 10 years, the rate of fatal overdose from opioid prescription for pain has more than doubled. Little is known about how the indications (substance abuse disorders, cancer-related pain, chronic pain, acute pain), maximal daily dose, and scheduling (standing, as-needed, or both) of opioid prescriptions relate to this increased risk.
Study design: Case-cohort study.
Setting: Veterans Health Administration (VHA) patients.
Synopsis: The VHA’s National Patient Care Database was used to randomly select a cohort of 154,684 nonhospice/nonpalliative-care patients who were prescribed opioids from 2004 to 2008. They were compared with 750 patients who were treated with prescription opioids who died from opioid overdose during this time.
Fatal opioid overdose was a rare event (0.04%), but risk increased with higher prescribed maximum daily morphine dose-equivalence, especially when greater than or equal to 50 mg/day in all subgroups (substance abuse, acute and chronic pain, and cancer). Fatal overdoses were higher in middle-aged white men with acute or chronic pain, substance abuse disorders, and other psychiatric illness. Patients with cancer were at increased risk of fatal overdose if they were prescribed as-needed opioids alone.
Treatment with both as-needed and standing opioids did not statistically affect risk of overdose death in any subgroup.
Bottom line: Although rare, risk of fatal opioid overdose in patients prescribed opiate medication increases with higher maximum prescribed daily dose.
Citation: Bohnert AS, Valenstein M, Bair M, et al. Association between opioid prescribing patterns and opioid overdose-related deaths. JAMA. 2011; 305:1315-1321.
Structured Interdisciplinary Rounds on Medical Teaching Unit Significantly Decrease Adverse Events
Clinical question: Do structured interdisciplinary rounds have an impact on the rate of adverse events?
Background: Many preventable adverse events occurring during hospitalization can be attributed to communication failures. Structured interdisciplinary rounds provide a format as well as a forum for team members to discuss patient care. Prior studies demonstrated improvements in collaboration; whether this translates to better patient care is not known.
Study design: Retrospective cohort using historic and concurrent control.
Setting: Tertiary-care teaching hospital in Chicago.
Synopsis: Structured interdisciplinary rounds, led by a nurse manager and medical director, and including nurses, residents, pharmacists, social workers, and case managers, were implemented on a medical teaching unit. New patients were discussed using a structured communication tool; existing patients were discussed in an unstructured format. Medical records were abstracted for 370 patients hospitalized after implementation of the intervention, equally divided between intervention and control units. One hundred eighty-five patients hospitalized on the intervention unit prior to the implementation of rounds served as a historic control.
Patients in the intervention unit had significantly lower rates of total adverse events (3.9 per 100 patient days in the intervention, compared with 7.2 and 7.7 per 100 patient days for the concurrent and historic control units, respectively), and preventable adverse events (0.9 per 100 patient days, compared with 2.8 and 2.1 per 100 patient days for the concurrent and historic controls, respectively).
Limitations of the study include lack of blinding of the medical record, slightly different patient populations in intervention and control groups, and the one-hospital setting, which could limit generalizability.
Bottom line: Structured interdisciplinary rounds might serve to improve communication between nurses, pharmacists, and physicians, resulting in decreases in adverse events.
Citation: O’Leary KJ, Buck R, Fligiel HM, et al. Structured interdisciplinary rounds in a medical teaching unit: improving patient safety. Arch Intern Med. 2011;171(7):678-684.
Pediatric HM Literature
Short-Course Antibiotic Therapy Effective for Bacterial Meningitis

Clinical question: Is five days of parenteral ceftriaxone as effective as 10 days for the treatment of bacterial meningitis in children?
Background: Morbidity and mortality in bacterial meningitis remain high, particularly in developing countries. Antibiotics are effective treatment, yet the optimal duration of treatment remains uncertain. Some data support a shorter duration of treatment (three to five days).
Study design: Multicountry, double-blind, placebo-controlled, randomized equivalence study.
Setting: Ten pediatric referral hospitals in Bangladesh, Egypt, Malawi, Pakistan, and Vietnam.
Synopsis: Children aged two months to 12 years with bacterial meningitis (due to Haemophilus influenza, Streptococcus pneumonia, Neisseria meningitidis, or culture-negative with indicative cerebrospinal fluid findings) and without complicating medical conditions were enrolled at participating centers. All children received 80 mg/kg to 100 mg/kg of parenteral ceftriaxone daily and a repeat lumbar puncture 48 to 72 hours after initiation of therapy.
Ultimately, 1,004 children without resistant organisms, persistently positive cultures, or suppurative complications were randomized on day five of therapy to placebo or continuance of ceftriaxone for five more days.
No bacteriologic failures (primary endpoint) were evident with either five or 10 days of treatment.
In addition, no statistically significant differences were found between the groups with respect to clinical treatment failure, hearing loss, neurological sequelae, or death. Secondary analysis by organism revealed similar results.
The primary limitation of this study is that it occurred in developing countries with a fair incidence of H. influenzae meningitis and a low rate of third-generation cephalosporin resistance.
However, pneumococcal and meningococcal disease remained prominent, and this study suggests that clinically stable patients might be treated with a shorter course of parenteral ceftriaxone therapy than currently is recommended.
Bottom line: Five days of ceftriaxone is as effective as 10 days for uncomplicated bacterial meningitis in children.
Citation: Molyneux E, Nizami SQ, Saha S, et al. 5 versus 10 days of treatment with ceftriaxone for bacterial meningitis in children: a double-blind randomised equivalence study. Lancet. 2011;377:1837-1845.
Reviewed by Pediatric Editor Mark Shen, MD, medical director of hospital medicine at Dell Children’s Medical Center, Austin, Texas.
In This Edition
Literature At A Glance
A guide to this month’s studies
- High-dose vs. low-dose clopidogrel after cardiac stenting
- Rates of overdiagnosis of PE with CTPA
- Outcomes of hospitalists with PAs or residents
- White coats and MRSA
- Correlation of vital signs and pain
- Rate of asymptomatic perioperative MI
- Relationship of opioid prescription patterns and overdose
- Interdisciplinary rounds and rates of adverse events
High-Dose Clopidogrel Is Not Superior to Standard-Dose Clopidogrel in Patients with High On-Treatment Platelet Activity after Percutaneous Corona
Clinical question: In patients with high on-treatment platelet activity, does the use of high-dose clopidogrel after percutaneous coronary intervention (PCI) decrease the risk of cardiovascular events?
Background: In patients receiving clopidogrel, high platelet reactivity after PCI is associated with an increase in cardiovascular events. At present, treatments targeted at this population are not well-defined.
Study design: Randomized, double-blind, active-control trial.
Setting: Eighty-three centers in North America.
Synopsis: Researchers randomized 2,214 patients with drug-eluting stents to receive either high-dose clopidogrel (600 mg initial dose, 150 mg daily thereafter) or standard-dose clopidogrel (no additional loading dose, 75 mg daily). At six months, the primary endpoint of death from cardiovascular causes, nonfatal myocardial infarction, or stent thrombosis was no different in the two groups (2.3% in the high-dose group versus 2.3% in the standard-dose group; hazard ratio 1.01).
Bottom line: High-dose clopidogrel adds no benefit over standard-dose clopidogrel in patients with high platelet reactivity who have undergone PCI with drug-eluting stent placement.
Citation: Price MJ, Berger PB, Teirstein PS, et al. Standard- vs. high-dose clopidogrel based on platelet function testing after percutaneous coronary intervention: the GRAVITAS randomized trial. JAMA. 2011;305(11):1097-1105.
Computed Tomographic Pulmonary Angiography (CTPA) Is Associated with Overdiagnosis and Overtreatment of Pulmonary Embolism (PE)
Clinical question: Is the use of CTPA associated with increased incidence of PE and increased complications from anticoagulation treatment?
Background: CTPA is a sensitive, noninvasive test for diagnosing PE that could have a drawback: identifying potentially clinically unimportant (small) pulmonary emboli that subsequently are treated. Overtreatment might be associated with patient harm due to increased complications of anticoagulation therapy.
Study design: Time-trend analysis of PE between the pre-CTPA period (1993 to 1998) and the post-CTPA period (1998 to 2006).
Setting: Nongovernmental U.S. hospitals.
Synopsis: The Nationwide Inpatient Sample and Multiple Cause-of-Death databases were used to determine national estimates of hospitalization for PE, along with morbidity and mortality from PE.
The age-adjusted analysis revealed a statistically significant increase in the incidence of PE diagnosis after introduction of CTPA (to 112 per 100,000 from 62 per 100,000), with minimal change in overall PE mortality. This was accompanied by a substantial reduction in PE case-fatality rate, the rate of hospital deaths among patients with a diagnosis of pulmonary embolism.
Availability of CTPA was associated with a significant increase in anticoagulation complication rates (to 5.3 per 100,000 from 3.1 per 100,000), including statistically significant increases in gastrointestinal hemorrhage and secondary thrombocytopenia, and a trend toward higher rates of intracranial hemorrhage.
Bottom line: Introduction of CTPA was associated with changes suggestive of overdiagnosis (increased incidence, relatively unchanged mortality) and overtreatment (increased complication rates) of PE, but it remains unknown which small PEs are clinically significant.
Citation: Wiener RS, Schwartz LM, Woloshin S. Time trends in pulmonary embolism in the United States: evidence of overdiagnosis. Arch Intern Med. 2011;171(9):831-837.
Hospitalist-Physician Assistant Teams Associated with Longer Length of Stay, No Change in Mortality, Readmission Rates
Clinical question: Do length of stay (LOS), hospital mortality, or readmission rate change if hospitalists and physician assistants, or the traditional resident-hospitalist teams, provide the patient care?
Background: Resident work-hour limitations require new models of care for hospitalized patients. Many academic medical centers have hired physician assistants to work with hospitalists to provide care. Little is known about how these models affect such outcomes as LOS, inpatient mortality rates, and readmission rates.
Study design: Retrospective cohort.
Setting: A 430-bed urban academic medical center in Milwaukee.
Synopsis: Administrative data were gathered on 9,681 patients admitted to the general medical service. Of those enrolled, 2,171 were cared for by a hospitalist-physician assistant (H-PA) team, while resident-hospitalist teams cared for 7,510 patients. Patient assignment was dependent on time of admission but not on patient complexity. Patients admitted overnight after the resident team capped were assigned to the H-PA team the next morning, resulting in increased transitions of care for the H-PA team.
Adjusted analyses revealed a 6.45% increase in LOS for the H-PA team compared with the resident team. Charges, inpatient mortality, and readmission rates at seven, 14, and 30 days were unchanged. Subgroup analyses revealed smaller differences in LOS for H-PA teams and resident-hospitalist teams with the same hospitalist (LOS 5.44% higher, P=0.081).
Conclusions from this study are limited due to lack of randomization of assignment, the retrospective design, and the use of administrative data at one institution.
Bottom line: Hospitalist-PA teams might result in a slightly increased LOS compared with the traditional resident teams; however, inpatient mortality and readmission rates are similar.
Citation: Singh S, Fletcher KE, Schapira MM, et al. A comparison of outcomes of general medical inpatient care provided by a hospitalist-physician assistant model vs a traditional resident-based model. J Hosp Med. 2011;6:122-130.
Washing White Coats Does Not Lower MRSA Bacterial Contamination
Clinical question: Are clean, short-sleeved uniforms less likely to carry MRSA than regularly laundered long-sleeved white coats?
Background: Studies have shown that bacteria frequently colonize in physician garments. However, evidence that short-sleeved garments or newly laundered garments are less likely to be contaminated has been lacking. Despite the paucity of evidence, the British Department of Health barred the use of traditional white coats and long-sleeved garments in 2007.
Study design: Prospective, randomized, controlled trial.
Setting: Urban U.S. hospital.
Synopsis: Study authors randomized 100 internal-medicine residents and hospitalists to their own long-sleeved white coats or freshly laundered short-sleeved uniforms from August 2008 to November 2009. Swabs were taken from the sleeves of the white coats or uniform, the breast pocket, and the volar wrist surface of the dominant hand. Swabs were cultured for MRSA and for general colony count.
Results showed no significant difference in colony counts or MRSA colonization in any of the sites tested between the newly laundered uniforms and the white coats. Additionally, there was no effect in relation to the frequency of laundering the white coats. Notably, within three hours of donning freshly laundered uniforms, bacterial counts approached 50% of the total bacterial counts seen at eight hours.
Bottom line: Laundering of uniforms does not affect MRSA colonization rate or general bacterial burden on physician uniforms or skin surfaces, though the effect on nosocomial infection has not been established.
Citation: Burden M, Cervantes L, Weed D, Keniston A, Price CS, Albert RK. Newly cleaned physician uniforms and infrequently washed white coats have similar rates of bacterial contamination after an 8-hour workday: a randomized controlled trial. J Hosp Med. 2011;6:177-182.
Self-Reported Pain Severity Does Not Correlate with Heart Rate or Blood Pressure Measurements in Pre-Hospital Setting
Clinical question: Do measured vital signs, including heart rate, blood pressure, and respiratory rate, correlate with the degree of self-reported pain?
Background: Because pain often can be associated with alterations in autonomic tone, it has been hypothesized that alterations in vital signs will occur in patients who report pain.
Study design: Retrospective cohort study.
Setting: Pre-hospital in Melbourne, Australia.
Synopsis: The authors reviewed all ambulance patient care records for patients age >14 years with a Glasgow Coma Score (GCS) >12 transported to a hospital during a seven-day period in 2005. Patients were selected for analysis if their patient care record included an initial assessment of pain severity, as measured by a numeric rating scale (NRS), in which patients rate their pain from 0 to 10.
More than half of the 3,357 patients transported by paramedics during the period were included in this analysis (n=1286). There was no correlation between heart rate or systolic blood pressure with the degree of self-reported pain. Although an increased respiratory rate was statistically correlated with a higher rating of pain, this relationship was not clinically significant, as each one-point increase in the pain rating scale was associated with a 0.16-breaths-per-minute increase in the respiratory rate.
Limitations included the large number of records excluded from analysis because pain was not evaluated, as well as numerous unmeasured confounders, including active disease processes such as sepsis, that were not accounted for.
Bottom line: Severity of pain did not correlate with heart rate or systolic blood pressure in the pre-hospital setting.
Citation: Lord B, Woollard M. The reliability of vital signs in estimating pain severity among adult patients treated by paramedics. Emerg Med J. 2011;28:147-150.
Asymptomatic Perioperative Myocardial Infarction Is Common in Patients Undergoing Noncardiac Surgery
Clinical question: In patients undergoing noncardiac surgery, what is the incidence and clinical characteristics of perioperative myocardial infarction (MI)?
Background: Though millions of patients experience perioperative MI after noncardiac surgery, little is known about the characteristics and outcomes of these patients.
Study design: Cohort study.
Setting: One hundred ninety centers in 23 countries.
Synopsis: Using data from the 8,351 patients in the POISE (PeriOperative ISchemic Evaluation) trial, this study showed that perioperative MI occurred in 5% of patients; 65% were asymptomatic. Patients who experienced postoperative MI were older and had more cardiovascular risk factors when compared to those who did not. The 30-day mortality was higher in patients with a perioperative MI (11.6%) compared with those who did not (2.2%); the presence or absence of ischemic symptoms was not associated with mortality rate.
Of the 8.3% of patients who experienced an elevation in cardiac biomarkers but who did not meet the definition of MI, there was an increased risk of nonfatal cardiac arrest and nonacute coronary revascularization. Those in the highest quartile also had increased 30-day mortality.
Bottom line: Given the high proportion of asymptomatic MIs and isolated elevations in cardiac biomarkers and the association between these events and increased risk of death, hospitalists should consider routine monitoring of troponin in at-risk patients undergoing noncardiac surgery.
Citation: Devereaux PJ, Xavier D, Pogue J, et al. Characteristics and short-term prognosis of perioperative myocardial infarction in patients undergoing noncardiac surgery: a cohort study. Ann Intern Med. 2011;154(8):523-528.
Patients Prescribed Higher Opioid Doses Are at Increased Risk of Opioid Overdose Death
Clinical question: What is the association between opioid prescribing patterns and fatal opioid overdose?
Background: In the past 10 years, the rate of fatal overdose from opioid prescription for pain has more than doubled. Little is known about how the indications (substance abuse disorders, cancer-related pain, chronic pain, acute pain), maximal daily dose, and scheduling (standing, as-needed, or both) of opioid prescriptions relate to this increased risk.
Study design: Case-cohort study.
Setting: Veterans Health Administration (VHA) patients.
Synopsis: The VHA’s National Patient Care Database was used to randomly select a cohort of 154,684 nonhospice/nonpalliative-care patients who were prescribed opioids from 2004 to 2008. They were compared with 750 patients who were treated with prescription opioids who died from opioid overdose during this time.
Fatal opioid overdose was a rare event (0.04%), but risk increased with higher prescribed maximum daily morphine dose-equivalence, especially when greater than or equal to 50 mg/day in all subgroups (substance abuse, acute and chronic pain, and cancer). Fatal overdoses were higher in middle-aged white men with acute or chronic pain, substance abuse disorders, and other psychiatric illness. Patients with cancer were at increased risk of fatal overdose if they were prescribed as-needed opioids alone.
Treatment with both as-needed and standing opioids did not statistically affect risk of overdose death in any subgroup.
Bottom line: Although rare, risk of fatal opioid overdose in patients prescribed opiate medication increases with higher maximum prescribed daily dose.
Citation: Bohnert AS, Valenstein M, Bair M, et al. Association between opioid prescribing patterns and opioid overdose-related deaths. JAMA. 2011; 305:1315-1321.
Structured Interdisciplinary Rounds on Medical Teaching Unit Significantly Decrease Adverse Events
Clinical question: Do structured interdisciplinary rounds have an impact on the rate of adverse events?
Background: Many preventable adverse events occurring during hospitalization can be attributed to communication failures. Structured interdisciplinary rounds provide a format as well as a forum for team members to discuss patient care. Prior studies demonstrated improvements in collaboration; whether this translates to better patient care is not known.
Study design: Retrospective cohort using historic and concurrent control.
Setting: Tertiary-care teaching hospital in Chicago.
Synopsis: Structured interdisciplinary rounds, led by a nurse manager and medical director, and including nurses, residents, pharmacists, social workers, and case managers, were implemented on a medical teaching unit. New patients were discussed using a structured communication tool; existing patients were discussed in an unstructured format. Medical records were abstracted for 370 patients hospitalized after implementation of the intervention, equally divided between intervention and control units. One hundred eighty-five patients hospitalized on the intervention unit prior to the implementation of rounds served as a historic control.
Patients in the intervention unit had significantly lower rates of total adverse events (3.9 per 100 patient days in the intervention, compared with 7.2 and 7.7 per 100 patient days for the concurrent and historic control units, respectively), and preventable adverse events (0.9 per 100 patient days, compared with 2.8 and 2.1 per 100 patient days for the concurrent and historic controls, respectively).
Limitations of the study include lack of blinding of the medical record, slightly different patient populations in intervention and control groups, and the one-hospital setting, which could limit generalizability.
Bottom line: Structured interdisciplinary rounds might serve to improve communication between nurses, pharmacists, and physicians, resulting in decreases in adverse events.
Citation: O’Leary KJ, Buck R, Fligiel HM, et al. Structured interdisciplinary rounds in a medical teaching unit: improving patient safety. Arch Intern Med. 2011;171(7):678-684.
Pediatric HM Literature
Short-Course Antibiotic Therapy Effective for Bacterial Meningitis
Clinical question: Is five days of parenteral ceftriaxone as effective as 10 days for the treatment of bacterial meningitis in children?
Background: Morbidity and mortality in bacterial meningitis remain high, particularly in developing countries. Antibiotics are effective treatment, yet the optimal duration of treatment remains uncertain. Some data support a shorter duration of treatment (three to five days).
Study design: Multicountry, double-blind, placebo-controlled, randomized equivalence study.
Setting: Ten pediatric referral hospitals in Bangladesh, Egypt, Malawi, Pakistan, and Vietnam.
Synopsis: Children aged two months to 12 years with bacterial meningitis (due to Haemophilus influenza, Streptococcus pneumonia, Neisseria meningitidis, or culture-negative with indicative cerebrospinal fluid findings) and without complicating medical conditions were enrolled at participating centers. All children received 80 mg/kg to 100 mg/kg of parenteral ceftriaxone daily and a repeat lumbar puncture 48 to 72 hours after initiation of therapy.
Ultimately, 1,004 children without resistant organisms, persistently positive cultures, or suppurative complications were randomized on day five of therapy to placebo or continuance of ceftriaxone for five more days.
No bacteriologic failures (primary endpoint) were evident with either five or 10 days of treatment.
In addition, no statistically significant differences were found between the groups with respect to clinical treatment failure, hearing loss, neurological sequelae, or death. Secondary analysis by organism revealed similar results.
The primary limitation of this study is that it occurred in developing countries with a fair incidence of H. influenzae meningitis and a low rate of third-generation cephalosporin resistance.
However, pneumococcal and meningococcal disease remained prominent, and this study suggests that clinically stable patients might be treated with a shorter course of parenteral ceftriaxone therapy than currently is recommended.
Bottom line: Five days of ceftriaxone is as effective as 10 days for uncomplicated bacterial meningitis in children.
Citation: Molyneux E, Nizami SQ, Saha S, et al. 5 versus 10 days of treatment with ceftriaxone for bacterial meningitis in children: a double-blind randomised equivalence study. Lancet. 2011;377:1837-1845.
Reviewed by Pediatric Editor Mark Shen, MD, medical director of hospital medicine at Dell Children’s Medical Center, Austin, Texas.
What Is the Best E&M of Heparin-Induced Thrombocytopenia?
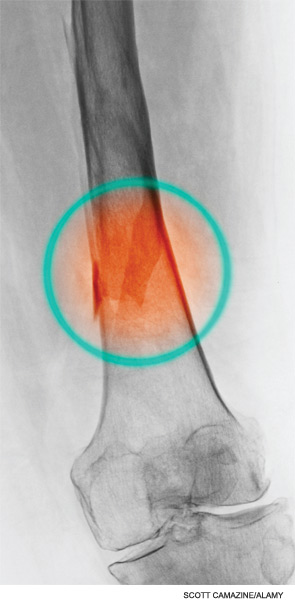
Case
A 52-year-old white woman presents to the ED after a motor vehicle accident with a fractured left femur. After surgical repair of the fracture, she is treated with enoxaparin 40 mg daily for VTE prophylaxis. Upon admission to the hospital, her platelet count is 180x109/L. On postoperative day three, it is 140x109/L; on postoperative day six, it is 78x109/L. Because of persistent swelling of the left leg, a venous ultrasound is obtained; results are negative for DVT. Is the decrease in the platelet count concerning for heparin-induced thrombocytopenia?
Overview
Approximately one-third of hospitalized patients are exposed to heparin each year.1 A well-described, life-threatening adverse effect of heparin use is thrombocytopenia, also called heparin-induced thrombocytopenia (HIT). Studies suggest that the frequency of HIT in the U.S. is as high as 1% to 5% in patients exposed to unfractionated heparin.1,2
There are two types of HIT. Type 2 HIT is more serious, with risk for life- or limb-threatening complications. Type 1 HIT is a nonimmune disorder caused by the direct effect of heparin on platelet activation, which is characterized by a drop in thrombocyte count within the first 48 hours of heparin exposure. The platelet count is expected to normalize with continued heparin exposure in Type 1 HIT. Type 2 HIT is an immune-mediated disorder in which heparin-dependent IgG recognizes complexes of heparin and platelet factor 4 (PF4), which subsequently induce platelet activation via the platelet Fc gammaRIIa receptor. A positive feedback loop occurs, causing further release of PF4 and platelet activation, which can lead to devastating prothrombotic complications.
Individuals affected by Type 2 HIT have a 20% to 50% risk of developing new thrombotic events, and also have a 10% rate of major morbidity, including limb ischemia requiring amputation, cerebrovascular events, myocardial infarction, DVT, or pulmonary embolus.1,2
Until recently, the mortality rate in HIT has been reported as high as 20%; however, earlier diagnosis and treatment have resulted in a better prognosis, with mortality and major morbidity of 6% to 10%.2 Low-molecular-weight heparin (LMWH) carries a lower risk for development of HIT; as such, one measure to reduce the risk of HIT is to use LMWH in place of unfractionated heparin.3
Review of the Data
When to suspect HIT. HIT should be considered as a potential diagnosis anytime there is a drop in platelet count, either during or shortly following heparin exposure. The differential diagnosis for thrombocytopenia during heparin exposure is broad and includes:
- Disseminated intravascular coagulation;
- Drug-induced thrombocytopenia;
- Hemolytic-uremic syndrome;
- Immune thrombocytopenic purpura;
- Post-transfusion thrombocytopenia;
- Systemic lupus erythematosus; and
- Thrombotic thrombocytopenic purpura.
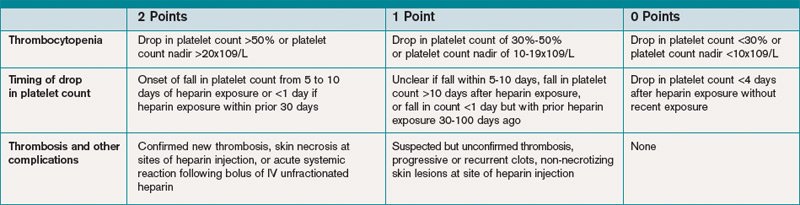
The 2009 Clinical Practice Guideline on Evaluation and Management of HIT provided by the American Society of Hematology recommends the use of Warkentin’s 4Ts clinical probability scoring system as a guide in determining the probability of HIT in patients with thrombocytopenia who are exposed to heparin.4 The 4Ts scoring system is detailed in Table 1.
In patients with intermediate to high clinical probability of HIT (4-5 points and 6-8 points, respectively, on the 4Ts scoring system), immunologic and functional assays could further guide management. In patients with a low probability of HIT (4Ts score <3), the diagnosis is unlikely and an alternative diagnoses should be considered. Immunologic and functional assays are not recommended for these patients, and heparin can be continued.
Laboratory and diagnostic workups. Immunologic assays (polyspecific ELISA, IgG-specific ELISA, and particle gel immunoassay) detect antibodies against the PF4 heparin complexes regardless of their capacity to activate platelets. These tests are highly sensitive but less specific for HIT because they also detect PF4-heparin antibodies in patients who do not have HIT; therefore, immunoassays have a lower positive predictive value but a high negative predictive value (>95%).5
Functional assays (serotonin release assay, heparin-induced platelet activation assay, and platelet aggregation test) detect antibodies that induce heparin-dependent platelet activation. These assays are highly sensitive and specific but are not available at many medical centers. The positive predictive value of these assays is higher (89% to 100%).5
Figure 1 provides a diagnostic and initial treatment algorithm for suspected HIT. Immunoassays to detect PF4-heparin antibodies are recommended when clinical probability of HIT is intermediate to high. In these patients, a negative result on serologic testing has a high negative predictive value and suggests that an alternative diagnosis is more likely. In patients with a positive serologic test and intermediate probability of HIT, a functional assay might be beneficial, as a positive result increases the probability of HIT. For patients with high probability of HIT and a positive immunologic assay, functional assays might not be indicated as the diagnosis is likely.
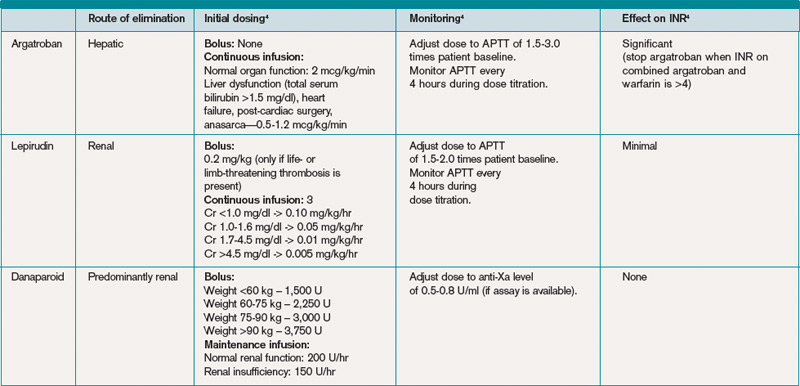
Treatment. If the probability of HIT is intermediate to high based on the 4Ts scoring system, all heparin products, including heparin flushes, should be immediately discontinued and a laboratory investigation for HIT antibodies should be undertaken. An investigation for lower-limb DVT also should be pursued in patients with high probability of HIT, as the risk of thrombosis is more than 30-fold higher than controls, and studies show that approximately 25% of patients with HIT present with both thrombocytopenia and thrombosis.5 In addition, the presence of thrombosis might influence duration of anticoagulation.
Avoid platelet transfusions, as this might propagate thrombosis.
Anticoagulation. With a significant risk of thrombosis associated with this disorder, treatment with an alternative anticoagulant should be started. Vitamin K antagonists, such as warfarin, cannot be given in acute HIT because of the high risk of inducing skin necrosis and venous limb gangrene. Such anticoagulation should not be used until the platelet count increases to greater than 150x109/L. If warfarin already has been given, reversal with vitamin K is indicated.
Consequently, an alternative anticoagulant bridge to warfarin therapy must be used. Usually, the bridging agent will be one of two intravenous direct thrombin inhibitors (argatroban and lepirudin) approved for this purpose.6 Both are associated with a higher risk of bleeding. Argatroban is hepatically cleared; lepirudin is renally cleared. Table 2 summarizes dosing information for these agents. A third direct thrombin inhibitor, bivalirudin, is approved for treatment of HIT, but only during percutaneous coronary intervention.6
Finally, the recently FDA-approved oral direct thrombin inhibitor dabigatrin has not been studied in or approved for HIT.
Other rational therapies include the factor Xa inhibitors danaparoid and fondaparinux. However, only danaparoid is FDA-approved for use in the treatment of HIT. It can, in cases of low or moderate suspicion of HIT, be given in prophylactic doses, lowering the risk of major bleeding.
Duration of treatment. Whichever bridging anticoagulant is chosen, it should be continued until the platelet count has fully recovered. Further, prior to discontinuation, warfarin therapy should be administered for at least five days and the international normalized ratio (INR) should be therapeutic for approximately 48 hours.
The subsequent length of warfarin therapy is dependent upon the presence or absence of an associated thrombosis. With the presence of a thrombus, the duration should be as defined for other provoked thromboses (three to six months). With no thrombus, the duration should be at least 30 days.
Future anticoagulation in patients with a prior diagnosis of HIT. A history of HIT does not appear to be a risk factor for a higher frequency of forming heparin antibodies upon re-exposure to heparin.7 Therefore, in patients with an important indication for heparin (i.e. cardiac or vascular surgery) and a remote history of HIT (>100 days), heparin can be used. In patients with a subacute history of HIT in whom surgery cannot be delayed, heparin products should be avoided and laboratory investigation should be pursued.
If the immunoassay is positive but the functional assay is negative, it is reasonable to use heparin. If both the immunologic and the functional assays are positive, the patient should be considered as having acute HIT, and bivalirudin is recommended.4
Back to the Case
Our patient has acute thrombocytopenia with a fall in platelets greater than 50% from baseline. The decrease is within the appropriate time frame for HIT. No thrombosis is found, but no alternate explanation for the thrombocytopenia is apparent. The 4Ts score of 6 indicates high risk for HIT. Heparin was discontinued, and argatroban at a rate of 2 mcg/kg/min was initiated. The immunoassay was positive.
Argatroban was continued until the platelet count reached 150x109/L, at which point warfarin therapy, 5 mg daily, was started. After four days, the INR was 2.2. After another 24 hours, argatroban was discontinued. She was instructed to continue warfarin for another 30 days.
Bottom Line
Evaluation for HIT combines clinical judgment, summarized in the 4Ts, with laboratory evaluation including an immunoassay and possibly a functional assay. Treatment requires immediate discontinuation of heparin, early initiation of a direct thrombin inhibitor, and bridging to warfarin to continue treatment for at least 30 days. TH
Drs. Smith and Rice are members of the Section of Hospital Medicine at Vanderbilt University in Nashville, Tenn.
References
- Heparin-Induced Thrombocytopenia. MedScape Reference website. Available at: http://emedicine.medscape.com/article/1357846. Accessed Aug. 31, 2010.
- Heparin-Induced Thrombocytopenia. Orpha.net website. Available at: http://www.orpha.net/data/patho/GB/uk-HIT.pdf. Accessed Aug. 31, 2010.
- Warkentin TE, Levine MN, Hirsh J, et al. Heparin-induced thrombocytopenia in patients treated with low-molecular-weight heparin or unfractionated heparin. N Engl J Med. 1995;332(20):1330-1335.
- American Society of Hematology Guidelines: Immune Thrombocytopenia (HIT). American Society of Hematology website. Available at: www.hematology.org/Practice/Guidelines/2934.aspx. Accessed Jan. 28, 2011.
- Arepally GM, Ortel TL. Heparin-induced thrombocytopenia. Annu Rev Med. 2010;61:77-90.
- Warkentin TE, Greinacher A, Koster A, Lincoff AM. Treatment and prevention of heparin-induced thrombocytopenia: American College of Chest Physicians Evidence-based Clinical Practice Guidelines (8th Edition). Chest. 2008;133:340S-380S.
- Warkentin TE. Agents for the treatment of heparin-induced thrombocytopenia. Hematol Oncol Clin N Am. 2010;24:755-775.
Case
A 52-year-old white woman presents to the ED after a motor vehicle accident with a fractured left femur. After surgical repair of the fracture, she is treated with enoxaparin 40 mg daily for VTE prophylaxis. Upon admission to the hospital, her platelet count is 180x109/L. On postoperative day three, it is 140x109/L; on postoperative day six, it is 78x109/L. Because of persistent swelling of the left leg, a venous ultrasound is obtained; results are negative for DVT. Is the decrease in the platelet count concerning for heparin-induced thrombocytopenia?
Overview
Approximately one-third of hospitalized patients are exposed to heparin each year.1 A well-described, life-threatening adverse effect of heparin use is thrombocytopenia, also called heparin-induced thrombocytopenia (HIT). Studies suggest that the frequency of HIT in the U.S. is as high as 1% to 5% in patients exposed to unfractionated heparin.1,2
There are two types of HIT. Type 2 HIT is more serious, with risk for life- or limb-threatening complications. Type 1 HIT is a nonimmune disorder caused by the direct effect of heparin on platelet activation, which is characterized by a drop in thrombocyte count within the first 48 hours of heparin exposure. The platelet count is expected to normalize with continued heparin exposure in Type 1 HIT. Type 2 HIT is an immune-mediated disorder in which heparin-dependent IgG recognizes complexes of heparin and platelet factor 4 (PF4), which subsequently induce platelet activation via the platelet Fc gammaRIIa receptor. A positive feedback loop occurs, causing further release of PF4 and platelet activation, which can lead to devastating prothrombotic complications.
Individuals affected by Type 2 HIT have a 20% to 50% risk of developing new thrombotic events, and also have a 10% rate of major morbidity, including limb ischemia requiring amputation, cerebrovascular events, myocardial infarction, DVT, or pulmonary embolus.1,2
Until recently, the mortality rate in HIT has been reported as high as 20%; however, earlier diagnosis and treatment have resulted in a better prognosis, with mortality and major morbidity of 6% to 10%.2 Low-molecular-weight heparin (LMWH) carries a lower risk for development of HIT; as such, one measure to reduce the risk of HIT is to use LMWH in place of unfractionated heparin.3
Review of the Data
When to suspect HIT. HIT should be considered as a potential diagnosis anytime there is a drop in platelet count, either during or shortly following heparin exposure. The differential diagnosis for thrombocytopenia during heparin exposure is broad and includes:
- Disseminated intravascular coagulation;
- Drug-induced thrombocytopenia;
- Hemolytic-uremic syndrome;
- Immune thrombocytopenic purpura;
- Post-transfusion thrombocytopenia;
- Systemic lupus erythematosus; and
- Thrombotic thrombocytopenic purpura.
The 2009 Clinical Practice Guideline on Evaluation and Management of HIT provided by the American Society of Hematology recommends the use of Warkentin’s 4Ts clinical probability scoring system as a guide in determining the probability of HIT in patients with thrombocytopenia who are exposed to heparin.4 The 4Ts scoring system is detailed in Table 1.
In patients with intermediate to high clinical probability of HIT (4-5 points and 6-8 points, respectively, on the 4Ts scoring system), immunologic and functional assays could further guide management. In patients with a low probability of HIT (4Ts score <3), the diagnosis is unlikely and an alternative diagnoses should be considered. Immunologic and functional assays are not recommended for these patients, and heparin can be continued.
Laboratory and diagnostic workups. Immunologic assays (polyspecific ELISA, IgG-specific ELISA, and particle gel immunoassay) detect antibodies against the PF4 heparin complexes regardless of their capacity to activate platelets. These tests are highly sensitive but less specific for HIT because they also detect PF4-heparin antibodies in patients who do not have HIT; therefore, immunoassays have a lower positive predictive value but a high negative predictive value (>95%).5
Functional assays (serotonin release assay, heparin-induced platelet activation assay, and platelet aggregation test) detect antibodies that induce heparin-dependent platelet activation. These assays are highly sensitive and specific but are not available at many medical centers. The positive predictive value of these assays is higher (89% to 100%).5
Figure 1 provides a diagnostic and initial treatment algorithm for suspected HIT. Immunoassays to detect PF4-heparin antibodies are recommended when clinical probability of HIT is intermediate to high. In these patients, a negative result on serologic testing has a high negative predictive value and suggests that an alternative diagnosis is more likely. In patients with a positive serologic test and intermediate probability of HIT, a functional assay might be beneficial, as a positive result increases the probability of HIT. For patients with high probability of HIT and a positive immunologic assay, functional assays might not be indicated as the diagnosis is likely.
Treatment. If the probability of HIT is intermediate to high based on the 4Ts scoring system, all heparin products, including heparin flushes, should be immediately discontinued and a laboratory investigation for HIT antibodies should be undertaken. An investigation for lower-limb DVT also should be pursued in patients with high probability of HIT, as the risk of thrombosis is more than 30-fold higher than controls, and studies show that approximately 25% of patients with HIT present with both thrombocytopenia and thrombosis.5 In addition, the presence of thrombosis might influence duration of anticoagulation.
Avoid platelet transfusions, as this might propagate thrombosis.
Anticoagulation. With a significant risk of thrombosis associated with this disorder, treatment with an alternative anticoagulant should be started. Vitamin K antagonists, such as warfarin, cannot be given in acute HIT because of the high risk of inducing skin necrosis and venous limb gangrene. Such anticoagulation should not be used until the platelet count increases to greater than 150x109/L. If warfarin already has been given, reversal with vitamin K is indicated.
Consequently, an alternative anticoagulant bridge to warfarin therapy must be used. Usually, the bridging agent will be one of two intravenous direct thrombin inhibitors (argatroban and lepirudin) approved for this purpose.6 Both are associated with a higher risk of bleeding. Argatroban is hepatically cleared; lepirudin is renally cleared. Table 2 summarizes dosing information for these agents. A third direct thrombin inhibitor, bivalirudin, is approved for treatment of HIT, but only during percutaneous coronary intervention.6
Finally, the recently FDA-approved oral direct thrombin inhibitor dabigatrin has not been studied in or approved for HIT.
Other rational therapies include the factor Xa inhibitors danaparoid and fondaparinux. However, only danaparoid is FDA-approved for use in the treatment of HIT. It can, in cases of low or moderate suspicion of HIT, be given in prophylactic doses, lowering the risk of major bleeding.
Duration of treatment. Whichever bridging anticoagulant is chosen, it should be continued until the platelet count has fully recovered. Further, prior to discontinuation, warfarin therapy should be administered for at least five days and the international normalized ratio (INR) should be therapeutic for approximately 48 hours.
The subsequent length of warfarin therapy is dependent upon the presence or absence of an associated thrombosis. With the presence of a thrombus, the duration should be as defined for other provoked thromboses (three to six months). With no thrombus, the duration should be at least 30 days.
Future anticoagulation in patients with a prior diagnosis of HIT. A history of HIT does not appear to be a risk factor for a higher frequency of forming heparin antibodies upon re-exposure to heparin.7 Therefore, in patients with an important indication for heparin (i.e. cardiac or vascular surgery) and a remote history of HIT (>100 days), heparin can be used. In patients with a subacute history of HIT in whom surgery cannot be delayed, heparin products should be avoided and laboratory investigation should be pursued.
If the immunoassay is positive but the functional assay is negative, it is reasonable to use heparin. If both the immunologic and the functional assays are positive, the patient should be considered as having acute HIT, and bivalirudin is recommended.4
Back to the Case
Our patient has acute thrombocytopenia with a fall in platelets greater than 50% from baseline. The decrease is within the appropriate time frame for HIT. No thrombosis is found, but no alternate explanation for the thrombocytopenia is apparent. The 4Ts score of 6 indicates high risk for HIT. Heparin was discontinued, and argatroban at a rate of 2 mcg/kg/min was initiated. The immunoassay was positive.
Argatroban was continued until the platelet count reached 150x109/L, at which point warfarin therapy, 5 mg daily, was started. After four days, the INR was 2.2. After another 24 hours, argatroban was discontinued. She was instructed to continue warfarin for another 30 days.
Bottom Line
Evaluation for HIT combines clinical judgment, summarized in the 4Ts, with laboratory evaluation including an immunoassay and possibly a functional assay. Treatment requires immediate discontinuation of heparin, early initiation of a direct thrombin inhibitor, and bridging to warfarin to continue treatment for at least 30 days. TH
Drs. Smith and Rice are members of the Section of Hospital Medicine at Vanderbilt University in Nashville, Tenn.
References
- Heparin-Induced Thrombocytopenia. MedScape Reference website. Available at: http://emedicine.medscape.com/article/1357846. Accessed Aug. 31, 2010.
- Heparin-Induced Thrombocytopenia. Orpha.net website. Available at: http://www.orpha.net/data/patho/GB/uk-HIT.pdf. Accessed Aug. 31, 2010.
- Warkentin TE, Levine MN, Hirsh J, et al. Heparin-induced thrombocytopenia in patients treated with low-molecular-weight heparin or unfractionated heparin. N Engl J Med. 1995;332(20):1330-1335.
- American Society of Hematology Guidelines: Immune Thrombocytopenia (HIT). American Society of Hematology website. Available at: www.hematology.org/Practice/Guidelines/2934.aspx. Accessed Jan. 28, 2011.
- Arepally GM, Ortel TL. Heparin-induced thrombocytopenia. Annu Rev Med. 2010;61:77-90.
- Warkentin TE, Greinacher A, Koster A, Lincoff AM. Treatment and prevention of heparin-induced thrombocytopenia: American College of Chest Physicians Evidence-based Clinical Practice Guidelines (8th Edition). Chest. 2008;133:340S-380S.
- Warkentin TE. Agents for the treatment of heparin-induced thrombocytopenia. Hematol Oncol Clin N Am. 2010;24:755-775.
Exchange Anxiety
A 224-page document full of regulatory jargon might not be a fun summer read. Nevertheless, the U.S. Department of Health and Human Service’s (HHS) mid-July release of proposed rules for state-run health insurance exchanges (HIE) represents a major step toward expanding an insurance pool that could grow by an estimated 24 million Americans over the next eight years.
When the exchanges arrive in 2014, the single biggest impact is likely to be a major expansion of access, with 8.9 million individuals expected to sign up in the first year alone, according to projections by the Congressional Budget Office. A new report by PwC US Health Research Institute forecasts that a stunning 97% of those expected participants will be individuals who currently lack health insurance. A major driver of the new enrollments will be sliding-scale federal subsidies for individuals who earn from 138% to 400% of the federal poverty level, helping them buy insurance through the exchanges.
Experts say the exchanges also could directly impact hospitalists by bringing big changes to hospitals’ reimbursement revenue streams, spurring efforts to improve patient satisfaction metrics and increasing the momentum toward clinical comanagement agreements.
First, though, the public will get a chance to weigh in over rules that have been alternately lauded and derided, largely following the fault lines over the broader package of healthcare reforms. At a news conference set in front of a hardware store, HHS Secretary Kathleen Sebelius said competition on a level playing field would increase the purchasing power and drive down costs for individuals and small businesses. Websites for each of the exchanges would allow consumers to comparison-shop, with HHS ensuring that plans provide minimum standards for coverage. Patient groups, consumer organizations, and some small-business associations have welcomed the HHS rules, despite some concern that the exchanges could be tilted too far in favor of insurers. Overall, many analysts say, the rules have provided a fair amount of latitude over how the HIEs will be established and governed. Some business lobbyists, however, contend that the complex requirements will increase healthcare costs instead of lowering them. A July 16 editorial in the Wall Street Journal blasted the exchange rules as poorly designed and offering too little flexibility for states.
Two state-run ex-changes already exist, in Massachusetts and Utah. As of mid-July, however, states that had enacted laws to establish their own HIEs were outnumbered by those whose legislatures or governors had specifically blocked efforts to do likewise, according to the National Conference of State Legislatures. If states cannot or will not set up an exchange, HHS will step in and do it for them.
Reversal of Fortune?
Regardless of who ultimately oversees the exchanges, studies have begun suggesting who the most likely participants might be. An analysis by the Kaiser Family Foundation suggests that the newly insured are likely to be relatively older, less educated, more racially diverse, and in poorer health than those who currently carry private insurance but have fewer diagnosed conditions (www.kff.org/health reform/8147.cfm). Just as analysts, such as PwC, say that insurers will need to change their business strategy to lure and retain consumers, hospitals might need to redouble efforts to ensure high quality and patient satisfaction among a patient demographic that might be harder to please.
Mark Williams, MD, FACP, FHM, professor and chief of the division of hospital medicine at Northwestern University’s Feinberg School of Medicine in Chicago, says the shift could represent a boon for hospitals that have been forced to maximize efficiency. “In general, those hospitals that have a poorer payor mix have tended to become very efficient, and so they make money off of Medicare patients,” Dr. Williams, a former SHM president, says. “This is fascinating because, on the one hand, there may be a lot of patients for whom hospitalists can now get paid because they’re insured. But I personally think that, simultaneously, we’re going to be seeing cutbacks in payments for other patients who have private insurance.”
For some hospitals, the net effect on revenue might not be materially different, though Dr. Williams sees a potentially sizable benefit for “safety net” hospitals that care for a large proportion of uninsured patients and excel in making the most of limited resources. Some investors apparently agree. Last December, Nashville, Tenn.-based Vanguard Health Systems finalized a deal to buy Detroit Medical Center, with a total investment of nearly $1.5 billion. Dr. Williams says the expectation is that the medical center will suddenly see many more insured patients via an HIE. The result could be a dramatic boost to its finances.
Wealthier hospitals, by contrast, have had less incentive to maximize efficiency—and now are worried by the potential financial impacts of insurance exchanges. “Your classic, highly profitable community hospital that has a good payor mix loses money on Medicare patients and tends to subsidize that with their private patients,” Dr. Williams says. “The wealthier hospitals are nervous because they’re worried that this entire health insurance exchange is going to put downward pressure on reimbursements from the private insurers.”

—Mark Williams, MD, FACP, SFHM, chief, division of hospital medicine, Feinberg School of Medicine, Northwestern University, Chicago
Satisfaction Times Two
With Medicare’s value-based purchasing initiative on its way, hospitals are ramping up their attention to patient satisfaction scores. So how will an influx of potentially older and sicker patients insured through the exchanges affect hospitalists’ scores? No one knows, but because hospitalists already are known for their expertise in treating this very demographic, some experts expect hospitals to lean on them more for leading quality and satisfaction initiatives. This reliance could represent a major opportunity for HM, but faulty performance metrics could also bring danger (read more about this topic in next month’s The Hospitalist).
Cherilyn Murer, president and CEO of Joliet, Ill.-based Murer Consultants Inc., says the expected shift in the nature of inpatients could accelerate efforts to be more accurate about physicians’ performance measures. “Patients who may be in the ICU are at a higher level of crisis than a person who’s in and out for an appendectomy, and yet we’re using the same tool of satisfaction,” she says. Furthermore, she adds, many factors that contribute to patient satisfaction are highly subjective and have nothing to do with a specific physician. “We have to really question the tools now, moreso than only questioning the participation and the outcome,” she says. As with other aspects of healthcare reform, Murer says, the looming arrival of exchanges also should be prompting hospitalists to ask themselves: “What’s our game plan now?” One compelling answer, she contends, is a clinical comanagement agreement that takes a longer-term view of doctors’ relationships with hospitals and gives them more control over decision-making. After all, if HM is taking care of “the sickest of the sick patients,” she says, a comanagement agreement can mean more say in factors that will directly impact their jobs over the long haul. Strategic direction of product lines, space, and equipment-buying decisions are just a few examples.
Murer ultimately sees clinical comanagement as a precursor to more widespread bundling of payments to hospitals and physicians. The mix of private and public insurance reimbursements, already in flux, might be further clouded by the arrival of HIEs. But solidifying hospital-hospitalist alignment with a flexible comanagement agreement, she says, can offer some reassurance over job structure, rewards, and authority as healthcare continues hurtling toward profound change.
Bryn Nelson is a freelance medical writer based in Seattle.
A 224-page document full of regulatory jargon might not be a fun summer read. Nevertheless, the U.S. Department of Health and Human Service’s (HHS) mid-July release of proposed rules for state-run health insurance exchanges (HIE) represents a major step toward expanding an insurance pool that could grow by an estimated 24 million Americans over the next eight years.
When the exchanges arrive in 2014, the single biggest impact is likely to be a major expansion of access, with 8.9 million individuals expected to sign up in the first year alone, according to projections by the Congressional Budget Office. A new report by PwC US Health Research Institute forecasts that a stunning 97% of those expected participants will be individuals who currently lack health insurance. A major driver of the new enrollments will be sliding-scale federal subsidies for individuals who earn from 138% to 400% of the federal poverty level, helping them buy insurance through the exchanges.
Experts say the exchanges also could directly impact hospitalists by bringing big changes to hospitals’ reimbursement revenue streams, spurring efforts to improve patient satisfaction metrics and increasing the momentum toward clinical comanagement agreements.
First, though, the public will get a chance to weigh in over rules that have been alternately lauded and derided, largely following the fault lines over the broader package of healthcare reforms. At a news conference set in front of a hardware store, HHS Secretary Kathleen Sebelius said competition on a level playing field would increase the purchasing power and drive down costs for individuals and small businesses. Websites for each of the exchanges would allow consumers to comparison-shop, with HHS ensuring that plans provide minimum standards for coverage. Patient groups, consumer organizations, and some small-business associations have welcomed the HHS rules, despite some concern that the exchanges could be tilted too far in favor of insurers. Overall, many analysts say, the rules have provided a fair amount of latitude over how the HIEs will be established and governed. Some business lobbyists, however, contend that the complex requirements will increase healthcare costs instead of lowering them. A July 16 editorial in the Wall Street Journal blasted the exchange rules as poorly designed and offering too little flexibility for states.
Two state-run ex-changes already exist, in Massachusetts and Utah. As of mid-July, however, states that had enacted laws to establish their own HIEs were outnumbered by those whose legislatures or governors had specifically blocked efforts to do likewise, according to the National Conference of State Legislatures. If states cannot or will not set up an exchange, HHS will step in and do it for them.
Reversal of Fortune?
Regardless of who ultimately oversees the exchanges, studies have begun suggesting who the most likely participants might be. An analysis by the Kaiser Family Foundation suggests that the newly insured are likely to be relatively older, less educated, more racially diverse, and in poorer health than those who currently carry private insurance but have fewer diagnosed conditions (www.kff.org/health reform/8147.cfm). Just as analysts, such as PwC, say that insurers will need to change their business strategy to lure and retain consumers, hospitals might need to redouble efforts to ensure high quality and patient satisfaction among a patient demographic that might be harder to please.
Mark Williams, MD, FACP, FHM, professor and chief of the division of hospital medicine at Northwestern University’s Feinberg School of Medicine in Chicago, says the shift could represent a boon for hospitals that have been forced to maximize efficiency. “In general, those hospitals that have a poorer payor mix have tended to become very efficient, and so they make money off of Medicare patients,” Dr. Williams, a former SHM president, says. “This is fascinating because, on the one hand, there may be a lot of patients for whom hospitalists can now get paid because they’re insured. But I personally think that, simultaneously, we’re going to be seeing cutbacks in payments for other patients who have private insurance.”
For some hospitals, the net effect on revenue might not be materially different, though Dr. Williams sees a potentially sizable benefit for “safety net” hospitals that care for a large proportion of uninsured patients and excel in making the most of limited resources. Some investors apparently agree. Last December, Nashville, Tenn.-based Vanguard Health Systems finalized a deal to buy Detroit Medical Center, with a total investment of nearly $1.5 billion. Dr. Williams says the expectation is that the medical center will suddenly see many more insured patients via an HIE. The result could be a dramatic boost to its finances.
Wealthier hospitals, by contrast, have had less incentive to maximize efficiency—and now are worried by the potential financial impacts of insurance exchanges. “Your classic, highly profitable community hospital that has a good payor mix loses money on Medicare patients and tends to subsidize that with their private patients,” Dr. Williams says. “The wealthier hospitals are nervous because they’re worried that this entire health insurance exchange is going to put downward pressure on reimbursements from the private insurers.”
—Mark Williams, MD, FACP, SFHM, chief, division of hospital medicine, Feinberg School of Medicine, Northwestern University, Chicago
Satisfaction Times Two
With Medicare’s value-based purchasing initiative on its way, hospitals are ramping up their attention to patient satisfaction scores. So how will an influx of potentially older and sicker patients insured through the exchanges affect hospitalists’ scores? No one knows, but because hospitalists already are known for their expertise in treating this very demographic, some experts expect hospitals to lean on them more for leading quality and satisfaction initiatives. This reliance could represent a major opportunity for HM, but faulty performance metrics could also bring danger (read more about this topic in next month’s The Hospitalist).
Cherilyn Murer, president and CEO of Joliet, Ill.-based Murer Consultants Inc., says the expected shift in the nature of inpatients could accelerate efforts to be more accurate about physicians’ performance measures. “Patients who may be in the ICU are at a higher level of crisis than a person who’s in and out for an appendectomy, and yet we’re using the same tool of satisfaction,” she says. Furthermore, she adds, many factors that contribute to patient satisfaction are highly subjective and have nothing to do with a specific physician. “We have to really question the tools now, moreso than only questioning the participation and the outcome,” she says. As with other aspects of healthcare reform, Murer says, the looming arrival of exchanges also should be prompting hospitalists to ask themselves: “What’s our game plan now?” One compelling answer, she contends, is a clinical comanagement agreement that takes a longer-term view of doctors’ relationships with hospitals and gives them more control over decision-making. After all, if HM is taking care of “the sickest of the sick patients,” she says, a comanagement agreement can mean more say in factors that will directly impact their jobs over the long haul. Strategic direction of product lines, space, and equipment-buying decisions are just a few examples.
Murer ultimately sees clinical comanagement as a precursor to more widespread bundling of payments to hospitals and physicians. The mix of private and public insurance reimbursements, already in flux, might be further clouded by the arrival of HIEs. But solidifying hospital-hospitalist alignment with a flexible comanagement agreement, she says, can offer some reassurance over job structure, rewards, and authority as healthcare continues hurtling toward profound change.
Bryn Nelson is a freelance medical writer based in Seattle.