User login
Unmasking gastric cancer
A 50-year-old male Japanese immigrant with a history of smoking and occasional untreated heartburn presented with the recent onset of flank pain, weight loss, headache, syncope, and blurred vision.
Previously healthy, he began feeling moderate pain in his left flank 1 month ago; it was diagnosed as kidney stones and was treated conservatively. Two weeks later he had an episode of syncope and soon after developed blurred vision, mainly in his left eye, along with severe bifrontal headache. An eye examination and magnetic resonance imaging of the brain indicated optic neuritis, for which he was given glucocorticoids intravenously for 3 days, with moderate improvement.
As his symptoms continued over the next 2 weeks, he lost 20 lb (9.1 kg) due to the pain, loss of appetite, nausea, and occasional vomiting.
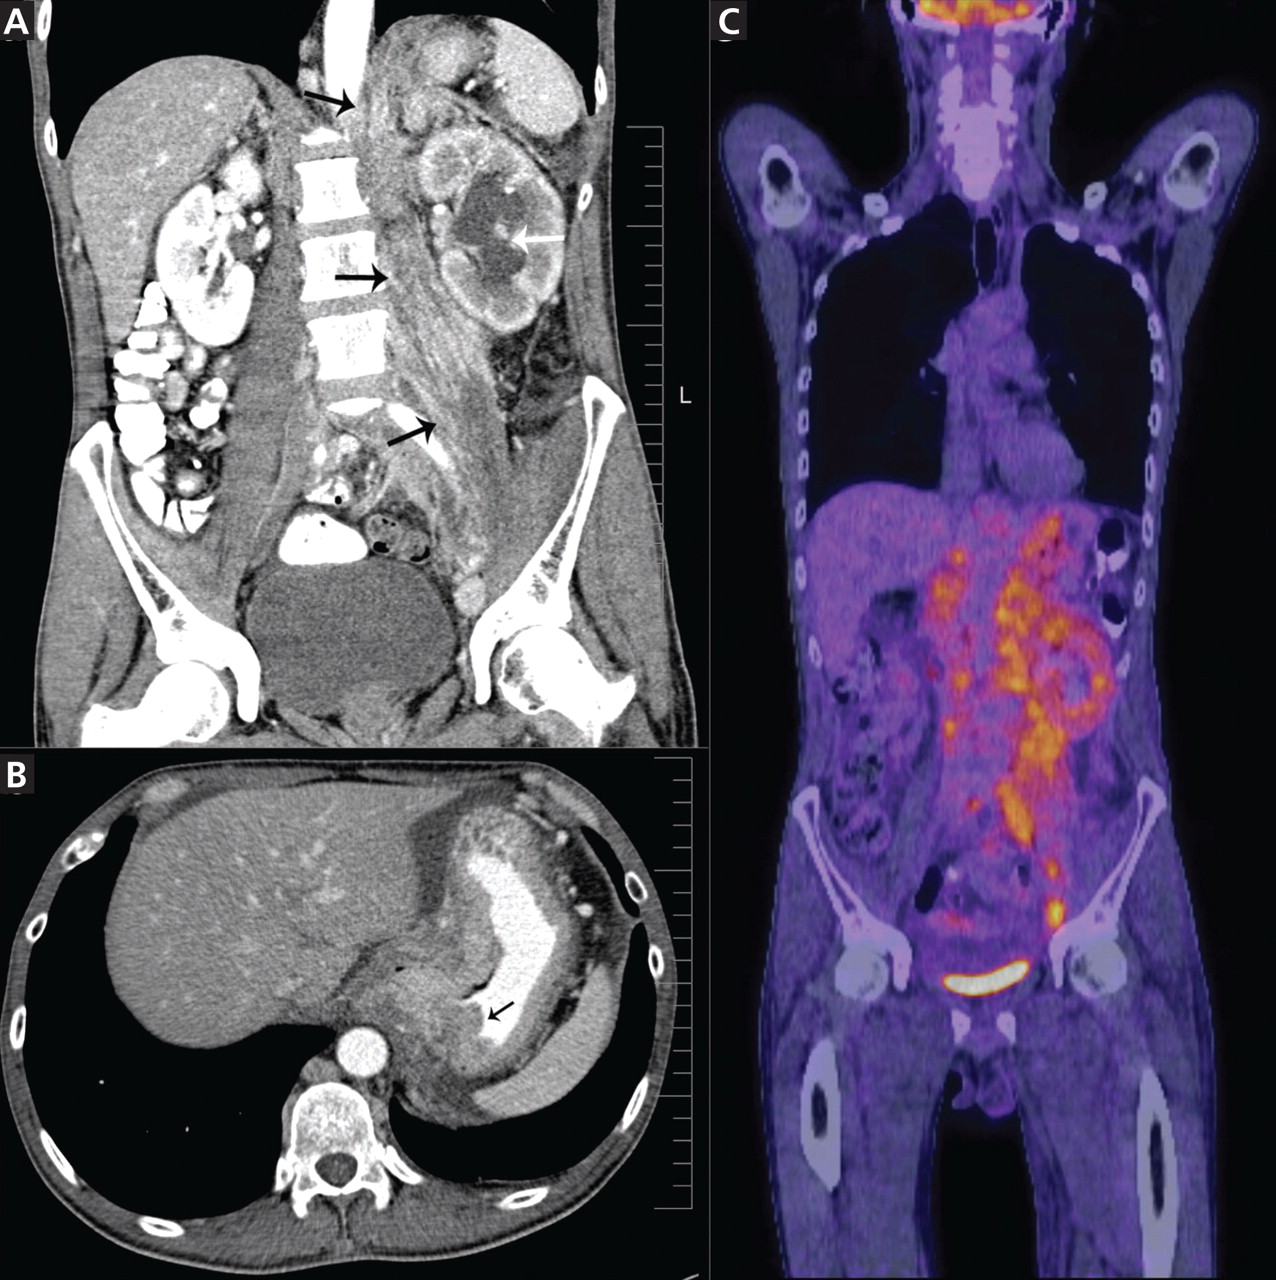
Positron emission tomography showed the retroperitoneal infiltrative process and the thickened gastric cardia to be hypermetabolic (Figure 1C).
The area of retroperitoneal infiltration was biopsied under CT guidance, and pathologic study showed poorly differentiated carcinoma with signet-ring cells, a feature of gastric cancer.
The patient underwent lumbar puncture. His cerebrospinal fluid had 206 white blood cells/μL (reference range 0–5) and large numbers of poorly differentiated malignant cells, most consistent with adenocarcinoma on cytologic study.
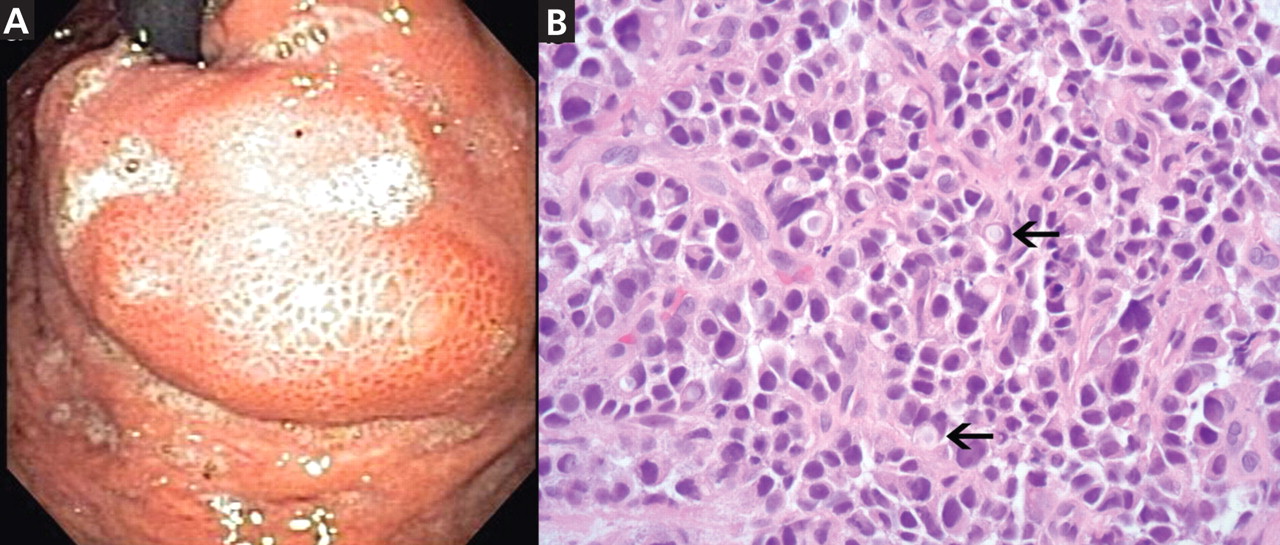
duodenoscopy (EGD) revealed a large, ulcerated, submucosal, nodular mass in the cardia of the stomach extending to the gastroesophageal junction (Figure 2A). Biopsy of the mass again revealed poorly differentiated adenocarcinoma with scattered signet-ring cells undermining the gastric mucosa, favoring a gastric origin (Figure 2B).
THREE SUBTYPES OF GASTRIC CANCER
Worldwide, gastric cancer is the third most common type of cancer and the second most common cause of cancer-related deaths.1 In the United States, blacks and people of Asian ancestry have almost twice the risk of death, with the highest incidence and mortality rates.2,3
Most cases of gastric adenocarcinoma can be categorized as either intestinal or diffuse, but a new proximal subtype is emerging.4
Intestinal-type gastric adenocarcinoma is the most common subtype and accounts for almost all the ethnic and geographic variation in incidence.2 The lesions are often ulcerative and distal; the pathogenesis is stepwise and is initiated by chronic inflammation. Risk factors include old age, Helicobacter pylori infection, tobacco smoking, family history, and high salt intake, with an observed risk-reduction with the use of nonsteroidal anti-inflammatory drugs and with a high intake of fruits and vegetables.3
Diffuse gastric adenocarcinoma, on the other hand, has a uniform distribution worldwide, and its incidence is increasing. It typically carries a poor prognosis. Evidence thus far has shown its pathogenesis to be independent of chronic inflammation, but it has a strong tendency to be hereditary.3
Proximal gastric adenocarcinoma is observed in the gastric cardia and near the gastroesophageal junction. It is often grouped with the distal esophageal adenocarcinomas and has similar risk factors, including reflux disease, obesity, alcohol abuse, and tobacco smoking. Interestingly, however, H pylori infection does not contribute to the pathogenesis of this type, and it may even have a protective role.3
DIFFICULT TO DETECT EARLY
Gastric cancer is difficult to detect early enough in its course to be cured. Understanding its risk factors, recognizing its common symptoms, and regarding its uncommon symptoms with suspicion may lead to earlier diagnosis and more effective treatment.
Our patient’s proximal gastric cancer was diagnosed late even though he had several risk factors for it (he was Japanese, he was a smoker, and he had gastroesophageal reflux disease) because of a late and atypical presentation with misleading paraneoplastic symptoms.
Early diagnosis is difficult because most patients have no symptoms in the early stage; weight loss and abdominal pain are often late signs of tumor progression.
Screening may be justified in high-risk groups in the United States, although the issue is debatable. Diagnostic imaging is the only effective method for screening,5 with EGD considered the first-line targeted evaluation should there be suspicion of gastric cancer either from the clinical presentation or from barium swallow.6 Candidates for screening may include elderly patients with atrophic gastritis or pernicious anemia, immigrants from countries with high rates of gastric carcinoma, and people with a family history of gastrointestinal cancer.7
- Parkin DM, Bray F, Ferlay J, Pisani P. Global cancer statistics, 2002. CA Cancer J Clin 2005; 55:74–108.
- Crew KD, Neugut AI. Epidemiology of gastric cancer. World J Gastroenterol 2006; 12:354–362.
- Shah MA, Kelsen DP. Gastric cancer: a primer on the epidemiology and biology of the disease and an overview of the medical management of advanced disease. J Natl Compr Canc Netw 2010; 8:437–447.
- Fine G, Chan K. Alimentary tract. In:Kissane JM, editor. Anderson’s Pathology. 8th ed. Saint Louis, MO: Mosby; 1985:1055–1095.
- Kunisaki C, Ishino J, Nakajima S, et al. Outcomes of mass screening for gastric carcinoma. Ann Surg Oncol 2006; 13:221–228.
- Cappell MS, Friedel D. The role of esophagogastroduodenoscopy in the diagnosis and management of upper gastrointestinal disorders. Med Clin North Am 2002; 86:1165–1216.
- Hisamuchi S, Fukao P, Sugawara N, et al. Evaluation of mass screening programme for stomach cancer in Japan. In:Miller AB, Chamberlain J, Day NE, et al, editors. Cancer Screening. Cambridge, UK: Cambridge University Press; 1991:357–372.
A 50-year-old male Japanese immigrant with a history of smoking and occasional untreated heartburn presented with the recent onset of flank pain, weight loss, headache, syncope, and blurred vision.
Previously healthy, he began feeling moderate pain in his left flank 1 month ago; it was diagnosed as kidney stones and was treated conservatively. Two weeks later he had an episode of syncope and soon after developed blurred vision, mainly in his left eye, along with severe bifrontal headache. An eye examination and magnetic resonance imaging of the brain indicated optic neuritis, for which he was given glucocorticoids intravenously for 3 days, with moderate improvement.
As his symptoms continued over the next 2 weeks, he lost 20 lb (9.1 kg) due to the pain, loss of appetite, nausea, and occasional vomiting.
Positron emission tomography showed the retroperitoneal infiltrative process and the thickened gastric cardia to be hypermetabolic (Figure 1C).
The area of retroperitoneal infiltration was biopsied under CT guidance, and pathologic study showed poorly differentiated carcinoma with signet-ring cells, a feature of gastric cancer.
The patient underwent lumbar puncture. His cerebrospinal fluid had 206 white blood cells/μL (reference range 0–5) and large numbers of poorly differentiated malignant cells, most consistent with adenocarcinoma on cytologic study.
duodenoscopy (EGD) revealed a large, ulcerated, submucosal, nodular mass in the cardia of the stomach extending to the gastroesophageal junction (Figure 2A). Biopsy of the mass again revealed poorly differentiated adenocarcinoma with scattered signet-ring cells undermining the gastric mucosa, favoring a gastric origin (Figure 2B).
THREE SUBTYPES OF GASTRIC CANCER
Worldwide, gastric cancer is the third most common type of cancer and the second most common cause of cancer-related deaths.1 In the United States, blacks and people of Asian ancestry have almost twice the risk of death, with the highest incidence and mortality rates.2,3
Most cases of gastric adenocarcinoma can be categorized as either intestinal or diffuse, but a new proximal subtype is emerging.4
Intestinal-type gastric adenocarcinoma is the most common subtype and accounts for almost all the ethnic and geographic variation in incidence.2 The lesions are often ulcerative and distal; the pathogenesis is stepwise and is initiated by chronic inflammation. Risk factors include old age, Helicobacter pylori infection, tobacco smoking, family history, and high salt intake, with an observed risk-reduction with the use of nonsteroidal anti-inflammatory drugs and with a high intake of fruits and vegetables.3
Diffuse gastric adenocarcinoma, on the other hand, has a uniform distribution worldwide, and its incidence is increasing. It typically carries a poor prognosis. Evidence thus far has shown its pathogenesis to be independent of chronic inflammation, but it has a strong tendency to be hereditary.3
Proximal gastric adenocarcinoma is observed in the gastric cardia and near the gastroesophageal junction. It is often grouped with the distal esophageal adenocarcinomas and has similar risk factors, including reflux disease, obesity, alcohol abuse, and tobacco smoking. Interestingly, however, H pylori infection does not contribute to the pathogenesis of this type, and it may even have a protective role.3
DIFFICULT TO DETECT EARLY
Gastric cancer is difficult to detect early enough in its course to be cured. Understanding its risk factors, recognizing its common symptoms, and regarding its uncommon symptoms with suspicion may lead to earlier diagnosis and more effective treatment.
Our patient’s proximal gastric cancer was diagnosed late even though he had several risk factors for it (he was Japanese, he was a smoker, and he had gastroesophageal reflux disease) because of a late and atypical presentation with misleading paraneoplastic symptoms.
Early diagnosis is difficult because most patients have no symptoms in the early stage; weight loss and abdominal pain are often late signs of tumor progression.
Screening may be justified in high-risk groups in the United States, although the issue is debatable. Diagnostic imaging is the only effective method for screening,5 with EGD considered the first-line targeted evaluation should there be suspicion of gastric cancer either from the clinical presentation or from barium swallow.6 Candidates for screening may include elderly patients with atrophic gastritis or pernicious anemia, immigrants from countries with high rates of gastric carcinoma, and people with a family history of gastrointestinal cancer.7
- Parkin DM, Bray F, Ferlay J, Pisani P. Global cancer statistics, 2002. CA Cancer J Clin 2005; 55:74–108.
- Crew KD, Neugut AI. Epidemiology of gastric cancer. World J Gastroenterol 2006; 12:354–362.
- Shah MA, Kelsen DP. Gastric cancer: a primer on the epidemiology and biology of the disease and an overview of the medical management of advanced disease. J Natl Compr Canc Netw 2010; 8:437–447.
- Fine G, Chan K. Alimentary tract. In:Kissane JM, editor. Anderson’s Pathology. 8th ed. Saint Louis, MO: Mosby; 1985:1055–1095.
- Kunisaki C, Ishino J, Nakajima S, et al. Outcomes of mass screening for gastric carcinoma. Ann Surg Oncol 2006; 13:221–228.
- Cappell MS, Friedel D. The role of esophagogastroduodenoscopy in the diagnosis and management of upper gastrointestinal disorders. Med Clin North Am 2002; 86:1165–1216.
- Hisamuchi S, Fukao P, Sugawara N, et al. Evaluation of mass screening programme for stomach cancer in Japan. In:Miller AB, Chamberlain J, Day NE, et al, editors. Cancer Screening. Cambridge, UK: Cambridge University Press; 1991:357–372.
Hepatic encephalopathy: Suspect it early in patients with cirrhosis
Hepatic encephalopathy is a serious but often reversible complication that arises when the liver cannot detoxify the portal venous blood (Table 1).1
PROPOSED PATHOGENETIC FACTORS
About 5.5 million cases of chronic liver disease and cirrhosis were reported in the United States in 2001. Hepatic encephalopathy is becoming more common as the prevalence of cirrhosis increases,2 and this will have important economic repercussions; in 2001, charges from hospitalizations because of hepatic encephalopathy were estimated at $932 million.3
Hepatic encephalopathy develops as cirrhosis progresses or as a result of portosystemic shunting, so that the liver cannot detoxify the portal venous blood. Several neurotoxins (notably ammonia) and inflammatory mediators play key roles in its pathogenesis, inducing low-grade brain edema and producing a wide spectrum of neuropsychiatric manifestations.4 Yet its pathogenesis is not entirely understood, impeding advances in its diagnosis and therapy.
Several hypotheses about the pathogenesis of hepatic encephalopathy have emerged in the last few years, and a number of factors are reported to directly or indirectly affect brain function in this condition. Ammonia and glutamine are the neurotoxins most often implicated in this syndrome5; others include inflammatory mediators, certain amino acids, and manganese.5,6
Ammonia causes brain swelling
Ammonia is primarily the byproduct of bacterial metabolism of protein and nitrogenous compounds in the colon and of glutamine metabolism in enterocytes.7
Normally, gut-absorbed ammonia is delivered via the portal vein to the liver, where most of it is metabolized into urea, leaving a small amount to be metabolized in the muscles, heart, brain, and kidneys. In cirrhosis and other conditions associated with hepatic encephalopathy, less ammonia is metabolized into urea and more of it reaches the astrocytes in the brain. The brain lacks a urea cycle but metabolizes ammonia to glutamine via glutamine synthase, an enzyme unique to astrocytes.
Ammonia causes swelling of astrocytes and brain edema via generation of glutamine, an osmotically active substance.
Glutamine causes swelling, oxidative stress
Glutamine draws water into astrocytes and induces changes of type II astrocytosis (also called Alzheimer type II astrocytosis)5 characterized by swelling, enlarged and pale nuclei, and displacement of chromatin to the periphery of the cell. Inhibition of glutamine synthase prevents astrocyte swelling in animals.8
Glutamine also enhances the activation of several receptors, including N-methyl-d-aspartate (NMDA) receptors,9,10 gammaaminobutyric acid (GABA) receptors, and peripheral-type benzodiazepine receptors on the mitochondrial membrane.10–12 A state of oxidative stress ensues, and this affects oxidation of protein and RNA, neurotransmitter synthesis, and neurotransmission at the neuronal junction.13 Reactive nitrogen and oxide radicals induce the release of inflammatory mediators such as interleukins 1 and 6, tumor necrosis factor, interferons, and neurosteroids, and contribute to edema and neurotoxicity.6,10 Neurosteroids are byproducts of mitochondrial metabolism of steroid hormones in the astrocyte.
Manganese enhances neurosteroid synthesis
Manganese enhances neurosteroid synthesis via activation of translocator proteins on the astrocyte membrane. It was first recognized as a factor in hepatic encephalopathy when cirrhotic patients experiencing extrapyramidal symptoms were found to have deposits of manganese in the caudate nucleus and in the globus pallidus on magnetic resonance imaging (MRI). Such deposits were also seen in specimens of brain tissue on autopsy of these patients. When the encephalopathy resolved, so did the abnormalities on MRI.14,15
Changes in the blood-brain barrier
Astrocytes contribute to the selective permeability of the blood-brain barrier. Disruptions in the permeability of the blood-brain barrier underlie hepatic encephalopathy, with poor diffusion of molecules out of astrocytes.
For instance, zinc, which plays a regulatory role in gene transcription and synaptic plasticity, accumulates in the astrocytes, causing relative zinc deficiency and further affecting neurotransmitter synthesis and neurotransmission at the neuronal synapse.6,16
Hyponatremia
Hyponatremia (a serum sodium concentration < 130 mmol/L) is increasingly being recognized as an independent predictor of overt hepatic encephalopathy and is reported to increase the risk by a factor of eight.17
Neuronal dysfunction
Astrocytes are integral to the physiologic functioning of the neurons, and it is becoming clear that both neurons and astrocytes are affected in hepatic encephalopathy.
Additionally, neuroinflammation and a decrease in energy metabolism by the brain are described during episodes of hepatic encephalopathy.18
Amino acid imbalance
An imbalance between aromatic amino acids (ie, high levels of tyrosine and phenylalanine) and branched-chain amino acids (leucine, isoleucine, and valine) has been linked with encephalopathy in patients with liver disease, 19–21 but it is not totally clear whether this imbalance contributes to hepatic encephalopathy or is a consequence of it.
Low-grade brain edema
Edema of the brain occurs in all forms of hepatic encephalopathy, but in cirrhosis it is characteristically of low grade. The mechanism behind this low-grade edema is not clear. Studies have shown that swelling of astrocytes is not global but involves certain areas of the brain and is associated with compensatory extrusion of intracellular myoinositol.22 This, in combination with a mild degree of brain atrophy23 observed in patients with chronic liver disease, is thought to keep the brain from extreme swelling and herniation, a phenomenon usually seen in acute hepatic failure.24,25
Transjugular intrahepatic portosystemic shunting and encephalopathy
The incidence rate of hepatic encephalopathy after placement of a portosystemic shunt to treat portal hypertension ranges from 30% to 55% and is similar to the rate in cirrhotic patients without a shunt.26 In 5% to 8% of patients, the hepatic encephalopathy is refractory and requires intentional occlusion of the shunt.26,27 An elevated serum creatinine level appears to be a risk factor for refractory hepatic encephalopathy in patients with a portosystemic shunt.26
In one study,28 when transjugular intrahepatic portosystemic shunting was done early in the treatment of cirrhotic patients with acute variceal bleeding, the rates of treatment failure and death were significantly less than in a control group that received endoscopic therapy, and no significant difference was noted in the rate of encephalopathy or of serious adverse effects between the groups.
Whether to place a portosystemic shunt in a patient with cirrhosis and a history of hepatic encephalopathy depends on the possible underlying causes of the encephalopathy. For example, if encephalopathy was precipitated by variceal bleeding, shunt placement will prevent further bleeding and will make a recurrence of encephalopathy less likely. However, if the encephalopathy is persistent and uncontrollable, then shunt placement is contraindicated.27
A SPECTRUM OF SYMPTOMS
The spectrum of symptoms extends from a subclinical syndrome that may not be clinically apparent (early-stage or “minimal” hepatic encephalopathy) to full-blown neuropsychiatric manifestations such as cognitive impairment, confusion, slow speech, loss of fine motor skills, asterixis, peripheral neuropathy, clonus, the Babinski sign, decerebrate and decorticate posturing, seizures, extrapyramidal symptoms, and coma.4 The clinical manifestations are usually reversible with prompt treatment, but recurrence is common, typically induced by an event such as gastrointestinal bleeding or an infection.
Minimal hepatic encephalopathy is important to recognize
Although this subclinical syndrome is a very early stage, it is nevertheless associated with higher rates of morbidity and can affect quality of life, including the patient’s ability to drive a car.29,30
Abnormal changes in the brain begin at this stage and eventually progress to more damage and to the development of overt clinical symptoms.
The exact prevalence of minimal hepatic encephalopathy is not known because it is difficult to diagnose, but reported rates range between 30% and 84% of patients with cirrhosis.31 Progression from minimal to overt hepatic encephalopathy is 3.7 times more likely than in patients without the diagnosis of minimal hepatic encephalopathy.32
Thus, minimal hepatic encephalopathy is important to identify,29 so that treatment can be started.
Overt encephalopathy and survival
The prevalence of overt encephalopathy in cirrhosis ranges from 30% to 40% and is even higher in the advanced stages. Once encephalopathy develops, the prognosis worsens rapidly. In patients who do not undergo liver transplantation, the survival rate at 1 year is 42%, and the survival rate at 3 years is 23%.33
These rates are worse than those after liver transplantation, and the American Association for the Study of Liver Diseases recommends that patients with cirrhosis who develop a first episode of encephalopathy be considered for liver transplantation and be referred to a transplantation center.34
CHALLENGES IN DIAGNOSIS
Since the symptoms of hepatic encephalopathy are not specific and can be subtle in the early stage, its diagnosis may be a challenge. It is important to recognize that this neuropsychiatric complication occurs in people with severe comorbidities and requires dedicated time for evaluation and management.
Special tests may be needed to detect subclinical hepatic encephalopathy
In subclinical hepatic encephalopathy, the apparent lack of manifestations poses a great diagnostic challenge, but a thorough history may uncover poor social interaction, personality changes, poor performance at work, and recent traffic violations or motor vehicle accidents. Primary care physicians are usually the first to suspect the condition because they are familiar with the patient’s baseline mental and physical conditions.
For example, the primary care physician may notice decreased attention and worsening memory during a follow-up visit, or the physician may ask whether the patient has difficulty with work performance and handwork (psychomotor and fine motor skills), and whether there have been traffic violations or car accidents (visuospatial skills). Such clues, although not restrictive, may help identify patients with minimal hepatic encephalopathy and prompt referral for neuropsychiatric testing.
Neurologic deficits described in the subclinical form are in the domains of attention and concentration, working memory, visuospatial ability, and fine motor skills; communication skills remain intact.35 These deficits are not reliably detected on standard clinical evaluation but can be detected by neuropsychiatric and neurophysiologic testing.
While several tests for minimal hepatic encephalopathy have been developed, they need to be validated in large trials in the United States.
Neurophysiologic tests include electroencephalography and auditory or visual event-related P300 (evoked potential) testing.
Neuropsychiatric tests traditionally involved several batteries administered and interpreted by specialized personnel. They were time-consuming and were not practical in a typical office setting. They were later refined into the Psychometric Hepatic Encephalopathy Score test (ie, the PSE syndrome test).36 This combines a digit symbol test, a serial dotting test, a line-tracing test, and a number-connection or figure-connection test. An abnormal result in at least three of the four subtests constitutes an overall abnormal PSE syndrome test.
The PSE syndrome test has been validated for standard use in Germany, Spain, Italy, the United Kingdom, and India.35 In 1999, the Working Group on Hepatic Encephalopathy designated it as the official test for minimal hepatic encephalopathy.1 But the test has not been validated for use in the United States. Other tests have been developed, but their use is also limited by a lack of validation and by copyright laws. These factors constitute major obstacles to the diagnosis of subclinical hepatic encephalopathy in the United States. Nonetheless, physicians who suspect minimal hepatic encephalopathy may start lactulose therapy37 and schedule frequent follow-up visits to address and manage potential precipitating factors for overt hepatic encephalopathy.
Staging the severity of the encephalopathy
It is essential to exclude stroke, cerebral bleeding, and brain tumor before making a diagnosis of a first episode of hepatic encephalopathy. Thereafter, such exclusion must be guided by whether the patient has risk factors for these conditions or persistent symptoms of encephalopathy that do not respond to medical therapy.
Laboratory tests can identify metabolic derangements
Although laboratory tests are not diagnostic for hepatic encephalopathy, they can identify metabolic derangements that could contribute to it.
Imaging can help exclude other diagnoses
Neurophysiologic imaging studies such as magnetic resonance spectroscopy, magnetic transfer imaging, and water-mapping techniques have helped elucidate pathologic mechanisms of hepatic encephalopathy and are available in research centers, but they are not currently considered for diagnosis.
SEVERAL LINES OF TREATMENT
Treatment of hepatic encephalopathy involves a preemptive approach to address potential precipitating factors, medical therapy to reduce the production and absorption of ammonia from the gut, and surgical or interventional therapies. A multidisciplinary approach for testing the severity of neurologic impairment and response to therapy is needed to help determine if and when liver transplantation is required.
Prevent potential precipitating factors
An important concept in managing hepatic encephalopathy is to recognize that every cirrhotic patient is at risk and to make an effort to address potential precipitating factors during regular clinic visits. This includes reviewing medication dosing and adverse effects, emphasizing abstinence from alcohol and other toxic substances, and preventing bleeding from esophageal varices with endoscopic band ligation.
Diet therapy
The prevalence of malnutrition in cirrhosis may be as high as 100%. Vitamin and nutritional deficiencies should be evaluated by a nutrition specialist, and nutritional needs should be reassessed on a regular basis. Protein restriction is no longer recommended and may even be harmful.
Guidelines of the European Society of Parenteral and Enteric Nutrition in 2006 recommended that patients with liver disease should have an energy intake of 35 to 40 kcal/kg of body weight daily, with a total daily protein intake of 1.2 to 1.5 mg/kg of body weight.41 Frequent meals and bedtime snacks are encouraged to avoid periods of prolonged fasting and catabolism of muscle protein and to improve nitrogen balance. Branched-chain amino acids and vegetable protein supplements are suggested to help meet the daily requirements.42
Drug therapy to reduce neurotoxins
Drug treatment is directed at reducing the neurotoxins that accumulate in cirrhosis. A variety of agents have been used.
Lactulose (Kristalose) is approved by the US Food and Drug Administration (FDA) as a first-line treatment. It has been shown to improve quality of life and cognitive function in patients with cirrhosis and minimal hepatic encephalopathy, although it has failed to improve mortality rates.37
Lactulose, a cathartic disaccharide, is metabolized by colonic bacteria into short-chain fatty acids. The acidic microenvironment has three major effects:
- It aids the transformation of ammonia to ammonium (NH4+), which is then trapped in the stool, leaving less ammonia to be absorbed
- It has a cathartic effect
- It reduces the breakdown of nitrogenous compounds into ammonia.43
Lactulose has an excessively sweet taste. Its side effects include flatulence, abdominal discomfort, and diarrhea. The usual oral dose is 15 to 45 mL/day given in multiple doses to induce two to three soft bowel movements daily. At this dosage, the monthly cost varies between $60 and $120.
Lactilol, a nonabsorbable disaccharide, is as effective as lactulose but with fewer side effects. It is not available in the United States.
Rifaximin (Xifaxan), a derivative of rifamycin, is FDA-approved for the maintenance of remission of hepatic encephalopathy but is not recommended as a first-line agent. It inhibits bacterial RNA synthesis in the gut. Less than 0.4% of an oral dose is absorbed.44
In a randomized, double-blind, placebo-controlled trial in patients who had had at least two episodes of hepatic encephalopathy while on lactulose therapy, taking rifaximin 550 mg twice a day for 6 months provided a prolonged remission from recurrences of encephalopathy compared with placebo.45 Side effects included nausea, vomiting, abdominal pain, weight loss, and Clostridium difficile colitis, which was reported in two cases in the study.45
Unfortunately, the effects of this drug beyond 6 months of therapy have not been studied. In addition, the drug is expensive: 1 month of treatment with rifaximin can cost between $700 and $1,500. Combining lactulose and rifaximin adds to the costs and the side effects, and contributes to poor adherence to therapy.
Other antibiotics such as metronidazole (Flagyl), vancomycin, and neomycin have been used as alternatives to lactulose, based on the principle that they reduce ammonia-producing bacteria in the gut. However, their efficacy in hepatic encephalopathy remains to be determined.
In controlled trials, neomycin combined with sorbitol, magnesium sulfate, or lactulose was as effective as lactulose, but when used alone, neomycin was no better than placebo.46,47 Neomycin was approved many years ago as an adjunct in the management of hepatic coma, but it has since fallen out of favor in the management of hepatic encephalopathy because of poor trial results and because of neurotoxicity and ototoxicity.
Branched-chain amino acids (leucine, isoleucine, and valine)48 are reported to increase ammonia intake in muscle and to improve cognitive functions on the PSE scale in minimal hepatic encephalopathy,49,50 but they did not decrease the rate of recurrence of hepatic encephalopathy.51 While debate continues over their efficacy in the management of hepatic encephalopathy, branched-chain amino acids may be used to improve nutritional status and muscle mass of patients with cirrhosis. However, the dosing is not standardized, and long-term compliance may be problematic.
Other medical therapies include zinc,16 sodium benzoate,50 and l-ornithine-l-aspartate52,53 to stimulate residual urea cycle activities; probiotics (which pose a risk of sepsis from fungi and lactobacilli); and laxatives.
Liver dialysis
Adsorbing toxins from the blood via liver dialysis or using a non-cell-based liver support system such as MARS (Molecular Adsorbent Recirculating System, Gambro, Inc.) appears to improve the amino acid profile in hepatic encephalopathy, but its role has not been clarified, and its use is limited to clinical trials.54,55
Transjugular intrahepatic shunts and large portosystemic shunts may need to be closed in order to reverse encephalopathy refractory to drug therapy.26,27,56
Liver transplantation
The current scoring system for end-stage liver disease does not include hepatic encephalopathy as a criterion for prioritizing patients on the transplantation list because it was originally developed to assess short-term prognosis in patients undergoing transjugular intrahepatic shunting. As a consequence, patients with end-stage liver disease are at increased risk of repeated episodes of encephalopathy, hospital readmission, and death. Therefore, the American Association for the Study of Liver Diseases recommends referral to a transplantation center when the patient experiences a first episode of overt hepatic encephalopathy to initiate a workup for liver transplantation.34
Liver transplantation improves survival in patients with severe hepatic dysfunction, but the presence of neurologic deficits may result in significant morbidity and in death.57,58 After transplantation, resolution of cognitive dysfunction, brain edema, and white-matter changes have been reported,59 but neuronal cell death and persistent cognitive impairment after resolution of overt hepatic encephalopathy are also described.60–63
Whether neurologic impairment will resolve after liver transplantation depends on a number of factors: the severity of encephalopathy before transplantation; the nature of the neurologic deficits; advanced age; history of alcohol abuse and the presence of alcoholic brain damage; persistence of portosystemic shunts after transplant; emergency transplantation; complications during surgery; and side effects of immunosuppressive drugs.57,58,64
The optimal timing of liver transplantation is not clearly defined for patients who have had bouts of hepatic encephalopathy, and more study is needed to determine the reversibility of clinical symptoms and brain damage. It is in these situations that neuropsychiatric testing and advanced neuroimaging can help determine the efficacy of therapeutic interventions, and it should be considered part of the pretransplantation evaluation.
Managing sleep disturbances
Insomnia and other changes in sleep-wake patterns are common in patients with cirrhosis, especially advanced cirrhosis.65 It is not known whether these changes represent early stages of hepatic encephalopathy.66 Patients often complain of fatigue, the need for frequent naps, and lethargy during the day and restlessness and inability to sleep at night. This affects the patient’s behavior and daytime functioning, and it also burdens household members and caregivers.
Long-acting benzodiazepines should be avoided when treating sleep disorders in cirrhosis because they may precipitate the encephalopathy. In a randomized controlled trial, hydroxyzine (Vistaril) at a dose of 25 mg at bedtime improved sleep behavior in 40% of patients with cirrhosis and subclinical hepatic encephalopathy, but 1 of 17 patients developed acute encephalopathy, which reversed with cessation of the hydroxyzine.66 Clearly, caution and close monitoring are required when giving hydroxyzine for sleep disorders in cirrhotic patients.
- Ferenci P, Lockwood A, Mullen K, Tarter R, Weissenborn K, Blei AT. Hepatic encephalopathy—definition, nomenclature, diagnosis, and quantification: final report of the working party at the 11th World Congresses of Gastroenterology, Vienna, 1998. Hepatology 2002; 35:716–721.
- Fleming KM, Aithal GP, Solaymani-Dodaran M, Card TR, West J. Incidence and prevalence of cirrhosis in the United Kingdom, 1992–2001: a general population-based study. J Hepatol 2008; 49:732–738.
- Poordad FF. Review article: the burden of hepatic encephalopathy. Aliment Pharmacol Ther 2007; 25(suppl 1):3–9.
- Bajaj JS, Wade JB, Sanyal AJ. Spectrum of neurocognitive impairment in cirrhosis: Implications for the assessment of hepatic encephalopathy. Hepatology 2009; 50:2014–2021.
- Norenberg MD, Jayakumar AR, Rama Rao KV, Panickar KS. New concepts in the mechanism of ammonia-induced astrocyte swelling. Metab Brain Dis 2007; 22:219–234.
- Häussinger D, Görg B. Interaction of oxidative stress, astrocyte swelling and cerebral ammonia toxicity. Curr Opin Clin Nutr Metab Care 2010; 13:87–92.
- Romero-Gómez M, Ramos-Guerrero R, Grande L, et al. Intestinal glutaminase activity is increased in liver cirrhosis and correlates with minimal hepatic encephalopathy. J Hepatol 2004; 41:49–54.
- Tanigami H, Rebel A, Martin LJ, et al. Effect of glutamine synthetase inhibition on astrocyte swelling and altered astroglial protein expression during hyperammonemia in rats. Neuroscience 2005; 131:437–449.
- Llansola M, Rodrigo R, Monfort P, et al. NMDA receptors in hyperammonemia and hepatic encephalopathy. Metab Brain Dis 2007; 22:321–335.
- Montoliu C, Piedrafita B, Serra MA, et al. IL-6 and IL-18 in blood may discriminate cirrhotic patients with and without minimal hepatic encephalopathy. J Clin Gastroenterol 2009; 43:272–279.
- Desjardins P, Butterworth RF. The “peripheral-type” benzodiazepine (omega 3) receptor in hyperammonemic disorders. Neurochem Int 2002; 41:109–114.
- Häussinger D, Schliess F. Pathogenetic mechanisms of hepatic encephalopathy. Gut 2008; 57:1156–1165.
- Cauli O, Rodrigo R, Llansola M, et al. Glutamatergic and gabaergic neurotransmission and neuronal circuits in hepatic encephalopathy. Metab Brain Dis 2009; 24:69–80.
- Krieger D, Krieger S, Jansen O, Gass P, Theilmann L, Lichtnecker H. Manganese and chronic hepatic encephalopathy. Lancet 1995; 346:270–274.
- Pomier-Layrargues G, Spahr L, Butterworth RF. Increased manganese concentrations in pallidum of cirrhotic patients. Lancet 1995; 345:735.
- Schliess F, Görg B, Häussinger D. RNA oxidation and zinc in hepatic encephalopathy and hyperammonemia. Metab Brain Dis 2009; 24:119–134.
- Guevara M, Baccaro ME, Torre A, et al. Hyponatremia is a risk factor of hepatic encephalopathy in patients with cirrhosis: a prospective study with time-dependent analysis. Am J Gastroenterol 2009; 104:1382–1389.
- Hertz L, Kala G. Energy metabolism in brain cells: effects of elevated ammonia concentrations. Metab Brain Dis 2007; 22:199–218.
- Marchesini G, Zoli M, Dondi C, et al. Prevalence of subclinical hepatic encephalopathy in cirrhotics and relationship to plasma amino acid imbalance. Dig Dis Sci 1980; 25:763–768.
- Morgan MY, Milsom JP, Sherlock S. Plasma ratio of valine, leucine and isoleucine to phenylalanine and tyrosine in liver disease. Gut 1978; 19:1068–1073.
- Fischer JE, Rosen HM, Ebeid AM, James JH, Keane JM, Soeters PB. The effect of normalization of plasma amino acids on hepatic encephalopathy in man. Surgery 1976; 80:77–91.
- Poveda MJ, Bernabeu A, Concepción L, et al. Brain edema dynamics in patients with overt hepatic encephalopathy A magnetic resonance imaging study. Neuroimage 2010; 52:481–487.
- Bernthal P, Hays A, Tarter RE, Van Thiel D, Lecky J, Hegedus A. Cerebral CT scan abnormalities in cholestatic and hepatocellular disease and their relationship to neuropsychologic test performance. Hepatology 1987; 7:107–114.
- Sugimoto R, Iwasa M, Maeda M, et al. Value of the apparent diffusion coefficient for quantification of low-grade hepatic encephalopathy. Am J Gastroenterol 2008; 103:1413–1420.
- Häussinger D. Low grade cerebral edema and the pathogenesis of hepatic encephalopathy in cirrhosis. Hepatology 2006; 43:1187–1190.
- Masson S, Mardini HA, Rose JD, Record CO. Hepatic encephalopathy after transjugular intrahepatic portosystemic shunt insertion: a decade of experience. QJM 2008; 101:493–501.
- Boyer TD, Haskal ZJ; American Association for the Study of Liver Diseases. The role of transjugular intrahepatic portosystemic shunt (TIPS) in the management of portal hypertension: update 2009. Hepatology 2010; 51:306.
- García-Pagán JC, Caca K, Bureau C, et al; Early TIPS (Transjugular Intrahepatic Portosystemic Shunt) Cooperative Study Group. Early use of TIPS in patients with cirrhosis and variceal bleeding. N Engl J Med 2010; 362:2370–2379.
- Kircheis G, Knoche A, Hilger N, et al. Hepatic encephalopathy and fitness to drive. Gastroenterology 2009; 137:1706–1715.e1–9.
- Bajaj JS, Saeian K, Schubert CM, et al. Minimal hepatic encephalopathy is associated with motor vehicle crashes: the reality beyond the driving test. Hepatology 2009; 50:1175–1183.
- Hartmann IJ, Groeneweg M, Quero JC, et al. The prognostic significance of subclinical hepatic encephalopathy. Am J Gastroenterol 2000; 95:2029–2034.
- Romero-Gómez M, Boza F, García-Valdecasas MS, García E, Aguilar-Reina J. Subclinical hepatic encephalopathy predicts the development of overt hepatic encephalopathy. Am J Gastroenterol 2001; 96:2718–2723.
- Bustamante J, Rimola A, Ventura PJ, et al. Prognostic significance of hepatic encephalopathy in patients with cirrhosis. J Hepatol 1999; 30:890–895.
- Murray KF, Carithers RL jR; AASLD. AASLD practice guidelines: evaluation of the patient for liver transplantation. Hepatology 2005; 41:1407–1432.
- Amodio P, Montagnese S, Gatta A, Morgan MY. Characteristics of minimal hepatic encephalopathy. Metab Brain Dis 2004; 19:253–267.
- Weissenborn K. PHES: one label, different goods?! J Hepatol 2008; 49:308–312.
- Prasad S, Dhiman RK, Duseja A, Chawla YK, Sharma A, Agarwal R. Lactulose improves cognitive functions and health-related quality of life in patients with cirrhosis who have minimal hepatic encephalopathy. Hepatology 2007; 45:549–559.
- Parsons-Smith BG, Summerskill WHJ, Dawson AM, Sherlock S. The electroencephalograph in liver disease. Lancet 1957; 2:867–871.
- Teasdale G, Jennett B. Assessment of coma and impaired consciousness. A practical scale. Lancet 1974; 2:81–84.
- Rovira A, Alonso J, Córdoba J. MR imaging findings in hepatic encephalopathy. AJNR Am J Neuroradiol 2008; 29:1612–1621.
- Plauth M, Cabré E, Riggio O, Assis-Camilo M, Pirlich M, Kondrup J; DGEM (German Society for Nutritional Medicine); ESPEN (European Society for Parenteral and Enteral Nutrition). ESPEN guidelines on enteral nutrition: liver disease. Clin Nutr 2006; 25:285–294.
- Gheorghe L, Iacob R, Vadan R, Iacob S, Gheorghe C. Improvement of hepatic encephalopathy using a modified high-calorie high-protein diet. Rom J Gastroenterol 2005; 14:231–238.
- Weber FL. Effects of lactulose on nitrogen metabolism. Scand J Gastroenterol Suppl 1997; 222:83–87.
- Ojetti V, Lauritano EC, Barbaro F, et al. Rifaximin pharmacology and clinical implications. Expert Opin Drug Metab Toxicol 2009; 5:675–682.
- Bass NM, Mullen KD, Sanyal A, et al. Rifaximin treatment in hepatic encephalopathy. N Engl J Med 2010; 362:1071–1081.
- Blei AT, Córdoba J; Practice Parameters Committee of the American College of Gastroenterology. Hepatic encephalopathy. Am J Gastroenterol 2001; 96:1968–1976.
- Rothenberg ME, Keeffe EB. Antibiotics in the management of hepatic encephalopathy: an evidence-based review. Rev Gastroenterol Disord 2005; 5(suppl 3):26–35.
- Charlton M. Branched-chain amino acid enriched supplements as therapy for liver disease. J Nutr 2006; 136(suppl 1):295S–298S.
- Egberts EH, Schomerus H, Hamster W, Jürgens P. [Branched-chain amino acids in the treatment of latent porto-systemic encephalopathy. A placebo-controlled double-blind cross-over study] [in German]. Z Ernahrungswiss 1986; 25:9–28.
- Plauth M, Egberts EH, Hamster W, et al. Long-term treatment of latent portosystemic encephalopathy with branched-chain amino acids. A double-blind placebo-controlled crossover study. J Hepatol 1993; 17:308–314.
- Les I, Doval E, García-Martínez R, et al. Effects of branched-chain amino acids supplementation in patients with cirrhosis and a previous episode of hepatic encephalopathy: a randomized study. Am J Gastroenterol 2011; 106:1081–1088.
- Efrati C, Masini A, Merli M, Valeriano V, Riggio O. Effect of sodium benzoate on blood ammonia response to oral glutamine challenge in cirrhotic patients: a note of caution. Am J Gastroenterol 2000; 95:3574–3578.
- Schmid M, Peck-Radosavljevic M, König F, Mittermaier C, Gangl A, Ferenci P. A double-blind, randomized, placebo-controlled trial of intravenous L-ornithine-L-aspartate on postural control in patients with cirrhosis. Liver Int 2010; 30:574–582.
- Blei AT. MARS and treatment of hepatic encephalopathy [in Spanish). Gastroenterol Hepatol 2005; 28:100–104.
- Heemann U, Treichel U, Loock J, et al. Albumin dialysis in cirrhosis with superimposed acute liver injury: a prospective, controlled study. Hepatology 2002; 36:949–958.
- Zidi SH, Zanditenas D, Gelu-Siméon M, et al. Treatment of chronic portosystemic encephalopathy in cirrhotic patients by embolization of portosystemic shunts. Liver Int 2007; 27:1389–1393.
- Dhar R, Young GB, Marotta P. Perioperative neurological complications after liver transplantation are best predicted by pre-transplant hepatic encephalopathy. Neurocrit Care 2008; 8:253–258.
- Teperman LW, Peyregne VP. Considerations on the impact of hepatic encephalopathy treatments in the pretransplant setting. Transplantation 2010; 89:771–778.
- Rovira A, Córdoba J, Sanpedro F, Grivé E, Rovira-Gols A, Alonso J. Normalization of T2 signal abnormalities in hemispheric white matter with liver transplant. Neurology 2002; 59:335–341.
- Senzolo M, Pizzolato G, Ferronato C, et al. Long-term evaluation of cognitive function and cerebral metabolism in liver transplanted patients. Transplant Proc 2009; 41:1295–1296.
- Butterworth RF. Neuronal cell death in hepatic encephalopathy. Metab Brain Dis 2007; 22:309–320.
- DiMartini A, Chopra K. The importance of hepatic encephalopathy: pre-transplant and post-transplant. Liver Transpl 2009; 15:121–123.
- Saner FH, Nadalin S, Radtke A, Sotiropoulos GC, Kaiser GM, Paul A. Liver transplantation and neurological side effects. Metab Brain Dis 2009; 24:183–187.
- Sotil EU, Gottstein J, Ayala E, Randolph C, Blei AT. Impact of preoperative overt hepatic encephalopathy on neurocognitive function after liver transplantation. Liver Transpl 2009; 15:184–192.
- Montagnese S, Middleton B, Skene DJ, Morgan MY. Night-time sleep disturbance does not correlate with neuropsychiatric impairment in patients with cirrhosis. Liver Int 2009; 29:1372–1382.
- Spahr L, Coeytaux A, Giostra E, Hadengue A, Annoni JM. Histamine H1 blocker hydroxyzine improves sleep in patients with cirrhosis and minimal hepatic encephalopathy: a randomized controlled pilot trial. Am J Gastroenterol 2007; 102:744–753.
Hepatic encephalopathy is a serious but often reversible complication that arises when the liver cannot detoxify the portal venous blood (Table 1).1
PROPOSED PATHOGENETIC FACTORS
About 5.5 million cases of chronic liver disease and cirrhosis were reported in the United States in 2001. Hepatic encephalopathy is becoming more common as the prevalence of cirrhosis increases,2 and this will have important economic repercussions; in 2001, charges from hospitalizations because of hepatic encephalopathy were estimated at $932 million.3
Hepatic encephalopathy develops as cirrhosis progresses or as a result of portosystemic shunting, so that the liver cannot detoxify the portal venous blood. Several neurotoxins (notably ammonia) and inflammatory mediators play key roles in its pathogenesis, inducing low-grade brain edema and producing a wide spectrum of neuropsychiatric manifestations.4 Yet its pathogenesis is not entirely understood, impeding advances in its diagnosis and therapy.
Several hypotheses about the pathogenesis of hepatic encephalopathy have emerged in the last few years, and a number of factors are reported to directly or indirectly affect brain function in this condition. Ammonia and glutamine are the neurotoxins most often implicated in this syndrome5; others include inflammatory mediators, certain amino acids, and manganese.5,6
Ammonia causes brain swelling
Ammonia is primarily the byproduct of bacterial metabolism of protein and nitrogenous compounds in the colon and of glutamine metabolism in enterocytes.7
Normally, gut-absorbed ammonia is delivered via the portal vein to the liver, where most of it is metabolized into urea, leaving a small amount to be metabolized in the muscles, heart, brain, and kidneys. In cirrhosis and other conditions associated with hepatic encephalopathy, less ammonia is metabolized into urea and more of it reaches the astrocytes in the brain. The brain lacks a urea cycle but metabolizes ammonia to glutamine via glutamine synthase, an enzyme unique to astrocytes.
Ammonia causes swelling of astrocytes and brain edema via generation of glutamine, an osmotically active substance.
Glutamine causes swelling, oxidative stress
Glutamine draws water into astrocytes and induces changes of type II astrocytosis (also called Alzheimer type II astrocytosis)5 characterized by swelling, enlarged and pale nuclei, and displacement of chromatin to the periphery of the cell. Inhibition of glutamine synthase prevents astrocyte swelling in animals.8
Glutamine also enhances the activation of several receptors, including N-methyl-d-aspartate (NMDA) receptors,9,10 gammaaminobutyric acid (GABA) receptors, and peripheral-type benzodiazepine receptors on the mitochondrial membrane.10–12 A state of oxidative stress ensues, and this affects oxidation of protein and RNA, neurotransmitter synthesis, and neurotransmission at the neuronal junction.13 Reactive nitrogen and oxide radicals induce the release of inflammatory mediators such as interleukins 1 and 6, tumor necrosis factor, interferons, and neurosteroids, and contribute to edema and neurotoxicity.6,10 Neurosteroids are byproducts of mitochondrial metabolism of steroid hormones in the astrocyte.
Manganese enhances neurosteroid synthesis
Manganese enhances neurosteroid synthesis via activation of translocator proteins on the astrocyte membrane. It was first recognized as a factor in hepatic encephalopathy when cirrhotic patients experiencing extrapyramidal symptoms were found to have deposits of manganese in the caudate nucleus and in the globus pallidus on magnetic resonance imaging (MRI). Such deposits were also seen in specimens of brain tissue on autopsy of these patients. When the encephalopathy resolved, so did the abnormalities on MRI.14,15
Changes in the blood-brain barrier
Astrocytes contribute to the selective permeability of the blood-brain barrier. Disruptions in the permeability of the blood-brain barrier underlie hepatic encephalopathy, with poor diffusion of molecules out of astrocytes.
For instance, zinc, which plays a regulatory role in gene transcription and synaptic plasticity, accumulates in the astrocytes, causing relative zinc deficiency and further affecting neurotransmitter synthesis and neurotransmission at the neuronal synapse.6,16
Hyponatremia
Hyponatremia (a serum sodium concentration < 130 mmol/L) is increasingly being recognized as an independent predictor of overt hepatic encephalopathy and is reported to increase the risk by a factor of eight.17
Neuronal dysfunction
Astrocytes are integral to the physiologic functioning of the neurons, and it is becoming clear that both neurons and astrocytes are affected in hepatic encephalopathy.
Additionally, neuroinflammation and a decrease in energy metabolism by the brain are described during episodes of hepatic encephalopathy.18
Amino acid imbalance
An imbalance between aromatic amino acids (ie, high levels of tyrosine and phenylalanine) and branched-chain amino acids (leucine, isoleucine, and valine) has been linked with encephalopathy in patients with liver disease, 19–21 but it is not totally clear whether this imbalance contributes to hepatic encephalopathy or is a consequence of it.
Low-grade brain edema
Edema of the brain occurs in all forms of hepatic encephalopathy, but in cirrhosis it is characteristically of low grade. The mechanism behind this low-grade edema is not clear. Studies have shown that swelling of astrocytes is not global but involves certain areas of the brain and is associated with compensatory extrusion of intracellular myoinositol.22 This, in combination with a mild degree of brain atrophy23 observed in patients with chronic liver disease, is thought to keep the brain from extreme swelling and herniation, a phenomenon usually seen in acute hepatic failure.24,25
Transjugular intrahepatic portosystemic shunting and encephalopathy
The incidence rate of hepatic encephalopathy after placement of a portosystemic shunt to treat portal hypertension ranges from 30% to 55% and is similar to the rate in cirrhotic patients without a shunt.26 In 5% to 8% of patients, the hepatic encephalopathy is refractory and requires intentional occlusion of the shunt.26,27 An elevated serum creatinine level appears to be a risk factor for refractory hepatic encephalopathy in patients with a portosystemic shunt.26
In one study,28 when transjugular intrahepatic portosystemic shunting was done early in the treatment of cirrhotic patients with acute variceal bleeding, the rates of treatment failure and death were significantly less than in a control group that received endoscopic therapy, and no significant difference was noted in the rate of encephalopathy or of serious adverse effects between the groups.
Whether to place a portosystemic shunt in a patient with cirrhosis and a history of hepatic encephalopathy depends on the possible underlying causes of the encephalopathy. For example, if encephalopathy was precipitated by variceal bleeding, shunt placement will prevent further bleeding and will make a recurrence of encephalopathy less likely. However, if the encephalopathy is persistent and uncontrollable, then shunt placement is contraindicated.27
A SPECTRUM OF SYMPTOMS
The spectrum of symptoms extends from a subclinical syndrome that may not be clinically apparent (early-stage or “minimal” hepatic encephalopathy) to full-blown neuropsychiatric manifestations such as cognitive impairment, confusion, slow speech, loss of fine motor skills, asterixis, peripheral neuropathy, clonus, the Babinski sign, decerebrate and decorticate posturing, seizures, extrapyramidal symptoms, and coma.4 The clinical manifestations are usually reversible with prompt treatment, but recurrence is common, typically induced by an event such as gastrointestinal bleeding or an infection.
Minimal hepatic encephalopathy is important to recognize
Although this subclinical syndrome is a very early stage, it is nevertheless associated with higher rates of morbidity and can affect quality of life, including the patient’s ability to drive a car.29,30
Abnormal changes in the brain begin at this stage and eventually progress to more damage and to the development of overt clinical symptoms.
The exact prevalence of minimal hepatic encephalopathy is not known because it is difficult to diagnose, but reported rates range between 30% and 84% of patients with cirrhosis.31 Progression from minimal to overt hepatic encephalopathy is 3.7 times more likely than in patients without the diagnosis of minimal hepatic encephalopathy.32
Thus, minimal hepatic encephalopathy is important to identify,29 so that treatment can be started.
Overt encephalopathy and survival
The prevalence of overt encephalopathy in cirrhosis ranges from 30% to 40% and is even higher in the advanced stages. Once encephalopathy develops, the prognosis worsens rapidly. In patients who do not undergo liver transplantation, the survival rate at 1 year is 42%, and the survival rate at 3 years is 23%.33
These rates are worse than those after liver transplantation, and the American Association for the Study of Liver Diseases recommends that patients with cirrhosis who develop a first episode of encephalopathy be considered for liver transplantation and be referred to a transplantation center.34
CHALLENGES IN DIAGNOSIS
Since the symptoms of hepatic encephalopathy are not specific and can be subtle in the early stage, its diagnosis may be a challenge. It is important to recognize that this neuropsychiatric complication occurs in people with severe comorbidities and requires dedicated time for evaluation and management.
Special tests may be needed to detect subclinical hepatic encephalopathy
In subclinical hepatic encephalopathy, the apparent lack of manifestations poses a great diagnostic challenge, but a thorough history may uncover poor social interaction, personality changes, poor performance at work, and recent traffic violations or motor vehicle accidents. Primary care physicians are usually the first to suspect the condition because they are familiar with the patient’s baseline mental and physical conditions.
For example, the primary care physician may notice decreased attention and worsening memory during a follow-up visit, or the physician may ask whether the patient has difficulty with work performance and handwork (psychomotor and fine motor skills), and whether there have been traffic violations or car accidents (visuospatial skills). Such clues, although not restrictive, may help identify patients with minimal hepatic encephalopathy and prompt referral for neuropsychiatric testing.
Neurologic deficits described in the subclinical form are in the domains of attention and concentration, working memory, visuospatial ability, and fine motor skills; communication skills remain intact.35 These deficits are not reliably detected on standard clinical evaluation but can be detected by neuropsychiatric and neurophysiologic testing.
While several tests for minimal hepatic encephalopathy have been developed, they need to be validated in large trials in the United States.
Neurophysiologic tests include electroencephalography and auditory or visual event-related P300 (evoked potential) testing.
Neuropsychiatric tests traditionally involved several batteries administered and interpreted by specialized personnel. They were time-consuming and were not practical in a typical office setting. They were later refined into the Psychometric Hepatic Encephalopathy Score test (ie, the PSE syndrome test).36 This combines a digit symbol test, a serial dotting test, a line-tracing test, and a number-connection or figure-connection test. An abnormal result in at least three of the four subtests constitutes an overall abnormal PSE syndrome test.
The PSE syndrome test has been validated for standard use in Germany, Spain, Italy, the United Kingdom, and India.35 In 1999, the Working Group on Hepatic Encephalopathy designated it as the official test for minimal hepatic encephalopathy.1 But the test has not been validated for use in the United States. Other tests have been developed, but their use is also limited by a lack of validation and by copyright laws. These factors constitute major obstacles to the diagnosis of subclinical hepatic encephalopathy in the United States. Nonetheless, physicians who suspect minimal hepatic encephalopathy may start lactulose therapy37 and schedule frequent follow-up visits to address and manage potential precipitating factors for overt hepatic encephalopathy.
Staging the severity of the encephalopathy
It is essential to exclude stroke, cerebral bleeding, and brain tumor before making a diagnosis of a first episode of hepatic encephalopathy. Thereafter, such exclusion must be guided by whether the patient has risk factors for these conditions or persistent symptoms of encephalopathy that do not respond to medical therapy.
Laboratory tests can identify metabolic derangements
Although laboratory tests are not diagnostic for hepatic encephalopathy, they can identify metabolic derangements that could contribute to it.
Imaging can help exclude other diagnoses
Neurophysiologic imaging studies such as magnetic resonance spectroscopy, magnetic transfer imaging, and water-mapping techniques have helped elucidate pathologic mechanisms of hepatic encephalopathy and are available in research centers, but they are not currently considered for diagnosis.
SEVERAL LINES OF TREATMENT
Treatment of hepatic encephalopathy involves a preemptive approach to address potential precipitating factors, medical therapy to reduce the production and absorption of ammonia from the gut, and surgical or interventional therapies. A multidisciplinary approach for testing the severity of neurologic impairment and response to therapy is needed to help determine if and when liver transplantation is required.
Prevent potential precipitating factors
An important concept in managing hepatic encephalopathy is to recognize that every cirrhotic patient is at risk and to make an effort to address potential precipitating factors during regular clinic visits. This includes reviewing medication dosing and adverse effects, emphasizing abstinence from alcohol and other toxic substances, and preventing bleeding from esophageal varices with endoscopic band ligation.
Diet therapy
The prevalence of malnutrition in cirrhosis may be as high as 100%. Vitamin and nutritional deficiencies should be evaluated by a nutrition specialist, and nutritional needs should be reassessed on a regular basis. Protein restriction is no longer recommended and may even be harmful.
Guidelines of the European Society of Parenteral and Enteric Nutrition in 2006 recommended that patients with liver disease should have an energy intake of 35 to 40 kcal/kg of body weight daily, with a total daily protein intake of 1.2 to 1.5 mg/kg of body weight.41 Frequent meals and bedtime snacks are encouraged to avoid periods of prolonged fasting and catabolism of muscle protein and to improve nitrogen balance. Branched-chain amino acids and vegetable protein supplements are suggested to help meet the daily requirements.42
Drug therapy to reduce neurotoxins
Drug treatment is directed at reducing the neurotoxins that accumulate in cirrhosis. A variety of agents have been used.
Lactulose (Kristalose) is approved by the US Food and Drug Administration (FDA) as a first-line treatment. It has been shown to improve quality of life and cognitive function in patients with cirrhosis and minimal hepatic encephalopathy, although it has failed to improve mortality rates.37
Lactulose, a cathartic disaccharide, is metabolized by colonic bacteria into short-chain fatty acids. The acidic microenvironment has three major effects:
- It aids the transformation of ammonia to ammonium (NH4+), which is then trapped in the stool, leaving less ammonia to be absorbed
- It has a cathartic effect
- It reduces the breakdown of nitrogenous compounds into ammonia.43
Lactulose has an excessively sweet taste. Its side effects include flatulence, abdominal discomfort, and diarrhea. The usual oral dose is 15 to 45 mL/day given in multiple doses to induce two to three soft bowel movements daily. At this dosage, the monthly cost varies between $60 and $120.
Lactilol, a nonabsorbable disaccharide, is as effective as lactulose but with fewer side effects. It is not available in the United States.
Rifaximin (Xifaxan), a derivative of rifamycin, is FDA-approved for the maintenance of remission of hepatic encephalopathy but is not recommended as a first-line agent. It inhibits bacterial RNA synthesis in the gut. Less than 0.4% of an oral dose is absorbed.44
In a randomized, double-blind, placebo-controlled trial in patients who had had at least two episodes of hepatic encephalopathy while on lactulose therapy, taking rifaximin 550 mg twice a day for 6 months provided a prolonged remission from recurrences of encephalopathy compared with placebo.45 Side effects included nausea, vomiting, abdominal pain, weight loss, and Clostridium difficile colitis, which was reported in two cases in the study.45
Unfortunately, the effects of this drug beyond 6 months of therapy have not been studied. In addition, the drug is expensive: 1 month of treatment with rifaximin can cost between $700 and $1,500. Combining lactulose and rifaximin adds to the costs and the side effects, and contributes to poor adherence to therapy.
Other antibiotics such as metronidazole (Flagyl), vancomycin, and neomycin have been used as alternatives to lactulose, based on the principle that they reduce ammonia-producing bacteria in the gut. However, their efficacy in hepatic encephalopathy remains to be determined.
In controlled trials, neomycin combined with sorbitol, magnesium sulfate, or lactulose was as effective as lactulose, but when used alone, neomycin was no better than placebo.46,47 Neomycin was approved many years ago as an adjunct in the management of hepatic coma, but it has since fallen out of favor in the management of hepatic encephalopathy because of poor trial results and because of neurotoxicity and ototoxicity.
Branched-chain amino acids (leucine, isoleucine, and valine)48 are reported to increase ammonia intake in muscle and to improve cognitive functions on the PSE scale in minimal hepatic encephalopathy,49,50 but they did not decrease the rate of recurrence of hepatic encephalopathy.51 While debate continues over their efficacy in the management of hepatic encephalopathy, branched-chain amino acids may be used to improve nutritional status and muscle mass of patients with cirrhosis. However, the dosing is not standardized, and long-term compliance may be problematic.
Other medical therapies include zinc,16 sodium benzoate,50 and l-ornithine-l-aspartate52,53 to stimulate residual urea cycle activities; probiotics (which pose a risk of sepsis from fungi and lactobacilli); and laxatives.
Liver dialysis
Adsorbing toxins from the blood via liver dialysis or using a non-cell-based liver support system such as MARS (Molecular Adsorbent Recirculating System, Gambro, Inc.) appears to improve the amino acid profile in hepatic encephalopathy, but its role has not been clarified, and its use is limited to clinical trials.54,55
Transjugular intrahepatic shunts and large portosystemic shunts may need to be closed in order to reverse encephalopathy refractory to drug therapy.26,27,56
Liver transplantation
The current scoring system for end-stage liver disease does not include hepatic encephalopathy as a criterion for prioritizing patients on the transplantation list because it was originally developed to assess short-term prognosis in patients undergoing transjugular intrahepatic shunting. As a consequence, patients with end-stage liver disease are at increased risk of repeated episodes of encephalopathy, hospital readmission, and death. Therefore, the American Association for the Study of Liver Diseases recommends referral to a transplantation center when the patient experiences a first episode of overt hepatic encephalopathy to initiate a workup for liver transplantation.34
Liver transplantation improves survival in patients with severe hepatic dysfunction, but the presence of neurologic deficits may result in significant morbidity and in death.57,58 After transplantation, resolution of cognitive dysfunction, brain edema, and white-matter changes have been reported,59 but neuronal cell death and persistent cognitive impairment after resolution of overt hepatic encephalopathy are also described.60–63
Whether neurologic impairment will resolve after liver transplantation depends on a number of factors: the severity of encephalopathy before transplantation; the nature of the neurologic deficits; advanced age; history of alcohol abuse and the presence of alcoholic brain damage; persistence of portosystemic shunts after transplant; emergency transplantation; complications during surgery; and side effects of immunosuppressive drugs.57,58,64
The optimal timing of liver transplantation is not clearly defined for patients who have had bouts of hepatic encephalopathy, and more study is needed to determine the reversibility of clinical symptoms and brain damage. It is in these situations that neuropsychiatric testing and advanced neuroimaging can help determine the efficacy of therapeutic interventions, and it should be considered part of the pretransplantation evaluation.
Managing sleep disturbances
Insomnia and other changes in sleep-wake patterns are common in patients with cirrhosis, especially advanced cirrhosis.65 It is not known whether these changes represent early stages of hepatic encephalopathy.66 Patients often complain of fatigue, the need for frequent naps, and lethargy during the day and restlessness and inability to sleep at night. This affects the patient’s behavior and daytime functioning, and it also burdens household members and caregivers.
Long-acting benzodiazepines should be avoided when treating sleep disorders in cirrhosis because they may precipitate the encephalopathy. In a randomized controlled trial, hydroxyzine (Vistaril) at a dose of 25 mg at bedtime improved sleep behavior in 40% of patients with cirrhosis and subclinical hepatic encephalopathy, but 1 of 17 patients developed acute encephalopathy, which reversed with cessation of the hydroxyzine.66 Clearly, caution and close monitoring are required when giving hydroxyzine for sleep disorders in cirrhotic patients.
- Ferenci P, Lockwood A, Mullen K, Tarter R, Weissenborn K, Blei AT. Hepatic encephalopathy—definition, nomenclature, diagnosis, and quantification: final report of the working party at the 11th World Congresses of Gastroenterology, Vienna, 1998. Hepatology 2002; 35:716–721.
- Fleming KM, Aithal GP, Solaymani-Dodaran M, Card TR, West J. Incidence and prevalence of cirrhosis in the United Kingdom, 1992–2001: a general population-based study. J Hepatol 2008; 49:732–738.
- Poordad FF. Review article: the burden of hepatic encephalopathy. Aliment Pharmacol Ther 2007; 25(suppl 1):3–9.
- Bajaj JS, Wade JB, Sanyal AJ. Spectrum of neurocognitive impairment in cirrhosis: Implications for the assessment of hepatic encephalopathy. Hepatology 2009; 50:2014–2021.
- Norenberg MD, Jayakumar AR, Rama Rao KV, Panickar KS. New concepts in the mechanism of ammonia-induced astrocyte swelling. Metab Brain Dis 2007; 22:219–234.
- Häussinger D, Görg B. Interaction of oxidative stress, astrocyte swelling and cerebral ammonia toxicity. Curr Opin Clin Nutr Metab Care 2010; 13:87–92.
- Romero-Gómez M, Ramos-Guerrero R, Grande L, et al. Intestinal glutaminase activity is increased in liver cirrhosis and correlates with minimal hepatic encephalopathy. J Hepatol 2004; 41:49–54.
- Tanigami H, Rebel A, Martin LJ, et al. Effect of glutamine synthetase inhibition on astrocyte swelling and altered astroglial protein expression during hyperammonemia in rats. Neuroscience 2005; 131:437–449.
- Llansola M, Rodrigo R, Monfort P, et al. NMDA receptors in hyperammonemia and hepatic encephalopathy. Metab Brain Dis 2007; 22:321–335.
- Montoliu C, Piedrafita B, Serra MA, et al. IL-6 and IL-18 in blood may discriminate cirrhotic patients with and without minimal hepatic encephalopathy. J Clin Gastroenterol 2009; 43:272–279.
- Desjardins P, Butterworth RF. The “peripheral-type” benzodiazepine (omega 3) receptor in hyperammonemic disorders. Neurochem Int 2002; 41:109–114.
- Häussinger D, Schliess F. Pathogenetic mechanisms of hepatic encephalopathy. Gut 2008; 57:1156–1165.
- Cauli O, Rodrigo R, Llansola M, et al. Glutamatergic and gabaergic neurotransmission and neuronal circuits in hepatic encephalopathy. Metab Brain Dis 2009; 24:69–80.
- Krieger D, Krieger S, Jansen O, Gass P, Theilmann L, Lichtnecker H. Manganese and chronic hepatic encephalopathy. Lancet 1995; 346:270–274.
- Pomier-Layrargues G, Spahr L, Butterworth RF. Increased manganese concentrations in pallidum of cirrhotic patients. Lancet 1995; 345:735.
- Schliess F, Görg B, Häussinger D. RNA oxidation and zinc in hepatic encephalopathy and hyperammonemia. Metab Brain Dis 2009; 24:119–134.
- Guevara M, Baccaro ME, Torre A, et al. Hyponatremia is a risk factor of hepatic encephalopathy in patients with cirrhosis: a prospective study with time-dependent analysis. Am J Gastroenterol 2009; 104:1382–1389.
- Hertz L, Kala G. Energy metabolism in brain cells: effects of elevated ammonia concentrations. Metab Brain Dis 2007; 22:199–218.
- Marchesini G, Zoli M, Dondi C, et al. Prevalence of subclinical hepatic encephalopathy in cirrhotics and relationship to plasma amino acid imbalance. Dig Dis Sci 1980; 25:763–768.
- Morgan MY, Milsom JP, Sherlock S. Plasma ratio of valine, leucine and isoleucine to phenylalanine and tyrosine in liver disease. Gut 1978; 19:1068–1073.
- Fischer JE, Rosen HM, Ebeid AM, James JH, Keane JM, Soeters PB. The effect of normalization of plasma amino acids on hepatic encephalopathy in man. Surgery 1976; 80:77–91.
- Poveda MJ, Bernabeu A, Concepción L, et al. Brain edema dynamics in patients with overt hepatic encephalopathy A magnetic resonance imaging study. Neuroimage 2010; 52:481–487.
- Bernthal P, Hays A, Tarter RE, Van Thiel D, Lecky J, Hegedus A. Cerebral CT scan abnormalities in cholestatic and hepatocellular disease and their relationship to neuropsychologic test performance. Hepatology 1987; 7:107–114.
- Sugimoto R, Iwasa M, Maeda M, et al. Value of the apparent diffusion coefficient for quantification of low-grade hepatic encephalopathy. Am J Gastroenterol 2008; 103:1413–1420.
- Häussinger D. Low grade cerebral edema and the pathogenesis of hepatic encephalopathy in cirrhosis. Hepatology 2006; 43:1187–1190.
- Masson S, Mardini HA, Rose JD, Record CO. Hepatic encephalopathy after transjugular intrahepatic portosystemic shunt insertion: a decade of experience. QJM 2008; 101:493–501.
- Boyer TD, Haskal ZJ; American Association for the Study of Liver Diseases. The role of transjugular intrahepatic portosystemic shunt (TIPS) in the management of portal hypertension: update 2009. Hepatology 2010; 51:306.
- García-Pagán JC, Caca K, Bureau C, et al; Early TIPS (Transjugular Intrahepatic Portosystemic Shunt) Cooperative Study Group. Early use of TIPS in patients with cirrhosis and variceal bleeding. N Engl J Med 2010; 362:2370–2379.
- Kircheis G, Knoche A, Hilger N, et al. Hepatic encephalopathy and fitness to drive. Gastroenterology 2009; 137:1706–1715.e1–9.
- Bajaj JS, Saeian K, Schubert CM, et al. Minimal hepatic encephalopathy is associated with motor vehicle crashes: the reality beyond the driving test. Hepatology 2009; 50:1175–1183.
- Hartmann IJ, Groeneweg M, Quero JC, et al. The prognostic significance of subclinical hepatic encephalopathy. Am J Gastroenterol 2000; 95:2029–2034.
- Romero-Gómez M, Boza F, García-Valdecasas MS, García E, Aguilar-Reina J. Subclinical hepatic encephalopathy predicts the development of overt hepatic encephalopathy. Am J Gastroenterol 2001; 96:2718–2723.
- Bustamante J, Rimola A, Ventura PJ, et al. Prognostic significance of hepatic encephalopathy in patients with cirrhosis. J Hepatol 1999; 30:890–895.
- Murray KF, Carithers RL jR; AASLD. AASLD practice guidelines: evaluation of the patient for liver transplantation. Hepatology 2005; 41:1407–1432.
- Amodio P, Montagnese S, Gatta A, Morgan MY. Characteristics of minimal hepatic encephalopathy. Metab Brain Dis 2004; 19:253–267.
- Weissenborn K. PHES: one label, different goods?! J Hepatol 2008; 49:308–312.
- Prasad S, Dhiman RK, Duseja A, Chawla YK, Sharma A, Agarwal R. Lactulose improves cognitive functions and health-related quality of life in patients with cirrhosis who have minimal hepatic encephalopathy. Hepatology 2007; 45:549–559.
- Parsons-Smith BG, Summerskill WHJ, Dawson AM, Sherlock S. The electroencephalograph in liver disease. Lancet 1957; 2:867–871.
- Teasdale G, Jennett B. Assessment of coma and impaired consciousness. A practical scale. Lancet 1974; 2:81–84.
- Rovira A, Alonso J, Córdoba J. MR imaging findings in hepatic encephalopathy. AJNR Am J Neuroradiol 2008; 29:1612–1621.
- Plauth M, Cabré E, Riggio O, Assis-Camilo M, Pirlich M, Kondrup J; DGEM (German Society for Nutritional Medicine); ESPEN (European Society for Parenteral and Enteral Nutrition). ESPEN guidelines on enteral nutrition: liver disease. Clin Nutr 2006; 25:285–294.
- Gheorghe L, Iacob R, Vadan R, Iacob S, Gheorghe C. Improvement of hepatic encephalopathy using a modified high-calorie high-protein diet. Rom J Gastroenterol 2005; 14:231–238.
- Weber FL. Effects of lactulose on nitrogen metabolism. Scand J Gastroenterol Suppl 1997; 222:83–87.
- Ojetti V, Lauritano EC, Barbaro F, et al. Rifaximin pharmacology and clinical implications. Expert Opin Drug Metab Toxicol 2009; 5:675–682.
- Bass NM, Mullen KD, Sanyal A, et al. Rifaximin treatment in hepatic encephalopathy. N Engl J Med 2010; 362:1071–1081.
- Blei AT, Córdoba J; Practice Parameters Committee of the American College of Gastroenterology. Hepatic encephalopathy. Am J Gastroenterol 2001; 96:1968–1976.
- Rothenberg ME, Keeffe EB. Antibiotics in the management of hepatic encephalopathy: an evidence-based review. Rev Gastroenterol Disord 2005; 5(suppl 3):26–35.
- Charlton M. Branched-chain amino acid enriched supplements as therapy for liver disease. J Nutr 2006; 136(suppl 1):295S–298S.
- Egberts EH, Schomerus H, Hamster W, Jürgens P. [Branched-chain amino acids in the treatment of latent porto-systemic encephalopathy. A placebo-controlled double-blind cross-over study] [in German]. Z Ernahrungswiss 1986; 25:9–28.
- Plauth M, Egberts EH, Hamster W, et al. Long-term treatment of latent portosystemic encephalopathy with branched-chain amino acids. A double-blind placebo-controlled crossover study. J Hepatol 1993; 17:308–314.
- Les I, Doval E, García-Martínez R, et al. Effects of branched-chain amino acids supplementation in patients with cirrhosis and a previous episode of hepatic encephalopathy: a randomized study. Am J Gastroenterol 2011; 106:1081–1088.
- Efrati C, Masini A, Merli M, Valeriano V, Riggio O. Effect of sodium benzoate on blood ammonia response to oral glutamine challenge in cirrhotic patients: a note of caution. Am J Gastroenterol 2000; 95:3574–3578.
- Schmid M, Peck-Radosavljevic M, König F, Mittermaier C, Gangl A, Ferenci P. A double-blind, randomized, placebo-controlled trial of intravenous L-ornithine-L-aspartate on postural control in patients with cirrhosis. Liver Int 2010; 30:574–582.
- Blei AT. MARS and treatment of hepatic encephalopathy [in Spanish). Gastroenterol Hepatol 2005; 28:100–104.
- Heemann U, Treichel U, Loock J, et al. Albumin dialysis in cirrhosis with superimposed acute liver injury: a prospective, controlled study. Hepatology 2002; 36:949–958.
- Zidi SH, Zanditenas D, Gelu-Siméon M, et al. Treatment of chronic portosystemic encephalopathy in cirrhotic patients by embolization of portosystemic shunts. Liver Int 2007; 27:1389–1393.
- Dhar R, Young GB, Marotta P. Perioperative neurological complications after liver transplantation are best predicted by pre-transplant hepatic encephalopathy. Neurocrit Care 2008; 8:253–258.
- Teperman LW, Peyregne VP. Considerations on the impact of hepatic encephalopathy treatments in the pretransplant setting. Transplantation 2010; 89:771–778.
- Rovira A, Córdoba J, Sanpedro F, Grivé E, Rovira-Gols A, Alonso J. Normalization of T2 signal abnormalities in hemispheric white matter with liver transplant. Neurology 2002; 59:335–341.
- Senzolo M, Pizzolato G, Ferronato C, et al. Long-term evaluation of cognitive function and cerebral metabolism in liver transplanted patients. Transplant Proc 2009; 41:1295–1296.
- Butterworth RF. Neuronal cell death in hepatic encephalopathy. Metab Brain Dis 2007; 22:309–320.
- DiMartini A, Chopra K. The importance of hepatic encephalopathy: pre-transplant and post-transplant. Liver Transpl 2009; 15:121–123.
- Saner FH, Nadalin S, Radtke A, Sotiropoulos GC, Kaiser GM, Paul A. Liver transplantation and neurological side effects. Metab Brain Dis 2009; 24:183–187.
- Sotil EU, Gottstein J, Ayala E, Randolph C, Blei AT. Impact of preoperative overt hepatic encephalopathy on neurocognitive function after liver transplantation. Liver Transpl 2009; 15:184–192.
- Montagnese S, Middleton B, Skene DJ, Morgan MY. Night-time sleep disturbance does not correlate with neuropsychiatric impairment in patients with cirrhosis. Liver Int 2009; 29:1372–1382.
- Spahr L, Coeytaux A, Giostra E, Hadengue A, Annoni JM. Histamine H1 blocker hydroxyzine improves sleep in patients with cirrhosis and minimal hepatic encephalopathy: a randomized controlled pilot trial. Am J Gastroenterol 2007; 102:744–753.
KEY POINTS
- Hepatic encephalopathy should be considered in any patient with cirrhosis who presents with neuropsychiatric manifestations in the absence of another brain disorder, such as stroke or brain tumor.
- “Minimal” hepatic encephalopathy may not be obvious on clinical examination but can be detected with neurophysiologic and neuropsychiatric testing.
- Every cirrhotic patient is at risk; potential precipitating factors should be addressed during regular clinic visits.
- Management requires prompt identification of precipitating factors and initiation of empiric medical therapy. Current treatments include drugs to prevent ammonia generation in the colon.
- Long-acting benzodiazepines should not be used to treat sleep disorders in patients with cirrhosis, as they may precipitate encephalopathy.
Oral plaques and dysphagia in a young man
A 23-year-old man presents with a sore throat, dysphagia, and general malaise that began 1 week ago. He also reports a 5-pound weight loss. He has not recently taken antibiotics or inhaled glucocorticoids, and he has no history of tobacco use or trauma to his mouth. He has no personal or family history of oral cancer. He uses cocaine on occasion. He reports feeling feverish and having a decreased appetite.
Q: Based on the history, the symptoms, and the physical examination, which of the following is the most likely diagnosis in this patient?
- Oral hairy leukoplakia
- Squamous cell carcinoma
- Oral candidiasis
- Herpetic gingivostomatitis
- Streptococcal pharyngitis
A: Oral candidiasis is correct.
Otherwise known as thrush, it is common in infants and in denture wearers, and it also can occur in diabetes mellitus, antibiotic therapy, chemotherapy, radiation therapy, and cellular immune deficiency states such as cancer or human immunodeficiency virus (HIV) infection.1 Patients using inhaled glucocorticoids are also at risk and should always be advised to rinse their mouth out with water after inhaled steroid use.
Although Candida albicans is the species most often responsible for candidal infections, other candidal species are increasingly responsible for infections in immunocompromised patients. Candida is part of the normal flora in many adults.
Oral hairy leukoplakia is caused by the Epstein-Barr virus and is often seen in HIV infection. It is a white, painless, corrugated lesion, typically found on the lateral aspect of the tongue, and it cannot be scraped from the adherent surfaces. It can also be found on the dorsum of the tongue, the buccal surfaces, and the floor of the mouth. In an asymptomatic patient with oral hairy leukoplakia, HIV infection with moderate immunosuppression is most likely present.2 Oral hairy leukoplakia is diagnosed by biopsy of suspected lesions. It is not a premalignant lesion, and how to best treat it is still being investigated.3
Squamous cell carcinoma of the oral cavity can present as nonhealing ulcers or masses, dental changes, or exophytic lesions with or without pain.1 They may be accompanied by cervical nodal disease. Malignancies of the oral cavity account for 14% of all head and neck cancers, with squamous cell carcinoma the predominant type.4 Alcohol and tobacco use increase the risk. Alcohol and tobacco together have a synergistic effect on the incidence of oral carcinoma.1,4 Predisposing lesions are leukoplakia, lichen planus of the erosive subtype, submucosal fibrosis, and erythroplakia. Oral infection with human papillomavirus has been shown to increase the risk of oral cancer by a factor of 14, and papillomavirus type 16 is detected in 72% of patients with oropharyngeal cancer.5
Herpetic gingivostomatitis is a manifestation of herpes simplex virus infection. The initial infection may be asymptomatic or may produce groups of vesicles that develop into shallow, painful, and superficial ulcerations on an erythematous base.1,3 If the gingiva is involved, it is erythematous, boggy, and tender.3 Infections are self-limited, lasting up to 2 weeks, but there is potential for recurrence because of the ability of herpes simplex virus to undergo latency. Recurrence is usually heralded by prodromal symptoms 24 hours before onset, with tingling, pain, or burning at the infected site. The diagnosis can be made clinically, but the Tzanck smear test, viral culture, direct fluorescent antibody test, or polymerase chain reaction test can be used to confirm the diagnosis. In patients who are immunocompromised, infections tend to be more severe and to last longer.
Streptococcal pharyngitis, most often caused by group A beta-hemolytic streptococci, is the most common type of bacterial pharyngitis in the clinical setting. The bacteria incubate for 2 to 5 days. The condition mainly affects younger children.6 Patients with “strep throat” often present with a sore throat and high-grade fever. Other symptoms include chills, myalgia, headache, and nausea. Findings on examination may include petechiae of the palate, pharyngeal and tonsillar erythema and exudates, and anterior cervical adenopathy.6 Children often present with coinciding abdominal complaints. A rapid antigen detection test for streptococcal infection can be performed in the office for quick diagnosis, but if clinical suspicion is high, a throat culture is necessary to confirm the diagnosis. Treatment is to prevent complications such as rheumatic fever.6
FEATURES AND DIAGNOSIS OF ORAL CANDIDIASIS
Lesions of oral candidiasis can vary in their appearance. The pseudomembranous form is the most characteristic, with white adherent “cottage-cheese-like” plaques that wipe away, causing minimal bleeding.1,7 The erythematous or atrophic form is associated with denture use and causes a “beefy” appearance on the dorsum of the tongue or on the mucosa that supports a denture.1,7 A third form affects the angles of the mouth, causing angular cheilitis (perlèche).7,8 Chronic infection appears as localized, firmly adherent plaques with an irregular surface similar to hyperkeratosis caused by chronic frictional irritation.7
Oral candidiasis can occur in different forms at the same time. Patients often describe minimal symptoms such as dysgeusia or dry mouth.1,7 Infections causing dysphagia or odynophagia warrant suspicion for involvement of the esophagus.
The diagnosis is made empirically if the lesions resolve with anticandidal therapy. A more definitive diagnosis can be made by microscopy with a potassium hydroxide preparation showing pseudohyphae. Formal culture can also determine the yeast’s susceptibility to medication in recurrent or resistant cases.2
Oral candidiasis may be the manifesting symptom of HIV infection, and more than 90% of patients with adult immunodeficiency syndrome have an episode of thrush.8 When candidiasis is diagnosed without obvious cause, HIV testing should be offered, regardless of a patient’s lack of obvious risk factors. Other oral lesions in HIV patients are oral hairy leukoplakia, Kaposi sarcoma, periodontal and gingival infections, aphthous ulcers, herpes simplex stomatitis, and xerostomia.2 With highly active antiretroviral therapy, the incidence of oral candidiasis has decreased by about 50%.2
Our patient was diagnosed with HIV when screened after this initial presentation. Lower CD4 counts and higher viral loads increase the patient’s risk for oral candidiasis and other lesions. This patient’s initial CD4 count was 524 cells/μL, and his viral load was 11,232 copies/mL.
TREATMENT
In HIV-negative patients or in HIV-positive patients with a CD4 count greater than 200 cells/μL, the treatment of oral candidiasis involves topical antifungal agents, including a nystatin suspension (Nystat-Rx) or clotrimazole (Mycelex) troches.3,7,9 Treatment should be continued for at least 7 days after resolution of the infection. If resolution does not occur, oral fluconazole (Diflucan) 200 mg daily should be given.
For HIV patients with CD4 counts below 200 cells/μL, oral fluconazole or itraconazole (Sporanox) is recommended, with posaconazole (Noxafil) as an alternative for refractory disease.3,9 Giving fluconazole prophylactically to prevent oral candidiasis is not recommended because of the risk of adverse effects, lack of survival benefit, associated cost, and potential to develop antifungal resistance.3,9
- Reichart PA. Clinical management of selected oral fungal and viral infections during HIV-disease. Int Dent J 1999; 49:251–259.
- Kim TB, Pletcher SD, Goldberg AN. Head and neck manifestations in the immunocompromised host. In:Flint PW, Haughey BH, Lund VJ, et al, editors. Cummings Otolaryngology: Head and Neck Surgery. 5th ed. Philadelphia, PA: Mosby/Elsevier; 2010:209–229(225–226).
- Sciubba JJ. Oral mucosal lesions. In:Flint PW, Haughey BH, Lund VJ, et al, editors. Cummings Otolaryngology: Head and Neck Surgery. 5th ed. Philadelphia, PA: Mosby/Elsevier; 2010:1222–1244(1229–1231).
- Wein R. Malignant Neoplasms of the Oral Cavity. In:Flint PW, Haughey BH, Lund VJ, et al, editors. Cummings Otolaryngology: Head and Neck Surgery. 5th ed. Philadelphia, PA: Mosby/Elsevier; 2010:1222–1244(1236).
- D’Souza G, Kreimer AR, Viscidi R, et al. Case-control study of human papillomavirus and oropharyngeal cancer. N Engl J Med 2007; 356:1944–1956.
- Hayes CS, Williamson H. Management of group A betahemolytic streptococcal pharyngitis. Am Fam Physician 2001; 63:1557–1564.
- Coleman GC. Diseases of the mouth. In:Bope ET, Rakel RE, Kellerman R, editors. Conn’s Current Therapy. Philadelphia, PA: Saunders; 2010:861–867.
- Habif TP. Candidiasis (moniliasis). In: Clinical Dermatology: A Color Guide to Diagnosis and Therapy. 5th ed. Edinburgh: Mosby; 2010:523–536.
- Pappas PG, Rex JH, Sobel JD, et al; Infectious Diseases Society of America. Guidelines for treatment of candidiasis. Clin Infect Dis 2004; 38:161–189.
A 23-year-old man presents with a sore throat, dysphagia, and general malaise that began 1 week ago. He also reports a 5-pound weight loss. He has not recently taken antibiotics or inhaled glucocorticoids, and he has no history of tobacco use or trauma to his mouth. He has no personal or family history of oral cancer. He uses cocaine on occasion. He reports feeling feverish and having a decreased appetite.
Q: Based on the history, the symptoms, and the physical examination, which of the following is the most likely diagnosis in this patient?
- Oral hairy leukoplakia
- Squamous cell carcinoma
- Oral candidiasis
- Herpetic gingivostomatitis
- Streptococcal pharyngitis
A: Oral candidiasis is correct.
Otherwise known as thrush, it is common in infants and in denture wearers, and it also can occur in diabetes mellitus, antibiotic therapy, chemotherapy, radiation therapy, and cellular immune deficiency states such as cancer or human immunodeficiency virus (HIV) infection.1 Patients using inhaled glucocorticoids are also at risk and should always be advised to rinse their mouth out with water after inhaled steroid use.
Although Candida albicans is the species most often responsible for candidal infections, other candidal species are increasingly responsible for infections in immunocompromised patients. Candida is part of the normal flora in many adults.
Oral hairy leukoplakia is caused by the Epstein-Barr virus and is often seen in HIV infection. It is a white, painless, corrugated lesion, typically found on the lateral aspect of the tongue, and it cannot be scraped from the adherent surfaces. It can also be found on the dorsum of the tongue, the buccal surfaces, and the floor of the mouth. In an asymptomatic patient with oral hairy leukoplakia, HIV infection with moderate immunosuppression is most likely present.2 Oral hairy leukoplakia is diagnosed by biopsy of suspected lesions. It is not a premalignant lesion, and how to best treat it is still being investigated.3
Squamous cell carcinoma of the oral cavity can present as nonhealing ulcers or masses, dental changes, or exophytic lesions with or without pain.1 They may be accompanied by cervical nodal disease. Malignancies of the oral cavity account for 14% of all head and neck cancers, with squamous cell carcinoma the predominant type.4 Alcohol and tobacco use increase the risk. Alcohol and tobacco together have a synergistic effect on the incidence of oral carcinoma.1,4 Predisposing lesions are leukoplakia, lichen planus of the erosive subtype, submucosal fibrosis, and erythroplakia. Oral infection with human papillomavirus has been shown to increase the risk of oral cancer by a factor of 14, and papillomavirus type 16 is detected in 72% of patients with oropharyngeal cancer.5
Herpetic gingivostomatitis is a manifestation of herpes simplex virus infection. The initial infection may be asymptomatic or may produce groups of vesicles that develop into shallow, painful, and superficial ulcerations on an erythematous base.1,3 If the gingiva is involved, it is erythematous, boggy, and tender.3 Infections are self-limited, lasting up to 2 weeks, but there is potential for recurrence because of the ability of herpes simplex virus to undergo latency. Recurrence is usually heralded by prodromal symptoms 24 hours before onset, with tingling, pain, or burning at the infected site. The diagnosis can be made clinically, but the Tzanck smear test, viral culture, direct fluorescent antibody test, or polymerase chain reaction test can be used to confirm the diagnosis. In patients who are immunocompromised, infections tend to be more severe and to last longer.
Streptococcal pharyngitis, most often caused by group A beta-hemolytic streptococci, is the most common type of bacterial pharyngitis in the clinical setting. The bacteria incubate for 2 to 5 days. The condition mainly affects younger children.6 Patients with “strep throat” often present with a sore throat and high-grade fever. Other symptoms include chills, myalgia, headache, and nausea. Findings on examination may include petechiae of the palate, pharyngeal and tonsillar erythema and exudates, and anterior cervical adenopathy.6 Children often present with coinciding abdominal complaints. A rapid antigen detection test for streptococcal infection can be performed in the office for quick diagnosis, but if clinical suspicion is high, a throat culture is necessary to confirm the diagnosis. Treatment is to prevent complications such as rheumatic fever.6
FEATURES AND DIAGNOSIS OF ORAL CANDIDIASIS
Lesions of oral candidiasis can vary in their appearance. The pseudomembranous form is the most characteristic, with white adherent “cottage-cheese-like” plaques that wipe away, causing minimal bleeding.1,7 The erythematous or atrophic form is associated with denture use and causes a “beefy” appearance on the dorsum of the tongue or on the mucosa that supports a denture.1,7 A third form affects the angles of the mouth, causing angular cheilitis (perlèche).7,8 Chronic infection appears as localized, firmly adherent plaques with an irregular surface similar to hyperkeratosis caused by chronic frictional irritation.7
Oral candidiasis can occur in different forms at the same time. Patients often describe minimal symptoms such as dysgeusia or dry mouth.1,7 Infections causing dysphagia or odynophagia warrant suspicion for involvement of the esophagus.
The diagnosis is made empirically if the lesions resolve with anticandidal therapy. A more definitive diagnosis can be made by microscopy with a potassium hydroxide preparation showing pseudohyphae. Formal culture can also determine the yeast’s susceptibility to medication in recurrent or resistant cases.2
Oral candidiasis may be the manifesting symptom of HIV infection, and more than 90% of patients with adult immunodeficiency syndrome have an episode of thrush.8 When candidiasis is diagnosed without obvious cause, HIV testing should be offered, regardless of a patient’s lack of obvious risk factors. Other oral lesions in HIV patients are oral hairy leukoplakia, Kaposi sarcoma, periodontal and gingival infections, aphthous ulcers, herpes simplex stomatitis, and xerostomia.2 With highly active antiretroviral therapy, the incidence of oral candidiasis has decreased by about 50%.2
Our patient was diagnosed with HIV when screened after this initial presentation. Lower CD4 counts and higher viral loads increase the patient’s risk for oral candidiasis and other lesions. This patient’s initial CD4 count was 524 cells/μL, and his viral load was 11,232 copies/mL.
TREATMENT
In HIV-negative patients or in HIV-positive patients with a CD4 count greater than 200 cells/μL, the treatment of oral candidiasis involves topical antifungal agents, including a nystatin suspension (Nystat-Rx) or clotrimazole (Mycelex) troches.3,7,9 Treatment should be continued for at least 7 days after resolution of the infection. If resolution does not occur, oral fluconazole (Diflucan) 200 mg daily should be given.
For HIV patients with CD4 counts below 200 cells/μL, oral fluconazole or itraconazole (Sporanox) is recommended, with posaconazole (Noxafil) as an alternative for refractory disease.3,9 Giving fluconazole prophylactically to prevent oral candidiasis is not recommended because of the risk of adverse effects, lack of survival benefit, associated cost, and potential to develop antifungal resistance.3,9
- Reichart PA. Clinical management of selected oral fungal and viral infections during HIV-disease. Int Dent J 1999; 49:251–259.
- Kim TB, Pletcher SD, Goldberg AN. Head and neck manifestations in the immunocompromised host. In:Flint PW, Haughey BH, Lund VJ, et al, editors. Cummings Otolaryngology: Head and Neck Surgery. 5th ed. Philadelphia, PA: Mosby/Elsevier; 2010:209–229(225–226).
- Sciubba JJ. Oral mucosal lesions. In:Flint PW, Haughey BH, Lund VJ, et al, editors. Cummings Otolaryngology: Head and Neck Surgery. 5th ed. Philadelphia, PA: Mosby/Elsevier; 2010:1222–1244(1229–1231).
- Wein R. Malignant Neoplasms of the Oral Cavity. In:Flint PW, Haughey BH, Lund VJ, et al, editors. Cummings Otolaryngology: Head and Neck Surgery. 5th ed. Philadelphia, PA: Mosby/Elsevier; 2010:1222–1244(1236).
- D’Souza G, Kreimer AR, Viscidi R, et al. Case-control study of human papillomavirus and oropharyngeal cancer. N Engl J Med 2007; 356:1944–1956.
- Hayes CS, Williamson H. Management of group A betahemolytic streptococcal pharyngitis. Am Fam Physician 2001; 63:1557–1564.
- Coleman GC. Diseases of the mouth. In:Bope ET, Rakel RE, Kellerman R, editors. Conn’s Current Therapy. Philadelphia, PA: Saunders; 2010:861–867.
- Habif TP. Candidiasis (moniliasis). In: Clinical Dermatology: A Color Guide to Diagnosis and Therapy. 5th ed. Edinburgh: Mosby; 2010:523–536.
- Pappas PG, Rex JH, Sobel JD, et al; Infectious Diseases Society of America. Guidelines for treatment of candidiasis. Clin Infect Dis 2004; 38:161–189.
Allergy blood testing: A practical guide for clinicians
Health care providers often need to evaluate allergic disorders such as allergic rhinoconjunctivitis, asthma, and allergies to foods, drugs, latex, and venom, both in the hospital and in the clinic.
Unfortunately, some symptoms, such as chronic nasal symptoms, can occur in both allergic and nonallergic disorders, and this overlap can confound the diagnosis and therapy. Studies suggest that when clinicians use the history and physical examination alone in evaluating possible allergic disease, the accuracy of their diagnoses rarely exceeds 50%.1
Blood tests are now available that measure immunoglobulin E (IgE) directed against specific antigens. These in vitro tests can be important tools in assessing a patient whose history suggests an allergic disease.2 However, neither allergy skin testing nor these blood tests are intended to be used for screening: they may be most useful as confirmatory diagnostic tests in cases in which the pretest clinical impression of allergic disease is high.
ALLERGY IS MEDIATED BY IgE
In susceptible people, IgE is produced by B cells in response to specific antigens such as foods, pollens, latex, and drugs. This antigen-specific (or allergen-specific) IgE circulates in the serum and binds to high-affinity IgE receptors on immune effector cells such as mast cells located throughout the body.
Upon subsequent exposure to the same allergen, IgE receptors cross-link and initiate downstream signaling events that trigger mast cell degranulation and an immediate allergic response—hence the term immediate (or Gell-Coombs type I) hypersensitivity.3
Common manifestations of type I hypersensitivity reactions include signs and symptoms that can be:
- Cutaneous (eg, acute urticaria, angioedema)
- Respiratory (eg, acute bronchospasm, rhinoconjunctivitis)
- Cardiovascular (eg, tachycardia, hypotension)
- Gastrointestinal (eg, vomiting, diarrhea)
- Generalized (eg, anaphylactic shock). By definition, anaphylaxis is a life-threatening reaction that occurs on exposure to an allergen and involves acute respiratory distress, cardiovascular failure, or involvement of two or more organ systems.4
MOST IgE BLOOD TESTS ARE IMMUNOASSAYS
The blood tests for allergic disease are immunoassays that measure the level of IgE specific to a particular allergen. The tests can be used to evaluate sensitivity to various allergens, for example, to common inhalants such as dust mites and pollens and to foods, drugs, venom, and latex.
Types of immunoassays include enzyme-linked immunosorbent assays (ELISAs), fluorescent enzyme immunoassays (FEIAs), and radioallergosorbent assays (RASTs). At present, most commercial laboratories use one of three autoanalyzer systems to measure specific IgE:
- ImmunoCAP (Phadia AB, Uppsala, Sweden)
- Immulite (Siemens AG, Berlin, Germany)
- HYTEC-288 (Hycor/Agilent, Garden Grove, CA).
These systems use a solid-phase polymer (cellulose or avidin) in which the antigen is embedded. The polymer also facilitates binding of IgE and, therefore, increases the sensitivity of the test.5 Specific IgE from the patient’s serum binds to the allergen embedded in the polymer, and then unbound antibodies are washed off.
Despite the term “RAST,” these systems do not use radiation. A fluorescent antibody is added that binds to the patient’s IgE, and the amount of IgE present is calculated from the amount of fluorescence.6 Results are reported in kilounits of antibody per liter (kU/L) or nanograms per milliliter (ng/mL).5–7
INTERPRETATION IS INDIVIDUALIZED
In general, the sensitivity of these tests ranges from 60% to 95% and their specificity from 30% to 95%, with a concordance among different immunoassays of 75% to 90%.8
Levels of IgE for a particular allergen are also divided into semiquantitative classes, from class I to class V or VI. In general, class I and class II correlate with a low level of allergen sensitization and, often, with a low likelihood of a clinical reaction. On the other hand, classes V and VI reflect higher degrees of sensitization and generally correlate with IgE-mediated clinical reactions upon allergen exposure.
The interpretation of a positive (ie, “nonzero”) test result must be individualized on the basis of clinical presentation and risk factors. A specialist can make an important contribution by helping to interpret any positive test result or a negative test result that does not correlate with the patient’s history.
ADVANTAGES OF ALLERGY BLOOD TESTING
Allergy blood testing is convenient, since it involves only a standard blood draw.
In theory, allergy blood testing may be safer, since it does not expose the patient to any allergens. On the other hand, many patients experience bruising from venipuncture performed for any reason: 16% in one survey.9 In another survey,10 adverse reactions of any type occurred in 0.49% of patients undergoing venipuncture but only in 0.04% of those undergoing allergy skin testing. Therefore, allergy blood testing may be most appropriate in situations in which a patient’s history suggests that he or she may be at risk of a systemic reaction from a traditional skin test or in cases in which skin testing is not possible (eg, extensive eczema).
Another advantage of allergy blood testing is that it is not affected by drugs such as antihistamines or tricyclic antidepressants that suppress the histamine response, which is a problem with skin testing.
Allergy blood testing may also be useful in patients on long-term glucocorticoid therapy, although the data conflict. Prolonged oral glucocorticoid use is associated with a decrease in mast cell density and histamine content in the skin,11,12 although in one study a corticosteroid was found not to affect the results of skin-prick testing for allergy.13 Thus, allergy blood testing can be performed in patients who have severe eczema or dermatographism or who cannot safely suspend taking antihistamines or tricyclic antidepressants.
LIMITATIONS OF THESE TESTS
A limitation of allergy blood tests is that there is no gold-standard test for many allergic conditions. (Double-blind, placebo-controlled oral food challenge testing has been proposed as the gold-standard test for food allergy, and nasal allergen provocation challenge has been proposed for allergic rhinitis.)
Also, allergy blood tests can give false-positive results because of nonspecific binding of antibody in the assay.
Of note: evidence of sensitization to a particular allergen (ie, a positive blood test result) is not synonymous with clinically relevant disease (ie, clinical sensitivity).
Conversely, these tests can give false-negative results in patients who have true IgE-mediated disease as confirmed by skin testing or allergen challenge. The sensitivity of blood allergy testing is approximately 25% to 30% lower than that of skin testing, based on comparative studies.2 The blood tests are usually considered positive if the allergen-specific IgE level is greater than 0.35 kU/L; however, sensitization to certain inhalant allergens can occur at levels as low as 0.12 kU/L.14
Specific IgE levels measured by different commercial assays are not always interchangeable or equivalent, so a clinician should consistently select the same immunoassay if possible when assessing any given patient over time.15
Levels of specific IgE have been shown to depend on age, allergen specificity, total serum IgE, and, with inhalant allergens, the season of the year.15,16
Other limitations of blood testing are its cost and a delay of several days to a week in obtaining the results.17
WHEN TO ORDER ALLERGY BLOOD TESTING
The allergy evaluation should begin with a thorough history to look for possible triggers for the patient’s symptoms.
For example, respiratory conditions such as asthma and rhinitis may be exacerbated during particular times of the year when certain pollens are commonly present. For patients with this pattern, blood testing for allergy to common inhalants, including pollens, may be appropriate. Similarly, peanut allergy evaluation is indicated for a child who has suffered an anaphylactic reaction after consuming peanut butter. Blood testing is also indicated in patients with a history of venom anaphylaxis, especially if venom skin testing was negative.
In cases in which the patient does not have a clear history of sensitization, blood testing for allergy to multiple foods may find evidence of sensitization that does not necessarily correlate with clinical disease.18
Likewise, blood tests are not likely to be clinically relevant in conditions not mediated by IgE, such as food intolerances (eg, lactose intolerance), celiac disease, the DRESS syndrome (drug rash, eosinophilia, and systemic symptoms), Stevens-Johnson syndrome, toxic epidermal necrolysis, or other types of drug hypersensitivity reactions, such as serum sickness.3
INTERPRETING COMMONLY ORDERED BLOOD TESTS FOR ALLERGY
Tests for allergy to hundreds of substances are available.
Foods
Milk, eggs, soy, wheat, peanuts, tree nuts, fish, and shellfish account for most cases of food allergy in the United States.18
IgE-mediated hypersensitivity to milk, eggs, and peanuts tends to be more common in children, whereas peanuts, tree nuts, fish, and shellfish are more commonly associated with reactions in adults.18 Children are more likely to outgrow allergy to milk, soy, wheat, and eggs than allergy to peanuts, tree nuts, fish, and shellfish—only about 20% of children outgrow peanut allergy.18
Patients with an IgE-mediated reaction to foods should be closely followed by a specialist, who can best help determine the appropriateness of additional testing (such as an oral challenge under observation), avoidance recommendations, and the introduction of foods back into the diet.19
Specific IgE tests for allergy to a variety of foods are available and can be very useful for diagnosis when used in the appropriate setting.

One caveat about these studies is that many were initially performed in children with a history of food allergy, many of whom had atopic dermatitis, and the findings have not been systematically reexamined in larger studies in more heterogeneous populations.
For example, at least eight studies tried to identify a diagnostic IgE level for cow’s milk allergy. The 95% confidence intervals varied widely, depending on the study design, the age of the study population, the prevalence of food allergy in the population, and the statistical method used for analysis.5 For most other foods for which blood tests are available, few studies have been performed to establish predictive values similar to those in Table 1.
Thus, slight elevations in antigen-specific IgE (> 0.35 kU/L) may correlate only with in vitro sensitization in a patient who has no clinical reactivity upon oral exposure to a particular antigen.
Broad food panels have been shown to have false-positive rates higher than 50%—ie, in more than half of cases, positive results have no clinical relevance. Therefore, these large food panels should not be used for screening.19 Instead, it is recommended that tests be limited to relevant foods based on the patient’s history when evaluating symptoms consistent with an IgE-mediated reaction to a particular food.
Food-specific IgE evaluation is also not helpful in evaluating non-IgE adverse reactions to foods (eg, intolerances).
Therefore, the patient’s history remains the most important tool for evaluation of food allergy. In cases in which the patient’s history suggests a food-associated IgE-mediated reaction and the blood test is negative, the patient should be referred to a specialist for skin testing with commercial extracts or even fresh food extracts, given the higher sensitivity of in vivo testing.20
Inhalants
Common aeroallergens associated with allergic rhinitis, allergic conjunctivitis, and allergic asthma include dust mites, animal dander, cockroach debris, molds, trees, grasses, weeds, and ragweed. Dust mites, animal dander, and mold spores are perennial allergens and may trigger symptoms year-round. Pollen, including pollen from trees, grasses, and weeds, is generally present in a seasonal pattern in many parts of the United States.
A positive blood test for an inhalant allergen can reinforce the physician’s clinical impression in making a diagnosis of allergic rhinoconjunctivitis. Interestingly, studies have suggested a high rate of false-positives based on history alone when in vivo and in vitro allergy testing were negative for IgE-mediated respiratory disease.21
Various studies have aimed to establish threshold values of aeroallergen-specific IgE that predict the likelihood of clinically relevant disease. Unfortunately, other factors also contribute to clinical symptoms of rhinoconjunctivitis; these include concurrent inflammation, infection, physical stress, psychological stress, exposure to irritants, and hormonal changes. These factors introduce variability and make specific IgE cutoffs for inhalant allergens unreliable.22
Prospective studies have suggested that skin testing correlates better with nasal allergen challenge (the gold standard) than blood testing for the diagnosis of inhalant allergy, though more recent studies using modern technologies demonstrate reasonable concordance (67%) between skin testing and blood testing (specifically, ImmunoCAP).23,24 According to current guidelines, skin tests are the preferred method for diagnosing IgE-mediated sensitivity to inhalants.25
Compared with skin prick tests as the gold standard, the sensitivity of specific IgE immunoassays is approximately 70% to 75%.25 Nevertheless, specific IgE values greater than 0.35 kU/L are generally considered positive for aeroallergen sensitization, although lower levels of dog-specific IgE have recently been shown to correlate with clinical disease.14
Drugs, including penicillins
A variety of clinical reactions can occur in response to oral, intravenous, or topical medications.
At present, blood tests are available for the evaluation of IgE-mediated adverse reactions to only a limited number of drugs. Reactions involving other mechanisms, such as those related to the drug’s metabolism, intolerances (eg, nausea), idiosyncratic reactions (eg, Stevens-Johnson syndrome, the DRESS syndrome), or other types of reactions can be diagnosed only by history and physical examination.
The development of specific IgE tests for sensitivity to medications has been limited by incomplete characterization of metabolic products and the possibility that a single medication can have different epitopes or IgE binding sites in different individuals.26
In vitro allergy testing has been most studied for beta-lactam antibiotics (eg, penicillin) and not so much for other drugs.
Table 2 summarizes the sensitivity and specificity of blood allergy tests that are commercially available for drugs.
Penicillin, a beta-lactam antibiotic, is degraded into various metabolites known as the major determinant (penicilloyl) and the minor determinants (eg, benzylpenicilloate and benzylpenilloate), which act as haptens. Specific IgE testing is not available for all these determinants.
The sensitivity of blood tests for allergy to penicilloyl (penicillin) and amino-penicillins such as amoxicilloyl (amoxicillin) is reported as between 32% and 50%, and the specificity as 96% to 98%.29
By definition, any nonzero level of IgE specific for penicillin or its derivatives is considered a positive result and may be associated with a higher risk of IgE-mediated reaction to penicillins. However, in a situation analogous to that in people with food allergy who have a food-specific IgE titer lower than the empirically established threshold value (Table 1), low-titer values to penicillin may not predict anaphylactic sensitivity in a penicillin oral challenge.28 Further studies are needed to determine if there is a threshold level of penicillin-specific IgE above which a patient has a higher likelihood of an IgE-mediated systemic reaction.
Other drugs. Specific IgE blood tests are also available for certain neuromuscular agents, insulin, cefaclor (Ceclor), chlorhexidine (contained in various antiseptic products), and gelatin (Table 2). These substances have not been as well studied as penicillins, and the sensitivity and specificity data reported in Table 2 are limited by few studies and small study sizes.
Neuromuscular blocking agents. Tests for IgE against neuromuscular blocking agents are reported to have low sensitivity (30%–60%) using a cutoff value of 0.35 kU/L.30 In small studies, the sensitivity was higher (68% to 92%) when threshold values for rocuronium-specific IgE were lowered from 0.35 to 0.13 kU/L.29
Chlorhexidine, an antiseptic commonly used in surgery, has been linked to IgE-mediated reactions.31 Chlorhexidine-specific IgE levels greater than 0.35 kU/L are considered positive, based on very limited data.
Insulin. Blood tests for allergy to insulin are also commercially available. However, studies have shown a significant overlap in the range of insulin-specific IgE in patients with a clinical history consistent with insulin allergy and in controls. Therefore, this test has a very limited ability to distinguish people who do not have a history of a reaction to insulin.32 More research is needed to determine the clinical utility of insulin-specific IgE testing.
Gelatin. IgE-mediated reactions have occurred after exposure to gelatin (from either cows or pigs) contained in foods and vaccines, including measles-mumps-rubella and yellow fever. One study identified gelatin-specific IgE in 10 of 11 children with a history of systemic reaction to measles or mumps vaccine.33 In the same study, gelatin-specific IgE levels were negative in 24 children who had developed non-IgE-mediated reactions to the vaccine.33
Tests for IgE against bovine gelatin are commercially available; results are considered positive for values higher than 0.35 kU/L. A negative test result does not exclude the possibility of an allergic reaction to porcine gelatin, which can also be found in foods and vaccines, but tests for anti-porcine gelatin IgE are not commercially available.
Latex
Latex, obtained from the rubber tree Hevea brasiliensis, has 13 known polypeptides (allergens Hev b 1–13) that cause IgE-mediated reactions, particularly in health care workers and patients with spina bifida.34 Overall, the incidence of latex allergy has decreased in the United States as most medical institutions have implemented a latex-free environment.
In vitro testing is the only mode of evaluation for allergy to latex approved by the US Food and Drug Administration (FDA).35 Its sensitivity is 80% and its specificity is 95%.36
In a 2007 study, 145 people at risk for latex allergy, including 104 health care workers, 31 patients with spina bifida, and 10 patients requiring multiple surgeries, underwent latex-specific IgE analysis for sensitivity to various recombinant and native latex allergens.34 The three groups differed in their latex allergy profiles, highlighting the diversity of clinical response to latex in high-risk groups and our current inability to establish specific cutoff points for quantitative latex-specific IgE. Thus, at present, any nonzero latex-specific IgE value is considered positive.
A formal evaluation for allergy is recommended for patients who have a strong history of an IgE-mediated reaction to latex and a latex-specific IgE value of zero. Blood tests for allergy to some native or recombinant latex allergens are available; these allergens may be underrepresented in the native total latex extract.33 Skin testing for allergy to latex, although not FDA-approved or standardized, can also be useful in this setting.37
Insect venom
Type I hypersensitivity reactions can occur from the stings of Vespidae (vespids), Apidae (bees), and Formicidae (fire ants). Large localized reactions after an insect sting are not infrequent and typically do not predict anaphylactic sensitivity with future stings, even though they are considered mild IgE-mediated reactions. However, systemic reactions are considered life-threatening and warrant allergy testing.38
The level of venom-specific IgE usually increases weeks to months after a sting.39 Therefore, blood tests can be falsely negative if performed within a short time of the sting.
Patients who have suffered a systemic reaction to venom and have evidence of sensitization by either in vitro or in vivo allergy testing are candidates for venom immunotherapy.40
At present, any nonzero venom-specific IgE test is considered positive, as there is no specific value for venom-specific IgE that predicts clinical risk.
A negative blood test does not exclude the possibility of an IgE-mediated reaction.41 In cases in which a patient has a clinical history compatible with venom allergy but the blood test is negative, the patient should be referred to an allergist for further evaluation, including venom skin testing and possibly repeat blood testing at a later time.
Conversely, specific IgE testing to venom is recommended when a patient has a history consistent with venom allergy and negative skin test results.38
As mentioned previously, in vitro test performance can vary with the laboratory and testing method used, and sending samples directly to a reference laboratory could be considered.41
TESTING FOR IgG AGAINST FOODS IS UNVALIDATED AND INAPPROPRIATE
In recent years, some practitioners of alternative medicine have started testing for allergen-specific IgG or IgG4 as part of evaluations for hypersensitivity, especially in cases in which patients describe atypical gastrointestinal, neurologic, or other symptoms after eating specific foods.19
However, this testing often finds IgG or IgG4 against foods that are well tolerated. At present, allergen-specific IgG testing lacks scientific evidence to support its clinical use in the evaluation of allergic disease.5,19
- Williams PB, Ahlstedt S, Barnes JH, Söderström L, Portnoy J. Are our impressions of allergy test performances correct? Ann Allergy Asthma Immunol 2003; 91:26–33.
- Bernstein IL, Li JT, Bernstein DI, et al; American Academy of Allergy, Asthma and Immunology; American College of Allergy, Asthma and Immunology. Allergy diagnostic testing: an updated practice parameter. Ann Allergy Asthma Immunol 2008; 100(suppl 3):S1–S148.
- Pichler WJ. Immune mechanism of drug hypersensitivity. Immunol Allergy Clin North Am 2004; 24:373–397.
- Lieberman P, Nicklas RA, Oppenheimer J, et al. The diagnosis and management of anaphylaxis practice parameter: 2010 update. J Allergy Clin Immunol 2010; 126:477–480.
- Hamilton RG. Clinical laboratory assessment of immediate-type hypersensitivity. J Allergy Clin Immunol 2010; 125(suppl 2):S284–S296.
- Cox L, Williams B, Sicherer S, et al; American College of Allergy, Asthma and Immunology Test Task Force; American Academy of Allergy, Asthma and Immunology Specific IgE Test Task Force. Pearls and pitfalls of allergy diagnostic testing: report from the American College of Allergy, Asthma and Immunology/American Academy of Allergy, Asthma and Immunology Specific IgE Test Task Force. Ann Allergy Asthma Immunol 2008; 101:580–592.
- Hamilton RG, Franklin Adkinson N. In vitro assays for the diagnosis of IgE-mediated disorders. J Allergy Clin Immunol 2004; 114:213–225.
- Williams PB, Dolen WK, Koepke JW, Selner JC. Comparison of skin testing and three in vitro assays for specific IgE in the clinical evaluation of immediate hypersensitivity. Ann Allergy 1992; 68:35–45.
- Howanitz PJ, Cembrowski GS, Bachner P. Laboratory phlebotomy. College of American Pathologists Q-Probe study of patient satisfaction and complications in 23,783 patients. Arch Pathol Lab Med 1991; 115:867–872.
- Turkeltaub PC, Gergen PJ. The risk of adverse reactions from percutaneous prick-puncture allergen skin testing, venipuncture, and body measurements: data from the second National Health and Nutrition Examination Survey 1976–80 (NHANES II). J Allergy Clin Immunol 1989; 84:886–890.
- Pipkorn U, Hammarlund A, Enerbäck L. Prolonged treatment with topical glucocorticoids results in an inhibition of the allergen-induced weal-and-flare response and a reduction in skin mast cell numbers and histamine content. Clin Exp Allergy 1989; 19:19–25.
- Cole ZA, Clough GF, Church MK. Inhibition by glucocorticoids of the mast cell-dependent weal and flare response in human skin in vivo. Br J Pharmacol 2001; 132:286–292.
- Des Roches A, Paradis L, Bougeard YH, Godard P, Bousquet J, Chanez P. Long-term oral corticosteroid therapy does not alter the results of immediate-type allergy skin prick tests. J Allergy Clin Immunol 1996; 98:522–527.
- Linden CC, Misiak RT, Wegienka G, et al. Analysis of allergen specific IgE cut points to cat and dog in the Childhood Allergy Study. Ann Allergy Asthma Immunol 2011; 106:153–158.
- Hamilton RG, Williams PB; Specific IgE Testing Task Force of the American Academy of Allergy, Asthma & Immunology; American College of Allergy, Asthma and Immunology. Human IgE antibody serology: a primer for the practicing North American allergist/immunologist. J Allergy Clin Immunol 2010; 126:33–38.
- Somville MA, Machiels J, Gilles JG, Saint-Remy JM. Seasonal variation in specific IgE antibodies of grass-pollen hypersensitive patients depends on the steady state IgE concentration and is not related to clinical symptoms. J Allergy Clin Immunol 1989; 83( 2 Pt 1):486–494.
- Poon AW, Goodman CS, Rubin RJ. In vitro and skin testing for allergy: comparable clinical utility and costs. Am J Manag Care 1998; 4:969–985.
- Sampson HA. Update on food allergy. J Allergy Clin Immunol 2004; 113:805–819.
- Boyce JA, Assa’ad A, Burks AW, et al; NIAID-Sponsored Expert Panel. Guidelines for the diagnosis and management of food allergy in the United States: summary of the NIAID-sponsored expert panel report. J Allergy Clin Immunol 2010; 126:1105–1118.
- Rosen JP, Selcow JE, Mendelson LM, Grodofsky MP, Factor JM, Sampson HA. Skin testing with natural foods in patients suspected of having food allergies: is it a necessity? J Allergy Clin Immunol 1994; 93:1068–1070.
- Williams PB, Siegel C, Portnoy J. Efficacy of a single diagnostic test for sensitization to common inhalant allergens. Ann Allergy Asthma Immunol 2001; 86:196–202.
- Söderström L, Kober A, Ahlstedt S, et al. A further evaluation of the clinical use of specific IgE antibody testing in allergic diseases. Allergy 2003; 58:921–928.
- Bousquet J, Lebel B, Dhivert H, Bataille Y, Martinot B, Michel FB. Nasal challenge with pollen grains, skin-prick tests and specific IgE in patients with grass pollen allergy. Clin Allergy 1987; 17:529–536.
- Nepper-Christensen S, Backer V, DuBuske LM, Nolte H. In vitro diagnostic evaluation of patients with inhalant allergies: summary of probability outcomes comparing results of CLA- and CAP-specific immunoglobulin E test systems. Allergy Asthma Proc 2003; 24:253–258.
- Wallace DV, Dykewicz MS, Bernstein DI, et al; Joint Task Force on Practice; American Academy of Allergy; Asthma & Immunology; Joint Council of Allergy, Asthma and Immunology. The diagnosis and management of rhinitis: an updated practice parameter. J Allergy Clin Immunol 2008; 122(suppl 2):S1–S84.
- Mayorga C, Sanz ML, Gamboa PM, et al; Immunology Committee of the Spanish Society of Allergology and Clinical Immunology of the SEAIC. In vitro diagnosis of immediate allergic reactions to drugs: an update. J Investig Allergol Clin Immunol 2010; 20:103–109.
- Garcia JJ, Blanca M, Moreno F, et al. Determination of IgE antibodies to the benzylpenicilloyl determinant: a comparison of the sensitivity and specificity of three radio allergo sorbent test methods. J Clin Lab Anal 1997; 11:251–257.
- Macy E, Goldberg B, Poon KY. Use of commercial anti-penicillin IgE fluorometric enzyme immunoassays to diagnose penicillin allergy. Ann Allergy Asthma Immunol 2010; 105:136–141.
- Blanca M, Mayorga C, Torres MJ, et al. Clinical evaluation of Pharmacia CAP System RAST FEIA amoxicilloyl and benzylpenicilloyl in patients with penicillin allergy. Allergy 2001; 56:862–870.
- Ebo DG, Venemalm L, Bridts CH, et al. Immunoglobulin E antibodies to rocuronium: a new diagnostic tool. Anesthesiology 2007; 107:253–259.
- Ebo DG, Bridts CH, Stevens WJ. IgE-mediated anaphylaxis from chlorhexidine: diagnostic possibilities. Contact Dermatitis 2006; 55:301–302.
- deShazo RD, Mather P, Grant W, et al. Evaluation of patients with local reactions to insulin with skin tests and in vitro techniques. Diabetes Care 1987; 10:330–336.
- Sakaguchi M, Ogura H, Inouye S. IgE antibody to gelatin in children with immediate-type reactions to measles and mumps vaccines. J Allergy Clin Immunol 1995; 96:563–565.
- Raulf-Heimsoth M, Rihs HP, Rozynek P, et al. Quantitative analysis of immunoglobulin E reactivity profiles in patients allergic or sensitized to natural rubber latex (Hevea brasiliensis). Clin Exp Allergy 2007; 37:1657–1667.
- Biagini RE, MacKenzie BA, Sammons DL, et al. Latex specific IgE: performance characteristics of the IMMULITE 2000 3gAllergy assay compared with skin testing. Ann Allergy Asthma Immunol 2006; 97:196–202.
- Hamilton RG, Peterson EL, Ownby DR. Clinical and laboratory-based methods in the diagnosis of natural rubber latex allergy. J Allergy Clin Immunol 2002; 110(suppl 2):S47–S56.
- Safadi GS, Corey EC, Taylor JS, Wagner WO, Pien LC, Melton AL. Latex hypersensitivity in emergency medical service providers. Ann Allergy Asthma Immunol 1996; 77:39–42.
- Moffitt JE, Golden DB, Reisman RE, et al. Stinging insect hypersensitivity: a practice parameter update. J Allergy Clin Immunol 2004; 114:869–886.
- Biló BM, Rueff F, Mosbech H, Bonifazi F, Oude-Elberink JN; EAACI Interest Group on Insect Venom Hypersensitivity. Diagnosis of Hymenoptera venom allergy. Allergy 2005; 60:1339–1349.
- Cox L, Nelson H, Lockey R, et al. Allergen immunotherapy: a practice parameter third update. J Allergy Clin Immunol 2011; 127(suppl 1):S1–S55.
- Golden DB, Kagey-Sobotka A, Norman PS, Hamilton RG, Lichtenstein LM. Insect sting allergy with negative venom skin test responses. J Allergy Clin Immunol 2001; 107:897–901.
Health care providers often need to evaluate allergic disorders such as allergic rhinoconjunctivitis, asthma, and allergies to foods, drugs, latex, and venom, both in the hospital and in the clinic.
Unfortunately, some symptoms, such as chronic nasal symptoms, can occur in both allergic and nonallergic disorders, and this overlap can confound the diagnosis and therapy. Studies suggest that when clinicians use the history and physical examination alone in evaluating possible allergic disease, the accuracy of their diagnoses rarely exceeds 50%.1
Blood tests are now available that measure immunoglobulin E (IgE) directed against specific antigens. These in vitro tests can be important tools in assessing a patient whose history suggests an allergic disease.2 However, neither allergy skin testing nor these blood tests are intended to be used for screening: they may be most useful as confirmatory diagnostic tests in cases in which the pretest clinical impression of allergic disease is high.
ALLERGY IS MEDIATED BY IgE
In susceptible people, IgE is produced by B cells in response to specific antigens such as foods, pollens, latex, and drugs. This antigen-specific (or allergen-specific) IgE circulates in the serum and binds to high-affinity IgE receptors on immune effector cells such as mast cells located throughout the body.
Upon subsequent exposure to the same allergen, IgE receptors cross-link and initiate downstream signaling events that trigger mast cell degranulation and an immediate allergic response—hence the term immediate (or Gell-Coombs type I) hypersensitivity.3
Common manifestations of type I hypersensitivity reactions include signs and symptoms that can be:
- Cutaneous (eg, acute urticaria, angioedema)
- Respiratory (eg, acute bronchospasm, rhinoconjunctivitis)
- Cardiovascular (eg, tachycardia, hypotension)
- Gastrointestinal (eg, vomiting, diarrhea)
- Generalized (eg, anaphylactic shock). By definition, anaphylaxis is a life-threatening reaction that occurs on exposure to an allergen and involves acute respiratory distress, cardiovascular failure, or involvement of two or more organ systems.4
MOST IgE BLOOD TESTS ARE IMMUNOASSAYS
The blood tests for allergic disease are immunoassays that measure the level of IgE specific to a particular allergen. The tests can be used to evaluate sensitivity to various allergens, for example, to common inhalants such as dust mites and pollens and to foods, drugs, venom, and latex.
Types of immunoassays include enzyme-linked immunosorbent assays (ELISAs), fluorescent enzyme immunoassays (FEIAs), and radioallergosorbent assays (RASTs). At present, most commercial laboratories use one of three autoanalyzer systems to measure specific IgE:
- ImmunoCAP (Phadia AB, Uppsala, Sweden)
- Immulite (Siemens AG, Berlin, Germany)
- HYTEC-288 (Hycor/Agilent, Garden Grove, CA).
These systems use a solid-phase polymer (cellulose or avidin) in which the antigen is embedded. The polymer also facilitates binding of IgE and, therefore, increases the sensitivity of the test.5 Specific IgE from the patient’s serum binds to the allergen embedded in the polymer, and then unbound antibodies are washed off.
Despite the term “RAST,” these systems do not use radiation. A fluorescent antibody is added that binds to the patient’s IgE, and the amount of IgE present is calculated from the amount of fluorescence.6 Results are reported in kilounits of antibody per liter (kU/L) or nanograms per milliliter (ng/mL).5–7
INTERPRETATION IS INDIVIDUALIZED
In general, the sensitivity of these tests ranges from 60% to 95% and their specificity from 30% to 95%, with a concordance among different immunoassays of 75% to 90%.8
Levels of IgE for a particular allergen are also divided into semiquantitative classes, from class I to class V or VI. In general, class I and class II correlate with a low level of allergen sensitization and, often, with a low likelihood of a clinical reaction. On the other hand, classes V and VI reflect higher degrees of sensitization and generally correlate with IgE-mediated clinical reactions upon allergen exposure.
The interpretation of a positive (ie, “nonzero”) test result must be individualized on the basis of clinical presentation and risk factors. A specialist can make an important contribution by helping to interpret any positive test result or a negative test result that does not correlate with the patient’s history.
ADVANTAGES OF ALLERGY BLOOD TESTING
Allergy blood testing is convenient, since it involves only a standard blood draw.
In theory, allergy blood testing may be safer, since it does not expose the patient to any allergens. On the other hand, many patients experience bruising from venipuncture performed for any reason: 16% in one survey.9 In another survey,10 adverse reactions of any type occurred in 0.49% of patients undergoing venipuncture but only in 0.04% of those undergoing allergy skin testing. Therefore, allergy blood testing may be most appropriate in situations in which a patient’s history suggests that he or she may be at risk of a systemic reaction from a traditional skin test or in cases in which skin testing is not possible (eg, extensive eczema).
Another advantage of allergy blood testing is that it is not affected by drugs such as antihistamines or tricyclic antidepressants that suppress the histamine response, which is a problem with skin testing.
Allergy blood testing may also be useful in patients on long-term glucocorticoid therapy, although the data conflict. Prolonged oral glucocorticoid use is associated with a decrease in mast cell density and histamine content in the skin,11,12 although in one study a corticosteroid was found not to affect the results of skin-prick testing for allergy.13 Thus, allergy blood testing can be performed in patients who have severe eczema or dermatographism or who cannot safely suspend taking antihistamines or tricyclic antidepressants.
LIMITATIONS OF THESE TESTS
A limitation of allergy blood tests is that there is no gold-standard test for many allergic conditions. (Double-blind, placebo-controlled oral food challenge testing has been proposed as the gold-standard test for food allergy, and nasal allergen provocation challenge has been proposed for allergic rhinitis.)
Also, allergy blood tests can give false-positive results because of nonspecific binding of antibody in the assay.
Of note: evidence of sensitization to a particular allergen (ie, a positive blood test result) is not synonymous with clinically relevant disease (ie, clinical sensitivity).
Conversely, these tests can give false-negative results in patients who have true IgE-mediated disease as confirmed by skin testing or allergen challenge. The sensitivity of blood allergy testing is approximately 25% to 30% lower than that of skin testing, based on comparative studies.2 The blood tests are usually considered positive if the allergen-specific IgE level is greater than 0.35 kU/L; however, sensitization to certain inhalant allergens can occur at levels as low as 0.12 kU/L.14
Specific IgE levels measured by different commercial assays are not always interchangeable or equivalent, so a clinician should consistently select the same immunoassay if possible when assessing any given patient over time.15
Levels of specific IgE have been shown to depend on age, allergen specificity, total serum IgE, and, with inhalant allergens, the season of the year.15,16
Other limitations of blood testing are its cost and a delay of several days to a week in obtaining the results.17
WHEN TO ORDER ALLERGY BLOOD TESTING
The allergy evaluation should begin with a thorough history to look for possible triggers for the patient’s symptoms.
For example, respiratory conditions such as asthma and rhinitis may be exacerbated during particular times of the year when certain pollens are commonly present. For patients with this pattern, blood testing for allergy to common inhalants, including pollens, may be appropriate. Similarly, peanut allergy evaluation is indicated for a child who has suffered an anaphylactic reaction after consuming peanut butter. Blood testing is also indicated in patients with a history of venom anaphylaxis, especially if venom skin testing was negative.
In cases in which the patient does not have a clear history of sensitization, blood testing for allergy to multiple foods may find evidence of sensitization that does not necessarily correlate with clinical disease.18
Likewise, blood tests are not likely to be clinically relevant in conditions not mediated by IgE, such as food intolerances (eg, lactose intolerance), celiac disease, the DRESS syndrome (drug rash, eosinophilia, and systemic symptoms), Stevens-Johnson syndrome, toxic epidermal necrolysis, or other types of drug hypersensitivity reactions, such as serum sickness.3
INTERPRETING COMMONLY ORDERED BLOOD TESTS FOR ALLERGY
Tests for allergy to hundreds of substances are available.
Foods
Milk, eggs, soy, wheat, peanuts, tree nuts, fish, and shellfish account for most cases of food allergy in the United States.18
IgE-mediated hypersensitivity to milk, eggs, and peanuts tends to be more common in children, whereas peanuts, tree nuts, fish, and shellfish are more commonly associated with reactions in adults.18 Children are more likely to outgrow allergy to milk, soy, wheat, and eggs than allergy to peanuts, tree nuts, fish, and shellfish—only about 20% of children outgrow peanut allergy.18
Patients with an IgE-mediated reaction to foods should be closely followed by a specialist, who can best help determine the appropriateness of additional testing (such as an oral challenge under observation), avoidance recommendations, and the introduction of foods back into the diet.19
Specific IgE tests for allergy to a variety of foods are available and can be very useful for diagnosis when used in the appropriate setting.
One caveat about these studies is that many were initially performed in children with a history of food allergy, many of whom had atopic dermatitis, and the findings have not been systematically reexamined in larger studies in more heterogeneous populations.
For example, at least eight studies tried to identify a diagnostic IgE level for cow’s milk allergy. The 95% confidence intervals varied widely, depending on the study design, the age of the study population, the prevalence of food allergy in the population, and the statistical method used for analysis.5 For most other foods for which blood tests are available, few studies have been performed to establish predictive values similar to those in Table 1.
Thus, slight elevations in antigen-specific IgE (> 0.35 kU/L) may correlate only with in vitro sensitization in a patient who has no clinical reactivity upon oral exposure to a particular antigen.
Broad food panels have been shown to have false-positive rates higher than 50%—ie, in more than half of cases, positive results have no clinical relevance. Therefore, these large food panels should not be used for screening.19 Instead, it is recommended that tests be limited to relevant foods based on the patient’s history when evaluating symptoms consistent with an IgE-mediated reaction to a particular food.
Food-specific IgE evaluation is also not helpful in evaluating non-IgE adverse reactions to foods (eg, intolerances).
Therefore, the patient’s history remains the most important tool for evaluation of food allergy. In cases in which the patient’s history suggests a food-associated IgE-mediated reaction and the blood test is negative, the patient should be referred to a specialist for skin testing with commercial extracts or even fresh food extracts, given the higher sensitivity of in vivo testing.20
Inhalants
Common aeroallergens associated with allergic rhinitis, allergic conjunctivitis, and allergic asthma include dust mites, animal dander, cockroach debris, molds, trees, grasses, weeds, and ragweed. Dust mites, animal dander, and mold spores are perennial allergens and may trigger symptoms year-round. Pollen, including pollen from trees, grasses, and weeds, is generally present in a seasonal pattern in many parts of the United States.
A positive blood test for an inhalant allergen can reinforce the physician’s clinical impression in making a diagnosis of allergic rhinoconjunctivitis. Interestingly, studies have suggested a high rate of false-positives based on history alone when in vivo and in vitro allergy testing were negative for IgE-mediated respiratory disease.21
Various studies have aimed to establish threshold values of aeroallergen-specific IgE that predict the likelihood of clinically relevant disease. Unfortunately, other factors also contribute to clinical symptoms of rhinoconjunctivitis; these include concurrent inflammation, infection, physical stress, psychological stress, exposure to irritants, and hormonal changes. These factors introduce variability and make specific IgE cutoffs for inhalant allergens unreliable.22
Prospective studies have suggested that skin testing correlates better with nasal allergen challenge (the gold standard) than blood testing for the diagnosis of inhalant allergy, though more recent studies using modern technologies demonstrate reasonable concordance (67%) between skin testing and blood testing (specifically, ImmunoCAP).23,24 According to current guidelines, skin tests are the preferred method for diagnosing IgE-mediated sensitivity to inhalants.25
Compared with skin prick tests as the gold standard, the sensitivity of specific IgE immunoassays is approximately 70% to 75%.25 Nevertheless, specific IgE values greater than 0.35 kU/L are generally considered positive for aeroallergen sensitization, although lower levels of dog-specific IgE have recently been shown to correlate with clinical disease.14
Drugs, including penicillins
A variety of clinical reactions can occur in response to oral, intravenous, or topical medications.
At present, blood tests are available for the evaluation of IgE-mediated adverse reactions to only a limited number of drugs. Reactions involving other mechanisms, such as those related to the drug’s metabolism, intolerances (eg, nausea), idiosyncratic reactions (eg, Stevens-Johnson syndrome, the DRESS syndrome), or other types of reactions can be diagnosed only by history and physical examination.
The development of specific IgE tests for sensitivity to medications has been limited by incomplete characterization of metabolic products and the possibility that a single medication can have different epitopes or IgE binding sites in different individuals.26
In vitro allergy testing has been most studied for beta-lactam antibiotics (eg, penicillin) and not so much for other drugs.
Table 2 summarizes the sensitivity and specificity of blood allergy tests that are commercially available for drugs.
Penicillin, a beta-lactam antibiotic, is degraded into various metabolites known as the major determinant (penicilloyl) and the minor determinants (eg, benzylpenicilloate and benzylpenilloate), which act as haptens. Specific IgE testing is not available for all these determinants.
The sensitivity of blood tests for allergy to penicilloyl (penicillin) and amino-penicillins such as amoxicilloyl (amoxicillin) is reported as between 32% and 50%, and the specificity as 96% to 98%.29
By definition, any nonzero level of IgE specific for penicillin or its derivatives is considered a positive result and may be associated with a higher risk of IgE-mediated reaction to penicillins. However, in a situation analogous to that in people with food allergy who have a food-specific IgE titer lower than the empirically established threshold value (Table 1), low-titer values to penicillin may not predict anaphylactic sensitivity in a penicillin oral challenge.28 Further studies are needed to determine if there is a threshold level of penicillin-specific IgE above which a patient has a higher likelihood of an IgE-mediated systemic reaction.
Other drugs. Specific IgE blood tests are also available for certain neuromuscular agents, insulin, cefaclor (Ceclor), chlorhexidine (contained in various antiseptic products), and gelatin (Table 2). These substances have not been as well studied as penicillins, and the sensitivity and specificity data reported in Table 2 are limited by few studies and small study sizes.
Neuromuscular blocking agents. Tests for IgE against neuromuscular blocking agents are reported to have low sensitivity (30%–60%) using a cutoff value of 0.35 kU/L.30 In small studies, the sensitivity was higher (68% to 92%) when threshold values for rocuronium-specific IgE were lowered from 0.35 to 0.13 kU/L.29
Chlorhexidine, an antiseptic commonly used in surgery, has been linked to IgE-mediated reactions.31 Chlorhexidine-specific IgE levels greater than 0.35 kU/L are considered positive, based on very limited data.
Insulin. Blood tests for allergy to insulin are also commercially available. However, studies have shown a significant overlap in the range of insulin-specific IgE in patients with a clinical history consistent with insulin allergy and in controls. Therefore, this test has a very limited ability to distinguish people who do not have a history of a reaction to insulin.32 More research is needed to determine the clinical utility of insulin-specific IgE testing.
Gelatin. IgE-mediated reactions have occurred after exposure to gelatin (from either cows or pigs) contained in foods and vaccines, including measles-mumps-rubella and yellow fever. One study identified gelatin-specific IgE in 10 of 11 children with a history of systemic reaction to measles or mumps vaccine.33 In the same study, gelatin-specific IgE levels were negative in 24 children who had developed non-IgE-mediated reactions to the vaccine.33
Tests for IgE against bovine gelatin are commercially available; results are considered positive for values higher than 0.35 kU/L. A negative test result does not exclude the possibility of an allergic reaction to porcine gelatin, which can also be found in foods and vaccines, but tests for anti-porcine gelatin IgE are not commercially available.
Latex
Latex, obtained from the rubber tree Hevea brasiliensis, has 13 known polypeptides (allergens Hev b 1–13) that cause IgE-mediated reactions, particularly in health care workers and patients with spina bifida.34 Overall, the incidence of latex allergy has decreased in the United States as most medical institutions have implemented a latex-free environment.
In vitro testing is the only mode of evaluation for allergy to latex approved by the US Food and Drug Administration (FDA).35 Its sensitivity is 80% and its specificity is 95%.36
In a 2007 study, 145 people at risk for latex allergy, including 104 health care workers, 31 patients with spina bifida, and 10 patients requiring multiple surgeries, underwent latex-specific IgE analysis for sensitivity to various recombinant and native latex allergens.34 The three groups differed in their latex allergy profiles, highlighting the diversity of clinical response to latex in high-risk groups and our current inability to establish specific cutoff points for quantitative latex-specific IgE. Thus, at present, any nonzero latex-specific IgE value is considered positive.
A formal evaluation for allergy is recommended for patients who have a strong history of an IgE-mediated reaction to latex and a latex-specific IgE value of zero. Blood tests for allergy to some native or recombinant latex allergens are available; these allergens may be underrepresented in the native total latex extract.33 Skin testing for allergy to latex, although not FDA-approved or standardized, can also be useful in this setting.37
Insect venom
Type I hypersensitivity reactions can occur from the stings of Vespidae (vespids), Apidae (bees), and Formicidae (fire ants). Large localized reactions after an insect sting are not infrequent and typically do not predict anaphylactic sensitivity with future stings, even though they are considered mild IgE-mediated reactions. However, systemic reactions are considered life-threatening and warrant allergy testing.38
The level of venom-specific IgE usually increases weeks to months after a sting.39 Therefore, blood tests can be falsely negative if performed within a short time of the sting.
Patients who have suffered a systemic reaction to venom and have evidence of sensitization by either in vitro or in vivo allergy testing are candidates for venom immunotherapy.40
At present, any nonzero venom-specific IgE test is considered positive, as there is no specific value for venom-specific IgE that predicts clinical risk.
A negative blood test does not exclude the possibility of an IgE-mediated reaction.41 In cases in which a patient has a clinical history compatible with venom allergy but the blood test is negative, the patient should be referred to an allergist for further evaluation, including venom skin testing and possibly repeat blood testing at a later time.
Conversely, specific IgE testing to venom is recommended when a patient has a history consistent with venom allergy and negative skin test results.38
As mentioned previously, in vitro test performance can vary with the laboratory and testing method used, and sending samples directly to a reference laboratory could be considered.41
TESTING FOR IgG AGAINST FOODS IS UNVALIDATED AND INAPPROPRIATE
In recent years, some practitioners of alternative medicine have started testing for allergen-specific IgG or IgG4 as part of evaluations for hypersensitivity, especially in cases in which patients describe atypical gastrointestinal, neurologic, or other symptoms after eating specific foods.19
However, this testing often finds IgG or IgG4 against foods that are well tolerated. At present, allergen-specific IgG testing lacks scientific evidence to support its clinical use in the evaluation of allergic disease.5,19
- Williams PB, Ahlstedt S, Barnes JH, Söderström L, Portnoy J. Are our impressions of allergy test performances correct? Ann Allergy Asthma Immunol 2003; 91:26–33.
- Bernstein IL, Li JT, Bernstein DI, et al; American Academy of Allergy, Asthma and Immunology; American College of Allergy, Asthma and Immunology. Allergy diagnostic testing: an updated practice parameter. Ann Allergy Asthma Immunol 2008; 100(suppl 3):S1–S148.
- Pichler WJ. Immune mechanism of drug hypersensitivity. Immunol Allergy Clin North Am 2004; 24:373–397.
- Lieberman P, Nicklas RA, Oppenheimer J, et al. The diagnosis and management of anaphylaxis practice parameter: 2010 update. J Allergy Clin Immunol 2010; 126:477–480.
- Hamilton RG. Clinical laboratory assessment of immediate-type hypersensitivity. J Allergy Clin Immunol 2010; 125(suppl 2):S284–S296.
- Cox L, Williams B, Sicherer S, et al; American College of Allergy, Asthma and Immunology Test Task Force; American Academy of Allergy, Asthma and Immunology Specific IgE Test Task Force. Pearls and pitfalls of allergy diagnostic testing: report from the American College of Allergy, Asthma and Immunology/American Academy of Allergy, Asthma and Immunology Specific IgE Test Task Force. Ann Allergy Asthma Immunol 2008; 101:580–592.
- Hamilton RG, Franklin Adkinson N. In vitro assays for the diagnosis of IgE-mediated disorders. J Allergy Clin Immunol 2004; 114:213–225.
- Williams PB, Dolen WK, Koepke JW, Selner JC. Comparison of skin testing and three in vitro assays for specific IgE in the clinical evaluation of immediate hypersensitivity. Ann Allergy 1992; 68:35–45.
- Howanitz PJ, Cembrowski GS, Bachner P. Laboratory phlebotomy. College of American Pathologists Q-Probe study of patient satisfaction and complications in 23,783 patients. Arch Pathol Lab Med 1991; 115:867–872.
- Turkeltaub PC, Gergen PJ. The risk of adverse reactions from percutaneous prick-puncture allergen skin testing, venipuncture, and body measurements: data from the second National Health and Nutrition Examination Survey 1976–80 (NHANES II). J Allergy Clin Immunol 1989; 84:886–890.
- Pipkorn U, Hammarlund A, Enerbäck L. Prolonged treatment with topical glucocorticoids results in an inhibition of the allergen-induced weal-and-flare response and a reduction in skin mast cell numbers and histamine content. Clin Exp Allergy 1989; 19:19–25.
- Cole ZA, Clough GF, Church MK. Inhibition by glucocorticoids of the mast cell-dependent weal and flare response in human skin in vivo. Br J Pharmacol 2001; 132:286–292.
- Des Roches A, Paradis L, Bougeard YH, Godard P, Bousquet J, Chanez P. Long-term oral corticosteroid therapy does not alter the results of immediate-type allergy skin prick tests. J Allergy Clin Immunol 1996; 98:522–527.
- Linden CC, Misiak RT, Wegienka G, et al. Analysis of allergen specific IgE cut points to cat and dog in the Childhood Allergy Study. Ann Allergy Asthma Immunol 2011; 106:153–158.
- Hamilton RG, Williams PB; Specific IgE Testing Task Force of the American Academy of Allergy, Asthma & Immunology; American College of Allergy, Asthma and Immunology. Human IgE antibody serology: a primer for the practicing North American allergist/immunologist. J Allergy Clin Immunol 2010; 126:33–38.
- Somville MA, Machiels J, Gilles JG, Saint-Remy JM. Seasonal variation in specific IgE antibodies of grass-pollen hypersensitive patients depends on the steady state IgE concentration and is not related to clinical symptoms. J Allergy Clin Immunol 1989; 83( 2 Pt 1):486–494.
- Poon AW, Goodman CS, Rubin RJ. In vitro and skin testing for allergy: comparable clinical utility and costs. Am J Manag Care 1998; 4:969–985.
- Sampson HA. Update on food allergy. J Allergy Clin Immunol 2004; 113:805–819.
- Boyce JA, Assa’ad A, Burks AW, et al; NIAID-Sponsored Expert Panel. Guidelines for the diagnosis and management of food allergy in the United States: summary of the NIAID-sponsored expert panel report. J Allergy Clin Immunol 2010; 126:1105–1118.
- Rosen JP, Selcow JE, Mendelson LM, Grodofsky MP, Factor JM, Sampson HA. Skin testing with natural foods in patients suspected of having food allergies: is it a necessity? J Allergy Clin Immunol 1994; 93:1068–1070.
- Williams PB, Siegel C, Portnoy J. Efficacy of a single diagnostic test for sensitization to common inhalant allergens. Ann Allergy Asthma Immunol 2001; 86:196–202.
- Söderström L, Kober A, Ahlstedt S, et al. A further evaluation of the clinical use of specific IgE antibody testing in allergic diseases. Allergy 2003; 58:921–928.
- Bousquet J, Lebel B, Dhivert H, Bataille Y, Martinot B, Michel FB. Nasal challenge with pollen grains, skin-prick tests and specific IgE in patients with grass pollen allergy. Clin Allergy 1987; 17:529–536.
- Nepper-Christensen S, Backer V, DuBuske LM, Nolte H. In vitro diagnostic evaluation of patients with inhalant allergies: summary of probability outcomes comparing results of CLA- and CAP-specific immunoglobulin E test systems. Allergy Asthma Proc 2003; 24:253–258.
- Wallace DV, Dykewicz MS, Bernstein DI, et al; Joint Task Force on Practice; American Academy of Allergy; Asthma & Immunology; Joint Council of Allergy, Asthma and Immunology. The diagnosis and management of rhinitis: an updated practice parameter. J Allergy Clin Immunol 2008; 122(suppl 2):S1–S84.
- Mayorga C, Sanz ML, Gamboa PM, et al; Immunology Committee of the Spanish Society of Allergology and Clinical Immunology of the SEAIC. In vitro diagnosis of immediate allergic reactions to drugs: an update. J Investig Allergol Clin Immunol 2010; 20:103–109.
- Garcia JJ, Blanca M, Moreno F, et al. Determination of IgE antibodies to the benzylpenicilloyl determinant: a comparison of the sensitivity and specificity of three radio allergo sorbent test methods. J Clin Lab Anal 1997; 11:251–257.
- Macy E, Goldberg B, Poon KY. Use of commercial anti-penicillin IgE fluorometric enzyme immunoassays to diagnose penicillin allergy. Ann Allergy Asthma Immunol 2010; 105:136–141.
- Blanca M, Mayorga C, Torres MJ, et al. Clinical evaluation of Pharmacia CAP System RAST FEIA amoxicilloyl and benzylpenicilloyl in patients with penicillin allergy. Allergy 2001; 56:862–870.
- Ebo DG, Venemalm L, Bridts CH, et al. Immunoglobulin E antibodies to rocuronium: a new diagnostic tool. Anesthesiology 2007; 107:253–259.
- Ebo DG, Bridts CH, Stevens WJ. IgE-mediated anaphylaxis from chlorhexidine: diagnostic possibilities. Contact Dermatitis 2006; 55:301–302.
- deShazo RD, Mather P, Grant W, et al. Evaluation of patients with local reactions to insulin with skin tests and in vitro techniques. Diabetes Care 1987; 10:330–336.
- Sakaguchi M, Ogura H, Inouye S. IgE antibody to gelatin in children with immediate-type reactions to measles and mumps vaccines. J Allergy Clin Immunol 1995; 96:563–565.
- Raulf-Heimsoth M, Rihs HP, Rozynek P, et al. Quantitative analysis of immunoglobulin E reactivity profiles in patients allergic or sensitized to natural rubber latex (Hevea brasiliensis). Clin Exp Allergy 2007; 37:1657–1667.
- Biagini RE, MacKenzie BA, Sammons DL, et al. Latex specific IgE: performance characteristics of the IMMULITE 2000 3gAllergy assay compared with skin testing. Ann Allergy Asthma Immunol 2006; 97:196–202.
- Hamilton RG, Peterson EL, Ownby DR. Clinical and laboratory-based methods in the diagnosis of natural rubber latex allergy. J Allergy Clin Immunol 2002; 110(suppl 2):S47–S56.
- Safadi GS, Corey EC, Taylor JS, Wagner WO, Pien LC, Melton AL. Latex hypersensitivity in emergency medical service providers. Ann Allergy Asthma Immunol 1996; 77:39–42.
- Moffitt JE, Golden DB, Reisman RE, et al. Stinging insect hypersensitivity: a practice parameter update. J Allergy Clin Immunol 2004; 114:869–886.
- Biló BM, Rueff F, Mosbech H, Bonifazi F, Oude-Elberink JN; EAACI Interest Group on Insect Venom Hypersensitivity. Diagnosis of Hymenoptera venom allergy. Allergy 2005; 60:1339–1349.
- Cox L, Nelson H, Lockey R, et al. Allergen immunotherapy: a practice parameter third update. J Allergy Clin Immunol 2011; 127(suppl 1):S1–S55.
- Golden DB, Kagey-Sobotka A, Norman PS, Hamilton RG, Lichtenstein LM. Insect sting allergy with negative venom skin test responses. J Allergy Clin Immunol 2001; 107:897–901.
KEY POINTS
- Specific IgE levels higher than 0.35 kU/L suggest sensitization, but that is not synonymous with clinical disease.
- Prospective studies have identified IgE levels that can predict clinical reactivity with greater than 95% certainty for certain foods, but similar studies have not been performed for most other foods, drugs, latex, or venom.
- The likelihood of an IgE-mediated clinical reaction often increases with the level of specific IgE, but these levels do not predict severity or guarantee a reaction will occur.
- The sensitivity of allergy blood tests ranges from 60% to 95%, and the specificity ranges from 30% to 95%.
- In the appropriate setting, these tests can help in identifying specific allergens and assessing allergic disease.
- Neither allergy blood testing nor skin testing should be used for screening: they may be most useful as confirmatory tests when the patient’s history is compatible with an IgE-mediated reaction.
Accountable care organizations, the patient-centered medical home, and health care reform: What does it all mean?
The US health care system cannot continue with “business as usual.” The current model is broken: it does not deliver the kind of care we want for our patients, ourselves, our families, and our communities. It is our role as professionals to help drive change and make medical care more cost-effective and of higher quality, with better satisfaction for patients as well as for providers.
Central to efforts to reform the system are two concepts. One is the “patient-centered medical home,” in which a single provider is responsible for coordinating care for individual patients. The other is “accountable care organizations,” a new way of organizing care along a continuum from doctor to hospital, mandated by the new health care reform law (technically known as the Patient Protection and Affordable Care Act).
CURRENT STATE OF HEALTH CARE: HIGH COST AND POOR QUALITY
Since health care reform was initially proposed in the 1990s, trends in the United States have grown steadily worse. Escalating health care costs have outstripped inflation, consuming an increasing percentage of the gross domestic product (GDP) at an unsustainable rate. Despite increased spending, quality outcomes are suboptimal. In addition, with the emergence of specialization and technology, care is increasingly fragmented and poorly coordinated, with multiple providers and poorly managed resources.
Over the last 15 years, the United States has far surpassed most countries in the developed world for total health care expenditures per capita.1,2 In 2009, we spent 17.4% of our GDP on health care, translating to $7,960 per capita, while Japan spent only 8.5% of its GDP, averaging $2,878 per capita.2 At the current rate, health care spending in the United States will increase from $2.5 trillion in 2009 to over $4.6 trillion in 2020.3
Paradoxically, costlier care is often of poorer quality. Many countries that spend far less per capita on health care achieve far better outcomes. Even within the United States, greater Medicare spending on a state and regional basis tends to correlate with poorer quality of care.4 Spending among Medicare beneficiaries is not standardized and varies widely throughout the country.5 The amount of care a patient receives also varies dramatically by region. The number of specialists involved in care during the last year of life is steadily increasing in many regions of the country, indicating poor care coordination.6
PATIENT-CENTERED MEDICAL HOMES: A POSITIVE TREND
The problems of high cost, poor quality, and poor coordination of care have led to the emergence of the concept of the patient-centered medical home. Originally proposed in 1967 by the American Academy of Pediatrics in response to the need for care coordination by a single physician, the idea did not really take root until the early 1990s. In 2002, the American Academy of Family Medicine embraced the concept and moved it forward.
According to the National Committee for Quality Assurance (NCQA), a nonprofit organization that provides voluntary certification for medical organizations, the patient-centered medical home is a model of care in which “patients have a direct relationship with a provider who coordinates a cooperative team of healthcare professionals, takes collective responsibility for the care provided to the patient, and arranges for appropriate care with other qualified providers as needed.”7
Patient-centered medical homes are supposed to improve quality outcomes and lower costs. In addition, they can compete for public or private incentives that reward this model of care and, as we will see later, are at the heart of ACO readiness.
Medical homes meet certification standards
NCQA first formally licensed patient-centered medical homes in 2008, based on nine standards and six key elements. A scoring system was used to rank the level of certification from level 1 (the lowest) to level 3. From 2008 to the end of 2010, the number of certified homes grew from 28 to 1,506. New York has the largest number of medical homes.
The new elements in the NCQA program align more closely with federal programs that are designed to drive quality, including the Centers for Medicare and Medicaid Services program to encourage the use of the electronic medical record, and with federal rule-making this last spring designed to implement accountable care organizations (ACOs).
Same-day access is now emphasized, as is managing patient populations—rather than just individual patients—with certain chronic diseases, such as diabetes and congestive heart failure. The requirements for tracking and coordinating care have profound implications about how resources are allocated. Ideally, coordinators of chronic disease management are embedded within practices to help manage high-risk patients, although the current reimbursement mechanism does not support this model. Population management may not be feasible for institutions that still rely on paper-based medical records.
Medical homes lower costs, improve quality
Integrated delivery system models such as patient-centered medical homes have demonstrated cost-savings while improving quality of care.8,9 Reducing hospital admissions and visits to the emergency department shows the greatest cost-savings in these models. Several projects have shown significant cost-savings10:
The Group Health Cooperative of Puget Sound reduced total costs by $10 per member per month (from $498 to $488, P = 0.76), with a 16% reduction in hospital admissions (P < .001) and a 29% reduction in emergency department visits (P < .001).
The Geisinger Health System Proven-Health Navigator in Pennsylvania reduced readmissions by 18% (P < .01). They also had a 7% reduction in total costs per member per month relative to a matched control group also in the Geisinger system but not in a medical home, although this difference did not reach statistical significance. Private payer demonstration projects of patient-centered medical homes have also shown cost-savings.
Blue Cross Blue Shield of South Carolina randomized patients to participate in either a patient-centered medical home or their standard system. The patient-centered medical home group had 36% fewer hospital days, 12.4% fewer emergency department visits, and a 6.5% reduction in total medical and pharmacy costs compared with controls.
Finally, the use of chronic care coordinators in a patient-centered medical home has been shown to be cost-effective and can lower the overall cost of care despite the investment to hire them. Johns Hopkins Guided Care program demonstrated a 24% reduction in hospital days, 15% fewer emergency department visits, and a 37% reduction in days in a skilled nursing facility. The annual net Medicare savings was $75,000 per coordinator nurse hired.
ACCOUNTABLE CARE ORGANIZATIONS: A NEW SYSTEM OF HEALTH CARE DELIVERY
While the patient-centered medical home is designed to improve the coordination of care among physicians, ACOs have the broader goal of coordinating care across the entire continuum of health care, from physicians to hospitals to other clinicians. The concept of ACOs was spawned in 2006 by Elliott S. Fisher, MD, MPH, of the Dartmouth Institute for Health Policy and Clinical Practice. The idea is that, by improving care coordination within an ACO and reducing fragmented care, costs can be controlled and outcomes improved. Of course, the devil is in the details.
As part of its health care reform initiative, the state of Massachusetts’ Special Commission on the Health Care Payment System defined ACOs as health care delivery systems composed of hospitals, physicians, and other clinician and nonclinician providers that manage care across the entire spectrum of care. An ACO could be a real (incorporated) or virtual (contractually networked) organization, for example, a large physician organization that would contract with one or more hospitals and ancillary providers.11
In a 2009 report to Congress, the Medicare Payment Advisory Committee (MedPac) similarly defined ACOs for the Medicare population. But MedPac also introduced the concept of financial risk: providers in the ACO would share in efficiency gains from improved care coordination and could be subjected to financial penalties for poor performance, depending on the structure of the ACO.12
But what has placed ACOs at center stage is the new health care reform law, which encourages the formation of ACOs. On March 31, 2011, the Centers for Medicare and Medicaid Services published proposed rules to implement ACOs for Medicare patients (they appeared in the Federal Register on April 7, 2011).13,14 Comments on the 129-page proposed rules were due by June 6, 2011. Final rules are supposed to be published later this year.
The proposed new rule has a three-part aim:
- Better care for individuals, as described by all six dimensions of quality in the Institute of Medicine report “Crossing the Quality Chasm”15: safety, effectiveness, patient-centeredness, timeliness, efficiency, and equity
- Better health for populations, with respect to educating beneficiaries about the major causes of ill health—poor nutrition, physical inactivity, substance abuse, and poverty—as well as about the importance of preventive services such as an annual physical examination and annual influenza vaccination
- Lower growth in expenditures by eliminating waste and inefficiencies while not withholding any needed care that helps beneficiaries.
DETAILS OF THE PROPOSED ACO RULE
Here are some of the highlights of the proposed ACO rule.
Two shared-savings options
Although the program could start as soon as January 1, 2012, the application process is formidable, so this timeline may not be realistic. Moreover, a final rule is pending.
The proposed rule requires at least a 3-year contract, and primary care physicians must be included. Shared savings will be available and will depend on an ACO’s ability to manage costs and to achieve quality target performances. Two shared-savings options will be available: one with no risk until the third year and the other with risk during all 3 years but greater potential benefit. In the one-sided model with no risk until year 3, an ACO would begin to accrue shared savings at a rate of 50% after an initial 2% of savings compared with a risk-adjusted per capita benchmark based on performance during the previous 3 years. In the second plan, an ACO would immediately realize shared savings at a rate of 60% as long as savings were achieved compared with prior benchmark performance. However, in this second model, the ACO would be at risk to repay a share of all losses that were more than 2% higher than the benchmark expenditures, with loss caps of 5%, 7.5%, and 10% above benchmark in years 1, 2, and 3, respectively.
Structure of an ACO
Under the proposed rule, the minimum population size of Medicare beneficiaries is 5,000 patients, with some exceptions in rural or other shortage areas, or areas with critical access hospitals. ACO founders can be primary care physicians, primary care independent practice associations, or employee groups. Participants may include hospitals, critical access hospitals, specialists, and other providers. The ACO must be a legal entity with its own tax identification number and its own governance and management structure.
Concerns have been expressed that, in some markets, certain groups may come together and achieve market dominance with more than half of the population. Proposed ACOs with less than 30% of the market share will be exempt from antitrust concerns, and those with greater than 50% of market share will undergo detailed review.
Patient assignment
Patients will be assigned to an ACO retrospectively, at the end of the 3 years. The Centers for Medicare and Medicaid Services argues that retrospective assignment will encourage the ACO to design a system to help all patients, not just those assigned to the ACO.
Patients may not opt out of being counted against ACO performance measures. Although Medicare will share beneficiaries’ data with the ACO retrospectively so that it can learn more about costs per patient, patients may opt out of this data-sharing. Patients also retain unrestricted choice to see other providers, with attribution of costs incurred to the ACO.
Quality and reporting
The proposed rule has 65 equally weighted quality measures, many of which are not presently reported by most health care organizations. The measures fall within five broad categories: patient and caregiver experience, care coordination, patient safety, preventive health, and managing at-risk populations, including the frail elderly. Bonus payments for cost-savings will be adjusted based on meeting the quality measures.
Governance and management
Under the proposed rule, an ACO must meet stringent governance requirements. It must be a distinct legal entity as governed by state law. There must be proportional representation of all participants (eg, hospitals, community organizations, providers), comprising at least 75% of its Board of Trustees. These members must have authority to execute statutory functions of the ACO. Medicare beneficiaries and community stakeholder organizations must also be represented on the Board.
ACO operations must be managed by an executive director, manager, or general partner, who may or may not be a physician. A board-certified physician who is licensed in the state in which the ACO is domiciled must serve on location as the full-time, senior-level medical director, overseeing and managing clinical operations. A leadership team must be able to influence clinical practice, and a physician-directed process-improvement and quality-assurance committee is required.
Infrastructure and policies
The proposed rule outlines a number of infrastructure and policy requirements that must be addressed in the application process. These include:
- Written performance standards for quality and efficiency
- Evidence-based practice guidelines
- Tools to collect, evaluate, and share data to influence decision-making at the point of care
- Processes to identify and correct poor performance
- Description of how shared savings will be used to further improve care.
CONCERNS ABOUT THE PROPOSED NEW ACO RULE
While there is broad consensus in the health care community that the current system of care delivery fails to achieve the desired outcomes and is financially unsustainable and in need of reform, many concerns have been expressed about the proposed new ACO rule.
The regulations are too detailed. The regulations are highly prescriptive with detailed application, reporting, and regulatory requirements that create significant administrative burdens. Small medical groups are unlikely to have the administrative infrastructure to become involved.
Potential savings are inadequate. The shared savings concept has modest upside gain when modeled with holdback.16 Moreover, a recent analysis from the University Health System Consortium suggested that 50% of ACOs with 5,000 or more attributed lives would sustain unwarranted penalties as a result of random fluctuation of expenditures in the population.17
Participation involves a big investment. Participation requires significant resource investment, such as hiring chronic-disease managers and, in some practices, creating a whole new concept of managing wellness and continuity of care.
Retrospective beneficiary assignment is unpopular. Groups would generally prefer to know beforehand for whom they are responsible financially. A prospective assignment model was considered for the proposed rule but was ultimately rejected.
The patient assignment system is too risky. The plurality rule requires only a single visit with the ACO in order to be responsible for a patient for the entire year. In addition, the fact that the patient has the freedom to choose care elsewhere with expense assigned to the ACO confers significant financial risk.
There are too many quality measures. The high number of quality metrics—65—required to be measured and reported is onerous for most organizations.
Advertising is micromanaged. All marketing materials that are sent to patients about the ACO and any subsequent revisions must first be approved by Medicare, a potentially burdensome and time-consuming requirement.
Specialists are excluded. Using only generalists could actually be less cost-effective for some patients, such as those with human immunodeficiency virus, end-stage renal disease, certain malignancies, or advanced congestive heart failure.
Provider replacement is prohibited. Providers cannot be replaced over the 3 years of the demonstration, but the departing physician’s patients are still the responsibility of the plan. This would be especially problematic for small practices.
PREDICTING ACO READINESS
I believe there are five core competencies that are required to be an ACO:
- Operational excellence in care delivery
- Ability to deliver care across the continuum
- Cultural alignment among participating organizations
- Technical and informatics support to manage individual and population data
- Physician alignment around the concept of the ACO.
Certain strategies will increase the chances of success of an ACO:
Reduce emergency department usage and hospitalization. Cost-savings in patient-centered medical homes have been greatest by reducing hospitalizations, rehospitalizations, and emergency department visits.
Develop a high-quality, efficient primary care network. Have enough of a share in the primary care physician network to deliver effective primary care. Make sure there is good access to care and effective communication between patients and the primary care network. Deliver comprehensive services and have good care coordination. Aggressively manage communication, care coordination, and “hand-offs” across the care continuum and with specialists.
Create an effective patient-centered medical home. The current reimbursement climate fails to incentivize all of the necessary elements, which ultimately need to include chronic-care coordinators for medically complex patients, pharmacy support for patient medication management, adequate support staff to optimize efficiency, and a culture of wellness and necessary resources to support wellness.
PHYSICIANS NEED TO DRIVE SOLUTIONS
Soaring health care costs in the United States, poor quality outcomes, and increasing fragmentation of care are the major drivers of health care reform. The Patient Centered Medical Home is a key component to the solution and has already been shown to improve outcomes and lower costs. Further refinement of this concept and implementation should be priorities for primary care physicians and health care organizations.
The ACO concept attempts to further improve quality and lower costs. The proposed ACO rule released by the Centers for Medicare and Medicaid Services on March 31, 2011, has generated significant controversy in the health care community. In its current form, few health care systems are likely to participate. A revised rule is awaited in the coming months. In the meantime, the Centers for Medicare and Medicaid Services has released a request for application for a Pioneer ACO model, which offers up to 30 organizations the opportunity to participate in an ACO pilot that allows for prospective patient assignment and greater shared savings.
Whether ACOs as proposed achieve widespread implementation remains to be seen. However, the current system of health care delivery in this country is broken. Physicians and health care systems need to drive solutions to the challenges we face about quality, cost, access, care coordination, and outcomes.
- The Concord Coalition. Escalating Health Care Costs and the Federal Budget. April 2, 2009. http://www.concordcoalition.org/files/uploaded_for_nodes/docs/Iowa_Handout_final.pdf. Accessed August 8, 2011.
- The Henry J. Kaiser Family Foundation. Snapshots: Health Care Costs. Health Care Spending in the United States and OECD Countries. April 2011. http://www.kff.org/insurance/snapshot/OECD042111.cfm. Accessed August 8, 2011.
- Centers for Medicare and Medicaid Services. National health expenditure projections 2010–2020. http://www.cms.gov/NationalHealthExpendData/downloads/proj2010.pdf. Accessed August 8, 2011.
- The Commonwealth Fund. Performance snapshots, 2006. http://www.cmwf.org/snapshots. Accessed August 8, 2011.
- Fisher E, Goodman D, Skinner J, Bronner K. Health care spending, quality, and outcomes. More isn’t always better. The Dartmouth Atlas of Health Care. The Dartmouth Institute for Health Policy and Clinical Practice, 2009. http://www.dartmouthatlas.org/downloads/reports/Spending_Brief_022709.pdf. Accessed August 8, 2011.
- Goodman DC, Esty AR, Fisher ES, Chang C-H. Trends and variation in end-of-life care for Medicare beneficiaries with severe chronic illness. The Dartmouth Atlas of Health Care. The Dartmouth Institute for Health Policy and Clinical Practice, 2011. http://www.dartmouthatlas.org/downloads/reports/EOL_Trend_Report_0411.pdf. Accessed August 8, 2011.
- National Committee for Quality Assurance (NCQA). Leveraging health IT to achieve ambulatory quality: the patient-centered medical home (PCMH). www.ncqa.org/Portals/0/Public%20Policy/HIMSS_NCQA_PCMH_Factsheet.pdf. Accessed August 8, 2011.
- Bodenheimer T. Lessons from the trenches—a high-functioning primary care clinic. N Eng J Med 2011; 365:5–8.
- Gabbay RA, Bailit MH, Mauger DT, Wagner EH, Siminerio L. Multipayer patient-centered medical home implementation guided by the chronic care model. Jt Comm J Qual Patient Saf 2011; 37:265–273.
- Grumbach K, Grundy P. Outcomes of implementing Patient Centered Medical Home interventions: a review of the evidence from prospective evaluation studies in the United States. Patient-Centered Primary Care Collaborative. November 16, 2010. http://www.pcpcc.net/files/evidence_outcomes_in_pcmh.pdf. Accessed August 8, 2011.
- Kirwan LA, Iselin S. Recommendations of the Special Commission on the Health Care Payment System. Commonwealth of Massachusetts, July 16, 2009. http://www.mass.gov/Eeohhs2/docs/dhcfp/pc/Final_Report/Final_Report.pdf. Accessed August 8, 2011.
- Medicare Payment Advisory Commission. Report to the Congress. Improving incentives in the Medicare Program. http://www.medpac.gov/documents/jun09_entirereport.pdf. Accessed August 8, 2011.
- National Archives and Records Administration. Federal Register Volume 76, Number 67, Thursday, April 7, 2011. http://edocket.access.gpo.gov/2011/pdf/2011-7880.pdf. Accessed August 8, 2011.
- Berwick DM. Launching accountable care organizations—the proposed rule for the Medicare Shared Savings Program. N Engl J Med 2011; 364:e32.
- Institute of Medicine. Crossing the Quality Chasm. Washington, DC: National Academy Press; 2001.
- Fitch K, Mirkin D, Murphy-Barron C, Parke R, Pyenson B. A first look at ACOs’ risky business: quality is not enough. Seattle, WA: Millman, Inc; 2011. http://publications.milliman.com/publications/healthreform/pdfs/at-first-lookacos.pdf. Accessed August 10, 2011.
- University HealthSystem Consortium. Accountable care organizations: a measured view for academic medical centers. May 2011.
The US health care system cannot continue with “business as usual.” The current model is broken: it does not deliver the kind of care we want for our patients, ourselves, our families, and our communities. It is our role as professionals to help drive change and make medical care more cost-effective and of higher quality, with better satisfaction for patients as well as for providers.
Central to efforts to reform the system are two concepts. One is the “patient-centered medical home,” in which a single provider is responsible for coordinating care for individual patients. The other is “accountable care organizations,” a new way of organizing care along a continuum from doctor to hospital, mandated by the new health care reform law (technically known as the Patient Protection and Affordable Care Act).
CURRENT STATE OF HEALTH CARE: HIGH COST AND POOR QUALITY
Since health care reform was initially proposed in the 1990s, trends in the United States have grown steadily worse. Escalating health care costs have outstripped inflation, consuming an increasing percentage of the gross domestic product (GDP) at an unsustainable rate. Despite increased spending, quality outcomes are suboptimal. In addition, with the emergence of specialization and technology, care is increasingly fragmented and poorly coordinated, with multiple providers and poorly managed resources.
Over the last 15 years, the United States has far surpassed most countries in the developed world for total health care expenditures per capita.1,2 In 2009, we spent 17.4% of our GDP on health care, translating to $7,960 per capita, while Japan spent only 8.5% of its GDP, averaging $2,878 per capita.2 At the current rate, health care spending in the United States will increase from $2.5 trillion in 2009 to over $4.6 trillion in 2020.3
Paradoxically, costlier care is often of poorer quality. Many countries that spend far less per capita on health care achieve far better outcomes. Even within the United States, greater Medicare spending on a state and regional basis tends to correlate with poorer quality of care.4 Spending among Medicare beneficiaries is not standardized and varies widely throughout the country.5 The amount of care a patient receives also varies dramatically by region. The number of specialists involved in care during the last year of life is steadily increasing in many regions of the country, indicating poor care coordination.6
PATIENT-CENTERED MEDICAL HOMES: A POSITIVE TREND
The problems of high cost, poor quality, and poor coordination of care have led to the emergence of the concept of the patient-centered medical home. Originally proposed in 1967 by the American Academy of Pediatrics in response to the need for care coordination by a single physician, the idea did not really take root until the early 1990s. In 2002, the American Academy of Family Medicine embraced the concept and moved it forward.
According to the National Committee for Quality Assurance (NCQA), a nonprofit organization that provides voluntary certification for medical organizations, the patient-centered medical home is a model of care in which “patients have a direct relationship with a provider who coordinates a cooperative team of healthcare professionals, takes collective responsibility for the care provided to the patient, and arranges for appropriate care with other qualified providers as needed.”7
Patient-centered medical homes are supposed to improve quality outcomes and lower costs. In addition, they can compete for public or private incentives that reward this model of care and, as we will see later, are at the heart of ACO readiness.
Medical homes meet certification standards
NCQA first formally licensed patient-centered medical homes in 2008, based on nine standards and six key elements. A scoring system was used to rank the level of certification from level 1 (the lowest) to level 3. From 2008 to the end of 2010, the number of certified homes grew from 28 to 1,506. New York has the largest number of medical homes.
The new elements in the NCQA program align more closely with federal programs that are designed to drive quality, including the Centers for Medicare and Medicaid Services program to encourage the use of the electronic medical record, and with federal rule-making this last spring designed to implement accountable care organizations (ACOs).
Same-day access is now emphasized, as is managing patient populations—rather than just individual patients—with certain chronic diseases, such as diabetes and congestive heart failure. The requirements for tracking and coordinating care have profound implications about how resources are allocated. Ideally, coordinators of chronic disease management are embedded within practices to help manage high-risk patients, although the current reimbursement mechanism does not support this model. Population management may not be feasible for institutions that still rely on paper-based medical records.
Medical homes lower costs, improve quality
Integrated delivery system models such as patient-centered medical homes have demonstrated cost-savings while improving quality of care.8,9 Reducing hospital admissions and visits to the emergency department shows the greatest cost-savings in these models. Several projects have shown significant cost-savings10:
The Group Health Cooperative of Puget Sound reduced total costs by $10 per member per month (from $498 to $488, P = 0.76), with a 16% reduction in hospital admissions (P < .001) and a 29% reduction in emergency department visits (P < .001).
The Geisinger Health System Proven-Health Navigator in Pennsylvania reduced readmissions by 18% (P < .01). They also had a 7% reduction in total costs per member per month relative to a matched control group also in the Geisinger system but not in a medical home, although this difference did not reach statistical significance. Private payer demonstration projects of patient-centered medical homes have also shown cost-savings.
Blue Cross Blue Shield of South Carolina randomized patients to participate in either a patient-centered medical home or their standard system. The patient-centered medical home group had 36% fewer hospital days, 12.4% fewer emergency department visits, and a 6.5% reduction in total medical and pharmacy costs compared with controls.
Finally, the use of chronic care coordinators in a patient-centered medical home has been shown to be cost-effective and can lower the overall cost of care despite the investment to hire them. Johns Hopkins Guided Care program demonstrated a 24% reduction in hospital days, 15% fewer emergency department visits, and a 37% reduction in days in a skilled nursing facility. The annual net Medicare savings was $75,000 per coordinator nurse hired.
ACCOUNTABLE CARE ORGANIZATIONS: A NEW SYSTEM OF HEALTH CARE DELIVERY
While the patient-centered medical home is designed to improve the coordination of care among physicians, ACOs have the broader goal of coordinating care across the entire continuum of health care, from physicians to hospitals to other clinicians. The concept of ACOs was spawned in 2006 by Elliott S. Fisher, MD, MPH, of the Dartmouth Institute for Health Policy and Clinical Practice. The idea is that, by improving care coordination within an ACO and reducing fragmented care, costs can be controlled and outcomes improved. Of course, the devil is in the details.
As part of its health care reform initiative, the state of Massachusetts’ Special Commission on the Health Care Payment System defined ACOs as health care delivery systems composed of hospitals, physicians, and other clinician and nonclinician providers that manage care across the entire spectrum of care. An ACO could be a real (incorporated) or virtual (contractually networked) organization, for example, a large physician organization that would contract with one or more hospitals and ancillary providers.11
In a 2009 report to Congress, the Medicare Payment Advisory Committee (MedPac) similarly defined ACOs for the Medicare population. But MedPac also introduced the concept of financial risk: providers in the ACO would share in efficiency gains from improved care coordination and could be subjected to financial penalties for poor performance, depending on the structure of the ACO.12
But what has placed ACOs at center stage is the new health care reform law, which encourages the formation of ACOs. On March 31, 2011, the Centers for Medicare and Medicaid Services published proposed rules to implement ACOs for Medicare patients (they appeared in the Federal Register on April 7, 2011).13,14 Comments on the 129-page proposed rules were due by June 6, 2011. Final rules are supposed to be published later this year.
The proposed new rule has a three-part aim:
- Better care for individuals, as described by all six dimensions of quality in the Institute of Medicine report “Crossing the Quality Chasm”15: safety, effectiveness, patient-centeredness, timeliness, efficiency, and equity
- Better health for populations, with respect to educating beneficiaries about the major causes of ill health—poor nutrition, physical inactivity, substance abuse, and poverty—as well as about the importance of preventive services such as an annual physical examination and annual influenza vaccination
- Lower growth in expenditures by eliminating waste and inefficiencies while not withholding any needed care that helps beneficiaries.
DETAILS OF THE PROPOSED ACO RULE
Here are some of the highlights of the proposed ACO rule.
Two shared-savings options
Although the program could start as soon as January 1, 2012, the application process is formidable, so this timeline may not be realistic. Moreover, a final rule is pending.
The proposed rule requires at least a 3-year contract, and primary care physicians must be included. Shared savings will be available and will depend on an ACO’s ability to manage costs and to achieve quality target performances. Two shared-savings options will be available: one with no risk until the third year and the other with risk during all 3 years but greater potential benefit. In the one-sided model with no risk until year 3, an ACO would begin to accrue shared savings at a rate of 50% after an initial 2% of savings compared with a risk-adjusted per capita benchmark based on performance during the previous 3 years. In the second plan, an ACO would immediately realize shared savings at a rate of 60% as long as savings were achieved compared with prior benchmark performance. However, in this second model, the ACO would be at risk to repay a share of all losses that were more than 2% higher than the benchmark expenditures, with loss caps of 5%, 7.5%, and 10% above benchmark in years 1, 2, and 3, respectively.
Structure of an ACO
Under the proposed rule, the minimum population size of Medicare beneficiaries is 5,000 patients, with some exceptions in rural or other shortage areas, or areas with critical access hospitals. ACO founders can be primary care physicians, primary care independent practice associations, or employee groups. Participants may include hospitals, critical access hospitals, specialists, and other providers. The ACO must be a legal entity with its own tax identification number and its own governance and management structure.
Concerns have been expressed that, in some markets, certain groups may come together and achieve market dominance with more than half of the population. Proposed ACOs with less than 30% of the market share will be exempt from antitrust concerns, and those with greater than 50% of market share will undergo detailed review.
Patient assignment
Patients will be assigned to an ACO retrospectively, at the end of the 3 years. The Centers for Medicare and Medicaid Services argues that retrospective assignment will encourage the ACO to design a system to help all patients, not just those assigned to the ACO.
Patients may not opt out of being counted against ACO performance measures. Although Medicare will share beneficiaries’ data with the ACO retrospectively so that it can learn more about costs per patient, patients may opt out of this data-sharing. Patients also retain unrestricted choice to see other providers, with attribution of costs incurred to the ACO.
Quality and reporting
The proposed rule has 65 equally weighted quality measures, many of which are not presently reported by most health care organizations. The measures fall within five broad categories: patient and caregiver experience, care coordination, patient safety, preventive health, and managing at-risk populations, including the frail elderly. Bonus payments for cost-savings will be adjusted based on meeting the quality measures.
Governance and management
Under the proposed rule, an ACO must meet stringent governance requirements. It must be a distinct legal entity as governed by state law. There must be proportional representation of all participants (eg, hospitals, community organizations, providers), comprising at least 75% of its Board of Trustees. These members must have authority to execute statutory functions of the ACO. Medicare beneficiaries and community stakeholder organizations must also be represented on the Board.
ACO operations must be managed by an executive director, manager, or general partner, who may or may not be a physician. A board-certified physician who is licensed in the state in which the ACO is domiciled must serve on location as the full-time, senior-level medical director, overseeing and managing clinical operations. A leadership team must be able to influence clinical practice, and a physician-directed process-improvement and quality-assurance committee is required.
Infrastructure and policies
The proposed rule outlines a number of infrastructure and policy requirements that must be addressed in the application process. These include:
- Written performance standards for quality and efficiency
- Evidence-based practice guidelines
- Tools to collect, evaluate, and share data to influence decision-making at the point of care
- Processes to identify and correct poor performance
- Description of how shared savings will be used to further improve care.
CONCERNS ABOUT THE PROPOSED NEW ACO RULE
While there is broad consensus in the health care community that the current system of care delivery fails to achieve the desired outcomes and is financially unsustainable and in need of reform, many concerns have been expressed about the proposed new ACO rule.
The regulations are too detailed. The regulations are highly prescriptive with detailed application, reporting, and regulatory requirements that create significant administrative burdens. Small medical groups are unlikely to have the administrative infrastructure to become involved.
Potential savings are inadequate. The shared savings concept has modest upside gain when modeled with holdback.16 Moreover, a recent analysis from the University Health System Consortium suggested that 50% of ACOs with 5,000 or more attributed lives would sustain unwarranted penalties as a result of random fluctuation of expenditures in the population.17
Participation involves a big investment. Participation requires significant resource investment, such as hiring chronic-disease managers and, in some practices, creating a whole new concept of managing wellness and continuity of care.
Retrospective beneficiary assignment is unpopular. Groups would generally prefer to know beforehand for whom they are responsible financially. A prospective assignment model was considered for the proposed rule but was ultimately rejected.
The patient assignment system is too risky. The plurality rule requires only a single visit with the ACO in order to be responsible for a patient for the entire year. In addition, the fact that the patient has the freedom to choose care elsewhere with expense assigned to the ACO confers significant financial risk.
There are too many quality measures. The high number of quality metrics—65—required to be measured and reported is onerous for most organizations.
Advertising is micromanaged. All marketing materials that are sent to patients about the ACO and any subsequent revisions must first be approved by Medicare, a potentially burdensome and time-consuming requirement.
Specialists are excluded. Using only generalists could actually be less cost-effective for some patients, such as those with human immunodeficiency virus, end-stage renal disease, certain malignancies, or advanced congestive heart failure.
Provider replacement is prohibited. Providers cannot be replaced over the 3 years of the demonstration, but the departing physician’s patients are still the responsibility of the plan. This would be especially problematic for small practices.
PREDICTING ACO READINESS
I believe there are five core competencies that are required to be an ACO:
- Operational excellence in care delivery
- Ability to deliver care across the continuum
- Cultural alignment among participating organizations
- Technical and informatics support to manage individual and population data
- Physician alignment around the concept of the ACO.
Certain strategies will increase the chances of success of an ACO:
Reduce emergency department usage and hospitalization. Cost-savings in patient-centered medical homes have been greatest by reducing hospitalizations, rehospitalizations, and emergency department visits.
Develop a high-quality, efficient primary care network. Have enough of a share in the primary care physician network to deliver effective primary care. Make sure there is good access to care and effective communication between patients and the primary care network. Deliver comprehensive services and have good care coordination. Aggressively manage communication, care coordination, and “hand-offs” across the care continuum and with specialists.
Create an effective patient-centered medical home. The current reimbursement climate fails to incentivize all of the necessary elements, which ultimately need to include chronic-care coordinators for medically complex patients, pharmacy support for patient medication management, adequate support staff to optimize efficiency, and a culture of wellness and necessary resources to support wellness.
PHYSICIANS NEED TO DRIVE SOLUTIONS
Soaring health care costs in the United States, poor quality outcomes, and increasing fragmentation of care are the major drivers of health care reform. The Patient Centered Medical Home is a key component to the solution and has already been shown to improve outcomes and lower costs. Further refinement of this concept and implementation should be priorities for primary care physicians and health care organizations.
The ACO concept attempts to further improve quality and lower costs. The proposed ACO rule released by the Centers for Medicare and Medicaid Services on March 31, 2011, has generated significant controversy in the health care community. In its current form, few health care systems are likely to participate. A revised rule is awaited in the coming months. In the meantime, the Centers for Medicare and Medicaid Services has released a request for application for a Pioneer ACO model, which offers up to 30 organizations the opportunity to participate in an ACO pilot that allows for prospective patient assignment and greater shared savings.
Whether ACOs as proposed achieve widespread implementation remains to be seen. However, the current system of health care delivery in this country is broken. Physicians and health care systems need to drive solutions to the challenges we face about quality, cost, access, care coordination, and outcomes.
- The Concord Coalition. Escalating Health Care Costs and the Federal Budget. April 2, 2009. http://www.concordcoalition.org/files/uploaded_for_nodes/docs/Iowa_Handout_final.pdf. Accessed August 8, 2011.
- The Henry J. Kaiser Family Foundation. Snapshots: Health Care Costs. Health Care Spending in the United States and OECD Countries. April 2011. http://www.kff.org/insurance/snapshot/OECD042111.cfm. Accessed August 8, 2011.
- Centers for Medicare and Medicaid Services. National health expenditure projections 2010–2020. http://www.cms.gov/NationalHealthExpendData/downloads/proj2010.pdf. Accessed August 8, 2011.
- The Commonwealth Fund. Performance snapshots, 2006. http://www.cmwf.org/snapshots. Accessed August 8, 2011.
- Fisher E, Goodman D, Skinner J, Bronner K. Health care spending, quality, and outcomes. More isn’t always better. The Dartmouth Atlas of Health Care. The Dartmouth Institute for Health Policy and Clinical Practice, 2009. http://www.dartmouthatlas.org/downloads/reports/Spending_Brief_022709.pdf. Accessed August 8, 2011.
- Goodman DC, Esty AR, Fisher ES, Chang C-H. Trends and variation in end-of-life care for Medicare beneficiaries with severe chronic illness. The Dartmouth Atlas of Health Care. The Dartmouth Institute for Health Policy and Clinical Practice, 2011. http://www.dartmouthatlas.org/downloads/reports/EOL_Trend_Report_0411.pdf. Accessed August 8, 2011.
- National Committee for Quality Assurance (NCQA). Leveraging health IT to achieve ambulatory quality: the patient-centered medical home (PCMH). www.ncqa.org/Portals/0/Public%20Policy/HIMSS_NCQA_PCMH_Factsheet.pdf. Accessed August 8, 2011.
- Bodenheimer T. Lessons from the trenches—a high-functioning primary care clinic. N Eng J Med 2011; 365:5–8.
- Gabbay RA, Bailit MH, Mauger DT, Wagner EH, Siminerio L. Multipayer patient-centered medical home implementation guided by the chronic care model. Jt Comm J Qual Patient Saf 2011; 37:265–273.
- Grumbach K, Grundy P. Outcomes of implementing Patient Centered Medical Home interventions: a review of the evidence from prospective evaluation studies in the United States. Patient-Centered Primary Care Collaborative. November 16, 2010. http://www.pcpcc.net/files/evidence_outcomes_in_pcmh.pdf. Accessed August 8, 2011.
- Kirwan LA, Iselin S. Recommendations of the Special Commission on the Health Care Payment System. Commonwealth of Massachusetts, July 16, 2009. http://www.mass.gov/Eeohhs2/docs/dhcfp/pc/Final_Report/Final_Report.pdf. Accessed August 8, 2011.
- Medicare Payment Advisory Commission. Report to the Congress. Improving incentives in the Medicare Program. http://www.medpac.gov/documents/jun09_entirereport.pdf. Accessed August 8, 2011.
- National Archives and Records Administration. Federal Register Volume 76, Number 67, Thursday, April 7, 2011. http://edocket.access.gpo.gov/2011/pdf/2011-7880.pdf. Accessed August 8, 2011.
- Berwick DM. Launching accountable care organizations—the proposed rule for the Medicare Shared Savings Program. N Engl J Med 2011; 364:e32.
- Institute of Medicine. Crossing the Quality Chasm. Washington, DC: National Academy Press; 2001.
- Fitch K, Mirkin D, Murphy-Barron C, Parke R, Pyenson B. A first look at ACOs’ risky business: quality is not enough. Seattle, WA: Millman, Inc; 2011. http://publications.milliman.com/publications/healthreform/pdfs/at-first-lookacos.pdf. Accessed August 10, 2011.
- University HealthSystem Consortium. Accountable care organizations: a measured view for academic medical centers. May 2011.
KEY POINTS
- Compared with other developed countries, health care in the United States is among the costliest and has poor quality measures.
- The patient-centered medical home is an increasingly popular model that emphasizes continuous coordinated patient care. It has been shown to lower costs while improving health care outcomes.
- Patient-centered medical homes are at the heart of ACOs, which establish a team approach to health care delivery systems that includes doctors and hospitals.
- Applications are now being accepted for participation in the Centers for Medicare and Medicaid Services’ ACO Proposed Rule. The 3-year minimum contract specifies numerous details regarding structure, governance, and management, and may or may not involve risk—as well as savings—according to the plan chosen.
When to stop treating the bones

Dr. Susan M. Ott, in this issue of the Journal, argues that many patients on bisphosphonate therapy for more than 5 years should be offered a “drug holiday.” She proposes a simple algorithm that uses measurement of bone turnover and bone density to decide whether to continue therapy, the assumption being that having accumulated in bone, the drug effect will persist after discontinuation.
This will please many patients, who prefer taking fewer drugs. Cost and potential adverse effects are their concerns. Physicians worry about adynamic bone, and as bisphosphonates accumulate in bone with prolonged therapy, they may ultimately increase the incidence of what are now rare adverse effects, ie, jaw necrosis and linear atypical fractures of the femur. To date, we have little evidence that continued drug exposure will cause more of these severe complications, but lack of data is not so comforting.
The data that support taking a bisphosphonate holiday after 5 years (vs continuing therapy for 10 years) are scant compared with the data supporting their initial benefit. The FLEX study (J Bone Miner Res 2010; 25:976–982), as Dr. Ott notes, provides only tenuous benefit for the longer therapy option (with alendronate). Benefit of 10 vs 5 years of therapy is based on subset analysis of a relevant but small group of patients in this study (those with a femoral neck T score lower than −2.5 and no vertebral fracture at baseline). Patients in this subset suffered more nonvertebral fractures after stopping the drug at 5 years. Data with other bisphosphonates may well differ. For the other subsets, 10 years of therapy did not seem better than 5. But the numbers are small, certainly too small to offer insight on the incidence of rare side effects developing with the extra 5 years of therapy.
My personal take: on the basis of limited data, I am worried about halting these drugs in patients at highest risk for fracture—those with severe osteoporosis and many prior fractures or ongoing corticosteroid use. In patients with osteoporosis but lower risk of fracture, I have increasingly offered drug holidays. Although it is clearly not based on large interventional outcome studies, I am more inclined to utilize markers of bone turnover than repeated bone density measurements in patients who have been taking bisphosphonates. Chronic bisphosphonate therapy may alter the relationship between density and fracture risk, akin (but opposite) to the way that corticosteroids increase fracture risk above what is suggested by bone density measurements.
But don’t let this discussion about how long to treat stand in the way of initiating therapy in osteoporotic patients at significant risk of fracture.
What is the optimal duration of bisphosphonate therapy?
Almost all the data about the safety and efficacy of bisphosphonate drugs for treating osteoporosis are from patients who took them for less than 5 years.
Reports of adverse effects with prolonged use have caused concern about the long-term safety of this class of drugs. This is particularly important because these drugs are retained in the skeleton longer than 10 years, because there are physiologic reasons why excessive bisphosphonate-induced inhibition of bone turnover could be damaging, and because many healthy postmenopausal women have been prescribed bisphosphonates in the hope of preventing fractures that are not expected to occur for 20 to 30 years.
Because information from trials is scant, opinions differ over whether bisphosphonates should be continued indefinitely. In this article, I summarize the physiologic mechanisms of these drugs, review the scant existing data about their effects beyond 5 years, and describe my approach to bisphosphonate therapy (while waiting for better evidence).
MORE THAN 4 MILLION WOMEN TAKE BISPHOSPHONATES
The first medical use of a bisphosphonate was in 1967, when a girl with myositis ossificans was given etidronate (Didronel) because it inhibited mineralization. Two years later, it was given to patients with Paget disease of bone because it was found to inhibit bone resorption.1 Etidronate could not be given for longer than 6 months, however, because patients developed osteomalacia.
Adding a nitrogen to the molecule dramatically increased its potency and led to the second generation of bisphosphonates. Alendronate (Fosamax), the first amino-bisphosphonate, became available in 1995, It was followed by risedronate (Actonel), ibandronate (Boniva), and zoledronic acid (Reclast). These drugs are potent inhibitors of bone resorption; however, in clinical doses they do not inhibit mineralization and therefore do not cause osteomalacia.
Randomized clinical trials involving more than 30,000 patients have provided grade A evidence that these drugs reduce the incidence of fragility fractures in patients with osteoporosis.2 Furthermore, observational studies have confirmed that they prevent fractures and have a good safety profile in clinical practice.
Therefore, the use of these drugs has become common. In 2008, an estimated 4 million women in the United States were taking them.3
BISPHOSPHONATES STRENGTHEN BONE BY INHIBITING RESORPTION
On a molecular level, bisphosphonates inhibit farnesyl pyrophosphate synthase, an enzyme necessary for formation of the cytoskeleton in osteoclasts. Thus, they strongly inhibit bone resorption. They do not appear to directly inhibit osteoblasts, the cells that form new bone, but they substantially decrease bone formation indirectly.4
To understand how inhibition of bone resorption affects bone physiology, it is necessary to appreciate the nature of bone remodeling. Bone is not like the skin, which is continually forming a new layer and sloughing off the old. Instead, bone is renewed in small units. It takes about 5 years to remodel cancellous bone and 13 years to remodel cortical bone5; at any one time, about 8% of the surface is being remodeled.
The first step occurs at a spot on the surface, where the osteoclasts resorb some bone to form a pit that looks like a pothole. Then a team of osteoblasts is formed and fills the pit with new bone over the next 3 to 6 months. When first formed, the new bone is mainly collagen and, like the tip of the nose, is not very stiff, but with mineral deposition the bone becomes stronger, like the bridge of the nose. The new bone gradually accumulates mineral and becomes harder and denser over the next 3 years.
When a bisphosphonate is given, the osteoclasts abruptly stop resorbing the bone, but osteoblasts continue to fill the pits that were there when the bisphosphonate was started. For the next several months, while the previous pits are being filled, the bone volume increases slightly. Thereafter, rates of both bone resorption and bone formation are very low.
A misconception: Bisphosphonates build bone
While semantically it is true that the bone formation rate in patients taking bisphosphonates is within the normal premenopausal range, this often-repeated statement is essentially misleading.
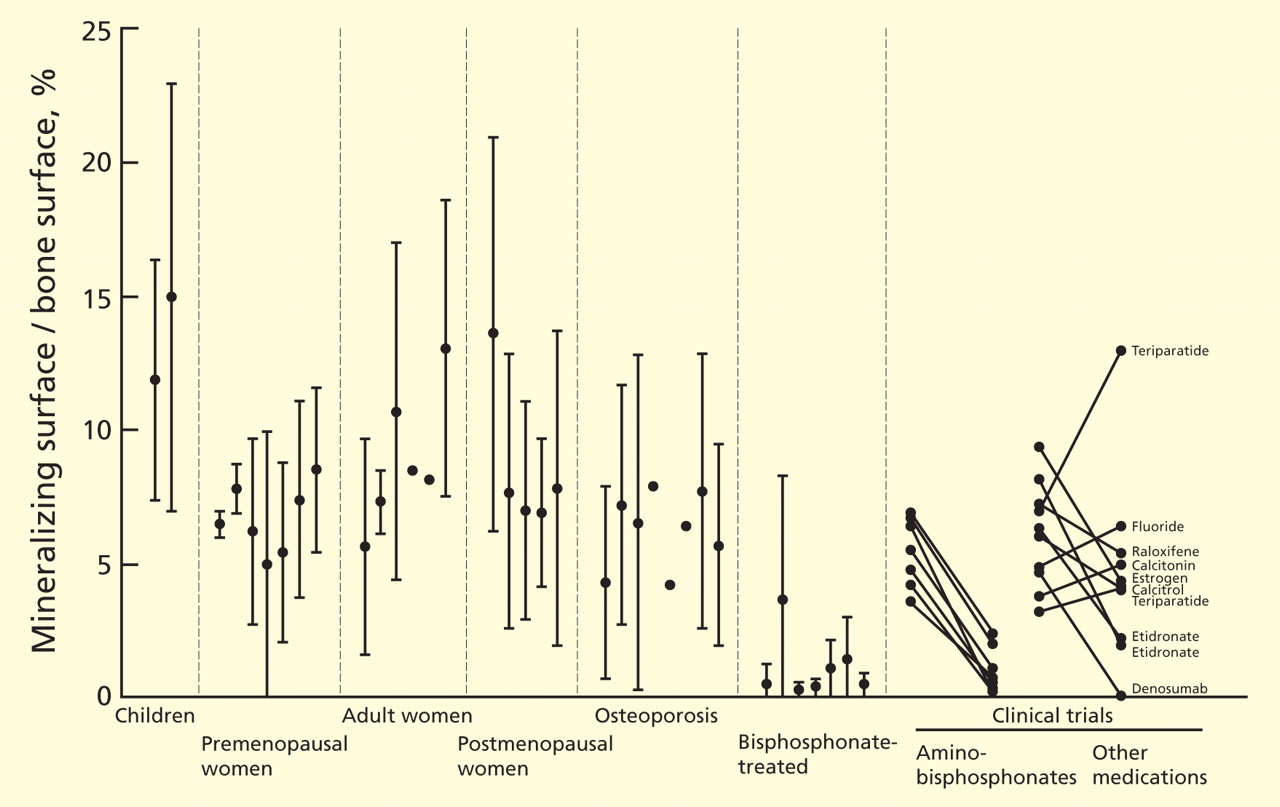
With continued bisphosphonate use, the bone gradually becomes more dense. There is no further new bone, but the existing bone matrix is packed more tightly with mineral crystals.9 The old bone is not resorbed. The bone density, measured radiographically, increases most rapidly during the first 6 months (while resorption pits are filling in) and more gradually over the next 3 years (while bone is becoming more mineralized).
Another common misunderstanding is that the bone density increases because the drugs are “building bone.” After 3 years, the bone density in the femur reaches a plateau.10 I have seen patients who were very worried because their bone density was no longer increasing, and their physicians did not realize that this is the expected pattern. The spinal bone density continues to increase modestly, but some of this may be from disk space narrowing, harder bone edges, and soft-tissue calcifications. Spinal bone density frequently increases even in those on placebo.
Bisphosphonates suppress markers of bone turnover
These changes in bone remodeling with bisphosphonates are reflected by changes in markers of bone formation and resorption. The levels of markers of bone resorption—N-telopeptide cross-linked type I collagen (NTx) and C-telopeptide cross-linked type I collagen (CTx)—decrease rapidly and remain low. The markers of bone formation—propeptide of type I collagen, bone alkaline phosphatase, and osteocalcin—decrease gradually over 3 to 6 months and then remain low. As measured directly at the bone, bone formation appears to be more suppressed than as measured by biochemical markers in the serum.
In a risedronate trial,11 the fracture rate decreased as the biochemical markers of bone turnover decreased, except when the markers were very low, in which case the fracture rate increased.
Without remodeling, cracks can accumulate
The bisphosphonates do not significantly increase bone volume, but they prevent microscopic architectural deterioration of the bone, as shown on microscopic computed tomographic imaging.12 This prevents fractures for at least 5 years.
But bisphosphonates may have long-term negative effects. One purpose of bone remodeling is to refresh the bone and to repair the microscopic damage that accumulates within any structure. Without remodeling, cracks can accumulate. Because the development and repair of microcracks is complex, it is difficult to predict what will happen with long-term bisphosphonate use. Studies of biopsies from women taking bisphosphonates long-term are inconsistent: one study found accumulation of microcracks,13 but another did not.8
STUDIES OF LONG-TERM USE: FOCUS ON FRACTURES
For this review, I consider long-term bisphosphonate use to be greater than 5 years, and I will focus on fractures. Bone density is only a surrogate end point. Unfortunately, this fact is often not emphasized in the training of young physicians.
The best illustration of this point was in a randomized clinical trial of fluoride,14 in which the bone density of the treated group increased by 8% per year for 4 years, for a total increase of 32%. This is more than we ever see with current therapies. But the patients had more fractures with fluoride than with placebo. This is because the quality of bone produced after fluoride treatment is poor, and although the bone is denser, it is weaker.
Observational studies of fracture incidence in patients who continued taking bisphosphonates compared with those who stopped provide some weak evidence about long-term effectiveness.
Curtis et al15 found, in 9,063 women who were prescribed bisphosphonates, that those who stopped taking them during the first 2 years had higher rates of hip fracture than compliant patients. Those who took bisphosphonates for 3 years and then stopped had a rate of hip fracture during the next year similar to that of those who continued taking the drugs.
Meijer et al16 used a database in the Netherlands to examine the fracture rates in 14,750 women who started taking a bisphosphonate for osteoporosis between 1996 and 2004. More than half of the women stopped taking the drug during the first year, and they served as the control group. Those who took bisphosphonates for 3 to 4 years had significantly fewer fractures than those who stopped during the first year (odds ratio 0.54). However, those who took them for 5 to 6 years had slightly more fractures than those who took them for less than a year.
Mellström et al17 performed a 2-year uncontrolled extension of a 5-year trial of risedronate that had blinded controls.18 Initially, 407 women were in the risedronate group; 68 completed 7 years.
The vertebral fracture rate in the placebo group was 7.6% per year during years 0 through 3. In the risedronate group, the rate was 4.7% per year during years 0 through 3 and 3.8% per year during years 6 and 7. Nonvertebral fractures occurred in 10.9% of risedronate-treated patients during the first 3 years and in 6% during the last 2 years. Markers of bone turnover remained reduced throughout the 7 years. Bone mineral density of the spine and hip did not change from years 5 to 7. The study did not include those who took risedronate for 5 years and then discontinued it.
Bone et al19 performed a similar, 10-year uncontrolled extension of a 3-year controlled trial of alendronate.20 There were 398 patients randomly assigned to alendronate, and 164 remained in the study for 8 to 10 years.
During years 8 through 10, bone mineral density of the spine increased by about 2%; no change was seen in the hip or total body. The nonvertebral fracture rate was similar in years 0 through 3 and years 6 through 10. Vertebral fractures occurred in approximately 3% of women in the first 3 years and in 9% in the last 5 years.
The FLEX trial: Continuing alendronate vs stopping
Only one study compared continuing a bisphosphonate vs stopping it. The Fracture Intervention Trial Long-Term Extension (FLEX)10 was an extension of the Fracture Intervention Trial (FIT)21,22 of alendronate. I am reviewing this study in detail because it is the only one that randomized patients and was double-blinded.
In the original trial,21,22 3,236 women were in the alendronate group. After a mean of 5 years on alendronate, 1,099 of them were randomized into the alendronate or placebo group.10 Those with T scores lower than −3.5 or who had lost bone density during the first 5 years were excluded.
The bone mineral density of the hip in the placebo group decreased by 3.4%, whereas in the alendronate group it decreased by 1.0%. At the spine, the placebo group gained less than the alendronate group.
Despite these differences in bone density, no significant difference was noted in the rates of all clinical fractures, nonvertebral fractures, vertebral fractures as measured on radiographs taken for the study (“morphometric” fractures, 11.3% vs 9.8%), or in the number of severe vertebral fractures (those with more than a two-grade change on radiography) between those who took alendronate for 10 years and those who took it for 5 years followed by placebo for 5 years.
However, fewer “clinical spine fractures” were observed in the group continuing alendronate (2.4% vs 5.3%). A clinical spine fracture was one diagnosed by the patient’s personal physician.
In FIT, these clinical fractures were painful in 90% of patients, and although the community radiographs were reviewed by a central radiologist, only 73% of the fractures were confirmed by subsequent measurements on the per protocol radiographs done at the study centers. About one-fourth of the morphometric fractures were also clinical fractures.23 Therefore, I think morphometric fractures provide the best evidence about the effects of treatment—ie, that treatment beyond 5 years is not beneficial. Other physicians, however, disagree, emphasizing the 55% reduction in clinical fractures.24
Markers of bone turnover gradually increased after discontinuation but remained lower than baseline even after 5 years without alendronate.10 There were no significant differences in fracture rates between the placebo and alendronate groups in those with baseline bone mineral density T scores less than −2.5.10 Also, after age adjustment, the fracture incidence was similar in the FIT and the FLEX studies.
Several years later, the authors published a post hoc subgroup analysis of these data.25 The patients were divided into six subgroups based on bone density and the presence of vertebral fractures at baseline. This is weak evidence, but I include it because reviews in the literature have emphasized only the positive findings, or have misquoted the data: Schwartz et al stated that in those with T scores of −2.5 or below, the risk of nonvertebral fracture was reduced by 50%25; and Shane26 concluded in an editorial that the use of alendronate for 10 years, rather than for 5 years, was associated with significantly fewer new vertebral fractures and nonvertebral fractures in patients with a bone mineral density T score of −2.5 or below.26
ATYPICAL FEMUR FRACTURES
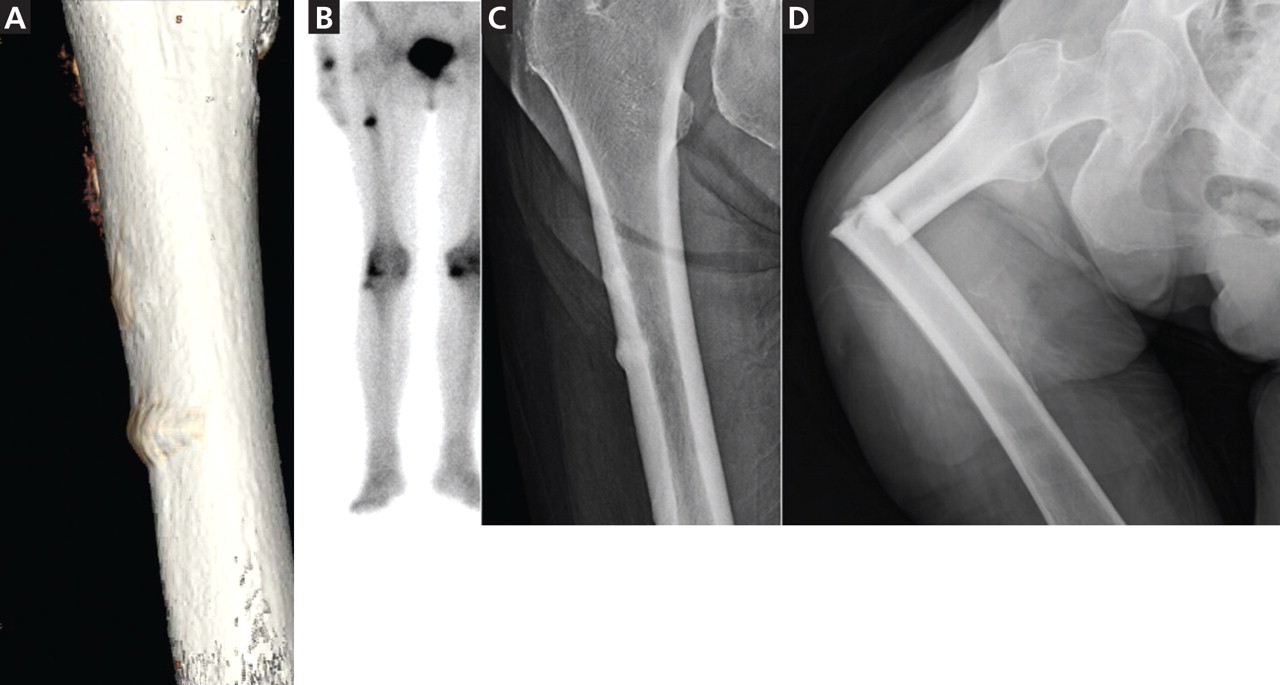
By March 2011, there were 55 papers describing a total of 283 cases, and about 85 individual cases (listed online in Ott SM. Osteoporosis and Bone Physiology. http://courses.washington.edu/bonephys/opsubtroch.html. Accessed 7/30/2011).
The mean age of the patients was 65, bisphosphonate use was longer than 5 years in 77% of cases, and bilateral fractures were seen in 48%.
The fractures occur with minor trauma, such as tripping, stepping off an elevator, or being jolted by a subway stop, and a disproportionate number of cases involve no trauma. They are often preceded by leg pain, typically in the mid-thigh.
These fractures are characterized by radiographic findings of a transverse fracture, with thickened cortices near the site of the fracture. Often, there is a peak on the cortex that may precede the fracture. These fractures initiate on the lateral side, and it is striking that they occur in the same horizontal plane on the contralateral side.
Radiographs and bone scans show stress fractures on the lateral side of the femur that resemble Looser zones (ie, dark lines seen radiographically). These radiographic features are not typical in osteoporosis but are reminiscent of the stress fractures seen with hypophosphatasia, an inherited disease characterized by severely decreased bone formation.31
Bone biopsy specimens show very low bone formation rates, but this is not a necessary feature. At the fracture site itself there is bone activity. For example, pathologists from St. Louis reviewed all iliac crest bone biopsies from patients seen between 2004 and 2007 who had an unusual cortical fracture while taking a bisphosphonate. An absence of double tetracycline labels was seen in 11 of the 16 patients.32
The first reports were anecdotal cases, then some centers reported systematic surveys of their patients. In a key report, Neviaser et al33 reviewed all low-trauma subtrochanteric fractures in their large hospital and found 20 cases with the atypical radiographic appearance; 19 of the patients in these cases had been taking a bisphosphonate. A similar survey in Australia found 41 cases with atypical radiographic features (out of 79 subtrochanteric low-trauma fractures), and all of the patients had been taking a bisphosphonate.34
By now, more than 230 cases have been reported. The estimated incidence is 1 in 1,000, based on a review of operative cases and radiographs.35
However, just because the drugs are associated with the fractures does not mean they caused the fractures, because the patients who took bisphosphonates were more likely to get a fracture in the first place. This confounding by indication makes it difficult to prove beyond a doubt that bisphosphonates cause atypical fractures.
Further, some studies have found no association between bisphosphonates and subtrochanteric fractures.36,37 These database analyses have relied on the coding of the International Classification of Diseases, Ninth Revision (ICD-9), and not on the examination of radiographs. We reviewed the ability of ICD-9 codes to identify subtrochanteric fractures and found that the predictive ability was only 36%.38 Even for fractures in the correct location, the codes cannot tell which cases have the typical spiral or comminuted fractures seen in osteoporosis and which have the unusual features of the bisphosphonate-associated fractures. Subtrochanteric and shaft fractures are about 10 times less common than hip fractures, and the atypical ones are about 10 times less common than typical ones, so studies based on ICD-9 codes cannot exonerate bisphosphonates.
A report of nearly 15,000 patients from randomized clinical trials did not find a significant incidence of subtrochanteric fractures, but the radiographs were not examined and only 500 of the patients had taken the medication for longer than 5 years.39
A population-based, nested case-control study using a database from Ontario, Canada, found an increased risk of diaphyseal femoral fractures in patients who had taken bisphosphonates longer than 5 years. The study included only women who had started bisphosphonates when they were older than 68, so many of the atypical fractures would have been missed. The investigators did not review the radiographs, so they combined both osteoporotic and atypical diaphyseal fractures in their analysis.40
At the 2010 meeting of the American Society for Bone and Mineral Research, preliminary data were presented from a systematic review of radiographs of patients with fractures of the femur from a health care plan with data about the use of medications. The incidence of atypical fractures increased progressively with the duration of bisphosphonate use, and was significantly higher after 5 years compared with less than 3 years.28
OTHER POSSIBLE ADVERSE EFFECTS
There have been conflicting reports about esophageal cancer with bisphosphonate use.41,42
Another possible adverse effect, osteonecrosis of the jaw, may have occurred in 1.4% of patients with cancer who were treated for 3 years with high intravenous doses of bisphosphonates (about 10 to 12 times the doses recommended for osteoporosis).43 This adverse effect is rare in patients with osteoporosis, occurring in less than 1 in 10,000 exposed patients.44
BISPHOSPHONATES SHOULD BE USED WHEN THEY ARE INDICATED
The focus of this paper is on the duration of use, but concern about long-term use should not discourage physicians or patients from using these drugs when there is a high risk of an osteoporotic fracture within the next 10 years, particularly in elderly patients who have experienced a vertebral compression fracture or a hip fracture. Patients with a vertebral fracture have a one-in-five chance of fracturing another vertebra, which is a far higher risk than any of the known long-term side effects from treatment, and bisphosphonates are effective at reducing the risk.
Low bone density alone can be used as an indication for bisphosphonates if the hip T score is lower than −2.5. A cost-effectiveness study concluded that alendronate was beneficial in these cases.45 In the FIT patients without a vertebral fracture at baseline, the overall fracture rate was significantly decreased by 36% with alendronate in those with a hip T score lower than −2.5, but there was no difference between placebo and alendronate in those with T scores between −2 and −2.5, and a 14% (nonsignificant) higher fracture rate when the T score was better than −2.0.22
A new method of calculating the risk of an osteoporotic fracture is the FRAX prediction tool (http://www.shef.ac.uk/FRAX), and one group has suggested that treatment is indicated when the 10-year risk of a hip fracture is greater than 3%.46 Another group, from the United Kingdom, suggests using a sliding scale depending on the fracture risk and the age.47
It is not always clear what to do when the hip fracture risk is greater than 3% for the next decade but the T score is better than −2.5. These patients have other factors that contribute to fracture risk. Their therapy must be individualized, and if they are at risk of fracture because of low weight, smoking, or alcohol use, it makes more sense to focus the approach on those treatable factors.
Women who have osteopenia and have not had a fragility fracture are often treated with bisphosphonates with the intent of preventing osteoporosis in the distant future. This approach is based on hope, not evidence, and several editorial reviews have concluded that these women do not need drug therapy.48–50
MY RECOMMENDATION: STOP AFTER 5 YEARS
Bisphosphonates reduce the incidence of devastating osteoporotic fractures in patients with osteoporosis, but that does not mean they should be used indefinitely.
After 5 years, the overall fracture risk is the same in patients who keep taking bisphosphonates as in patients who discontinue them. Therefore, I think these drugs are no longer necessary after 5 years. The post hoc subgroup analysis that showed benefit in only one of six groups of the FLEX study does not provide compelling evidence to continue taking bisphosphonates.
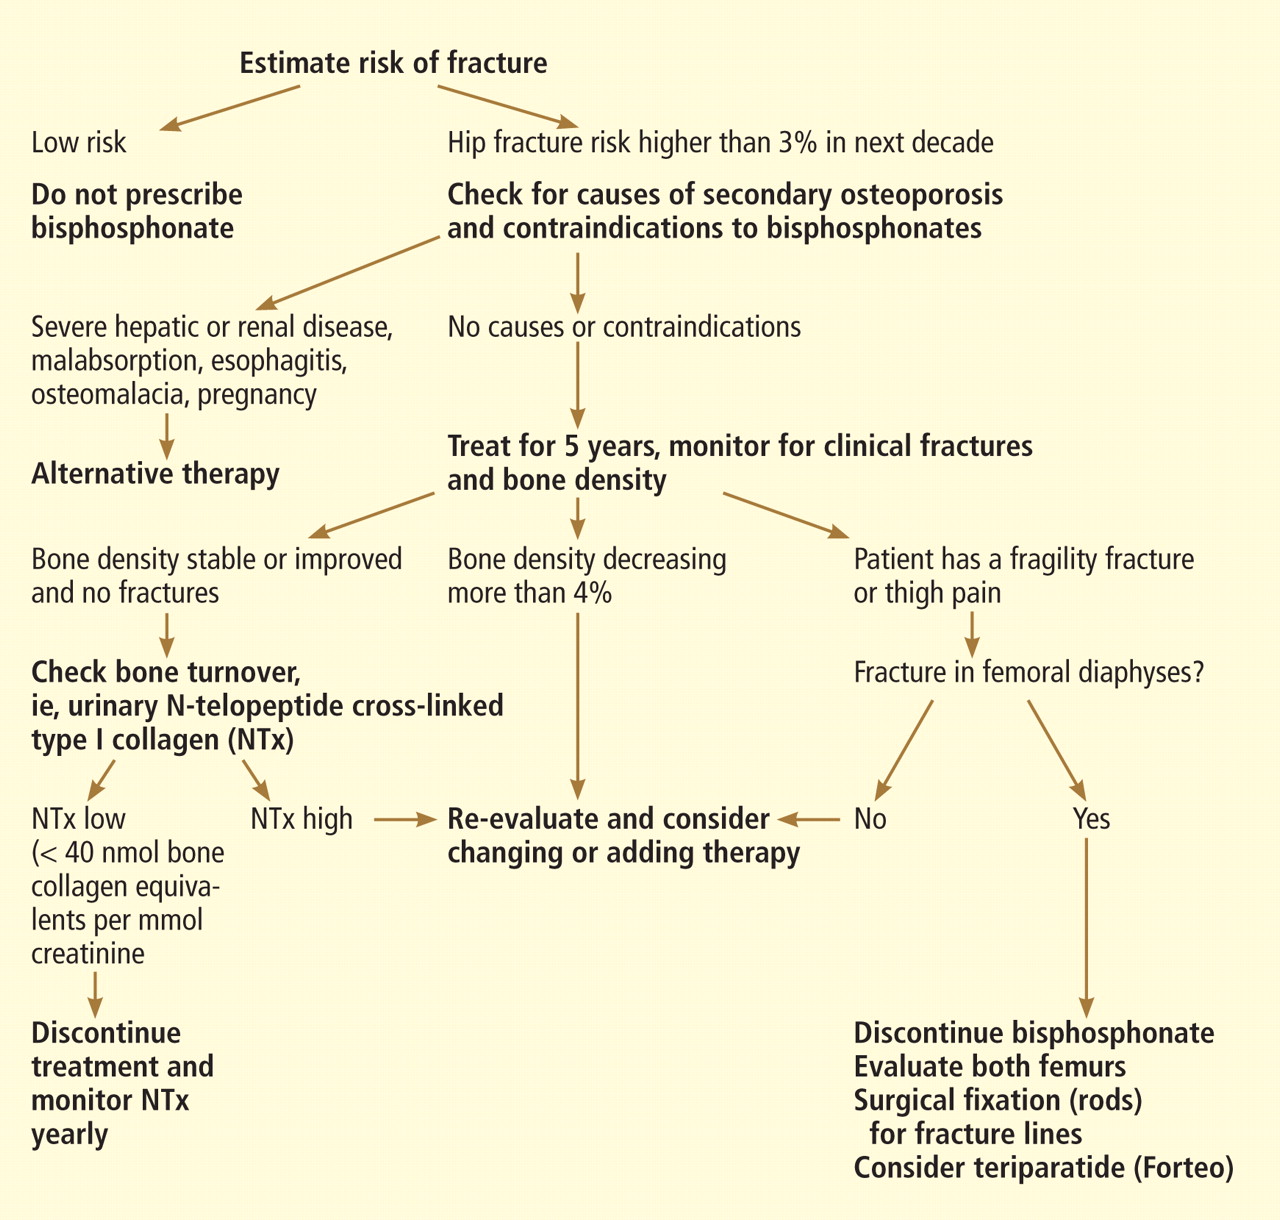
While awaiting better studies, we use the approach shown in the algorithm in Figure 4.
Follow the patient with bone resorption markers
In patients who have shown some improvement in bone density during 5 years of bisphosphonate treatment and who have not had any fractures, I measure a marker of bone resorption at the end of 5 years.
The use of a biochemical marker to assess patients treated with anti-turnover drugs has not been studied in a formal trial, so we have no grade A evidence for recommending it. However, there have been many papers describing the effects of bisphosphonates on these markers, and it makes physiologic sense to use them in situations where decisions must be made when there is not enough evidence.
In FIT (a trial of alendronate), we reported that the change in bone turnover markers was significantly related to the reduction in fracture risk, and the effect was at least as strong as that observed with a 1-year change in bone density. Those with a 30% decrease in bone alkaline phosphatase had a significant reduction in fracture risk.51
Furthermore, in those patients who were compliant with bisphosphonate treatment, the reduction in fractures with alendronate treatment was significantly better in those who initially had a high bone turnover.52
Similarly, with risedronate, the change in NTx accounted for half of the effect on fracture reduction during the clinical trial, and there was little further improvement in fracture benefit below a decrease of 35% to 40%.10
The baseline NTx level in these clinical trials was about 70 nmol bone collagen equivalents per millimole of creatinine (nmol BCE/mmol Cr) in the risedronate study and 60 in the alendronate study, and in both the fracture reduction was seen at a level of about 40. The FLEX study measured NTx after 5 years, and the average was 19 nmol BCE/mmol Cr. This increased to 22 after 3 years without alendronate.53 At 5 years, the turnover markers had gradually increased but were still 7% to 24% lower than baseline.10
These markers have a diurnal rhythm and daily variation, but despite these limitations they do help identify low bone resorption.
In our hospital, NTx is the most economical marker, and my patients prefer a urine sample to a blood test. Therefore, we measure the NTx and consider values lower than 40 nmol BCE/mmol Cr to be satisfactory.
If the NTx is as low as expected, I discontinue the bisphosphonate. The patient remains on 1,200 mg/day of calcium and 1,000 U/day vitamin D supplementation and is encouraged to exercise.
Bone density tends to be stable for 1 or 2 years after stopping a bisphosphonate, and the biochemical markers of bone resorption remain reduced for several years. We remeasure the urine NTx level annually, and if it increases to more than 40 nmol BCE/mmol Cr an antiresorptive medication is given: either the bisphosphonate is restarted or raloxifene (Evista), calcitonin (Miacalcin), or denosumab (Prolia) is used.
Bone density is less helpful, but reassuring
Bone density is less helpful because it decreases even though the markers of bone resorption remain low. Although one could argue that bone density is not helpful in monitoring patients on therapy, I think it is reassuring to know the patient is not excessively losing bone.
Checking at 2-year intervals is reasonable. If the bone density shows a consistent decrease greater than 6% (which is greater than the difference we can see from patients walking around the room), then we would re-evaluate the patient and consider adding another medication.
If the bone density decreases but the biomarkers are low, then clinical judgment must be used. The bone density result may be erroneous due to different positioning or different regions of interest.
If turnover markers are not reduced
If a patient has been prescribed a bisphosphonate for 5 years but the NTx level is not reduced, I reevaluate the patient. Some are not taking the medication or are not taking it properly. The absorption of oral bisphosphonates is quite low in terms of bioavailability, and this decreases to nearly zero if the medication is taken with food. Some patients may have another disease, such as hyperparathyroidism, malignancy, hyperthyroidism, weight loss, malabsorption, celiac sprue, or vitamin D deficiency.
If repeated biochemical tests show high bone resorption and if the bone density response is suboptimal without a secondary cause, I often switch to an intravenous form of bisphosphonate because some patients do not seem to absorb the oral doses.
If a patient has had a fracture
If a patient has had a fracture despite several years of bisphosphonate therapy, I first check for any other medical problems. The bone markers are, unfortunately, not very helpful because they increase after a fracture and stay elevated for at least 4 months.54 If there are no contraindications, treatment with teriparatide (Forteo) is a reasonable choice. There is evidence from human biopsy studies that teriparatide can reduce the number of microcracks that were related to bisphosphonate treatment,13 and can increase the bone formation rate even when there has been prior bisphosphonate treatment.55–57 Although the anabolic response is blunted, it is still there.58
If the patient remains at high risk
A frail patient with a high risk of fracture presents a challenge, especially one who needs treatment with glucocorticoids or who still has a hip T score below −3. Many physicians are uneasy about discontinuing all osteoporosis-specific drugs, even after 5 years of successful bisphosphonate treatment. In these patients anabolic medications make the most sense. Currently, teriparatide is the only one available, but others are being developed. Bone becomes resistant to the anabolic effects of teriparatide after about 18 months, so this drug cannot be used indefinitely. What we really need are longer-lasting anabolic medicines!
If the patient has thigh pain
Finally, in patients with thigh pain, radiography of the femur should be done to check for a stress fracture. Magnetic resonance imaging or computed tomography may be needed to diagnose a hairline fracture.
If there are already radiographic changes that precede the atypical fractures, then bisphosphonates should be discontinued. In a follow-up observational study of 16 patients who already had one fracture, all four whose contralateral side showed a fracture line (the “dreaded black line”) eventually completed the fracture.59
Another study found that five of six incomplete fractures went on to a complete fracture if not surgically stabilized with rods.60 This is an indication for prophylactic rodding of the femur.
Teriparatide use and rodding of a femur with thickening but not a fracture line must be decided on an individual basis and should be considered more strongly in those with pain in the thigh.
- Francis MD, Valent DJ. Historical perspectives on the clinical development of bisphosphonates in the treatment of bone diseases. J Musculoskelet Neuronal Interact 2007; 7:2–8.
- Bilezikian JP. Efficacy of bisphosphonates in reducing fracture risk in postmenopausal osteoporosis. Am J Med 2009; 122(suppl 2):S14–S21.
- Siris ES, Pasquale MK, Wang Y, Watts NB. Estimating bisphosphonate use and fracture reduction among US women aged 45 years and older, 2001–2008. J Bone Miner Res 2011; 26:3–11.
- Russell RG, Xia Z, Dunford JE, et al. Bisphosphonates: an update on mechanisms of action and how these relate to clinical efficacy. Ann N Y Acad Sci 2007; 1117:209–257.
- Parfitt AM. Misconceptions (2): turnover is always higher in cancellous than in cortical bone. Bone 2002; 30:807–809.
- Han ZH, Palnitkar S, Rao DS, Nelson D, Parfitt AM. Effects of ethnicity and age or menopause on the remodeling and turnover of iliac bone: implications for mechanisms of bone loss. J Bone Miner Res 1997; 12:498–508.
- Chavassieux PM, Arlot ME, Reda C, Wei L, Yates AJ, Meunier PJ. Histomorphometric assessment of the long-term effects of alendronate on bone quality and remodeling in patients with osteoporosis. J Clin Invest 1997; 100:1475–1480.
- Chapurlat RD, Arlot M, Burt-Pichat B, et al. Microcrack frequency and bone remodeling in postmenopausal osteoporotic women on long-term bisphosphonates: a bone biopsy study. J Bone Miner Res 2007; 22:1502–1509.
- Boivin G, Meunier PJ. Effects of bisphosphonates on matrix mineralization. J Musculoskelet Neuronal Interact 2002; 2:538–543.
- Black DM, Schwartz AV, Ensrud KE, et al; FLEX Research Group. Effects of continuing or stopping alendronate after 5 years of treatment: the Fracture Intervention Trial Long-term Extension (FLEX): a randomized trial. JAMA 2006; 296:2927–2938.
- Eastell R, Hannon RA, Garnero P, Campbell MJ, Delmas PD. Relationship of early changes in bone resorption to the reduction in fracture risk with risedronate: review of statistical analysis. J Bone Miner Res 2007; 22:1656–1660.
- Borah B, Dufresne TE, Chmielewski PA, Johnson TD, Chines A, Manhart MD. Risedronate preserves bone architecture in postmenopausal women with osteoporosis as measured by three-dimensional microcomputed tomography. Bone 2004; 34:736–746.
- Stepan JJ, Dobnig H, Burr DB, et al. Histomorphometric changes by teriparatide in alendronate pre-treated women with osteoporosis (abstract). Presented at the Annual Meeting of the American Society of Bone and Mineral Research, Montreal 2008: #1019.
- Riggs BL, Hodgson SF, O’Fallon WM, et al. Effect of fluoride treatment on the fracture rate in postmenopausal women with osteoporosis. N Engl J Med 1990; 322:802–809.
- Curtis JR, Westfall AO, Cheng H, Delzell E, Saag KG. Risk of hip fracture after bisphosphonate discontinuation: implications for a drug holiday. Osteoporos Int 2008; 19:1613–1620.
- Meijer WM, Penning-van Beest FJ, Olson M, Herings RM. Relationship between duration of compliant bisphosphonate use and the risk of osteoporotic fractures. Curr Med Res Opin 2008; 24:3217–3222.
- Mellström DD, Sörensen OH, Goemaere S, Roux C, Johnson TD, Chines AA. Seven years of treatment with risedronate in women with postmenopausal osteoporosis. Calcif Tissue Int 2004; 75:462–468.
- Reginster J, Minne HW, Sorensen OH, et al. Randomized trial of the effects of risedronate on vertebral fractures in women with established postmenopausal osteoporosis. Vertebral Efficacy with Risedronate Therapy (VERT) Study Group. Osteoporos Int 2000; 11:83–91.
- Bone HG, Hosking D, Devogelaer JP, et al; Alendronate Phase III Osteoporosis Treatment Study Group. Ten years’ experience with alendronate for osteoporosis in postmenopausal women. N Engl J Med 2004; 350:1189–1199.
- Liberman UA, Weiss SR, Bröll J, et al. Effect of oral alendronate on bone mineral density and the incidence of fractures in postmenopausal osteoporosis. The Alendronate Phase III Osteoporosis Treatment Study Group. N Engl J Med 1995; 333:1437–1443.
- Black DM, Cummings SR, Karpf DB, et al; Fracture Intervention Trial Research Group. Randomised trial of effect of alendronate on risk of fracture in women with existing vertebral fractures. Lancet 1996; 348:1535–1541.
- Cummings SR, Black DM, Thompson DE, et al. Effect of alendronate on risk of fracture in women with low bone density but without vertebral fractures: results from the Fracture Intervention Trial. JAMA 1998; 280:2077–2082.
- Fink HA, Milavetz DL, Palermo L, et al. What proportion of incident radiographic vertebral deformities is clinically diagnosed and vice versa? J Bone Miner Res 2005; 20:1216–1222.
- Watts NB, Diab DL. Long-term use of bisphosphonates in osteoporosis. J Clin Endocrinol Metab 2010; 95:1555–1565.
- Schwartz AV, Bauer DC, Cummings SR, et al; FLEX Research Group. Efficacy of continued alendronate for fractures in women with and without prevalent vertebral fracture: the FLEX trial. J Bone Miner Res 2010; 25:976–982.
- Shane E. Evolving data about subtrochanteric fractures and bisphosphonates (editorial). N Engl J Med 2010; 362:1825–1827.
- Sellmeyer DE. Atypical fractures as a potential complication of long-term bisphosphonate therapy. JAMA 2010; 304:1480–1484.
- Shane E, Burr D, Ebeling PR, et al; American Society for Bone and Mineral Research. Atypical subtrochanteric and diaphyseal femoral fractures: report of a task force of the American Society for Bone and Mineral Research. J Bone Miner Res 2010; 25:2267–2294.
- Giusti A, Hamdy NA, Papapoulos SE. Atypical fractures of the femur and bisphosphonate therapy: a systematic review of case/case series studies. Bone 2010; 47:169–180.
- Rizzoli R, Akesson K, Bouxsein M, et al. Subtrochanteric fractures after long-term treatment with bisphosphonates: a European Society on Clinical and Economic Aspects of Osteoporosis and Osteoarthritis, and International Osteoporosis Foundation Working Group Report. Osteoporos Int 2011; 22:373–390.
- Whyte MP. Atypical femoral fractures, bisphosphonates, and adult hypophosphatasia. J Bone Miner Res 2009; 24:1132–1134.
- Armamento-Villareal R, Napoli N, Panwar V, Novack D. Suppressed bone turnover during alendronate therapy for high-turnover osteoporosis. N Engl J Med 2006; 355:2048–2050.
- Neviaser AS, Lane JM, Lenart BA, Edobor-Osula F, Lorich DG. Low-energy femoral shaft fractures associated with alendronate use. J Orthop Trauma 2008; 22:346–350.
- Isaacs JD, Shidiak L, Harris IA, Szomor ZL. Femoral insufficiency fractures associated with prolonged bisphosphonate therapy. Clin Orthop Relat Res 2010; 468:3384–3392.
- Schilcher J, Aspenberg P. Incidence of stress fractures of the femoral shaft in women treated with bisphosphonate. Acta Orthop 2009; 80:413–415.
- Abrahamsen B, Eiken P, Eastell R. Cumulative alendronate dose and the long-term absolute risk of subtrochanteric and diaphyseal femur fractures: a register-based national cohort analysis. J Clin Endocrinol Metab 2010; 95:5258–5265.
- Kim SY, Schneeweiss S, Katz JN, Levin R, Solomon DH. Oral bisphosphonates and risk of subtrochanteric or diaphyseal femur fractures in a population-based cohort. J Bone Miner Res 2010. [Epub ahead of print]
- Spangler L, Ott SM, Scholes D. Utility of automated data in identifying femoral shaft and subtrochanteric (diaphyseal) fractures. Osteoporos Int. 2010. [Epub ahead of print]
- Black DM, Kelly MP, Genant HK, et al; Fracture Intervention Trial Steering Committee; HORIZON Pivotal Fracture Trial Steering Committee. Bisphosphonates and fractures of the subtrochanteric or diaphyseal femur. N Engl J Med 2010; 362:1761–1771.
- Park-Wyllie LY, Mamdani MM, Juurlink DN, et al. Bisphosphonate use and the risk of subtrochanteric or femoral shaft fractures in older women. JAMA 2011; 305:783–789.
- Green J, Czanner G, Reeves G, Watson J, Wise L, Beral V. Oral bisphosphonates and risk of cancer of oesophagus, stomach, and colorectum: case-control analysis within a UK primary care cohort. BMJ 2010; 341:c4444.
- Cardwell CR, Abnet CC, Cantwell MM, Murray LJ. Exposure to oral bisphosphonates and risk of esophageal cancer. JAMA 2010; 304:657–663.
- Stopeck AT, Lipton A, Body JJ, et al. Denosumab compared with zoledronic acid for the treatment of bone metastases in patients with advanced breast cancer: a randomized, double-blind study. J Clin Oncol 2010; 28:5132–5139.
- Khosla S, Burr D, Cauley J, et al; American Society for Bone and Mineral Research. Bisphosphonate-associated osteonecrosis of the jaw: report of a task force of the American Society for Bone and Mineral Research. J Bone Miner Res 2007; 22:1479–1491.
- Schousboe JT, Ensrud KE, Nyman JA, Kane RL, Melton LJ. Cost-effectiveness of vertebral fracture assessment to detect prevalent vertebral deformity and select postmenopausal women with a femoral neck T-score > −2.5 for alendronate therapy: a modeling study. J Clin Densitom 2006; 9:133–143.
- Dawson-Hughes B; National Osteoporosis Foundation Guide Committee. A revised clinician’s guide to the prevention and treatment of osteoporosis. J Clin Endocrinol Metab 2008; 93:2463–2465.
- Compston J, Cooper A, Cooper C, et al; the National Osteoporosis Guideline Group (NOGG). Guidelines for the diagnosis and management of osteoporosis in postmenopausal women and men from the age of 50 years in the UK. Maturitas 2009; 62:105–108.
- Cummings SR. A 55-year-old woman with osteopenia. JAMA 2006; 296:2601–2610.
- Khosla S, Melton LJ. Clinical practice. Osteopenia. N Engl J Med 2007; 356:2293–2300.
- McClung MR. Osteopenia: to treat or not to treat? Ann Intern Med 2005; 142:796–797.
- Bauer DC, Black DM, Garnero P, et al; Fracture Intervention Trial Study Group. Change in bone turnover and hip, non-spine, and vertebral fracture in alendronate-treated women: the fracture intervention trial. J Bone Miner Res 2004; 19:1250–1258.
- Bauer DC, Garnero P, Hochberg MC, et al; for the Fracture Intervention Research Group. Pretreatment levels of bone turnover and the anti-fracture efficacy of alendronate: the fracture intervention trial. J Bone Miner Res 2006; 21:292–299.
- Ensrud KE, Barrett-Connor EL, Schwartz A, et al; Fracture Intervention Trial Long-Term Extension Research Group. Randomized trial of effect of alendronate continuation versus discontinuation in women with low BMD: results from the Fracture Intervention Trial long-term extension. J Bone Miner Res 2004; 19:1259–1269.
- Ivaska KK, Gerdhem P, Akesson K, Garnero P, Obrant KJ. Effect of fracture on bone turnover markers: a longitudinal study comparing marker levels before and after injury in 113 elderly women. J Bone Miner Res 2007; 22:1155–1164.
- Cosman F, Nieves JW, Zion M, Barbuto N, Lindsay R. Retreatment with teriparatide one year after the first teriparatide course in patients on continued long-term alendronate. J Bone Miner Res 2009; 24:1110–1115.
- Jobke B, Pfeifer M, Minne HW. Teriparatide following bisphosphonates: initial and long-term effects on microarchitecture and bone remodeling at the human iliac crest. Connect Tissue Res 2009; 50:46–54.
- Miller PD, Delmas PD, Lindsay R, et al; Open-label Study to Determine How Prior Therapy with Alendronate or Risedronate in Postmenopausal Women with Osteoporosis Influences the Clinical Effectiveness of Teriparatide Investigators. Early responsiveness of women with osteoporosis to teriparatide after therapy with alendronate or risedronate. J Clin Endocrinol Metab 2008; 93:3785–3793.
- Ettinger B, San Martin J, Crans G, Pavo I. Differential effects of teriparatide on BMD after treatment with raloxifene or alendronate. J Bone Miner Res 2004; 19:745–751.
- Koh JS, Goh SK, Png MA, Kwek EB, Howe TS. Femoral cortical stress lesions in long-term bisphosphonate therapy: a herald of impending fracture? J Orthop Trauma 2010; 24:75–81.
- Banffy MB, Vrahas MS, Ready JE, Abraham JA. Nonoperative versus prophylactic treatment of bisphosphonate-associated femoral stress fractures. Clin Orthop Relat Res 2011; 469:2028–2034.
Almost all the data about the safety and efficacy of bisphosphonate drugs for treating osteoporosis are from patients who took them for less than 5 years.
Reports of adverse effects with prolonged use have caused concern about the long-term safety of this class of drugs. This is particularly important because these drugs are retained in the skeleton longer than 10 years, because there are physiologic reasons why excessive bisphosphonate-induced inhibition of bone turnover could be damaging, and because many healthy postmenopausal women have been prescribed bisphosphonates in the hope of preventing fractures that are not expected to occur for 20 to 30 years.
Because information from trials is scant, opinions differ over whether bisphosphonates should be continued indefinitely. In this article, I summarize the physiologic mechanisms of these drugs, review the scant existing data about their effects beyond 5 years, and describe my approach to bisphosphonate therapy (while waiting for better evidence).
MORE THAN 4 MILLION WOMEN TAKE BISPHOSPHONATES
The first medical use of a bisphosphonate was in 1967, when a girl with myositis ossificans was given etidronate (Didronel) because it inhibited mineralization. Two years later, it was given to patients with Paget disease of bone because it was found to inhibit bone resorption.1 Etidronate could not be given for longer than 6 months, however, because patients developed osteomalacia.
Adding a nitrogen to the molecule dramatically increased its potency and led to the second generation of bisphosphonates. Alendronate (Fosamax), the first amino-bisphosphonate, became available in 1995, It was followed by risedronate (Actonel), ibandronate (Boniva), and zoledronic acid (Reclast). These drugs are potent inhibitors of bone resorption; however, in clinical doses they do not inhibit mineralization and therefore do not cause osteomalacia.
Randomized clinical trials involving more than 30,000 patients have provided grade A evidence that these drugs reduce the incidence of fragility fractures in patients with osteoporosis.2 Furthermore, observational studies have confirmed that they prevent fractures and have a good safety profile in clinical practice.
Therefore, the use of these drugs has become common. In 2008, an estimated 4 million women in the United States were taking them.3
BISPHOSPHONATES STRENGTHEN BONE BY INHIBITING RESORPTION
On a molecular level, bisphosphonates inhibit farnesyl pyrophosphate synthase, an enzyme necessary for formation of the cytoskeleton in osteoclasts. Thus, they strongly inhibit bone resorption. They do not appear to directly inhibit osteoblasts, the cells that form new bone, but they substantially decrease bone formation indirectly.4
To understand how inhibition of bone resorption affects bone physiology, it is necessary to appreciate the nature of bone remodeling. Bone is not like the skin, which is continually forming a new layer and sloughing off the old. Instead, bone is renewed in small units. It takes about 5 years to remodel cancellous bone and 13 years to remodel cortical bone5; at any one time, about 8% of the surface is being remodeled.
The first step occurs at a spot on the surface, where the osteoclasts resorb some bone to form a pit that looks like a pothole. Then a team of osteoblasts is formed and fills the pit with new bone over the next 3 to 6 months. When first formed, the new bone is mainly collagen and, like the tip of the nose, is not very stiff, but with mineral deposition the bone becomes stronger, like the bridge of the nose. The new bone gradually accumulates mineral and becomes harder and denser over the next 3 years.
When a bisphosphonate is given, the osteoclasts abruptly stop resorbing the bone, but osteoblasts continue to fill the pits that were there when the bisphosphonate was started. For the next several months, while the previous pits are being filled, the bone volume increases slightly. Thereafter, rates of both bone resorption and bone formation are very low.
A misconception: Bisphosphonates build bone
While semantically it is true that the bone formation rate in patients taking bisphosphonates is within the normal premenopausal range, this often-repeated statement is essentially misleading.
With continued bisphosphonate use, the bone gradually becomes more dense. There is no further new bone, but the existing bone matrix is packed more tightly with mineral crystals.9 The old bone is not resorbed. The bone density, measured radiographically, increases most rapidly during the first 6 months (while resorption pits are filling in) and more gradually over the next 3 years (while bone is becoming more mineralized).
Another common misunderstanding is that the bone density increases because the drugs are “building bone.” After 3 years, the bone density in the femur reaches a plateau.10 I have seen patients who were very worried because their bone density was no longer increasing, and their physicians did not realize that this is the expected pattern. The spinal bone density continues to increase modestly, but some of this may be from disk space narrowing, harder bone edges, and soft-tissue calcifications. Spinal bone density frequently increases even in those on placebo.
Bisphosphonates suppress markers of bone turnover
These changes in bone remodeling with bisphosphonates are reflected by changes in markers of bone formation and resorption. The levels of markers of bone resorption—N-telopeptide cross-linked type I collagen (NTx) and C-telopeptide cross-linked type I collagen (CTx)—decrease rapidly and remain low. The markers of bone formation—propeptide of type I collagen, bone alkaline phosphatase, and osteocalcin—decrease gradually over 3 to 6 months and then remain low. As measured directly at the bone, bone formation appears to be more suppressed than as measured by biochemical markers in the serum.
In a risedronate trial,11 the fracture rate decreased as the biochemical markers of bone turnover decreased, except when the markers were very low, in which case the fracture rate increased.
Without remodeling, cracks can accumulate
The bisphosphonates do not significantly increase bone volume, but they prevent microscopic architectural deterioration of the bone, as shown on microscopic computed tomographic imaging.12 This prevents fractures for at least 5 years.
But bisphosphonates may have long-term negative effects. One purpose of bone remodeling is to refresh the bone and to repair the microscopic damage that accumulates within any structure. Without remodeling, cracks can accumulate. Because the development and repair of microcracks is complex, it is difficult to predict what will happen with long-term bisphosphonate use. Studies of biopsies from women taking bisphosphonates long-term are inconsistent: one study found accumulation of microcracks,13 but another did not.8
STUDIES OF LONG-TERM USE: FOCUS ON FRACTURES
For this review, I consider long-term bisphosphonate use to be greater than 5 years, and I will focus on fractures. Bone density is only a surrogate end point. Unfortunately, this fact is often not emphasized in the training of young physicians.
The best illustration of this point was in a randomized clinical trial of fluoride,14 in which the bone density of the treated group increased by 8% per year for 4 years, for a total increase of 32%. This is more than we ever see with current therapies. But the patients had more fractures with fluoride than with placebo. This is because the quality of bone produced after fluoride treatment is poor, and although the bone is denser, it is weaker.
Observational studies of fracture incidence in patients who continued taking bisphosphonates compared with those who stopped provide some weak evidence about long-term effectiveness.
Curtis et al15 found, in 9,063 women who were prescribed bisphosphonates, that those who stopped taking them during the first 2 years had higher rates of hip fracture than compliant patients. Those who took bisphosphonates for 3 years and then stopped had a rate of hip fracture during the next year similar to that of those who continued taking the drugs.
Meijer et al16 used a database in the Netherlands to examine the fracture rates in 14,750 women who started taking a bisphosphonate for osteoporosis between 1996 and 2004. More than half of the women stopped taking the drug during the first year, and they served as the control group. Those who took bisphosphonates for 3 to 4 years had significantly fewer fractures than those who stopped during the first year (odds ratio 0.54). However, those who took them for 5 to 6 years had slightly more fractures than those who took them for less than a year.
Mellström et al17 performed a 2-year uncontrolled extension of a 5-year trial of risedronate that had blinded controls.18 Initially, 407 women were in the risedronate group; 68 completed 7 years.
The vertebral fracture rate in the placebo group was 7.6% per year during years 0 through 3. In the risedronate group, the rate was 4.7% per year during years 0 through 3 and 3.8% per year during years 6 and 7. Nonvertebral fractures occurred in 10.9% of risedronate-treated patients during the first 3 years and in 6% during the last 2 years. Markers of bone turnover remained reduced throughout the 7 years. Bone mineral density of the spine and hip did not change from years 5 to 7. The study did not include those who took risedronate for 5 years and then discontinued it.
Bone et al19 performed a similar, 10-year uncontrolled extension of a 3-year controlled trial of alendronate.20 There were 398 patients randomly assigned to alendronate, and 164 remained in the study for 8 to 10 years.
During years 8 through 10, bone mineral density of the spine increased by about 2%; no change was seen in the hip or total body. The nonvertebral fracture rate was similar in years 0 through 3 and years 6 through 10. Vertebral fractures occurred in approximately 3% of women in the first 3 years and in 9% in the last 5 years.
The FLEX trial: Continuing alendronate vs stopping
Only one study compared continuing a bisphosphonate vs stopping it. The Fracture Intervention Trial Long-Term Extension (FLEX)10 was an extension of the Fracture Intervention Trial (FIT)21,22 of alendronate. I am reviewing this study in detail because it is the only one that randomized patients and was double-blinded.
In the original trial,21,22 3,236 women were in the alendronate group. After a mean of 5 years on alendronate, 1,099 of them were randomized into the alendronate or placebo group.10 Those with T scores lower than −3.5 or who had lost bone density during the first 5 years were excluded.
The bone mineral density of the hip in the placebo group decreased by 3.4%, whereas in the alendronate group it decreased by 1.0%. At the spine, the placebo group gained less than the alendronate group.
Despite these differences in bone density, no significant difference was noted in the rates of all clinical fractures, nonvertebral fractures, vertebral fractures as measured on radiographs taken for the study (“morphometric” fractures, 11.3% vs 9.8%), or in the number of severe vertebral fractures (those with more than a two-grade change on radiography) between those who took alendronate for 10 years and those who took it for 5 years followed by placebo for 5 years.
However, fewer “clinical spine fractures” were observed in the group continuing alendronate (2.4% vs 5.3%). A clinical spine fracture was one diagnosed by the patient’s personal physician.
In FIT, these clinical fractures were painful in 90% of patients, and although the community radiographs were reviewed by a central radiologist, only 73% of the fractures were confirmed by subsequent measurements on the per protocol radiographs done at the study centers. About one-fourth of the morphometric fractures were also clinical fractures.23 Therefore, I think morphometric fractures provide the best evidence about the effects of treatment—ie, that treatment beyond 5 years is not beneficial. Other physicians, however, disagree, emphasizing the 55% reduction in clinical fractures.24
Markers of bone turnover gradually increased after discontinuation but remained lower than baseline even after 5 years without alendronate.10 There were no significant differences in fracture rates between the placebo and alendronate groups in those with baseline bone mineral density T scores less than −2.5.10 Also, after age adjustment, the fracture incidence was similar in the FIT and the FLEX studies.
Several years later, the authors published a post hoc subgroup analysis of these data.25 The patients were divided into six subgroups based on bone density and the presence of vertebral fractures at baseline. This is weak evidence, but I include it because reviews in the literature have emphasized only the positive findings, or have misquoted the data: Schwartz et al stated that in those with T scores of −2.5 or below, the risk of nonvertebral fracture was reduced by 50%25; and Shane26 concluded in an editorial that the use of alendronate for 10 years, rather than for 5 years, was associated with significantly fewer new vertebral fractures and nonvertebral fractures in patients with a bone mineral density T score of −2.5 or below.26
ATYPICAL FEMUR FRACTURES
By March 2011, there were 55 papers describing a total of 283 cases, and about 85 individual cases (listed online in Ott SM. Osteoporosis and Bone Physiology. http://courses.washington.edu/bonephys/opsubtroch.html. Accessed 7/30/2011).
The mean age of the patients was 65, bisphosphonate use was longer than 5 years in 77% of cases, and bilateral fractures were seen in 48%.
The fractures occur with minor trauma, such as tripping, stepping off an elevator, or being jolted by a subway stop, and a disproportionate number of cases involve no trauma. They are often preceded by leg pain, typically in the mid-thigh.
These fractures are characterized by radiographic findings of a transverse fracture, with thickened cortices near the site of the fracture. Often, there is a peak on the cortex that may precede the fracture. These fractures initiate on the lateral side, and it is striking that they occur in the same horizontal plane on the contralateral side.
Radiographs and bone scans show stress fractures on the lateral side of the femur that resemble Looser zones (ie, dark lines seen radiographically). These radiographic features are not typical in osteoporosis but are reminiscent of the stress fractures seen with hypophosphatasia, an inherited disease characterized by severely decreased bone formation.31
Bone biopsy specimens show very low bone formation rates, but this is not a necessary feature. At the fracture site itself there is bone activity. For example, pathologists from St. Louis reviewed all iliac crest bone biopsies from patients seen between 2004 and 2007 who had an unusual cortical fracture while taking a bisphosphonate. An absence of double tetracycline labels was seen in 11 of the 16 patients.32
The first reports were anecdotal cases, then some centers reported systematic surveys of their patients. In a key report, Neviaser et al33 reviewed all low-trauma subtrochanteric fractures in their large hospital and found 20 cases with the atypical radiographic appearance; 19 of the patients in these cases had been taking a bisphosphonate. A similar survey in Australia found 41 cases with atypical radiographic features (out of 79 subtrochanteric low-trauma fractures), and all of the patients had been taking a bisphosphonate.34
By now, more than 230 cases have been reported. The estimated incidence is 1 in 1,000, based on a review of operative cases and radiographs.35
However, just because the drugs are associated with the fractures does not mean they caused the fractures, because the patients who took bisphosphonates were more likely to get a fracture in the first place. This confounding by indication makes it difficult to prove beyond a doubt that bisphosphonates cause atypical fractures.
Further, some studies have found no association between bisphosphonates and subtrochanteric fractures.36,37 These database analyses have relied on the coding of the International Classification of Diseases, Ninth Revision (ICD-9), and not on the examination of radiographs. We reviewed the ability of ICD-9 codes to identify subtrochanteric fractures and found that the predictive ability was only 36%.38 Even for fractures in the correct location, the codes cannot tell which cases have the typical spiral or comminuted fractures seen in osteoporosis and which have the unusual features of the bisphosphonate-associated fractures. Subtrochanteric and shaft fractures are about 10 times less common than hip fractures, and the atypical ones are about 10 times less common than typical ones, so studies based on ICD-9 codes cannot exonerate bisphosphonates.
A report of nearly 15,000 patients from randomized clinical trials did not find a significant incidence of subtrochanteric fractures, but the radiographs were not examined and only 500 of the patients had taken the medication for longer than 5 years.39
A population-based, nested case-control study using a database from Ontario, Canada, found an increased risk of diaphyseal femoral fractures in patients who had taken bisphosphonates longer than 5 years. The study included only women who had started bisphosphonates when they were older than 68, so many of the atypical fractures would have been missed. The investigators did not review the radiographs, so they combined both osteoporotic and atypical diaphyseal fractures in their analysis.40
At the 2010 meeting of the American Society for Bone and Mineral Research, preliminary data were presented from a systematic review of radiographs of patients with fractures of the femur from a health care plan with data about the use of medications. The incidence of atypical fractures increased progressively with the duration of bisphosphonate use, and was significantly higher after 5 years compared with less than 3 years.28
OTHER POSSIBLE ADVERSE EFFECTS
There have been conflicting reports about esophageal cancer with bisphosphonate use.41,42
Another possible adverse effect, osteonecrosis of the jaw, may have occurred in 1.4% of patients with cancer who were treated for 3 years with high intravenous doses of bisphosphonates (about 10 to 12 times the doses recommended for osteoporosis).43 This adverse effect is rare in patients with osteoporosis, occurring in less than 1 in 10,000 exposed patients.44
BISPHOSPHONATES SHOULD BE USED WHEN THEY ARE INDICATED
The focus of this paper is on the duration of use, but concern about long-term use should not discourage physicians or patients from using these drugs when there is a high risk of an osteoporotic fracture within the next 10 years, particularly in elderly patients who have experienced a vertebral compression fracture or a hip fracture. Patients with a vertebral fracture have a one-in-five chance of fracturing another vertebra, which is a far higher risk than any of the known long-term side effects from treatment, and bisphosphonates are effective at reducing the risk.
Low bone density alone can be used as an indication for bisphosphonates if the hip T score is lower than −2.5. A cost-effectiveness study concluded that alendronate was beneficial in these cases.45 In the FIT patients without a vertebral fracture at baseline, the overall fracture rate was significantly decreased by 36% with alendronate in those with a hip T score lower than −2.5, but there was no difference between placebo and alendronate in those with T scores between −2 and −2.5, and a 14% (nonsignificant) higher fracture rate when the T score was better than −2.0.22
A new method of calculating the risk of an osteoporotic fracture is the FRAX prediction tool (http://www.shef.ac.uk/FRAX), and one group has suggested that treatment is indicated when the 10-year risk of a hip fracture is greater than 3%.46 Another group, from the United Kingdom, suggests using a sliding scale depending on the fracture risk and the age.47
It is not always clear what to do when the hip fracture risk is greater than 3% for the next decade but the T score is better than −2.5. These patients have other factors that contribute to fracture risk. Their therapy must be individualized, and if they are at risk of fracture because of low weight, smoking, or alcohol use, it makes more sense to focus the approach on those treatable factors.
Women who have osteopenia and have not had a fragility fracture are often treated with bisphosphonates with the intent of preventing osteoporosis in the distant future. This approach is based on hope, not evidence, and several editorial reviews have concluded that these women do not need drug therapy.48–50
MY RECOMMENDATION: STOP AFTER 5 YEARS
Bisphosphonates reduce the incidence of devastating osteoporotic fractures in patients with osteoporosis, but that does not mean they should be used indefinitely.
After 5 years, the overall fracture risk is the same in patients who keep taking bisphosphonates as in patients who discontinue them. Therefore, I think these drugs are no longer necessary after 5 years. The post hoc subgroup analysis that showed benefit in only one of six groups of the FLEX study does not provide compelling evidence to continue taking bisphosphonates.
While awaiting better studies, we use the approach shown in the algorithm in Figure 4.
Follow the patient with bone resorption markers
In patients who have shown some improvement in bone density during 5 years of bisphosphonate treatment and who have not had any fractures, I measure a marker of bone resorption at the end of 5 years.
The use of a biochemical marker to assess patients treated with anti-turnover drugs has not been studied in a formal trial, so we have no grade A evidence for recommending it. However, there have been many papers describing the effects of bisphosphonates on these markers, and it makes physiologic sense to use them in situations where decisions must be made when there is not enough evidence.
In FIT (a trial of alendronate), we reported that the change in bone turnover markers was significantly related to the reduction in fracture risk, and the effect was at least as strong as that observed with a 1-year change in bone density. Those with a 30% decrease in bone alkaline phosphatase had a significant reduction in fracture risk.51
Furthermore, in those patients who were compliant with bisphosphonate treatment, the reduction in fractures with alendronate treatment was significantly better in those who initially had a high bone turnover.52
Similarly, with risedronate, the change in NTx accounted for half of the effect on fracture reduction during the clinical trial, and there was little further improvement in fracture benefit below a decrease of 35% to 40%.10
The baseline NTx level in these clinical trials was about 70 nmol bone collagen equivalents per millimole of creatinine (nmol BCE/mmol Cr) in the risedronate study and 60 in the alendronate study, and in both the fracture reduction was seen at a level of about 40. The FLEX study measured NTx after 5 years, and the average was 19 nmol BCE/mmol Cr. This increased to 22 after 3 years without alendronate.53 At 5 years, the turnover markers had gradually increased but were still 7% to 24% lower than baseline.10
These markers have a diurnal rhythm and daily variation, but despite these limitations they do help identify low bone resorption.
In our hospital, NTx is the most economical marker, and my patients prefer a urine sample to a blood test. Therefore, we measure the NTx and consider values lower than 40 nmol BCE/mmol Cr to be satisfactory.
If the NTx is as low as expected, I discontinue the bisphosphonate. The patient remains on 1,200 mg/day of calcium and 1,000 U/day vitamin D supplementation and is encouraged to exercise.
Bone density tends to be stable for 1 or 2 years after stopping a bisphosphonate, and the biochemical markers of bone resorption remain reduced for several years. We remeasure the urine NTx level annually, and if it increases to more than 40 nmol BCE/mmol Cr an antiresorptive medication is given: either the bisphosphonate is restarted or raloxifene (Evista), calcitonin (Miacalcin), or denosumab (Prolia) is used.
Bone density is less helpful, but reassuring
Bone density is less helpful because it decreases even though the markers of bone resorption remain low. Although one could argue that bone density is not helpful in monitoring patients on therapy, I think it is reassuring to know the patient is not excessively losing bone.
Checking at 2-year intervals is reasonable. If the bone density shows a consistent decrease greater than 6% (which is greater than the difference we can see from patients walking around the room), then we would re-evaluate the patient and consider adding another medication.
If the bone density decreases but the biomarkers are low, then clinical judgment must be used. The bone density result may be erroneous due to different positioning or different regions of interest.
If turnover markers are not reduced
If a patient has been prescribed a bisphosphonate for 5 years but the NTx level is not reduced, I reevaluate the patient. Some are not taking the medication or are not taking it properly. The absorption of oral bisphosphonates is quite low in terms of bioavailability, and this decreases to nearly zero if the medication is taken with food. Some patients may have another disease, such as hyperparathyroidism, malignancy, hyperthyroidism, weight loss, malabsorption, celiac sprue, or vitamin D deficiency.
If repeated biochemical tests show high bone resorption and if the bone density response is suboptimal without a secondary cause, I often switch to an intravenous form of bisphosphonate because some patients do not seem to absorb the oral doses.
If a patient has had a fracture
If a patient has had a fracture despite several years of bisphosphonate therapy, I first check for any other medical problems. The bone markers are, unfortunately, not very helpful because they increase after a fracture and stay elevated for at least 4 months.54 If there are no contraindications, treatment with teriparatide (Forteo) is a reasonable choice. There is evidence from human biopsy studies that teriparatide can reduce the number of microcracks that were related to bisphosphonate treatment,13 and can increase the bone formation rate even when there has been prior bisphosphonate treatment.55–57 Although the anabolic response is blunted, it is still there.58
If the patient remains at high risk
A frail patient with a high risk of fracture presents a challenge, especially one who needs treatment with glucocorticoids or who still has a hip T score below −3. Many physicians are uneasy about discontinuing all osteoporosis-specific drugs, even after 5 years of successful bisphosphonate treatment. In these patients anabolic medications make the most sense. Currently, teriparatide is the only one available, but others are being developed. Bone becomes resistant to the anabolic effects of teriparatide after about 18 months, so this drug cannot be used indefinitely. What we really need are longer-lasting anabolic medicines!
If the patient has thigh pain
Finally, in patients with thigh pain, radiography of the femur should be done to check for a stress fracture. Magnetic resonance imaging or computed tomography may be needed to diagnose a hairline fracture.
If there are already radiographic changes that precede the atypical fractures, then bisphosphonates should be discontinued. In a follow-up observational study of 16 patients who already had one fracture, all four whose contralateral side showed a fracture line (the “dreaded black line”) eventually completed the fracture.59
Another study found that five of six incomplete fractures went on to a complete fracture if not surgically stabilized with rods.60 This is an indication for prophylactic rodding of the femur.
Teriparatide use and rodding of a femur with thickening but not a fracture line must be decided on an individual basis and should be considered more strongly in those with pain in the thigh.
- Francis MD, Valent DJ. Historical perspectives on the clinical development of bisphosphonates in the treatment of bone diseases. J Musculoskelet Neuronal Interact 2007; 7:2–8.
- Bilezikian JP. Efficacy of bisphosphonates in reducing fracture risk in postmenopausal osteoporosis. Am J Med 2009; 122(suppl 2):S14–S21.
- Siris ES, Pasquale MK, Wang Y, Watts NB. Estimating bisphosphonate use and fracture reduction among US women aged 45 years and older, 2001–2008. J Bone Miner Res 2011; 26:3–11.
- Russell RG, Xia Z, Dunford JE, et al. Bisphosphonates: an update on mechanisms of action and how these relate to clinical efficacy. Ann N Y Acad Sci 2007; 1117:209–257.
- Parfitt AM. Misconceptions (2): turnover is always higher in cancellous than in cortical bone. Bone 2002; 30:807–809.
- Han ZH, Palnitkar S, Rao DS, Nelson D, Parfitt AM. Effects of ethnicity and age or menopause on the remodeling and turnover of iliac bone: implications for mechanisms of bone loss. J Bone Miner Res 1997; 12:498–508.
- Chavassieux PM, Arlot ME, Reda C, Wei L, Yates AJ, Meunier PJ. Histomorphometric assessment of the long-term effects of alendronate on bone quality and remodeling in patients with osteoporosis. J Clin Invest 1997; 100:1475–1480.
- Chapurlat RD, Arlot M, Burt-Pichat B, et al. Microcrack frequency and bone remodeling in postmenopausal osteoporotic women on long-term bisphosphonates: a bone biopsy study. J Bone Miner Res 2007; 22:1502–1509.
- Boivin G, Meunier PJ. Effects of bisphosphonates on matrix mineralization. J Musculoskelet Neuronal Interact 2002; 2:538–543.
- Black DM, Schwartz AV, Ensrud KE, et al; FLEX Research Group. Effects of continuing or stopping alendronate after 5 years of treatment: the Fracture Intervention Trial Long-term Extension (FLEX): a randomized trial. JAMA 2006; 296:2927–2938.
- Eastell R, Hannon RA, Garnero P, Campbell MJ, Delmas PD. Relationship of early changes in bone resorption to the reduction in fracture risk with risedronate: review of statistical analysis. J Bone Miner Res 2007; 22:1656–1660.
- Borah B, Dufresne TE, Chmielewski PA, Johnson TD, Chines A, Manhart MD. Risedronate preserves bone architecture in postmenopausal women with osteoporosis as measured by three-dimensional microcomputed tomography. Bone 2004; 34:736–746.
- Stepan JJ, Dobnig H, Burr DB, et al. Histomorphometric changes by teriparatide in alendronate pre-treated women with osteoporosis (abstract). Presented at the Annual Meeting of the American Society of Bone and Mineral Research, Montreal 2008: #1019.
- Riggs BL, Hodgson SF, O’Fallon WM, et al. Effect of fluoride treatment on the fracture rate in postmenopausal women with osteoporosis. N Engl J Med 1990; 322:802–809.
- Curtis JR, Westfall AO, Cheng H, Delzell E, Saag KG. Risk of hip fracture after bisphosphonate discontinuation: implications for a drug holiday. Osteoporos Int 2008; 19:1613–1620.
- Meijer WM, Penning-van Beest FJ, Olson M, Herings RM. Relationship between duration of compliant bisphosphonate use and the risk of osteoporotic fractures. Curr Med Res Opin 2008; 24:3217–3222.
- Mellström DD, Sörensen OH, Goemaere S, Roux C, Johnson TD, Chines AA. Seven years of treatment with risedronate in women with postmenopausal osteoporosis. Calcif Tissue Int 2004; 75:462–468.
- Reginster J, Minne HW, Sorensen OH, et al. Randomized trial of the effects of risedronate on vertebral fractures in women with established postmenopausal osteoporosis. Vertebral Efficacy with Risedronate Therapy (VERT) Study Group. Osteoporos Int 2000; 11:83–91.
- Bone HG, Hosking D, Devogelaer JP, et al; Alendronate Phase III Osteoporosis Treatment Study Group. Ten years’ experience with alendronate for osteoporosis in postmenopausal women. N Engl J Med 2004; 350:1189–1199.
- Liberman UA, Weiss SR, Bröll J, et al. Effect of oral alendronate on bone mineral density and the incidence of fractures in postmenopausal osteoporosis. The Alendronate Phase III Osteoporosis Treatment Study Group. N Engl J Med 1995; 333:1437–1443.
- Black DM, Cummings SR, Karpf DB, et al; Fracture Intervention Trial Research Group. Randomised trial of effect of alendronate on risk of fracture in women with existing vertebral fractures. Lancet 1996; 348:1535–1541.
- Cummings SR, Black DM, Thompson DE, et al. Effect of alendronate on risk of fracture in women with low bone density but without vertebral fractures: results from the Fracture Intervention Trial. JAMA 1998; 280:2077–2082.
- Fink HA, Milavetz DL, Palermo L, et al. What proportion of incident radiographic vertebral deformities is clinically diagnosed and vice versa? J Bone Miner Res 2005; 20:1216–1222.
- Watts NB, Diab DL. Long-term use of bisphosphonates in osteoporosis. J Clin Endocrinol Metab 2010; 95:1555–1565.
- Schwartz AV, Bauer DC, Cummings SR, et al; FLEX Research Group. Efficacy of continued alendronate for fractures in women with and without prevalent vertebral fracture: the FLEX trial. J Bone Miner Res 2010; 25:976–982.
- Shane E. Evolving data about subtrochanteric fractures and bisphosphonates (editorial). N Engl J Med 2010; 362:1825–1827.
- Sellmeyer DE. Atypical fractures as a potential complication of long-term bisphosphonate therapy. JAMA 2010; 304:1480–1484.
- Shane E, Burr D, Ebeling PR, et al; American Society for Bone and Mineral Research. Atypical subtrochanteric and diaphyseal femoral fractures: report of a task force of the American Society for Bone and Mineral Research. J Bone Miner Res 2010; 25:2267–2294.
- Giusti A, Hamdy NA, Papapoulos SE. Atypical fractures of the femur and bisphosphonate therapy: a systematic review of case/case series studies. Bone 2010; 47:169–180.
- Rizzoli R, Akesson K, Bouxsein M, et al. Subtrochanteric fractures after long-term treatment with bisphosphonates: a European Society on Clinical and Economic Aspects of Osteoporosis and Osteoarthritis, and International Osteoporosis Foundation Working Group Report. Osteoporos Int 2011; 22:373–390.
- Whyte MP. Atypical femoral fractures, bisphosphonates, and adult hypophosphatasia. J Bone Miner Res 2009; 24:1132–1134.
- Armamento-Villareal R, Napoli N, Panwar V, Novack D. Suppressed bone turnover during alendronate therapy for high-turnover osteoporosis. N Engl J Med 2006; 355:2048–2050.
- Neviaser AS, Lane JM, Lenart BA, Edobor-Osula F, Lorich DG. Low-energy femoral shaft fractures associated with alendronate use. J Orthop Trauma 2008; 22:346–350.
- Isaacs JD, Shidiak L, Harris IA, Szomor ZL. Femoral insufficiency fractures associated with prolonged bisphosphonate therapy. Clin Orthop Relat Res 2010; 468:3384–3392.
- Schilcher J, Aspenberg P. Incidence of stress fractures of the femoral shaft in women treated with bisphosphonate. Acta Orthop 2009; 80:413–415.
- Abrahamsen B, Eiken P, Eastell R. Cumulative alendronate dose and the long-term absolute risk of subtrochanteric and diaphyseal femur fractures: a register-based national cohort analysis. J Clin Endocrinol Metab 2010; 95:5258–5265.
- Kim SY, Schneeweiss S, Katz JN, Levin R, Solomon DH. Oral bisphosphonates and risk of subtrochanteric or diaphyseal femur fractures in a population-based cohort. J Bone Miner Res 2010. [Epub ahead of print]
- Spangler L, Ott SM, Scholes D. Utility of automated data in identifying femoral shaft and subtrochanteric (diaphyseal) fractures. Osteoporos Int. 2010. [Epub ahead of print]
- Black DM, Kelly MP, Genant HK, et al; Fracture Intervention Trial Steering Committee; HORIZON Pivotal Fracture Trial Steering Committee. Bisphosphonates and fractures of the subtrochanteric or diaphyseal femur. N Engl J Med 2010; 362:1761–1771.
- Park-Wyllie LY, Mamdani MM, Juurlink DN, et al. Bisphosphonate use and the risk of subtrochanteric or femoral shaft fractures in older women. JAMA 2011; 305:783–789.
- Green J, Czanner G, Reeves G, Watson J, Wise L, Beral V. Oral bisphosphonates and risk of cancer of oesophagus, stomach, and colorectum: case-control analysis within a UK primary care cohort. BMJ 2010; 341:c4444.
- Cardwell CR, Abnet CC, Cantwell MM, Murray LJ. Exposure to oral bisphosphonates and risk of esophageal cancer. JAMA 2010; 304:657–663.
- Stopeck AT, Lipton A, Body JJ, et al. Denosumab compared with zoledronic acid for the treatment of bone metastases in patients with advanced breast cancer: a randomized, double-blind study. J Clin Oncol 2010; 28:5132–5139.
- Khosla S, Burr D, Cauley J, et al; American Society for Bone and Mineral Research. Bisphosphonate-associated osteonecrosis of the jaw: report of a task force of the American Society for Bone and Mineral Research. J Bone Miner Res 2007; 22:1479–1491.
- Schousboe JT, Ensrud KE, Nyman JA, Kane RL, Melton LJ. Cost-effectiveness of vertebral fracture assessment to detect prevalent vertebral deformity and select postmenopausal women with a femoral neck T-score > −2.5 for alendronate therapy: a modeling study. J Clin Densitom 2006; 9:133–143.
- Dawson-Hughes B; National Osteoporosis Foundation Guide Committee. A revised clinician’s guide to the prevention and treatment of osteoporosis. J Clin Endocrinol Metab 2008; 93:2463–2465.
- Compston J, Cooper A, Cooper C, et al; the National Osteoporosis Guideline Group (NOGG). Guidelines for the diagnosis and management of osteoporosis in postmenopausal women and men from the age of 50 years in the UK. Maturitas 2009; 62:105–108.
- Cummings SR. A 55-year-old woman with osteopenia. JAMA 2006; 296:2601–2610.
- Khosla S, Melton LJ. Clinical practice. Osteopenia. N Engl J Med 2007; 356:2293–2300.
- McClung MR. Osteopenia: to treat or not to treat? Ann Intern Med 2005; 142:796–797.
- Bauer DC, Black DM, Garnero P, et al; Fracture Intervention Trial Study Group. Change in bone turnover and hip, non-spine, and vertebral fracture in alendronate-treated women: the fracture intervention trial. J Bone Miner Res 2004; 19:1250–1258.
- Bauer DC, Garnero P, Hochberg MC, et al; for the Fracture Intervention Research Group. Pretreatment levels of bone turnover and the anti-fracture efficacy of alendronate: the fracture intervention trial. J Bone Miner Res 2006; 21:292–299.
- Ensrud KE, Barrett-Connor EL, Schwartz A, et al; Fracture Intervention Trial Long-Term Extension Research Group. Randomized trial of effect of alendronate continuation versus discontinuation in women with low BMD: results from the Fracture Intervention Trial long-term extension. J Bone Miner Res 2004; 19:1259–1269.
- Ivaska KK, Gerdhem P, Akesson K, Garnero P, Obrant KJ. Effect of fracture on bone turnover markers: a longitudinal study comparing marker levels before and after injury in 113 elderly women. J Bone Miner Res 2007; 22:1155–1164.
- Cosman F, Nieves JW, Zion M, Barbuto N, Lindsay R. Retreatment with teriparatide one year after the first teriparatide course in patients on continued long-term alendronate. J Bone Miner Res 2009; 24:1110–1115.
- Jobke B, Pfeifer M, Minne HW. Teriparatide following bisphosphonates: initial and long-term effects on microarchitecture and bone remodeling at the human iliac crest. Connect Tissue Res 2009; 50:46–54.
- Miller PD, Delmas PD, Lindsay R, et al; Open-label Study to Determine How Prior Therapy with Alendronate or Risedronate in Postmenopausal Women with Osteoporosis Influences the Clinical Effectiveness of Teriparatide Investigators. Early responsiveness of women with osteoporosis to teriparatide after therapy with alendronate or risedronate. J Clin Endocrinol Metab 2008; 93:3785–3793.
- Ettinger B, San Martin J, Crans G, Pavo I. Differential effects of teriparatide on BMD after treatment with raloxifene or alendronate. J Bone Miner Res 2004; 19:745–751.
- Koh JS, Goh SK, Png MA, Kwek EB, Howe TS. Femoral cortical stress lesions in long-term bisphosphonate therapy: a herald of impending fracture? J Orthop Trauma 2010; 24:75–81.
- Banffy MB, Vrahas MS, Ready JE, Abraham JA. Nonoperative versus prophylactic treatment of bisphosphonate-associated femoral stress fractures. Clin Orthop Relat Res 2011; 469:2028–2034.
KEY POINTS
- Bisphosphonates reduce the risk of osteoporotic fractures, including devastating hip and spine fractures.
- As with any drugs, bisphosphonates should not be used indiscriminately. They are indicated for patients at high risk of fracture, especially those with vertebral fractures or a hip bone density T score lower than −2.5.
- There is little evidence to guide physicians about the duration of bisphosphonate therapy beyond 5 years. One study with marginal power did not show any difference in fracture rates between those who continued taking alendronate and those who discontinued after 5 years (JAMA 2006; 296:2927–2938).
- Evidence is accumulating that the risk of atypical fracture of the femur increases after 5 years of bisphosphonate use.
- Anabolic drugs are needed; the only one currently available is teriparatide (Forteo), which can be used when fractures occur despite (or perhaps because of) bisphosphonate use.