Rivaroxaban noninferior to warfarin in AF patients

Article Type
Changed
Display Headline
Rivaroxaban noninferior to warfarin in AF patients

A large, multicenter, randomized study of 14, 264 patients at risk for stroke with nonvalvular atrial fibrillation (AF) found the factor Xa inhibitor rivaroxaban to be noninferior to warfarin for preventing stroke or systemic embolism.

The ROCKET AF investigators, who reported the results online August 10 in The New England Journal of Medicine, detected no significant difference between rivaroxaban and warfarin in the rates of major or nonmajor clinically relevant bleeding.

Investigators at 1178 study sites in 45 countries randomly assigned the patients to receive either fixed-dose rivaroxaban at 20 mg daily or adjusted-dose warfarin to a target of INR 2.0 – 3.0. Patients with a creatinine clearance of 30-49 mL/minute received a rivaroxaban dose of 15 mg daily.

Patients in both arms of the intent-to-treat population were a median age of 73 years and about 40% were women. The patients had considerable rates of coexisting conditions, including 90.5% with hypertension, 62.5% with heart failure, and 54.8% who had had a previous stroke, embolism, or transient ischemic attack.

After a median treatment duration of 590 days, the primary efficacy analysis showed188 patients (1.7% per year) in the rivaroxaban group had a stroke or systemic embolism, compared with 241 patients (2.2% per year) in the warfarin group (P<0.001 for noninferiority).

Rates of major bleeding were similar in the 2 groups—3.6% with rivaroxaban and 3.4% with warfarin (P=0.58). Major and clinically relevant nonmajor bleeding occurred in 1475 (14.9%) rivaroxaban-treated patients and 1449 (14.5%) warfarin-treated patients (P=0.44). Intracranial and fatal bleeding occurred less often in the rivaroxaban group.

The investigators noted that the warfarin-treated patients were in therapeutic range a mean of 55% of the time. However, the efficacy of rivaroxaban was as favorable in those centers with the best INR control as it was in those with inferior control.

Lead author Manesh R. Patel, MD, of Duke University School of Medicine in North Carolina, said, “Warfarin has been a standard treatment for decades, but requires a rigorous monitoring schedule to ensure therapeutic dosing levels, and is subject to the potential of food and drug interactions that present treatment obstacles for patients and doctors alike.”

He indicated that the result of the trial “have convincingly shown rivaroxaban to be an alternative to warfarin in treating patients with atrial fibrillation, and importantly, with no increase in bleeding.”

The study was funded by Johnson & Johnson and Bayer.

ROCKET AF stands for Rivaroxaban Once Daily Oral Direct Factor Xa Inhibition Compared with Vitamin K Antagonist for Prevention of Stroke and Embolism Trial in Atrial Fibrillation.

Publications
Topics

A large, multicenter, randomized study of 14, 264 patients at risk for stroke with nonvalvular atrial fibrillation (AF) found the factor Xa inhibitor rivaroxaban to be noninferior to warfarin for preventing stroke or systemic embolism.

The ROCKET AF investigators, who reported the results online August 10 in The New England Journal of Medicine, detected no significant difference between rivaroxaban and warfarin in the rates of major or nonmajor clinically relevant bleeding.

Investigators at 1178 study sites in 45 countries randomly assigned the patients to receive either fixed-dose rivaroxaban at 20 mg daily or adjusted-dose warfarin to a target of INR 2.0 – 3.0. Patients with a creatinine clearance of 30-49 mL/minute received a rivaroxaban dose of 15 mg daily.

Patients in both arms of the intent-to-treat population were a median age of 73 years and about 40% were women. The patients had considerable rates of coexisting conditions, including 90.5% with hypertension, 62.5% with heart failure, and 54.8% who had had a previous stroke, embolism, or transient ischemic attack.

After a median treatment duration of 590 days, the primary efficacy analysis showed188 patients (1.7% per year) in the rivaroxaban group had a stroke or systemic embolism, compared with 241 patients (2.2% per year) in the warfarin group (P<0.001 for noninferiority).

Rates of major bleeding were similar in the 2 groups—3.6% with rivaroxaban and 3.4% with warfarin (P=0.58). Major and clinically relevant nonmajor bleeding occurred in 1475 (14.9%) rivaroxaban-treated patients and 1449 (14.5%) warfarin-treated patients (P=0.44). Intracranial and fatal bleeding occurred less often in the rivaroxaban group.

The investigators noted that the warfarin-treated patients were in therapeutic range a mean of 55% of the time. However, the efficacy of rivaroxaban was as favorable in those centers with the best INR control as it was in those with inferior control.

Lead author Manesh R. Patel, MD, of Duke University School of Medicine in North Carolina, said, “Warfarin has been a standard treatment for decades, but requires a rigorous monitoring schedule to ensure therapeutic dosing levels, and is subject to the potential of food and drug interactions that present treatment obstacles for patients and doctors alike.”

He indicated that the result of the trial “have convincingly shown rivaroxaban to be an alternative to warfarin in treating patients with atrial fibrillation, and importantly, with no increase in bleeding.”

The study was funded by Johnson & Johnson and Bayer.

ROCKET AF stands for Rivaroxaban Once Daily Oral Direct Factor Xa Inhibition Compared with Vitamin K Antagonist for Prevention of Stroke and Embolism Trial in Atrial Fibrillation.

A large, multicenter, randomized study of 14, 264 patients at risk for stroke with nonvalvular atrial fibrillation (AF) found the factor Xa inhibitor rivaroxaban to be noninferior to warfarin for preventing stroke or systemic embolism.

The ROCKET AF investigators, who reported the results online August 10 in The New England Journal of Medicine, detected no significant difference between rivaroxaban and warfarin in the rates of major or nonmajor clinically relevant bleeding.

Investigators at 1178 study sites in 45 countries randomly assigned the patients to receive either fixed-dose rivaroxaban at 20 mg daily or adjusted-dose warfarin to a target of INR 2.0 – 3.0. Patients with a creatinine clearance of 30-49 mL/minute received a rivaroxaban dose of 15 mg daily.

Patients in both arms of the intent-to-treat population were a median age of 73 years and about 40% were women. The patients had considerable rates of coexisting conditions, including 90.5% with hypertension, 62.5% with heart failure, and 54.8% who had had a previous stroke, embolism, or transient ischemic attack.

After a median treatment duration of 590 days, the primary efficacy analysis showed188 patients (1.7% per year) in the rivaroxaban group had a stroke or systemic embolism, compared with 241 patients (2.2% per year) in the warfarin group (P<0.001 for noninferiority).

Rates of major bleeding were similar in the 2 groups—3.6% with rivaroxaban and 3.4% with warfarin (P=0.58). Major and clinically relevant nonmajor bleeding occurred in 1475 (14.9%) rivaroxaban-treated patients and 1449 (14.5%) warfarin-treated patients (P=0.44). Intracranial and fatal bleeding occurred less often in the rivaroxaban group.

The investigators noted that the warfarin-treated patients were in therapeutic range a mean of 55% of the time. However, the efficacy of rivaroxaban was as favorable in those centers with the best INR control as it was in those with inferior control.

Lead author Manesh R. Patel, MD, of Duke University School of Medicine in North Carolina, said, “Warfarin has been a standard treatment for decades, but requires a rigorous monitoring schedule to ensure therapeutic dosing levels, and is subject to the potential of food and drug interactions that present treatment obstacles for patients and doctors alike.”

He indicated that the result of the trial “have convincingly shown rivaroxaban to be an alternative to warfarin in treating patients with atrial fibrillation, and importantly, with no increase in bleeding.”

The study was funded by Johnson & Johnson and Bayer.

ROCKET AF stands for Rivaroxaban Once Daily Oral Direct Factor Xa Inhibition Compared with Vitamin K Antagonist for Prevention of Stroke and Embolism Trial in Atrial Fibrillation.

Publications
Publications
Topics
Article Type
Display Headline
Rivaroxaban noninferior to warfarin in AF patients
Display Headline
Rivaroxaban noninferior to warfarin in AF patients
Disallow All Ads
Content Gating
No Gating (article Unlocked/Free)
Alternative CME
Disqus Comments
Default
Use ProPublica

Out of Control

Article Type
Changed
Display Headline
Out of Control

That the largest-ever study of glucose control in U.S. hospitals found roughly 1 in 3 patients are hyperglycemic (<180 mg/dL) during their hospital stay is no surprise to hospitalist Cheryl O'Malley, MD, FACP, program director of internal medicine at the Banner Good Samaritan Medical Center, Phoenix.

The data (PDF), based on point-of-care bedside glucose tests at 575 hospitals, showed hyperglycemia in 32.2% of ICU patients and 32% in non-ICU patients. Dr. O'Malley says the findings are further evidence that HM leaders have a duty to focus on glycemic control because so many of their patients are hyperglycemic.

Dr. O'Malley does her part as a mentor for SHM's Glycemic Control Mentored Initiative (GCMI) program, which recently expanded to a second cohort of 96 sites. The mentoring program has branched out to include nurses, physician assistants, and even two leading endocrinologists as mentors: Emory University School of Medicine's Guillermo Umpierrez, MD, FACP, FACE, and HealthPartners' John MacIndoe, MD.

SHM also has launched a microsite, dubbed eQUIPS (Electronic Quality Improvement Programs), which gives HM groups not involved in the mentoring program access to data analysis, benchmarking tools, and other services.

Kendall M. Rogers, MD, CPE, FACP, SFHM, associate professor of medicine and hospital medicine division chief at the University of New Mexico Health Sciences Center's Department of Internal Medicine, says SHM has always wanted to broaden the program to as many hospitals and physicians as possible to battle glycemic-control issues. And bringing in nationally respected endocrinologists as mentors furthers the goal to build "teams of experts within local hospitals."

"Hospitalists, endocrinologists, and other specialists have to work together," Dr. O'Malley adds. "The volume of work is just too much for any one group to bear."

Issue
The Hospitalist - 2011(08)
Publications
Sections

That the largest-ever study of glucose control in U.S. hospitals found roughly 1 in 3 patients are hyperglycemic (<180 mg/dL) during their hospital stay is no surprise to hospitalist Cheryl O'Malley, MD, FACP, program director of internal medicine at the Banner Good Samaritan Medical Center, Phoenix.

The data (PDF), based on point-of-care bedside glucose tests at 575 hospitals, showed hyperglycemia in 32.2% of ICU patients and 32% in non-ICU patients. Dr. O'Malley says the findings are further evidence that HM leaders have a duty to focus on glycemic control because so many of their patients are hyperglycemic.

Dr. O'Malley does her part as a mentor for SHM's Glycemic Control Mentored Initiative (GCMI) program, which recently expanded to a second cohort of 96 sites. The mentoring program has branched out to include nurses, physician assistants, and even two leading endocrinologists as mentors: Emory University School of Medicine's Guillermo Umpierrez, MD, FACP, FACE, and HealthPartners' John MacIndoe, MD.

SHM also has launched a microsite, dubbed eQUIPS (Electronic Quality Improvement Programs), which gives HM groups not involved in the mentoring program access to data analysis, benchmarking tools, and other services.

Kendall M. Rogers, MD, CPE, FACP, SFHM, associate professor of medicine and hospital medicine division chief at the University of New Mexico Health Sciences Center's Department of Internal Medicine, says SHM has always wanted to broaden the program to as many hospitals and physicians as possible to battle glycemic-control issues. And bringing in nationally respected endocrinologists as mentors furthers the goal to build "teams of experts within local hospitals."

"Hospitalists, endocrinologists, and other specialists have to work together," Dr. O'Malley adds. "The volume of work is just too much for any one group to bear."

That the largest-ever study of glucose control in U.S. hospitals found roughly 1 in 3 patients are hyperglycemic (<180 mg/dL) during their hospital stay is no surprise to hospitalist Cheryl O'Malley, MD, FACP, program director of internal medicine at the Banner Good Samaritan Medical Center, Phoenix.

The data (PDF), based on point-of-care bedside glucose tests at 575 hospitals, showed hyperglycemia in 32.2% of ICU patients and 32% in non-ICU patients. Dr. O'Malley says the findings are further evidence that HM leaders have a duty to focus on glycemic control because so many of their patients are hyperglycemic.

Dr. O'Malley does her part as a mentor for SHM's Glycemic Control Mentored Initiative (GCMI) program, which recently expanded to a second cohort of 96 sites. The mentoring program has branched out to include nurses, physician assistants, and even two leading endocrinologists as mentors: Emory University School of Medicine's Guillermo Umpierrez, MD, FACP, FACE, and HealthPartners' John MacIndoe, MD.

SHM also has launched a microsite, dubbed eQUIPS (Electronic Quality Improvement Programs), which gives HM groups not involved in the mentoring program access to data analysis, benchmarking tools, and other services.

Kendall M. Rogers, MD, CPE, FACP, SFHM, associate professor of medicine and hospital medicine division chief at the University of New Mexico Health Sciences Center's Department of Internal Medicine, says SHM has always wanted to broaden the program to as many hospitals and physicians as possible to battle glycemic-control issues. And bringing in nationally respected endocrinologists as mentors furthers the goal to build "teams of experts within local hospitals."

"Hospitalists, endocrinologists, and other specialists have to work together," Dr. O'Malley adds. "The volume of work is just too much for any one group to bear."

Issue
The Hospitalist - 2011(08)
Issue
The Hospitalist - 2011(08)
Publications
Publications
Article Type
Display Headline
Out of Control
Display Headline
Out of Control
Sections
Disallow All Ads
Content Gating
No Gating (article Unlocked/Free)

Smooth Moves

Article Type
Changed
Display Headline
Smooth Moves

A recent study in the Journal of Hospital Medicine concluded that by rescheduling fewer than 10 elective admissions per week from a weekday to a weekend, hospitals can reduce overcrowding. The report should encourage hospitalists to reconsider their own scheduling strategies, the lead author says.

"If they notice that on certain days their unit or their hospital is very crowded and on other days it's less so, it may be worth working with their organization's quality and safety or operational leadership to learn more about those patterns and see if they can improve on them," says Evan S. Fieldston, MD, MBA, MSHP, pediatric hospitalist at the Children's Hospital of Philadelphia.

The study examined 2007 daily inpatient census data from 39 tertiary-care children's hospitals. The average weekday occupancy ranged from 70.9% to 108.1%, while the average weekend occupancy ranged from 65.7% to 94.9%. After rescheduling, or "smoothing," elective admissions from days with "thresholds of high occupancy," defined as >85% occupancy, to less busy days, 39,607 patients were removed from exposure to occupancy levels greater than 95%.

Eugene Litvak, MD, president and CEO of the nonprofit Institute for Healthcare Optimization and adjunct professor of operations management at the Harvard School of Public Health in Boston, says the issue goes beyond U.S. hospitals. Dr. Litvak says he's discussed overcrowding with more than 100 hospitals in Europe, Japan, Australia, and the U.S. "In talking with their leadership in healthcare, I saw the same problem," he says.

The solution, Dr. Litvak suggests, lies with queueing theory, a mathematical formula that addresses random demand for a fixed capacity. Based on average census data, hospitals can apply queueing theory to determine how many beds and staff they need for ED admissions throughout a typical week.

Issue
The Hospitalist - 2011(08)
Publications
Sections

A recent study in the Journal of Hospital Medicine concluded that by rescheduling fewer than 10 elective admissions per week from a weekday to a weekend, hospitals can reduce overcrowding. The report should encourage hospitalists to reconsider their own scheduling strategies, the lead author says.

"If they notice that on certain days their unit or their hospital is very crowded and on other days it's less so, it may be worth working with their organization's quality and safety or operational leadership to learn more about those patterns and see if they can improve on them," says Evan S. Fieldston, MD, MBA, MSHP, pediatric hospitalist at the Children's Hospital of Philadelphia.

The study examined 2007 daily inpatient census data from 39 tertiary-care children's hospitals. The average weekday occupancy ranged from 70.9% to 108.1%, while the average weekend occupancy ranged from 65.7% to 94.9%. After rescheduling, or "smoothing," elective admissions from days with "thresholds of high occupancy," defined as >85% occupancy, to less busy days, 39,607 patients were removed from exposure to occupancy levels greater than 95%.

Eugene Litvak, MD, president and CEO of the nonprofit Institute for Healthcare Optimization and adjunct professor of operations management at the Harvard School of Public Health in Boston, says the issue goes beyond U.S. hospitals. Dr. Litvak says he's discussed overcrowding with more than 100 hospitals in Europe, Japan, Australia, and the U.S. "In talking with their leadership in healthcare, I saw the same problem," he says.

The solution, Dr. Litvak suggests, lies with queueing theory, a mathematical formula that addresses random demand for a fixed capacity. Based on average census data, hospitals can apply queueing theory to determine how many beds and staff they need for ED admissions throughout a typical week.

A recent study in the Journal of Hospital Medicine concluded that by rescheduling fewer than 10 elective admissions per week from a weekday to a weekend, hospitals can reduce overcrowding. The report should encourage hospitalists to reconsider their own scheduling strategies, the lead author says.

"If they notice that on certain days their unit or their hospital is very crowded and on other days it's less so, it may be worth working with their organization's quality and safety or operational leadership to learn more about those patterns and see if they can improve on them," says Evan S. Fieldston, MD, MBA, MSHP, pediatric hospitalist at the Children's Hospital of Philadelphia.

The study examined 2007 daily inpatient census data from 39 tertiary-care children's hospitals. The average weekday occupancy ranged from 70.9% to 108.1%, while the average weekend occupancy ranged from 65.7% to 94.9%. After rescheduling, or "smoothing," elective admissions from days with "thresholds of high occupancy," defined as >85% occupancy, to less busy days, 39,607 patients were removed from exposure to occupancy levels greater than 95%.

Eugene Litvak, MD, president and CEO of the nonprofit Institute for Healthcare Optimization and adjunct professor of operations management at the Harvard School of Public Health in Boston, says the issue goes beyond U.S. hospitals. Dr. Litvak says he's discussed overcrowding with more than 100 hospitals in Europe, Japan, Australia, and the U.S. "In talking with their leadership in healthcare, I saw the same problem," he says.

The solution, Dr. Litvak suggests, lies with queueing theory, a mathematical formula that addresses random demand for a fixed capacity. Based on average census data, hospitals can apply queueing theory to determine how many beds and staff they need for ED admissions throughout a typical week.

Issue
The Hospitalist - 2011(08)
Issue
The Hospitalist - 2011(08)
Publications
Publications
Article Type
Display Headline
Smooth Moves
Display Headline
Smooth Moves
Sections
Disallow All Ads
Content Gating
No Gating (article Unlocked/Free)

CD19-redirected T cells induce remission in CLL patients

Article Type
Changed
Display Headline
CD19-redirected T cells induce remission in CLL patients

Gene therapy with a lentiviral vector expressing a chimeric antigen receptor with specificity for CD19 (CART19) has induced complete remission in 3 patients with chronic lymphocytic leukemia (CLL), according to research published simultaneously in the August 10 issues of The New England Journal of Medicine and Science Translational Medicine.

The research team, from the University of Pennsylvania, reported that the reinfused, modified T cells expanded to more than 1000 times the initial engraftment level. The patients’ remission was ongoing at 10 months after treatment.

The investigators believe the big difference between this genetically modified T cell and previous ones that had disappointing clinical activity is the addition of the CD137 (4-1BB) costimulatory signaling domain that significantly increases antitumor activity.

The team, led by Carl June, MD, described in the NEJM article the T-cell treatment of one of the patients with advanced, p53-deficient CLL.

A half year prior to enrolling in the trial, the 64-year-old patient’s T cells were collected and frozen. Before reinfusing the T cells into the patient, the investigators thawed the cells and transduced them with lentivirus expressing CD19-specific chimeric antigen receptor.

Four days prior to reinfusion, the patient received chemotherapy with pentostatin and cyclophosphamide to deplete his lymphocytes. After 3 days of chemotherapy, his bone marrow was hypercellular with approximately 40% involvement by CLL.

After 4 days of chemotherapy, the patient received an infusion of T cells, of which 5% were transduced, totaling 1.42 x 10⁷ transduced cells, split into 3 consecutive daily infusions.

Two weeks after the infusion, the patient experienced chills, fever, and fatigue, which intensified over the subsequent days. He was diagnosed with tumor lysis syndrome on day 22 after infusion. On day 23 after the CART19-cell infusion, the patient had no evidence of CLL in the bone marrow, and by day 28, his adenopathy was not palpable.

In addition to tumor lysis syndrome, the only other grade 3/4 toxicity observed was lymphopenia.

The investigators did not expect that such a low dose of chimeric antigen receptor T cells would result in a clinically evident antitumor response. The dose was several orders of magnitude lower than that used in previous studies of modified T cells.

They speculated that the course of chemotherapy administered to the patient prior to the CART19-cell infusion may have been responsible for the increased engraftment and for “potentiating the ability of chimeric antigen receptor T cells to kill stressed tumor cells that would otherwise survive the chemotherapy.”

The researchers conclude that continued study of CD19-redirected T cells is warranted and plan to test the approach in other CD19-positive tumors, including non-Hodgkin lymphoma and acute lymphocytic leukemia.

Publications
Topics

Gene therapy with a lentiviral vector expressing a chimeric antigen receptor with specificity for CD19 (CART19) has induced complete remission in 3 patients with chronic lymphocytic leukemia (CLL), according to research published simultaneously in the August 10 issues of The New England Journal of Medicine and Science Translational Medicine.

The research team, from the University of Pennsylvania, reported that the reinfused, modified T cells expanded to more than 1000 times the initial engraftment level. The patients’ remission was ongoing at 10 months after treatment.

The investigators believe the big difference between this genetically modified T cell and previous ones that had disappointing clinical activity is the addition of the CD137 (4-1BB) costimulatory signaling domain that significantly increases antitumor activity.

The team, led by Carl June, MD, described in the NEJM article the T-cell treatment of one of the patients with advanced, p53-deficient CLL.

A half year prior to enrolling in the trial, the 64-year-old patient’s T cells were collected and frozen. Before reinfusing the T cells into the patient, the investigators thawed the cells and transduced them with lentivirus expressing CD19-specific chimeric antigen receptor.

Four days prior to reinfusion, the patient received chemotherapy with pentostatin and cyclophosphamide to deplete his lymphocytes. After 3 days of chemotherapy, his bone marrow was hypercellular with approximately 40% involvement by CLL.

After 4 days of chemotherapy, the patient received an infusion of T cells, of which 5% were transduced, totaling 1.42 x 10⁷ transduced cells, split into 3 consecutive daily infusions.

Two weeks after the infusion, the patient experienced chills, fever, and fatigue, which intensified over the subsequent days. He was diagnosed with tumor lysis syndrome on day 22 after infusion. On day 23 after the CART19-cell infusion, the patient had no evidence of CLL in the bone marrow, and by day 28, his adenopathy was not palpable.

In addition to tumor lysis syndrome, the only other grade 3/4 toxicity observed was lymphopenia.

The investigators did not expect that such a low dose of chimeric antigen receptor T cells would result in a clinically evident antitumor response. The dose was several orders of magnitude lower than that used in previous studies of modified T cells.

They speculated that the course of chemotherapy administered to the patient prior to the CART19-cell infusion may have been responsible for the increased engraftment and for “potentiating the ability of chimeric antigen receptor T cells to kill stressed tumor cells that would otherwise survive the chemotherapy.”

The researchers conclude that continued study of CD19-redirected T cells is warranted and plan to test the approach in other CD19-positive tumors, including non-Hodgkin lymphoma and acute lymphocytic leukemia.

Gene therapy with a lentiviral vector expressing a chimeric antigen receptor with specificity for CD19 (CART19) has induced complete remission in 3 patients with chronic lymphocytic leukemia (CLL), according to research published simultaneously in the August 10 issues of The New England Journal of Medicine and Science Translational Medicine.

The research team, from the University of Pennsylvania, reported that the reinfused, modified T cells expanded to more than 1000 times the initial engraftment level. The patients’ remission was ongoing at 10 months after treatment.

The investigators believe the big difference between this genetically modified T cell and previous ones that had disappointing clinical activity is the addition of the CD137 (4-1BB) costimulatory signaling domain that significantly increases antitumor activity.

The team, led by Carl June, MD, described in the NEJM article the T-cell treatment of one of the patients with advanced, p53-deficient CLL.

A half year prior to enrolling in the trial, the 64-year-old patient’s T cells were collected and frozen. Before reinfusing the T cells into the patient, the investigators thawed the cells and transduced them with lentivirus expressing CD19-specific chimeric antigen receptor.

Four days prior to reinfusion, the patient received chemotherapy with pentostatin and cyclophosphamide to deplete his lymphocytes. After 3 days of chemotherapy, his bone marrow was hypercellular with approximately 40% involvement by CLL.

After 4 days of chemotherapy, the patient received an infusion of T cells, of which 5% were transduced, totaling 1.42 x 10⁷ transduced cells, split into 3 consecutive daily infusions.

Two weeks after the infusion, the patient experienced chills, fever, and fatigue, which intensified over the subsequent days. He was diagnosed with tumor lysis syndrome on day 22 after infusion. On day 23 after the CART19-cell infusion, the patient had no evidence of CLL in the bone marrow, and by day 28, his adenopathy was not palpable.

In addition to tumor lysis syndrome, the only other grade 3/4 toxicity observed was lymphopenia.

The investigators did not expect that such a low dose of chimeric antigen receptor T cells would result in a clinically evident antitumor response. The dose was several orders of magnitude lower than that used in previous studies of modified T cells.

They speculated that the course of chemotherapy administered to the patient prior to the CART19-cell infusion may have been responsible for the increased engraftment and for “potentiating the ability of chimeric antigen receptor T cells to kill stressed tumor cells that would otherwise survive the chemotherapy.”

The researchers conclude that continued study of CD19-redirected T cells is warranted and plan to test the approach in other CD19-positive tumors, including non-Hodgkin lymphoma and acute lymphocytic leukemia.

Publications
Publications
Topics
Article Type
Display Headline
CD19-redirected T cells induce remission in CLL patients
Display Headline
CD19-redirected T cells induce remission in CLL patients
Disallow All Ads
Content Gating
No Gating (article Unlocked/Free)
Alternative CME
Disqus Comments
Default
Use ProPublica

Neuro-HM Gains Numbers, Momentum

Article Type
Changed
Display Headline
Neuro-HM Gains Numbers, Momentum

“Enter The Neurohospitalist” might sound like a medical spoof of a Bruce Lee movie, but it’s really a subspecialty’s announcement that it’s here to stay.

The clever moniker was the name of a plenary session at the 8th New York Symposium on Neurological Emergencies & Neurological Care, sponsored by Columbia University’s Center for Continuing Medical Education. The two-hour presentation on neurology’s take on HM was a new feature for the annual meeting, and to presenter David Likosky, MD, SFHM, hospitalist and stroke program director at Evergreen Hospital Medical Center in Kirkland, Wash., it was the latest sign that the field of HM is cementing its future.

“The neurohospitalist world right now is where the hospital medicine world was, say, ten, fifteen years ago,” says Dr. Likosky, who is board-certified in both neurology and internal medicine.

Multiple fields have adopted the HM model, to the point that SHM is holding its first national specialty hospitalist meeting, Focused Practice in Hospital Medicine, on Nov. 4 in Las Vegas. The meeting is designed to help promote networking of people interested in the hospitalist model in various specialties, as well as to help identify issues related to those specialties. Click here for more information and registration.

But even within the growth of speciality hospitalist models, neurology might be the cohort embracing it the fastest. Dr. Likosky estimates there are 500 neurohospitalists practicing nationwide. The Neurohospitalist Society held its first meeting earlier this year, and the field’s first textbook, which he is contributing to, is set for release in November. The Academy of Neurology has a dedicated neurohospitalist section. And the subspecialty even has its own quarterly journal, The Neurohospitalist.

There is now a critical mass of neurohospitalists. There’s also an increasing recognition by the neurointensivists that someone has to help them take care of these patients, either before they get to the unit or when they come out of the unit.


—David Likosky, MD, SFHM, hospitalist, stroke program director, Evergreen Hospital Medical Center, Kirkland, Wash.

“There is now a critical mass of neurohospitalists,” Dr. Likosky says. “There’s also an increasing recognition by the neurointensivists that someone has to help them take care of these patients, either before they get to the unit or when they come out of the unit. … Most hospitals don’t have neurointensivists, but they have very ill neurology patients. That’s another niche for neurohospitalists. All specialties of intensivists are looking for help with these patients.”

Another panelist at the four-day Manhattan conference, William D. Freeman, MD, assistant professor of neurology at the Mayo Clinic in Jacksonville, Fla., says the continued success of the field will be judged on data. He says three areas of potential “low-hanging fruit” to focus on are:

  • Increased use of intravenous tissue plasminogen activators (tPA). The FDA-approved “clot-busting therapy” has been shown to reverse the effects of ischemic stroke if given within a time-sensitive window of therapeutic opportunity.
  • Reduced length of stay for stroke patients. Adherence to best practices, Dr. Freeman says, will most effectively reduce patient stays and will be the ones that also demonstrate quality and patient-safety attributes.
  • Focus on stroke patient metrics. Administrators often focus on quality measures that are easily identifiable; Dr. Likosky says new programs have to be able to show they can meet those thresholds.

“Hospital administrators are new to the concept of a neurohospitalist,” Dr. Likosky adds. “It’s easier in that they get the hospitalist model because that’s been around for so long, but figuring out the expense of a neurohospitalist program, how that functionally works, are there enough volumes, are all questions that are being asked.”


Listen to more from Dr. Likosky

Still, Drs. Freeman and Likosky agree that the advantages of the subspecialty—everything from physicians’ quality of life to newly satisfied specialists in other departments (who will have a quicker neuro consult available)—mean the nascent specialty can continue to grow in numbers and influence.

“The future is bright for neurohospitalists,” Dr. Freeman says.


Richard Quinn is a freelance writer based in New Jersey.

 

Issue
The Hospitalist - 2011(08)
Publications
Topics
Sections

“Enter The Neurohospitalist” might sound like a medical spoof of a Bruce Lee movie, but it’s really a subspecialty’s announcement that it’s here to stay.

The clever moniker was the name of a plenary session at the 8th New York Symposium on Neurological Emergencies & Neurological Care, sponsored by Columbia University’s Center for Continuing Medical Education. The two-hour presentation on neurology’s take on HM was a new feature for the annual meeting, and to presenter David Likosky, MD, SFHM, hospitalist and stroke program director at Evergreen Hospital Medical Center in Kirkland, Wash., it was the latest sign that the field of HM is cementing its future.

“The neurohospitalist world right now is where the hospital medicine world was, say, ten, fifteen years ago,” says Dr. Likosky, who is board-certified in both neurology and internal medicine.

Multiple fields have adopted the HM model, to the point that SHM is holding its first national specialty hospitalist meeting, Focused Practice in Hospital Medicine, on Nov. 4 in Las Vegas. The meeting is designed to help promote networking of people interested in the hospitalist model in various specialties, as well as to help identify issues related to those specialties. Click here for more information and registration.

But even within the growth of speciality hospitalist models, neurology might be the cohort embracing it the fastest. Dr. Likosky estimates there are 500 neurohospitalists practicing nationwide. The Neurohospitalist Society held its first meeting earlier this year, and the field’s first textbook, which he is contributing to, is set for release in November. The Academy of Neurology has a dedicated neurohospitalist section. And the subspecialty even has its own quarterly journal, The Neurohospitalist.

There is now a critical mass of neurohospitalists. There’s also an increasing recognition by the neurointensivists that someone has to help them take care of these patients, either before they get to the unit or when they come out of the unit.


—David Likosky, MD, SFHM, hospitalist, stroke program director, Evergreen Hospital Medical Center, Kirkland, Wash.

“There is now a critical mass of neurohospitalists,” Dr. Likosky says. “There’s also an increasing recognition by the neurointensivists that someone has to help them take care of these patients, either before they get to the unit or when they come out of the unit. … Most hospitals don’t have neurointensivists, but they have very ill neurology patients. That’s another niche for neurohospitalists. All specialties of intensivists are looking for help with these patients.”

Another panelist at the four-day Manhattan conference, William D. Freeman, MD, assistant professor of neurology at the Mayo Clinic in Jacksonville, Fla., says the continued success of the field will be judged on data. He says three areas of potential “low-hanging fruit” to focus on are:

  • Increased use of intravenous tissue plasminogen activators (tPA). The FDA-approved “clot-busting therapy” has been shown to reverse the effects of ischemic stroke if given within a time-sensitive window of therapeutic opportunity.
  • Reduced length of stay for stroke patients. Adherence to best practices, Dr. Freeman says, will most effectively reduce patient stays and will be the ones that also demonstrate quality and patient-safety attributes.
  • Focus on stroke patient metrics. Administrators often focus on quality measures that are easily identifiable; Dr. Likosky says new programs have to be able to show they can meet those thresholds.

“Hospital administrators are new to the concept of a neurohospitalist,” Dr. Likosky adds. “It’s easier in that they get the hospitalist model because that’s been around for so long, but figuring out the expense of a neurohospitalist program, how that functionally works, are there enough volumes, are all questions that are being asked.”


Listen to more from Dr. Likosky

Still, Drs. Freeman and Likosky agree that the advantages of the subspecialty—everything from physicians’ quality of life to newly satisfied specialists in other departments (who will have a quicker neuro consult available)—mean the nascent specialty can continue to grow in numbers and influence.

“The future is bright for neurohospitalists,” Dr. Freeman says.


Richard Quinn is a freelance writer based in New Jersey.


“Enter The Neurohospitalist” might sound like a medical spoof of a Bruce Lee movie, but it’s really a subspecialty’s announcement that it’s here to stay.

The clever moniker was the name of a plenary session at the 8th New York Symposium on Neurological Emergencies & Neurological Care, sponsored by Columbia University’s Center for Continuing Medical Education. The two-hour presentation on neurology’s take on HM was a new feature for the annual meeting, and to presenter David Likosky, MD, SFHM, hospitalist and stroke program director at Evergreen Hospital Medical Center in Kirkland, Wash., it was the latest sign that the field of HM is cementing its future.

“The neurohospitalist world right now is where the hospital medicine world was, say, ten, fifteen years ago,” says Dr. Likosky, who is board-certified in both neurology and internal medicine.

Multiple fields have adopted the HM model, to the point that SHM is holding its first national specialty hospitalist meeting, Focused Practice in Hospital Medicine, on Nov. 4 in Las Vegas. The meeting is designed to help promote networking of people interested in the hospitalist model in various specialties, as well as to help identify issues related to those specialties. Click here for more information and registration.

But even within the growth of speciality hospitalist models, neurology might be the cohort embracing it the fastest. Dr. Likosky estimates there are 500 neurohospitalists practicing nationwide. The Neurohospitalist Society held its first meeting earlier this year, and the field’s first textbook, which he is contributing to, is set for release in November. The Academy of Neurology has a dedicated neurohospitalist section. And the subspecialty even has its own quarterly journal, The Neurohospitalist.

There is now a critical mass of neurohospitalists. There’s also an increasing recognition by the neurointensivists that someone has to help them take care of these patients, either before they get to the unit or when they come out of the unit.


—David Likosky, MD, SFHM, hospitalist, stroke program director, Evergreen Hospital Medical Center, Kirkland, Wash.

“There is now a critical mass of neurohospitalists,” Dr. Likosky says. “There’s also an increasing recognition by the neurointensivists that someone has to help them take care of these patients, either before they get to the unit or when they come out of the unit. … Most hospitals don’t have neurointensivists, but they have very ill neurology patients. That’s another niche for neurohospitalists. All specialties of intensivists are looking for help with these patients.”

Another panelist at the four-day Manhattan conference, William D. Freeman, MD, assistant professor of neurology at the Mayo Clinic in Jacksonville, Fla., says the continued success of the field will be judged on data. He says three areas of potential “low-hanging fruit” to focus on are:

  • Increased use of intravenous tissue plasminogen activators (tPA). The FDA-approved “clot-busting therapy” has been shown to reverse the effects of ischemic stroke if given within a time-sensitive window of therapeutic opportunity.
  • Reduced length of stay for stroke patients. Adherence to best practices, Dr. Freeman says, will most effectively reduce patient stays and will be the ones that also demonstrate quality and patient-safety attributes.
  • Focus on stroke patient metrics. Administrators often focus on quality measures that are easily identifiable; Dr. Likosky says new programs have to be able to show they can meet those thresholds.

“Hospital administrators are new to the concept of a neurohospitalist,” Dr. Likosky adds. “It’s easier in that they get the hospitalist model because that’s been around for so long, but figuring out the expense of a neurohospitalist program, how that functionally works, are there enough volumes, are all questions that are being asked.”


Listen to more from Dr. Likosky

Still, Drs. Freeman and Likosky agree that the advantages of the subspecialty—everything from physicians’ quality of life to newly satisfied specialists in other departments (who will have a quicker neuro consult available)—mean the nascent specialty can continue to grow in numbers and influence.

“The future is bright for neurohospitalists,” Dr. Freeman says.


Richard Quinn is a freelance writer based in New Jersey.


Issue
The Hospitalist - 2011(08)
Issue
The Hospitalist - 2011(08)
Publications
Publications
Topics
Article Type
Display Headline
Neuro-HM Gains Numbers, Momentum
Display Headline
Neuro-HM Gains Numbers, Momentum
Sections
Disallow All Ads
Content Gating
No Gating (article Unlocked/Free)

Roth Spots—More than Meets the Eye

Article Type
Changed
Display Headline
Roth spots—more than meets the eye

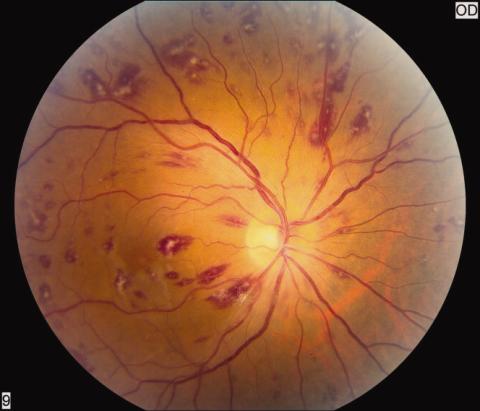
A 50‐year‐old female patient with a past medical history of Sjogren's syndrome and polymyositis presented with fever, rash, swelling, and pain in her extremities. Skin biopsy confirmed vasculitis. She was treated with steroids and azathioprine. However, she developed sudden‐onset central visual blurring in her right eye on the fifth day of hospitalization. Fundoscopic exam showed multiple central white‐centered retinal hemorrhages (Roth spots, Figures 1, 2) and vascular sheathing, consistent with retinal vasculitis. Blood cultures were negative. Transthoracic and transesophageal echocardiograms were normal. She was treated with high‐dose intravenous steroids and cyclophosphamide, with visual improvement and a marked reduction in the number of Roth spots.
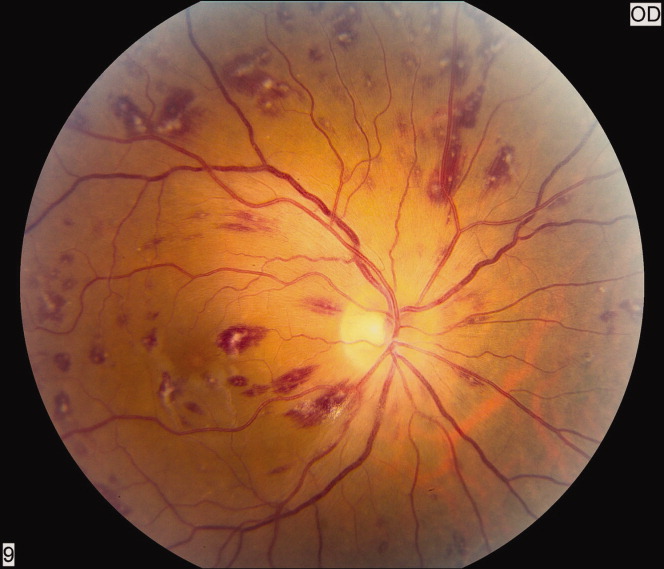
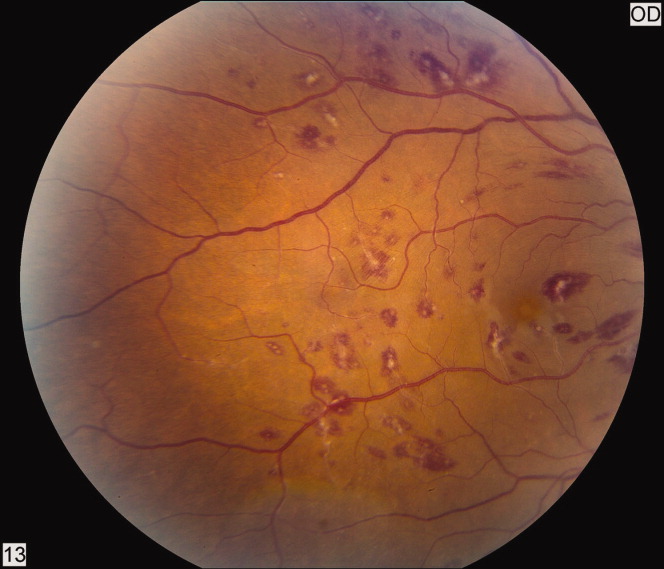
Figure 1
Fundoscopic view of macula and optic disc showing numerous Roth spots.
Figure 2
View of temporal macula with many Roth spots.

Roth spots 1 are nonspecific intraretinal hemorrhagic lesions with a white center due to fibrin deposition. Although historically associated with infective endocarditis, they can also occur in other systemic diseases such as connective tissue disorders, vasculitis, leukemia, diabetes, hypertension, anemia, trauma, as well as disseminated bacterial and fungal infections.

References
  1. Duane TD, Osher RH, Green WR.White centered hemorrhages: their significance.Ophthalmology.1980;87:6669.
Article PDF
Issue
Journal of Hospital Medicine - 6(6)
Page Number
369-369
Sections
Article PDF
Article PDF

A 50‐year‐old female patient with a past medical history of Sjogren's syndrome and polymyositis presented with fever, rash, swelling, and pain in her extremities. Skin biopsy confirmed vasculitis. She was treated with steroids and azathioprine. However, she developed sudden‐onset central visual blurring in her right eye on the fifth day of hospitalization. Fundoscopic exam showed multiple central white‐centered retinal hemorrhages (Roth spots, Figures 1, 2) and vascular sheathing, consistent with retinal vasculitis. Blood cultures were negative. Transthoracic and transesophageal echocardiograms were normal. She was treated with high‐dose intravenous steroids and cyclophosphamide, with visual improvement and a marked reduction in the number of Roth spots.

Figure 1
Fundoscopic view of macula and optic disc showing numerous Roth spots.
Figure 2
View of temporal macula with many Roth spots.

Roth spots 1 are nonspecific intraretinal hemorrhagic lesions with a white center due to fibrin deposition. Although historically associated with infective endocarditis, they can also occur in other systemic diseases such as connective tissue disorders, vasculitis, leukemia, diabetes, hypertension, anemia, trauma, as well as disseminated bacterial and fungal infections.

A 50‐year‐old female patient with a past medical history of Sjogren's syndrome and polymyositis presented with fever, rash, swelling, and pain in her extremities. Skin biopsy confirmed vasculitis. She was treated with steroids and azathioprine. However, she developed sudden‐onset central visual blurring in her right eye on the fifth day of hospitalization. Fundoscopic exam showed multiple central white‐centered retinal hemorrhages (Roth spots, Figures 1, 2) and vascular sheathing, consistent with retinal vasculitis. Blood cultures were negative. Transthoracic and transesophageal echocardiograms were normal. She was treated with high‐dose intravenous steroids and cyclophosphamide, with visual improvement and a marked reduction in the number of Roth spots.

Figure 1
Fundoscopic view of macula and optic disc showing numerous Roth spots.
Figure 2
View of temporal macula with many Roth spots.

Roth spots 1 are nonspecific intraretinal hemorrhagic lesions with a white center due to fibrin deposition. Although historically associated with infective endocarditis, they can also occur in other systemic diseases such as connective tissue disorders, vasculitis, leukemia, diabetes, hypertension, anemia, trauma, as well as disseminated bacterial and fungal infections.

References
  1. Duane TD, Osher RH, Green WR.White centered hemorrhages: their significance.Ophthalmology.1980;87:6669.
References
  1. Duane TD, Osher RH, Green WR.White centered hemorrhages: their significance.Ophthalmology.1980;87:6669.
Issue
Journal of Hospital Medicine - 6(6)
Issue
Journal of Hospital Medicine - 6(6)
Page Number
369-369
Page Number
369-369
Article Type
Display Headline
Roth spots—more than meets the eye
Display Headline
Roth spots—more than meets the eye
Sections
Article Source
Copyright © 2011 Society of Hospital Medicine
Disallow All Ads
Correspondence Location
Cleveland Clinic Foundation, 9500 Euclid Avenue, Mailcode M2‐annexe, Cleveland, OH 44195
Content Gating
Gated (full article locked unless allowed per User)
Gating Strategy
First Peek Free
Article PDF Media

Pharmacist‐Directed Anticoagulation

Article Type
Changed
Display Headline
Clinical and safety impact of an inpatient Pharmacist‐Directed anticoagulation service

Anticoagulants are one of the most common drug classes involved in medication errors and adverse events. Warfarin, an anticoagulant that plays a key role in the management of many disease states, is implicated in approximately 30% of reported anticoagulant‐related errors.1 Anticoagulation with warfarin is complicated by inter‐individual variability in response to therapy, clinically significant drug interactions, a narrow therapeutic window, and the need for frequent and lifelong monitoring.2

In the hospital setting, warfarin use is complicated due to patient handoff among health care providers, and acute illnesses that impact sensitivity and response to warfarin. Common causes of errors with anticoagulants are knowledge deficits, failure to follow policy/procedure/protocol, and communication issues.1 An added opportunity for warfarin‐related medication errors is the risk associated with the transition from the inpatient‐to‐outpatient setting. Due to the risk and complexity associated with anticoagulant medications, the Joint Commission instituted National Patient Safety Goal (NPSG) 03.05.01 (formerly NPSG 3E): a series of requirements intended to Reduce the likelihood of patient harm with the use of anticoagulation therapy.3 In order to optimally address this National Patient Safety Goal, a systematic intervention would be required to impact each step of the medication use process for anticoagulants.

Several studies have suggested that dedicated anticoagulation management services or clinics improve anticoagulation management in the outpatient setting.2 Non‐physician providers, primarily pharmacists and nurses, frequently manage outpatient anticoagulation management services or clinics. However, very few studies have evaluated the impact of a warfarin management service in the inpatient hospital setting.48 While the few available studies suggest some benefit associated with an inpatient anticoagulation management service, a minority of these studies have assessed the role of these services in facilitating the transition of the anticoagulated patient to the outpatient setting.7

In order to improve anticoagulation management and safety, our institution implemented an inpatient Pharmacist‐Directed Anticoagulation Service (PDAS). The purpose of this study was to evaluate the impact of this service on both transition of care and safety of patients receiving warfarin anticoagulation.

METHODS

This study was completed at Henry Ford Hospital, an 802‐bed, tertiary care, level 1 trauma and academic medical center in Detroit, MI. The study was carried out between November 2007 and June 2009. The study was approved by the Henry Ford Hospital Institutional Review Board with waiver of consent.

Patients

This was a prospective cluster randomized study. All patients admitted to two internal medicine units (IM1 or IM2) or two cardiology units (Card1 or Card2), who received at least one inpatient dose of warfarin, were eligible for inclusion. Patients were included regardless of whether warfarin was newly initiated during the index admission (newly initiated patients) or was continuation of existing anticoagulation (existing warfarin patients). In order to ensure that patient data following discharge would be available for analysis, patients were excluded from this analysis if they were not scheduled to follow‐up in the Henry Ford Medical Group outpatient anticoagulation clinics after discharge, however, these patients were cared for by the PDAS service in the usual manner.

Study Design

Prior to implementation of the PDAS, one internal medicine and one cardiology unit was randomly selected to receive the PDAS intervention (IM1 and Card1), while the other two units (IM2 and Card2) served as control units. These hospital units were selected because anticoagulants are frequently used on these units and the patient population is generally similar between the two internal medicine and two cardiology unitswith exception that Card1 unit also contains a specialized service for advanced heart failure and left ventricular assist device (LVAD) patients. Of note, there was significant expansion of the heart failure service and LVAD program during the time frame of the study, accounting for a greater number of more complicated patients on the Card1 (PDAS) unit.

Specific responsibilities of the PDAS related to warfarin are detailed in Table 1. The PDAS was implemented in September 2007 as a system‐based change to improve anticoagulant safety at our institution. The goals of this service were to improve communication regarding anticoagulation; to improve safety as patients transition from the inpatient‐to‐outpatient settings; and to standardize anticoagulant dosing, monitoring, and patient education. For patients taking warfarin, who are cared for by a health system‐affiliated physician, the PDAS collaborates with our outpatient anticoagulation clinics in order to facilitate transition from the inpatient‐to‐outpatient setting. The Henry Ford Health System has an established, multisite outpatient Anticoagulation Clinic with >5000 patients actively receiving warfarin dosing and monitoring. The anticoagulation clinics are staffed by nurses and pharmacists who provide standardized management of warfarin for patients of all physicians within our health system and provide consistent high‐quality care (average time in international normalized ratio [INR] goal range = 68.2%). The anticoagulation clinics have been in existence since 1992. The PDAS is comprised of three full‐time and two part‐time pharmacists whose responsibilities are limited to the management of anticoagulation throughout the hospital.

Pharmacist‐Directed Anticoagulation Service Responsibilities
Inpatient CarePatient EducationTransition of Care
  • Abbreviation: INR, international normalized ratio.

Initial dose selection and daily dose adjustments after warfarin is initiated by primary teamComprehensive education provided verbally and via written communication utilizing the Krames database.Contact anticoagulation‐responsible physician and anticoagulation clinic via phone.
Provide written dosing regimen to patient and provide date for first INR postdischarge.
Daily laboratory monitoringEducation provided is standardized between inpatient and outpatient settings.Create electronic Anticoagulation Discharge Summary. Document communication with the outpatient clinicians, reason for admission, steps taken to manage warfarin drug interactions, and warfarin doses administered during stay, discharge warfarin dose and follow‐up date.

The PDAS was staffed by repurposing pharmacist staff. All pharmacists had either several years of general medicine‐based clinical practice experience or residency training, or both. Pharmacists were oriented to service responsibilities by spending approximately one week in the outpatient anticoagulation clinic and completing focused review of internal and external anticoagulation guidelines.

In the control group, management of anticoagulation and transition of care occurred at the discretion of the primary care team. The primary team had access to a clinical pharmacist, who was not part of the PDAS, seven days per week. However, the primary team was not able to consult the PDAS.

This study was primarily designed to assess the impact of the PDAS on both transition of care and patient safety. For study endpoint purposes, transition of care was assessed by satisfactory completion and documentation of four important metrics: 1) appropriate enrollment in the anticoagulation clinic; 2) documented communication between the inpatient service responsible for anticoagulation and the outpatient anticoagulation clinic prior to patient discharge; 3) documented communication between the inpatient service responsible for anticoagulation and the physician responsible for outpatient management of the patient; 4) INR drawn within five days of hospital discharge. Documentation of communication for metric #2 and #3 was obtained by reviewing the electronic medical record system, particularly electronic discharge summaries and telephone encounter notes.

The primary safety endpoint was defined as a composite of any INR >5, any episode of major bleeding, or development of new thrombosis. This endpoint was met if any of these events occurred either during the index hospitalization or within 30 days of hospital discharge. Major bleeding was identified by review of outpatient anticoagulation clinic encounters and the patient's electronic medical record (includes all inpatient and outpatient encounters within Henry Ford Health System) by using the International Society of Thrombosis and Haemostasis standard and was defined as fatal bleeding or symptomatic bleeding in a critical area or organ (intracranial, intraspinal, intraocular, retroperitoneal, intraarticular, pericardial, or intramuscular with compartment syndrome), or bleeding causing a reduction in hemoglobin levels of 2 g/dL or more, or leading to transfusion of two or more units of blood or red cells.9 New thrombosis was defined as documentation of any of the following: deep vein thrombosis, pulmonary embolism, or cardioembolic stroke. Need for dose adjustment at the first anticoagulation clinic visit after discharge was evaluated as a secondary endpoint.

All analyses compared the PDAS to the control group. In addition, a planned comparison of patients in the PDAS and control groups who were newly initiated to warfarin during the study hospitalization (newly initiated subgroup) and those who were taking warfarin on admission (existing warfarin subgroup) was also undertaken. It was expected that these subgroup analyses would likely be underpowered, however, the potential implications of a service such as this could differ based on history of warfarin use. Therefore, these analyses were planned for exploratory purposes. In order to determine the impact of risk factors for altered warfarin pharmacodynamic response on the safety endpoint, post hoc subgroup analyses were performed based on demographics and clinical characteristics.

Data Analysis

Data are presented as mean standard deviation or proportion, as appropriate. A P‐value of less than 0.05 was considered significant for all comparisons and all tests were two‐tailed.

Intervention and control groups were compared with Student's t test, MannWhitney U test, chi‐square or Fishers exact test, as appropriate. Relative risk (RR) and 95% confidence intervals (CI) were calculated for all primary analyses. All statistical analyses were performed with SPSS v.12.0 (SPSS Inc, Chicago, IL).

It was estimated that a sample size of 250 patients per group would provide greater than 80% power to detect at least a 50% improvement in both the transition of care and primary safety endpoints, with implementation of the PDAS. This calculation is based on the following assumptions: alpha = 0.05; expected control group achievement of the four transition of care metrics = 50%; rate of safety endpoint for the control group = 20%.4

RESULTS

Baseline Characteristics

During the study period, 1360 patients were admitted to the study units. A total of 377 and 483 patients were found to be ineligible for inclusion on the PDAS and control units, respectively. These patients were ineligible because they did not follow up in the Henry Ford Medical Group outpatient anticoagulation clinic. In total, 500 patients were included in the analysis. Patients (n = 145) who were newly initiated on warfarin made up 29% of the total population. Table 2 presents baseline clinical characteristics for patients in the PDAS and control groups, showing increased age, and a greater proportion of patients with heart failure and LVADs in the PDAS group. Patients in the PDAS group had significantly longer hospital stays, however, these increases were driven by a longer length of stay among the advanced heart failure service patients that were managed by the PDAS.

Patient Demographics and Clinical Characteristics
 PDAS (n = 250)Control (n = 250)P Value
  • Abbreviation: LVAD, left ventricular assist device; PDAS, pharmacist‐directed anticoagulation service; SD, standard deviation.

  • Heart failure history and admission diagnoses determined through review of hospital discharge summaries.

  • Other less common indications for anticoagulation included: valvular disease, cardiomyopathy, left ventricular assist device, cardiac thrombosis.

Demographic data   
Age (mean SD)64.1 15.668.0 14.90.004
Male gender54.0%56.4%0.589
Caucasian race44.4%50.4%0.179
Admitted to a cardiology unit78.8%74.8%0.289
Length of stay (mean SD)8.13 7.046.29 5.630.001
No heart failure history: length of stay (mean SD)6.83 4.536.15 5.140.288
Heart failure history: length of stay (mean SD)9.09 8.316.45 6.150.004
History of heart failure*57.6%47.6%0.025
Heart failure with an LVAD14.0%0.4%<0.001
Indication for anticoagulation   
Venous thromboembolism21.6%18.4%0.371
Atrial fibrillation54.4%66.4%0.006
Other24.0%15.2%0.013
Primary admission diagnosis*   
Heart failure25.6%*21.6%0.292
Atrial fibrillation16.4%20.8%0.206
Acute coronary syndrome13.6%17.6%0.218
Venous thromboembolism4.8%4.8%1.00
Infection12.4%10.0%0.395
Bleeding1.6%1.2%0.703

Early Warfarin Management

Warfarin management metrics are presented in Table 3. The number of inpatient days prescribed warfarin was increased in the PDAS group by greater than one day while PDAS patients required significantly less dosage adjustment at first outpatient follow‐up visit. Similar to increases noted with length of stay, increases in inpatient warfarin days were likely driven by patients with severe heart failure managed by the PDAS.

Warfarin Management Metrics
Warfarin DosingPDAS (n = 250)Control (n = 250)P Value
  • Abbreviation: INR, international normalized ratio; PDAS, Pharmacist‐Directed Anticoagulation Service; SD, standard deviation.

Initial dose (mean SD)5.23 2.374.99 2.070.245
Discharge dose (mean SD)5.15 2.524.91 2.140.258
INR at discharge (mean SD)2.07 0.732.04 0.730.660
Therapeutic INR at discharge40.8%38.0%0.522
Inpatient warfarin days (mean SD)4.97 4.303.68 2.69<0.001
No heart failure: inpatient warfarin days (mean SD)4.09 2.493.60 2.670.148
Heart failure: inpatient warfarin days (mean SD)5.62 5.163.76 2.71<0.001
Dose change required at first follow‐up visit44.8%72.6%<0.001

Transition of Care

Transition of care results are presented in Table 4. Full compliance and achievement of the transition of care metrics occurred significantly more often in the PDAS versus control patients with markedly increased rates of documented communication between inpatient providers and both outpatient anticoagulation clinic staff and outpatient physicians. Early follow‐up INR monitoring also occurred more frequently in the PDAS patients. The PDAS patients experienced greater compliance with the transition of care metrics regardless of whether they were in the newly initiated or existing warfarin subgroups (data not shown).

Transition of Care and Safety Results
Transition of CarePDAS (n = 250)Control (n = 250)Relative Risk (95% CI)P Value
  • Abbreviation: AC, anticoagulation; CI, confidence interval; INR, international normalized ratio; N/A, not applicable; PDAS, pharmacist‐directed anticoagulation service.

  • Appropriate enrollment in the anticoagulation clinic; documented communication between the inpatient service and outpatient physician; documented communication between the inpatient clinicians and anticoagulation clinic staff; INR drawn within 5 days of discharge.

  • Rate of inpatient and 30‐day INR >5; major bleeding; thrombosis.

100% Communication bundle* compliance, % (n)75.6% (189)2.8% (7)27.0 (13.056.2)<0.001
Appropriately enrolled in the AC clinic, % (n)97.2% (243)95.2% (238)1.02 (0.991.06)0.242
Communication: inpatient service and outpatient physician, % (n)99.6% (249)12.4% (31)8.03 (5.7811.2)<0.001
Communication: inpatient clinicians and AC clinic staff, % (n)98.8% (247)14.8% (37)6.68 (4.969.00)<0.001
INR drawn within five days of hospital discharge, % (n)78.4% (196)66.4% (166)1.18 (1.061.32)0.003
30‐Day Composite safety endpoint, % (n)10.0% (25)14.8% (37)0.68 (0.421.09)0.103
Inpatient + 30‐day INR >5, % (n)9.6% (24)14.8% (37)0.65 (0.401.05)0.076
Inpatient + 30‐day major bleeding, % (n)0.8% (2)0.4% (1)2.00 (0.1821.9)0.563
Inpatient + 30‐day thrombosis, % (n)0% (0)0% (0)N/AN/A

Anticoagulant Safety

Safety endpoint data is presented in Table 4. The composite safety outcome of INR >5, major bleeding event, or thrombosis occurred in 12.4% of all patients with no early thrombotic events and only three major bleeding events recorded. Excessive INR values >5 occurred less frequently in the PDAS patients, however, differences in this metric and the composite safety outcome were not significantly different. Safety endpoint results in the overall population were driven by a reduction in INR values >5 among newly initiated warfarin patients in the PDAS group (PDAS: 9.5% vs control: 19.7%; P = 0.079; Figure 1). Other subgroup analyses relating to the safety endpoint are presented in Figure 1.
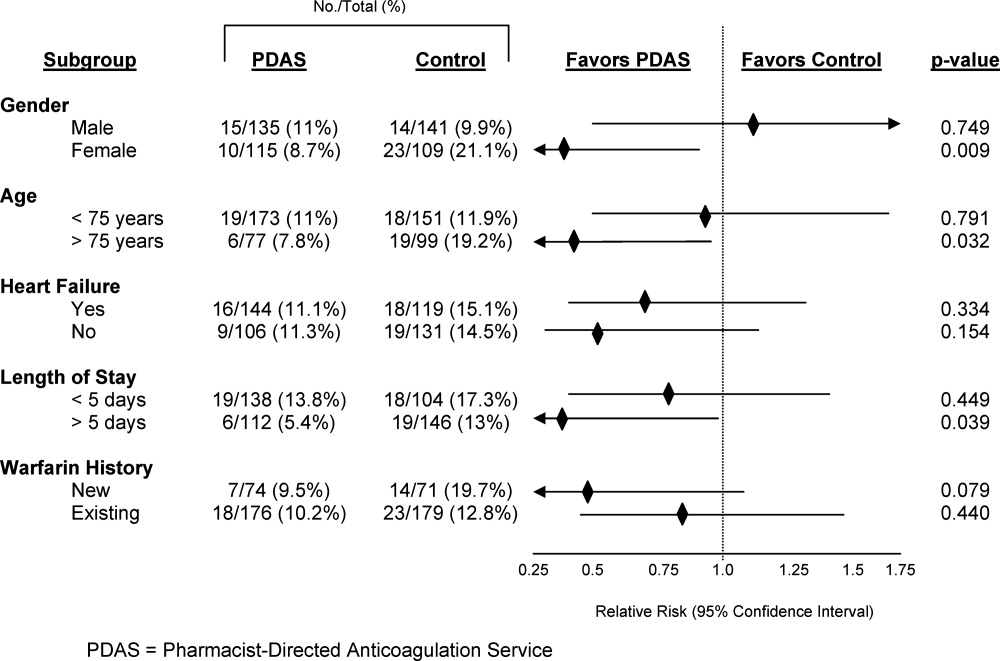
Figure 1
Subgroup analysis of composite safety endpoint: Pharmacist‐Directed Anticoagulation Service (PDAS) vs control based on patient characteristics and demographics.

DISCUSSION

This article describes a systematic intervention designed to improve anticoagulation safety and efficacy in the hospital and during the transition to the postdischarge setting. Implementation of a PDAS did not impact patient bleeding and thrombotic outcomes, but did result in improved coordination and documentation of warfarin management and subsequent enhancement in the transition of the anticoagulated patient from the inpatient‐to‐outpatient setting with the Pharmacist‐Directed Anticoagulation Service.

Limited previous work has investigated the role of an anticoagulation service in inpatient management of anticoagulation.48 Only one published study has investigated the impact of this type of service on transition of care issues with warfarin, as was done in our study.7 In that study, management by an inpatient anticoagulation service resulted in a greater proportion of patients referred to an anticoagulation clinic for management (P = 0.001), more patients presenting to the anticoagulation clinic with a therapeutic INR (P = 0.001), and fewer patients presenting to the clinic with supratherapeutic levels of anticoagulation (P = 0.002). These results are somewhat analogous to our findings, in that patients in our study were less likely to require a dose change at the first clinic follow‐up visit after discharge or to have INR values 5.

We completed several subgroup analyses to thoroughly explore the impact of the PDAS on the safety endpoint. While firm conclusions cannot be drawn from these subgroup analyses, some hypothesis‐generating observations can be made. First, there was a greater impact of the PDAS on the safety endpoint in patients who are usually more sensitive to the effects of warfarin and therefore more challenging to manage.2 The impact of the PDAS was also greater among patients whose length of stay was more than five days (population median). This is significant because it suggests that when the opportunity for adverse events and miscommunication is greatest (ie, during hospitalizations of longer duration), there appears to be improvement in the safety endpoint with the PDAS.

To our knowledge, this study was the first to explore the impact of an inpatient anticoagulation service on the care of both newly initiated and existing warfarin patients, rather than only patients newly initiated on warfarin. As expected, the greatest influence of the PDAS on the safety endpoint was observed among the newly initiated patients. While the safety impact of the PDAS was noted most significantly among the newly initiated patients, the PDAS had a positive effect on the transition of care metrics regardless of previous warfarin use.

A limitation of our study should be mentioned. While we employed a design in which randomly selected units were exposed to the PDAS, individual patients were not randomized to the service. This cluster randomized design was chosen because it mimics quality improvement processes that would be rolled out to a hospital nursing unit. While lack of randomization at the patient level is a limitation, our cluster randomized study design is pragmatic and represents an improvement over the existing published before and after quasi‐experimental studies in this area.48

An improved system for documentation of communication was built into the PDAS processes on implementation of the service. However, it should also be noted that inadequate communication between inpatient and outpatient providers was an identified root cause for adverse events with warfarin in our institution prior to implementation of the PDAS. Therefore, improvement in the transition of care metrics with the PDAS were likely due to a combination of both improved documentation and true improvement in communication.

The approach of the PDAS was refined in several ways early after implementation of the service. Some major notable improvements included the development of a systematic approach to ensuring appropriate follow‐up and transition of care for patients being discharged to a skilled nursing facility, and creation of a system that required a mandatory conversation between the PDAS and a surgical service if anticoagulation is ordered within 48 hours of a major procedure. An upcoming improvement to the service will be to transition from a home grown electronic database, which was built for the purposes of streamlining clinical workflow and data collection, to a commercially available software program that has recently become available for management of inpatient anticoagulation. The major advantage of the new program will be the clinical decision support capabilities that will help to further streamline the service and allow for greater efficiency.

To understand implications of our PDAS intervention, it is important to remember that the majority of study patients were prescribed warfarin prior to hospital admission, that patients in both study groups were enrolled in an established, multisite anticoagulation clinic, and that patients in both groups were managed with a comprehensive inpatientoutpatient electronic medical record. Therefore, all providers caring for these patients had real‐time access to all warfarin dosing and dose adjustments, INR results, and anticoagulation clinic encounters, even though formal communication between providers was infrequently documented for control group patients in our electronic medical record. Study patients had low rates of bleeding and no adverse thrombotic outcomes across both treatment groups. Therefore, this type of model is likely to produce larger gains in communication and safety outcomes in health care systems without established anticoagulation clinics or comprehensive electronic medical records.

The PDAS was enthusiastically accepted by providers at our institution and expanded hospital‐wide after completion of this pilot. The PDAS model is a viable approach to standardize anticoagulant management with a goal of improving anticoagulant safety in the inpatient setting. Assessment of the effectiveness of models such as the PDAS for improving anticoagulant safety in the inpatient setting is particularly relevant with the current expectations for hospitals set by The Joint Commission's NPSG.03.05.01.3 More importantly the PDAS model can be an option for improving the transition of the anticoagulated patient from the inpatient‐to‐outpatient setting. Follow‐up with the anticoagulation clinic occurred earlier with the PDAS and, while this study was not designed to evaluate the impact of this new service on rehospitalization, recent literature suggests that earlier follow‐up after discharge leads to less rehospitalization.10 Finally, it may be possible to adapt this model to provide more intensive medication therapy management and monitoring for hospitalized patients with other complicated medication regimens or chronic disease.

CONCLUSION

The clinical pharmacist is uniquely prepared to manage inter‐individual variability in pharmacodynamic response to drug therapy, as well as to provide high‐quality patient education. This study evaluated a new model of inpatient warfarin management, in which warfarin dosing, monitoring, patient education, and transition of care was coordinated by a specialized team of clinical pharmacists that worked in collaboration with physicians and outpatient anticoagulation clinic staff. Safety and efficiency of the care provided by this new service was improved in certain subsets of more complex patients. The major advantage of this service was improvement in patient handoff, improved communication, and earlier patient follow‐up after discharge. Therefore, implementation of a Pharmacist‐Directed Anticoagulation Service provides a net improvement in quality of care for the patient taking warfarin in the inpatient setting.

Acknowledgements

The authors acknowledge the efforts of the PDAS staff: Nassif Abi‐Samra, Pam Holland, Sara Lanfear, and Gail Washington. This work would not have been possible without the dedication of these pharmacists. All authors had full access to all of the data in the study and take responsibility for the integrity of the data and the accuracy of the data analysis.

References
  1. U.S. Pharmacopeia. USP Patient Safety CapsLink: January 2008. Available at: http://www.usp.org/pdf/EN/patientSafety/capsLink2008–01‐01.pdf. Accessed March 19,2010.
  2. Ansel J,Hirsh J,Hylek E,Jacobson A,Crowther M,Palareti G.Pharmacology and management of the vitamin K antagonists: American College of Chest Physicians evidence‐based clinical practice guidelines (8th ed.).Chest.2008;133:160S198S.
  3. The Joint Commission. 2009 National Patient Safety Goals. Available at: http://www.jointcommission.org/NR/rdonlyres/31666E86‐E7F4–423E‐9BE8‐F05BD1CB0AA8/0/HAP_NPSG.pdf. Accessed May 6,2010.
  4. Dager WE,Branch JM,King JH, et al.Optimization of inpatient warfarin therapy: impact of a daily consultation by a pharmacist‐managed anticoagulation service.Ann Pharmacother.2000;34:567572.
  5. Rivey MP,Wood RD,Allington DR, et al.Pharmacy‐managed protocol for warfarin use in orthopedic surgery patients.Am J Health‐Syst Pharm.1995;52:13101316.
  6. Boddy C.Pharmacist involvement with warfarin dosing for inpatients.Pharm World Sci.2001;23:3135.
  7. Ellis RF,Stephens MA,Sharp GB.Evaluation of a pharmacy‐managed warfarin‐monitoring service to coordinate inpatient and outpatient therapy.Am J Hosp Pharm.1992;49:387394.
  8. To EK,Pearson GJ.Implementation and evaluation of a pharmacist‐assisted warfarin dosing program.Can J Hosp Pharm.1997;50:169175.
  9. Schulman S,Kearon C.Definition of major bleeding in clinical investigations of antihemostatic medicinal products in non‐surgical patients.J Thromb Haemostasis.2005;3:692694.
  10. Jencks SF,Williams MV,Coleman EA.Rehospitalizations among patients in the Medicare fee‐for‐service program.N Engl J Med.2009;360:14181428.
Article PDF
Issue
Journal of Hospital Medicine - 6(6)
Page Number
322-328
Sections
Article PDF
Article PDF

Anticoagulants are one of the most common drug classes involved in medication errors and adverse events. Warfarin, an anticoagulant that plays a key role in the management of many disease states, is implicated in approximately 30% of reported anticoagulant‐related errors.1 Anticoagulation with warfarin is complicated by inter‐individual variability in response to therapy, clinically significant drug interactions, a narrow therapeutic window, and the need for frequent and lifelong monitoring.2

In the hospital setting, warfarin use is complicated due to patient handoff among health care providers, and acute illnesses that impact sensitivity and response to warfarin. Common causes of errors with anticoagulants are knowledge deficits, failure to follow policy/procedure/protocol, and communication issues.1 An added opportunity for warfarin‐related medication errors is the risk associated with the transition from the inpatient‐to‐outpatient setting. Due to the risk and complexity associated with anticoagulant medications, the Joint Commission instituted National Patient Safety Goal (NPSG) 03.05.01 (formerly NPSG 3E): a series of requirements intended to Reduce the likelihood of patient harm with the use of anticoagulation therapy.3 In order to optimally address this National Patient Safety Goal, a systematic intervention would be required to impact each step of the medication use process for anticoagulants.

Several studies have suggested that dedicated anticoagulation management services or clinics improve anticoagulation management in the outpatient setting.2 Non‐physician providers, primarily pharmacists and nurses, frequently manage outpatient anticoagulation management services or clinics. However, very few studies have evaluated the impact of a warfarin management service in the inpatient hospital setting.48 While the few available studies suggest some benefit associated with an inpatient anticoagulation management service, a minority of these studies have assessed the role of these services in facilitating the transition of the anticoagulated patient to the outpatient setting.7

In order to improve anticoagulation management and safety, our institution implemented an inpatient Pharmacist‐Directed Anticoagulation Service (PDAS). The purpose of this study was to evaluate the impact of this service on both transition of care and safety of patients receiving warfarin anticoagulation.

METHODS

This study was completed at Henry Ford Hospital, an 802‐bed, tertiary care, level 1 trauma and academic medical center in Detroit, MI. The study was carried out between November 2007 and June 2009. The study was approved by the Henry Ford Hospital Institutional Review Board with waiver of consent.

Patients

This was a prospective cluster randomized study. All patients admitted to two internal medicine units (IM1 or IM2) or two cardiology units (Card1 or Card2), who received at least one inpatient dose of warfarin, were eligible for inclusion. Patients were included regardless of whether warfarin was newly initiated during the index admission (newly initiated patients) or was continuation of existing anticoagulation (existing warfarin patients). In order to ensure that patient data following discharge would be available for analysis, patients were excluded from this analysis if they were not scheduled to follow‐up in the Henry Ford Medical Group outpatient anticoagulation clinics after discharge, however, these patients were cared for by the PDAS service in the usual manner.

Study Design

Prior to implementation of the PDAS, one internal medicine and one cardiology unit was randomly selected to receive the PDAS intervention (IM1 and Card1), while the other two units (IM2 and Card2) served as control units. These hospital units were selected because anticoagulants are frequently used on these units and the patient population is generally similar between the two internal medicine and two cardiology unitswith exception that Card1 unit also contains a specialized service for advanced heart failure and left ventricular assist device (LVAD) patients. Of note, there was significant expansion of the heart failure service and LVAD program during the time frame of the study, accounting for a greater number of more complicated patients on the Card1 (PDAS) unit.

Specific responsibilities of the PDAS related to warfarin are detailed in Table 1. The PDAS was implemented in September 2007 as a system‐based change to improve anticoagulant safety at our institution. The goals of this service were to improve communication regarding anticoagulation; to improve safety as patients transition from the inpatient‐to‐outpatient settings; and to standardize anticoagulant dosing, monitoring, and patient education. For patients taking warfarin, who are cared for by a health system‐affiliated physician, the PDAS collaborates with our outpatient anticoagulation clinics in order to facilitate transition from the inpatient‐to‐outpatient setting. The Henry Ford Health System has an established, multisite outpatient Anticoagulation Clinic with >5000 patients actively receiving warfarin dosing and monitoring. The anticoagulation clinics are staffed by nurses and pharmacists who provide standardized management of warfarin for patients of all physicians within our health system and provide consistent high‐quality care (average time in international normalized ratio [INR] goal range = 68.2%). The anticoagulation clinics have been in existence since 1992. The PDAS is comprised of three full‐time and two part‐time pharmacists whose responsibilities are limited to the management of anticoagulation throughout the hospital.

Pharmacist‐Directed Anticoagulation Service Responsibilities
Inpatient CarePatient EducationTransition of Care
  • Abbreviation: INR, international normalized ratio.

Initial dose selection and daily dose adjustments after warfarin is initiated by primary teamComprehensive education provided verbally and via written communication utilizing the Krames database.Contact anticoagulation‐responsible physician and anticoagulation clinic via phone.
Provide written dosing regimen to patient and provide date for first INR postdischarge.
Daily laboratory monitoringEducation provided is standardized between inpatient and outpatient settings.Create electronic Anticoagulation Discharge Summary. Document communication with the outpatient clinicians, reason for admission, steps taken to manage warfarin drug interactions, and warfarin doses administered during stay, discharge warfarin dose and follow‐up date.

The PDAS was staffed by repurposing pharmacist staff. All pharmacists had either several years of general medicine‐based clinical practice experience or residency training, or both. Pharmacists were oriented to service responsibilities by spending approximately one week in the outpatient anticoagulation clinic and completing focused review of internal and external anticoagulation guidelines.

In the control group, management of anticoagulation and transition of care occurred at the discretion of the primary care team. The primary team had access to a clinical pharmacist, who was not part of the PDAS, seven days per week. However, the primary team was not able to consult the PDAS.

This study was primarily designed to assess the impact of the PDAS on both transition of care and patient safety. For study endpoint purposes, transition of care was assessed by satisfactory completion and documentation of four important metrics: 1) appropriate enrollment in the anticoagulation clinic; 2) documented communication between the inpatient service responsible for anticoagulation and the outpatient anticoagulation clinic prior to patient discharge; 3) documented communication between the inpatient service responsible for anticoagulation and the physician responsible for outpatient management of the patient; 4) INR drawn within five days of hospital discharge. Documentation of communication for metric #2 and #3 was obtained by reviewing the electronic medical record system, particularly electronic discharge summaries and telephone encounter notes.

The primary safety endpoint was defined as a composite of any INR >5, any episode of major bleeding, or development of new thrombosis. This endpoint was met if any of these events occurred either during the index hospitalization or within 30 days of hospital discharge. Major bleeding was identified by review of outpatient anticoagulation clinic encounters and the patient's electronic medical record (includes all inpatient and outpatient encounters within Henry Ford Health System) by using the International Society of Thrombosis and Haemostasis standard and was defined as fatal bleeding or symptomatic bleeding in a critical area or organ (intracranial, intraspinal, intraocular, retroperitoneal, intraarticular, pericardial, or intramuscular with compartment syndrome), or bleeding causing a reduction in hemoglobin levels of 2 g/dL or more, or leading to transfusion of two or more units of blood or red cells.9 New thrombosis was defined as documentation of any of the following: deep vein thrombosis, pulmonary embolism, or cardioembolic stroke. Need for dose adjustment at the first anticoagulation clinic visit after discharge was evaluated as a secondary endpoint.

All analyses compared the PDAS to the control group. In addition, a planned comparison of patients in the PDAS and control groups who were newly initiated to warfarin during the study hospitalization (newly initiated subgroup) and those who were taking warfarin on admission (existing warfarin subgroup) was also undertaken. It was expected that these subgroup analyses would likely be underpowered, however, the potential implications of a service such as this could differ based on history of warfarin use. Therefore, these analyses were planned for exploratory purposes. In order to determine the impact of risk factors for altered warfarin pharmacodynamic response on the safety endpoint, post hoc subgroup analyses were performed based on demographics and clinical characteristics.

Data Analysis

Data are presented as mean standard deviation or proportion, as appropriate. A P‐value of less than 0.05 was considered significant for all comparisons and all tests were two‐tailed.

Intervention and control groups were compared with Student's t test, MannWhitney U test, chi‐square or Fishers exact test, as appropriate. Relative risk (RR) and 95% confidence intervals (CI) were calculated for all primary analyses. All statistical analyses were performed with SPSS v.12.0 (SPSS Inc, Chicago, IL).

It was estimated that a sample size of 250 patients per group would provide greater than 80% power to detect at least a 50% improvement in both the transition of care and primary safety endpoints, with implementation of the PDAS. This calculation is based on the following assumptions: alpha = 0.05; expected control group achievement of the four transition of care metrics = 50%; rate of safety endpoint for the control group = 20%.4

RESULTS

Baseline Characteristics

During the study period, 1360 patients were admitted to the study units. A total of 377 and 483 patients were found to be ineligible for inclusion on the PDAS and control units, respectively. These patients were ineligible because they did not follow up in the Henry Ford Medical Group outpatient anticoagulation clinic. In total, 500 patients were included in the analysis. Patients (n = 145) who were newly initiated on warfarin made up 29% of the total population. Table 2 presents baseline clinical characteristics for patients in the PDAS and control groups, showing increased age, and a greater proportion of patients with heart failure and LVADs in the PDAS group. Patients in the PDAS group had significantly longer hospital stays, however, these increases were driven by a longer length of stay among the advanced heart failure service patients that were managed by the PDAS.

Patient Demographics and Clinical Characteristics
 PDAS (n = 250)Control (n = 250)P Value
  • Abbreviation: LVAD, left ventricular assist device; PDAS, pharmacist‐directed anticoagulation service; SD, standard deviation.

  • Heart failure history and admission diagnoses determined through review of hospital discharge summaries.

  • Other less common indications for anticoagulation included: valvular disease, cardiomyopathy, left ventricular assist device, cardiac thrombosis.

Demographic data   
Age (mean SD)64.1 15.668.0 14.90.004
Male gender54.0%56.4%0.589
Caucasian race44.4%50.4%0.179
Admitted to a cardiology unit78.8%74.8%0.289
Length of stay (mean SD)8.13 7.046.29 5.630.001
No heart failure history: length of stay (mean SD)6.83 4.536.15 5.140.288
Heart failure history: length of stay (mean SD)9.09 8.316.45 6.150.004
History of heart failure*57.6%47.6%0.025
Heart failure with an LVAD14.0%0.4%<0.001
Indication for anticoagulation   
Venous thromboembolism21.6%18.4%0.371
Atrial fibrillation54.4%66.4%0.006
Other24.0%15.2%0.013
Primary admission diagnosis*   
Heart failure25.6%*21.6%0.292
Atrial fibrillation16.4%20.8%0.206
Acute coronary syndrome13.6%17.6%0.218
Venous thromboembolism4.8%4.8%1.00
Infection12.4%10.0%0.395
Bleeding1.6%1.2%0.703

Early Warfarin Management

Warfarin management metrics are presented in Table 3. The number of inpatient days prescribed warfarin was increased in the PDAS group by greater than one day while PDAS patients required significantly less dosage adjustment at first outpatient follow‐up visit. Similar to increases noted with length of stay, increases in inpatient warfarin days were likely driven by patients with severe heart failure managed by the PDAS.

Warfarin Management Metrics
Warfarin DosingPDAS (n = 250)Control (n = 250)P Value
  • Abbreviation: INR, international normalized ratio; PDAS, Pharmacist‐Directed Anticoagulation Service; SD, standard deviation.

Initial dose (mean SD)5.23 2.374.99 2.070.245
Discharge dose (mean SD)5.15 2.524.91 2.140.258
INR at discharge (mean SD)2.07 0.732.04 0.730.660
Therapeutic INR at discharge40.8%38.0%0.522
Inpatient warfarin days (mean SD)4.97 4.303.68 2.69<0.001
No heart failure: inpatient warfarin days (mean SD)4.09 2.493.60 2.670.148
Heart failure: inpatient warfarin days (mean SD)5.62 5.163.76 2.71<0.001
Dose change required at first follow‐up visit44.8%72.6%<0.001

Transition of Care

Transition of care results are presented in Table 4. Full compliance and achievement of the transition of care metrics occurred significantly more often in the PDAS versus control patients with markedly increased rates of documented communication between inpatient providers and both outpatient anticoagulation clinic staff and outpatient physicians. Early follow‐up INR monitoring also occurred more frequently in the PDAS patients. The PDAS patients experienced greater compliance with the transition of care metrics regardless of whether they were in the newly initiated or existing warfarin subgroups (data not shown).

Transition of Care and Safety Results
Transition of CarePDAS (n = 250)Control (n = 250)Relative Risk (95% CI)P Value
  • Abbreviation: AC, anticoagulation; CI, confidence interval; INR, international normalized ratio; N/A, not applicable; PDAS, pharmacist‐directed anticoagulation service.

  • Appropriate enrollment in the anticoagulation clinic; documented communication between the inpatient service and outpatient physician; documented communication between the inpatient clinicians and anticoagulation clinic staff; INR drawn within 5 days of discharge.

  • Rate of inpatient and 30‐day INR >5; major bleeding; thrombosis.

100% Communication bundle* compliance, % (n)75.6% (189)2.8% (7)27.0 (13.056.2)<0.001
Appropriately enrolled in the AC clinic, % (n)97.2% (243)95.2% (238)1.02 (0.991.06)0.242
Communication: inpatient service and outpatient physician, % (n)99.6% (249)12.4% (31)8.03 (5.7811.2)<0.001
Communication: inpatient clinicians and AC clinic staff, % (n)98.8% (247)14.8% (37)6.68 (4.969.00)<0.001
INR drawn within five days of hospital discharge, % (n)78.4% (196)66.4% (166)1.18 (1.061.32)0.003
30‐Day Composite safety endpoint, % (n)10.0% (25)14.8% (37)0.68 (0.421.09)0.103
Inpatient + 30‐day INR >5, % (n)9.6% (24)14.8% (37)0.65 (0.401.05)0.076
Inpatient + 30‐day major bleeding, % (n)0.8% (2)0.4% (1)2.00 (0.1821.9)0.563
Inpatient + 30‐day thrombosis, % (n)0% (0)0% (0)N/AN/A

Anticoagulant Safety

Safety endpoint data is presented in Table 4. The composite safety outcome of INR >5, major bleeding event, or thrombosis occurred in 12.4% of all patients with no early thrombotic events and only three major bleeding events recorded. Excessive INR values >5 occurred less frequently in the PDAS patients, however, differences in this metric and the composite safety outcome were not significantly different. Safety endpoint results in the overall population were driven by a reduction in INR values >5 among newly initiated warfarin patients in the PDAS group (PDAS: 9.5% vs control: 19.7%; P = 0.079; Figure 1). Other subgroup analyses relating to the safety endpoint are presented in Figure 1.

Figure 1
Subgroup analysis of composite safety endpoint: Pharmacist‐Directed Anticoagulation Service (PDAS) vs control based on patient characteristics and demographics.

DISCUSSION

This article describes a systematic intervention designed to improve anticoagulation safety and efficacy in the hospital and during the transition to the postdischarge setting. Implementation of a PDAS did not impact patient bleeding and thrombotic outcomes, but did result in improved coordination and documentation of warfarin management and subsequent enhancement in the transition of the anticoagulated patient from the inpatient‐to‐outpatient setting with the Pharmacist‐Directed Anticoagulation Service.

Limited previous work has investigated the role of an anticoagulation service in inpatient management of anticoagulation.48 Only one published study has investigated the impact of this type of service on transition of care issues with warfarin, as was done in our study.7 In that study, management by an inpatient anticoagulation service resulted in a greater proportion of patients referred to an anticoagulation clinic for management (P = 0.001), more patients presenting to the anticoagulation clinic with a therapeutic INR (P = 0.001), and fewer patients presenting to the clinic with supratherapeutic levels of anticoagulation (P = 0.002). These results are somewhat analogous to our findings, in that patients in our study were less likely to require a dose change at the first clinic follow‐up visit after discharge or to have INR values 5.

We completed several subgroup analyses to thoroughly explore the impact of the PDAS on the safety endpoint. While firm conclusions cannot be drawn from these subgroup analyses, some hypothesis‐generating observations can be made. First, there was a greater impact of the PDAS on the safety endpoint in patients who are usually more sensitive to the effects of warfarin and therefore more challenging to manage.2 The impact of the PDAS was also greater among patients whose length of stay was more than five days (population median). This is significant because it suggests that when the opportunity for adverse events and miscommunication is greatest (ie, during hospitalizations of longer duration), there appears to be improvement in the safety endpoint with the PDAS.

To our knowledge, this study was the first to explore the impact of an inpatient anticoagulation service on the care of both newly initiated and existing warfarin patients, rather than only patients newly initiated on warfarin. As expected, the greatest influence of the PDAS on the safety endpoint was observed among the newly initiated patients. While the safety impact of the PDAS was noted most significantly among the newly initiated patients, the PDAS had a positive effect on the transition of care metrics regardless of previous warfarin use.

A limitation of our study should be mentioned. While we employed a design in which randomly selected units were exposed to the PDAS, individual patients were not randomized to the service. This cluster randomized design was chosen because it mimics quality improvement processes that would be rolled out to a hospital nursing unit. While lack of randomization at the patient level is a limitation, our cluster randomized study design is pragmatic and represents an improvement over the existing published before and after quasi‐experimental studies in this area.48

An improved system for documentation of communication was built into the PDAS processes on implementation of the service. However, it should also be noted that inadequate communication between inpatient and outpatient providers was an identified root cause for adverse events with warfarin in our institution prior to implementation of the PDAS. Therefore, improvement in the transition of care metrics with the PDAS were likely due to a combination of both improved documentation and true improvement in communication.

The approach of the PDAS was refined in several ways early after implementation of the service. Some major notable improvements included the development of a systematic approach to ensuring appropriate follow‐up and transition of care for patients being discharged to a skilled nursing facility, and creation of a system that required a mandatory conversation between the PDAS and a surgical service if anticoagulation is ordered within 48 hours of a major procedure. An upcoming improvement to the service will be to transition from a home grown electronic database, which was built for the purposes of streamlining clinical workflow and data collection, to a commercially available software program that has recently become available for management of inpatient anticoagulation. The major advantage of the new program will be the clinical decision support capabilities that will help to further streamline the service and allow for greater efficiency.

To understand implications of our PDAS intervention, it is important to remember that the majority of study patients were prescribed warfarin prior to hospital admission, that patients in both study groups were enrolled in an established, multisite anticoagulation clinic, and that patients in both groups were managed with a comprehensive inpatientoutpatient electronic medical record. Therefore, all providers caring for these patients had real‐time access to all warfarin dosing and dose adjustments, INR results, and anticoagulation clinic encounters, even though formal communication between providers was infrequently documented for control group patients in our electronic medical record. Study patients had low rates of bleeding and no adverse thrombotic outcomes across both treatment groups. Therefore, this type of model is likely to produce larger gains in communication and safety outcomes in health care systems without established anticoagulation clinics or comprehensive electronic medical records.

The PDAS was enthusiastically accepted by providers at our institution and expanded hospital‐wide after completion of this pilot. The PDAS model is a viable approach to standardize anticoagulant management with a goal of improving anticoagulant safety in the inpatient setting. Assessment of the effectiveness of models such as the PDAS for improving anticoagulant safety in the inpatient setting is particularly relevant with the current expectations for hospitals set by The Joint Commission's NPSG.03.05.01.3 More importantly the PDAS model can be an option for improving the transition of the anticoagulated patient from the inpatient‐to‐outpatient setting. Follow‐up with the anticoagulation clinic occurred earlier with the PDAS and, while this study was not designed to evaluate the impact of this new service on rehospitalization, recent literature suggests that earlier follow‐up after discharge leads to less rehospitalization.10 Finally, it may be possible to adapt this model to provide more intensive medication therapy management and monitoring for hospitalized patients with other complicated medication regimens or chronic disease.

CONCLUSION

The clinical pharmacist is uniquely prepared to manage inter‐individual variability in pharmacodynamic response to drug therapy, as well as to provide high‐quality patient education. This study evaluated a new model of inpatient warfarin management, in which warfarin dosing, monitoring, patient education, and transition of care was coordinated by a specialized team of clinical pharmacists that worked in collaboration with physicians and outpatient anticoagulation clinic staff. Safety and efficiency of the care provided by this new service was improved in certain subsets of more complex patients. The major advantage of this service was improvement in patient handoff, improved communication, and earlier patient follow‐up after discharge. Therefore, implementation of a Pharmacist‐Directed Anticoagulation Service provides a net improvement in quality of care for the patient taking warfarin in the inpatient setting.

Acknowledgements

The authors acknowledge the efforts of the PDAS staff: Nassif Abi‐Samra, Pam Holland, Sara Lanfear, and Gail Washington. This work would not have been possible without the dedication of these pharmacists. All authors had full access to all of the data in the study and take responsibility for the integrity of the data and the accuracy of the data analysis.

Anticoagulants are one of the most common drug classes involved in medication errors and adverse events. Warfarin, an anticoagulant that plays a key role in the management of many disease states, is implicated in approximately 30% of reported anticoagulant‐related errors.1 Anticoagulation with warfarin is complicated by inter‐individual variability in response to therapy, clinically significant drug interactions, a narrow therapeutic window, and the need for frequent and lifelong monitoring.2

In the hospital setting, warfarin use is complicated due to patient handoff among health care providers, and acute illnesses that impact sensitivity and response to warfarin. Common causes of errors with anticoagulants are knowledge deficits, failure to follow policy/procedure/protocol, and communication issues.1 An added opportunity for warfarin‐related medication errors is the risk associated with the transition from the inpatient‐to‐outpatient setting. Due to the risk and complexity associated with anticoagulant medications, the Joint Commission instituted National Patient Safety Goal (NPSG) 03.05.01 (formerly NPSG 3E): a series of requirements intended to Reduce the likelihood of patient harm with the use of anticoagulation therapy.3 In order to optimally address this National Patient Safety Goal, a systematic intervention would be required to impact each step of the medication use process for anticoagulants.

Several studies have suggested that dedicated anticoagulation management services or clinics improve anticoagulation management in the outpatient setting.2 Non‐physician providers, primarily pharmacists and nurses, frequently manage outpatient anticoagulation management services or clinics. However, very few studies have evaluated the impact of a warfarin management service in the inpatient hospital setting.48 While the few available studies suggest some benefit associated with an inpatient anticoagulation management service, a minority of these studies have assessed the role of these services in facilitating the transition of the anticoagulated patient to the outpatient setting.7

In order to improve anticoagulation management and safety, our institution implemented an inpatient Pharmacist‐Directed Anticoagulation Service (PDAS). The purpose of this study was to evaluate the impact of this service on both transition of care and safety of patients receiving warfarin anticoagulation.

METHODS

This study was completed at Henry Ford Hospital, an 802‐bed, tertiary care, level 1 trauma and academic medical center in Detroit, MI. The study was carried out between November 2007 and June 2009. The study was approved by the Henry Ford Hospital Institutional Review Board with waiver of consent.

Patients

This was a prospective cluster randomized study. All patients admitted to two internal medicine units (IM1 or IM2) or two cardiology units (Card1 or Card2), who received at least one inpatient dose of warfarin, were eligible for inclusion. Patients were included regardless of whether warfarin was newly initiated during the index admission (newly initiated patients) or was continuation of existing anticoagulation (existing warfarin patients). In order to ensure that patient data following discharge would be available for analysis, patients were excluded from this analysis if they were not scheduled to follow‐up in the Henry Ford Medical Group outpatient anticoagulation clinics after discharge, however, these patients were cared for by the PDAS service in the usual manner.

Study Design

Prior to implementation of the PDAS, one internal medicine and one cardiology unit was randomly selected to receive the PDAS intervention (IM1 and Card1), while the other two units (IM2 and Card2) served as control units. These hospital units were selected because anticoagulants are frequently used on these units and the patient population is generally similar between the two internal medicine and two cardiology unitswith exception that Card1 unit also contains a specialized service for advanced heart failure and left ventricular assist device (LVAD) patients. Of note, there was significant expansion of the heart failure service and LVAD program during the time frame of the study, accounting for a greater number of more complicated patients on the Card1 (PDAS) unit.

Specific responsibilities of the PDAS related to warfarin are detailed in Table 1. The PDAS was implemented in September 2007 as a system‐based change to improve anticoagulant safety at our institution. The goals of this service were to improve communication regarding anticoagulation; to improve safety as patients transition from the inpatient‐to‐outpatient settings; and to standardize anticoagulant dosing, monitoring, and patient education. For patients taking warfarin, who are cared for by a health system‐affiliated physician, the PDAS collaborates with our outpatient anticoagulation clinics in order to facilitate transition from the inpatient‐to‐outpatient setting. The Henry Ford Health System has an established, multisite outpatient Anticoagulation Clinic with >5000 patients actively receiving warfarin dosing and monitoring. The anticoagulation clinics are staffed by nurses and pharmacists who provide standardized management of warfarin for patients of all physicians within our health system and provide consistent high‐quality care (average time in international normalized ratio [INR] goal range = 68.2%). The anticoagulation clinics have been in existence since 1992. The PDAS is comprised of three full‐time and two part‐time pharmacists whose responsibilities are limited to the management of anticoagulation throughout the hospital.

Pharmacist‐Directed Anticoagulation Service Responsibilities
Inpatient CarePatient EducationTransition of Care
  • Abbreviation: INR, international normalized ratio.

Initial dose selection and daily dose adjustments after warfarin is initiated by primary teamComprehensive education provided verbally and via written communication utilizing the Krames database.Contact anticoagulation‐responsible physician and anticoagulation clinic via phone.
Provide written dosing regimen to patient and provide date for first INR postdischarge.
Daily laboratory monitoringEducation provided is standardized between inpatient and outpatient settings.Create electronic Anticoagulation Discharge Summary. Document communication with the outpatient clinicians, reason for admission, steps taken to manage warfarin drug interactions, and warfarin doses administered during stay, discharge warfarin dose and follow‐up date.

The PDAS was staffed by repurposing pharmacist staff. All pharmacists had either several years of general medicine‐based clinical practice experience or residency training, or both. Pharmacists were oriented to service responsibilities by spending approximately one week in the outpatient anticoagulation clinic and completing focused review of internal and external anticoagulation guidelines.

In the control group, management of anticoagulation and transition of care occurred at the discretion of the primary care team. The primary team had access to a clinical pharmacist, who was not part of the PDAS, seven days per week. However, the primary team was not able to consult the PDAS.

This study was primarily designed to assess the impact of the PDAS on both transition of care and patient safety. For study endpoint purposes, transition of care was assessed by satisfactory completion and documentation of four important metrics: 1) appropriate enrollment in the anticoagulation clinic; 2) documented communication between the inpatient service responsible for anticoagulation and the outpatient anticoagulation clinic prior to patient discharge; 3) documented communication between the inpatient service responsible for anticoagulation and the physician responsible for outpatient management of the patient; 4) INR drawn within five days of hospital discharge. Documentation of communication for metric #2 and #3 was obtained by reviewing the electronic medical record system, particularly electronic discharge summaries and telephone encounter notes.

The primary safety endpoint was defined as a composite of any INR >5, any episode of major bleeding, or development of new thrombosis. This endpoint was met if any of these events occurred either during the index hospitalization or within 30 days of hospital discharge. Major bleeding was identified by review of outpatient anticoagulation clinic encounters and the patient's electronic medical record (includes all inpatient and outpatient encounters within Henry Ford Health System) by using the International Society of Thrombosis and Haemostasis standard and was defined as fatal bleeding or symptomatic bleeding in a critical area or organ (intracranial, intraspinal, intraocular, retroperitoneal, intraarticular, pericardial, or intramuscular with compartment syndrome), or bleeding causing a reduction in hemoglobin levels of 2 g/dL or more, or leading to transfusion of two or more units of blood or red cells.9 New thrombosis was defined as documentation of any of the following: deep vein thrombosis, pulmonary embolism, or cardioembolic stroke. Need for dose adjustment at the first anticoagulation clinic visit after discharge was evaluated as a secondary endpoint.

All analyses compared the PDAS to the control group. In addition, a planned comparison of patients in the PDAS and control groups who were newly initiated to warfarin during the study hospitalization (newly initiated subgroup) and those who were taking warfarin on admission (existing warfarin subgroup) was also undertaken. It was expected that these subgroup analyses would likely be underpowered, however, the potential implications of a service such as this could differ based on history of warfarin use. Therefore, these analyses were planned for exploratory purposes. In order to determine the impact of risk factors for altered warfarin pharmacodynamic response on the safety endpoint, post hoc subgroup analyses were performed based on demographics and clinical characteristics.

Data Analysis

Data are presented as mean standard deviation or proportion, as appropriate. A P‐value of less than 0.05 was considered significant for all comparisons and all tests were two‐tailed.

Intervention and control groups were compared with Student's t test, MannWhitney U test, chi‐square or Fishers exact test, as appropriate. Relative risk (RR) and 95% confidence intervals (CI) were calculated for all primary analyses. All statistical analyses were performed with SPSS v.12.0 (SPSS Inc, Chicago, IL).

It was estimated that a sample size of 250 patients per group would provide greater than 80% power to detect at least a 50% improvement in both the transition of care and primary safety endpoints, with implementation of the PDAS. This calculation is based on the following assumptions: alpha = 0.05; expected control group achievement of the four transition of care metrics = 50%; rate of safety endpoint for the control group = 20%.4

RESULTS

Baseline Characteristics

During the study period, 1360 patients were admitted to the study units. A total of 377 and 483 patients were found to be ineligible for inclusion on the PDAS and control units, respectively. These patients were ineligible because they did not follow up in the Henry Ford Medical Group outpatient anticoagulation clinic. In total, 500 patients were included in the analysis. Patients (n = 145) who were newly initiated on warfarin made up 29% of the total population. Table 2 presents baseline clinical characteristics for patients in the PDAS and control groups, showing increased age, and a greater proportion of patients with heart failure and LVADs in the PDAS group. Patients in the PDAS group had significantly longer hospital stays, however, these increases were driven by a longer length of stay among the advanced heart failure service patients that were managed by the PDAS.

Patient Demographics and Clinical Characteristics
 PDAS (n = 250)Control (n = 250)P Value
  • Abbreviation: LVAD, left ventricular assist device; PDAS, pharmacist‐directed anticoagulation service; SD, standard deviation.

  • Heart failure history and admission diagnoses determined through review of hospital discharge summaries.

  • Other less common indications for anticoagulation included: valvular disease, cardiomyopathy, left ventricular assist device, cardiac thrombosis.

Demographic data   
Age (mean SD)64.1 15.668.0 14.90.004
Male gender54.0%56.4%0.589
Caucasian race44.4%50.4%0.179
Admitted to a cardiology unit78.8%74.8%0.289
Length of stay (mean SD)8.13 7.046.29 5.630.001
No heart failure history: length of stay (mean SD)6.83 4.536.15 5.140.288
Heart failure history: length of stay (mean SD)9.09 8.316.45 6.150.004
History of heart failure*57.6%47.6%0.025
Heart failure with an LVAD14.0%0.4%<0.001
Indication for anticoagulation   
Venous thromboembolism21.6%18.4%0.371
Atrial fibrillation54.4%66.4%0.006
Other24.0%15.2%0.013
Primary admission diagnosis*   
Heart failure25.6%*21.6%0.292
Atrial fibrillation16.4%20.8%0.206
Acute coronary syndrome13.6%17.6%0.218
Venous thromboembolism4.8%4.8%1.00
Infection12.4%10.0%0.395
Bleeding1.6%1.2%0.703

Early Warfarin Management

Warfarin management metrics are presented in Table 3. The number of inpatient days prescribed warfarin was increased in the PDAS group by greater than one day while PDAS patients required significantly less dosage adjustment at first outpatient follow‐up visit. Similar to increases noted with length of stay, increases in inpatient warfarin days were likely driven by patients with severe heart failure managed by the PDAS.

Warfarin Management Metrics
Warfarin DosingPDAS (n = 250)Control (n = 250)P Value
  • Abbreviation: INR, international normalized ratio; PDAS, Pharmacist‐Directed Anticoagulation Service; SD, standard deviation.

Initial dose (mean SD)5.23 2.374.99 2.070.245
Discharge dose (mean SD)5.15 2.524.91 2.140.258
INR at discharge (mean SD)2.07 0.732.04 0.730.660
Therapeutic INR at discharge40.8%38.0%0.522
Inpatient warfarin days (mean SD)4.97 4.303.68 2.69<0.001
No heart failure: inpatient warfarin days (mean SD)4.09 2.493.60 2.670.148
Heart failure: inpatient warfarin days (mean SD)5.62 5.163.76 2.71<0.001
Dose change required at first follow‐up visit44.8%72.6%<0.001

Transition of Care

Transition of care results are presented in Table 4. Full compliance and achievement of the transition of care metrics occurred significantly more often in the PDAS versus control patients with markedly increased rates of documented communication between inpatient providers and both outpatient anticoagulation clinic staff and outpatient physicians. Early follow‐up INR monitoring also occurred more frequently in the PDAS patients. The PDAS patients experienced greater compliance with the transition of care metrics regardless of whether they were in the newly initiated or existing warfarin subgroups (data not shown).

Transition of Care and Safety Results
Transition of CarePDAS (n = 250)Control (n = 250)Relative Risk (95% CI)P Value
  • Abbreviation: AC, anticoagulation; CI, confidence interval; INR, international normalized ratio; N/A, not applicable; PDAS, pharmacist‐directed anticoagulation service.

  • Appropriate enrollment in the anticoagulation clinic; documented communication between the inpatient service and outpatient physician; documented communication between the inpatient clinicians and anticoagulation clinic staff; INR drawn within 5 days of discharge.

  • Rate of inpatient and 30‐day INR >5; major bleeding; thrombosis.

100% Communication bundle* compliance, % (n)75.6% (189)2.8% (7)27.0 (13.056.2)<0.001
Appropriately enrolled in the AC clinic, % (n)97.2% (243)95.2% (238)1.02 (0.991.06)0.242
Communication: inpatient service and outpatient physician, % (n)99.6% (249)12.4% (31)8.03 (5.7811.2)<0.001
Communication: inpatient clinicians and AC clinic staff, % (n)98.8% (247)14.8% (37)6.68 (4.969.00)<0.001
INR drawn within five days of hospital discharge, % (n)78.4% (196)66.4% (166)1.18 (1.061.32)0.003
30‐Day Composite safety endpoint, % (n)10.0% (25)14.8% (37)0.68 (0.421.09)0.103
Inpatient + 30‐day INR >5, % (n)9.6% (24)14.8% (37)0.65 (0.401.05)0.076
Inpatient + 30‐day major bleeding, % (n)0.8% (2)0.4% (1)2.00 (0.1821.9)0.563
Inpatient + 30‐day thrombosis, % (n)0% (0)0% (0)N/AN/A

Anticoagulant Safety

Safety endpoint data is presented in Table 4. The composite safety outcome of INR >5, major bleeding event, or thrombosis occurred in 12.4% of all patients with no early thrombotic events and only three major bleeding events recorded. Excessive INR values >5 occurred less frequently in the PDAS patients, however, differences in this metric and the composite safety outcome were not significantly different. Safety endpoint results in the overall population were driven by a reduction in INR values >5 among newly initiated warfarin patients in the PDAS group (PDAS: 9.5% vs control: 19.7%; P = 0.079; Figure 1). Other subgroup analyses relating to the safety endpoint are presented in Figure 1.

Figure 1
Subgroup analysis of composite safety endpoint: Pharmacist‐Directed Anticoagulation Service (PDAS) vs control based on patient characteristics and demographics.

DISCUSSION

This article describes a systematic intervention designed to improve anticoagulation safety and efficacy in the hospital and during the transition to the postdischarge setting. Implementation of a PDAS did not impact patient bleeding and thrombotic outcomes, but did result in improved coordination and documentation of warfarin management and subsequent enhancement in the transition of the anticoagulated patient from the inpatient‐to‐outpatient setting with the Pharmacist‐Directed Anticoagulation Service.

Limited previous work has investigated the role of an anticoagulation service in inpatient management of anticoagulation.48 Only one published study has investigated the impact of this type of service on transition of care issues with warfarin, as was done in our study.7 In that study, management by an inpatient anticoagulation service resulted in a greater proportion of patients referred to an anticoagulation clinic for management (P = 0.001), more patients presenting to the anticoagulation clinic with a therapeutic INR (P = 0.001), and fewer patients presenting to the clinic with supratherapeutic levels of anticoagulation (P = 0.002). These results are somewhat analogous to our findings, in that patients in our study were less likely to require a dose change at the first clinic follow‐up visit after discharge or to have INR values 5.

We completed several subgroup analyses to thoroughly explore the impact of the PDAS on the safety endpoint. While firm conclusions cannot be drawn from these subgroup analyses, some hypothesis‐generating observations can be made. First, there was a greater impact of the PDAS on the safety endpoint in patients who are usually more sensitive to the effects of warfarin and therefore more challenging to manage.2 The impact of the PDAS was also greater among patients whose length of stay was more than five days (population median). This is significant because it suggests that when the opportunity for adverse events and miscommunication is greatest (ie, during hospitalizations of longer duration), there appears to be improvement in the safety endpoint with the PDAS.

To our knowledge, this study was the first to explore the impact of an inpatient anticoagulation service on the care of both newly initiated and existing warfarin patients, rather than only patients newly initiated on warfarin. As expected, the greatest influence of the PDAS on the safety endpoint was observed among the newly initiated patients. While the safety impact of the PDAS was noted most significantly among the newly initiated patients, the PDAS had a positive effect on the transition of care metrics regardless of previous warfarin use.

A limitation of our study should be mentioned. While we employed a design in which randomly selected units were exposed to the PDAS, individual patients were not randomized to the service. This cluster randomized design was chosen because it mimics quality improvement processes that would be rolled out to a hospital nursing unit. While lack of randomization at the patient level is a limitation, our cluster randomized study design is pragmatic and represents an improvement over the existing published before and after quasi‐experimental studies in this area.48

An improved system for documentation of communication was built into the PDAS processes on implementation of the service. However, it should also be noted that inadequate communication between inpatient and outpatient providers was an identified root cause for adverse events with warfarin in our institution prior to implementation of the PDAS. Therefore, improvement in the transition of care metrics with the PDAS were likely due to a combination of both improved documentation and true improvement in communication.

The approach of the PDAS was refined in several ways early after implementation of the service. Some major notable improvements included the development of a systematic approach to ensuring appropriate follow‐up and transition of care for patients being discharged to a skilled nursing facility, and creation of a system that required a mandatory conversation between the PDAS and a surgical service if anticoagulation is ordered within 48 hours of a major procedure. An upcoming improvement to the service will be to transition from a home grown electronic database, which was built for the purposes of streamlining clinical workflow and data collection, to a commercially available software program that has recently become available for management of inpatient anticoagulation. The major advantage of the new program will be the clinical decision support capabilities that will help to further streamline the service and allow for greater efficiency.

To understand implications of our PDAS intervention, it is important to remember that the majority of study patients were prescribed warfarin prior to hospital admission, that patients in both study groups were enrolled in an established, multisite anticoagulation clinic, and that patients in both groups were managed with a comprehensive inpatientoutpatient electronic medical record. Therefore, all providers caring for these patients had real‐time access to all warfarin dosing and dose adjustments, INR results, and anticoagulation clinic encounters, even though formal communication between providers was infrequently documented for control group patients in our electronic medical record. Study patients had low rates of bleeding and no adverse thrombotic outcomes across both treatment groups. Therefore, this type of model is likely to produce larger gains in communication and safety outcomes in health care systems without established anticoagulation clinics or comprehensive electronic medical records.

The PDAS was enthusiastically accepted by providers at our institution and expanded hospital‐wide after completion of this pilot. The PDAS model is a viable approach to standardize anticoagulant management with a goal of improving anticoagulant safety in the inpatient setting. Assessment of the effectiveness of models such as the PDAS for improving anticoagulant safety in the inpatient setting is particularly relevant with the current expectations for hospitals set by The Joint Commission's NPSG.03.05.01.3 More importantly the PDAS model can be an option for improving the transition of the anticoagulated patient from the inpatient‐to‐outpatient setting. Follow‐up with the anticoagulation clinic occurred earlier with the PDAS and, while this study was not designed to evaluate the impact of this new service on rehospitalization, recent literature suggests that earlier follow‐up after discharge leads to less rehospitalization.10 Finally, it may be possible to adapt this model to provide more intensive medication therapy management and monitoring for hospitalized patients with other complicated medication regimens or chronic disease.

CONCLUSION

The clinical pharmacist is uniquely prepared to manage inter‐individual variability in pharmacodynamic response to drug therapy, as well as to provide high‐quality patient education. This study evaluated a new model of inpatient warfarin management, in which warfarin dosing, monitoring, patient education, and transition of care was coordinated by a specialized team of clinical pharmacists that worked in collaboration with physicians and outpatient anticoagulation clinic staff. Safety and efficiency of the care provided by this new service was improved in certain subsets of more complex patients. The major advantage of this service was improvement in patient handoff, improved communication, and earlier patient follow‐up after discharge. Therefore, implementation of a Pharmacist‐Directed Anticoagulation Service provides a net improvement in quality of care for the patient taking warfarin in the inpatient setting.

Acknowledgements

The authors acknowledge the efforts of the PDAS staff: Nassif Abi‐Samra, Pam Holland, Sara Lanfear, and Gail Washington. This work would not have been possible without the dedication of these pharmacists. All authors had full access to all of the data in the study and take responsibility for the integrity of the data and the accuracy of the data analysis.

References
  1. U.S. Pharmacopeia. USP Patient Safety CapsLink: January 2008. Available at: http://www.usp.org/pdf/EN/patientSafety/capsLink2008–01‐01.pdf. Accessed March 19,2010.
  2. Ansel J,Hirsh J,Hylek E,Jacobson A,Crowther M,Palareti G.Pharmacology and management of the vitamin K antagonists: American College of Chest Physicians evidence‐based clinical practice guidelines (8th ed.).Chest.2008;133:160S198S.
  3. The Joint Commission. 2009 National Patient Safety Goals. Available at: http://www.jointcommission.org/NR/rdonlyres/31666E86‐E7F4–423E‐9BE8‐F05BD1CB0AA8/0/HAP_NPSG.pdf. Accessed May 6,2010.
  4. Dager WE,Branch JM,King JH, et al.Optimization of inpatient warfarin therapy: impact of a daily consultation by a pharmacist‐managed anticoagulation service.Ann Pharmacother.2000;34:567572.
  5. Rivey MP,Wood RD,Allington DR, et al.Pharmacy‐managed protocol for warfarin use in orthopedic surgery patients.Am J Health‐Syst Pharm.1995;52:13101316.
  6. Boddy C.Pharmacist involvement with warfarin dosing for inpatients.Pharm World Sci.2001;23:3135.
  7. Ellis RF,Stephens MA,Sharp GB.Evaluation of a pharmacy‐managed warfarin‐monitoring service to coordinate inpatient and outpatient therapy.Am J Hosp Pharm.1992;49:387394.
  8. To EK,Pearson GJ.Implementation and evaluation of a pharmacist‐assisted warfarin dosing program.Can J Hosp Pharm.1997;50:169175.
  9. Schulman S,Kearon C.Definition of major bleeding in clinical investigations of antihemostatic medicinal products in non‐surgical patients.J Thromb Haemostasis.2005;3:692694.
  10. Jencks SF,Williams MV,Coleman EA.Rehospitalizations among patients in the Medicare fee‐for‐service program.N Engl J Med.2009;360:14181428.
References
  1. U.S. Pharmacopeia. USP Patient Safety CapsLink: January 2008. Available at: http://www.usp.org/pdf/EN/patientSafety/capsLink2008–01‐01.pdf. Accessed March 19,2010.
  2. Ansel J,Hirsh J,Hylek E,Jacobson A,Crowther M,Palareti G.Pharmacology and management of the vitamin K antagonists: American College of Chest Physicians evidence‐based clinical practice guidelines (8th ed.).Chest.2008;133:160S198S.
  3. The Joint Commission. 2009 National Patient Safety Goals. Available at: http://www.jointcommission.org/NR/rdonlyres/31666E86‐E7F4–423E‐9BE8‐F05BD1CB0AA8/0/HAP_NPSG.pdf. Accessed May 6,2010.
  4. Dager WE,Branch JM,King JH, et al.Optimization of inpatient warfarin therapy: impact of a daily consultation by a pharmacist‐managed anticoagulation service.Ann Pharmacother.2000;34:567572.
  5. Rivey MP,Wood RD,Allington DR, et al.Pharmacy‐managed protocol for warfarin use in orthopedic surgery patients.Am J Health‐Syst Pharm.1995;52:13101316.
  6. Boddy C.Pharmacist involvement with warfarin dosing for inpatients.Pharm World Sci.2001;23:3135.
  7. Ellis RF,Stephens MA,Sharp GB.Evaluation of a pharmacy‐managed warfarin‐monitoring service to coordinate inpatient and outpatient therapy.Am J Hosp Pharm.1992;49:387394.
  8. To EK,Pearson GJ.Implementation and evaluation of a pharmacist‐assisted warfarin dosing program.Can J Hosp Pharm.1997;50:169175.
  9. Schulman S,Kearon C.Definition of major bleeding in clinical investigations of antihemostatic medicinal products in non‐surgical patients.J Thromb Haemostasis.2005;3:692694.
  10. Jencks SF,Williams MV,Coleman EA.Rehospitalizations among patients in the Medicare fee‐for‐service program.N Engl J Med.2009;360:14181428.
Issue
Journal of Hospital Medicine - 6(6)
Issue
Journal of Hospital Medicine - 6(6)
Page Number
322-328
Page Number
322-328
Article Type
Display Headline
Clinical and safety impact of an inpatient Pharmacist‐Directed anticoagulation service
Display Headline
Clinical and safety impact of an inpatient Pharmacist‐Directed anticoagulation service
Sections
Article Source

Copyright © 2011 Society of Hospital Medicine
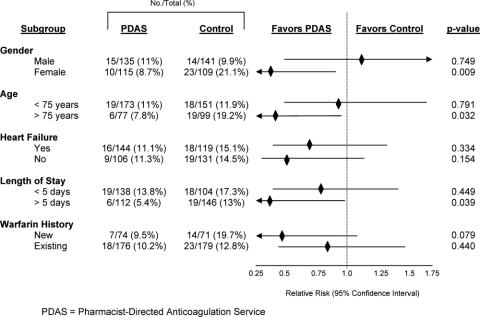
Disallow All Ads
Correspondence Location
BCPS (AQ CV), Patient Care Services, Henry Ford Hospital, 2799 West Grand Blvd., Detroit, MI 48202
Content Gating
No Gating (article Unlocked/Free)
Alternative CME
Article PDF Media

Characteristics of High Cost/LOS Patients

Article Type
Changed
Display Headline
Characteristics associated with higher cost per day or longer length of stay in hospitalized patients who died during the hospitalization or were discharged to hospice

Patients with advanced illness frequently do not receive care that meets their physical and emotional needs at the end of life,1 despite significant expenditures. Palliative care has been recommended as an approach to improve the quality of care for patients with advanced illness,26 while achieving hospital cost savings.7 Studies show that palliative care consults are associated with decreased hospitalization cost712 and length of stay13, 14 in the acute care setting.

Identifying which hospitalized patients are likely to benefit most from palliative care has not been well defined. The Hamilton Chart Audit tool was developed to estimate the number of patients that would benefit from a palliative care consult, in order to determine hospital palliative care staffing and financial needs.15 The CARING criteria identifies patients on admission to the hospital who are at high risk of death within one year and may, therefore, benefit from palliative care.16 The literature from the medical intensive care unit (MICU) identifies palliative care core competencies and quality measures, but does not describe patient factors that should trigger a palliative care consult.1719 Norton et al. studied proactive palliative care consultation in the MICU, finding that palliative care consultation in the high‐risk group (serious illness and high risk of dying) was associated with a shorter MICU length of stay without a significant difference in mortality rates.14

The most specific triggers for a palliative care consult comes from the surgical intensive care guidelines. The American College of Surgeons Surgical Palliative Care Task Force published a consensus guideline based on expert opinion identifying the top ten triggers for a palliative care consultation in the surgical intensive care unit (SICU).20 The top 10 criteria to identify SICU patients for palliative care consultation listed in order of priority were: 1) family request; 2) futility considered or declared by the medical team; 3) family disagreement with the team, advance directive, or each other lasting greater than seven days; 4) death expected during the same SICU stay; 5) SICU stay of greater than one month; 6) diagnosis with a median survival of less than six months; 7) greater than three SICU admissions during the same hospitalization; 8) Glasgow Coma Score of less than eight for greater than one week in a patient greater than 75 years old; 9) Glasgow Outcome Score of less than three (i.e., persistent vegetative state); and 10) multisystem organ failure of greater than three systems.

Studies are lacking that identify hospitalized patients who are more likely to have higher cost per day or length of stay, as these are patients who may benefit from palliative care. We sought to identify patient characteristics that are associated with higher cost per day or longer length of stay in hospitalized patients who died during the hospitalization or were discharged to hospicepatients likely to benefit from targeted palliative care services. We hypothesized that hospitalized patients with the following characteristics who died during the hospitalization or were discharged to hospice would have a higher cost per day or longer length of stay: older patients, lack of insurance, and patients receiving care from a critical care specialty.

METHODS

Study Design

We analyzed administrative data from a single academic hospital, the University of Colorado Hospital, a tertiary care, academic hospital with approximately 400 beds. The study population consisted of hospitalized adult patients (age 18 years) who died during hospitalization or were discharged to hospice in 2006 and 2007. We included both patients discharged to hospice and those who died during hospitalization, as we were seeking to identify a hospitalized patient population who might be expected to benefit from palliative care: those at high risk of death in the near future. Predictors were selected on the basis of clinical experience and the literature. Cost per day and length of stay were the outcome variables. Institutional Review Board (IRB) approval was not necessary because all of the study patients were deceased at the time of analysis.

Due to resource limitations, we were only able to gather clinical information (presence of organ failure [cardiac, respiratory, renal, hepatic, neurologic] or sepsis on admission, and presence or absence of palliative care consultation during hospitalization) from chart review in a subset of the sample population: those that had the highest 10% total hospitalization costs (n = 115). Organ failure was defined as chart documentation of any of the following: 1) cardiac: ST segment elevation myocardial infarction, non‐ST segment elevation myocardial infarction, congestive heart failure, heart failure (n = 28); 2) respiratory: respiratory failure (n = 36); 3) renal: acute kidney injury, acute renal failure, chronic renal failure, dialysis, end‐stage renal disease (n = 42); 4) hepatic: hepatic failure, end‐stage liver disease (n = 10); and 5) neurologic: altered mental status, delirium (n = 4). Sepsis was defined as chart documentation of any of the following: sepsis, severe sepsis, or septic shock.

Outcomes

We found total cost and length of stay to be correlated. Therefore, we used cost per day in lieu of total cost as the primary outcome. Length of stay was the secondary outcome. Using cost per day as the primary outcome reduced the correlation between our primary and secondary outcomes.

Predictors

Potential predictors (age, insurance status, and attending physician specialty) were selected on the basis of clinical experience, the literature, and patient variables available from the administrative data. We also considered diagnosis‐related group (DRG), however, the wide range of unique DRGs for this population did not allow for sensible groupings, so DRG was excluded from further analyses. For descriptive purposes, mean (standard deviation, SD) age was reported. For modeling, age was centered at 65 years, because this is the age of Medicare eligibility and thus a likely point at which insurance status would change. Sixty‐five was also close to the mean age of the full population, 62 years, therefore ensuring that interactions were assessed over the bulk of the data, rather than at outlying points. We also divided age into ten‐year increments for easier interpretation of model estimates. The relationship between age and primary and secondary outcomes differed among younger vs older patients. Therefore, age was included as a piecewise term in the final multivariate linear model which allowed a separate slope to be fit for patients age <65 years vs those 65 years.

Insurance status was dichotomized as insured vs uninsured. Attending physician specialty categories (internal medicine, pulmonary critical care, neurosurgery, surgical oncology, and cardiothoracic surgery) were selected because they were the five most common specialties. The remaining specialties were grouped together as other, which was used as a reference group in the multivariate analyses as it constituted a nontrivial proportion of the study population.

Statistical Analyses

Univariate analyses were performed separately for the primary and secondary outcomes. Univariate associations between the outcomes and categorical predictors were tested using analysis of variance (ANOVA) models with adjustment for multiple comparisons. Associations between the outcomes and the binary predictors were assessed with t‐tests. Predictors that were significant at the 0.10 level and considered clinically relevant were included in the multivariate model. Interaction terms between predictors were examined and included in the final multivariate piecewise linear models, when inclusion of the interaction terms altered the magnitude of the model estimates.

RESULTS

The study population comprised 1155 hospitalizations. Nine hospitalizations were excluded from analysis (five for organ donation, three were erroneousthe patients were not discharged to hospice or did not die during the hospitalization, and one was a pediatric patient), resulting in a study population of n = 1146 hospitalizations.

Table 1 depicts study population characteristics. The average patient age was 62 years (SD = 16), and 96% of patients were insured. The average length of stay was 10.7 days (SD = 14.1), with an average total cost per admission of $44,410 (SD = 76,355), as compared to an overall hospital admission (excluding obstetrics/neonatology) average length of stay of 5.7 days (SD = 8.5) and average total cost per admission of $17,410 (SD = 36,633) during the same time period. The average cost per day was $5095 (SD = $8546). About one‐third of patients were admitted to internal medicine, 20% to pulmonary critical care, and 18% to surgical specialties. The remaining 29% belonged to other specialties.

Patient Characteristics
Number of patients, n (%)1146
Death in hospital730 (63.7)
Discharged with hospice416 (36.3)
Age (years), mean (SD)61.7 (15.9)
Insurance, n (%) 
Uninsured52 (4.5)
Insured1,094 (95.5)
Length of stay (days), mean (SD)10.7 (14.1)
Total cost, mean (SD)$44,410 (76,355)
Cost per day, mean (SD)$5,095 (8,546)
Attending MD specialty, n (%) 
Cardiothoracic Surgery56 (4.9)
Pulmonary Critical Care230 (20.1)
Surgical Oncology70 (6.1)
Internal Medicine383 (33.4)
Neurosurgery77 (6.7)
Other330 (28.8)

Univariate Analyses

Overall, younger patients had a higher cost per day (Pearson 0.09; P = 0.02) and longer length of stay (Pearson 0.15; P < 0.0001) than older patients (data not shown). According to age groups defined by quartiles, patients who were age <51 and between 61‐72 years had significantly higher cost per day than patients age 73 years ($5787 and $5826 vs $3649, respectively; ANOVA P = 0.005; pairwise P < 0.05). The length of stay for the age groups under 73 years of age were significantly longer than for the patients who were 73 years of age and older (11.9, 11.9, and 11.2 vs 8.0 days, respectively; ANOVA P = 0.001; pairwise P < 0.05; Table 2). Uninsured patients had a higher cost per day ($6618 vs $5023; P = 0.02) than insured patients. In pairwise comparisons, patients on the cardiothoracic surgery service had a higher cost per day ($17,942) than any other specialty (ANOVA P < 0.0001; pairwise P < 0.05). Neurosurgery patients had a higher cost per day ($7089) than the internal medicine patients ($3173; pairwise P < 0.05). Cardiothoracic surgery patients also had a significantly higher LOS (18.3 days) than internal medicine (8.0 days), critical care (11.6 days), neurosurgery (10.0 days), and the other (10.9 days) specialties (ANOVA P < 0.0001; pairwise P < 0.05). The LOS for internal medicine (8.0 days) was significantly lower than critical care (11.6 days), surgical oncology (15.9 days), and cardiothoracic surgery (18.3 days; pairwise P < 0.05).

Univariate Analysis: Cost per Day and Length of Stay
VariableNCost per day [$] (mean [SD])P ValueLength of stay [days] (mean [SD])P Value
  • The Cardiothoracic Surgery group has significantly higher cost per day than the other five categories. Cost per day for Internal Medicine is significantly lower than for the Neurosurgery specialty.

  • The Cardiothoracic Surgery group has significantly higher length of stay than Internal Medicine, Pulmonary Critical Care, Neurosurgery, and Other categories. Length of stay for Internal Medicine is significantly lower than Pulmonary Critical Care, Surgical Oncology, and Cardiothoracic Surgery.

 1146    
Age group, quartiles     
<51 years2815,787 (8,008)0.00511.9 (16.4)0.001
51‐602645,202 (7,643) 11.9 (15.4) 
61‐722975,826 (12,272) 11.2 (14.1) 
733043,649 (3,978) 8.0 (9.7) 
Insurance     
Insured10945,023 (8,691)0.0210.8 (14.2)0.23
Uninsured526,618 (4,297) 8.4 (13.5) 
Attending MD specialty     
Internal Medicine3833,173 (2,647)<0.0001*8.0 (11.0)<0.0001
Pulmonary Critical Care2304,671 (2,734) 11.6 (14.3) 
Neurosurgery777,089 (6,103) 10.0 (13.5) 
Surgical Oncology705,768 (3,521) 15.9 (17.9) 
Cardiothoracic Surgery5617,942 (26,943) 18.3 (23.6) 
Other3304,833 (8,641) 10.9 (13.6) 

Multivariate Analyses

Cost per Day

The final multivariate linear model included age and attending physician specialty. Insurance status was excluded because it lost significant association with cost per day when it was added to the model (Table 3). Compared to the other specialty, internal medicine decreased cost per day by $1531 (P = 0.01), neurosurgery increased cost per day by $2255 (P = 0.03), and cardiothoracic surgery increased cost per day by $12,937 (P < 0.0001). Cost per day decreased by $811 (SE = 349; P = 0.02) for each age decade 65 years, however, no effect was observed on cost per day for those younger than 65 years.

Final Model for Cost per Day Using Piecewise Age Function Centered at Age 65 Years
PredictorsEstimated Effect ($)95% Confidence IntervalP Value to Test if = 0
Other specialty (reference group at 65 yr)5209(4,133, 6,284) 
Internal Medicine1,531(2,709, 353)0.01
Pulmonary Critical Care217(1,562, 1,128)0.75
Neurosurgery2255(278, 4,232)0.03
Surgical Oncology1064(994, 3,122)0.31
Cardiothoracic Surgery12937(10,676, 15,198)<0.0001
Age per 10 yr/age <657(506, 519)0.98
Age per 10 yr/age 65811(1,497, 125)0.02

Length of Stay

Because age and attending physician specialty had a significant effect on length of stay, multivariate analyses were performed with these two predictor variables (Table 4). Compared to the other specialty, internal medicine decreased length of stay by 2.4 days (P = 0.02), surgical oncology increased LOS by 5.3 days (P = 0.003), and cardiothoracic surgery increased length of stay by 6.9 days (P = 0.001). Length of stay was significantly decreased by 1.8 days (SE = 0.61; P = 0.003) for each age decade 65 years.

Final Model for Length of Stay (Days) Using Attending Physician Specialty and Piecewise Age Function Centered at 65 Years
PredictorsEstimated Effect (days)95% Confidence IntervalP Value to Test if = 0
Other specialty (reference group at 65 yr)11(9.1, 12.9) 
Internal Medicine2.4(4.4, 0.3)0.02
Pulmonary Critical Care0.5(1.9, 2.8)0.7
Neurosurgery0.9(4.3, 2.6)0.62
Surgical Oncology5.3(1.8, 8.9)0.003
Cardiothoracic Surgery6.9(3.0, 10.9)0.001
Age per 10 yr/age <650.8(1.7, 0.1)0.08
Age per 10 yr/age 651.8(3.0, 0.6)0.003

DISCUSSION

We found several characteristics that were significantly associated with higher cost per day or longer length of stay in patients who died during hospitalization or were discharged to hospice. Among this patient population, the surgical specialty services had overall higher cost per day and length of stay than other services. Patients cared for on the cardiothoracic surgery service had higher cost per day and length of stay; in contrast, internal medicine patients had lower cost per day and length of stay. Neurosurgery patients had higher cost per day, while surgical oncology patients had higher length of stay. Patients age 65 years and older had a significantly lower cost per day and shorter length of stay than those less than 65 years of age.

Higher cost per day for cardiothoracic surgery and neurosurgery patients may partially be explained by cardiothoracic surgery patients' usage of clinical services, including operating room services, which are higher in costs compared with those of nonsurgical specialties. Some patients may require repeat surgeries in the same hospitalization which further increases the cost per day. Longer length of stay in surgical oncology patients may be related to complex surgeries and possible postoperative complications that may take longer to recover from than standard surgeries.

Our findings that older patients have lower cost per day and shorter length of stay are corroborated by other studies. Lubitz and Riley21 found that in 1976 and 1988, Medicare payments per person year decreased with age. Levinsky et al.22 had similar findings in a review of Medicare data in 2001, but noted smaller reductions in total costabout $400 decrease for each year above 65. Their explanation of the lower cost is that older patients receive less aggressive care. Physicians, as well as patients and families, may continue to pursue expensive, invasive therapies for terminally ill patients who are younger for a longer period of time than with older patients, which would increase cost per day as well as length of stay.

The finding that patients on the surgical specialty services may be a focus for active palliative care intervention has many implications. The American College of Surgeons Surgical Palliative Care Task Force consensus guideline triggers for a palliative care consultation in SICU applied clinically did not result in a change in palliative care consultation rate.23 The use of triggers for palliative care consultation may be an ineffective approach because knowledge and application of the triggers did not change behavior. Focusing on integrating palliative care interventions or consultation for all high‐risk surgical patients, as opposed to relying upon triggers, may be a more effective approach to meeting these patients' palliative care needs while lowering cost per day and length of stay and warrants further study. For instance, palliative care consult teams may consider routine or daily rounds with the surgical specialty services in order to effectively integrate palliative care for these patients. Such an integrative approach may foster familiarity and comfort with palliative care approaches, facilitating access to palliative care services for those patients with palliative needs.

Our study is limited in that it is a retrospective, single‐center study. Our results may not be applicable to the general population. The experience of additional centers analyzed prospectively would provide additional context. The available administrative data limited the analyses to only a small number of predictors. In the subset population with the highest 10% total hospitalization costs, from which clinical information was gathered, the presence of respiratory failure was associated with shorter LOS (33 days vs 42 days; P = 0.03), but not associated with cost per day. Having sepsis at admission was associated with lower cost per day ($5783 vs $10,071; P = 0.04); however, this finding was based on only four patients with sepsis at admission. Patients who were evaluated by the palliative care service (n = 35) had a significantly lower cost per day ($4896 vs $12,210; P = 0.01) but longer LOS (46.5 vs 35.7 days; P = 0.03) than those who were not. These, and other, clinical characteristics need further testing in larger samples. An additional limitation is that we combined hospital decedents with patients discharged to hospice as our study population. These groups were combined since they are both at high risk of death in the near future; the median hospice length of stay in Colorado is 20 days.24 There may exist important differences in these populations that are not accounted for in our findings. Despite these unidentified differences, both populations are at high risk of death in the near future, making it likely that they would benefit from palliative care. Those who died during hospitalization did have a longer LOS (11.5 vs 9.2 days; P = 0.003) and higher cost per day ($6734 vs $2221; P < 0.0001) than those who were discharged to hospice.

Palliative care consultations can lead to improved quality of care for patients and families by addressing suffering and addressing quality of life measures (2, 4, 5, 6). We sought to identify characteristics associated with high cost and prolonged hospitalizations in patients who died during hospitalization, or were discharged to hospice, in order to inform targeting of palliative care services. Our data suggest that younger patients and those cared for by surgical specialty services may have the most palliative needs. Palliative care teams may consider focusing efforts at integrating palliative care with surgical specialty services to address these needs. These findings need to be corroborated in other centers, and include clinical outcomes.

References
  1. Teno JM,Clarridge BR,Casey V, et al.Family perspectives on end‐of‐life care at the last place of care.JAMA.2004;291:8893.
  2. Hearn J,Higginson IJ.Do specialist palliative care teams improve outcomes for cancer patients? A systematic literature review.Palliat Med.1998;12:317332.
  3. Qaseem A,Snow V,Shekelle P, et al.Evidence‐based interventions to improve the palliative care of pain, dyspnea, and depression at the end of life: a clinical practice guideline from the American College of Physicians.Ann Intern Med.2008;148:141146.
  4. Casarett D,Pickard A,Bailey FA, et al.Do palliative consultations improve patient outcomes?JAGS.2008;56:593599.
  5. Bakitas M,Lyons KD,Hegel MT, et al.Effects of a palliative cafe intervention on clinical outcomes in patients with advanced cancer.JAMA.2009;302:741749.
  6. Temel JS,Greer JA,Muzikansky A, et al.Early palliative care for patients with metastatic non‐small‐cell lung cancer.N Engl J Med.2010;363:733742.
  7. Morrison RS,Penrod JD,Cassel JB, et al.Cost savings associated with US hospital palliative care consultation programs.Arch Intern Med.2008;168(16):17831790.
  8. Back AL,Li YF,Sales AE.Impact of palliative care case management on resource use by patients dying of cancer at a Veterans Affairs Medical Center.J Palliat Med.2005;8(1):2635.
  9. Penrod JD,Deb P,Luhrs C, et al.Cost and utilization outcomes of patients receiving hospital‐based palliative care consultation.J Palliat Med.2006;9(4):855860.
  10. Smith TJ,Coyne P,Cassel B, et al.A high‐volume specialist palliative care unit and team may reduce in‐hospital end‐of‐life care costs.J Palliat Med.2003;6(5):699705.
  11. Ciemins EL,Blum L,Nunley M, et al.The economic and clinical impact of an inpatient palliative care consultation service: a multifaceted approach.J Palliat Med.2007;10(6):13471355.
  12. Penrod JD,Deb P,Dellenbaugh C, et al.Hospital‐based palliative care consultation: effects on hospital cost.J Palliat Med.2010;13(8):17.
  13. Campbell ML,Guzman JA.Impact of a proactive approach to improve end‐of‐life care in a medical ICU.Chest.2003;123:266271.
  14. Norton SA,Hogan LA,Holloway RG, et al.Proactive palliative care in the medical intensive care unit: effects on length of stay for selected high‐risk patients.Crit Care Med.2007;35:15301535.
  15. Slaven M,Wylie N,Fitzgerald B,Henderson N,Taylor S.Who needs a palliative care consult? The Hamilton Chart Audit tool.J Palliat Med.2007;10(2):304307.
  16. Fischer SM,Gozansky WS,Sauaia A,Min SJ,Kutner JS,Kramer A.A practical tool to identify patients who may benefit from a palliative care approach: the CARING criteria.J Pain Symptom Manage.2006;31:285292.
  17. Lanken PN,Terry PB,DeLisser HM, et al.An Official American Thoracic Society Clinical Policy Statement: palliative care for patients with respiratory diseases and critical illnesses.Am J Respir Crit Care Med.2008;177:912927.
  18. Mularski RA,Curtis JR,Billlings JA, et al.Proposed quality measures for palliative care in the critically ill: a consensus from the Robert Wood Johnson Foundation Critical Care Workgroup.Crit Care Med.2006;34:S404S411.
  19. Truog RD,Campbell ML,Curtis JR, et al.Recommendations for end‐of‐life care in the intensive care unit: a consensus statement by the American Academy of Critical Care Medicine.Crit Care Med.2008;36:953963.
  20. Bradley CT,Brasel KJ.Developing guidelines that identify patients who would benefit from palliative care services in the surgical intensive care unit.Crit Care Med.2009;37:946950.
  21. Lubitz JD,Riley GF.Trends in Medicare payments in the last year of life.N Engl J Med.1993;328:10921096.
  22. Levinsky NG,Yu W,Ash A, et al.Influence of age on Medicare expenditures and medical care in the last year of life.JAMA.2001;286:13491355.
  23. Bradley C,Weaver J,Brasel K.Addressing access to palliative care services in the surgical intensive care unit.Surgery.2010;147:871877.
  24. http://www.coloradocancercoalition.org/…/CCCConferenceKassner Slides11.13.07.ppt. Accessed August 16,2010.
  25. Al‐Shahri MZ,Sroor MY,Alsirafy SA.The impact of implementing referral criteria on the patterns of referrals and admissions to a palliative care program in Saudi Arabia.J Support Oncol.2010;8:7881.
Article PDF
Issue
Journal of Hospital Medicine - 6(6)
Page Number
338-343
Sections
Article PDF
Article PDF

Patients with advanced illness frequently do not receive care that meets their physical and emotional needs at the end of life,1 despite significant expenditures. Palliative care has been recommended as an approach to improve the quality of care for patients with advanced illness,26 while achieving hospital cost savings.7 Studies show that palliative care consults are associated with decreased hospitalization cost712 and length of stay13, 14 in the acute care setting.

Identifying which hospitalized patients are likely to benefit most from palliative care has not been well defined. The Hamilton Chart Audit tool was developed to estimate the number of patients that would benefit from a palliative care consult, in order to determine hospital palliative care staffing and financial needs.15 The CARING criteria identifies patients on admission to the hospital who are at high risk of death within one year and may, therefore, benefit from palliative care.16 The literature from the medical intensive care unit (MICU) identifies palliative care core competencies and quality measures, but does not describe patient factors that should trigger a palliative care consult.1719 Norton et al. studied proactive palliative care consultation in the MICU, finding that palliative care consultation in the high‐risk group (serious illness and high risk of dying) was associated with a shorter MICU length of stay without a significant difference in mortality rates.14

The most specific triggers for a palliative care consult comes from the surgical intensive care guidelines. The American College of Surgeons Surgical Palliative Care Task Force published a consensus guideline based on expert opinion identifying the top ten triggers for a palliative care consultation in the surgical intensive care unit (SICU).20 The top 10 criteria to identify SICU patients for palliative care consultation listed in order of priority were: 1) family request; 2) futility considered or declared by the medical team; 3) family disagreement with the team, advance directive, or each other lasting greater than seven days; 4) death expected during the same SICU stay; 5) SICU stay of greater than one month; 6) diagnosis with a median survival of less than six months; 7) greater than three SICU admissions during the same hospitalization; 8) Glasgow Coma Score of less than eight for greater than one week in a patient greater than 75 years old; 9) Glasgow Outcome Score of less than three (i.e., persistent vegetative state); and 10) multisystem organ failure of greater than three systems.

Studies are lacking that identify hospitalized patients who are more likely to have higher cost per day or length of stay, as these are patients who may benefit from palliative care. We sought to identify patient characteristics that are associated with higher cost per day or longer length of stay in hospitalized patients who died during the hospitalization or were discharged to hospicepatients likely to benefit from targeted palliative care services. We hypothesized that hospitalized patients with the following characteristics who died during the hospitalization or were discharged to hospice would have a higher cost per day or longer length of stay: older patients, lack of insurance, and patients receiving care from a critical care specialty.

METHODS

Study Design

We analyzed administrative data from a single academic hospital, the University of Colorado Hospital, a tertiary care, academic hospital with approximately 400 beds. The study population consisted of hospitalized adult patients (age 18 years) who died during hospitalization or were discharged to hospice in 2006 and 2007. We included both patients discharged to hospice and those who died during hospitalization, as we were seeking to identify a hospitalized patient population who might be expected to benefit from palliative care: those at high risk of death in the near future. Predictors were selected on the basis of clinical experience and the literature. Cost per day and length of stay were the outcome variables. Institutional Review Board (IRB) approval was not necessary because all of the study patients were deceased at the time of analysis.

Due to resource limitations, we were only able to gather clinical information (presence of organ failure [cardiac, respiratory, renal, hepatic, neurologic] or sepsis on admission, and presence or absence of palliative care consultation during hospitalization) from chart review in a subset of the sample population: those that had the highest 10% total hospitalization costs (n = 115). Organ failure was defined as chart documentation of any of the following: 1) cardiac: ST segment elevation myocardial infarction, non‐ST segment elevation myocardial infarction, congestive heart failure, heart failure (n = 28); 2) respiratory: respiratory failure (n = 36); 3) renal: acute kidney injury, acute renal failure, chronic renal failure, dialysis, end‐stage renal disease (n = 42); 4) hepatic: hepatic failure, end‐stage liver disease (n = 10); and 5) neurologic: altered mental status, delirium (n = 4). Sepsis was defined as chart documentation of any of the following: sepsis, severe sepsis, or septic shock.

Outcomes

We found total cost and length of stay to be correlated. Therefore, we used cost per day in lieu of total cost as the primary outcome. Length of stay was the secondary outcome. Using cost per day as the primary outcome reduced the correlation between our primary and secondary outcomes.

Predictors

Potential predictors (age, insurance status, and attending physician specialty) were selected on the basis of clinical experience, the literature, and patient variables available from the administrative data. We also considered diagnosis‐related group (DRG), however, the wide range of unique DRGs for this population did not allow for sensible groupings, so DRG was excluded from further analyses. For descriptive purposes, mean (standard deviation, SD) age was reported. For modeling, age was centered at 65 years, because this is the age of Medicare eligibility and thus a likely point at which insurance status would change. Sixty‐five was also close to the mean age of the full population, 62 years, therefore ensuring that interactions were assessed over the bulk of the data, rather than at outlying points. We also divided age into ten‐year increments for easier interpretation of model estimates. The relationship between age and primary and secondary outcomes differed among younger vs older patients. Therefore, age was included as a piecewise term in the final multivariate linear model which allowed a separate slope to be fit for patients age <65 years vs those 65 years.

Insurance status was dichotomized as insured vs uninsured. Attending physician specialty categories (internal medicine, pulmonary critical care, neurosurgery, surgical oncology, and cardiothoracic surgery) were selected because they were the five most common specialties. The remaining specialties were grouped together as other, which was used as a reference group in the multivariate analyses as it constituted a nontrivial proportion of the study population.

Statistical Analyses

Univariate analyses were performed separately for the primary and secondary outcomes. Univariate associations between the outcomes and categorical predictors were tested using analysis of variance (ANOVA) models with adjustment for multiple comparisons. Associations between the outcomes and the binary predictors were assessed with t‐tests. Predictors that were significant at the 0.10 level and considered clinically relevant were included in the multivariate model. Interaction terms between predictors were examined and included in the final multivariate piecewise linear models, when inclusion of the interaction terms altered the magnitude of the model estimates.

RESULTS

The study population comprised 1155 hospitalizations. Nine hospitalizations were excluded from analysis (five for organ donation, three were erroneousthe patients were not discharged to hospice or did not die during the hospitalization, and one was a pediatric patient), resulting in a study population of n = 1146 hospitalizations.

Table 1 depicts study population characteristics. The average patient age was 62 years (SD = 16), and 96% of patients were insured. The average length of stay was 10.7 days (SD = 14.1), with an average total cost per admission of $44,410 (SD = 76,355), as compared to an overall hospital admission (excluding obstetrics/neonatology) average length of stay of 5.7 days (SD = 8.5) and average total cost per admission of $17,410 (SD = 36,633) during the same time period. The average cost per day was $5095 (SD = $8546). About one‐third of patients were admitted to internal medicine, 20% to pulmonary critical care, and 18% to surgical specialties. The remaining 29% belonged to other specialties.

Patient Characteristics
Number of patients, n (%)1146
Death in hospital730 (63.7)
Discharged with hospice416 (36.3)
Age (years), mean (SD)61.7 (15.9)
Insurance, n (%) 
Uninsured52 (4.5)
Insured1,094 (95.5)
Length of stay (days), mean (SD)10.7 (14.1)
Total cost, mean (SD)$44,410 (76,355)
Cost per day, mean (SD)$5,095 (8,546)
Attending MD specialty, n (%) 
Cardiothoracic Surgery56 (4.9)
Pulmonary Critical Care230 (20.1)
Surgical Oncology70 (6.1)
Internal Medicine383 (33.4)
Neurosurgery77 (6.7)
Other330 (28.8)

Univariate Analyses

Overall, younger patients had a higher cost per day (Pearson 0.09; P = 0.02) and longer length of stay (Pearson 0.15; P < 0.0001) than older patients (data not shown). According to age groups defined by quartiles, patients who were age <51 and between 61‐72 years had significantly higher cost per day than patients age 73 years ($5787 and $5826 vs $3649, respectively; ANOVA P = 0.005; pairwise P < 0.05). The length of stay for the age groups under 73 years of age were significantly longer than for the patients who were 73 years of age and older (11.9, 11.9, and 11.2 vs 8.0 days, respectively; ANOVA P = 0.001; pairwise P < 0.05; Table 2). Uninsured patients had a higher cost per day ($6618 vs $5023; P = 0.02) than insured patients. In pairwise comparisons, patients on the cardiothoracic surgery service had a higher cost per day ($17,942) than any other specialty (ANOVA P < 0.0001; pairwise P < 0.05). Neurosurgery patients had a higher cost per day ($7089) than the internal medicine patients ($3173; pairwise P < 0.05). Cardiothoracic surgery patients also had a significantly higher LOS (18.3 days) than internal medicine (8.0 days), critical care (11.6 days), neurosurgery (10.0 days), and the other (10.9 days) specialties (ANOVA P < 0.0001; pairwise P < 0.05). The LOS for internal medicine (8.0 days) was significantly lower than critical care (11.6 days), surgical oncology (15.9 days), and cardiothoracic surgery (18.3 days; pairwise P < 0.05).

Univariate Analysis: Cost per Day and Length of Stay
VariableNCost per day [$] (mean [SD])P ValueLength of stay [days] (mean [SD])P Value
  • The Cardiothoracic Surgery group has significantly higher cost per day than the other five categories. Cost per day for Internal Medicine is significantly lower than for the Neurosurgery specialty.

  • The Cardiothoracic Surgery group has significantly higher length of stay than Internal Medicine, Pulmonary Critical Care, Neurosurgery, and Other categories. Length of stay for Internal Medicine is significantly lower than Pulmonary Critical Care, Surgical Oncology, and Cardiothoracic Surgery.

 1146    
Age group, quartiles     
<51 years2815,787 (8,008)0.00511.9 (16.4)0.001
51‐602645,202 (7,643) 11.9 (15.4) 
61‐722975,826 (12,272) 11.2 (14.1) 
733043,649 (3,978) 8.0 (9.7) 
Insurance     
Insured10945,023 (8,691)0.0210.8 (14.2)0.23
Uninsured526,618 (4,297) 8.4 (13.5) 
Attending MD specialty     
Internal Medicine3833,173 (2,647)<0.0001*8.0 (11.0)<0.0001
Pulmonary Critical Care2304,671 (2,734) 11.6 (14.3) 
Neurosurgery777,089 (6,103) 10.0 (13.5) 
Surgical Oncology705,768 (3,521) 15.9 (17.9) 
Cardiothoracic Surgery5617,942 (26,943) 18.3 (23.6) 
Other3304,833 (8,641) 10.9 (13.6) 

Multivariate Analyses

Cost per Day

The final multivariate linear model included age and attending physician specialty. Insurance status was excluded because it lost significant association with cost per day when it was added to the model (Table 3). Compared to the other specialty, internal medicine decreased cost per day by $1531 (P = 0.01), neurosurgery increased cost per day by $2255 (P = 0.03), and cardiothoracic surgery increased cost per day by $12,937 (P < 0.0001). Cost per day decreased by $811 (SE = 349; P = 0.02) for each age decade 65 years, however, no effect was observed on cost per day for those younger than 65 years.

Final Model for Cost per Day Using Piecewise Age Function Centered at Age 65 Years
PredictorsEstimated Effect ($)95% Confidence IntervalP Value to Test if = 0
Other specialty (reference group at 65 yr)5209(4,133, 6,284) 
Internal Medicine1,531(2,709, 353)0.01
Pulmonary Critical Care217(1,562, 1,128)0.75
Neurosurgery2255(278, 4,232)0.03
Surgical Oncology1064(994, 3,122)0.31
Cardiothoracic Surgery12937(10,676, 15,198)<0.0001
Age per 10 yr/age <657(506, 519)0.98
Age per 10 yr/age 65811(1,497, 125)0.02

Length of Stay

Because age and attending physician specialty had a significant effect on length of stay, multivariate analyses were performed with these two predictor variables (Table 4). Compared to the other specialty, internal medicine decreased length of stay by 2.4 days (P = 0.02), surgical oncology increased LOS by 5.3 days (P = 0.003), and cardiothoracic surgery increased length of stay by 6.9 days (P = 0.001). Length of stay was significantly decreased by 1.8 days (SE = 0.61; P = 0.003) for each age decade 65 years.

Final Model for Length of Stay (Days) Using Attending Physician Specialty and Piecewise Age Function Centered at 65 Years
PredictorsEstimated Effect (days)95% Confidence IntervalP Value to Test if = 0
Other specialty (reference group at 65 yr)11(9.1, 12.9) 
Internal Medicine2.4(4.4, 0.3)0.02
Pulmonary Critical Care0.5(1.9, 2.8)0.7
Neurosurgery0.9(4.3, 2.6)0.62
Surgical Oncology5.3(1.8, 8.9)0.003
Cardiothoracic Surgery6.9(3.0, 10.9)0.001
Age per 10 yr/age <650.8(1.7, 0.1)0.08
Age per 10 yr/age 651.8(3.0, 0.6)0.003

DISCUSSION

We found several characteristics that were significantly associated with higher cost per day or longer length of stay in patients who died during hospitalization or were discharged to hospice. Among this patient population, the surgical specialty services had overall higher cost per day and length of stay than other services. Patients cared for on the cardiothoracic surgery service had higher cost per day and length of stay; in contrast, internal medicine patients had lower cost per day and length of stay. Neurosurgery patients had higher cost per day, while surgical oncology patients had higher length of stay. Patients age 65 years and older had a significantly lower cost per day and shorter length of stay than those less than 65 years of age.

Higher cost per day for cardiothoracic surgery and neurosurgery patients may partially be explained by cardiothoracic surgery patients' usage of clinical services, including operating room services, which are higher in costs compared with those of nonsurgical specialties. Some patients may require repeat surgeries in the same hospitalization which further increases the cost per day. Longer length of stay in surgical oncology patients may be related to complex surgeries and possible postoperative complications that may take longer to recover from than standard surgeries.

Our findings that older patients have lower cost per day and shorter length of stay are corroborated by other studies. Lubitz and Riley21 found that in 1976 and 1988, Medicare payments per person year decreased with age. Levinsky et al.22 had similar findings in a review of Medicare data in 2001, but noted smaller reductions in total costabout $400 decrease for each year above 65. Their explanation of the lower cost is that older patients receive less aggressive care. Physicians, as well as patients and families, may continue to pursue expensive, invasive therapies for terminally ill patients who are younger for a longer period of time than with older patients, which would increase cost per day as well as length of stay.

The finding that patients on the surgical specialty services may be a focus for active palliative care intervention has many implications. The American College of Surgeons Surgical Palliative Care Task Force consensus guideline triggers for a palliative care consultation in SICU applied clinically did not result in a change in palliative care consultation rate.23 The use of triggers for palliative care consultation may be an ineffective approach because knowledge and application of the triggers did not change behavior. Focusing on integrating palliative care interventions or consultation for all high‐risk surgical patients, as opposed to relying upon triggers, may be a more effective approach to meeting these patients' palliative care needs while lowering cost per day and length of stay and warrants further study. For instance, palliative care consult teams may consider routine or daily rounds with the surgical specialty services in order to effectively integrate palliative care for these patients. Such an integrative approach may foster familiarity and comfort with palliative care approaches, facilitating access to palliative care services for those patients with palliative needs.

Our study is limited in that it is a retrospective, single‐center study. Our results may not be applicable to the general population. The experience of additional centers analyzed prospectively would provide additional context. The available administrative data limited the analyses to only a small number of predictors. In the subset population with the highest 10% total hospitalization costs, from which clinical information was gathered, the presence of respiratory failure was associated with shorter LOS (33 days vs 42 days; P = 0.03), but not associated with cost per day. Having sepsis at admission was associated with lower cost per day ($5783 vs $10,071; P = 0.04); however, this finding was based on only four patients with sepsis at admission. Patients who were evaluated by the palliative care service (n = 35) had a significantly lower cost per day ($4896 vs $12,210; P = 0.01) but longer LOS (46.5 vs 35.7 days; P = 0.03) than those who were not. These, and other, clinical characteristics need further testing in larger samples. An additional limitation is that we combined hospital decedents with patients discharged to hospice as our study population. These groups were combined since they are both at high risk of death in the near future; the median hospice length of stay in Colorado is 20 days.24 There may exist important differences in these populations that are not accounted for in our findings. Despite these unidentified differences, both populations are at high risk of death in the near future, making it likely that they would benefit from palliative care. Those who died during hospitalization did have a longer LOS (11.5 vs 9.2 days; P = 0.003) and higher cost per day ($6734 vs $2221; P < 0.0001) than those who were discharged to hospice.

Palliative care consultations can lead to improved quality of care for patients and families by addressing suffering and addressing quality of life measures (2, 4, 5, 6). We sought to identify characteristics associated with high cost and prolonged hospitalizations in patients who died during hospitalization, or were discharged to hospice, in order to inform targeting of palliative care services. Our data suggest that younger patients and those cared for by surgical specialty services may have the most palliative needs. Palliative care teams may consider focusing efforts at integrating palliative care with surgical specialty services to address these needs. These findings need to be corroborated in other centers, and include clinical outcomes.

Patients with advanced illness frequently do not receive care that meets their physical and emotional needs at the end of life,1 despite significant expenditures. Palliative care has been recommended as an approach to improve the quality of care for patients with advanced illness,26 while achieving hospital cost savings.7 Studies show that palliative care consults are associated with decreased hospitalization cost712 and length of stay13, 14 in the acute care setting.

Identifying which hospitalized patients are likely to benefit most from palliative care has not been well defined. The Hamilton Chart Audit tool was developed to estimate the number of patients that would benefit from a palliative care consult, in order to determine hospital palliative care staffing and financial needs.15 The CARING criteria identifies patients on admission to the hospital who are at high risk of death within one year and may, therefore, benefit from palliative care.16 The literature from the medical intensive care unit (MICU) identifies palliative care core competencies and quality measures, but does not describe patient factors that should trigger a palliative care consult.1719 Norton et al. studied proactive palliative care consultation in the MICU, finding that palliative care consultation in the high‐risk group (serious illness and high risk of dying) was associated with a shorter MICU length of stay without a significant difference in mortality rates.14

The most specific triggers for a palliative care consult comes from the surgical intensive care guidelines. The American College of Surgeons Surgical Palliative Care Task Force published a consensus guideline based on expert opinion identifying the top ten triggers for a palliative care consultation in the surgical intensive care unit (SICU).20 The top 10 criteria to identify SICU patients for palliative care consultation listed in order of priority were: 1) family request; 2) futility considered or declared by the medical team; 3) family disagreement with the team, advance directive, or each other lasting greater than seven days; 4) death expected during the same SICU stay; 5) SICU stay of greater than one month; 6) diagnosis with a median survival of less than six months; 7) greater than three SICU admissions during the same hospitalization; 8) Glasgow Coma Score of less than eight for greater than one week in a patient greater than 75 years old; 9) Glasgow Outcome Score of less than three (i.e., persistent vegetative state); and 10) multisystem organ failure of greater than three systems.

Studies are lacking that identify hospitalized patients who are more likely to have higher cost per day or length of stay, as these are patients who may benefit from palliative care. We sought to identify patient characteristics that are associated with higher cost per day or longer length of stay in hospitalized patients who died during the hospitalization or were discharged to hospicepatients likely to benefit from targeted palliative care services. We hypothesized that hospitalized patients with the following characteristics who died during the hospitalization or were discharged to hospice would have a higher cost per day or longer length of stay: older patients, lack of insurance, and patients receiving care from a critical care specialty.

METHODS

Study Design

We analyzed administrative data from a single academic hospital, the University of Colorado Hospital, a tertiary care, academic hospital with approximately 400 beds. The study population consisted of hospitalized adult patients (age 18 years) who died during hospitalization or were discharged to hospice in 2006 and 2007. We included both patients discharged to hospice and those who died during hospitalization, as we were seeking to identify a hospitalized patient population who might be expected to benefit from palliative care: those at high risk of death in the near future. Predictors were selected on the basis of clinical experience and the literature. Cost per day and length of stay were the outcome variables. Institutional Review Board (IRB) approval was not necessary because all of the study patients were deceased at the time of analysis.

Due to resource limitations, we were only able to gather clinical information (presence of organ failure [cardiac, respiratory, renal, hepatic, neurologic] or sepsis on admission, and presence or absence of palliative care consultation during hospitalization) from chart review in a subset of the sample population: those that had the highest 10% total hospitalization costs (n = 115). Organ failure was defined as chart documentation of any of the following: 1) cardiac: ST segment elevation myocardial infarction, non‐ST segment elevation myocardial infarction, congestive heart failure, heart failure (n = 28); 2) respiratory: respiratory failure (n = 36); 3) renal: acute kidney injury, acute renal failure, chronic renal failure, dialysis, end‐stage renal disease (n = 42); 4) hepatic: hepatic failure, end‐stage liver disease (n = 10); and 5) neurologic: altered mental status, delirium (n = 4). Sepsis was defined as chart documentation of any of the following: sepsis, severe sepsis, or septic shock.

Outcomes

We found total cost and length of stay to be correlated. Therefore, we used cost per day in lieu of total cost as the primary outcome. Length of stay was the secondary outcome. Using cost per day as the primary outcome reduced the correlation between our primary and secondary outcomes.

Predictors

Potential predictors (age, insurance status, and attending physician specialty) were selected on the basis of clinical experience, the literature, and patient variables available from the administrative data. We also considered diagnosis‐related group (DRG), however, the wide range of unique DRGs for this population did not allow for sensible groupings, so DRG was excluded from further analyses. For descriptive purposes, mean (standard deviation, SD) age was reported. For modeling, age was centered at 65 years, because this is the age of Medicare eligibility and thus a likely point at which insurance status would change. Sixty‐five was also close to the mean age of the full population, 62 years, therefore ensuring that interactions were assessed over the bulk of the data, rather than at outlying points. We also divided age into ten‐year increments for easier interpretation of model estimates. The relationship between age and primary and secondary outcomes differed among younger vs older patients. Therefore, age was included as a piecewise term in the final multivariate linear model which allowed a separate slope to be fit for patients age <65 years vs those 65 years.

Insurance status was dichotomized as insured vs uninsured. Attending physician specialty categories (internal medicine, pulmonary critical care, neurosurgery, surgical oncology, and cardiothoracic surgery) were selected because they were the five most common specialties. The remaining specialties were grouped together as other, which was used as a reference group in the multivariate analyses as it constituted a nontrivial proportion of the study population.

Statistical Analyses

Univariate analyses were performed separately for the primary and secondary outcomes. Univariate associations between the outcomes and categorical predictors were tested using analysis of variance (ANOVA) models with adjustment for multiple comparisons. Associations between the outcomes and the binary predictors were assessed with t‐tests. Predictors that were significant at the 0.10 level and considered clinically relevant were included in the multivariate model. Interaction terms between predictors were examined and included in the final multivariate piecewise linear models, when inclusion of the interaction terms altered the magnitude of the model estimates.

RESULTS

The study population comprised 1155 hospitalizations. Nine hospitalizations were excluded from analysis (five for organ donation, three were erroneousthe patients were not discharged to hospice or did not die during the hospitalization, and one was a pediatric patient), resulting in a study population of n = 1146 hospitalizations.

Table 1 depicts study population characteristics. The average patient age was 62 years (SD = 16), and 96% of patients were insured. The average length of stay was 10.7 days (SD = 14.1), with an average total cost per admission of $44,410 (SD = 76,355), as compared to an overall hospital admission (excluding obstetrics/neonatology) average length of stay of 5.7 days (SD = 8.5) and average total cost per admission of $17,410 (SD = 36,633) during the same time period. The average cost per day was $5095 (SD = $8546). About one‐third of patients were admitted to internal medicine, 20% to pulmonary critical care, and 18% to surgical specialties. The remaining 29% belonged to other specialties.

Patient Characteristics
Number of patients, n (%)1146
Death in hospital730 (63.7)
Discharged with hospice416 (36.3)
Age (years), mean (SD)61.7 (15.9)
Insurance, n (%) 
Uninsured52 (4.5)
Insured1,094 (95.5)
Length of stay (days), mean (SD)10.7 (14.1)
Total cost, mean (SD)$44,410 (76,355)
Cost per day, mean (SD)$5,095 (8,546)
Attending MD specialty, n (%) 
Cardiothoracic Surgery56 (4.9)
Pulmonary Critical Care230 (20.1)
Surgical Oncology70 (6.1)
Internal Medicine383 (33.4)
Neurosurgery77 (6.7)
Other330 (28.8)

Univariate Analyses

Overall, younger patients had a higher cost per day (Pearson 0.09; P = 0.02) and longer length of stay (Pearson 0.15; P < 0.0001) than older patients (data not shown). According to age groups defined by quartiles, patients who were age <51 and between 61‐72 years had significantly higher cost per day than patients age 73 years ($5787 and $5826 vs $3649, respectively; ANOVA P = 0.005; pairwise P < 0.05). The length of stay for the age groups under 73 years of age were significantly longer than for the patients who were 73 years of age and older (11.9, 11.9, and 11.2 vs 8.0 days, respectively; ANOVA P = 0.001; pairwise P < 0.05; Table 2). Uninsured patients had a higher cost per day ($6618 vs $5023; P = 0.02) than insured patients. In pairwise comparisons, patients on the cardiothoracic surgery service had a higher cost per day ($17,942) than any other specialty (ANOVA P < 0.0001; pairwise P < 0.05). Neurosurgery patients had a higher cost per day ($7089) than the internal medicine patients ($3173; pairwise P < 0.05). Cardiothoracic surgery patients also had a significantly higher LOS (18.3 days) than internal medicine (8.0 days), critical care (11.6 days), neurosurgery (10.0 days), and the other (10.9 days) specialties (ANOVA P < 0.0001; pairwise P < 0.05). The LOS for internal medicine (8.0 days) was significantly lower than critical care (11.6 days), surgical oncology (15.9 days), and cardiothoracic surgery (18.3 days; pairwise P < 0.05).

Univariate Analysis: Cost per Day and Length of Stay
VariableNCost per day [$] (mean [SD])P ValueLength of stay [days] (mean [SD])P Value
  • The Cardiothoracic Surgery group has significantly higher cost per day than the other five categories. Cost per day for Internal Medicine is significantly lower than for the Neurosurgery specialty.

  • The Cardiothoracic Surgery group has significantly higher length of stay than Internal Medicine, Pulmonary Critical Care, Neurosurgery, and Other categories. Length of stay for Internal Medicine is significantly lower than Pulmonary Critical Care, Surgical Oncology, and Cardiothoracic Surgery.

 1146    
Age group, quartiles     
<51 years2815,787 (8,008)0.00511.9 (16.4)0.001
51‐602645,202 (7,643) 11.9 (15.4) 
61‐722975,826 (12,272) 11.2 (14.1) 
733043,649 (3,978) 8.0 (9.7) 
Insurance     
Insured10945,023 (8,691)0.0210.8 (14.2)0.23
Uninsured526,618 (4,297) 8.4 (13.5) 
Attending MD specialty     
Internal Medicine3833,173 (2,647)<0.0001*8.0 (11.0)<0.0001
Pulmonary Critical Care2304,671 (2,734) 11.6 (14.3) 
Neurosurgery777,089 (6,103) 10.0 (13.5) 
Surgical Oncology705,768 (3,521) 15.9 (17.9) 
Cardiothoracic Surgery5617,942 (26,943) 18.3 (23.6) 
Other3304,833 (8,641) 10.9 (13.6) 

Multivariate Analyses

Cost per Day

The final multivariate linear model included age and attending physician specialty. Insurance status was excluded because it lost significant association with cost per day when it was added to the model (Table 3). Compared to the other specialty, internal medicine decreased cost per day by $1531 (P = 0.01), neurosurgery increased cost per day by $2255 (P = 0.03), and cardiothoracic surgery increased cost per day by $12,937 (P < 0.0001). Cost per day decreased by $811 (SE = 349; P = 0.02) for each age decade 65 years, however, no effect was observed on cost per day for those younger than 65 years.

Final Model for Cost per Day Using Piecewise Age Function Centered at Age 65 Years
PredictorsEstimated Effect ($)95% Confidence IntervalP Value to Test if = 0
Other specialty (reference group at 65 yr)5209(4,133, 6,284) 
Internal Medicine1,531(2,709, 353)0.01
Pulmonary Critical Care217(1,562, 1,128)0.75
Neurosurgery2255(278, 4,232)0.03
Surgical Oncology1064(994, 3,122)0.31
Cardiothoracic Surgery12937(10,676, 15,198)<0.0001
Age per 10 yr/age <657(506, 519)0.98
Age per 10 yr/age 65811(1,497, 125)0.02

Length of Stay

Because age and attending physician specialty had a significant effect on length of stay, multivariate analyses were performed with these two predictor variables (Table 4). Compared to the other specialty, internal medicine decreased length of stay by 2.4 days (P = 0.02), surgical oncology increased LOS by 5.3 days (P = 0.003), and cardiothoracic surgery increased length of stay by 6.9 days (P = 0.001). Length of stay was significantly decreased by 1.8 days (SE = 0.61; P = 0.003) for each age decade 65 years.

Final Model for Length of Stay (Days) Using Attending Physician Specialty and Piecewise Age Function Centered at 65 Years
PredictorsEstimated Effect (days)95% Confidence IntervalP Value to Test if = 0
Other specialty (reference group at 65 yr)11(9.1, 12.9) 
Internal Medicine2.4(4.4, 0.3)0.02
Pulmonary Critical Care0.5(1.9, 2.8)0.7
Neurosurgery0.9(4.3, 2.6)0.62
Surgical Oncology5.3(1.8, 8.9)0.003
Cardiothoracic Surgery6.9(3.0, 10.9)0.001
Age per 10 yr/age <650.8(1.7, 0.1)0.08
Age per 10 yr/age 651.8(3.0, 0.6)0.003

DISCUSSION

We found several characteristics that were significantly associated with higher cost per day or longer length of stay in patients who died during hospitalization or were discharged to hospice. Among this patient population, the surgical specialty services had overall higher cost per day and length of stay than other services. Patients cared for on the cardiothoracic surgery service had higher cost per day and length of stay; in contrast, internal medicine patients had lower cost per day and length of stay. Neurosurgery patients had higher cost per day, while surgical oncology patients had higher length of stay. Patients age 65 years and older had a significantly lower cost per day and shorter length of stay than those less than 65 years of age.

Higher cost per day for cardiothoracic surgery and neurosurgery patients may partially be explained by cardiothoracic surgery patients' usage of clinical services, including operating room services, which are higher in costs compared with those of nonsurgical specialties. Some patients may require repeat surgeries in the same hospitalization which further increases the cost per day. Longer length of stay in surgical oncology patients may be related to complex surgeries and possible postoperative complications that may take longer to recover from than standard surgeries.

Our findings that older patients have lower cost per day and shorter length of stay are corroborated by other studies. Lubitz and Riley21 found that in 1976 and 1988, Medicare payments per person year decreased with age. Levinsky et al.22 had similar findings in a review of Medicare data in 2001, but noted smaller reductions in total costabout $400 decrease for each year above 65. Their explanation of the lower cost is that older patients receive less aggressive care. Physicians, as well as patients and families, may continue to pursue expensive, invasive therapies for terminally ill patients who are younger for a longer period of time than with older patients, which would increase cost per day as well as length of stay.

The finding that patients on the surgical specialty services may be a focus for active palliative care intervention has many implications. The American College of Surgeons Surgical Palliative Care Task Force consensus guideline triggers for a palliative care consultation in SICU applied clinically did not result in a change in palliative care consultation rate.23 The use of triggers for palliative care consultation may be an ineffective approach because knowledge and application of the triggers did not change behavior. Focusing on integrating palliative care interventions or consultation for all high‐risk surgical patients, as opposed to relying upon triggers, may be a more effective approach to meeting these patients' palliative care needs while lowering cost per day and length of stay and warrants further study. For instance, palliative care consult teams may consider routine or daily rounds with the surgical specialty services in order to effectively integrate palliative care for these patients. Such an integrative approach may foster familiarity and comfort with palliative care approaches, facilitating access to palliative care services for those patients with palliative needs.

Our study is limited in that it is a retrospective, single‐center study. Our results may not be applicable to the general population. The experience of additional centers analyzed prospectively would provide additional context. The available administrative data limited the analyses to only a small number of predictors. In the subset population with the highest 10% total hospitalization costs, from which clinical information was gathered, the presence of respiratory failure was associated with shorter LOS (33 days vs 42 days; P = 0.03), but not associated with cost per day. Having sepsis at admission was associated with lower cost per day ($5783 vs $10,071; P = 0.04); however, this finding was based on only four patients with sepsis at admission. Patients who were evaluated by the palliative care service (n = 35) had a significantly lower cost per day ($4896 vs $12,210; P = 0.01) but longer LOS (46.5 vs 35.7 days; P = 0.03) than those who were not. These, and other, clinical characteristics need further testing in larger samples. An additional limitation is that we combined hospital decedents with patients discharged to hospice as our study population. These groups were combined since they are both at high risk of death in the near future; the median hospice length of stay in Colorado is 20 days.24 There may exist important differences in these populations that are not accounted for in our findings. Despite these unidentified differences, both populations are at high risk of death in the near future, making it likely that they would benefit from palliative care. Those who died during hospitalization did have a longer LOS (11.5 vs 9.2 days; P = 0.003) and higher cost per day ($6734 vs $2221; P < 0.0001) than those who were discharged to hospice.

Palliative care consultations can lead to improved quality of care for patients and families by addressing suffering and addressing quality of life measures (2, 4, 5, 6). We sought to identify characteristics associated with high cost and prolonged hospitalizations in patients who died during hospitalization, or were discharged to hospice, in order to inform targeting of palliative care services. Our data suggest that younger patients and those cared for by surgical specialty services may have the most palliative needs. Palliative care teams may consider focusing efforts at integrating palliative care with surgical specialty services to address these needs. These findings need to be corroborated in other centers, and include clinical outcomes.

References
  1. Teno JM,Clarridge BR,Casey V, et al.Family perspectives on end‐of‐life care at the last place of care.JAMA.2004;291:8893.
  2. Hearn J,Higginson IJ.Do specialist palliative care teams improve outcomes for cancer patients? A systematic literature review.Palliat Med.1998;12:317332.
  3. Qaseem A,Snow V,Shekelle P, et al.Evidence‐based interventions to improve the palliative care of pain, dyspnea, and depression at the end of life: a clinical practice guideline from the American College of Physicians.Ann Intern Med.2008;148:141146.
  4. Casarett D,Pickard A,Bailey FA, et al.Do palliative consultations improve patient outcomes?JAGS.2008;56:593599.
  5. Bakitas M,Lyons KD,Hegel MT, et al.Effects of a palliative cafe intervention on clinical outcomes in patients with advanced cancer.JAMA.2009;302:741749.
  6. Temel JS,Greer JA,Muzikansky A, et al.Early palliative care for patients with metastatic non‐small‐cell lung cancer.N Engl J Med.2010;363:733742.
  7. Morrison RS,Penrod JD,Cassel JB, et al.Cost savings associated with US hospital palliative care consultation programs.Arch Intern Med.2008;168(16):17831790.
  8. Back AL,Li YF,Sales AE.Impact of palliative care case management on resource use by patients dying of cancer at a Veterans Affairs Medical Center.J Palliat Med.2005;8(1):2635.
  9. Penrod JD,Deb P,Luhrs C, et al.Cost and utilization outcomes of patients receiving hospital‐based palliative care consultation.J Palliat Med.2006;9(4):855860.
  10. Smith TJ,Coyne P,Cassel B, et al.A high‐volume specialist palliative care unit and team may reduce in‐hospital end‐of‐life care costs.J Palliat Med.2003;6(5):699705.
  11. Ciemins EL,Blum L,Nunley M, et al.The economic and clinical impact of an inpatient palliative care consultation service: a multifaceted approach.J Palliat Med.2007;10(6):13471355.
  12. Penrod JD,Deb P,Dellenbaugh C, et al.Hospital‐based palliative care consultation: effects on hospital cost.J Palliat Med.2010;13(8):17.
  13. Campbell ML,Guzman JA.Impact of a proactive approach to improve end‐of‐life care in a medical ICU.Chest.2003;123:266271.
  14. Norton SA,Hogan LA,Holloway RG, et al.Proactive palliative care in the medical intensive care unit: effects on length of stay for selected high‐risk patients.Crit Care Med.2007;35:15301535.
  15. Slaven M,Wylie N,Fitzgerald B,Henderson N,Taylor S.Who needs a palliative care consult? The Hamilton Chart Audit tool.J Palliat Med.2007;10(2):304307.
  16. Fischer SM,Gozansky WS,Sauaia A,Min SJ,Kutner JS,Kramer A.A practical tool to identify patients who may benefit from a palliative care approach: the CARING criteria.J Pain Symptom Manage.2006;31:285292.
  17. Lanken PN,Terry PB,DeLisser HM, et al.An Official American Thoracic Society Clinical Policy Statement: palliative care for patients with respiratory diseases and critical illnesses.Am J Respir Crit Care Med.2008;177:912927.
  18. Mularski RA,Curtis JR,Billlings JA, et al.Proposed quality measures for palliative care in the critically ill: a consensus from the Robert Wood Johnson Foundation Critical Care Workgroup.Crit Care Med.2006;34:S404S411.
  19. Truog RD,Campbell ML,Curtis JR, et al.Recommendations for end‐of‐life care in the intensive care unit: a consensus statement by the American Academy of Critical Care Medicine.Crit Care Med.2008;36:953963.
  20. Bradley CT,Brasel KJ.Developing guidelines that identify patients who would benefit from palliative care services in the surgical intensive care unit.Crit Care Med.2009;37:946950.
  21. Lubitz JD,Riley GF.Trends in Medicare payments in the last year of life.N Engl J Med.1993;328:10921096.
  22. Levinsky NG,Yu W,Ash A, et al.Influence of age on Medicare expenditures and medical care in the last year of life.JAMA.2001;286:13491355.
  23. Bradley C,Weaver J,Brasel K.Addressing access to palliative care services in the surgical intensive care unit.Surgery.2010;147:871877.
  24. http://www.coloradocancercoalition.org/…/CCCConferenceKassner Slides11.13.07.ppt. Accessed August 16,2010.
  25. Al‐Shahri MZ,Sroor MY,Alsirafy SA.The impact of implementing referral criteria on the patterns of referrals and admissions to a palliative care program in Saudi Arabia.J Support Oncol.2010;8:7881.
References
  1. Teno JM,Clarridge BR,Casey V, et al.Family perspectives on end‐of‐life care at the last place of care.JAMA.2004;291:8893.
  2. Hearn J,Higginson IJ.Do specialist palliative care teams improve outcomes for cancer patients? A systematic literature review.Palliat Med.1998;12:317332.
  3. Qaseem A,Snow V,Shekelle P, et al.Evidence‐based interventions to improve the palliative care of pain, dyspnea, and depression at the end of life: a clinical practice guideline from the American College of Physicians.Ann Intern Med.2008;148:141146.
  4. Casarett D,Pickard A,Bailey FA, et al.Do palliative consultations improve patient outcomes?JAGS.2008;56:593599.
  5. Bakitas M,Lyons KD,Hegel MT, et al.Effects of a palliative cafe intervention on clinical outcomes in patients with advanced cancer.JAMA.2009;302:741749.
  6. Temel JS,Greer JA,Muzikansky A, et al.Early palliative care for patients with metastatic non‐small‐cell lung cancer.N Engl J Med.2010;363:733742.
  7. Morrison RS,Penrod JD,Cassel JB, et al.Cost savings associated with US hospital palliative care consultation programs.Arch Intern Med.2008;168(16):17831790.
  8. Back AL,Li YF,Sales AE.Impact of palliative care case management on resource use by patients dying of cancer at a Veterans Affairs Medical Center.J Palliat Med.2005;8(1):2635.
  9. Penrod JD,Deb P,Luhrs C, et al.Cost and utilization outcomes of patients receiving hospital‐based palliative care consultation.J Palliat Med.2006;9(4):855860.
  10. Smith TJ,Coyne P,Cassel B, et al.A high‐volume specialist palliative care unit and team may reduce in‐hospital end‐of‐life care costs.J Palliat Med.2003;6(5):699705.
  11. Ciemins EL,Blum L,Nunley M, et al.The economic and clinical impact of an inpatient palliative care consultation service: a multifaceted approach.J Palliat Med.2007;10(6):13471355.
  12. Penrod JD,Deb P,Dellenbaugh C, et al.Hospital‐based palliative care consultation: effects on hospital cost.J Palliat Med.2010;13(8):17.
  13. Campbell ML,Guzman JA.Impact of a proactive approach to improve end‐of‐life care in a medical ICU.Chest.2003;123:266271.
  14. Norton SA,Hogan LA,Holloway RG, et al.Proactive palliative care in the medical intensive care unit: effects on length of stay for selected high‐risk patients.Crit Care Med.2007;35:15301535.
  15. Slaven M,Wylie N,Fitzgerald B,Henderson N,Taylor S.Who needs a palliative care consult? The Hamilton Chart Audit tool.J Palliat Med.2007;10(2):304307.
  16. Fischer SM,Gozansky WS,Sauaia A,Min SJ,Kutner JS,Kramer A.A practical tool to identify patients who may benefit from a palliative care approach: the CARING criteria.J Pain Symptom Manage.2006;31:285292.
  17. Lanken PN,Terry PB,DeLisser HM, et al.An Official American Thoracic Society Clinical Policy Statement: palliative care for patients with respiratory diseases and critical illnesses.Am J Respir Crit Care Med.2008;177:912927.
  18. Mularski RA,Curtis JR,Billlings JA, et al.Proposed quality measures for palliative care in the critically ill: a consensus from the Robert Wood Johnson Foundation Critical Care Workgroup.Crit Care Med.2006;34:S404S411.
  19. Truog RD,Campbell ML,Curtis JR, et al.Recommendations for end‐of‐life care in the intensive care unit: a consensus statement by the American Academy of Critical Care Medicine.Crit Care Med.2008;36:953963.
  20. Bradley CT,Brasel KJ.Developing guidelines that identify patients who would benefit from palliative care services in the surgical intensive care unit.Crit Care Med.2009;37:946950.
  21. Lubitz JD,Riley GF.Trends in Medicare payments in the last year of life.N Engl J Med.1993;328:10921096.
  22. Levinsky NG,Yu W,Ash A, et al.Influence of age on Medicare expenditures and medical care in the last year of life.JAMA.2001;286:13491355.
  23. Bradley C,Weaver J,Brasel K.Addressing access to palliative care services in the surgical intensive care unit.Surgery.2010;147:871877.
  24. http://www.coloradocancercoalition.org/…/CCCConferenceKassner Slides11.13.07.ppt. Accessed August 16,2010.
  25. Al‐Shahri MZ,Sroor MY,Alsirafy SA.The impact of implementing referral criteria on the patterns of referrals and admissions to a palliative care program in Saudi Arabia.J Support Oncol.2010;8:7881.
Issue
Journal of Hospital Medicine - 6(6)
Issue
Journal of Hospital Medicine - 6(6)
Page Number
338-343
Page Number
338-343
Article Type
Display Headline
Characteristics associated with higher cost per day or longer length of stay in hospitalized patients who died during the hospitalization or were discharged to hospice
Display Headline
Characteristics associated with higher cost per day or longer length of stay in hospitalized patients who died during the hospitalization or were discharged to hospice
Sections
Article Source

Copyright © 2011 Society of Hospital Medicine

Disallow All Ads
Correspondence Location
University of Colorado Denver, Hospital Medicine Group, Leprino Bldg., 12401 E. 17th Avenue, Mail Stop F782, Rm. 938, Aurora, CO 80045
Content Gating
No Gating (article Unlocked/Free)
Alternative CME
Article PDF Media

Continuing Medical Education Program in

Article Type
Changed
Display Headline
Continuing Medical Education Program in the Journal of Hospital Medicine

If you wish to receive credit for this activity, please refer to the website: www.wileyblackwellcme.com.

Accreditation and Designation Statement

Blackwell Futura Media Services designates this journal‐based CME activity for a maximum of 1 AMA PRA Category 1 Credit.. Physicians should only claim credit commensurate with the extent of their participation in the activity.

Blackwell Futura Media Services is accredited by the Accreditation Council for Continuing Medical Education to provide continuing medical education for physicians.

Educational Objectives

The objectives need to be changed. Please remove the existing ones, and include these two:

  • Identify complications elderly patients are at risk for during hospitalization.

  • Suggest evidence‐based strategies to prevent and treat common causes of hospitalization‐related complications in geriatric patients.

This manuscript underwent peer review in line with the standards of editorial integrity and publication ethics maintained by Journal of Hospital Medicine. The peer reviewers have no relevant financial relationships. The peer review process for Journal of Hospital Medicine is single‐blinded. As such, the identities of the reviewers are not disclosed in line with the standard accepted practices of medical journal peer review.

Conflicts of interest have been identified and resolved in accordance with Blackwell Futura Media Services's Policy on Activity Disclosure and Conflict of Interest. The primary resolution method used was peer review and review by a non‐conflicted expert.

Instructions on Receiving Credit

For information on applicability and acceptance of CME credit for this activity, please consult your professional licensing board.

This activity is designed to be completed within an hour; physicians should claim only those credits that reflect the time actually spent in the activity. To successfully earn credit, participants must complete the activity during the valid credit period, which is up to two years from initial publication.

Follow these steps to earn credit:

  • Log on to www.wileyblackwellcme.com

  • Read the target audience, learning objectives, and author disclosures.

  • Read the article in print or online format.

  • Reflect on the article.

  • Access the CME Exam, and choose the best answer to each question.

  • Complete the required evaluation component of the activity.

This activity will be available for CME credit for twelve months following its publication date. At that time, it will be reviewed and potentially updated and extended for an additional twelve months.

Article PDF
Issue
Journal of Hospital Medicine - 6(6)
Page Number
350-350
Sections
Article PDF
Article PDF

If you wish to receive credit for this activity, please refer to the website: www.wileyblackwellcme.com.

Accreditation and Designation Statement

Blackwell Futura Media Services designates this journal‐based CME activity for a maximum of 1 AMA PRA Category 1 Credit.. Physicians should only claim credit commensurate with the extent of their participation in the activity.

Blackwell Futura Media Services is accredited by the Accreditation Council for Continuing Medical Education to provide continuing medical education for physicians.

Educational Objectives

The objectives need to be changed. Please remove the existing ones, and include these two:

  • Identify complications elderly patients are at risk for during hospitalization.

  • Suggest evidence‐based strategies to prevent and treat common causes of hospitalization‐related complications in geriatric patients.

This manuscript underwent peer review in line with the standards of editorial integrity and publication ethics maintained by Journal of Hospital Medicine. The peer reviewers have no relevant financial relationships. The peer review process for Journal of Hospital Medicine is single‐blinded. As such, the identities of the reviewers are not disclosed in line with the standard accepted practices of medical journal peer review.

Conflicts of interest have been identified and resolved in accordance with Blackwell Futura Media Services's Policy on Activity Disclosure and Conflict of Interest. The primary resolution method used was peer review and review by a non‐conflicted expert.

Instructions on Receiving Credit

For information on applicability and acceptance of CME credit for this activity, please consult your professional licensing board.

This activity is designed to be completed within an hour; physicians should claim only those credits that reflect the time actually spent in the activity. To successfully earn credit, participants must complete the activity during the valid credit period, which is up to two years from initial publication.

Follow these steps to earn credit:

  • Log on to www.wileyblackwellcme.com

  • Read the target audience, learning objectives, and author disclosures.

  • Read the article in print or online format.

  • Reflect on the article.

  • Access the CME Exam, and choose the best answer to each question.

  • Complete the required evaluation component of the activity.

This activity will be available for CME credit for twelve months following its publication date. At that time, it will be reviewed and potentially updated and extended for an additional twelve months.

If you wish to receive credit for this activity, please refer to the website: www.wileyblackwellcme.com.

Accreditation and Designation Statement

Blackwell Futura Media Services designates this journal‐based CME activity for a maximum of 1 AMA PRA Category 1 Credit.. Physicians should only claim credit commensurate with the extent of their participation in the activity.

Blackwell Futura Media Services is accredited by the Accreditation Council for Continuing Medical Education to provide continuing medical education for physicians.

Educational Objectives

The objectives need to be changed. Please remove the existing ones, and include these two:

  • Identify complications elderly patients are at risk for during hospitalization.

  • Suggest evidence‐based strategies to prevent and treat common causes of hospitalization‐related complications in geriatric patients.

This manuscript underwent peer review in line with the standards of editorial integrity and publication ethics maintained by Journal of Hospital Medicine. The peer reviewers have no relevant financial relationships. The peer review process for Journal of Hospital Medicine is single‐blinded. As such, the identities of the reviewers are not disclosed in line with the standard accepted practices of medical journal peer review.

Conflicts of interest have been identified and resolved in accordance with Blackwell Futura Media Services's Policy on Activity Disclosure and Conflict of Interest. The primary resolution method used was peer review and review by a non‐conflicted expert.

Instructions on Receiving Credit

For information on applicability and acceptance of CME credit for this activity, please consult your professional licensing board.

This activity is designed to be completed within an hour; physicians should claim only those credits that reflect the time actually spent in the activity. To successfully earn credit, participants must complete the activity during the valid credit period, which is up to two years from initial publication.

Follow these steps to earn credit:

  • Log on to www.wileyblackwellcme.com

  • Read the target audience, learning objectives, and author disclosures.

  • Read the article in print or online format.

  • Reflect on the article.

  • Access the CME Exam, and choose the best answer to each question.

  • Complete the required evaluation component of the activity.

This activity will be available for CME credit for twelve months following its publication date. At that time, it will be reviewed and potentially updated and extended for an additional twelve months.

Issue
Journal of Hospital Medicine - 6(6)
Issue
Journal of Hospital Medicine - 6(6)
Page Number
350-350
Page Number
350-350
Article Type
Display Headline
Continuing Medical Education Program in the Journal of Hospital Medicine
Display Headline
Continuing Medical Education Program in the Journal of Hospital Medicine
Sections
Article Source
Copyright © 2010 Society of Hospital Medicine
Disallow All Ads
Correspondence Location
University of Washington Medical Center, 1959 NE Pacific Street, Box 356429, Seattle, WA 98195‐6429
Content Gating
Gated (full article locked unless allowed per User)
Gating Strategy
First Peek Free
Article PDF Media

Medication Reconciliation Barriers

Article Type
Changed
Display Headline
Medication reconciliation: Barriers and facilitators from the perspectives of resident physicians and pharmacists

Adverse drug events (ADEs) occur when patients transition between the hospital and other care settings. Medication reconciliation, a process by which a provider obtains and documents a thorough medication history with specific attention to comparing current and previous medication use, can prevent transition‐related errors and harm in a variety of care locations.13 Nevertheless, poor intersite communication,4 flawed reconciliation of drug regimens,2 unreliable patient history‐taking, and poor provider decision‐making5 continue to contribute to transition‐related ADEs.

The Joint Commission introduced medication reconciliation as a hospital National Patient Safety Goal in 2006. However, because organizations have had difficulty implementing the process, it stopped citing medication reconciliation deficiencies in its accreditation surveys.6 Although regional and national initiatives have attempted to improve implementation of medication reconciliationusing provider education, workflow, and process reorganization, and organizational change7a recent field review by the Joint Commission suggests that healthcare organizations remain unable to ensure effective medication reconciliation, citing factors beyond the organizations' control, especially unreliable patient histories.8 Still, the process is slated to return as an accreditation requirement of the Joint Commission on July 1, 2011.8

The objective of this study was to determine factors that influenced physicians' and pharmacists' performance of medication reconciliation in a hospital setting with a computerized medical record and medication reconciliation tool, with the goal of informing an organization's approach to implementation. We conducted individual cognitive task analysis (CTA) interviews and focus group interviews to ascertain physicians' and pharmacists' opinions on the purpose and effectiveness of medication reconciliation, their approach to completing the task, and task facilitators and barriers.

METHODS

Setting and Medication Reconciliation Process

The study setting was an urban, academic, tertiary‐care Veterans Affairs (VA) medical center. A computerized medication reconciliation tool and process were developed in 2005 to comply with the Joint Commission's National Patient Safety Goal.6 The tool was embedded in the VA's Computerized Patient Record System (CPRS) and consisted of a dialogue with which a provider (physician, pharmacist, or other provider) could: 1) view the patient's outpatient medication use, for the last 90 days, from VA computerized pharmacy data; 2) view current VA inpatient orders; 3) record discrepancies between patient‐reported medications, and outpatient and inpatient medications in the VA computerized database; 4) record diagnostic indications for, and responses to, these discrepancies; and 5) produce a medication reconciliation document, which was a separate progress note (Figure 1). The tool did not directly facilitate ordering; however, in CPRS, outpatient orders could easily be copied to inpatient orders and vice versa.

Figure 1
Computer screen shots (A‐E) of the medication reconciliation tool used at hospital admission.

Two versions of the medication reconciliation process were implemented upon hospital admission: one in which the physician initiated and completed a reconciliation that was then reviewed by a pharmacist (Figure 2A)the process primarily used on the medical and surgical services; and one in which, after the physician wrote admission orders, the pharmacist initiated and completed the reconciliation and communicated his or her findings with the physician (Figure 2B)the process primarily used on the psychiatric service. At discharge, after the physician wrote discharge orders, the pharmacist completed a reconciliation of preadmission, inpatient, and discharge orders using a tool similar to the admission one (Figure 1). The pharmacist then communicated the reconciliation findings to the physician, similar to the admission medication reconciliation process shown in Figure 2B. These processes and tools were in place for 18 months at the time of the cognitive task analysis, which took place in June 2007, and 32 months at the time of the focus groups, which took place in August 2008.

Figure 2
(A) Flow diagram of physician‐initiated admission medication reconciliation. (B) Flow diagram of pharmacist‐initiated admission medication reconciliation.

Participants

Participants consisted of internal medicine house staff physicians rotating on the inpatient service (n = 23) and inpatient staff pharmacists (n = 12). Overall, 14 (40%) were female. The 23 house staff physicians represented approximately 64% of the total house staff inpatient staffing. Thirteen (57%) were in postgraduate year 1 (PGY1), and 10 (43%) were in PGY2 or higher. The 12 pharmacists represented approximately 50% of the total pharmacist inpatient staffing. Individual CTA interviews took place at the end of the academic year (June) with participants who were highly experienced with the process of medication reconciliation in the VA setting. Focus groups took place at the beginning of the academic year (August) with participants who had to endorse the statement that they were experienced completing medication reconciliation. Subjects participated in either the individual or focus group interviews, but not both. Physicians and pharmacists were interviewed separately. All participants provided written informed consent, and the Institutional Review Board of the James J. Peters VA Medical Center approved the study procedures.

Data Collection

Theoretical Model

The Integrated Change Model9 guided our approach to data collection and analysis. It indicates that a person's motivation, intention, and ability determine whether a behavior will be carried out. A person's motivation is influenced by attitudes (eg, perceived pros and cons of the behavior), social influences, and self‐efficacy (eg, perceived capability). The behavior is also influenced by environmental and physical factorsin this case circumstances of the patient encounter, information systems, and the medication reconciliation tool.

Individual Interviews

We conducted individual CTA interviews with 7 physicians and 5 pharmacists. During CTA, participants verbalized their thoughts while they completed medication reconciliation for at least 1 actual case, and at least 1 standardized (fictitious) case, using the computerized medical record and tool. The purpose of this think aloud exercise was to provide information on medication reconciliation tool functionality and usability, problems in humancomputer interaction, and the impact of the tool on decision‐making, clinical practice, and workflow. As the participants interacted with the medication reconciliation tool, computer screens, mouse clicks, and menu selections were recorded using screen recording software (Hypercam), and the participants' thinking aloud was audio‐recorded. This provided the experimenters with context for analyzing and coding subjects' verbalizations (ie, playback of the screens provided detail about the subjects' interaction with the tool, including what functions of the tool they accessed, and problems they may have encountered). Immediately after completing the tasks, subjects were briefly interviewed about their impressions of the tool and their interaction with it. CTA sessions took 30‐50 minutes per participant. Audio‐ and screen‐recordings were synchronized and transcribed.

Focus Group Interviews

We conducted 3 focus groups, 2 with house staff physicians (n = 9 and n = 7), and 1 with pharmacists (n = 7), for a total of 23 focus group participants. The focus group discussion guide was informed by the results of the CTA and began with broad, open‐ended questions,10 followed by a series of more specific probes. Participants were asked to describe medication reconciliation and its purpose, whether they thought that the process influenced their decision‐making and was effective, and how they go about completing the process. Probes included how the task fit into daily workflow, time needed to complete the task, and its priority relative to other tasks. A set of questions asked participants to report barriers and facilitators to completing the task, training needs and experience, and their suggestions on how to improve task implementation and completion. The discussion also included participants' views of the optimal roles of physicians and pharmacists in performing medication reconciliation. Throughout, participants were encouraged to report both positive and negative perceptions. Group interviews lasted 60‐90 minutes, and were audiotaped and transcribed. The same moderator facilitated all 3 focus groups and participated in the individual CTA interviews.

Data Analysis

CTA and focus group transcripts were analyzed using standard social science methods for analyzing qualitative data.1114 Using multiple close readings, investigators performed initial independent coding of each of the transcripts and generated a list of concepts and domains, and a coding scheme. The coding was reviewed from the perspective of the theoretical model to determine whether additional codes were necessary. A research staff member, blinded to the study hypotheses, applied the codes to each transcript by labeling each word, phrase, or line. To test the coding scheme's reliability, a random 5% of transcript lines were coded by 2 independent coders and interrater reliability was assessed. Disagreement was reconciled by discussion and transcripts recoded as appropriate. The investigators then compared codes within and across interviews to elucidate the larger themes that emerged. Frequencies of mention of each domain were calculated. Although the original intent was to analyze the CTA and focus groups separately, themes arising from each of these 2 techniques overlapped sufficiently to allow for a combined analysis. Data were compiled to provide a description of the factors that affect medication reconciliation completion, a summary of barriers and facilitators to use of the medication reconciliation tool, and user suggestions.

RESULTS

Purpose of Medication Reconciliation

Both physicians and pharmacists agreed that a central goal of medication reconciliation is to prevent prescribing errors and adverse drug events that arise from medication utilization over time, and across place and provider. Respondents also agreed that the medication reconciliation document provides a record of patients' history of medication use and of the provider's rationale for medication changes.

Both physicians and pharmacists also indicated awareness of external necessities for completing medication reconciliation, including Joint Commission accreditation standards and, to a lesser extent, medico‐legal liability concerns. On the other hand, 1 physician expressed concern that documented medication discrepancies could be interpreted as mistakes and a liability problem.

Effectiveness of Medication Reconciliation

There was overall disagreement about whether or not medication reconciliation actually achieves its goal of improving medication safety. Many physicians and pharmacists said that medication reconciliation prompts them to perform additional checking of medication lists, dosing, conditions, and interactions, and to better document medication histories and provider decision‐making. On the other hand, some physicians and pharmacists saw it as mainly an administrative task and doubted whether it had any impact on patient care, as this physician indicated: It just seems like another form to fill out .You could be writing a bunch of whatever and no one would notice and no one would say anything and it would never matter. Likewise, a majority of physicians indicated that other parts of the medical record are better sources of prescribing information than the medication reconciliation document.

Medication Reconciliation Process

Physicians and pharmacists agreed that the key components of medication reconciliation are obtaining a medication history from patients and other available sources, identifying differences among medication histories and medications being given, documenting these discrepancies and their reasons, recording a prescribing plan, and counseling the patient. Respondents indicated that the process varies depending on patient complexity, number of medications, encounter type, and provider. For example, physicians were more likely than pharmacists to complete medication reconciliation at once on admission, rather than begin the task and complete it later, as this physician indicated:


It might seem a little tough, but if you don't do it right at that moment, chances [are high] of you forgetting to do it . So it's best done at the moment when you speak to the patient unless you're waiting for some more information.


On the other hand, this physician routinely put off completing medication reconciliation until the day after admission in order to incorporate a more developed prescribing plan:


You can't do it till the end. Until you have your whole plan. when I do an admission note, I write down every single problem and I account for every single medication that I'm going to put someone on in the hospital or not put someone on. And I actually do the medication reconciliation the next day very easily, because I know exactly what I discontinued or why, or added and why. I don't think it's necessary to do it that night [and] you think about it a little bit more.


These quotes suggests that there is an adherence benefit to completing medication reconciliation on admission as a routine, but that this may not be possible, or even desirable, when more time is needed to obtain and verify medication information and make informed prescribing decisions.

Impact of the Computer on the Medication Reconciliation Process

A majority of respondents cautioned about the impact of computerized information and an electronic tool on medication reconciliation. As indicated in these quotes, the first by a physician and the second by a pharmacist, providers' reliance on the computer can lead to less thorough patient interviews, and computerized medication information may be incomplete, both unintended consequences of the electronic health record:


At the VA, you can just easily import [all the information] and you don't even have to ask the patient. So I would imagine more errors get made because people just import whatever meds are in the computer.


If I didn't have [the computerized record], I would be doing patient interviews much more and finding out what they're taking. On the computer, you do all these beautiful notesso I rely a lot on the computer and the whole patient contact thing kind of slides away. When you go to other hospitals, medication reconciliation is extensively patient interview, family interview, calling neighborhood pharmacies, you know, more like detective work and talking to people versus just sitting here typing, so.But the computer is great.


Who Should Perform Medication Reconciliation

Pharmacists and physicians had mixed responses when asked who should perform medication reconciliation. Several physicians indicated that medication reconciliation duplicates what they already do on admission and in progress notes, and therefore is not a good use of their time.

Respondents from both professions questioned the quality of physicians' medication reconciliation. As 1 pharmacist stated about physicians:


They're busy. Whether you like it or not, they're busy. To compare everything, to go across all the sources whether it's what they get here, asking the patient [viewing data from other facilities].There's nothing wrong with the computer [being] able to copy everything that's active and dropping it in. Butyou have to look it over. That's the problem. They don't look it over.


Thus, there was a tension among a majority of respondents between a belief that pharmacists do a better job at medication history‐taking and reconciliation, and a belief that physicians make the prescribing decisions and should be responsible for them. The quote also suggests that a barrier to self‐efficacy among pharmacists is their dependence on physicians to write the orders needed to address the findings of medication reconciliation. Although many respondents recognized that the task needs to be a component of both profession's jobs, suggestions for collaboration between physicians and pharmacists were limited in vision. Suggestions included pharmacists' checking physicians' work, physicians cosigning pharmacists' work, or some other sequenced completion of the task.

Barriers to Medication Reconciliation

Barriers to efficient and effective completion of medication reconciliation according to respondents are shown in Table 1. Physicians and pharmacists both indicated that patients can be unreliable sources of medication information. A few respondents indicated that whereas patients' health conditions change, medication reconciliation occurs at 1 point in time; this can limit its usefulness or make it immediately obsolete.

Barriers to High‐Quality Medication Reconciliation, in Order of Strength of Endorsement
BarrierBarrier Type/LevelPrimary Endorser(s)No. of Endorsers (MDs/PharmDs)
  • Abbreviation: MDs/PharmDs, physicians/pharmacists; VA, Veterans Affairs medical center.

Competing clinical tasks have higher priorityProviderPhysician9/2
Patients provide unreliable informationPatientPhysician6/1
Status (active/expired/discontinued) of medications is unclearSystemPhysician/pharmacist2/5
Need to complete many medication reconciliationsProviderPharmacist0/6
Preadmission medication list generated by the tool may show medications in duplicate and may require extensive scrollingToolPhysician/pharmacist4/2
Medication reconciliation tool only picks up information on medications supplied by the VAToolPharmacist0/5
Process to import non‐local VA medications is slow or does not workSystemPhysician/pharmacist3/2
Patient's health status changes over timePatientPhysician/pharmacist3/1
It is difficult to determine physicians' rationale for prescribing changes, which is needed for the reconciliation documentProviderPharmacist0/4
Tool is unclear on where to insert revisions to the medication history, changes to the outpatient or inpatient orders, and unresolved medication discrepanciesToolPhysician3/0

Both physicians and pharmacists said that medication reconciliation competed for their time with other responsibilities, and physicians placed acute care responsibilities as a higher priority: One sick patient takes all your timeso your mind is on the patient, not on the reconciliation; that's the last thing you worry about.

Pharmacists emphasized that the volume of patients is a barrier: Give me time and I can do a perfect med rec.Honestly, it's work load.I'm sorry, that day where I had 17 people being discharged, I don't think I did such a great job on their med recs.

Respondents indicated several ways in which the computer system itself was a barrier to effective medication reconciliation. First, as previously noted, the computer only picks up information on medications supplied by the VA, and the medication reconciliation tool may only pick up medications supplied by the local facility. Second, sometimes the computer is unclear on the status of medications, as when outpatient medications are automatically discontinued after hospital admission, or when the system automatically imports a medication that is shown to be active but was only meant to be given for a short period of time, such as an antibiotic. Several barriers specific to tool usability are also shown in Table 1.

Suggestions for Improving Medication Reconciliation

Physicians' and pharmacists' suggestions for improving medication reconciliation are shown in Table 2. First, there was recognition of the need for someone in addition to the author to check the medication reconciliation document to find mistakes. Second, respondents indicated that better provider training might improve medication reconciliation's effectiveness. Both physicians and pharmacists indicated that their education consisted of a limited amount of on‐the‐job training, such as a walk through with a supervisor the first time. When asked for suggestions for improving education, both physicians and pharmacists suggested that physicians should receive case‐based education, during which the purpose of the task is emphasized. These respondents, the first a pharmacist and the second a physician, called for provider feedback to improve and maintain reliability:

Suggestions for Improving Medication Reconciliation, in Order of Strength of Endorsement
SuggestionTargeted LevelPrimary Endorser(s)No. of Endorsers (MDs/PharmDs)
  • Abbreviation: MDs/PharmDs, physicians/pharmacists; VAs, Veterans Affairs medical centers.

Place checkbox next to each medicationToolPhysician/pharmacist6/2
Order or label medication by condition or diagnosisToolPhysician/pharmacist2/3
Someone in addition to the author should check the medication reconciliation note and provide feedback and correctionsProviderPhysician/pharmacist2/2
Enable searchable medication historySystemPhysician2/2
Enable automatic importing of medication information from other VAsSystem/toolPhysician/pharmacist1/2
Reconciliation document should be signed by both physician and pharmacistProviderPharmacist0/2
Task should have dedicated staffingProviderPharmacist0/2
Facilitate viewing of preadmission medication list and inpatient orders side‐by‐side, instead of topbottomToolPharmacist0/2
Make template more conciseToolPharmacist0/2
Automatically convert medication reconciliation planned actions into ordersSystem/toolPharmacist0/2
Automatically insert medication reconciliation documentation into admission noteSystem/toolPhysician2/0


Have somebody really look at the quality of the reconciliation and speak to whoever did it, whether it's done correctly or not correctly. Because I've seen too many people just use the template, click, click, and then sign. You can finish the note [in] two minutes, but it's not going to be accurate and it's not going to do the patient any good.


We just keep on doing the same thing without ever learning [whether it is] the right way. That's where [we get] this [idea that] we are just doing it for the sake of doing it.


These quotes suggest that a lack of review and feedback about the reconciliation process appears to impact both perceived importance and quality.

DISCUSSION

In this study of hospital physicians' and pharmacists' perspectives on medication reconciliation, we found that although respondents agreed about its main purposeto improve prescribing safetya near majority believed that it was of uncertain benefit to patients and limited use to providers. This might, in part, be because of a tool that was not adequately integrated into workflow, making it extraneous to patient care. As a consequence, many respondents' indicated that when they had competing tasks, especially other acute care responsibilities, medication reconciliation was displaced in priority. Respondents indicated that unreliability of patient medication histories was also a major barrier, which is consistent with a recent Joint Commission field review in which organizations cited this as a task hindrance beyond their control.8 Lastly, respondents revealed limited perception of it being a team‐oriented task.

Our study also probed providers' perceptions of the effect of computerization on completing medication reconciliation. Although study respondents indicated that the computerized tool reduced the time required to complete the task, they also expressed concern that because medication reconciliation was automated in part at the VA, they spent less time with patients on the process. This finding is important because, according to 1 study, many medications are not captured by the VA's Computerized Patient Record System,15 and a patient's lack of medication adherence may not be evident in the CPRS. This finding is also consistent with our prior work that has not demonstrated an inherent advantage to electronic communication of medication information over paper.16

Our study suggests that, for medication reconciliation to be improved, provider self‐efficacy and engagement with the process must be increased. This might involve addressing negative provider attitudes, changing workflow, and improving provider confidence by improving information reliability. With regard to changing attitudes, team members should be briefed on research evidence that shows that medication reconciliation is effective in preventing ADEs13 and is cost‐effective17 to help to increase the value that providers place on medication reconciliation. With regard to workflow, the tool has to be optimized to facilitate information gathering, processing, and medication ordering. Our findings also suggest that medication reconciliation would benefit from widening the time window in which it should be completed (eg, to the first or second business day after admission), since this increases the time available to access multiple data sources, and for providers to update the preadmission medication history and to act on new medication information. Finally, regional electronic health information exchange would improve information reliability and provider confidence in the information.

Our findings also suggest that assignment of productive teamsconsisting of physicians, physician‐extenders, nurses, pharmacists, and/or administrative support staffrather than individuals to the task might improve task completion. Efficacy and perceived capability might be improved by dividing the task into parts more easily manageable by individual team members. One example would be to assign 1 team member to record all of the sources of medication information available for each patient (the patient's home, pharmacies, doctors, hospitals, etc), and assign 1 or more other team members to access these sources as needed. Another example would be to assign the pharmacist to take and document the preadmission medication history (if not for all patients, then perhaps for the highest‐risk patients), and assign the physician to verify the history, specify the planned action on admission for each medication, and complete the admission orders. These suggestions are consistent with a study that suggested that physician engagement and an effective team are strongly correlated with successful implementation of medication reconciliation.7

A strength of our study was its use of multiple methods (focus groups and cognitive task analysis) to collect data from key users individually while they interfaced with the system and in groups. Nevertheless, a limitation of the study is that it took place in a single hospital. Though it had a limited number of physician and pharmacist participants, the study sample represented a large fraction of the inpatient staff in those disciplines. We also did not include nurses, hospitalist attending physicians, or other disciplines that might be involved in medication reconciliation in other facilities or settings. However, our study explored the relationship between two disciplines (physicians and pharmacists), yielding findings that could apply to optimizing the function of other interdisciplinary teams.

Our findings can be used to inform improvement efforts in hospitals that have struggled to implement medication reconciliation. Given that the process is slated to return as an accreditation requirement of the Joint Commission,8 hospitals will need to find ways to strengthen the process. Our findings suggest that increasing providers' perceived capability, and confidence in the process and its outcomes, would improve their engagement in the process. This could be accomplished by improved information gathering, including better computer information systems and regional electronic health information exchange, a flexible timeframe for the process, provider training and feedback, and teamwork. In addition, hospitals can make sure their process is working by ascertaining a gold standard medication history on a subset of patients, and comparing the gold standard to the team's history, and admission and discharge orders. Because it is a central component of safe medication prescribing, medication reconciliation will continue to be a focus of state,18 national,19 and international safety efforts20 in the near future.

Acknowledgements

The authors are grateful for the technical assistance of Daniel Signor in the conduct of this work.

References
  1. Schnipper JL,Hamann C,Ndumele CD, et al.Effect of an electronic medication reconciliation application and process redesign on potential adverse drug events: a cluster‐randomized trial.Arch Intern Med.2009;169:771780.
  2. Pronovost P,Weast B,Schwarz M, et al.Medication reconciliation: a practical tool to reduce the risk of medication errors.J Crit Care.2003;18:201205.
  3. Boockvar KS,Carlson LaCorte H,Giambanco V,Fridman B,Siu A.Medication reconciliation for reducing drug‐discrepancy adverse events.Am J Geriatr Pharmacother.2006;4:236243.
  4. Jones JS,Dwyer PR,White LJ,Firman R.Patient transfer from nursing home to emergency department: outcomes and policy implications.Acad Emerg Med.1997;4:908915.
  5. Leape LL,Bates DW,Cullen DJ, et al.Systems analysis of adverse drug events. ADE Prevention Study Group.JAMA.1995;274:3543.
  6. Joint Commission Hospital National Patient Safety Goal #8. Available at: http://www.jointcommission.org/AccreditationPrograms/ Hospitals/NPSG/. Accessed November 10,2010.
  7. Rogers G,Alper E,Brunelle D, et al.Reconciling medications at admission: safe practice recommendations and implementation strategies.Jt Comm J Qual Patient Saf.2006;32:3750.
  8. Update: medication reconciliation. National Patient Safety Goal field review results. Joint Commission online June 2, 2010. Available at: http://www.jointcommission.org/NR/rdonlyres/17295FE3–6643‐48E6–89A5‐C629 609E3F36/0/jconlineJune210.pdf. Accessed November 10,2010.
  9. Vries H,Mesters I,van de Steeg H,Honing C.The general public's information needs and perceptions regarding hereditary cancer: an application of the integrated change model.Patient Educ Couns.2005;56:154165.
  10. Krueger R,King J.Involving Community Members in Focus Groups.Thousand Oaks, CA:Sage;1998.
  11. Miles M,Huberman M.Qualitative Data Analysis.Thousand Oaks, CA:Sage;1994.
  12. Patton MQ.How to Use Qualitative Methods in Evaluation.Newbury Park, CA:Sage;1987.
  13. Miller DC.Handbook of Research Design and Social Measurement,5th ed.Newbury Park, CA:Sage;1991.
  14. Flick U.An Introduction to Qualitative Research.London:Sage;1998.
  15. Kaboli PJ,McClimon BJ,Hoth AB,Barnett MJ.Assessing the accuracy of computerized medication histories.Am J Manag Care.2004;10:872877.
  16. Boockvar KS,Livote E,Goldstein N, et al.Electronic health records and adverse drug events after patient transfer.Qual Saf Health Care.2010;19:15.
  17. Karnon J,Campbell F,Czoski‐Murray C.Model‐based cost‐effectiveness analysis of interventions aimed at preventing medication error at hospital admission (medicines reconciliation).J Eval Clin Pract.2009;15:299306.
  18. Massachusetts Hospital Association. Reconciling medications. A Medication Safety Collaborative sponsored by the MA Coalition for the Prevention of Medical Errors. Available at: http://www.macoalition.org/Initiatives/RecMeds/ProjectBackground.pdf. Accessed November 10,2010.
  19. Patient safety medication systems tools. Available at: http://www. ihi.org/IHI/Topics/PatientSafety/MedicationSystems/Tools/. Accessed November 10,2010.
  20. Danish Society for Patient Safety: Operation Life Denmark. Available at: http://patientsikkerhed.dk/en/about_the_danish_society_for_patient_ safety/activities/. Accessed November 10,2010.
Article PDF
Issue
Journal of Hospital Medicine - 6(6)
Page Number
329-337
Sections
Article PDF
Article PDF

Adverse drug events (ADEs) occur when patients transition between the hospital and other care settings. Medication reconciliation, a process by which a provider obtains and documents a thorough medication history with specific attention to comparing current and previous medication use, can prevent transition‐related errors and harm in a variety of care locations.13 Nevertheless, poor intersite communication,4 flawed reconciliation of drug regimens,2 unreliable patient history‐taking, and poor provider decision‐making5 continue to contribute to transition‐related ADEs.

The Joint Commission introduced medication reconciliation as a hospital National Patient Safety Goal in 2006. However, because organizations have had difficulty implementing the process, it stopped citing medication reconciliation deficiencies in its accreditation surveys.6 Although regional and national initiatives have attempted to improve implementation of medication reconciliationusing provider education, workflow, and process reorganization, and organizational change7a recent field review by the Joint Commission suggests that healthcare organizations remain unable to ensure effective medication reconciliation, citing factors beyond the organizations' control, especially unreliable patient histories.8 Still, the process is slated to return as an accreditation requirement of the Joint Commission on July 1, 2011.8

The objective of this study was to determine factors that influenced physicians' and pharmacists' performance of medication reconciliation in a hospital setting with a computerized medical record and medication reconciliation tool, with the goal of informing an organization's approach to implementation. We conducted individual cognitive task analysis (CTA) interviews and focus group interviews to ascertain physicians' and pharmacists' opinions on the purpose and effectiveness of medication reconciliation, their approach to completing the task, and task facilitators and barriers.

METHODS

Setting and Medication Reconciliation Process

The study setting was an urban, academic, tertiary‐care Veterans Affairs (VA) medical center. A computerized medication reconciliation tool and process were developed in 2005 to comply with the Joint Commission's National Patient Safety Goal.6 The tool was embedded in the VA's Computerized Patient Record System (CPRS) and consisted of a dialogue with which a provider (physician, pharmacist, or other provider) could: 1) view the patient's outpatient medication use, for the last 90 days, from VA computerized pharmacy data; 2) view current VA inpatient orders; 3) record discrepancies between patient‐reported medications, and outpatient and inpatient medications in the VA computerized database; 4) record diagnostic indications for, and responses to, these discrepancies; and 5) produce a medication reconciliation document, which was a separate progress note (Figure 1). The tool did not directly facilitate ordering; however, in CPRS, outpatient orders could easily be copied to inpatient orders and vice versa.

Figure 1
Computer screen shots (A‐E) of the medication reconciliation tool used at hospital admission.

Two versions of the medication reconciliation process were implemented upon hospital admission: one in which the physician initiated and completed a reconciliation that was then reviewed by a pharmacist (Figure 2A)the process primarily used on the medical and surgical services; and one in which, after the physician wrote admission orders, the pharmacist initiated and completed the reconciliation and communicated his or her findings with the physician (Figure 2B)the process primarily used on the psychiatric service. At discharge, after the physician wrote discharge orders, the pharmacist completed a reconciliation of preadmission, inpatient, and discharge orders using a tool similar to the admission one (Figure 1). The pharmacist then communicated the reconciliation findings to the physician, similar to the admission medication reconciliation process shown in Figure 2B. These processes and tools were in place for 18 months at the time of the cognitive task analysis, which took place in June 2007, and 32 months at the time of the focus groups, which took place in August 2008.

Figure 2
(A) Flow diagram of physician‐initiated admission medication reconciliation. (B) Flow diagram of pharmacist‐initiated admission medication reconciliation.

Participants

Participants consisted of internal medicine house staff physicians rotating on the inpatient service (n = 23) and inpatient staff pharmacists (n = 12). Overall, 14 (40%) were female. The 23 house staff physicians represented approximately 64% of the total house staff inpatient staffing. Thirteen (57%) were in postgraduate year 1 (PGY1), and 10 (43%) were in PGY2 or higher. The 12 pharmacists represented approximately 50% of the total pharmacist inpatient staffing. Individual CTA interviews took place at the end of the academic year (June) with participants who were highly experienced with the process of medication reconciliation in the VA setting. Focus groups took place at the beginning of the academic year (August) with participants who had to endorse the statement that they were experienced completing medication reconciliation. Subjects participated in either the individual or focus group interviews, but not both. Physicians and pharmacists were interviewed separately. All participants provided written informed consent, and the Institutional Review Board of the James J. Peters VA Medical Center approved the study procedures.

Data Collection

Theoretical Model

The Integrated Change Model9 guided our approach to data collection and analysis. It indicates that a person's motivation, intention, and ability determine whether a behavior will be carried out. A person's motivation is influenced by attitudes (eg, perceived pros and cons of the behavior), social influences, and self‐efficacy (eg, perceived capability). The behavior is also influenced by environmental and physical factorsin this case circumstances of the patient encounter, information systems, and the medication reconciliation tool.

Individual Interviews

We conducted individual CTA interviews with 7 physicians and 5 pharmacists. During CTA, participants verbalized their thoughts while they completed medication reconciliation for at least 1 actual case, and at least 1 standardized (fictitious) case, using the computerized medical record and tool. The purpose of this think aloud exercise was to provide information on medication reconciliation tool functionality and usability, problems in humancomputer interaction, and the impact of the tool on decision‐making, clinical practice, and workflow. As the participants interacted with the medication reconciliation tool, computer screens, mouse clicks, and menu selections were recorded using screen recording software (Hypercam), and the participants' thinking aloud was audio‐recorded. This provided the experimenters with context for analyzing and coding subjects' verbalizations (ie, playback of the screens provided detail about the subjects' interaction with the tool, including what functions of the tool they accessed, and problems they may have encountered). Immediately after completing the tasks, subjects were briefly interviewed about their impressions of the tool and their interaction with it. CTA sessions took 30‐50 minutes per participant. Audio‐ and screen‐recordings were synchronized and transcribed.

Focus Group Interviews

We conducted 3 focus groups, 2 with house staff physicians (n = 9 and n = 7), and 1 with pharmacists (n = 7), for a total of 23 focus group participants. The focus group discussion guide was informed by the results of the CTA and began with broad, open‐ended questions,10 followed by a series of more specific probes. Participants were asked to describe medication reconciliation and its purpose, whether they thought that the process influenced their decision‐making and was effective, and how they go about completing the process. Probes included how the task fit into daily workflow, time needed to complete the task, and its priority relative to other tasks. A set of questions asked participants to report barriers and facilitators to completing the task, training needs and experience, and their suggestions on how to improve task implementation and completion. The discussion also included participants' views of the optimal roles of physicians and pharmacists in performing medication reconciliation. Throughout, participants were encouraged to report both positive and negative perceptions. Group interviews lasted 60‐90 minutes, and were audiotaped and transcribed. The same moderator facilitated all 3 focus groups and participated in the individual CTA interviews.

Data Analysis

CTA and focus group transcripts were analyzed using standard social science methods for analyzing qualitative data.1114 Using multiple close readings, investigators performed initial independent coding of each of the transcripts and generated a list of concepts and domains, and a coding scheme. The coding was reviewed from the perspective of the theoretical model to determine whether additional codes were necessary. A research staff member, blinded to the study hypotheses, applied the codes to each transcript by labeling each word, phrase, or line. To test the coding scheme's reliability, a random 5% of transcript lines were coded by 2 independent coders and interrater reliability was assessed. Disagreement was reconciled by discussion and transcripts recoded as appropriate. The investigators then compared codes within and across interviews to elucidate the larger themes that emerged. Frequencies of mention of each domain were calculated. Although the original intent was to analyze the CTA and focus groups separately, themes arising from each of these 2 techniques overlapped sufficiently to allow for a combined analysis. Data were compiled to provide a description of the factors that affect medication reconciliation completion, a summary of barriers and facilitators to use of the medication reconciliation tool, and user suggestions.

RESULTS

Purpose of Medication Reconciliation

Both physicians and pharmacists agreed that a central goal of medication reconciliation is to prevent prescribing errors and adverse drug events that arise from medication utilization over time, and across place and provider. Respondents also agreed that the medication reconciliation document provides a record of patients' history of medication use and of the provider's rationale for medication changes.

Both physicians and pharmacists also indicated awareness of external necessities for completing medication reconciliation, including Joint Commission accreditation standards and, to a lesser extent, medico‐legal liability concerns. On the other hand, 1 physician expressed concern that documented medication discrepancies could be interpreted as mistakes and a liability problem.

Effectiveness of Medication Reconciliation

There was overall disagreement about whether or not medication reconciliation actually achieves its goal of improving medication safety. Many physicians and pharmacists said that medication reconciliation prompts them to perform additional checking of medication lists, dosing, conditions, and interactions, and to better document medication histories and provider decision‐making. On the other hand, some physicians and pharmacists saw it as mainly an administrative task and doubted whether it had any impact on patient care, as this physician indicated: It just seems like another form to fill out .You could be writing a bunch of whatever and no one would notice and no one would say anything and it would never matter. Likewise, a majority of physicians indicated that other parts of the medical record are better sources of prescribing information than the medication reconciliation document.

Medication Reconciliation Process

Physicians and pharmacists agreed that the key components of medication reconciliation are obtaining a medication history from patients and other available sources, identifying differences among medication histories and medications being given, documenting these discrepancies and their reasons, recording a prescribing plan, and counseling the patient. Respondents indicated that the process varies depending on patient complexity, number of medications, encounter type, and provider. For example, physicians were more likely than pharmacists to complete medication reconciliation at once on admission, rather than begin the task and complete it later, as this physician indicated:


It might seem a little tough, but if you don't do it right at that moment, chances [are high] of you forgetting to do it . So it's best done at the moment when you speak to the patient unless you're waiting for some more information.


On the other hand, this physician routinely put off completing medication reconciliation until the day after admission in order to incorporate a more developed prescribing plan:


You can't do it till the end. Until you have your whole plan. when I do an admission note, I write down every single problem and I account for every single medication that I'm going to put someone on in the hospital or not put someone on. And I actually do the medication reconciliation the next day very easily, because I know exactly what I discontinued or why, or added and why. I don't think it's necessary to do it that night [and] you think about it a little bit more.


These quotes suggests that there is an adherence benefit to completing medication reconciliation on admission as a routine, but that this may not be possible, or even desirable, when more time is needed to obtain and verify medication information and make informed prescribing decisions.

Impact of the Computer on the Medication Reconciliation Process

A majority of respondents cautioned about the impact of computerized information and an electronic tool on medication reconciliation. As indicated in these quotes, the first by a physician and the second by a pharmacist, providers' reliance on the computer can lead to less thorough patient interviews, and computerized medication information may be incomplete, both unintended consequences of the electronic health record:


At the VA, you can just easily import [all the information] and you don't even have to ask the patient. So I would imagine more errors get made because people just import whatever meds are in the computer.


If I didn't have [the computerized record], I would be doing patient interviews much more and finding out what they're taking. On the computer, you do all these beautiful notesso I rely a lot on the computer and the whole patient contact thing kind of slides away. When you go to other hospitals, medication reconciliation is extensively patient interview, family interview, calling neighborhood pharmacies, you know, more like detective work and talking to people versus just sitting here typing, so.But the computer is great.


Who Should Perform Medication Reconciliation

Pharmacists and physicians had mixed responses when asked who should perform medication reconciliation. Several physicians indicated that medication reconciliation duplicates what they already do on admission and in progress notes, and therefore is not a good use of their time.

Respondents from both professions questioned the quality of physicians' medication reconciliation. As 1 pharmacist stated about physicians:


They're busy. Whether you like it or not, they're busy. To compare everything, to go across all the sources whether it's what they get here, asking the patient [viewing data from other facilities].There's nothing wrong with the computer [being] able to copy everything that's active and dropping it in. Butyou have to look it over. That's the problem. They don't look it over.


Thus, there was a tension among a majority of respondents between a belief that pharmacists do a better job at medication history‐taking and reconciliation, and a belief that physicians make the prescribing decisions and should be responsible for them. The quote also suggests that a barrier to self‐efficacy among pharmacists is their dependence on physicians to write the orders needed to address the findings of medication reconciliation. Although many respondents recognized that the task needs to be a component of both profession's jobs, suggestions for collaboration between physicians and pharmacists were limited in vision. Suggestions included pharmacists' checking physicians' work, physicians cosigning pharmacists' work, or some other sequenced completion of the task.

Barriers to Medication Reconciliation

Barriers to efficient and effective completion of medication reconciliation according to respondents are shown in Table 1. Physicians and pharmacists both indicated that patients can be unreliable sources of medication information. A few respondents indicated that whereas patients' health conditions change, medication reconciliation occurs at 1 point in time; this can limit its usefulness or make it immediately obsolete.

Barriers to High‐Quality Medication Reconciliation, in Order of Strength of Endorsement
BarrierBarrier Type/LevelPrimary Endorser(s)No. of Endorsers (MDs/PharmDs)
  • Abbreviation: MDs/PharmDs, physicians/pharmacists; VA, Veterans Affairs medical center.

Competing clinical tasks have higher priorityProviderPhysician9/2
Patients provide unreliable informationPatientPhysician6/1
Status (active/expired/discontinued) of medications is unclearSystemPhysician/pharmacist2/5
Need to complete many medication reconciliationsProviderPharmacist0/6
Preadmission medication list generated by the tool may show medications in duplicate and may require extensive scrollingToolPhysician/pharmacist4/2
Medication reconciliation tool only picks up information on medications supplied by the VAToolPharmacist0/5
Process to import non‐local VA medications is slow or does not workSystemPhysician/pharmacist3/2
Patient's health status changes over timePatientPhysician/pharmacist3/1
It is difficult to determine physicians' rationale for prescribing changes, which is needed for the reconciliation documentProviderPharmacist0/4
Tool is unclear on where to insert revisions to the medication history, changes to the outpatient or inpatient orders, and unresolved medication discrepanciesToolPhysician3/0

Both physicians and pharmacists said that medication reconciliation competed for their time with other responsibilities, and physicians placed acute care responsibilities as a higher priority: One sick patient takes all your timeso your mind is on the patient, not on the reconciliation; that's the last thing you worry about.

Pharmacists emphasized that the volume of patients is a barrier: Give me time and I can do a perfect med rec.Honestly, it's work load.I'm sorry, that day where I had 17 people being discharged, I don't think I did such a great job on their med recs.

Respondents indicated several ways in which the computer system itself was a barrier to effective medication reconciliation. First, as previously noted, the computer only picks up information on medications supplied by the VA, and the medication reconciliation tool may only pick up medications supplied by the local facility. Second, sometimes the computer is unclear on the status of medications, as when outpatient medications are automatically discontinued after hospital admission, or when the system automatically imports a medication that is shown to be active but was only meant to be given for a short period of time, such as an antibiotic. Several barriers specific to tool usability are also shown in Table 1.

Suggestions for Improving Medication Reconciliation

Physicians' and pharmacists' suggestions for improving medication reconciliation are shown in Table 2. First, there was recognition of the need for someone in addition to the author to check the medication reconciliation document to find mistakes. Second, respondents indicated that better provider training might improve medication reconciliation's effectiveness. Both physicians and pharmacists indicated that their education consisted of a limited amount of on‐the‐job training, such as a walk through with a supervisor the first time. When asked for suggestions for improving education, both physicians and pharmacists suggested that physicians should receive case‐based education, during which the purpose of the task is emphasized. These respondents, the first a pharmacist and the second a physician, called for provider feedback to improve and maintain reliability:

Suggestions for Improving Medication Reconciliation, in Order of Strength of Endorsement
SuggestionTargeted LevelPrimary Endorser(s)No. of Endorsers (MDs/PharmDs)
  • Abbreviation: MDs/PharmDs, physicians/pharmacists; VAs, Veterans Affairs medical centers.

Place checkbox next to each medicationToolPhysician/pharmacist6/2
Order or label medication by condition or diagnosisToolPhysician/pharmacist2/3
Someone in addition to the author should check the medication reconciliation note and provide feedback and correctionsProviderPhysician/pharmacist2/2
Enable searchable medication historySystemPhysician2/2
Enable automatic importing of medication information from other VAsSystem/toolPhysician/pharmacist1/2
Reconciliation document should be signed by both physician and pharmacistProviderPharmacist0/2
Task should have dedicated staffingProviderPharmacist0/2
Facilitate viewing of preadmission medication list and inpatient orders side‐by‐side, instead of topbottomToolPharmacist0/2
Make template more conciseToolPharmacist0/2
Automatically convert medication reconciliation planned actions into ordersSystem/toolPharmacist0/2
Automatically insert medication reconciliation documentation into admission noteSystem/toolPhysician2/0


Have somebody really look at the quality of the reconciliation and speak to whoever did it, whether it's done correctly or not correctly. Because I've seen too many people just use the template, click, click, and then sign. You can finish the note [in] two minutes, but it's not going to be accurate and it's not going to do the patient any good.


We just keep on doing the same thing without ever learning [whether it is] the right way. That's where [we get] this [idea that] we are just doing it for the sake of doing it.


These quotes suggest that a lack of review and feedback about the reconciliation process appears to impact both perceived importance and quality.

DISCUSSION

In this study of hospital physicians' and pharmacists' perspectives on medication reconciliation, we found that although respondents agreed about its main purposeto improve prescribing safetya near majority believed that it was of uncertain benefit to patients and limited use to providers. This might, in part, be because of a tool that was not adequately integrated into workflow, making it extraneous to patient care. As a consequence, many respondents' indicated that when they had competing tasks, especially other acute care responsibilities, medication reconciliation was displaced in priority. Respondents indicated that unreliability of patient medication histories was also a major barrier, which is consistent with a recent Joint Commission field review in which organizations cited this as a task hindrance beyond their control.8 Lastly, respondents revealed limited perception of it being a team‐oriented task.

Our study also probed providers' perceptions of the effect of computerization on completing medication reconciliation. Although study respondents indicated that the computerized tool reduced the time required to complete the task, they also expressed concern that because medication reconciliation was automated in part at the VA, they spent less time with patients on the process. This finding is important because, according to 1 study, many medications are not captured by the VA's Computerized Patient Record System,15 and a patient's lack of medication adherence may not be evident in the CPRS. This finding is also consistent with our prior work that has not demonstrated an inherent advantage to electronic communication of medication information over paper.16

Our study suggests that, for medication reconciliation to be improved, provider self‐efficacy and engagement with the process must be increased. This might involve addressing negative provider attitudes, changing workflow, and improving provider confidence by improving information reliability. With regard to changing attitudes, team members should be briefed on research evidence that shows that medication reconciliation is effective in preventing ADEs13 and is cost‐effective17 to help to increase the value that providers place on medication reconciliation. With regard to workflow, the tool has to be optimized to facilitate information gathering, processing, and medication ordering. Our findings also suggest that medication reconciliation would benefit from widening the time window in which it should be completed (eg, to the first or second business day after admission), since this increases the time available to access multiple data sources, and for providers to update the preadmission medication history and to act on new medication information. Finally, regional electronic health information exchange would improve information reliability and provider confidence in the information.

Our findings also suggest that assignment of productive teamsconsisting of physicians, physician‐extenders, nurses, pharmacists, and/or administrative support staffrather than individuals to the task might improve task completion. Efficacy and perceived capability might be improved by dividing the task into parts more easily manageable by individual team members. One example would be to assign 1 team member to record all of the sources of medication information available for each patient (the patient's home, pharmacies, doctors, hospitals, etc), and assign 1 or more other team members to access these sources as needed. Another example would be to assign the pharmacist to take and document the preadmission medication history (if not for all patients, then perhaps for the highest‐risk patients), and assign the physician to verify the history, specify the planned action on admission for each medication, and complete the admission orders. These suggestions are consistent with a study that suggested that physician engagement and an effective team are strongly correlated with successful implementation of medication reconciliation.7

A strength of our study was its use of multiple methods (focus groups and cognitive task analysis) to collect data from key users individually while they interfaced with the system and in groups. Nevertheless, a limitation of the study is that it took place in a single hospital. Though it had a limited number of physician and pharmacist participants, the study sample represented a large fraction of the inpatient staff in those disciplines. We also did not include nurses, hospitalist attending physicians, or other disciplines that might be involved in medication reconciliation in other facilities or settings. However, our study explored the relationship between two disciplines (physicians and pharmacists), yielding findings that could apply to optimizing the function of other interdisciplinary teams.

Our findings can be used to inform improvement efforts in hospitals that have struggled to implement medication reconciliation. Given that the process is slated to return as an accreditation requirement of the Joint Commission,8 hospitals will need to find ways to strengthen the process. Our findings suggest that increasing providers' perceived capability, and confidence in the process and its outcomes, would improve their engagement in the process. This could be accomplished by improved information gathering, including better computer information systems and regional electronic health information exchange, a flexible timeframe for the process, provider training and feedback, and teamwork. In addition, hospitals can make sure their process is working by ascertaining a gold standard medication history on a subset of patients, and comparing the gold standard to the team's history, and admission and discharge orders. Because it is a central component of safe medication prescribing, medication reconciliation will continue to be a focus of state,18 national,19 and international safety efforts20 in the near future.

Acknowledgements

The authors are grateful for the technical assistance of Daniel Signor in the conduct of this work.

Adverse drug events (ADEs) occur when patients transition between the hospital and other care settings. Medication reconciliation, a process by which a provider obtains and documents a thorough medication history with specific attention to comparing current and previous medication use, can prevent transition‐related errors and harm in a variety of care locations.13 Nevertheless, poor intersite communication,4 flawed reconciliation of drug regimens,2 unreliable patient history‐taking, and poor provider decision‐making5 continue to contribute to transition‐related ADEs.

The Joint Commission introduced medication reconciliation as a hospital National Patient Safety Goal in 2006. However, because organizations have had difficulty implementing the process, it stopped citing medication reconciliation deficiencies in its accreditation surveys.6 Although regional and national initiatives have attempted to improve implementation of medication reconciliationusing provider education, workflow, and process reorganization, and organizational change7a recent field review by the Joint Commission suggests that healthcare organizations remain unable to ensure effective medication reconciliation, citing factors beyond the organizations' control, especially unreliable patient histories.8 Still, the process is slated to return as an accreditation requirement of the Joint Commission on July 1, 2011.8

The objective of this study was to determine factors that influenced physicians' and pharmacists' performance of medication reconciliation in a hospital setting with a computerized medical record and medication reconciliation tool, with the goal of informing an organization's approach to implementation. We conducted individual cognitive task analysis (CTA) interviews and focus group interviews to ascertain physicians' and pharmacists' opinions on the purpose and effectiveness of medication reconciliation, their approach to completing the task, and task facilitators and barriers.

METHODS

Setting and Medication Reconciliation Process

The study setting was an urban, academic, tertiary‐care Veterans Affairs (VA) medical center. A computerized medication reconciliation tool and process were developed in 2005 to comply with the Joint Commission's National Patient Safety Goal.6 The tool was embedded in the VA's Computerized Patient Record System (CPRS) and consisted of a dialogue with which a provider (physician, pharmacist, or other provider) could: 1) view the patient's outpatient medication use, for the last 90 days, from VA computerized pharmacy data; 2) view current VA inpatient orders; 3) record discrepancies between patient‐reported medications, and outpatient and inpatient medications in the VA computerized database; 4) record diagnostic indications for, and responses to, these discrepancies; and 5) produce a medication reconciliation document, which was a separate progress note (Figure 1). The tool did not directly facilitate ordering; however, in CPRS, outpatient orders could easily be copied to inpatient orders and vice versa.

Figure 1
Computer screen shots (A‐E) of the medication reconciliation tool used at hospital admission.

Two versions of the medication reconciliation process were implemented upon hospital admission: one in which the physician initiated and completed a reconciliation that was then reviewed by a pharmacist (Figure 2A)the process primarily used on the medical and surgical services; and one in which, after the physician wrote admission orders, the pharmacist initiated and completed the reconciliation and communicated his or her findings with the physician (Figure 2B)the process primarily used on the psychiatric service. At discharge, after the physician wrote discharge orders, the pharmacist completed a reconciliation of preadmission, inpatient, and discharge orders using a tool similar to the admission one (Figure 1). The pharmacist then communicated the reconciliation findings to the physician, similar to the admission medication reconciliation process shown in Figure 2B. These processes and tools were in place for 18 months at the time of the cognitive task analysis, which took place in June 2007, and 32 months at the time of the focus groups, which took place in August 2008.

Figure 2
(A) Flow diagram of physician‐initiated admission medication reconciliation. (B) Flow diagram of pharmacist‐initiated admission medication reconciliation.

Participants

Participants consisted of internal medicine house staff physicians rotating on the inpatient service (n = 23) and inpatient staff pharmacists (n = 12). Overall, 14 (40%) were female. The 23 house staff physicians represented approximately 64% of the total house staff inpatient staffing. Thirteen (57%) were in postgraduate year 1 (PGY1), and 10 (43%) were in PGY2 or higher. The 12 pharmacists represented approximately 50% of the total pharmacist inpatient staffing. Individual CTA interviews took place at the end of the academic year (June) with participants who were highly experienced with the process of medication reconciliation in the VA setting. Focus groups took place at the beginning of the academic year (August) with participants who had to endorse the statement that they were experienced completing medication reconciliation. Subjects participated in either the individual or focus group interviews, but not both. Physicians and pharmacists were interviewed separately. All participants provided written informed consent, and the Institutional Review Board of the James J. Peters VA Medical Center approved the study procedures.

Data Collection

Theoretical Model

The Integrated Change Model9 guided our approach to data collection and analysis. It indicates that a person's motivation, intention, and ability determine whether a behavior will be carried out. A person's motivation is influenced by attitudes (eg, perceived pros and cons of the behavior), social influences, and self‐efficacy (eg, perceived capability). The behavior is also influenced by environmental and physical factorsin this case circumstances of the patient encounter, information systems, and the medication reconciliation tool.

Individual Interviews

We conducted individual CTA interviews with 7 physicians and 5 pharmacists. During CTA, participants verbalized their thoughts while they completed medication reconciliation for at least 1 actual case, and at least 1 standardized (fictitious) case, using the computerized medical record and tool. The purpose of this think aloud exercise was to provide information on medication reconciliation tool functionality and usability, problems in humancomputer interaction, and the impact of the tool on decision‐making, clinical practice, and workflow. As the participants interacted with the medication reconciliation tool, computer screens, mouse clicks, and menu selections were recorded using screen recording software (Hypercam), and the participants' thinking aloud was audio‐recorded. This provided the experimenters with context for analyzing and coding subjects' verbalizations (ie, playback of the screens provided detail about the subjects' interaction with the tool, including what functions of the tool they accessed, and problems they may have encountered). Immediately after completing the tasks, subjects were briefly interviewed about their impressions of the tool and their interaction with it. CTA sessions took 30‐50 minutes per participant. Audio‐ and screen‐recordings were synchronized and transcribed.

Focus Group Interviews

We conducted 3 focus groups, 2 with house staff physicians (n = 9 and n = 7), and 1 with pharmacists (n = 7), for a total of 23 focus group participants. The focus group discussion guide was informed by the results of the CTA and began with broad, open‐ended questions,10 followed by a series of more specific probes. Participants were asked to describe medication reconciliation and its purpose, whether they thought that the process influenced their decision‐making and was effective, and how they go about completing the process. Probes included how the task fit into daily workflow, time needed to complete the task, and its priority relative to other tasks. A set of questions asked participants to report barriers and facilitators to completing the task, training needs and experience, and their suggestions on how to improve task implementation and completion. The discussion also included participants' views of the optimal roles of physicians and pharmacists in performing medication reconciliation. Throughout, participants were encouraged to report both positive and negative perceptions. Group interviews lasted 60‐90 minutes, and were audiotaped and transcribed. The same moderator facilitated all 3 focus groups and participated in the individual CTA interviews.

Data Analysis

CTA and focus group transcripts were analyzed using standard social science methods for analyzing qualitative data.1114 Using multiple close readings, investigators performed initial independent coding of each of the transcripts and generated a list of concepts and domains, and a coding scheme. The coding was reviewed from the perspective of the theoretical model to determine whether additional codes were necessary. A research staff member, blinded to the study hypotheses, applied the codes to each transcript by labeling each word, phrase, or line. To test the coding scheme's reliability, a random 5% of transcript lines were coded by 2 independent coders and interrater reliability was assessed. Disagreement was reconciled by discussion and transcripts recoded as appropriate. The investigators then compared codes within and across interviews to elucidate the larger themes that emerged. Frequencies of mention of each domain were calculated. Although the original intent was to analyze the CTA and focus groups separately, themes arising from each of these 2 techniques overlapped sufficiently to allow for a combined analysis. Data were compiled to provide a description of the factors that affect medication reconciliation completion, a summary of barriers and facilitators to use of the medication reconciliation tool, and user suggestions.

RESULTS

Purpose of Medication Reconciliation

Both physicians and pharmacists agreed that a central goal of medication reconciliation is to prevent prescribing errors and adverse drug events that arise from medication utilization over time, and across place and provider. Respondents also agreed that the medication reconciliation document provides a record of patients' history of medication use and of the provider's rationale for medication changes.

Both physicians and pharmacists also indicated awareness of external necessities for completing medication reconciliation, including Joint Commission accreditation standards and, to a lesser extent, medico‐legal liability concerns. On the other hand, 1 physician expressed concern that documented medication discrepancies could be interpreted as mistakes and a liability problem.

Effectiveness of Medication Reconciliation

There was overall disagreement about whether or not medication reconciliation actually achieves its goal of improving medication safety. Many physicians and pharmacists said that medication reconciliation prompts them to perform additional checking of medication lists, dosing, conditions, and interactions, and to better document medication histories and provider decision‐making. On the other hand, some physicians and pharmacists saw it as mainly an administrative task and doubted whether it had any impact on patient care, as this physician indicated: It just seems like another form to fill out .You could be writing a bunch of whatever and no one would notice and no one would say anything and it would never matter. Likewise, a majority of physicians indicated that other parts of the medical record are better sources of prescribing information than the medication reconciliation document.

Medication Reconciliation Process

Physicians and pharmacists agreed that the key components of medication reconciliation are obtaining a medication history from patients and other available sources, identifying differences among medication histories and medications being given, documenting these discrepancies and their reasons, recording a prescribing plan, and counseling the patient. Respondents indicated that the process varies depending on patient complexity, number of medications, encounter type, and provider. For example, physicians were more likely than pharmacists to complete medication reconciliation at once on admission, rather than begin the task and complete it later, as this physician indicated:


It might seem a little tough, but if you don't do it right at that moment, chances [are high] of you forgetting to do it . So it's best done at the moment when you speak to the patient unless you're waiting for some more information.


On the other hand, this physician routinely put off completing medication reconciliation until the day after admission in order to incorporate a more developed prescribing plan:


You can't do it till the end. Until you have your whole plan. when I do an admission note, I write down every single problem and I account for every single medication that I'm going to put someone on in the hospital or not put someone on. And I actually do the medication reconciliation the next day very easily, because I know exactly what I discontinued or why, or added and why. I don't think it's necessary to do it that night [and] you think about it a little bit more.


These quotes suggests that there is an adherence benefit to completing medication reconciliation on admission as a routine, but that this may not be possible, or even desirable, when more time is needed to obtain and verify medication information and make informed prescribing decisions.

Impact of the Computer on the Medication Reconciliation Process

A majority of respondents cautioned about the impact of computerized information and an electronic tool on medication reconciliation. As indicated in these quotes, the first by a physician and the second by a pharmacist, providers' reliance on the computer can lead to less thorough patient interviews, and computerized medication information may be incomplete, both unintended consequences of the electronic health record:


At the VA, you can just easily import [all the information] and you don't even have to ask the patient. So I would imagine more errors get made because people just import whatever meds are in the computer.


If I didn't have [the computerized record], I would be doing patient interviews much more and finding out what they're taking. On the computer, you do all these beautiful notesso I rely a lot on the computer and the whole patient contact thing kind of slides away. When you go to other hospitals, medication reconciliation is extensively patient interview, family interview, calling neighborhood pharmacies, you know, more like detective work and talking to people versus just sitting here typing, so.But the computer is great.


Who Should Perform Medication Reconciliation

Pharmacists and physicians had mixed responses when asked who should perform medication reconciliation. Several physicians indicated that medication reconciliation duplicates what they already do on admission and in progress notes, and therefore is not a good use of their time.

Respondents from both professions questioned the quality of physicians' medication reconciliation. As 1 pharmacist stated about physicians:


They're busy. Whether you like it or not, they're busy. To compare everything, to go across all the sources whether it's what they get here, asking the patient [viewing data from other facilities].There's nothing wrong with the computer [being] able to copy everything that's active and dropping it in. Butyou have to look it over. That's the problem. They don't look it over.


Thus, there was a tension among a majority of respondents between a belief that pharmacists do a better job at medication history‐taking and reconciliation, and a belief that physicians make the prescribing decisions and should be responsible for them. The quote also suggests that a barrier to self‐efficacy among pharmacists is their dependence on physicians to write the orders needed to address the findings of medication reconciliation. Although many respondents recognized that the task needs to be a component of both profession's jobs, suggestions for collaboration between physicians and pharmacists were limited in vision. Suggestions included pharmacists' checking physicians' work, physicians cosigning pharmacists' work, or some other sequenced completion of the task.

Barriers to Medication Reconciliation

Barriers to efficient and effective completion of medication reconciliation according to respondents are shown in Table 1. Physicians and pharmacists both indicated that patients can be unreliable sources of medication information. A few respondents indicated that whereas patients' health conditions change, medication reconciliation occurs at 1 point in time; this can limit its usefulness or make it immediately obsolete.

Barriers to High‐Quality Medication Reconciliation, in Order of Strength of Endorsement
BarrierBarrier Type/LevelPrimary Endorser(s)No. of Endorsers (MDs/PharmDs)
  • Abbreviation: MDs/PharmDs, physicians/pharmacists; VA, Veterans Affairs medical center.

Competing clinical tasks have higher priorityProviderPhysician9/2
Patients provide unreliable informationPatientPhysician6/1
Status (active/expired/discontinued) of medications is unclearSystemPhysician/pharmacist2/5
Need to complete many medication reconciliationsProviderPharmacist0/6
Preadmission medication list generated by the tool may show medications in duplicate and may require extensive scrollingToolPhysician/pharmacist4/2
Medication reconciliation tool only picks up information on medications supplied by the VAToolPharmacist0/5
Process to import non‐local VA medications is slow or does not workSystemPhysician/pharmacist3/2
Patient's health status changes over timePatientPhysician/pharmacist3/1
It is difficult to determine physicians' rationale for prescribing changes, which is needed for the reconciliation documentProviderPharmacist0/4
Tool is unclear on where to insert revisions to the medication history, changes to the outpatient or inpatient orders, and unresolved medication discrepanciesToolPhysician3/0

Both physicians and pharmacists said that medication reconciliation competed for their time with other responsibilities, and physicians placed acute care responsibilities as a higher priority: One sick patient takes all your timeso your mind is on the patient, not on the reconciliation; that's the last thing you worry about.

Pharmacists emphasized that the volume of patients is a barrier: Give me time and I can do a perfect med rec.Honestly, it's work load.I'm sorry, that day where I had 17 people being discharged, I don't think I did such a great job on their med recs.

Respondents indicated several ways in which the computer system itself was a barrier to effective medication reconciliation. First, as previously noted, the computer only picks up information on medications supplied by the VA, and the medication reconciliation tool may only pick up medications supplied by the local facility. Second, sometimes the computer is unclear on the status of medications, as when outpatient medications are automatically discontinued after hospital admission, or when the system automatically imports a medication that is shown to be active but was only meant to be given for a short period of time, such as an antibiotic. Several barriers specific to tool usability are also shown in Table 1.

Suggestions for Improving Medication Reconciliation

Physicians' and pharmacists' suggestions for improving medication reconciliation are shown in Table 2. First, there was recognition of the need for someone in addition to the author to check the medication reconciliation document to find mistakes. Second, respondents indicated that better provider training might improve medication reconciliation's effectiveness. Both physicians and pharmacists indicated that their education consisted of a limited amount of on‐the‐job training, such as a walk through with a supervisor the first time. When asked for suggestions for improving education, both physicians and pharmacists suggested that physicians should receive case‐based education, during which the purpose of the task is emphasized. These respondents, the first a pharmacist and the second a physician, called for provider feedback to improve and maintain reliability:

Suggestions for Improving Medication Reconciliation, in Order of Strength of Endorsement
SuggestionTargeted LevelPrimary Endorser(s)No. of Endorsers (MDs/PharmDs)
  • Abbreviation: MDs/PharmDs, physicians/pharmacists; VAs, Veterans Affairs medical centers.

Place checkbox next to each medicationToolPhysician/pharmacist6/2
Order or label medication by condition or diagnosisToolPhysician/pharmacist2/3
Someone in addition to the author should check the medication reconciliation note and provide feedback and correctionsProviderPhysician/pharmacist2/2
Enable searchable medication historySystemPhysician2/2
Enable automatic importing of medication information from other VAsSystem/toolPhysician/pharmacist1/2
Reconciliation document should be signed by both physician and pharmacistProviderPharmacist0/2
Task should have dedicated staffingProviderPharmacist0/2
Facilitate viewing of preadmission medication list and inpatient orders side‐by‐side, instead of topbottomToolPharmacist0/2
Make template more conciseToolPharmacist0/2
Automatically convert medication reconciliation planned actions into ordersSystem/toolPharmacist0/2
Automatically insert medication reconciliation documentation into admission noteSystem/toolPhysician2/0


Have somebody really look at the quality of the reconciliation and speak to whoever did it, whether it's done correctly or not correctly. Because I've seen too many people just use the template, click, click, and then sign. You can finish the note [in] two minutes, but it's not going to be accurate and it's not going to do the patient any good.


We just keep on doing the same thing without ever learning [whether it is] the right way. That's where [we get] this [idea that] we are just doing it for the sake of doing it.


These quotes suggest that a lack of review and feedback about the reconciliation process appears to impact both perceived importance and quality.

DISCUSSION

In this study of hospital physicians' and pharmacists' perspectives on medication reconciliation, we found that although respondents agreed about its main purposeto improve prescribing safetya near majority believed that it was of uncertain benefit to patients and limited use to providers. This might, in part, be because of a tool that was not adequately integrated into workflow, making it extraneous to patient care. As a consequence, many respondents' indicated that when they had competing tasks, especially other acute care responsibilities, medication reconciliation was displaced in priority. Respondents indicated that unreliability of patient medication histories was also a major barrier, which is consistent with a recent Joint Commission field review in which organizations cited this as a task hindrance beyond their control.8 Lastly, respondents revealed limited perception of it being a team‐oriented task.

Our study also probed providers' perceptions of the effect of computerization on completing medication reconciliation. Although study respondents indicated that the computerized tool reduced the time required to complete the task, they also expressed concern that because medication reconciliation was automated in part at the VA, they spent less time with patients on the process. This finding is important because, according to 1 study, many medications are not captured by the VA's Computerized Patient Record System,15 and a patient's lack of medication adherence may not be evident in the CPRS. This finding is also consistent with our prior work that has not demonstrated an inherent advantage to electronic communication of medication information over paper.16

Our study suggests that, for medication reconciliation to be improved, provider self‐efficacy and engagement with the process must be increased. This might involve addressing negative provider attitudes, changing workflow, and improving provider confidence by improving information reliability. With regard to changing attitudes, team members should be briefed on research evidence that shows that medication reconciliation is effective in preventing ADEs13 and is cost‐effective17 to help to increase the value that providers place on medication reconciliation. With regard to workflow, the tool has to be optimized to facilitate information gathering, processing, and medication ordering. Our findings also suggest that medication reconciliation would benefit from widening the time window in which it should be completed (eg, to the first or second business day after admission), since this increases the time available to access multiple data sources, and for providers to update the preadmission medication history and to act on new medication information. Finally, regional electronic health information exchange would improve information reliability and provider confidence in the information.

Our findings also suggest that assignment of productive teamsconsisting of physicians, physician‐extenders, nurses, pharmacists, and/or administrative support staffrather than individuals to the task might improve task completion. Efficacy and perceived capability might be improved by dividing the task into parts more easily manageable by individual team members. One example would be to assign 1 team member to record all of the sources of medication information available for each patient (the patient's home, pharmacies, doctors, hospitals, etc), and assign 1 or more other team members to access these sources as needed. Another example would be to assign the pharmacist to take and document the preadmission medication history (if not for all patients, then perhaps for the highest‐risk patients), and assign the physician to verify the history, specify the planned action on admission for each medication, and complete the admission orders. These suggestions are consistent with a study that suggested that physician engagement and an effective team are strongly correlated with successful implementation of medication reconciliation.7

A strength of our study was its use of multiple methods (focus groups and cognitive task analysis) to collect data from key users individually while they interfaced with the system and in groups. Nevertheless, a limitation of the study is that it took place in a single hospital. Though it had a limited number of physician and pharmacist participants, the study sample represented a large fraction of the inpatient staff in those disciplines. We also did not include nurses, hospitalist attending physicians, or other disciplines that might be involved in medication reconciliation in other facilities or settings. However, our study explored the relationship between two disciplines (physicians and pharmacists), yielding findings that could apply to optimizing the function of other interdisciplinary teams.

Our findings can be used to inform improvement efforts in hospitals that have struggled to implement medication reconciliation. Given that the process is slated to return as an accreditation requirement of the Joint Commission,8 hospitals will need to find ways to strengthen the process. Our findings suggest that increasing providers' perceived capability, and confidence in the process and its outcomes, would improve their engagement in the process. This could be accomplished by improved information gathering, including better computer information systems and regional electronic health information exchange, a flexible timeframe for the process, provider training and feedback, and teamwork. In addition, hospitals can make sure their process is working by ascertaining a gold standard medication history on a subset of patients, and comparing the gold standard to the team's history, and admission and discharge orders. Because it is a central component of safe medication prescribing, medication reconciliation will continue to be a focus of state,18 national,19 and international safety efforts20 in the near future.

Acknowledgements

The authors are grateful for the technical assistance of Daniel Signor in the conduct of this work.

References
  1. Schnipper JL,Hamann C,Ndumele CD, et al.Effect of an electronic medication reconciliation application and process redesign on potential adverse drug events: a cluster‐randomized trial.Arch Intern Med.2009;169:771780.
  2. Pronovost P,Weast B,Schwarz M, et al.Medication reconciliation: a practical tool to reduce the risk of medication errors.J Crit Care.2003;18:201205.
  3. Boockvar KS,Carlson LaCorte H,Giambanco V,Fridman B,Siu A.Medication reconciliation for reducing drug‐discrepancy adverse events.Am J Geriatr Pharmacother.2006;4:236243.
  4. Jones JS,Dwyer PR,White LJ,Firman R.Patient transfer from nursing home to emergency department: outcomes and policy implications.Acad Emerg Med.1997;4:908915.
  5. Leape LL,Bates DW,Cullen DJ, et al.Systems analysis of adverse drug events. ADE Prevention Study Group.JAMA.1995;274:3543.
  6. Joint Commission Hospital National Patient Safety Goal #8. Available at: http://www.jointcommission.org/AccreditationPrograms/ Hospitals/NPSG/. Accessed November 10,2010.
  7. Rogers G,Alper E,Brunelle D, et al.Reconciling medications at admission: safe practice recommendations and implementation strategies.Jt Comm J Qual Patient Saf.2006;32:3750.
  8. Update: medication reconciliation. National Patient Safety Goal field review results. Joint Commission online June 2, 2010. Available at: http://www.jointcommission.org/NR/rdonlyres/17295FE3–6643‐48E6–89A5‐C629 609E3F36/0/jconlineJune210.pdf. Accessed November 10,2010.
  9. Vries H,Mesters I,van de Steeg H,Honing C.The general public's information needs and perceptions regarding hereditary cancer: an application of the integrated change model.Patient Educ Couns.2005;56:154165.
  10. Krueger R,King J.Involving Community Members in Focus Groups.Thousand Oaks, CA:Sage;1998.
  11. Miles M,Huberman M.Qualitative Data Analysis.Thousand Oaks, CA:Sage;1994.
  12. Patton MQ.How to Use Qualitative Methods in Evaluation.Newbury Park, CA:Sage;1987.
  13. Miller DC.Handbook of Research Design and Social Measurement,5th ed.Newbury Park, CA:Sage;1991.
  14. Flick U.An Introduction to Qualitative Research.London:Sage;1998.
  15. Kaboli PJ,McClimon BJ,Hoth AB,Barnett MJ.Assessing the accuracy of computerized medication histories.Am J Manag Care.2004;10:872877.
  16. Boockvar KS,Livote E,Goldstein N, et al.Electronic health records and adverse drug events after patient transfer.Qual Saf Health Care.2010;19:15.
  17. Karnon J,Campbell F,Czoski‐Murray C.Model‐based cost‐effectiveness analysis of interventions aimed at preventing medication error at hospital admission (medicines reconciliation).J Eval Clin Pract.2009;15:299306.
  18. Massachusetts Hospital Association. Reconciling medications. A Medication Safety Collaborative sponsored by the MA Coalition for the Prevention of Medical Errors. Available at: http://www.macoalition.org/Initiatives/RecMeds/ProjectBackground.pdf. Accessed November 10,2010.
  19. Patient safety medication systems tools. Available at: http://www. ihi.org/IHI/Topics/PatientSafety/MedicationSystems/Tools/. Accessed November 10,2010.
  20. Danish Society for Patient Safety: Operation Life Denmark. Available at: http://patientsikkerhed.dk/en/about_the_danish_society_for_patient_ safety/activities/. Accessed November 10,2010.
References
  1. Schnipper JL,Hamann C,Ndumele CD, et al.Effect of an electronic medication reconciliation application and process redesign on potential adverse drug events: a cluster‐randomized trial.Arch Intern Med.2009;169:771780.
  2. Pronovost P,Weast B,Schwarz M, et al.Medication reconciliation: a practical tool to reduce the risk of medication errors.J Crit Care.2003;18:201205.
  3. Boockvar KS,Carlson LaCorte H,Giambanco V,Fridman B,Siu A.Medication reconciliation for reducing drug‐discrepancy adverse events.Am J Geriatr Pharmacother.2006;4:236243.
  4. Jones JS,Dwyer PR,White LJ,Firman R.Patient transfer from nursing home to emergency department: outcomes and policy implications.Acad Emerg Med.1997;4:908915.
  5. Leape LL,Bates DW,Cullen DJ, et al.Systems analysis of adverse drug events. ADE Prevention Study Group.JAMA.1995;274:3543.
  6. Joint Commission Hospital National Patient Safety Goal #8. Available at: http://www.jointcommission.org/AccreditationPrograms/ Hospitals/NPSG/. Accessed November 10,2010.
  7. Rogers G,Alper E,Brunelle D, et al.Reconciling medications at admission: safe practice recommendations and implementation strategies.Jt Comm J Qual Patient Saf.2006;32:3750.
  8. Update: medication reconciliation. National Patient Safety Goal field review results. Joint Commission online June 2, 2010. Available at: http://www.jointcommission.org/NR/rdonlyres/17295FE3–6643‐48E6–89A5‐C629 609E3F36/0/jconlineJune210.pdf. Accessed November 10,2010.
  9. Vries H,Mesters I,van de Steeg H,Honing C.The general public's information needs and perceptions regarding hereditary cancer: an application of the integrated change model.Patient Educ Couns.2005;56:154165.
  10. Krueger R,King J.Involving Community Members in Focus Groups.Thousand Oaks, CA:Sage;1998.
  11. Miles M,Huberman M.Qualitative Data Analysis.Thousand Oaks, CA:Sage;1994.
  12. Patton MQ.How to Use Qualitative Methods in Evaluation.Newbury Park, CA:Sage;1987.
  13. Miller DC.Handbook of Research Design and Social Measurement,5th ed.Newbury Park, CA:Sage;1991.
  14. Flick U.An Introduction to Qualitative Research.London:Sage;1998.
  15. Kaboli PJ,McClimon BJ,Hoth AB,Barnett MJ.Assessing the accuracy of computerized medication histories.Am J Manag Care.2004;10:872877.
  16. Boockvar KS,Livote E,Goldstein N, et al.Electronic health records and adverse drug events after patient transfer.Qual Saf Health Care.2010;19:15.
  17. Karnon J,Campbell F,Czoski‐Murray C.Model‐based cost‐effectiveness analysis of interventions aimed at preventing medication error at hospital admission (medicines reconciliation).J Eval Clin Pract.2009;15:299306.
  18. Massachusetts Hospital Association. Reconciling medications. A Medication Safety Collaborative sponsored by the MA Coalition for the Prevention of Medical Errors. Available at: http://www.macoalition.org/Initiatives/RecMeds/ProjectBackground.pdf. Accessed November 10,2010.
  19. Patient safety medication systems tools. Available at: http://www. ihi.org/IHI/Topics/PatientSafety/MedicationSystems/Tools/. Accessed November 10,2010.
  20. Danish Society for Patient Safety: Operation Life Denmark. Available at: http://patientsikkerhed.dk/en/about_the_danish_society_for_patient_ safety/activities/. Accessed November 10,2010.
Issue
Journal of Hospital Medicine - 6(6)
Issue
Journal of Hospital Medicine - 6(6)
Page Number
329-337
Page Number
329-337
Article Type
Display Headline
Medication reconciliation: Barriers and facilitators from the perspectives of resident physicians and pharmacists
Display Headline
Medication reconciliation: Barriers and facilitators from the perspectives of resident physicians and pharmacists
Sections
Article Source

Copyright © 2011 Society of Hospital Medicine

Disallow All Ads
Correspondence Location
VA Medical Center, 130 West Kingsbridge Road, Bronx, NY 10468
Content Gating
No Gating (article Unlocked/Free)
Alternative CME
Article PDF Media