User login
Conway Tells HM12 Attendees to Keep Focus on Triple Aim: Better Care, Better Health, Lower Cost
CMS has evolved from a passive payor to an active facilitator and catalyst for quality improvement, with a “relentless focus” on what is the right thing to do for patients, Pat Conway told more than 2,000 hospitalists at HM12 in San Diego this morning.
There are a myriad of efficiencies and tactics being implemented at CMS to enhance the ability to roll out best practices across the board, in rapid cycle sequence. The future of safety is moving from individual safety breaches to an “all-cause harm” metric that tracks across setting.
A big focus in the next 2 years will be reduction of readmission (with financial penalties) and a reduction of hospital-acquired conditions (through the Partnership for Patients).
CMS is moving toward:
- Patient-centered outcomes;
- Reducing burdensome measurements; and
- Anticipating and mitigating unintended consequences;
Send your comments and feedback to: [email protected]
CMS has evolved from a passive payor to an active facilitator and catalyst for quality improvement, with a “relentless focus” on what is the right thing to do for patients, Pat Conway told more than 2,000 hospitalists at HM12 in San Diego this morning.
There are a myriad of efficiencies and tactics being implemented at CMS to enhance the ability to roll out best practices across the board, in rapid cycle sequence. The future of safety is moving from individual safety breaches to an “all-cause harm” metric that tracks across setting.
A big focus in the next 2 years will be reduction of readmission (with financial penalties) and a reduction of hospital-acquired conditions (through the Partnership for Patients).
CMS is moving toward:
- Patient-centered outcomes;
- Reducing burdensome measurements; and
- Anticipating and mitigating unintended consequences;
Send your comments and feedback to: [email protected]
CMS has evolved from a passive payor to an active facilitator and catalyst for quality improvement, with a “relentless focus” on what is the right thing to do for patients, Pat Conway told more than 2,000 hospitalists at HM12 in San Diego this morning.
There are a myriad of efficiencies and tactics being implemented at CMS to enhance the ability to roll out best practices across the board, in rapid cycle sequence. The future of safety is moving from individual safety breaches to an “all-cause harm” metric that tracks across setting.
A big focus in the next 2 years will be reduction of readmission (with financial penalties) and a reduction of hospital-acquired conditions (through the Partnership for Patients).
CMS is moving toward:
- Patient-centered outcomes;
- Reducing burdensome measurements; and
- Anticipating and mitigating unintended consequences;
Send your comments and feedback to: [email protected]
HM12 Pre-Course Session Emphasizes Ultrasound-Guidance, Evidence-Based Practices
Summation
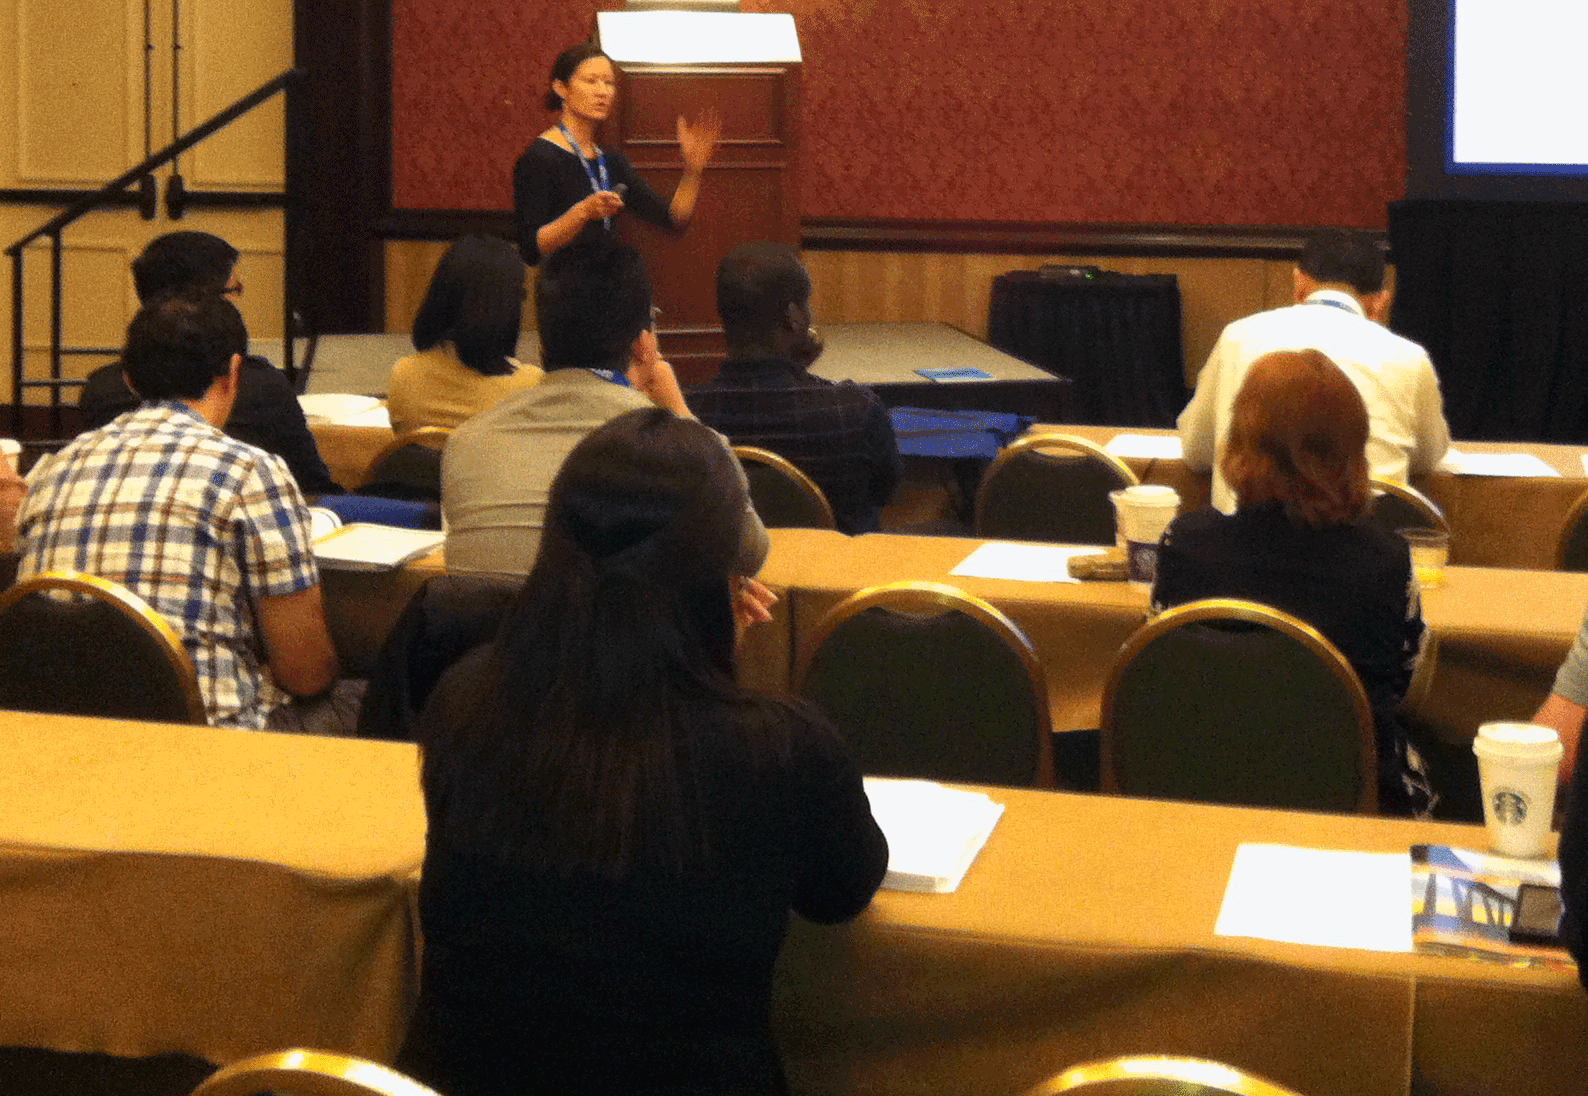
While bedside procedures have been long been a staple of internal medicine practice, the field of procedural medicine has increasingly become the dominion of hospitalists and now proceduralists. Nearly all procedures now can be aided by ultrasound guidance, and for many procedures, ultrasound guidance is standard of care.
“You think you’re a pretty good driver, but you wouldn’t drive down the road with your headlights off,” said Mark Ault, MD, director of the division of general internal medicine at Cedars-Sinai Medical Center in Los Angeles. “On your flight home, I’m sure you wouldn’t want your pilot flying with his controls off.”
Takeaways
• Performing bedside procedures safely requires specific training and steady experience that is well-suited to healthcare providers in hospital medicine.
• Ultrasound guidance is considered standard of care for central venous catheter placement, paracentesis, and thoracentesis.
• Widely accepted limitations in fluid removal thought to prevent re-expansion pulmonary edema (RPE) after thoracentesis may not prove to be valid.
• Arbitrary cutoffs for INR and platelet count in paracentesis are based on data that may not be valid in bedside paracentesis.
• Use of non-traumatic lumbar puncture needles, such as the Gertie-Marx and Sprotte needles, may reduce the incidence of post-LP headache.
• Fine-needle aspiration, punch skin biopsy, and arthrocentesis are bedside procedures that can be mastered by hospitalists and used regularly in their practice.
• Establishing a proceduralist group or center initially requires showing to hospital administrators benefits other than revenue, such as reduction in CLABSI and off-loading other procedural services.
Dr. Chang is a pediatric hospitalist at the University of San Diego Medical Center and Rady Children's Hospital in San Diego, Calif.
Summation
While bedside procedures have been long been a staple of internal medicine practice, the field of procedural medicine has increasingly become the dominion of hospitalists and now proceduralists. Nearly all procedures now can be aided by ultrasound guidance, and for many procedures, ultrasound guidance is standard of care.
“You think you’re a pretty good driver, but you wouldn’t drive down the road with your headlights off,” said Mark Ault, MD, director of the division of general internal medicine at Cedars-Sinai Medical Center in Los Angeles. “On your flight home, I’m sure you wouldn’t want your pilot flying with his controls off.”
Takeaways
• Performing bedside procedures safely requires specific training and steady experience that is well-suited to healthcare providers in hospital medicine.
• Ultrasound guidance is considered standard of care for central venous catheter placement, paracentesis, and thoracentesis.
• Widely accepted limitations in fluid removal thought to prevent re-expansion pulmonary edema (RPE) after thoracentesis may not prove to be valid.
• Arbitrary cutoffs for INR and platelet count in paracentesis are based on data that may not be valid in bedside paracentesis.
• Use of non-traumatic lumbar puncture needles, such as the Gertie-Marx and Sprotte needles, may reduce the incidence of post-LP headache.
• Fine-needle aspiration, punch skin biopsy, and arthrocentesis are bedside procedures that can be mastered by hospitalists and used regularly in their practice.
• Establishing a proceduralist group or center initially requires showing to hospital administrators benefits other than revenue, such as reduction in CLABSI and off-loading other procedural services.
Dr. Chang is a pediatric hospitalist at the University of San Diego Medical Center and Rady Children's Hospital in San Diego, Calif.
Summation
While bedside procedures have been long been a staple of internal medicine practice, the field of procedural medicine has increasingly become the dominion of hospitalists and now proceduralists. Nearly all procedures now can be aided by ultrasound guidance, and for many procedures, ultrasound guidance is standard of care.
“You think you’re a pretty good driver, but you wouldn’t drive down the road with your headlights off,” said Mark Ault, MD, director of the division of general internal medicine at Cedars-Sinai Medical Center in Los Angeles. “On your flight home, I’m sure you wouldn’t want your pilot flying with his controls off.”
Takeaways
• Performing bedside procedures safely requires specific training and steady experience that is well-suited to healthcare providers in hospital medicine.
• Ultrasound guidance is considered standard of care for central venous catheter placement, paracentesis, and thoracentesis.
• Widely accepted limitations in fluid removal thought to prevent re-expansion pulmonary edema (RPE) after thoracentesis may not prove to be valid.
• Arbitrary cutoffs for INR and platelet count in paracentesis are based on data that may not be valid in bedside paracentesis.
• Use of non-traumatic lumbar puncture needles, such as the Gertie-Marx and Sprotte needles, may reduce the incidence of post-LP headache.
• Fine-needle aspiration, punch skin biopsy, and arthrocentesis are bedside procedures that can be mastered by hospitalists and used regularly in their practice.
• Establishing a proceduralist group or center initially requires showing to hospital administrators benefits other than revenue, such as reduction in CLABSI and off-loading other procedural services.
Dr. Chang is a pediatric hospitalist at the University of San Diego Medical Center and Rady Children's Hospital in San Diego, Calif.

SIAD in Elderly Pneumonia Patients
One of the most common causes of hospitalization in the elderly is aspiration pneumonia related to dysphagia due to numerous underlying diseases.1 Thus, it is clinically important to identify prognostic factors associated with increased mortality in elderly patients with aspiration pneumonia. Hyponatremia is the most common electrolyte abnormality in hospitalized patients occurring in up to 11% of elderly patients in hospital.2 Previous studies have suggested that the presence and degree of hyponatremia is associated with the severity of pneumonia in adults and children, although the results have differed among studies.37
Hyponatremia is caused by various factors, including volume depletion, use of diuretics, hypothyroidism, adrenal insufficiency, heart failure, renal failure, and cirrhosis. Additionally, the syndrome of inappropriate antidiuresis (SIAD) is a frequent and heterogeneous disorder characterized by hyponatremia and impaired urinary dilution in the absence of any recognized stimulation of antidiuretic hormone secretion.8 Because not all patients with SIAD have elevated circulating levels of arginine vasopressin (AVP), the term SIAD is preferred to the term syndrome of inappropriate secretion of antidiuretic hormone (SIADH).9 One study has shown an association between the severity of pneumonia in children and the development of hyponatremia due to SIAD.10 To our knowledge, there have been no studies evaluating the impact of different causes of hyponatremia on mortality in elderly patients with aspiration pneumonia.
We therefore sought to investigate whether hyponatremia of all etiologies (all‐cause hyponatremia) was associated with mortality in elderly patients with aspiration pneumonia. Additionally, we compared the impact of hyponatremia due to SIAD, with hyponatremia of other etiologies, on mortality in this population
METHODS
Patients and Data Source
The Aspiration Pneumonia Dataset (APD) is the product of a retrospective analysis of elderly patients hospitalized with aspiration pneumonia from July 2004 to March 2007, performed by our second author (T.S.). The aim of the APD was to provide a dataset to allow for the development of a prediction rule for mortality, in elderly patients with aspiration pneumonia. All patients were hospitalized at Rakuwakai Otowa Hospital, in Kyoto, Japan, a 430‐bed community teaching hospital. Patients hospitalized with a diagnosis of aspiration pneumonia were identified, but those who required intensive care unit level care or intubation were excluded. The diagnosis of aspiration pneumonia was based on clinical evaluation, including a history of aspiration, a comorbidity associated with aspiration, symptoms or objective findings relevant to the respiratory system, and chest radiographic findings consistent with pneumonia.
From the APD dataset, we identified patients with hyponatremia at admission. After abstraction of the data, clinical charts were examined to obtain the data relevant to the etiologies of hyponatremia. The data were reviewed independently by 2 internal medicine physicians (J.M. and T.S.). Disagreements were resolved by consensus. Inter‐rater agreement was evaluated by using kappa statistics. The study was approved by the Ethics Committee of the Kyoto University Graduate School and Faculty of Medicine (project approval No. E290).
Definition of Hyponatremia and Its Causes
The definitions of hyponatremia and SIAD are given in Table 1. Hyponatremia was defined as serum sodium <135 mEq/L. Normonatremia was defined as serum sodium 135 mEq/L and 145 mEq/L, and hypernatremia was defined as serum sodium >145 mEq/L. Severity of hyponatremia was defined as mild (130 Na <135 mEq/L), moderate (125 Na <130 mEq/L), or severe (Na <125 mEq/L). Effective serum osmolality was calculated by the formula: [Effective serum osmolality (mOsm/kg H2O) = 2 Na (mEq/L) + glucose (mg/dL)/18].9 Hypotonic hyponatremia was defined as hyponatremia in the setting of effective serum osmolality <280 mOsm/kg H2O. Hypotonic hyponatremia was classified by extracellular fluid volume (ECFV) status as hypovolemic, SIAD euvolemic, non‐SIAD euvolemic or hypervolemic.11, 12
| Hypovolemic* | 1. Either of the terms volume depletion or hypovolemic documented in the admission notes. |
| 2. Clinical signs suggestive of volume depletion observed on physical examination and documented in admission notes (ie, dry oral cavity or dry skin in the axilla). | |
| 3. Volume depletion detected by biochemical or physiological examination (ie, metabolic alkalosis in arterial gas studies or collapsed inferior vena cava on echocardiography, respectively). | |
| 4. Increase in sodium concentration to within the normal range, together with decrease in blood urea nitrogen, following administration of hypotonic fluid. | |
| Euvolemic* | 1. The term euvolemic documented in admission notes. |
| 2. Criteria for hypovolemic and hypervolemic hyponatremia not met. | |
| Hypervolemic* | 1. The terms hypervolemic or an excess of ECFV documented in admission notes. |
| 2. Clinical signs suggestive of an excess of ECFV observed on physical examination and documented in admission notes (ie, edema or jugular venous distension). | |
| 3. Excess of ECFV detected by physiological examination (ie, dilated inferior vena cava on echocardiography). | |
| SIAD | Euvolemic hyponatremia with the following findings: |
| Urinary sodium concentration >30 mEq/L; | |
| Urinary osmolality >100 mOsm/kg H2O; | |
| Normal thyroid, adrenal, and renal function. | |
Clinical Outcomes
The primary outcome of analysis was defined as mortality within 30 days of admission (30‐day mortality). The secondary outcome was defined as mortality during the hospital stay (in‐hospital mortality).
Statistical Methods
First, for the subsequent analyses, we used a cohort from which hypernatremia and non‐hypotonic hyponatremia patients were excluded. Multivariate logistic regression was used to evaluate the impacts of hyponatremia and SIAD on the outcomes of interest. The following baseline risk factors associated with the severity of pneumonia in previous studies were considered for inclusion in the multivariate model1315: age, gender, living in a care facility, use of a feeding tube, disorientation, systolic blood pressure <90 mmHg or diastolic blood pressure <60 mmHg, heart rate >125 beats/min, body temperature <35C or >40C, respiratory failure (defined as oxygen saturation 90% or partial pressure of oxygen 60 mmHg or respiratory rate >30 breaths/min), blood glucose >250 mg/dL, anemia (defined as hematocrit <30%), blood urea nitrogen (BUN) >20 mg/dL, serum C‐reactive protein >10 mg/dL, serum albumin <3 g/dL, congestive heart failure, diabetes mellitus, chronic respiratory disease, malignancy, cirrhosis, chronic kidney failure, and central nervous system disease. The severity of pneumonia was evaluated by using the 6‐point scale of the A‐DROP (Age, Dehydration, Respiratory failure, Orientation disturbance, and low blood Pressure) scoring system proposed by the Japanese Respiratory Society.15 This is a modified version of the CURB‐65 (Confusion, Uremia, Respiratory rate, BP, age 65 years) clinical prediction rule and assesses the following parameters: age (men 70 years; women 75 years), dehydration (BUN concentration 21 mg/dL), respiratory failure (oxygen saturation 90%, partial pressure of oxygen 60 mmHg, ratio of partial pressure of oxygen to fraction of inspired oxygen 300), orientation disturbance (defined as disorientation at admission), and systolic blood pressure <90 mmHg. Patients with scores of 0 or 1 were classified as mild, patients scoring 2 as moderate, and patients scoring 3 to 5 as severe. In univariate analyses, the chi‐squared test was used. Those variables with P < 0.2 in the univariate analyses were included in the multivariate analyses. The HosmerLemeshow test was used to assess the goodness‐of‐fit for multivariate logistic regression models. Data were analyzed with STATA 10 (StataCorp, College Station, TX). Two‐tailed P values <0.05 were considered statistically significant.
RESULTS
The baseline characteristics of the study population are listed in Table 2. There were 221 elderly patients identified as having aspiration pneumonia. Of those, 65 (29%) had hyponatremia; 3 (5%) with non‐hypotonic and 62 (95%) with hypotonic hyponatremia. In the latter group, patients were characterized has having hypovolemic (39 [63%]), hypervolemic (3 [5%]), and euvolemic (20 [32%]) hyponatremia. Among the euvolemic patients, SIAD occurred in 14 (70%) of patients. Non‐SIAD euvolemic hyponatremia occurred in 6 (30%) patients and was associated with hypothyroidism (1 patient), adrenal insufficiency (1 patient), and was unclassifiable due to lack of available clinical data in 4 patients. The kappa value was 0.87 for inter‐rater agreement of the classification of hypotonic hyponatremia.
| |
| Age (yr) | 84 8.6* |
| Male | 90 (41) |
| Living in care facilities | 143 (65) |
| Use of a feeding tube | 40 (18) |
| Comorbidity | |
| Congestive heart failure | 21 (10) |
| Diabetes mellitus | 33 (15) |
| Chronic respiratory disease | 31 (14) |
| Malignancy | 14 (6) |
| Liver cirrhosis | 13 (6) |
| Chronic renal failure | 23 (10) |
| Central nervous system disease | 194 (88) |
| Disorientation | 36 (16) |
| Systolic blood pressure (mmHg) | 131 28* |
| Heart rate (beats/min) | 92 20* |
| Body temperature (C) | 37.5 1.1* |
| Respiratory rate (breaths/min) | 24 (IQR, 2030) |
| Oxygen saturation (%) | 95 (IQR, 9197) |
| pH | 7.44 (IQR, 7.407.47) |
| Glucose (mg/dL) | 140 57* |
| Hematocrit (%) | 34.7 5.9* |
| Blood urea nitrogen (mg/dL) | 22.7 15* |
| C‐reactive protein (mg/dL) | 5.2 (IQR, 1.811.7) |
| Albumin (g/dL) | 3.3 0.60* |
| A‐DROP severity class | |
| Mild (score, 0 or 1) | 83 (38) |
| Moderate (score, 2) | 84 (38) |
| Severe (score, 35) | 54 (24) |
| Sodium (mEq/L) | 137 6.98* |
| Sodium range (mEq/L) | 101162 |
| Distribution and classification of sodium concentration (mEq/L) | |
| Hypernatremia: Na >145 | 16 (7) |
| Normonatremia: 135 Na 145 | 140 (64) |
| Hyponatremia: Na <135 | 65 (29) |
| Mild: 130 Na <135 | 44 (20) |
| Moderate: 125 Na <130 | 11 (5) |
| Severe: Na <125 | 10 (4) |
| Length of stay (days) | 34.6 39* |
| 30‐day mortality | 28 (13) |
| LOS in these patients (days) | 14.7 9.6 |
| In‐hospital mortality | 63 (29) |
| LOS in these patients (days) | 41.9 33.8* |
The following variables were included in multivariate logistic analyses: congestive heart failure, cirrhosis, chronic renal failure, disorientation, body temperature <35C or >40C, anemia, and serum albumin <3 g/dL (see Supporting Information, Appendix, in the online version of this article).
In the multivariate logistic analyses, all‐cause hyponatremia was not associated with increased 30‐day mortality (odds ratio [OR] 1.85, 95% confidence interval [CI] 0.635.48; P = 0.262), but was associated with a trend toward increased risk of in‐hospital mortality (OR 2.10, 95% CI 1.004.42; P = 0.050) (Table 3). Moderate and severe hyponatremia were both significantly associated with increased in‐hospital mortality (OR 6.05, 95% CI 1.4625.0; P = 0.013 and OR 5.65, 95% CI 1.1428.1; P = 0.034, respectively). The same trends were observed for 30‐day mortality, although the results were not statistically significant. No such trend was observed for mild hyponatremia.
| Normonatremia | Hypotonic Hyponatremia | ||||
|---|---|---|---|---|---|
| All‐Cause | Mild | Moderate | Severe | ||
| n = 140 | n = 62 | n = 42 | n = 10 | n = 10 | |
| |||||
| 30‐day mortality, n (%) | 11 (8) | 11 (17) | 4 (10) | 2 (18) | 4 (60) |
| Odds ratio (95% CI) | 1 (ref) | 1.85 (0.635.48) | 1.30 (0.354.82) | 3.15 (0.5019.9) | 3.44 (0.5719.3) |
| P value | P = 0.262 | P = 0.691 | P = 0.222 | P = 0.184 | |
| In‐hospital mortality, n (%) | 28 (20) | 25 (39) | 10 (24) | 6 (55) | 7 (70) |
| Odds ratio (95% CI) | 1 (ref) | 2.10 (1.004.42) | 1.26 (0.523.07) | 6.05 (1.4625.0) | 5.65 (1.1428.1) |
| P value | P = 0.050 | P = 0.606 | P = 0.013 | P = 0.034 | |
In the multivariate logistic regression analyses, hypotonic hyponatremia due to SIAD was significantly associated with both increased risk of 30‐day mortality (OR 7.40, 95% CI 1.7331.7; P = 0.007) and increased risk of in‐hospital mortality (OR 22.3, 95% CI 4.26117; P < 0.001) (Table 4). In contrast, hypovolemic or non‐SIAD euvolemic hyponatremia was associated with neither increased risk of 30‐day mortality nor increased risk of in‐hospital mortality. There were too few hypervolemic hyponatremia patients for us to perform effective logistic analyses. The P values of the HosmerLemeshow tests were 0.45 for the multivariate logistic regression model (hypovolemic, SIAD, and non‐SIAD euvolemic vs normonatremia) with 30‐day mortality, and 0.30 for the model with in‐hospital mortality.
| Normonatremia | Hypotonic Hyponatremia | ||||
|---|---|---|---|---|---|
| Hypovolemic | Euvolemic | Hypervolemic | |||
| SIAD | non‐SIAD* | ||||
| n = 140 | n = 39 | n = 14 | n = 6 | n = 3 | |
| |||||
| 30‐day mortality, n (%) | 11 (8) | 2 (5) | 6 (43) | 1 (17) | 1 (33) |
| Odds ratio (95% CI) | 1 (ref) | 0.58 (0.113.10) | 7.40 (1.7331.7) | 2.71 (0.2430.6) | |
| P value | P = 0.525 | P = 0.007 | P = 0.421 | ||
| In‐hospital mortality, n (%) | 28 (20) | 7 (18) | 12 (86) | 1 (17) | 3 (100) |
| Odds ratio (95% CI) | 1 (ref) | 0.85 (0.322.30) | 22.3 (4.26117) | 0.93 (0.108.98) | |
| P value | P = 0.751 | P < 0.001 | P = 0.948 | ||
Six patients with SIAD were classified as having an A‐DROP severity class of mild, 4 as moderate, and 4 as severe (P = 0.908, Wilcoxon‐type test for trend). There was no association between the occurrence of SIAD and the severity of pneumonia.
DISCUSSION
We demonstrated that mortality in elderly patients with aspiration pneumonia was significantly associated with SIAD, but not with all‐cause hyponatremia. Unlike SIAD, other etiologies of hyponatremia were not associated with mortality in elderly patients with aspiration pneumonia. A recent study by Waikar and colleagues concluded that hyponatremia subgrouped by severity was not significantly associated with in‐hospital mortality in pneumonia patients, although a trend between severe hyponatremia and mortality was observed.16 Likewise, a study by Zilberberg and colleagues reported no significant increased risk of death with hyponatremia compared with normonatremia.4 These results are similar to our results for all‐cause hyponatremia and for hyponatremia subgrouped by severity. In contrast, a study by Nair and colleagues reported some increased risk of death with hyponatremia.5 Our results suggest that the heterogeneity of these previous results was probably due to the fact that SIAD was not identified in these other studies.
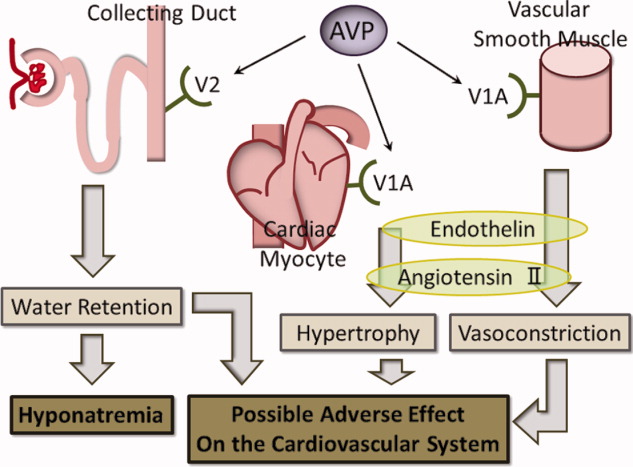
While the rationale for increased mortality in patients with pneumonia associated with SIAD is not known, it may be that there is a direct deleterious effect of elevated AVP. AVP has 3 distinct receptor subtypes, V1A, V1B, and V2. Stimulation of the V1A receptor in vascular smooth muscle promotes an increase in systemic vascular resistance, and stimulation of the same receptor in cardiac myocytes promotes myocyte hypertrophy. Stimulation of the V1B receptor in the anterior pituitary promotes adrenocorticotropic hormone release, and stimulation of the V2 receptor in the renal collecting ducts promotes an increase in water retention, which plays the main role in SIAD.1719 Our hypothesis in elderly SIAD patients with aspiration pneumonia is that increased AVP levels may lead not only to water retention and hyponatremia, but also to other effects such as vasoconstriction and myocyte hypertrophy, which may adversely influence the cardiovascular systems of elderly patients (Figure 1).
In our study, SIAD in elderly patients with aspiration pneumonia was more strongly associated with in‐hospital mortality than with 30‐day mortality. The average length of stay (LOS) of all patients dying in hospital (42 days) was significantly longer than the average LOS of those dying within 30 days of admission (15 days; P < 0.001, MannWhitney Test; Table 2). These findings suggest that SIAD was associated more strongly with longer‐term mortality than with acute‐stage mortality. The reason for the association between SIAD and longer‐term mortality remains unclear, although there may be some association between longer‐term mortality and the pathophysiologic mechanisms of AVP.
Our study has some limitations. First, because of the retrospective observational design, there is a potential for bias. We used multivariate analyses adjusted for confounding factors, however, other residual confounding factors may have remained. In addition, since the diagnosis of pneumonia was based on chart review, there may have been imprecision in the accuracy of diagnosing aspiration pneumonia. Aspiration pneumonia sometimes occurs without apparent episodes of aspiration, and this would have led to underdiagnosis. In contrast, aspiration pneumonitis can be mistaken for aspiration pneumonia; this would have led to overdiagnosis.
Second, volume status is difficult to evaluate prospectively, and thus by nature of our design, appropriate assignment of volume status was difficult. Several studies have used test infusions of isotonic saline to discriminate between these alternatives, but because our study was retrospective, we were unable to use this test.11, 20 Some studies have reported that, in patients in a state of volume depletion, volume repletion removes the stimulus for antidiuretic hormone release, allowing excess water to be excreted in a dilute urine and the serum sodium concentration to return toward normal.21, 22 According to this theory, instead of using an isotonic test infusion, we added in our study a criterion of volume depletion in which patients with a sustained increase in serum sodium concentration of 5 mEq/L and a sustained decrease in blood urea nitrogen, even with administration of hypotonic solution, were classified as volume depleted.
Third, all patients were analyzed according to status on admission, although some patients with hypovolemic hyponatremia at admission were found to have hyponatremia due to SIAD after admission.
Fourth, because the sample size of this study was small with our results revealing wide confidence intervals, an effect between other causes of hyponatremia and mortality might not have been identified. However, for 80% power, the calculated sample size was 100 non‐SIAD patients with aspiration pneumonia versus 10 SIAD patients, given that the mortality rate of elderly patients with aspiration pneumonia was, at a moderate estimate, 15% according to the studies of both Stukenborg and colleagues and Oliver and colleagues, and the mortality rate of SIAD patients was increased by 400% compared with that of non‐SIAD patients according to the study of Song and colleagues, with an alpha error of 0.05.7, 23, 24 Our sample size was therefore greater than the required size.
Fifth, because the APD dataset was compiled in 2007 for another study, it was not concurrent, and this may have led to other limitations in interpreting the data.
Finally, in Japan, the average length of hospital stay was 36.3 days in 2004 and 34.1 days in 2007much longer than other developed countries.25 Because of this situation, in‐hospital mortality, and not 30‐day mortality, represented long‐term mortality. Therefore, our results may not be easily applicable to the situation in other developed countries.
In conclusion, our results suggest that the presence of SIAD on admission in elderly patients with aspiration pneumonia is associated with increased mortality. This novel finding should be re‐evaluated, but it does raise the question of a direct, negative impact of AVP on patients' clinical outcomes. In the future, a larger prospective cohort study should be conducted to confirm the findings of this study, given the small sample size and the retrospective nature of the study. Additionally, a different population of pneumonia patients, such as those with community‐acquired pneumonia, should be examined to further evaluate the etiologies of hyponatremia in pneumonia and the association between hyponatremia of these different etiologies and mortality.
Acknowledgements
Disclosures: Jun Miyashita and Toshihiko Shimada report receiving a grant‐in‐aid from the Ministry of Health, Labour and Welfare of Japan, Development of Clinical Research Fellowship (Principal Investigator, Shunichi Fukuhara), grant H18‐001. No other potential conflict of interest relevant to this article was reported.
- ,.Aspiration pneumonia and dysphagia in the elderly.Chest.2003;124(1):328–336.
- ,.Hyponatraemia in the elderly.Age Ageing.1983;12(1):77–80.
- ,.Frequency and significance of electrolyte abnormalities in pneumonia.Indian Pediatr.1992;29(6):735–740.
- ,,, et al.Hyponatremia and hospital outcomes among patients with pneumonia: a retrospective cohort study.BMC Pulm Med.2008;8(2):16.
- ,,,.Hyponatremia in community‐acquired pneumonia.Am J Nephrol.2007;27(2):184–190.
- ,,,.Hyponatremia in pediatric community‐acquired pneumonia.Pediatr Nephrol.2008;23(12):2247–2253.
- ,,, et al.Epidemiology and clinical outcomes of community‐acquired pneumonia in adult patients in Asian countries: a prospective study by the Asian network for surveillance of resistant pathogens.Int J Antimicrob Agents.2008;31(2):107–114.
- ,.The syndrome of inappropriate secretion of antidiuretic hormone.Am J Med.1967;42(5):790–806.
- ,.Clinical practice. The syndrome of inappropriate antidiuresis.N Engl J Med.2007;356(20):2064–2072.
- ,,.Hyponatraemia and the inappropriate ADH syndrome in pneumonia.Ann Trop Paediatr.1992;12(4):455–462.
- ,,, et al.Value of fractional uric acid excretion in differential diagnosis of hyponatremic patients on diuretics.J Clin Endocrinol Metab.2008;93(8):2991–2997.
- ,.The syndrome of inappropriate antidiuretic hormone: prevalence, causes and consequences.Eur J Endocrinol.2010;162(suppl 1):S5–S12.
- ,,, et al.A prediction rule to identify low‐risk patients with community‐acquired pneumonia.N Engl J Med.1997;336(4):243–250.
- ,,, et al.Defining community acquired pneumonia severity on presentation to hospital: an international derivation and validation study.Thorax.2003;58(5):377–382.
- ,,, et al.Comparison of severity scoring systems A‐DROP and CURB‐65 for community‐acquired pneumonia.Respirology.2008;13(5):731–735.
- ,,.Mortality after hospitalization with mild, moderate, and severe hyponatremia.Am J Med.2009;122(9):857–865.
- .The role of vasopressin in congestive heart failure.Cleve Clin J Med.2006;73(suppl 3):S19–S23.
- .Vasopressin antagonists—progress and promise.N Engl J Med.2006;355(20):2146–2148.
- ,,, et al.A novel vasopressin dual V1A/V2 receptor antagonist, conivaptan hydrochloride, improves hyponatremia in rats with syndrome of inappropriate secretion of antidiuretic hormone (SIADH).Biol Pharm Bull.2007;30(1):91–95.
- ,.Clinical laboratory evaluation of the syndrome of inappropriate secretion of antidiuretic hormone.Clin J Am Soc Nephrol.2008;3(4):1175–1184.
- ,,,,,.Danger of central pontine myelinolysis in hypotonic dehydration and recommendation for treatment.Am J Med Sci.1989;298(1):41–43.
- ,.Treatment of hyponatremia: a quantitative analysis.Am J Kidney Dis.1993;21(4):439–443.
- ,,, et al.Hospital discharge abstract data on comorbidity improved the prediction of death among patients hospitalized with aspiration pneumonia.J Clin Epidemiol.2004;57(5):522–532.
- ,,, et al.Comorbid disease and the effect of race and ethnicity on in‐hospital mortality from aspiration pneumonia.J Natl Med Assoc.2004;96(11):1462–1469.
- Ministry of Health, Labour and Welfare, Japan. Health Statistics in Japan 2007. Available at: http://www.mhlw.go.jp/english/database/db‐hss/hs2007.html. Accessed August 18,2010.
One of the most common causes of hospitalization in the elderly is aspiration pneumonia related to dysphagia due to numerous underlying diseases.1 Thus, it is clinically important to identify prognostic factors associated with increased mortality in elderly patients with aspiration pneumonia. Hyponatremia is the most common electrolyte abnormality in hospitalized patients occurring in up to 11% of elderly patients in hospital.2 Previous studies have suggested that the presence and degree of hyponatremia is associated with the severity of pneumonia in adults and children, although the results have differed among studies.37
Hyponatremia is caused by various factors, including volume depletion, use of diuretics, hypothyroidism, adrenal insufficiency, heart failure, renal failure, and cirrhosis. Additionally, the syndrome of inappropriate antidiuresis (SIAD) is a frequent and heterogeneous disorder characterized by hyponatremia and impaired urinary dilution in the absence of any recognized stimulation of antidiuretic hormone secretion.8 Because not all patients with SIAD have elevated circulating levels of arginine vasopressin (AVP), the term SIAD is preferred to the term syndrome of inappropriate secretion of antidiuretic hormone (SIADH).9 One study has shown an association between the severity of pneumonia in children and the development of hyponatremia due to SIAD.10 To our knowledge, there have been no studies evaluating the impact of different causes of hyponatremia on mortality in elderly patients with aspiration pneumonia.
We therefore sought to investigate whether hyponatremia of all etiologies (all‐cause hyponatremia) was associated with mortality in elderly patients with aspiration pneumonia. Additionally, we compared the impact of hyponatremia due to SIAD, with hyponatremia of other etiologies, on mortality in this population
METHODS
Patients and Data Source
The Aspiration Pneumonia Dataset (APD) is the product of a retrospective analysis of elderly patients hospitalized with aspiration pneumonia from July 2004 to March 2007, performed by our second author (T.S.). The aim of the APD was to provide a dataset to allow for the development of a prediction rule for mortality, in elderly patients with aspiration pneumonia. All patients were hospitalized at Rakuwakai Otowa Hospital, in Kyoto, Japan, a 430‐bed community teaching hospital. Patients hospitalized with a diagnosis of aspiration pneumonia were identified, but those who required intensive care unit level care or intubation were excluded. The diagnosis of aspiration pneumonia was based on clinical evaluation, including a history of aspiration, a comorbidity associated with aspiration, symptoms or objective findings relevant to the respiratory system, and chest radiographic findings consistent with pneumonia.
From the APD dataset, we identified patients with hyponatremia at admission. After abstraction of the data, clinical charts were examined to obtain the data relevant to the etiologies of hyponatremia. The data were reviewed independently by 2 internal medicine physicians (J.M. and T.S.). Disagreements were resolved by consensus. Inter‐rater agreement was evaluated by using kappa statistics. The study was approved by the Ethics Committee of the Kyoto University Graduate School and Faculty of Medicine (project approval No. E290).
Definition of Hyponatremia and Its Causes
The definitions of hyponatremia and SIAD are given in Table 1. Hyponatremia was defined as serum sodium <135 mEq/L. Normonatremia was defined as serum sodium 135 mEq/L and 145 mEq/L, and hypernatremia was defined as serum sodium >145 mEq/L. Severity of hyponatremia was defined as mild (130 Na <135 mEq/L), moderate (125 Na <130 mEq/L), or severe (Na <125 mEq/L). Effective serum osmolality was calculated by the formula: [Effective serum osmolality (mOsm/kg H2O) = 2 Na (mEq/L) + glucose (mg/dL)/18].9 Hypotonic hyponatremia was defined as hyponatremia in the setting of effective serum osmolality <280 mOsm/kg H2O. Hypotonic hyponatremia was classified by extracellular fluid volume (ECFV) status as hypovolemic, SIAD euvolemic, non‐SIAD euvolemic or hypervolemic.11, 12
| Hypovolemic* | 1. Either of the terms volume depletion or hypovolemic documented in the admission notes. |
| 2. Clinical signs suggestive of volume depletion observed on physical examination and documented in admission notes (ie, dry oral cavity or dry skin in the axilla). | |
| 3. Volume depletion detected by biochemical or physiological examination (ie, metabolic alkalosis in arterial gas studies or collapsed inferior vena cava on echocardiography, respectively). | |
| 4. Increase in sodium concentration to within the normal range, together with decrease in blood urea nitrogen, following administration of hypotonic fluid. | |
| Euvolemic* | 1. The term euvolemic documented in admission notes. |
| 2. Criteria for hypovolemic and hypervolemic hyponatremia not met. | |
| Hypervolemic* | 1. The terms hypervolemic or an excess of ECFV documented in admission notes. |
| 2. Clinical signs suggestive of an excess of ECFV observed on physical examination and documented in admission notes (ie, edema or jugular venous distension). | |
| 3. Excess of ECFV detected by physiological examination (ie, dilated inferior vena cava on echocardiography). | |
| SIAD | Euvolemic hyponatremia with the following findings: |
| Urinary sodium concentration >30 mEq/L; | |
| Urinary osmolality >100 mOsm/kg H2O; | |
| Normal thyroid, adrenal, and renal function. | |
Clinical Outcomes
The primary outcome of analysis was defined as mortality within 30 days of admission (30‐day mortality). The secondary outcome was defined as mortality during the hospital stay (in‐hospital mortality).
Statistical Methods
First, for the subsequent analyses, we used a cohort from which hypernatremia and non‐hypotonic hyponatremia patients were excluded. Multivariate logistic regression was used to evaluate the impacts of hyponatremia and SIAD on the outcomes of interest. The following baseline risk factors associated with the severity of pneumonia in previous studies were considered for inclusion in the multivariate model1315: age, gender, living in a care facility, use of a feeding tube, disorientation, systolic blood pressure <90 mmHg or diastolic blood pressure <60 mmHg, heart rate >125 beats/min, body temperature <35C or >40C, respiratory failure (defined as oxygen saturation 90% or partial pressure of oxygen 60 mmHg or respiratory rate >30 breaths/min), blood glucose >250 mg/dL, anemia (defined as hematocrit <30%), blood urea nitrogen (BUN) >20 mg/dL, serum C‐reactive protein >10 mg/dL, serum albumin <3 g/dL, congestive heart failure, diabetes mellitus, chronic respiratory disease, malignancy, cirrhosis, chronic kidney failure, and central nervous system disease. The severity of pneumonia was evaluated by using the 6‐point scale of the A‐DROP (Age, Dehydration, Respiratory failure, Orientation disturbance, and low blood Pressure) scoring system proposed by the Japanese Respiratory Society.15 This is a modified version of the CURB‐65 (Confusion, Uremia, Respiratory rate, BP, age 65 years) clinical prediction rule and assesses the following parameters: age (men 70 years; women 75 years), dehydration (BUN concentration 21 mg/dL), respiratory failure (oxygen saturation 90%, partial pressure of oxygen 60 mmHg, ratio of partial pressure of oxygen to fraction of inspired oxygen 300), orientation disturbance (defined as disorientation at admission), and systolic blood pressure <90 mmHg. Patients with scores of 0 or 1 were classified as mild, patients scoring 2 as moderate, and patients scoring 3 to 5 as severe. In univariate analyses, the chi‐squared test was used. Those variables with P < 0.2 in the univariate analyses were included in the multivariate analyses. The HosmerLemeshow test was used to assess the goodness‐of‐fit for multivariate logistic regression models. Data were analyzed with STATA 10 (StataCorp, College Station, TX). Two‐tailed P values <0.05 were considered statistically significant.
RESULTS
The baseline characteristics of the study population are listed in Table 2. There were 221 elderly patients identified as having aspiration pneumonia. Of those, 65 (29%) had hyponatremia; 3 (5%) with non‐hypotonic and 62 (95%) with hypotonic hyponatremia. In the latter group, patients were characterized has having hypovolemic (39 [63%]), hypervolemic (3 [5%]), and euvolemic (20 [32%]) hyponatremia. Among the euvolemic patients, SIAD occurred in 14 (70%) of patients. Non‐SIAD euvolemic hyponatremia occurred in 6 (30%) patients and was associated with hypothyroidism (1 patient), adrenal insufficiency (1 patient), and was unclassifiable due to lack of available clinical data in 4 patients. The kappa value was 0.87 for inter‐rater agreement of the classification of hypotonic hyponatremia.
| |
| Age (yr) | 84 8.6* |
| Male | 90 (41) |
| Living in care facilities | 143 (65) |
| Use of a feeding tube | 40 (18) |
| Comorbidity | |
| Congestive heart failure | 21 (10) |
| Diabetes mellitus | 33 (15) |
| Chronic respiratory disease | 31 (14) |
| Malignancy | 14 (6) |
| Liver cirrhosis | 13 (6) |
| Chronic renal failure | 23 (10) |
| Central nervous system disease | 194 (88) |
| Disorientation | 36 (16) |
| Systolic blood pressure (mmHg) | 131 28* |
| Heart rate (beats/min) | 92 20* |
| Body temperature (C) | 37.5 1.1* |
| Respiratory rate (breaths/min) | 24 (IQR, 2030) |
| Oxygen saturation (%) | 95 (IQR, 9197) |
| pH | 7.44 (IQR, 7.407.47) |
| Glucose (mg/dL) | 140 57* |
| Hematocrit (%) | 34.7 5.9* |
| Blood urea nitrogen (mg/dL) | 22.7 15* |
| C‐reactive protein (mg/dL) | 5.2 (IQR, 1.811.7) |
| Albumin (g/dL) | 3.3 0.60* |
| A‐DROP severity class | |
| Mild (score, 0 or 1) | 83 (38) |
| Moderate (score, 2) | 84 (38) |
| Severe (score, 35) | 54 (24) |
| Sodium (mEq/L) | 137 6.98* |
| Sodium range (mEq/L) | 101162 |
| Distribution and classification of sodium concentration (mEq/L) | |
| Hypernatremia: Na >145 | 16 (7) |
| Normonatremia: 135 Na 145 | 140 (64) |
| Hyponatremia: Na <135 | 65 (29) |
| Mild: 130 Na <135 | 44 (20) |
| Moderate: 125 Na <130 | 11 (5) |
| Severe: Na <125 | 10 (4) |
| Length of stay (days) | 34.6 39* |
| 30‐day mortality | 28 (13) |
| LOS in these patients (days) | 14.7 9.6 |
| In‐hospital mortality | 63 (29) |
| LOS in these patients (days) | 41.9 33.8* |
The following variables were included in multivariate logistic analyses: congestive heart failure, cirrhosis, chronic renal failure, disorientation, body temperature <35C or >40C, anemia, and serum albumin <3 g/dL (see Supporting Information, Appendix, in the online version of this article).
In the multivariate logistic analyses, all‐cause hyponatremia was not associated with increased 30‐day mortality (odds ratio [OR] 1.85, 95% confidence interval [CI] 0.635.48; P = 0.262), but was associated with a trend toward increased risk of in‐hospital mortality (OR 2.10, 95% CI 1.004.42; P = 0.050) (Table 3). Moderate and severe hyponatremia were both significantly associated with increased in‐hospital mortality (OR 6.05, 95% CI 1.4625.0; P = 0.013 and OR 5.65, 95% CI 1.1428.1; P = 0.034, respectively). The same trends were observed for 30‐day mortality, although the results were not statistically significant. No such trend was observed for mild hyponatremia.
| Normonatremia | Hypotonic Hyponatremia | ||||
|---|---|---|---|---|---|
| All‐Cause | Mild | Moderate | Severe | ||
| n = 140 | n = 62 | n = 42 | n = 10 | n = 10 | |
| |||||
| 30‐day mortality, n (%) | 11 (8) | 11 (17) | 4 (10) | 2 (18) | 4 (60) |
| Odds ratio (95% CI) | 1 (ref) | 1.85 (0.635.48) | 1.30 (0.354.82) | 3.15 (0.5019.9) | 3.44 (0.5719.3) |
| P value | P = 0.262 | P = 0.691 | P = 0.222 | P = 0.184 | |
| In‐hospital mortality, n (%) | 28 (20) | 25 (39) | 10 (24) | 6 (55) | 7 (70) |
| Odds ratio (95% CI) | 1 (ref) | 2.10 (1.004.42) | 1.26 (0.523.07) | 6.05 (1.4625.0) | 5.65 (1.1428.1) |
| P value | P = 0.050 | P = 0.606 | P = 0.013 | P = 0.034 | |
In the multivariate logistic regression analyses, hypotonic hyponatremia due to SIAD was significantly associated with both increased risk of 30‐day mortality (OR 7.40, 95% CI 1.7331.7; P = 0.007) and increased risk of in‐hospital mortality (OR 22.3, 95% CI 4.26117; P < 0.001) (Table 4). In contrast, hypovolemic or non‐SIAD euvolemic hyponatremia was associated with neither increased risk of 30‐day mortality nor increased risk of in‐hospital mortality. There were too few hypervolemic hyponatremia patients for us to perform effective logistic analyses. The P values of the HosmerLemeshow tests were 0.45 for the multivariate logistic regression model (hypovolemic, SIAD, and non‐SIAD euvolemic vs normonatremia) with 30‐day mortality, and 0.30 for the model with in‐hospital mortality.
| Normonatremia | Hypotonic Hyponatremia | ||||
|---|---|---|---|---|---|
| Hypovolemic | Euvolemic | Hypervolemic | |||
| SIAD | non‐SIAD* | ||||
| n = 140 | n = 39 | n = 14 | n = 6 | n = 3 | |
| |||||
| 30‐day mortality, n (%) | 11 (8) | 2 (5) | 6 (43) | 1 (17) | 1 (33) |
| Odds ratio (95% CI) | 1 (ref) | 0.58 (0.113.10) | 7.40 (1.7331.7) | 2.71 (0.2430.6) | |
| P value | P = 0.525 | P = 0.007 | P = 0.421 | ||
| In‐hospital mortality, n (%) | 28 (20) | 7 (18) | 12 (86) | 1 (17) | 3 (100) |
| Odds ratio (95% CI) | 1 (ref) | 0.85 (0.322.30) | 22.3 (4.26117) | 0.93 (0.108.98) | |
| P value | P = 0.751 | P < 0.001 | P = 0.948 | ||
Six patients with SIAD were classified as having an A‐DROP severity class of mild, 4 as moderate, and 4 as severe (P = 0.908, Wilcoxon‐type test for trend). There was no association between the occurrence of SIAD and the severity of pneumonia.
DISCUSSION
We demonstrated that mortality in elderly patients with aspiration pneumonia was significantly associated with SIAD, but not with all‐cause hyponatremia. Unlike SIAD, other etiologies of hyponatremia were not associated with mortality in elderly patients with aspiration pneumonia. A recent study by Waikar and colleagues concluded that hyponatremia subgrouped by severity was not significantly associated with in‐hospital mortality in pneumonia patients, although a trend between severe hyponatremia and mortality was observed.16 Likewise, a study by Zilberberg and colleagues reported no significant increased risk of death with hyponatremia compared with normonatremia.4 These results are similar to our results for all‐cause hyponatremia and for hyponatremia subgrouped by severity. In contrast, a study by Nair and colleagues reported some increased risk of death with hyponatremia.5 Our results suggest that the heterogeneity of these previous results was probably due to the fact that SIAD was not identified in these other studies.
While the rationale for increased mortality in patients with pneumonia associated with SIAD is not known, it may be that there is a direct deleterious effect of elevated AVP. AVP has 3 distinct receptor subtypes, V1A, V1B, and V2. Stimulation of the V1A receptor in vascular smooth muscle promotes an increase in systemic vascular resistance, and stimulation of the same receptor in cardiac myocytes promotes myocyte hypertrophy. Stimulation of the V1B receptor in the anterior pituitary promotes adrenocorticotropic hormone release, and stimulation of the V2 receptor in the renal collecting ducts promotes an increase in water retention, which plays the main role in SIAD.1719 Our hypothesis in elderly SIAD patients with aspiration pneumonia is that increased AVP levels may lead not only to water retention and hyponatremia, but also to other effects such as vasoconstriction and myocyte hypertrophy, which may adversely influence the cardiovascular systems of elderly patients (Figure 1).
In our study, SIAD in elderly patients with aspiration pneumonia was more strongly associated with in‐hospital mortality than with 30‐day mortality. The average length of stay (LOS) of all patients dying in hospital (42 days) was significantly longer than the average LOS of those dying within 30 days of admission (15 days; P < 0.001, MannWhitney Test; Table 2). These findings suggest that SIAD was associated more strongly with longer‐term mortality than with acute‐stage mortality. The reason for the association between SIAD and longer‐term mortality remains unclear, although there may be some association between longer‐term mortality and the pathophysiologic mechanisms of AVP.
Our study has some limitations. First, because of the retrospective observational design, there is a potential for bias. We used multivariate analyses adjusted for confounding factors, however, other residual confounding factors may have remained. In addition, since the diagnosis of pneumonia was based on chart review, there may have been imprecision in the accuracy of diagnosing aspiration pneumonia. Aspiration pneumonia sometimes occurs without apparent episodes of aspiration, and this would have led to underdiagnosis. In contrast, aspiration pneumonitis can be mistaken for aspiration pneumonia; this would have led to overdiagnosis.
Second, volume status is difficult to evaluate prospectively, and thus by nature of our design, appropriate assignment of volume status was difficult. Several studies have used test infusions of isotonic saline to discriminate between these alternatives, but because our study was retrospective, we were unable to use this test.11, 20 Some studies have reported that, in patients in a state of volume depletion, volume repletion removes the stimulus for antidiuretic hormone release, allowing excess water to be excreted in a dilute urine and the serum sodium concentration to return toward normal.21, 22 According to this theory, instead of using an isotonic test infusion, we added in our study a criterion of volume depletion in which patients with a sustained increase in serum sodium concentration of 5 mEq/L and a sustained decrease in blood urea nitrogen, even with administration of hypotonic solution, were classified as volume depleted.
Third, all patients were analyzed according to status on admission, although some patients with hypovolemic hyponatremia at admission were found to have hyponatremia due to SIAD after admission.
Fourth, because the sample size of this study was small with our results revealing wide confidence intervals, an effect between other causes of hyponatremia and mortality might not have been identified. However, for 80% power, the calculated sample size was 100 non‐SIAD patients with aspiration pneumonia versus 10 SIAD patients, given that the mortality rate of elderly patients with aspiration pneumonia was, at a moderate estimate, 15% according to the studies of both Stukenborg and colleagues and Oliver and colleagues, and the mortality rate of SIAD patients was increased by 400% compared with that of non‐SIAD patients according to the study of Song and colleagues, with an alpha error of 0.05.7, 23, 24 Our sample size was therefore greater than the required size.
Fifth, because the APD dataset was compiled in 2007 for another study, it was not concurrent, and this may have led to other limitations in interpreting the data.
Finally, in Japan, the average length of hospital stay was 36.3 days in 2004 and 34.1 days in 2007much longer than other developed countries.25 Because of this situation, in‐hospital mortality, and not 30‐day mortality, represented long‐term mortality. Therefore, our results may not be easily applicable to the situation in other developed countries.
In conclusion, our results suggest that the presence of SIAD on admission in elderly patients with aspiration pneumonia is associated with increased mortality. This novel finding should be re‐evaluated, but it does raise the question of a direct, negative impact of AVP on patients' clinical outcomes. In the future, a larger prospective cohort study should be conducted to confirm the findings of this study, given the small sample size and the retrospective nature of the study. Additionally, a different population of pneumonia patients, such as those with community‐acquired pneumonia, should be examined to further evaluate the etiologies of hyponatremia in pneumonia and the association between hyponatremia of these different etiologies and mortality.
Acknowledgements
Disclosures: Jun Miyashita and Toshihiko Shimada report receiving a grant‐in‐aid from the Ministry of Health, Labour and Welfare of Japan, Development of Clinical Research Fellowship (Principal Investigator, Shunichi Fukuhara), grant H18‐001. No other potential conflict of interest relevant to this article was reported.
One of the most common causes of hospitalization in the elderly is aspiration pneumonia related to dysphagia due to numerous underlying diseases.1 Thus, it is clinically important to identify prognostic factors associated with increased mortality in elderly patients with aspiration pneumonia. Hyponatremia is the most common electrolyte abnormality in hospitalized patients occurring in up to 11% of elderly patients in hospital.2 Previous studies have suggested that the presence and degree of hyponatremia is associated with the severity of pneumonia in adults and children, although the results have differed among studies.37
Hyponatremia is caused by various factors, including volume depletion, use of diuretics, hypothyroidism, adrenal insufficiency, heart failure, renal failure, and cirrhosis. Additionally, the syndrome of inappropriate antidiuresis (SIAD) is a frequent and heterogeneous disorder characterized by hyponatremia and impaired urinary dilution in the absence of any recognized stimulation of antidiuretic hormone secretion.8 Because not all patients with SIAD have elevated circulating levels of arginine vasopressin (AVP), the term SIAD is preferred to the term syndrome of inappropriate secretion of antidiuretic hormone (SIADH).9 One study has shown an association between the severity of pneumonia in children and the development of hyponatremia due to SIAD.10 To our knowledge, there have been no studies evaluating the impact of different causes of hyponatremia on mortality in elderly patients with aspiration pneumonia.
We therefore sought to investigate whether hyponatremia of all etiologies (all‐cause hyponatremia) was associated with mortality in elderly patients with aspiration pneumonia. Additionally, we compared the impact of hyponatremia due to SIAD, with hyponatremia of other etiologies, on mortality in this population
METHODS
Patients and Data Source
The Aspiration Pneumonia Dataset (APD) is the product of a retrospective analysis of elderly patients hospitalized with aspiration pneumonia from July 2004 to March 2007, performed by our second author (T.S.). The aim of the APD was to provide a dataset to allow for the development of a prediction rule for mortality, in elderly patients with aspiration pneumonia. All patients were hospitalized at Rakuwakai Otowa Hospital, in Kyoto, Japan, a 430‐bed community teaching hospital. Patients hospitalized with a diagnosis of aspiration pneumonia were identified, but those who required intensive care unit level care or intubation were excluded. The diagnosis of aspiration pneumonia was based on clinical evaluation, including a history of aspiration, a comorbidity associated with aspiration, symptoms or objective findings relevant to the respiratory system, and chest radiographic findings consistent with pneumonia.
From the APD dataset, we identified patients with hyponatremia at admission. After abstraction of the data, clinical charts were examined to obtain the data relevant to the etiologies of hyponatremia. The data were reviewed independently by 2 internal medicine physicians (J.M. and T.S.). Disagreements were resolved by consensus. Inter‐rater agreement was evaluated by using kappa statistics. The study was approved by the Ethics Committee of the Kyoto University Graduate School and Faculty of Medicine (project approval No. E290).
Definition of Hyponatremia and Its Causes
The definitions of hyponatremia and SIAD are given in Table 1. Hyponatremia was defined as serum sodium <135 mEq/L. Normonatremia was defined as serum sodium 135 mEq/L and 145 mEq/L, and hypernatremia was defined as serum sodium >145 mEq/L. Severity of hyponatremia was defined as mild (130 Na <135 mEq/L), moderate (125 Na <130 mEq/L), or severe (Na <125 mEq/L). Effective serum osmolality was calculated by the formula: [Effective serum osmolality (mOsm/kg H2O) = 2 Na (mEq/L) + glucose (mg/dL)/18].9 Hypotonic hyponatremia was defined as hyponatremia in the setting of effective serum osmolality <280 mOsm/kg H2O. Hypotonic hyponatremia was classified by extracellular fluid volume (ECFV) status as hypovolemic, SIAD euvolemic, non‐SIAD euvolemic or hypervolemic.11, 12
| Hypovolemic* | 1. Either of the terms volume depletion or hypovolemic documented in the admission notes. |
| 2. Clinical signs suggestive of volume depletion observed on physical examination and documented in admission notes (ie, dry oral cavity or dry skin in the axilla). | |
| 3. Volume depletion detected by biochemical or physiological examination (ie, metabolic alkalosis in arterial gas studies or collapsed inferior vena cava on echocardiography, respectively). | |
| 4. Increase in sodium concentration to within the normal range, together with decrease in blood urea nitrogen, following administration of hypotonic fluid. | |
| Euvolemic* | 1. The term euvolemic documented in admission notes. |
| 2. Criteria for hypovolemic and hypervolemic hyponatremia not met. | |
| Hypervolemic* | 1. The terms hypervolemic or an excess of ECFV documented in admission notes. |
| 2. Clinical signs suggestive of an excess of ECFV observed on physical examination and documented in admission notes (ie, edema or jugular venous distension). | |
| 3. Excess of ECFV detected by physiological examination (ie, dilated inferior vena cava on echocardiography). | |
| SIAD | Euvolemic hyponatremia with the following findings: |
| Urinary sodium concentration >30 mEq/L; | |
| Urinary osmolality >100 mOsm/kg H2O; | |
| Normal thyroid, adrenal, and renal function. | |
Clinical Outcomes
The primary outcome of analysis was defined as mortality within 30 days of admission (30‐day mortality). The secondary outcome was defined as mortality during the hospital stay (in‐hospital mortality).
Statistical Methods
First, for the subsequent analyses, we used a cohort from which hypernatremia and non‐hypotonic hyponatremia patients were excluded. Multivariate logistic regression was used to evaluate the impacts of hyponatremia and SIAD on the outcomes of interest. The following baseline risk factors associated with the severity of pneumonia in previous studies were considered for inclusion in the multivariate model1315: age, gender, living in a care facility, use of a feeding tube, disorientation, systolic blood pressure <90 mmHg or diastolic blood pressure <60 mmHg, heart rate >125 beats/min, body temperature <35C or >40C, respiratory failure (defined as oxygen saturation 90% or partial pressure of oxygen 60 mmHg or respiratory rate >30 breaths/min), blood glucose >250 mg/dL, anemia (defined as hematocrit <30%), blood urea nitrogen (BUN) >20 mg/dL, serum C‐reactive protein >10 mg/dL, serum albumin <3 g/dL, congestive heart failure, diabetes mellitus, chronic respiratory disease, malignancy, cirrhosis, chronic kidney failure, and central nervous system disease. The severity of pneumonia was evaluated by using the 6‐point scale of the A‐DROP (Age, Dehydration, Respiratory failure, Orientation disturbance, and low blood Pressure) scoring system proposed by the Japanese Respiratory Society.15 This is a modified version of the CURB‐65 (Confusion, Uremia, Respiratory rate, BP, age 65 years) clinical prediction rule and assesses the following parameters: age (men 70 years; women 75 years), dehydration (BUN concentration 21 mg/dL), respiratory failure (oxygen saturation 90%, partial pressure of oxygen 60 mmHg, ratio of partial pressure of oxygen to fraction of inspired oxygen 300), orientation disturbance (defined as disorientation at admission), and systolic blood pressure <90 mmHg. Patients with scores of 0 or 1 were classified as mild, patients scoring 2 as moderate, and patients scoring 3 to 5 as severe. In univariate analyses, the chi‐squared test was used. Those variables with P < 0.2 in the univariate analyses were included in the multivariate analyses. The HosmerLemeshow test was used to assess the goodness‐of‐fit for multivariate logistic regression models. Data were analyzed with STATA 10 (StataCorp, College Station, TX). Two‐tailed P values <0.05 were considered statistically significant.
RESULTS
The baseline characteristics of the study population are listed in Table 2. There were 221 elderly patients identified as having aspiration pneumonia. Of those, 65 (29%) had hyponatremia; 3 (5%) with non‐hypotonic and 62 (95%) with hypotonic hyponatremia. In the latter group, patients were characterized has having hypovolemic (39 [63%]), hypervolemic (3 [5%]), and euvolemic (20 [32%]) hyponatremia. Among the euvolemic patients, SIAD occurred in 14 (70%) of patients. Non‐SIAD euvolemic hyponatremia occurred in 6 (30%) patients and was associated with hypothyroidism (1 patient), adrenal insufficiency (1 patient), and was unclassifiable due to lack of available clinical data in 4 patients. The kappa value was 0.87 for inter‐rater agreement of the classification of hypotonic hyponatremia.
| |
| Age (yr) | 84 8.6* |
| Male | 90 (41) |
| Living in care facilities | 143 (65) |
| Use of a feeding tube | 40 (18) |
| Comorbidity | |
| Congestive heart failure | 21 (10) |
| Diabetes mellitus | 33 (15) |
| Chronic respiratory disease | 31 (14) |
| Malignancy | 14 (6) |
| Liver cirrhosis | 13 (6) |
| Chronic renal failure | 23 (10) |
| Central nervous system disease | 194 (88) |
| Disorientation | 36 (16) |
| Systolic blood pressure (mmHg) | 131 28* |
| Heart rate (beats/min) | 92 20* |
| Body temperature (C) | 37.5 1.1* |
| Respiratory rate (breaths/min) | 24 (IQR, 2030) |
| Oxygen saturation (%) | 95 (IQR, 9197) |
| pH | 7.44 (IQR, 7.407.47) |
| Glucose (mg/dL) | 140 57* |
| Hematocrit (%) | 34.7 5.9* |
| Blood urea nitrogen (mg/dL) | 22.7 15* |
| C‐reactive protein (mg/dL) | 5.2 (IQR, 1.811.7) |
| Albumin (g/dL) | 3.3 0.60* |
| A‐DROP severity class | |
| Mild (score, 0 or 1) | 83 (38) |
| Moderate (score, 2) | 84 (38) |
| Severe (score, 35) | 54 (24) |
| Sodium (mEq/L) | 137 6.98* |
| Sodium range (mEq/L) | 101162 |
| Distribution and classification of sodium concentration (mEq/L) | |
| Hypernatremia: Na >145 | 16 (7) |
| Normonatremia: 135 Na 145 | 140 (64) |
| Hyponatremia: Na <135 | 65 (29) |
| Mild: 130 Na <135 | 44 (20) |
| Moderate: 125 Na <130 | 11 (5) |
| Severe: Na <125 | 10 (4) |
| Length of stay (days) | 34.6 39* |
| 30‐day mortality | 28 (13) |
| LOS in these patients (days) | 14.7 9.6 |
| In‐hospital mortality | 63 (29) |
| LOS in these patients (days) | 41.9 33.8* |
The following variables were included in multivariate logistic analyses: congestive heart failure, cirrhosis, chronic renal failure, disorientation, body temperature <35C or >40C, anemia, and serum albumin <3 g/dL (see Supporting Information, Appendix, in the online version of this article).
In the multivariate logistic analyses, all‐cause hyponatremia was not associated with increased 30‐day mortality (odds ratio [OR] 1.85, 95% confidence interval [CI] 0.635.48; P = 0.262), but was associated with a trend toward increased risk of in‐hospital mortality (OR 2.10, 95% CI 1.004.42; P = 0.050) (Table 3). Moderate and severe hyponatremia were both significantly associated with increased in‐hospital mortality (OR 6.05, 95% CI 1.4625.0; P = 0.013 and OR 5.65, 95% CI 1.1428.1; P = 0.034, respectively). The same trends were observed for 30‐day mortality, although the results were not statistically significant. No such trend was observed for mild hyponatremia.
| Normonatremia | Hypotonic Hyponatremia | ||||
|---|---|---|---|---|---|
| All‐Cause | Mild | Moderate | Severe | ||
| n = 140 | n = 62 | n = 42 | n = 10 | n = 10 | |
| |||||
| 30‐day mortality, n (%) | 11 (8) | 11 (17) | 4 (10) | 2 (18) | 4 (60) |
| Odds ratio (95% CI) | 1 (ref) | 1.85 (0.635.48) | 1.30 (0.354.82) | 3.15 (0.5019.9) | 3.44 (0.5719.3) |
| P value | P = 0.262 | P = 0.691 | P = 0.222 | P = 0.184 | |
| In‐hospital mortality, n (%) | 28 (20) | 25 (39) | 10 (24) | 6 (55) | 7 (70) |
| Odds ratio (95% CI) | 1 (ref) | 2.10 (1.004.42) | 1.26 (0.523.07) | 6.05 (1.4625.0) | 5.65 (1.1428.1) |
| P value | P = 0.050 | P = 0.606 | P = 0.013 | P = 0.034 | |
In the multivariate logistic regression analyses, hypotonic hyponatremia due to SIAD was significantly associated with both increased risk of 30‐day mortality (OR 7.40, 95% CI 1.7331.7; P = 0.007) and increased risk of in‐hospital mortality (OR 22.3, 95% CI 4.26117; P < 0.001) (Table 4). In contrast, hypovolemic or non‐SIAD euvolemic hyponatremia was associated with neither increased risk of 30‐day mortality nor increased risk of in‐hospital mortality. There were too few hypervolemic hyponatremia patients for us to perform effective logistic analyses. The P values of the HosmerLemeshow tests were 0.45 for the multivariate logistic regression model (hypovolemic, SIAD, and non‐SIAD euvolemic vs normonatremia) with 30‐day mortality, and 0.30 for the model with in‐hospital mortality.
| Normonatremia | Hypotonic Hyponatremia | ||||
|---|---|---|---|---|---|
| Hypovolemic | Euvolemic | Hypervolemic | |||
| SIAD | non‐SIAD* | ||||
| n = 140 | n = 39 | n = 14 | n = 6 | n = 3 | |
| |||||
| 30‐day mortality, n (%) | 11 (8) | 2 (5) | 6 (43) | 1 (17) | 1 (33) |
| Odds ratio (95% CI) | 1 (ref) | 0.58 (0.113.10) | 7.40 (1.7331.7) | 2.71 (0.2430.6) | |
| P value | P = 0.525 | P = 0.007 | P = 0.421 | ||
| In‐hospital mortality, n (%) | 28 (20) | 7 (18) | 12 (86) | 1 (17) | 3 (100) |
| Odds ratio (95% CI) | 1 (ref) | 0.85 (0.322.30) | 22.3 (4.26117) | 0.93 (0.108.98) | |
| P value | P = 0.751 | P < 0.001 | P = 0.948 | ||
Six patients with SIAD were classified as having an A‐DROP severity class of mild, 4 as moderate, and 4 as severe (P = 0.908, Wilcoxon‐type test for trend). There was no association between the occurrence of SIAD and the severity of pneumonia.
DISCUSSION
We demonstrated that mortality in elderly patients with aspiration pneumonia was significantly associated with SIAD, but not with all‐cause hyponatremia. Unlike SIAD, other etiologies of hyponatremia were not associated with mortality in elderly patients with aspiration pneumonia. A recent study by Waikar and colleagues concluded that hyponatremia subgrouped by severity was not significantly associated with in‐hospital mortality in pneumonia patients, although a trend between severe hyponatremia and mortality was observed.16 Likewise, a study by Zilberberg and colleagues reported no significant increased risk of death with hyponatremia compared with normonatremia.4 These results are similar to our results for all‐cause hyponatremia and for hyponatremia subgrouped by severity. In contrast, a study by Nair and colleagues reported some increased risk of death with hyponatremia.5 Our results suggest that the heterogeneity of these previous results was probably due to the fact that SIAD was not identified in these other studies.
While the rationale for increased mortality in patients with pneumonia associated with SIAD is not known, it may be that there is a direct deleterious effect of elevated AVP. AVP has 3 distinct receptor subtypes, V1A, V1B, and V2. Stimulation of the V1A receptor in vascular smooth muscle promotes an increase in systemic vascular resistance, and stimulation of the same receptor in cardiac myocytes promotes myocyte hypertrophy. Stimulation of the V1B receptor in the anterior pituitary promotes adrenocorticotropic hormone release, and stimulation of the V2 receptor in the renal collecting ducts promotes an increase in water retention, which plays the main role in SIAD.1719 Our hypothesis in elderly SIAD patients with aspiration pneumonia is that increased AVP levels may lead not only to water retention and hyponatremia, but also to other effects such as vasoconstriction and myocyte hypertrophy, which may adversely influence the cardiovascular systems of elderly patients (Figure 1).
In our study, SIAD in elderly patients with aspiration pneumonia was more strongly associated with in‐hospital mortality than with 30‐day mortality. The average length of stay (LOS) of all patients dying in hospital (42 days) was significantly longer than the average LOS of those dying within 30 days of admission (15 days; P < 0.001, MannWhitney Test; Table 2). These findings suggest that SIAD was associated more strongly with longer‐term mortality than with acute‐stage mortality. The reason for the association between SIAD and longer‐term mortality remains unclear, although there may be some association between longer‐term mortality and the pathophysiologic mechanisms of AVP.
Our study has some limitations. First, because of the retrospective observational design, there is a potential for bias. We used multivariate analyses adjusted for confounding factors, however, other residual confounding factors may have remained. In addition, since the diagnosis of pneumonia was based on chart review, there may have been imprecision in the accuracy of diagnosing aspiration pneumonia. Aspiration pneumonia sometimes occurs without apparent episodes of aspiration, and this would have led to underdiagnosis. In contrast, aspiration pneumonitis can be mistaken for aspiration pneumonia; this would have led to overdiagnosis.
Second, volume status is difficult to evaluate prospectively, and thus by nature of our design, appropriate assignment of volume status was difficult. Several studies have used test infusions of isotonic saline to discriminate between these alternatives, but because our study was retrospective, we were unable to use this test.11, 20 Some studies have reported that, in patients in a state of volume depletion, volume repletion removes the stimulus for antidiuretic hormone release, allowing excess water to be excreted in a dilute urine and the serum sodium concentration to return toward normal.21, 22 According to this theory, instead of using an isotonic test infusion, we added in our study a criterion of volume depletion in which patients with a sustained increase in serum sodium concentration of 5 mEq/L and a sustained decrease in blood urea nitrogen, even with administration of hypotonic solution, were classified as volume depleted.
Third, all patients were analyzed according to status on admission, although some patients with hypovolemic hyponatremia at admission were found to have hyponatremia due to SIAD after admission.
Fourth, because the sample size of this study was small with our results revealing wide confidence intervals, an effect between other causes of hyponatremia and mortality might not have been identified. However, for 80% power, the calculated sample size was 100 non‐SIAD patients with aspiration pneumonia versus 10 SIAD patients, given that the mortality rate of elderly patients with aspiration pneumonia was, at a moderate estimate, 15% according to the studies of both Stukenborg and colleagues and Oliver and colleagues, and the mortality rate of SIAD patients was increased by 400% compared with that of non‐SIAD patients according to the study of Song and colleagues, with an alpha error of 0.05.7, 23, 24 Our sample size was therefore greater than the required size.
Fifth, because the APD dataset was compiled in 2007 for another study, it was not concurrent, and this may have led to other limitations in interpreting the data.
Finally, in Japan, the average length of hospital stay was 36.3 days in 2004 and 34.1 days in 2007much longer than other developed countries.25 Because of this situation, in‐hospital mortality, and not 30‐day mortality, represented long‐term mortality. Therefore, our results may not be easily applicable to the situation in other developed countries.
In conclusion, our results suggest that the presence of SIAD on admission in elderly patients with aspiration pneumonia is associated with increased mortality. This novel finding should be re‐evaluated, but it does raise the question of a direct, negative impact of AVP on patients' clinical outcomes. In the future, a larger prospective cohort study should be conducted to confirm the findings of this study, given the small sample size and the retrospective nature of the study. Additionally, a different population of pneumonia patients, such as those with community‐acquired pneumonia, should be examined to further evaluate the etiologies of hyponatremia in pneumonia and the association between hyponatremia of these different etiologies and mortality.
Acknowledgements
Disclosures: Jun Miyashita and Toshihiko Shimada report receiving a grant‐in‐aid from the Ministry of Health, Labour and Welfare of Japan, Development of Clinical Research Fellowship (Principal Investigator, Shunichi Fukuhara), grant H18‐001. No other potential conflict of interest relevant to this article was reported.
- ,.Aspiration pneumonia and dysphagia in the elderly.Chest.2003;124(1):328–336.
- ,.Hyponatraemia in the elderly.Age Ageing.1983;12(1):77–80.
- ,.Frequency and significance of electrolyte abnormalities in pneumonia.Indian Pediatr.1992;29(6):735–740.
- ,,, et al.Hyponatremia and hospital outcomes among patients with pneumonia: a retrospective cohort study.BMC Pulm Med.2008;8(2):16.
- ,,,.Hyponatremia in community‐acquired pneumonia.Am J Nephrol.2007;27(2):184–190.
- ,,,.Hyponatremia in pediatric community‐acquired pneumonia.Pediatr Nephrol.2008;23(12):2247–2253.
- ,,, et al.Epidemiology and clinical outcomes of community‐acquired pneumonia in adult patients in Asian countries: a prospective study by the Asian network for surveillance of resistant pathogens.Int J Antimicrob Agents.2008;31(2):107–114.
- ,.The syndrome of inappropriate secretion of antidiuretic hormone.Am J Med.1967;42(5):790–806.
- ,.Clinical practice. The syndrome of inappropriate antidiuresis.N Engl J Med.2007;356(20):2064–2072.
- ,,.Hyponatraemia and the inappropriate ADH syndrome in pneumonia.Ann Trop Paediatr.1992;12(4):455–462.
- ,,, et al.Value of fractional uric acid excretion in differential diagnosis of hyponatremic patients on diuretics.J Clin Endocrinol Metab.2008;93(8):2991–2997.
- ,.The syndrome of inappropriate antidiuretic hormone: prevalence, causes and consequences.Eur J Endocrinol.2010;162(suppl 1):S5–S12.
- ,,, et al.A prediction rule to identify low‐risk patients with community‐acquired pneumonia.N Engl J Med.1997;336(4):243–250.
- ,,, et al.Defining community acquired pneumonia severity on presentation to hospital: an international derivation and validation study.Thorax.2003;58(5):377–382.
- ,,, et al.Comparison of severity scoring systems A‐DROP and CURB‐65 for community‐acquired pneumonia.Respirology.2008;13(5):731–735.
- ,,.Mortality after hospitalization with mild, moderate, and severe hyponatremia.Am J Med.2009;122(9):857–865.
- .The role of vasopressin in congestive heart failure.Cleve Clin J Med.2006;73(suppl 3):S19–S23.
- .Vasopressin antagonists—progress and promise.N Engl J Med.2006;355(20):2146–2148.
- ,,, et al.A novel vasopressin dual V1A/V2 receptor antagonist, conivaptan hydrochloride, improves hyponatremia in rats with syndrome of inappropriate secretion of antidiuretic hormone (SIADH).Biol Pharm Bull.2007;30(1):91–95.
- ,.Clinical laboratory evaluation of the syndrome of inappropriate secretion of antidiuretic hormone.Clin J Am Soc Nephrol.2008;3(4):1175–1184.
- ,,,,,.Danger of central pontine myelinolysis in hypotonic dehydration and recommendation for treatment.Am J Med Sci.1989;298(1):41–43.
- ,.Treatment of hyponatremia: a quantitative analysis.Am J Kidney Dis.1993;21(4):439–443.
- ,,, et al.Hospital discharge abstract data on comorbidity improved the prediction of death among patients hospitalized with aspiration pneumonia.J Clin Epidemiol.2004;57(5):522–532.
- ,,, et al.Comorbid disease and the effect of race and ethnicity on in‐hospital mortality from aspiration pneumonia.J Natl Med Assoc.2004;96(11):1462–1469.
- Ministry of Health, Labour and Welfare, Japan. Health Statistics in Japan 2007. Available at: http://www.mhlw.go.jp/english/database/db‐hss/hs2007.html. Accessed August 18,2010.
- ,.Aspiration pneumonia and dysphagia in the elderly.Chest.2003;124(1):328–336.
- ,.Hyponatraemia in the elderly.Age Ageing.1983;12(1):77–80.
- ,.Frequency and significance of electrolyte abnormalities in pneumonia.Indian Pediatr.1992;29(6):735–740.
- ,,, et al.Hyponatremia and hospital outcomes among patients with pneumonia: a retrospective cohort study.BMC Pulm Med.2008;8(2):16.
- ,,,.Hyponatremia in community‐acquired pneumonia.Am J Nephrol.2007;27(2):184–190.
- ,,,.Hyponatremia in pediatric community‐acquired pneumonia.Pediatr Nephrol.2008;23(12):2247–2253.
- ,,, et al.Epidemiology and clinical outcomes of community‐acquired pneumonia in adult patients in Asian countries: a prospective study by the Asian network for surveillance of resistant pathogens.Int J Antimicrob Agents.2008;31(2):107–114.
- ,.The syndrome of inappropriate secretion of antidiuretic hormone.Am J Med.1967;42(5):790–806.
- ,.Clinical practice. The syndrome of inappropriate antidiuresis.N Engl J Med.2007;356(20):2064–2072.
- ,,.Hyponatraemia and the inappropriate ADH syndrome in pneumonia.Ann Trop Paediatr.1992;12(4):455–462.
- ,,, et al.Value of fractional uric acid excretion in differential diagnosis of hyponatremic patients on diuretics.J Clin Endocrinol Metab.2008;93(8):2991–2997.
- ,.The syndrome of inappropriate antidiuretic hormone: prevalence, causes and consequences.Eur J Endocrinol.2010;162(suppl 1):S5–S12.
- ,,, et al.A prediction rule to identify low‐risk patients with community‐acquired pneumonia.N Engl J Med.1997;336(4):243–250.
- ,,, et al.Defining community acquired pneumonia severity on presentation to hospital: an international derivation and validation study.Thorax.2003;58(5):377–382.
- ,,, et al.Comparison of severity scoring systems A‐DROP and CURB‐65 for community‐acquired pneumonia.Respirology.2008;13(5):731–735.
- ,,.Mortality after hospitalization with mild, moderate, and severe hyponatremia.Am J Med.2009;122(9):857–865.
- .The role of vasopressin in congestive heart failure.Cleve Clin J Med.2006;73(suppl 3):S19–S23.
- .Vasopressin antagonists—progress and promise.N Engl J Med.2006;355(20):2146–2148.
- ,,, et al.A novel vasopressin dual V1A/V2 receptor antagonist, conivaptan hydrochloride, improves hyponatremia in rats with syndrome of inappropriate secretion of antidiuretic hormone (SIADH).Biol Pharm Bull.2007;30(1):91–95.
- ,.Clinical laboratory evaluation of the syndrome of inappropriate secretion of antidiuretic hormone.Clin J Am Soc Nephrol.2008;3(4):1175–1184.
- ,,,,,.Danger of central pontine myelinolysis in hypotonic dehydration and recommendation for treatment.Am J Med Sci.1989;298(1):41–43.
- ,.Treatment of hyponatremia: a quantitative analysis.Am J Kidney Dis.1993;21(4):439–443.
- ,,, et al.Hospital discharge abstract data on comorbidity improved the prediction of death among patients hospitalized with aspiration pneumonia.J Clin Epidemiol.2004;57(5):522–532.
- ,,, et al.Comorbid disease and the effect of race and ethnicity on in‐hospital mortality from aspiration pneumonia.J Natl Med Assoc.2004;96(11):1462–1469.
- Ministry of Health, Labour and Welfare, Japan. Health Statistics in Japan 2007. Available at: http://www.mhlw.go.jp/english/database/db‐hss/hs2007.html. Accessed August 18,2010.
Copyright © 2012 Society of Hospital Medicine
LMW vs UF Heparin
Venous thromboembolism (VTE) is a major source of morbidity and mortality for hospitalized patients, with as many as 16% of high‐risk medical patients developing VTE during their hospital stay.1, 2 Pharmacologic prophylaxis with subcutaneous heparin reduces the risk of VTE by approximately 50%,3, 4 and guidelines produced by the American College of Chest Physicians (ACCP) recommend thromboprophylaxis for patients at moderate‐to‐high risk of VTE with either low‐molecular‐weight heparin (LMWH) or unfractionated heparin (UFH).2 UFH is less expensive per dose, but meta‐analyses have suggested that UFH may be either less effective than LMWH3 or more likely to cause complications, such as bleeding5 or heparin‐induced thrombocytopenia (HIT).6 Others have argued that the efficacy and risk of bleeding with UFH and LMWH are similar.7, 8 In either case, there are few head‐to‐head studies of LMWH and UFH in medical patients and they tend to be small. In the most recent meta‐analysis, which included fewer than 4500 patients, several different low‐molecular‐weight heparins were assessed together, and the observed rate of deep vein thrombosis (DVT) with UFH was high (5.4%), with evidence suggesting publication bias.3
Given the current Joint Commission requirement9 that all medical patients either receive VTE prophylaxis or have documented a reason not to, the implications related to choosing one form of VTE prophylaxis over another are substantial on a national scale. In order to compare the effectiveness of UFH and LMWH in routine practice among hospitalized medical patients, we conducted a retrospective cohort study in a national sample of hospitals and compared the risk of VTE, bleeding, HIT, and death associated with each treatment.
METHODS
Setting and Patients
We conducted a retrospective cohort study of patients discharged between January 1, 2004 and June 30, 2005 from 333 acute care facilities in the United States that participated in Premier's Perspective, a database we have described previously.10 Compared to US hospitals as a whole, Perspective hospitals are more likely to be located in the South and in urban areas. Perspective contains the following data elements: sociodemographic information, International Classification of Diseases, Ninth Revision, Clinical Modification (ICD‐9‐CM) diagnosis and procedure codes, as well as a list of all billed items with a date of service, including diagnostic tests, medications, and other treatments. Hospitals' characteristics include size, region, setting, and teaching status. The Institutional Review Board at Baystate Medical Center granted permission to conduct the study (#132280‐1).
We included general medical patients aged 18 years whose ICD‐9‐CM primary diagnosis code (congestive heart failure, stroke, pneumonia, and urinary tract infection) placed them at moderate‐to‐high risk of VTE according to the ACCP recommendations,2 and who received daily prophylactic dosages of either LMWH (40 mg daily) or UFH (10,00015,000 units daily) initiated by hospital day 2 and continued to discharge or until the patient developed a VTE or a complication attributable to heparin. Patients were included so long as they missed no more than 1 day of prophylaxis or had no more than 1 unusual dose recorded. Patients who switched between heparin types were included and analyzed according to their initial therapy. Patients who received any other regimen were excluded. We also excluded patients who received warfarin on hospital day 1 or 2, because they would not be considered candidates for heparin prophylaxis, and patients whose length of stay was 2 days, because the value of VTE prophylaxis in such cases is unknown.
Data Elements
For each patient, we extracted age, gender, race, and insurance status, principal diagnosis, comorbidities, and specialty of the attending physician. Comorbidities were identified from ICD‐9‐CM secondary diagnosis codes and Diagnosis Related Groups using Healthcare Cost and Utilization Project Comorbidity Software, version 3.1, based on the work of Elixhauser and colleagues.11 We also identified additional risk factors for VTE using a combination of ICD‐9‐CM codes and specific charges. These included cancer, chemotherapy/radiation, prior VTE, use of estrogens and estrogen modulators, inflammatory bowel disease, nephrotic syndrome, myeloproliferative disorders, smoking, central venous catheter, inherited or acquired thrombophilia, mechanical ventilation, urinary catheter, decubitus ulcer, 3‐hydroxy‐3‐methylglutaryl coenzyme A (HMG‐CoA) reductase inhibitors, restraints, and varicose veins. Hospitals were categorized by region (Northeast, South, Midwest, or West), bed size, setting (urban vs rural), and teaching status.
Outcome Variables
We defined hospital‐acquired VTE as a secondary diagnosis of VTE (ICD‐9‐CM diagnoses 453.4, 453.40, 453.41, 453.42, 453.8, 453.9, 415.1, 415.11, 415.19), combined with a diagnostic test for VTE (lower extremity ultrasound, venography, computed tomography (CT) angiogram, ventilation‐perfusion scan, or pulmonary angiogram) after hospital day 2, followed by treatment for VTE (intravenous unfractionated heparin, >60 mg of enoxaparin, 7500 mg of dalteparin, or placement of an inferior vena cava filter) for at least 50% of the remaining hospital days or until initiation of warfarin or appearance of a complication (eg, transfusion or treatment for heparin‐induced thrombocytopenia). We chose this definition to differentiate hospital‐acquired VTE from VTE present on admission.12 In addition, patients who were readmitted within 30 days of discharge with a primary diagnosis of VTE were also considered to have hospital‐acquired VTE.
We also assessed complications of VTE prophylaxis. Major bleeding was defined as the receipt of 2 or more units of packed red blood cells on a single day or a secondary diagnosis of intracranial bleeding. Because there was no ICD‐9‐CM code for HIT, we assessed codes for all thrombocytopenia, as well as secondary thrombocytopenia. Definite HIT was defined as an ICD‐9‐CM code for thrombocytopenia, together with discontinuation of heparin and initiation of treatment with argatroban. A definite complication was defined as HIT or evidence of major bleeding coupled with discontinuation of heparin. Finally, we evaluated all‐cause in‐hospital mortality and total hospital costs.
Statistical Analysis
We computed summary statistics using frequencies and percents for categorical variables, and means, medians, and standard deviations and interquartile range for continuous variables. Associations of prophylaxis type with patient and hospital characteristics and outcomes were assessed using chi‐square tests or Fisher's exact test for categorical variables, and z‐tests or Wilcoxon tests for continuous variables.
We developed a propensity model for treatment with UFH as the outcome; the model included patient characteristics, early treatments, comorbidities, risk factors for VTE, physician specialty, and selected interaction terms. We then developed a series of multivariable models to evaluate the impact of heparin choice on the risk of VTE, complications of treatment, mortality, and total cost. Generalized estimating equation models with a logit link were used to assess the association between the choice of heparin and the risk of VTE, and of complications and mortality, while adjusting for the effects of within‐hospital correlation; identity link models were used for analyses of cost. Costs were trimmed at 3 standard deviations above the mean, and natural log‐transformed values were modeled due to extreme positive skew.
Unadjusted and covariate‐adjusted models were evaluated with and without adjustments for propensity score. In addition, since the hospital was the single strongest predictor of treatment, we developed grouped treatment models, in which a patient's actual treatment was replaced by a probability equal to the proportion of prophylaxed patients receiving UFH at that hospital. This adaptation of instrumental variable analysis uses the hospital as the instrument, and attempts to assess whether patients treated at a hospital which uses UFH more frequently have outcomes that differ from those of patients treated at hospitals which use LMWH more frequently, while adjusting for other patient, physician, and hospital variables. By relying on treatment at the hospital level, this method reduces the opportunity for selection bias at the patient level.
Finally, in order to exclude the possibility that our surrogate bleeding outcome was due to transfusion practices at hospitals that use a particular form of heparin, we compared the hospital rates of transfusion of 2 or more units of packed red cells to the hospital rates of prophylaxis with UFH in a larger dataset of the same hospitals. This set included patients with congestive heart failure, stroke, pneumonia, and urinary tract infection who did not receive daily prophylaxis, as well as patients admitted for chronic obstructive pulmonary disease (COPD) or acute myocardial infarction, and patients who received either warfarin or a treatment dose of heparin in the first 2 hospital days. We also compared the transfusion rates at hospitals that used unfractionated heparin in 80% of patients to hospitals that used LMWH in 80%. All analyses were performed using SAS version 9.1 (SAS Institute Inc, Cary, NC).
RESULTS
Our final sample included 32,104 patients who received prophylaxis at 333 hospitals (see Supporting Information, e‐Figure, in the online version of this article). Patient characteristics appear in Table 1. Most patients (66%) were over age 65; 59% were female and 61% were white. The most common primary diagnoses were pneumonia (40%) and congestive heart failure (25%). Additional risk factors for thromboembolism included cancer (13%), paralysis (8%), or diabetes (35%). Most patients' attending physicians were either internists (61%) or family practitioners (14%). Almost half of the patients were cared for at hospitals in the South (46%).
| Total | UFH | LMWH | ||
|---|---|---|---|---|
| 32,104 (100) | 14,591 (45.4) | 17,513 (54.6) | ||
| N (%) | N (%) | N (%) | P | |
| ||||
| Demographics | ||||
| Age | 0.0002 | |||
| 1849 | 4,061 (12.7) | 1,950 (13.4) | 2,111 (12.1) | |
| 5064 | 6,962 (21.7) | 3,225 (22.1) | 3,737 (21.3) | |
| 6579 | 10,909 (34.0) | 4,921 (33.7) | 5,988 (34.2) | |
| 80+ | 10,172 (31.7) | 4,495 (30.8) | 5,677 (32.4) | |
| Sex | 0.0071 | |||
| Male | 13,234 (41.2) | 6,133 (42.0) | 7,101 (40.5) | |
| Female | 18,870 (58.8) | 8,458 (58.0) | 10,412 (59.5) | |
| Race/ethnicity | <0.0001 | |||
| White | 19,489 (60.7) | 8,063 (55.3) | 11,426 (65.2) | |
| Black | 7,429 (23.1) | 4,101 (28.1) | 3,328 (19.0) | |
| Hispanic | 1,304 (4.1) | 591 (4.1) | 713 (4.1) | |
| Other | 3,882 (12.1) | 1,836 (12.6) | 2,046 (11.7) | |
| Primary diagnosis | <0.0001 | |||
| Pneumonia | 12,768 (39.8) | 5,354 (36.7) | 7,414 (42.3) | |
| Sepsis* | 1,217 (3.8) | 562 (3.9) | 655 (3.7) | |
| Respiratory failure* | 2,017 (6.3) | 814 (5.6) | 1,203 (6.9) | |
| Heart failure | 8,157 (25.4) | 3,825 (26.2) | 4,332 (24.7) | |
| Stroke | 4,416 (13.8) | 2,295 (15.7) | 2,121 (12.1) | |
| Urinary tract infection | 3,529 (11.0) | 1,741 (11.9) | 1,788 (10.2) | |
| Attending specialty | <0.0001 | |||
| Internist | 19,511 (60.8) | 8,945 (61.3) | 10,566 (60.3) | |
| General practice/Family medicine | 4,326 (13.5) | 1,964 (13.5) | 2,362 (13.5) | |
| Cardiologist | 1,606 (5.0) | 730 (5.0) | 876 (5.0) | |
| Pulmonologist | 2,179 (6.8) | 854 (5.9) | 1,325 (7.6) | |
| Nephrology | 583 (1.8) | 380 (2.6) | 203 (1.2) | |
| Critical care/Intensivist | 150 (0.5) | 93 (0.6) | 57 (0.3) | |
| Other | 3,749 (11.7) | 1,625 (11.1) | 2,124 (12.1) | |
| Insurance | <0.0001 | |||
| Medicare traditional | 20,281 (63.2) | 8,929 (61.2) | 11,352 (64.8) | |
| Medicare managed care | 1,737 (5.4) | 826 (5.7) | 911 (5.2) | |
| Medicaid | 2,629 (8.2) | 1,401 (9.6) | 1,228 (7.0) | |
| Private | 5,967 (18.6) | 2,830 (19.4) | 3,137 (17.9) | |
| Self‐pay/uninsured/other | 1,490 (4.6) | 605 (4.1) | 885 (5.1) | |
| Risk factors for VTE | ||||
| Admit from skilled nursing facility | 476 (1.5) | 277 (1.9) | 199 (1.1) | <0.0001 |
| Paralysis | 2,608 (8.1) | 1,317 (9.0) | 1,291 (7.4) | <0.0001 |
| Restraints | 417 (1.3) | 147 (1.0) | 270 (1.5) | <0.0001 |
| Decubitus ulcer | 1,190 (3.7) | 631 (4.3) | 559 (3.2) | <0.0001 |
| Cancer | 4,154 (12.9) | 1,858 (12.7) | 2,296 (13.1) | 0.3171 |
| Chemotherapy | 86 (0.3) | 41 (0.3) | 45 (0.3) | 0.6781 |
| Prior venous thromboembolism | 494 (1.5) | 202 (1.4) | 292 (1.7) | 0.0403 |
| Pregnancy | 1 (0) | 1 (0) | 0 (0) | 0.2733 |
| Estrogens | 438 (1.4) | 143 (1.0) | 295 (1.7) | <0.0001 |
| Estrogen modulators | 246 (0.8) | 80 (0.5) | 166 (0.9) | <0.0001 |
| Congestive heart failure | 3,107 (9.7) | 1,438 (9.9) | 1,669 (9.5) | 0.3263 |
| Respiratory failure | 2,210 (6.9) | 1,037 (7.1) | 1,173 (6.7) | 0.1493 |
| Inflammatory bowel disease | 108 (0.3) | 41 (0.3) | 67 (0.4) | 0.1176 |
| Nephrotic syndrome | 92 (0.3) | 50 (0.3) | 42 (0.2) | 0.0860 |
| Myeloproliferative disorder | 198 (0.6) | 68 (0.5) | 130 (0.7) | 0.0016 |
| Obesity | 2,973 (9.3) | 1,211 (8.3) | 1,762 (10.1) | <0.0001 |
| Smoking | 4,476 (13.9) | 1,887 (12.9) | 2,589 (14.8) | <0.0001 |
| Varicose veins | 19 (0.1) | 6 (0) | 13 (0.1) | 0.2245 |
| Central line | 1,070 (3.3) | 502 (3.4) | 568 (3.2) | 0.3271 |
| Inherited or acquired thrombophilia | 16 (0) | 9 (0.1) | 7 (0) | 0.3855 |
| Diabetes | 11,136 (34.7) | 5,157 (35.3) | 5,979 (34.1) | 0.0241 |
| Procedures associated with VTE or bleed | ||||
| Mechanical ventilation | 2,282 (7.1) | 1,111 (7.6) | 1,171 (6.7) | 0.0013 |
| Urinary catheter | 4,496 (14.0) | 1,545 (10.6) | 2,951 (16.9) | <0.0001 |
| Aspirin | 12,865 (40.1) | 6,101 (41.8) | 6,764 (38.6) | <0.0001 |
| Clopidogrel | 4,575 (14.3) | 2,087 (14.3) | 2,488 (14.2) | 0.8050 |
| Non‐steroidal anti‐inflammatory drugs | 2,147 (6.7) | 867 (5.9) | 1,280 (7.3) | <0.0001 |
| Steroids | 7,938 (24.7) | 3,136 (21.5) | 4,802 (27.4) | <0.0001 |
| Statins | 7,376 (23.0) | 3,462 (23.7) | 3,914 (22.3) | 0.0035 |
| Comorbidities | ||||
| AIDS | 124 (0.4) | 73 (0.5) | 51 (0.3) | 0.0026 |
| Alcohol abuse | 1,048 (3.3) | 523 (3.6) | 525 (3.0) | 0.0032 |
| Deficiency anemia | 7,010 (21.8) | 3,228 (22.1) | 3,782 (21.6) | 0.2543 |
| Rheumatoid arthritis/collagen vas | 967 (3.0) | 426 (2.9) | 541 (3.1) | 0.3762 |
| Chronic blood loss anemia | 177 (0.6) | 79 (0.5) | 98 (0.6) | 0.8269 |
| Chronic pulmonary disease | 12,418 (38.7) | 5,314 (36.4) | 7,104 (40.6) | <0.0001 |
| Depression | 3,334 (10.4) | 1433 (9.8) | 1901 (10.9) | 0.0025 |
| Drug abuse | 694 (2.2) | 412 (2.8) | 282 (1.6) | <0.0001 |
| Hypertension | 16,979 (52.9) | 7,658 (52.5) | 9,321 (53.2) | 0.1866 |
| Hypothyroidism | 4,016 (12.5) | 1,716 (11.8) | 2,300 (13.1) | 0.0002 |
| Liver disease | 453 (1.4) | 227 (1.6) | 226 (1.3) | 0.0448 |
| Other neurological disorders | 4,682 (14.6) | 2,202 (15.1) | 2,480 (14.2) | 0.0187 |
| Peripheral vascular disease | 2,134 (6.6) | 980 (6.7) | 1,154 (6.6) | 0.6490 |
| Psychoses | 1,295 (4.0) | 574 (3.9) | 721 (4.1) | 0.4066 |
| Pulmonary circulation disease | 1,034 (3.2) | 442 (3.0) | 592 (3.4) | 0.0760 |
| Renal failure | 2,794 (8.7) | 1,636 (11.2) | 1,158 (6.6) | 0.0000 |
| Peptic ulcer disease with bleeding | 563 (1.8) | 232 (1.6) | 331 (1.9) | 0.0414 |
| Valvular disease | 2,079 (6.5) | 899 (6.2) | 1,180 (6.7) | 0.0366 |
| Weight loss | 1,231 (3.8) | 556 (3.8) | 675 (3.9) | 0.8391 |
| Other prophylaxis | ||||
| Intermittent pneumatic compression | 1,003 (3.1) | 456 (3.1) | 547 (3.1) | 0.9926 |
| Mechanical prophylaxis | 1,281 (4.0) | 524 (3.6) | 757 (4.3) | 0.0009 |
Fifty‐five percent of patients received LMWH and the remainder received UFH; 1274 (4%) patients switched type of heparin during their stay. The proportion of patients receiving LMWH at an individual hospital varied from 0% to 100% with a u‐shaped distribution, with almost one‐third of hospitals prescribing one treatment or the other exclusively (Figure 1). Similarly, the proportion of an individual physician's patients who received prophylaxis with UFH (vs LMWH) varied from 0% to 100% (Figure 1), with 51% prescribing LMWH exclusively and 31% prescribing UFH exclusively. Compared to patients who received UFH, patients receiving LMWH were older and were more likely to be white, female, and to have pneumonia. By far the biggest difference between the groups was the hospitals at which they received their care (see Supporting Information, e‐Table, in the online version of this article). Patients receiving LMWH were much more likely to be from smaller, rural, non‐teaching hospitals in the South or the West. There were also numerous small differences in comorbidities and individual VTE risk factors between the 2 groups. The only large difference was that patients with a secondary diagnosis of renal failure (for which LMWH is not US Food and Drug Administration [FDA] approved) were almost twice as likely to receive UFH.
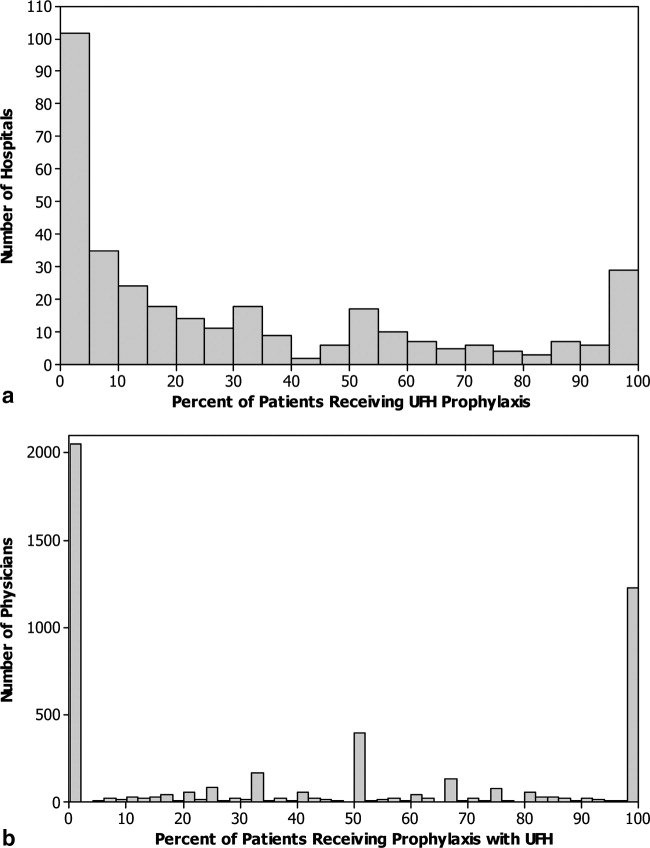
We identified 163 (0.51%) episodes of VTE (Table 2). Compared to patients receiving UFH, those receiving standard LMWH had similar unadjusted rates of VTE (0.53% vs 0.48%; P = 0.54), major bleeding (0.77% vs 0.76%; P = 0.88), thrombocytopenia (1.9% vs 2.0%; P = 0.48), definite HIT (n = 1 vs n = 3; P = 0.34), and mortality (2.8% vs 3.1%; P = 0.07). Definite complications of prophylaxis (HIT or major bleed combined with the discontinuation of heparin) were more common among patients receiving UFH (0.2% vs 0.1%; P = 0.022). Patients treated with UFH had longer unadjusted lengths of stay (P < 0.0001) and higher unadjusted costs (P < 0.0001).
| Total | UFH | LMWH | P | |
|---|---|---|---|---|
| 32,104 (100) | 14,591 (45.4) | 17,513 (54.6) | ||
| n (%) | n (%) | n (%) | ||
| ||||
| Venous thromboembolism | 163 (0.5) | 78 (0.5) | 85 (0.5) | 0.54 |
| Heparin‐induced thrombocytopenia | 4 (0) | 3 (0) | 1 (0) | 0.34* |
| Any major bleeding | 246 (0.8) | 113 (0.8) | 133 (0.8) | 0.88 |
| Transfusion with 2 units of packed red blood cells | 218 (0.7) | 97 (0.7) | 121 (0.7) | 0.78 |
| Intracranial hemorrhage | 30 (0.1) | 17 (0.1) | 13 (0.1) | 0.22 |
| Complication resulting in stopping heparin | 44 (0.1) | 28 (0.2) | 16 (0.1) | 0.02 |
| In‐hospital mortality | 944 (2.9) | 456 (3.1) | 488 (2.8) | 0.07 |
| LOS in days; mean (SD) | 6.2 (5.9) | 6.4 (6.2) | 6.0 (5.6) | <0.001 |
| Median (IQR) | 5 (37) | 5 (37) | 5 (37) | |
| Cost in USD; median (IQR) | 5873 (41718982) | 6007 (41779456) | 5774 (41658660) | <0.001 |
A propensity model for UFH treatment based upon patient characteristics and treatments was not strongly predictive of treatment (c = 0.58) and propensity matching failed to balance many of the patient characteristics. However, hospital alone, ignoring patient characteristics was strongly predictive (c = 0.91) of treatment.
In a model adjusting only for clustering within hospitals, patients treated with UFH had an odds ratio (OR) for VTE of 1.08 (95% confidence interval [CI] 0.79 to 1.49) compared to patients receiving LMWH (Figure 2). Adjustment for propensity for UFH and other covariates attenuated the effect of LMWH (OR 1.04, 95% CI 0.76 to 1.43). When individual patients were assigned a probability of treatment with UFH equal to the hospital rate where they received care, UFH use was associated with a nonsignificant change in the odds of VTE (OR 1.14, 95% CI 0.72 to 1.81).
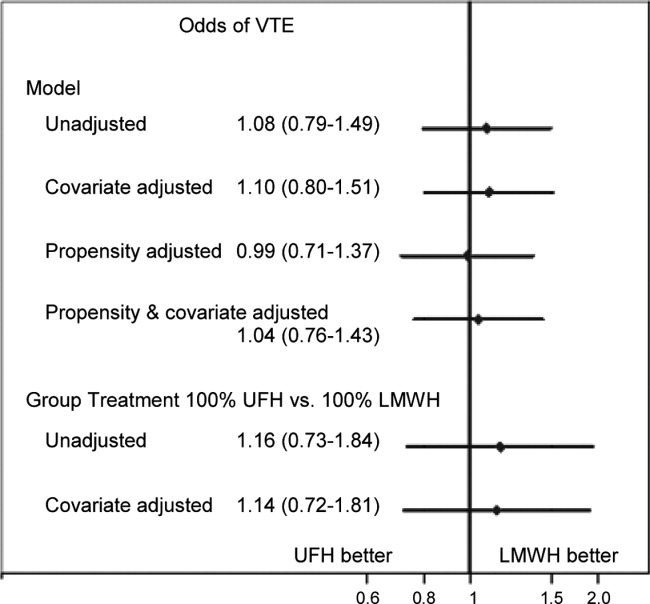
Adjusted for clustering within hospital only, patients treated with UFH had an odds ratio for major bleed of 1.38 (95% CI 1.00 to 1.91) compared to patients receiving LMWH (Figure 3). Adjustment for propensity for UFH and other covariates gave similar results (OR 1.34, 95% CI 0.97 to 1.84). When individual patients were assigned a probability of treatment with UFH equal to the hospital rate where they received care, UFH treatment was associated with a nonsignificant increase in the odds of major bleed (OR 1.64, 95% CI 0.50 to 5.33). When we compared the rate of transfusion across hospitals, including 576,231 additional patients who were excluded from the original analyses because they did not receive daily prophylaxis or had a diagnosis of myocardial infarction or COPD, there was a slight negative correlation between transfusion rates and use of UFH (Spearman Correlation Coefficient 0.03; P = 0.61). Hospitals that used primarily UFH had a transfusion rate of 0.60% versus 0.76% at hospitals using primarily LMWH (P = 0.54), indicating that the increased risk of major bleeding associated with UFH was not confounded by local transfusion practices.
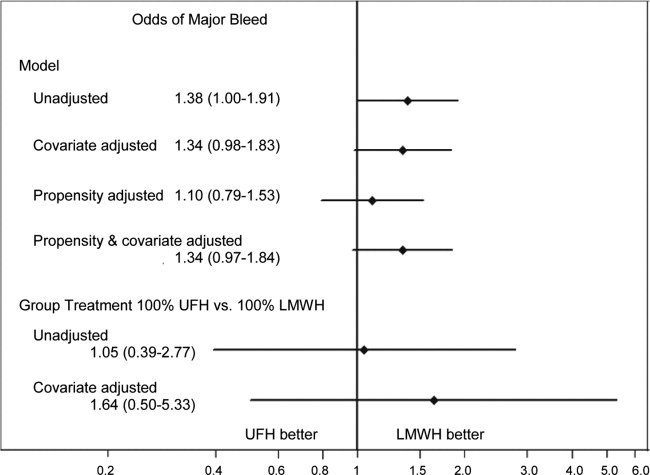
Adjusted for clustering only, patients treated with UFH had an odds ratio for definite complication of 2.35 (95% CI 1.17 to 4.72) compared to those treated with LMWH. Adjustment for propensity and covariates accentuated the association (OR 2.84, 95% CI 1.43 to 5.66). When assigned a probability of treatment with UFH equal to the hospital rate where they received care, UFH treatment was associated with an increase in the risk of definite complication (OR 2.79, 95% CI 1.00 to 7.74).
Adjusted for clustering only, patients treated with UFH had higher costs than those treated with LMWH (cost ratio 1.07, 95% CI 1.05 to 1.09). Adjustment for propensity for UFH and other covariates attenuated the association (cost ratio 1.02, 95% CI 1.00 to 1.03). Finally, when individual patients were assigned a probability of initial treatment with UFH equal to the hospital rate where they received care, treatment with UFH was associated with a nonsignificant change in the relative cost (cost ratio 0.97, 95% CI 0.90 to 1.05).
DISCUSSION
In this retrospective cohort study, we found that low‐molecular‐weight heparin and unfractionated heparin were associated with similar rates of VTE in moderate‐to‐high risk medical patients. However, unfractionated heparin was associated with a small, but higher risk of complications, even after adjustment. There were no statistical differences in rates of heparin‐induced thrombocytopenia, but this complication was exceedingly rare. Finally, overall costs associated with both treatments were similar.
A number of industry‐funded studies have compared LMWH to UFH in randomized clinical trials. These trials have generally been small and used endpoints of uncertain significance, such as asymptomatic deep vein thrombosis assessed by ultrasound. At least 3 meta‐analyses of these trials have been published. Each used different inclusion criteria. The only one to find an efficacy benefit to LMWH over UFH was heavily influenced by the inclusion of a number of studies of stroke patients.3 In that study, LMWH reduced VTE by approximately one‐third relative to UFH. The other 2 analyses found smaller reductions in DVT and pulmonary embolism (PE), and these results were not statistically significant.5, 8 Similarly, 1 analysis5 found a reduction in major bleeding events with LMWH versus UFH, whereas the other 2 studies found smaller reductions which were not statistically significant. The assessment of major bleeding is further complicated by differences in the definition of major bleeding across studies. Using a standard definition of 2 units of packed red blood cells transfused in 1 day to denote major bleeding, we found an associated reduction in bleeding with LMWH that was similar to that observed in the meta‐analyses. Moreover, patients receiving UFH were twice as likely to have a complication that resulted in stopping the prophylaxis, although these complications were overall quite rare. Lastly, there are no cost comparisons based on randomized trials. Several comparisons based on modeling have favored LMWH. One assumed that 3% of patients receiving UFH would develop HIT;13 something we did not observe. At least 3 additional analyses,1416 all funded by the manufacturer of enoxaparin, assumed that LMWH was both more effective and safer than UFH. We found that adjusted costs were similar or slightly lower with UFH than LMWH.
Our study has a number of limitations. First, its observational design makes it vulnerable to selection bias. We attempted to overcome this with rigorous multivariable adjustment, including the propensity for treatment and by using an adaptation of the instrumental variable approach. This method is of particular interest because individual hospitals were strongly predictive of choice of heparin. Still, we cannot exclude the possibility of residual confounding, especially if other outcomes, such as transfusion decisions, were also tied to specific hospital practices. Second, our study used administrative data, and therefore we could not directly adjust for certain differences which may exist between patients who received LMWH and those who received UFH. However, we did adjust for many classic risk factors for VTE. More importantly, it seems that the chance of being treated with a particular form of heparin depends more on the hospital where one receives care than on any combination of patient characteristics. Thus, apart from renal failure, for which we adjusted, it seems unlikely that there were major differences in unmeasured physiological confounders. Third, we limited our analysis to patients who received standard dosing of either type of heparin. We did this to bolster the validity of our findings, but they may not apply to unconventional dosing often observed in clinical practice. Fourth, we measured only outcomes that occurred in the hospital or that prompted a return to the hospital. VTEs which were diagnosed and treated in ambulatory care were not included. While this may have led us to underestimate the true risk of VTE, we have little reason to believe that the choice of whether to admit a patient with VTE is influenced by the original choice of VTE prophylaxis. Finally, our study was conducted before the introduction of generic LMWH, which would be expected to reduce costs associated with LMWH prophylaxis.
VTE prophylaxis for medical patients has emerged as a major focus for quality improvement initiatives. As a result, a significant proportion of general medical patients receive some form of chemoprophylaxis during their hospital stay. Small differences in efficacy or safety of different forms of prophylaxis multiplied by millions of admissions each year can have profound effects on the health of hospitalized patients. Similarly, differences in cost could also have a substantial impact on the healthcare system. We found no difference in efficacy or cost, but treatment with LMWH was less likely to be associated with subsequent transfusion of 2 or more units of packed red blood cells, a surrogate marker for bleeding. In addition, LMWH is more convenient since it can be dosed once daily, and for that reason may be more acceptable to patients. For these reasons, LMWH may be the drug of choice for inpatient prophylaxis of general medical patients. In situations where the cost of the medication itself is important, UFH represents an equally effective alternative.
Acknowledgements
All authors have contributed sufficiently to this study and have provided written permission to be named in the manuscript. No other persons have made substantial contributions to this manuscript. Michael B. Rothberg is the guarantor of the entire manuscript.
Disclosures: This study was supported by a Clinical Scientist Development Award from the Doris Duke Charitable Foundation. The funding source had no role in the study design, analysis, or interpretation of the data. Dr Rothberg served for 1 day as a consultant to Novartis Pharma about an influenza vaccine model. Sandoz, a division of Novartis, was recently granted approval to manufacture a generic form of low‐molecular‐weight heparin. None of the other authors have any conflicts of interest.
- ,,, et al.A comparison of enoxaparin with placebo for the prevention of venous thromboembolism in acutely ill medical patients. Prophylaxis in Medical Patients with Enoxaparin Study Group.N Engl J Med.1999;341:793–800.
- ,,, et al.Prevention of venous thromboembolism: American College of Chest Physicians Evidence‐Based Clinical Practice Guidelines (8th Edition).Chest.2008;133:381S–453S.
- ,,,,.Pharmacological venous thromboembolism prophylaxis in hospitalized medical patients: a meta‐analysis of randomized controlled trials.Arch Intern Med.2007;167:1476–1486.
- ,,,,.Meta‐analysis: anticoagulant prophylaxis to prevent symptomatic venous thromboembolism in hospitalized medical patients.Ann Intern Med.2007;146:278–288.
- ,,, et al.Prevention of venous thromboembolism in internal medicine with unfractionated or low‐molecular‐weight heparins: a meta‐analysis of randomised clinical trials.Thromb Haemost.2000;83:14–19.
- ,,.Risk for heparin‐induced thrombocytopenia with unfractionated and low‐molecular‐weight heparin thromboprophylaxis: a meta‐analysis.Blood.2005;106:2710–2715.
- ,.A safety analysis of thromboprophylaxis in acute medical illness.Thromb Haemost.2003;89:590–591.
- ,,,,.How complete is the evidence for thromboembolism prophylaxis in general medicine patients? A meta‐analysis of randomized controlled trials.J Hosp Med.2009;4:289–297.
- The Joint Commission on the Accreditation of Healthcare Organizations. Venous Thromboembolism (VTE) Core Measure Set. Available at: http://www.jointcommission.org/PerformanceMeasurement/PerformanceMeasurement/VTE.htm. Accessed June 1,2009.
- ,,, et al.Potentially inappropriate medication use in hospitalized elders.J Hosp Med.2008;3:91–102.
- ,,,.Comorbidity measures for use with administrative data.Med Care.1998;36:8–27.
- ,,,,,.Identification of in‐hospital complications from claims data. Is it valid?Med Care.2000;38:785–795.
- ,,,.Cost utility of substituting enoxaparin for unfractionated heparin for prophylaxis of venous thrombosis in the hospitalized medical patient.J Hosp Med.2006;1:168–176.
- ,,,.Cost effectiveness of thromboprophylaxis with a low‐molecular‐weight heparin versus unfractionated heparin in acutely ill medical inpatients.Am J Manag Care.2004;10:632–642.
- ,,,.Comparison of the two‐year outcomes and costs of prophylaxis in medical patients at risk of venous thromboembolism.Thromb Haemost.2008;100:810–820.
- ,,, et al.Cost effectiveness of enoxaparin as prophylaxis against venous thromboembolic complications in acutely ill medical inpatients: modelling study from the hospital perspective in Germany.Pharmacoeconomics.2006;24:571–591.
Venous thromboembolism (VTE) is a major source of morbidity and mortality for hospitalized patients, with as many as 16% of high‐risk medical patients developing VTE during their hospital stay.1, 2 Pharmacologic prophylaxis with subcutaneous heparin reduces the risk of VTE by approximately 50%,3, 4 and guidelines produced by the American College of Chest Physicians (ACCP) recommend thromboprophylaxis for patients at moderate‐to‐high risk of VTE with either low‐molecular‐weight heparin (LMWH) or unfractionated heparin (UFH).2 UFH is less expensive per dose, but meta‐analyses have suggested that UFH may be either less effective than LMWH3 or more likely to cause complications, such as bleeding5 or heparin‐induced thrombocytopenia (HIT).6 Others have argued that the efficacy and risk of bleeding with UFH and LMWH are similar.7, 8 In either case, there are few head‐to‐head studies of LMWH and UFH in medical patients and they tend to be small. In the most recent meta‐analysis, which included fewer than 4500 patients, several different low‐molecular‐weight heparins were assessed together, and the observed rate of deep vein thrombosis (DVT) with UFH was high (5.4%), with evidence suggesting publication bias.3
Given the current Joint Commission requirement9 that all medical patients either receive VTE prophylaxis or have documented a reason not to, the implications related to choosing one form of VTE prophylaxis over another are substantial on a national scale. In order to compare the effectiveness of UFH and LMWH in routine practice among hospitalized medical patients, we conducted a retrospective cohort study in a national sample of hospitals and compared the risk of VTE, bleeding, HIT, and death associated with each treatment.
METHODS
Setting and Patients
We conducted a retrospective cohort study of patients discharged between January 1, 2004 and June 30, 2005 from 333 acute care facilities in the United States that participated in Premier's Perspective, a database we have described previously.10 Compared to US hospitals as a whole, Perspective hospitals are more likely to be located in the South and in urban areas. Perspective contains the following data elements: sociodemographic information, International Classification of Diseases, Ninth Revision, Clinical Modification (ICD‐9‐CM) diagnosis and procedure codes, as well as a list of all billed items with a date of service, including diagnostic tests, medications, and other treatments. Hospitals' characteristics include size, region, setting, and teaching status. The Institutional Review Board at Baystate Medical Center granted permission to conduct the study (#132280‐1).
We included general medical patients aged 18 years whose ICD‐9‐CM primary diagnosis code (congestive heart failure, stroke, pneumonia, and urinary tract infection) placed them at moderate‐to‐high risk of VTE according to the ACCP recommendations,2 and who received daily prophylactic dosages of either LMWH (40 mg daily) or UFH (10,00015,000 units daily) initiated by hospital day 2 and continued to discharge or until the patient developed a VTE or a complication attributable to heparin. Patients were included so long as they missed no more than 1 day of prophylaxis or had no more than 1 unusual dose recorded. Patients who switched between heparin types were included and analyzed according to their initial therapy. Patients who received any other regimen were excluded. We also excluded patients who received warfarin on hospital day 1 or 2, because they would not be considered candidates for heparin prophylaxis, and patients whose length of stay was 2 days, because the value of VTE prophylaxis in such cases is unknown.
Data Elements
For each patient, we extracted age, gender, race, and insurance status, principal diagnosis, comorbidities, and specialty of the attending physician. Comorbidities were identified from ICD‐9‐CM secondary diagnosis codes and Diagnosis Related Groups using Healthcare Cost and Utilization Project Comorbidity Software, version 3.1, based on the work of Elixhauser and colleagues.11 We also identified additional risk factors for VTE using a combination of ICD‐9‐CM codes and specific charges. These included cancer, chemotherapy/radiation, prior VTE, use of estrogens and estrogen modulators, inflammatory bowel disease, nephrotic syndrome, myeloproliferative disorders, smoking, central venous catheter, inherited or acquired thrombophilia, mechanical ventilation, urinary catheter, decubitus ulcer, 3‐hydroxy‐3‐methylglutaryl coenzyme A (HMG‐CoA) reductase inhibitors, restraints, and varicose veins. Hospitals were categorized by region (Northeast, South, Midwest, or West), bed size, setting (urban vs rural), and teaching status.
Outcome Variables
We defined hospital‐acquired VTE as a secondary diagnosis of VTE (ICD‐9‐CM diagnoses 453.4, 453.40, 453.41, 453.42, 453.8, 453.9, 415.1, 415.11, 415.19), combined with a diagnostic test for VTE (lower extremity ultrasound, venography, computed tomography (CT) angiogram, ventilation‐perfusion scan, or pulmonary angiogram) after hospital day 2, followed by treatment for VTE (intravenous unfractionated heparin, >60 mg of enoxaparin, 7500 mg of dalteparin, or placement of an inferior vena cava filter) for at least 50% of the remaining hospital days or until initiation of warfarin or appearance of a complication (eg, transfusion or treatment for heparin‐induced thrombocytopenia). We chose this definition to differentiate hospital‐acquired VTE from VTE present on admission.12 In addition, patients who were readmitted within 30 days of discharge with a primary diagnosis of VTE were also considered to have hospital‐acquired VTE.
We also assessed complications of VTE prophylaxis. Major bleeding was defined as the receipt of 2 or more units of packed red blood cells on a single day or a secondary diagnosis of intracranial bleeding. Because there was no ICD‐9‐CM code for HIT, we assessed codes for all thrombocytopenia, as well as secondary thrombocytopenia. Definite HIT was defined as an ICD‐9‐CM code for thrombocytopenia, together with discontinuation of heparin and initiation of treatment with argatroban. A definite complication was defined as HIT or evidence of major bleeding coupled with discontinuation of heparin. Finally, we evaluated all‐cause in‐hospital mortality and total hospital costs.
Statistical Analysis
We computed summary statistics using frequencies and percents for categorical variables, and means, medians, and standard deviations and interquartile range for continuous variables. Associations of prophylaxis type with patient and hospital characteristics and outcomes were assessed using chi‐square tests or Fisher's exact test for categorical variables, and z‐tests or Wilcoxon tests for continuous variables.
We developed a propensity model for treatment with UFH as the outcome; the model included patient characteristics, early treatments, comorbidities, risk factors for VTE, physician specialty, and selected interaction terms. We then developed a series of multivariable models to evaluate the impact of heparin choice on the risk of VTE, complications of treatment, mortality, and total cost. Generalized estimating equation models with a logit link were used to assess the association between the choice of heparin and the risk of VTE, and of complications and mortality, while adjusting for the effects of within‐hospital correlation; identity link models were used for analyses of cost. Costs were trimmed at 3 standard deviations above the mean, and natural log‐transformed values were modeled due to extreme positive skew.
Unadjusted and covariate‐adjusted models were evaluated with and without adjustments for propensity score. In addition, since the hospital was the single strongest predictor of treatment, we developed grouped treatment models, in which a patient's actual treatment was replaced by a probability equal to the proportion of prophylaxed patients receiving UFH at that hospital. This adaptation of instrumental variable analysis uses the hospital as the instrument, and attempts to assess whether patients treated at a hospital which uses UFH more frequently have outcomes that differ from those of patients treated at hospitals which use LMWH more frequently, while adjusting for other patient, physician, and hospital variables. By relying on treatment at the hospital level, this method reduces the opportunity for selection bias at the patient level.
Finally, in order to exclude the possibility that our surrogate bleeding outcome was due to transfusion practices at hospitals that use a particular form of heparin, we compared the hospital rates of transfusion of 2 or more units of packed red cells to the hospital rates of prophylaxis with UFH in a larger dataset of the same hospitals. This set included patients with congestive heart failure, stroke, pneumonia, and urinary tract infection who did not receive daily prophylaxis, as well as patients admitted for chronic obstructive pulmonary disease (COPD) or acute myocardial infarction, and patients who received either warfarin or a treatment dose of heparin in the first 2 hospital days. We also compared the transfusion rates at hospitals that used unfractionated heparin in 80% of patients to hospitals that used LMWH in 80%. All analyses were performed using SAS version 9.1 (SAS Institute Inc, Cary, NC).
RESULTS
Our final sample included 32,104 patients who received prophylaxis at 333 hospitals (see Supporting Information, e‐Figure, in the online version of this article). Patient characteristics appear in Table 1. Most patients (66%) were over age 65; 59% were female and 61% were white. The most common primary diagnoses were pneumonia (40%) and congestive heart failure (25%). Additional risk factors for thromboembolism included cancer (13%), paralysis (8%), or diabetes (35%). Most patients' attending physicians were either internists (61%) or family practitioners (14%). Almost half of the patients were cared for at hospitals in the South (46%).
| Total | UFH | LMWH | ||
|---|---|---|---|---|
| 32,104 (100) | 14,591 (45.4) | 17,513 (54.6) | ||
| N (%) | N (%) | N (%) | P | |
| ||||
| Demographics | ||||
| Age | 0.0002 | |||
| 1849 | 4,061 (12.7) | 1,950 (13.4) | 2,111 (12.1) | |
| 5064 | 6,962 (21.7) | 3,225 (22.1) | 3,737 (21.3) | |
| 6579 | 10,909 (34.0) | 4,921 (33.7) | 5,988 (34.2) | |
| 80+ | 10,172 (31.7) | 4,495 (30.8) | 5,677 (32.4) | |
| Sex | 0.0071 | |||
| Male | 13,234 (41.2) | 6,133 (42.0) | 7,101 (40.5) | |
| Female | 18,870 (58.8) | 8,458 (58.0) | 10,412 (59.5) | |
| Race/ethnicity | <0.0001 | |||
| White | 19,489 (60.7) | 8,063 (55.3) | 11,426 (65.2) | |
| Black | 7,429 (23.1) | 4,101 (28.1) | 3,328 (19.0) | |
| Hispanic | 1,304 (4.1) | 591 (4.1) | 713 (4.1) | |
| Other | 3,882 (12.1) | 1,836 (12.6) | 2,046 (11.7) | |
| Primary diagnosis | <0.0001 | |||
| Pneumonia | 12,768 (39.8) | 5,354 (36.7) | 7,414 (42.3) | |
| Sepsis* | 1,217 (3.8) | 562 (3.9) | 655 (3.7) | |
| Respiratory failure* | 2,017 (6.3) | 814 (5.6) | 1,203 (6.9) | |
| Heart failure | 8,157 (25.4) | 3,825 (26.2) | 4,332 (24.7) | |
| Stroke | 4,416 (13.8) | 2,295 (15.7) | 2,121 (12.1) | |
| Urinary tract infection | 3,529 (11.0) | 1,741 (11.9) | 1,788 (10.2) | |
| Attending specialty | <0.0001 | |||
| Internist | 19,511 (60.8) | 8,945 (61.3) | 10,566 (60.3) | |
| General practice/Family medicine | 4,326 (13.5) | 1,964 (13.5) | 2,362 (13.5) | |
| Cardiologist | 1,606 (5.0) | 730 (5.0) | 876 (5.0) | |
| Pulmonologist | 2,179 (6.8) | 854 (5.9) | 1,325 (7.6) | |
| Nephrology | 583 (1.8) | 380 (2.6) | 203 (1.2) | |
| Critical care/Intensivist | 150 (0.5) | 93 (0.6) | 57 (0.3) | |
| Other | 3,749 (11.7) | 1,625 (11.1) | 2,124 (12.1) | |
| Insurance | <0.0001 | |||
| Medicare traditional | 20,281 (63.2) | 8,929 (61.2) | 11,352 (64.8) | |
| Medicare managed care | 1,737 (5.4) | 826 (5.7) | 911 (5.2) | |
| Medicaid | 2,629 (8.2) | 1,401 (9.6) | 1,228 (7.0) | |
| Private | 5,967 (18.6) | 2,830 (19.4) | 3,137 (17.9) | |
| Self‐pay/uninsured/other | 1,490 (4.6) | 605 (4.1) | 885 (5.1) | |
| Risk factors for VTE | ||||
| Admit from skilled nursing facility | 476 (1.5) | 277 (1.9) | 199 (1.1) | <0.0001 |
| Paralysis | 2,608 (8.1) | 1,317 (9.0) | 1,291 (7.4) | <0.0001 |
| Restraints | 417 (1.3) | 147 (1.0) | 270 (1.5) | <0.0001 |
| Decubitus ulcer | 1,190 (3.7) | 631 (4.3) | 559 (3.2) | <0.0001 |
| Cancer | 4,154 (12.9) | 1,858 (12.7) | 2,296 (13.1) | 0.3171 |
| Chemotherapy | 86 (0.3) | 41 (0.3) | 45 (0.3) | 0.6781 |
| Prior venous thromboembolism | 494 (1.5) | 202 (1.4) | 292 (1.7) | 0.0403 |
| Pregnancy | 1 (0) | 1 (0) | 0 (0) | 0.2733 |
| Estrogens | 438 (1.4) | 143 (1.0) | 295 (1.7) | <0.0001 |
| Estrogen modulators | 246 (0.8) | 80 (0.5) | 166 (0.9) | <0.0001 |
| Congestive heart failure | 3,107 (9.7) | 1,438 (9.9) | 1,669 (9.5) | 0.3263 |
| Respiratory failure | 2,210 (6.9) | 1,037 (7.1) | 1,173 (6.7) | 0.1493 |
| Inflammatory bowel disease | 108 (0.3) | 41 (0.3) | 67 (0.4) | 0.1176 |
| Nephrotic syndrome | 92 (0.3) | 50 (0.3) | 42 (0.2) | 0.0860 |
| Myeloproliferative disorder | 198 (0.6) | 68 (0.5) | 130 (0.7) | 0.0016 |
| Obesity | 2,973 (9.3) | 1,211 (8.3) | 1,762 (10.1) | <0.0001 |
| Smoking | 4,476 (13.9) | 1,887 (12.9) | 2,589 (14.8) | <0.0001 |
| Varicose veins | 19 (0.1) | 6 (0) | 13 (0.1) | 0.2245 |
| Central line | 1,070 (3.3) | 502 (3.4) | 568 (3.2) | 0.3271 |
| Inherited or acquired thrombophilia | 16 (0) | 9 (0.1) | 7 (0) | 0.3855 |
| Diabetes | 11,136 (34.7) | 5,157 (35.3) | 5,979 (34.1) | 0.0241 |
| Procedures associated with VTE or bleed | ||||
| Mechanical ventilation | 2,282 (7.1) | 1,111 (7.6) | 1,171 (6.7) | 0.0013 |
| Urinary catheter | 4,496 (14.0) | 1,545 (10.6) | 2,951 (16.9) | <0.0001 |
| Aspirin | 12,865 (40.1) | 6,101 (41.8) | 6,764 (38.6) | <0.0001 |
| Clopidogrel | 4,575 (14.3) | 2,087 (14.3) | 2,488 (14.2) | 0.8050 |
| Non‐steroidal anti‐inflammatory drugs | 2,147 (6.7) | 867 (5.9) | 1,280 (7.3) | <0.0001 |
| Steroids | 7,938 (24.7) | 3,136 (21.5) | 4,802 (27.4) | <0.0001 |
| Statins | 7,376 (23.0) | 3,462 (23.7) | 3,914 (22.3) | 0.0035 |
| Comorbidities | ||||
| AIDS | 124 (0.4) | 73 (0.5) | 51 (0.3) | 0.0026 |
| Alcohol abuse | 1,048 (3.3) | 523 (3.6) | 525 (3.0) | 0.0032 |
| Deficiency anemia | 7,010 (21.8) | 3,228 (22.1) | 3,782 (21.6) | 0.2543 |
| Rheumatoid arthritis/collagen vas | 967 (3.0) | 426 (2.9) | 541 (3.1) | 0.3762 |
| Chronic blood loss anemia | 177 (0.6) | 79 (0.5) | 98 (0.6) | 0.8269 |
| Chronic pulmonary disease | 12,418 (38.7) | 5,314 (36.4) | 7,104 (40.6) | <0.0001 |
| Depression | 3,334 (10.4) | 1433 (9.8) | 1901 (10.9) | 0.0025 |
| Drug abuse | 694 (2.2) | 412 (2.8) | 282 (1.6) | <0.0001 |
| Hypertension | 16,979 (52.9) | 7,658 (52.5) | 9,321 (53.2) | 0.1866 |
| Hypothyroidism | 4,016 (12.5) | 1,716 (11.8) | 2,300 (13.1) | 0.0002 |
| Liver disease | 453 (1.4) | 227 (1.6) | 226 (1.3) | 0.0448 |
| Other neurological disorders | 4,682 (14.6) | 2,202 (15.1) | 2,480 (14.2) | 0.0187 |
| Peripheral vascular disease | 2,134 (6.6) | 980 (6.7) | 1,154 (6.6) | 0.6490 |
| Psychoses | 1,295 (4.0) | 574 (3.9) | 721 (4.1) | 0.4066 |
| Pulmonary circulation disease | 1,034 (3.2) | 442 (3.0) | 592 (3.4) | 0.0760 |
| Renal failure | 2,794 (8.7) | 1,636 (11.2) | 1,158 (6.6) | 0.0000 |
| Peptic ulcer disease with bleeding | 563 (1.8) | 232 (1.6) | 331 (1.9) | 0.0414 |
| Valvular disease | 2,079 (6.5) | 899 (6.2) | 1,180 (6.7) | 0.0366 |
| Weight loss | 1,231 (3.8) | 556 (3.8) | 675 (3.9) | 0.8391 |
| Other prophylaxis | ||||
| Intermittent pneumatic compression | 1,003 (3.1) | 456 (3.1) | 547 (3.1) | 0.9926 |
| Mechanical prophylaxis | 1,281 (4.0) | 524 (3.6) | 757 (4.3) | 0.0009 |
Fifty‐five percent of patients received LMWH and the remainder received UFH; 1274 (4%) patients switched type of heparin during their stay. The proportion of patients receiving LMWH at an individual hospital varied from 0% to 100% with a u‐shaped distribution, with almost one‐third of hospitals prescribing one treatment or the other exclusively (Figure 1). Similarly, the proportion of an individual physician's patients who received prophylaxis with UFH (vs LMWH) varied from 0% to 100% (Figure 1), with 51% prescribing LMWH exclusively and 31% prescribing UFH exclusively. Compared to patients who received UFH, patients receiving LMWH were older and were more likely to be white, female, and to have pneumonia. By far the biggest difference between the groups was the hospitals at which they received their care (see Supporting Information, e‐Table, in the online version of this article). Patients receiving LMWH were much more likely to be from smaller, rural, non‐teaching hospitals in the South or the West. There were also numerous small differences in comorbidities and individual VTE risk factors between the 2 groups. The only large difference was that patients with a secondary diagnosis of renal failure (for which LMWH is not US Food and Drug Administration [FDA] approved) were almost twice as likely to receive UFH.
We identified 163 (0.51%) episodes of VTE (Table 2). Compared to patients receiving UFH, those receiving standard LMWH had similar unadjusted rates of VTE (0.53% vs 0.48%; P = 0.54), major bleeding (0.77% vs 0.76%; P = 0.88), thrombocytopenia (1.9% vs 2.0%; P = 0.48), definite HIT (n = 1 vs n = 3; P = 0.34), and mortality (2.8% vs 3.1%; P = 0.07). Definite complications of prophylaxis (HIT or major bleed combined with the discontinuation of heparin) were more common among patients receiving UFH (0.2% vs 0.1%; P = 0.022). Patients treated with UFH had longer unadjusted lengths of stay (P < 0.0001) and higher unadjusted costs (P < 0.0001).
| Total | UFH | LMWH | P | |
|---|---|---|---|---|
| 32,104 (100) | 14,591 (45.4) | 17,513 (54.6) | ||
| n (%) | n (%) | n (%) | ||
| ||||
| Venous thromboembolism | 163 (0.5) | 78 (0.5) | 85 (0.5) | 0.54 |
| Heparin‐induced thrombocytopenia | 4 (0) | 3 (0) | 1 (0) | 0.34* |
| Any major bleeding | 246 (0.8) | 113 (0.8) | 133 (0.8) | 0.88 |
| Transfusion with 2 units of packed red blood cells | 218 (0.7) | 97 (0.7) | 121 (0.7) | 0.78 |
| Intracranial hemorrhage | 30 (0.1) | 17 (0.1) | 13 (0.1) | 0.22 |
| Complication resulting in stopping heparin | 44 (0.1) | 28 (0.2) | 16 (0.1) | 0.02 |
| In‐hospital mortality | 944 (2.9) | 456 (3.1) | 488 (2.8) | 0.07 |
| LOS in days; mean (SD) | 6.2 (5.9) | 6.4 (6.2) | 6.0 (5.6) | <0.001 |
| Median (IQR) | 5 (37) | 5 (37) | 5 (37) | |
| Cost in USD; median (IQR) | 5873 (41718982) | 6007 (41779456) | 5774 (41658660) | <0.001 |
A propensity model for UFH treatment based upon patient characteristics and treatments was not strongly predictive of treatment (c = 0.58) and propensity matching failed to balance many of the patient characteristics. However, hospital alone, ignoring patient characteristics was strongly predictive (c = 0.91) of treatment.
In a model adjusting only for clustering within hospitals, patients treated with UFH had an odds ratio (OR) for VTE of 1.08 (95% confidence interval [CI] 0.79 to 1.49) compared to patients receiving LMWH (Figure 2). Adjustment for propensity for UFH and other covariates attenuated the effect of LMWH (OR 1.04, 95% CI 0.76 to 1.43). When individual patients were assigned a probability of treatment with UFH equal to the hospital rate where they received care, UFH use was associated with a nonsignificant change in the odds of VTE (OR 1.14, 95% CI 0.72 to 1.81).
Adjusted for clustering within hospital only, patients treated with UFH had an odds ratio for major bleed of 1.38 (95% CI 1.00 to 1.91) compared to patients receiving LMWH (Figure 3). Adjustment for propensity for UFH and other covariates gave similar results (OR 1.34, 95% CI 0.97 to 1.84). When individual patients were assigned a probability of treatment with UFH equal to the hospital rate where they received care, UFH treatment was associated with a nonsignificant increase in the odds of major bleed (OR 1.64, 95% CI 0.50 to 5.33). When we compared the rate of transfusion across hospitals, including 576,231 additional patients who were excluded from the original analyses because they did not receive daily prophylaxis or had a diagnosis of myocardial infarction or COPD, there was a slight negative correlation between transfusion rates and use of UFH (Spearman Correlation Coefficient 0.03; P = 0.61). Hospitals that used primarily UFH had a transfusion rate of 0.60% versus 0.76% at hospitals using primarily LMWH (P = 0.54), indicating that the increased risk of major bleeding associated with UFH was not confounded by local transfusion practices.
Adjusted for clustering only, patients treated with UFH had an odds ratio for definite complication of 2.35 (95% CI 1.17 to 4.72) compared to those treated with LMWH. Adjustment for propensity and covariates accentuated the association (OR 2.84, 95% CI 1.43 to 5.66). When assigned a probability of treatment with UFH equal to the hospital rate where they received care, UFH treatment was associated with an increase in the risk of definite complication (OR 2.79, 95% CI 1.00 to 7.74).
Adjusted for clustering only, patients treated with UFH had higher costs than those treated with LMWH (cost ratio 1.07, 95% CI 1.05 to 1.09). Adjustment for propensity for UFH and other covariates attenuated the association (cost ratio 1.02, 95% CI 1.00 to 1.03). Finally, when individual patients were assigned a probability of initial treatment with UFH equal to the hospital rate where they received care, treatment with UFH was associated with a nonsignificant change in the relative cost (cost ratio 0.97, 95% CI 0.90 to 1.05).
DISCUSSION
In this retrospective cohort study, we found that low‐molecular‐weight heparin and unfractionated heparin were associated with similar rates of VTE in moderate‐to‐high risk medical patients. However, unfractionated heparin was associated with a small, but higher risk of complications, even after adjustment. There were no statistical differences in rates of heparin‐induced thrombocytopenia, but this complication was exceedingly rare. Finally, overall costs associated with both treatments were similar.
A number of industry‐funded studies have compared LMWH to UFH in randomized clinical trials. These trials have generally been small and used endpoints of uncertain significance, such as asymptomatic deep vein thrombosis assessed by ultrasound. At least 3 meta‐analyses of these trials have been published. Each used different inclusion criteria. The only one to find an efficacy benefit to LMWH over UFH was heavily influenced by the inclusion of a number of studies of stroke patients.3 In that study, LMWH reduced VTE by approximately one‐third relative to UFH. The other 2 analyses found smaller reductions in DVT and pulmonary embolism (PE), and these results were not statistically significant.5, 8 Similarly, 1 analysis5 found a reduction in major bleeding events with LMWH versus UFH, whereas the other 2 studies found smaller reductions which were not statistically significant. The assessment of major bleeding is further complicated by differences in the definition of major bleeding across studies. Using a standard definition of 2 units of packed red blood cells transfused in 1 day to denote major bleeding, we found an associated reduction in bleeding with LMWH that was similar to that observed in the meta‐analyses. Moreover, patients receiving UFH were twice as likely to have a complication that resulted in stopping the prophylaxis, although these complications were overall quite rare. Lastly, there are no cost comparisons based on randomized trials. Several comparisons based on modeling have favored LMWH. One assumed that 3% of patients receiving UFH would develop HIT;13 something we did not observe. At least 3 additional analyses,1416 all funded by the manufacturer of enoxaparin, assumed that LMWH was both more effective and safer than UFH. We found that adjusted costs were similar or slightly lower with UFH than LMWH.
Our study has a number of limitations. First, its observational design makes it vulnerable to selection bias. We attempted to overcome this with rigorous multivariable adjustment, including the propensity for treatment and by using an adaptation of the instrumental variable approach. This method is of particular interest because individual hospitals were strongly predictive of choice of heparin. Still, we cannot exclude the possibility of residual confounding, especially if other outcomes, such as transfusion decisions, were also tied to specific hospital practices. Second, our study used administrative data, and therefore we could not directly adjust for certain differences which may exist between patients who received LMWH and those who received UFH. However, we did adjust for many classic risk factors for VTE. More importantly, it seems that the chance of being treated with a particular form of heparin depends more on the hospital where one receives care than on any combination of patient characteristics. Thus, apart from renal failure, for which we adjusted, it seems unlikely that there were major differences in unmeasured physiological confounders. Third, we limited our analysis to patients who received standard dosing of either type of heparin. We did this to bolster the validity of our findings, but they may not apply to unconventional dosing often observed in clinical practice. Fourth, we measured only outcomes that occurred in the hospital or that prompted a return to the hospital. VTEs which were diagnosed and treated in ambulatory care were not included. While this may have led us to underestimate the true risk of VTE, we have little reason to believe that the choice of whether to admit a patient with VTE is influenced by the original choice of VTE prophylaxis. Finally, our study was conducted before the introduction of generic LMWH, which would be expected to reduce costs associated with LMWH prophylaxis.
VTE prophylaxis for medical patients has emerged as a major focus for quality improvement initiatives. As a result, a significant proportion of general medical patients receive some form of chemoprophylaxis during their hospital stay. Small differences in efficacy or safety of different forms of prophylaxis multiplied by millions of admissions each year can have profound effects on the health of hospitalized patients. Similarly, differences in cost could also have a substantial impact on the healthcare system. We found no difference in efficacy or cost, but treatment with LMWH was less likely to be associated with subsequent transfusion of 2 or more units of packed red blood cells, a surrogate marker for bleeding. In addition, LMWH is more convenient since it can be dosed once daily, and for that reason may be more acceptable to patients. For these reasons, LMWH may be the drug of choice for inpatient prophylaxis of general medical patients. In situations where the cost of the medication itself is important, UFH represents an equally effective alternative.
Acknowledgements
All authors have contributed sufficiently to this study and have provided written permission to be named in the manuscript. No other persons have made substantial contributions to this manuscript. Michael B. Rothberg is the guarantor of the entire manuscript.
Disclosures: This study was supported by a Clinical Scientist Development Award from the Doris Duke Charitable Foundation. The funding source had no role in the study design, analysis, or interpretation of the data. Dr Rothberg served for 1 day as a consultant to Novartis Pharma about an influenza vaccine model. Sandoz, a division of Novartis, was recently granted approval to manufacture a generic form of low‐molecular‐weight heparin. None of the other authors have any conflicts of interest.
Venous thromboembolism (VTE) is a major source of morbidity and mortality for hospitalized patients, with as many as 16% of high‐risk medical patients developing VTE during their hospital stay.1, 2 Pharmacologic prophylaxis with subcutaneous heparin reduces the risk of VTE by approximately 50%,3, 4 and guidelines produced by the American College of Chest Physicians (ACCP) recommend thromboprophylaxis for patients at moderate‐to‐high risk of VTE with either low‐molecular‐weight heparin (LMWH) or unfractionated heparin (UFH).2 UFH is less expensive per dose, but meta‐analyses have suggested that UFH may be either less effective than LMWH3 or more likely to cause complications, such as bleeding5 or heparin‐induced thrombocytopenia (HIT).6 Others have argued that the efficacy and risk of bleeding with UFH and LMWH are similar.7, 8 In either case, there are few head‐to‐head studies of LMWH and UFH in medical patients and they tend to be small. In the most recent meta‐analysis, which included fewer than 4500 patients, several different low‐molecular‐weight heparins were assessed together, and the observed rate of deep vein thrombosis (DVT) with UFH was high (5.4%), with evidence suggesting publication bias.3
Given the current Joint Commission requirement9 that all medical patients either receive VTE prophylaxis or have documented a reason not to, the implications related to choosing one form of VTE prophylaxis over another are substantial on a national scale. In order to compare the effectiveness of UFH and LMWH in routine practice among hospitalized medical patients, we conducted a retrospective cohort study in a national sample of hospitals and compared the risk of VTE, bleeding, HIT, and death associated with each treatment.
METHODS
Setting and Patients
We conducted a retrospective cohort study of patients discharged between January 1, 2004 and June 30, 2005 from 333 acute care facilities in the United States that participated in Premier's Perspective, a database we have described previously.10 Compared to US hospitals as a whole, Perspective hospitals are more likely to be located in the South and in urban areas. Perspective contains the following data elements: sociodemographic information, International Classification of Diseases, Ninth Revision, Clinical Modification (ICD‐9‐CM) diagnosis and procedure codes, as well as a list of all billed items with a date of service, including diagnostic tests, medications, and other treatments. Hospitals' characteristics include size, region, setting, and teaching status. The Institutional Review Board at Baystate Medical Center granted permission to conduct the study (#132280‐1).
We included general medical patients aged 18 years whose ICD‐9‐CM primary diagnosis code (congestive heart failure, stroke, pneumonia, and urinary tract infection) placed them at moderate‐to‐high risk of VTE according to the ACCP recommendations,2 and who received daily prophylactic dosages of either LMWH (40 mg daily) or UFH (10,00015,000 units daily) initiated by hospital day 2 and continued to discharge or until the patient developed a VTE or a complication attributable to heparin. Patients were included so long as they missed no more than 1 day of prophylaxis or had no more than 1 unusual dose recorded. Patients who switched between heparin types were included and analyzed according to their initial therapy. Patients who received any other regimen were excluded. We also excluded patients who received warfarin on hospital day 1 or 2, because they would not be considered candidates for heparin prophylaxis, and patients whose length of stay was 2 days, because the value of VTE prophylaxis in such cases is unknown.
Data Elements
For each patient, we extracted age, gender, race, and insurance status, principal diagnosis, comorbidities, and specialty of the attending physician. Comorbidities were identified from ICD‐9‐CM secondary diagnosis codes and Diagnosis Related Groups using Healthcare Cost and Utilization Project Comorbidity Software, version 3.1, based on the work of Elixhauser and colleagues.11 We also identified additional risk factors for VTE using a combination of ICD‐9‐CM codes and specific charges. These included cancer, chemotherapy/radiation, prior VTE, use of estrogens and estrogen modulators, inflammatory bowel disease, nephrotic syndrome, myeloproliferative disorders, smoking, central venous catheter, inherited or acquired thrombophilia, mechanical ventilation, urinary catheter, decubitus ulcer, 3‐hydroxy‐3‐methylglutaryl coenzyme A (HMG‐CoA) reductase inhibitors, restraints, and varicose veins. Hospitals were categorized by region (Northeast, South, Midwest, or West), bed size, setting (urban vs rural), and teaching status.
Outcome Variables
We defined hospital‐acquired VTE as a secondary diagnosis of VTE (ICD‐9‐CM diagnoses 453.4, 453.40, 453.41, 453.42, 453.8, 453.9, 415.1, 415.11, 415.19), combined with a diagnostic test for VTE (lower extremity ultrasound, venography, computed tomography (CT) angiogram, ventilation‐perfusion scan, or pulmonary angiogram) after hospital day 2, followed by treatment for VTE (intravenous unfractionated heparin, >60 mg of enoxaparin, 7500 mg of dalteparin, or placement of an inferior vena cava filter) for at least 50% of the remaining hospital days or until initiation of warfarin or appearance of a complication (eg, transfusion or treatment for heparin‐induced thrombocytopenia). We chose this definition to differentiate hospital‐acquired VTE from VTE present on admission.12 In addition, patients who were readmitted within 30 days of discharge with a primary diagnosis of VTE were also considered to have hospital‐acquired VTE.
We also assessed complications of VTE prophylaxis. Major bleeding was defined as the receipt of 2 or more units of packed red blood cells on a single day or a secondary diagnosis of intracranial bleeding. Because there was no ICD‐9‐CM code for HIT, we assessed codes for all thrombocytopenia, as well as secondary thrombocytopenia. Definite HIT was defined as an ICD‐9‐CM code for thrombocytopenia, together with discontinuation of heparin and initiation of treatment with argatroban. A definite complication was defined as HIT or evidence of major bleeding coupled with discontinuation of heparin. Finally, we evaluated all‐cause in‐hospital mortality and total hospital costs.
Statistical Analysis
We computed summary statistics using frequencies and percents for categorical variables, and means, medians, and standard deviations and interquartile range for continuous variables. Associations of prophylaxis type with patient and hospital characteristics and outcomes were assessed using chi‐square tests or Fisher's exact test for categorical variables, and z‐tests or Wilcoxon tests for continuous variables.
We developed a propensity model for treatment with UFH as the outcome; the model included patient characteristics, early treatments, comorbidities, risk factors for VTE, physician specialty, and selected interaction terms. We then developed a series of multivariable models to evaluate the impact of heparin choice on the risk of VTE, complications of treatment, mortality, and total cost. Generalized estimating equation models with a logit link were used to assess the association between the choice of heparin and the risk of VTE, and of complications and mortality, while adjusting for the effects of within‐hospital correlation; identity link models were used for analyses of cost. Costs were trimmed at 3 standard deviations above the mean, and natural log‐transformed values were modeled due to extreme positive skew.
Unadjusted and covariate‐adjusted models were evaluated with and without adjustments for propensity score. In addition, since the hospital was the single strongest predictor of treatment, we developed grouped treatment models, in which a patient's actual treatment was replaced by a probability equal to the proportion of prophylaxed patients receiving UFH at that hospital. This adaptation of instrumental variable analysis uses the hospital as the instrument, and attempts to assess whether patients treated at a hospital which uses UFH more frequently have outcomes that differ from those of patients treated at hospitals which use LMWH more frequently, while adjusting for other patient, physician, and hospital variables. By relying on treatment at the hospital level, this method reduces the opportunity for selection bias at the patient level.
Finally, in order to exclude the possibility that our surrogate bleeding outcome was due to transfusion practices at hospitals that use a particular form of heparin, we compared the hospital rates of transfusion of 2 or more units of packed red cells to the hospital rates of prophylaxis with UFH in a larger dataset of the same hospitals. This set included patients with congestive heart failure, stroke, pneumonia, and urinary tract infection who did not receive daily prophylaxis, as well as patients admitted for chronic obstructive pulmonary disease (COPD) or acute myocardial infarction, and patients who received either warfarin or a treatment dose of heparin in the first 2 hospital days. We also compared the transfusion rates at hospitals that used unfractionated heparin in 80% of patients to hospitals that used LMWH in 80%. All analyses were performed using SAS version 9.1 (SAS Institute Inc, Cary, NC).
RESULTS
Our final sample included 32,104 patients who received prophylaxis at 333 hospitals (see Supporting Information, e‐Figure, in the online version of this article). Patient characteristics appear in Table 1. Most patients (66%) were over age 65; 59% were female and 61% were white. The most common primary diagnoses were pneumonia (40%) and congestive heart failure (25%). Additional risk factors for thromboembolism included cancer (13%), paralysis (8%), or diabetes (35%). Most patients' attending physicians were either internists (61%) or family practitioners (14%). Almost half of the patients were cared for at hospitals in the South (46%).
| Total | UFH | LMWH | ||
|---|---|---|---|---|
| 32,104 (100) | 14,591 (45.4) | 17,513 (54.6) | ||
| N (%) | N (%) | N (%) | P | |
| ||||
| Demographics | ||||
| Age | 0.0002 | |||
| 1849 | 4,061 (12.7) | 1,950 (13.4) | 2,111 (12.1) | |
| 5064 | 6,962 (21.7) | 3,225 (22.1) | 3,737 (21.3) | |
| 6579 | 10,909 (34.0) | 4,921 (33.7) | 5,988 (34.2) | |
| 80+ | 10,172 (31.7) | 4,495 (30.8) | 5,677 (32.4) | |
| Sex | 0.0071 | |||
| Male | 13,234 (41.2) | 6,133 (42.0) | 7,101 (40.5) | |
| Female | 18,870 (58.8) | 8,458 (58.0) | 10,412 (59.5) | |
| Race/ethnicity | <0.0001 | |||
| White | 19,489 (60.7) | 8,063 (55.3) | 11,426 (65.2) | |
| Black | 7,429 (23.1) | 4,101 (28.1) | 3,328 (19.0) | |
| Hispanic | 1,304 (4.1) | 591 (4.1) | 713 (4.1) | |
| Other | 3,882 (12.1) | 1,836 (12.6) | 2,046 (11.7) | |
| Primary diagnosis | <0.0001 | |||
| Pneumonia | 12,768 (39.8) | 5,354 (36.7) | 7,414 (42.3) | |
| Sepsis* | 1,217 (3.8) | 562 (3.9) | 655 (3.7) | |
| Respiratory failure* | 2,017 (6.3) | 814 (5.6) | 1,203 (6.9) | |
| Heart failure | 8,157 (25.4) | 3,825 (26.2) | 4,332 (24.7) | |
| Stroke | 4,416 (13.8) | 2,295 (15.7) | 2,121 (12.1) | |
| Urinary tract infection | 3,529 (11.0) | 1,741 (11.9) | 1,788 (10.2) | |
| Attending specialty | <0.0001 | |||
| Internist | 19,511 (60.8) | 8,945 (61.3) | 10,566 (60.3) | |
| General practice/Family medicine | 4,326 (13.5) | 1,964 (13.5) | 2,362 (13.5) | |
| Cardiologist | 1,606 (5.0) | 730 (5.0) | 876 (5.0) | |
| Pulmonologist | 2,179 (6.8) | 854 (5.9) | 1,325 (7.6) | |
| Nephrology | 583 (1.8) | 380 (2.6) | 203 (1.2) | |
| Critical care/Intensivist | 150 (0.5) | 93 (0.6) | 57 (0.3) | |
| Other | 3,749 (11.7) | 1,625 (11.1) | 2,124 (12.1) | |
| Insurance | <0.0001 | |||
| Medicare traditional | 20,281 (63.2) | 8,929 (61.2) | 11,352 (64.8) | |
| Medicare managed care | 1,737 (5.4) | 826 (5.7) | 911 (5.2) | |
| Medicaid | 2,629 (8.2) | 1,401 (9.6) | 1,228 (7.0) | |
| Private | 5,967 (18.6) | 2,830 (19.4) | 3,137 (17.9) | |
| Self‐pay/uninsured/other | 1,490 (4.6) | 605 (4.1) | 885 (5.1) | |
| Risk factors for VTE | ||||
| Admit from skilled nursing facility | 476 (1.5) | 277 (1.9) | 199 (1.1) | <0.0001 |
| Paralysis | 2,608 (8.1) | 1,317 (9.0) | 1,291 (7.4) | <0.0001 |
| Restraints | 417 (1.3) | 147 (1.0) | 270 (1.5) | <0.0001 |
| Decubitus ulcer | 1,190 (3.7) | 631 (4.3) | 559 (3.2) | <0.0001 |
| Cancer | 4,154 (12.9) | 1,858 (12.7) | 2,296 (13.1) | 0.3171 |
| Chemotherapy | 86 (0.3) | 41 (0.3) | 45 (0.3) | 0.6781 |
| Prior venous thromboembolism | 494 (1.5) | 202 (1.4) | 292 (1.7) | 0.0403 |
| Pregnancy | 1 (0) | 1 (0) | 0 (0) | 0.2733 |
| Estrogens | 438 (1.4) | 143 (1.0) | 295 (1.7) | <0.0001 |
| Estrogen modulators | 246 (0.8) | 80 (0.5) | 166 (0.9) | <0.0001 |
| Congestive heart failure | 3,107 (9.7) | 1,438 (9.9) | 1,669 (9.5) | 0.3263 |
| Respiratory failure | 2,210 (6.9) | 1,037 (7.1) | 1,173 (6.7) | 0.1493 |
| Inflammatory bowel disease | 108 (0.3) | 41 (0.3) | 67 (0.4) | 0.1176 |
| Nephrotic syndrome | 92 (0.3) | 50 (0.3) | 42 (0.2) | 0.0860 |
| Myeloproliferative disorder | 198 (0.6) | 68 (0.5) | 130 (0.7) | 0.0016 |
| Obesity | 2,973 (9.3) | 1,211 (8.3) | 1,762 (10.1) | <0.0001 |
| Smoking | 4,476 (13.9) | 1,887 (12.9) | 2,589 (14.8) | <0.0001 |
| Varicose veins | 19 (0.1) | 6 (0) | 13 (0.1) | 0.2245 |
| Central line | 1,070 (3.3) | 502 (3.4) | 568 (3.2) | 0.3271 |
| Inherited or acquired thrombophilia | 16 (0) | 9 (0.1) | 7 (0) | 0.3855 |
| Diabetes | 11,136 (34.7) | 5,157 (35.3) | 5,979 (34.1) | 0.0241 |
| Procedures associated with VTE or bleed | ||||
| Mechanical ventilation | 2,282 (7.1) | 1,111 (7.6) | 1,171 (6.7) | 0.0013 |
| Urinary catheter | 4,496 (14.0) | 1,545 (10.6) | 2,951 (16.9) | <0.0001 |
| Aspirin | 12,865 (40.1) | 6,101 (41.8) | 6,764 (38.6) | <0.0001 |
| Clopidogrel | 4,575 (14.3) | 2,087 (14.3) | 2,488 (14.2) | 0.8050 |
| Non‐steroidal anti‐inflammatory drugs | 2,147 (6.7) | 867 (5.9) | 1,280 (7.3) | <0.0001 |
| Steroids | 7,938 (24.7) | 3,136 (21.5) | 4,802 (27.4) | <0.0001 |
| Statins | 7,376 (23.0) | 3,462 (23.7) | 3,914 (22.3) | 0.0035 |
| Comorbidities | ||||
| AIDS | 124 (0.4) | 73 (0.5) | 51 (0.3) | 0.0026 |
| Alcohol abuse | 1,048 (3.3) | 523 (3.6) | 525 (3.0) | 0.0032 |
| Deficiency anemia | 7,010 (21.8) | 3,228 (22.1) | 3,782 (21.6) | 0.2543 |
| Rheumatoid arthritis/collagen vas | 967 (3.0) | 426 (2.9) | 541 (3.1) | 0.3762 |
| Chronic blood loss anemia | 177 (0.6) | 79 (0.5) | 98 (0.6) | 0.8269 |
| Chronic pulmonary disease | 12,418 (38.7) | 5,314 (36.4) | 7,104 (40.6) | <0.0001 |
| Depression | 3,334 (10.4) | 1433 (9.8) | 1901 (10.9) | 0.0025 |
| Drug abuse | 694 (2.2) | 412 (2.8) | 282 (1.6) | <0.0001 |
| Hypertension | 16,979 (52.9) | 7,658 (52.5) | 9,321 (53.2) | 0.1866 |
| Hypothyroidism | 4,016 (12.5) | 1,716 (11.8) | 2,300 (13.1) | 0.0002 |
| Liver disease | 453 (1.4) | 227 (1.6) | 226 (1.3) | 0.0448 |
| Other neurological disorders | 4,682 (14.6) | 2,202 (15.1) | 2,480 (14.2) | 0.0187 |
| Peripheral vascular disease | 2,134 (6.6) | 980 (6.7) | 1,154 (6.6) | 0.6490 |
| Psychoses | 1,295 (4.0) | 574 (3.9) | 721 (4.1) | 0.4066 |
| Pulmonary circulation disease | 1,034 (3.2) | 442 (3.0) | 592 (3.4) | 0.0760 |
| Renal failure | 2,794 (8.7) | 1,636 (11.2) | 1,158 (6.6) | 0.0000 |
| Peptic ulcer disease with bleeding | 563 (1.8) | 232 (1.6) | 331 (1.9) | 0.0414 |
| Valvular disease | 2,079 (6.5) | 899 (6.2) | 1,180 (6.7) | 0.0366 |
| Weight loss | 1,231 (3.8) | 556 (3.8) | 675 (3.9) | 0.8391 |
| Other prophylaxis | ||||
| Intermittent pneumatic compression | 1,003 (3.1) | 456 (3.1) | 547 (3.1) | 0.9926 |
| Mechanical prophylaxis | 1,281 (4.0) | 524 (3.6) | 757 (4.3) | 0.0009 |
Fifty‐five percent of patients received LMWH and the remainder received UFH; 1274 (4%) patients switched type of heparin during their stay. The proportion of patients receiving LMWH at an individual hospital varied from 0% to 100% with a u‐shaped distribution, with almost one‐third of hospitals prescribing one treatment or the other exclusively (Figure 1). Similarly, the proportion of an individual physician's patients who received prophylaxis with UFH (vs LMWH) varied from 0% to 100% (Figure 1), with 51% prescribing LMWH exclusively and 31% prescribing UFH exclusively. Compared to patients who received UFH, patients receiving LMWH were older and were more likely to be white, female, and to have pneumonia. By far the biggest difference between the groups was the hospitals at which they received their care (see Supporting Information, e‐Table, in the online version of this article). Patients receiving LMWH were much more likely to be from smaller, rural, non‐teaching hospitals in the South or the West. There were also numerous small differences in comorbidities and individual VTE risk factors between the 2 groups. The only large difference was that patients with a secondary diagnosis of renal failure (for which LMWH is not US Food and Drug Administration [FDA] approved) were almost twice as likely to receive UFH.
We identified 163 (0.51%) episodes of VTE (Table 2). Compared to patients receiving UFH, those receiving standard LMWH had similar unadjusted rates of VTE (0.53% vs 0.48%; P = 0.54), major bleeding (0.77% vs 0.76%; P = 0.88), thrombocytopenia (1.9% vs 2.0%; P = 0.48), definite HIT (n = 1 vs n = 3; P = 0.34), and mortality (2.8% vs 3.1%; P = 0.07). Definite complications of prophylaxis (HIT or major bleed combined with the discontinuation of heparin) were more common among patients receiving UFH (0.2% vs 0.1%; P = 0.022). Patients treated with UFH had longer unadjusted lengths of stay (P < 0.0001) and higher unadjusted costs (P < 0.0001).
| Total | UFH | LMWH | P | |
|---|---|---|---|---|
| 32,104 (100) | 14,591 (45.4) | 17,513 (54.6) | ||
| n (%) | n (%) | n (%) | ||
| ||||
| Venous thromboembolism | 163 (0.5) | 78 (0.5) | 85 (0.5) | 0.54 |
| Heparin‐induced thrombocytopenia | 4 (0) | 3 (0) | 1 (0) | 0.34* |
| Any major bleeding | 246 (0.8) | 113 (0.8) | 133 (0.8) | 0.88 |
| Transfusion with 2 units of packed red blood cells | 218 (0.7) | 97 (0.7) | 121 (0.7) | 0.78 |
| Intracranial hemorrhage | 30 (0.1) | 17 (0.1) | 13 (0.1) | 0.22 |
| Complication resulting in stopping heparin | 44 (0.1) | 28 (0.2) | 16 (0.1) | 0.02 |
| In‐hospital mortality | 944 (2.9) | 456 (3.1) | 488 (2.8) | 0.07 |
| LOS in days; mean (SD) | 6.2 (5.9) | 6.4 (6.2) | 6.0 (5.6) | <0.001 |
| Median (IQR) | 5 (37) | 5 (37) | 5 (37) | |
| Cost in USD; median (IQR) | 5873 (41718982) | 6007 (41779456) | 5774 (41658660) | <0.001 |
A propensity model for UFH treatment based upon patient characteristics and treatments was not strongly predictive of treatment (c = 0.58) and propensity matching failed to balance many of the patient characteristics. However, hospital alone, ignoring patient characteristics was strongly predictive (c = 0.91) of treatment.
In a model adjusting only for clustering within hospitals, patients treated with UFH had an odds ratio (OR) for VTE of 1.08 (95% confidence interval [CI] 0.79 to 1.49) compared to patients receiving LMWH (Figure 2). Adjustment for propensity for UFH and other covariates attenuated the effect of LMWH (OR 1.04, 95% CI 0.76 to 1.43). When individual patients were assigned a probability of treatment with UFH equal to the hospital rate where they received care, UFH use was associated with a nonsignificant change in the odds of VTE (OR 1.14, 95% CI 0.72 to 1.81).
Adjusted for clustering within hospital only, patients treated with UFH had an odds ratio for major bleed of 1.38 (95% CI 1.00 to 1.91) compared to patients receiving LMWH (Figure 3). Adjustment for propensity for UFH and other covariates gave similar results (OR 1.34, 95% CI 0.97 to 1.84). When individual patients were assigned a probability of treatment with UFH equal to the hospital rate where they received care, UFH treatment was associated with a nonsignificant increase in the odds of major bleed (OR 1.64, 95% CI 0.50 to 5.33). When we compared the rate of transfusion across hospitals, including 576,231 additional patients who were excluded from the original analyses because they did not receive daily prophylaxis or had a diagnosis of myocardial infarction or COPD, there was a slight negative correlation between transfusion rates and use of UFH (Spearman Correlation Coefficient 0.03; P = 0.61). Hospitals that used primarily UFH had a transfusion rate of 0.60% versus 0.76% at hospitals using primarily LMWH (P = 0.54), indicating that the increased risk of major bleeding associated with UFH was not confounded by local transfusion practices.
Adjusted for clustering only, patients treated with UFH had an odds ratio for definite complication of 2.35 (95% CI 1.17 to 4.72) compared to those treated with LMWH. Adjustment for propensity and covariates accentuated the association (OR 2.84, 95% CI 1.43 to 5.66). When assigned a probability of treatment with UFH equal to the hospital rate where they received care, UFH treatment was associated with an increase in the risk of definite complication (OR 2.79, 95% CI 1.00 to 7.74).
Adjusted for clustering only, patients treated with UFH had higher costs than those treated with LMWH (cost ratio 1.07, 95% CI 1.05 to 1.09). Adjustment for propensity for UFH and other covariates attenuated the association (cost ratio 1.02, 95% CI 1.00 to 1.03). Finally, when individual patients were assigned a probability of initial treatment with UFH equal to the hospital rate where they received care, treatment with UFH was associated with a nonsignificant change in the relative cost (cost ratio 0.97, 95% CI 0.90 to 1.05).
DISCUSSION
In this retrospective cohort study, we found that low‐molecular‐weight heparin and unfractionated heparin were associated with similar rates of VTE in moderate‐to‐high risk medical patients. However, unfractionated heparin was associated with a small, but higher risk of complications, even after adjustment. There were no statistical differences in rates of heparin‐induced thrombocytopenia, but this complication was exceedingly rare. Finally, overall costs associated with both treatments were similar.
A number of industry‐funded studies have compared LMWH to UFH in randomized clinical trials. These trials have generally been small and used endpoints of uncertain significance, such as asymptomatic deep vein thrombosis assessed by ultrasound. At least 3 meta‐analyses of these trials have been published. Each used different inclusion criteria. The only one to find an efficacy benefit to LMWH over UFH was heavily influenced by the inclusion of a number of studies of stroke patients.3 In that study, LMWH reduced VTE by approximately one‐third relative to UFH. The other 2 analyses found smaller reductions in DVT and pulmonary embolism (PE), and these results were not statistically significant.5, 8 Similarly, 1 analysis5 found a reduction in major bleeding events with LMWH versus UFH, whereas the other 2 studies found smaller reductions which were not statistically significant. The assessment of major bleeding is further complicated by differences in the definition of major bleeding across studies. Using a standard definition of 2 units of packed red blood cells transfused in 1 day to denote major bleeding, we found an associated reduction in bleeding with LMWH that was similar to that observed in the meta‐analyses. Moreover, patients receiving UFH were twice as likely to have a complication that resulted in stopping the prophylaxis, although these complications were overall quite rare. Lastly, there are no cost comparisons based on randomized trials. Several comparisons based on modeling have favored LMWH. One assumed that 3% of patients receiving UFH would develop HIT;13 something we did not observe. At least 3 additional analyses,1416 all funded by the manufacturer of enoxaparin, assumed that LMWH was both more effective and safer than UFH. We found that adjusted costs were similar or slightly lower with UFH than LMWH.
Our study has a number of limitations. First, its observational design makes it vulnerable to selection bias. We attempted to overcome this with rigorous multivariable adjustment, including the propensity for treatment and by using an adaptation of the instrumental variable approach. This method is of particular interest because individual hospitals were strongly predictive of choice of heparin. Still, we cannot exclude the possibility of residual confounding, especially if other outcomes, such as transfusion decisions, were also tied to specific hospital practices. Second, our study used administrative data, and therefore we could not directly adjust for certain differences which may exist between patients who received LMWH and those who received UFH. However, we did adjust for many classic risk factors for VTE. More importantly, it seems that the chance of being treated with a particular form of heparin depends more on the hospital where one receives care than on any combination of patient characteristics. Thus, apart from renal failure, for which we adjusted, it seems unlikely that there were major differences in unmeasured physiological confounders. Third, we limited our analysis to patients who received standard dosing of either type of heparin. We did this to bolster the validity of our findings, but they may not apply to unconventional dosing often observed in clinical practice. Fourth, we measured only outcomes that occurred in the hospital or that prompted a return to the hospital. VTEs which were diagnosed and treated in ambulatory care were not included. While this may have led us to underestimate the true risk of VTE, we have little reason to believe that the choice of whether to admit a patient with VTE is influenced by the original choice of VTE prophylaxis. Finally, our study was conducted before the introduction of generic LMWH, which would be expected to reduce costs associated with LMWH prophylaxis.
VTE prophylaxis for medical patients has emerged as a major focus for quality improvement initiatives. As a result, a significant proportion of general medical patients receive some form of chemoprophylaxis during their hospital stay. Small differences in efficacy or safety of different forms of prophylaxis multiplied by millions of admissions each year can have profound effects on the health of hospitalized patients. Similarly, differences in cost could also have a substantial impact on the healthcare system. We found no difference in efficacy or cost, but treatment with LMWH was less likely to be associated with subsequent transfusion of 2 or more units of packed red blood cells, a surrogate marker for bleeding. In addition, LMWH is more convenient since it can be dosed once daily, and for that reason may be more acceptable to patients. For these reasons, LMWH may be the drug of choice for inpatient prophylaxis of general medical patients. In situations where the cost of the medication itself is important, UFH represents an equally effective alternative.
Acknowledgements
All authors have contributed sufficiently to this study and have provided written permission to be named in the manuscript. No other persons have made substantial contributions to this manuscript. Michael B. Rothberg is the guarantor of the entire manuscript.
Disclosures: This study was supported by a Clinical Scientist Development Award from the Doris Duke Charitable Foundation. The funding source had no role in the study design, analysis, or interpretation of the data. Dr Rothberg served for 1 day as a consultant to Novartis Pharma about an influenza vaccine model. Sandoz, a division of Novartis, was recently granted approval to manufacture a generic form of low‐molecular‐weight heparin. None of the other authors have any conflicts of interest.
- ,,, et al.A comparison of enoxaparin with placebo for the prevention of venous thromboembolism in acutely ill medical patients. Prophylaxis in Medical Patients with Enoxaparin Study Group.N Engl J Med.1999;341:793–800.
- ,,, et al.Prevention of venous thromboembolism: American College of Chest Physicians Evidence‐Based Clinical Practice Guidelines (8th Edition).Chest.2008;133:381S–453S.
- ,,,,.Pharmacological venous thromboembolism prophylaxis in hospitalized medical patients: a meta‐analysis of randomized controlled trials.Arch Intern Med.2007;167:1476–1486.
- ,,,,.Meta‐analysis: anticoagulant prophylaxis to prevent symptomatic venous thromboembolism in hospitalized medical patients.Ann Intern Med.2007;146:278–288.
- ,,, et al.Prevention of venous thromboembolism in internal medicine with unfractionated or low‐molecular‐weight heparins: a meta‐analysis of randomised clinical trials.Thromb Haemost.2000;83:14–19.
- ,,.Risk for heparin‐induced thrombocytopenia with unfractionated and low‐molecular‐weight heparin thromboprophylaxis: a meta‐analysis.Blood.2005;106:2710–2715.
- ,.A safety analysis of thromboprophylaxis in acute medical illness.Thromb Haemost.2003;89:590–591.
- ,,,,.How complete is the evidence for thromboembolism prophylaxis in general medicine patients? A meta‐analysis of randomized controlled trials.J Hosp Med.2009;4:289–297.
- The Joint Commission on the Accreditation of Healthcare Organizations. Venous Thromboembolism (VTE) Core Measure Set. Available at: http://www.jointcommission.org/PerformanceMeasurement/PerformanceMeasurement/VTE.htm. Accessed June 1,2009.
- ,,, et al.Potentially inappropriate medication use in hospitalized elders.J Hosp Med.2008;3:91–102.
- ,,,.Comorbidity measures for use with administrative data.Med Care.1998;36:8–27.
- ,,,,,.Identification of in‐hospital complications from claims data. Is it valid?Med Care.2000;38:785–795.
- ,,,.Cost utility of substituting enoxaparin for unfractionated heparin for prophylaxis of venous thrombosis in the hospitalized medical patient.J Hosp Med.2006;1:168–176.
- ,,,.Cost effectiveness of thromboprophylaxis with a low‐molecular‐weight heparin versus unfractionated heparin in acutely ill medical inpatients.Am J Manag Care.2004;10:632–642.
- ,,,.Comparison of the two‐year outcomes and costs of prophylaxis in medical patients at risk of venous thromboembolism.Thromb Haemost.2008;100:810–820.
- ,,, et al.Cost effectiveness of enoxaparin as prophylaxis against venous thromboembolic complications in acutely ill medical inpatients: modelling study from the hospital perspective in Germany.Pharmacoeconomics.2006;24:571–591.
- ,,, et al.A comparison of enoxaparin with placebo for the prevention of venous thromboembolism in acutely ill medical patients. Prophylaxis in Medical Patients with Enoxaparin Study Group.N Engl J Med.1999;341:793–800.
- ,,, et al.Prevention of venous thromboembolism: American College of Chest Physicians Evidence‐Based Clinical Practice Guidelines (8th Edition).Chest.2008;133:381S–453S.
- ,,,,.Pharmacological venous thromboembolism prophylaxis in hospitalized medical patients: a meta‐analysis of randomized controlled trials.Arch Intern Med.2007;167:1476–1486.
- ,,,,.Meta‐analysis: anticoagulant prophylaxis to prevent symptomatic venous thromboembolism in hospitalized medical patients.Ann Intern Med.2007;146:278–288.
- ,,, et al.Prevention of venous thromboembolism in internal medicine with unfractionated or low‐molecular‐weight heparins: a meta‐analysis of randomised clinical trials.Thromb Haemost.2000;83:14–19.
- ,,.Risk for heparin‐induced thrombocytopenia with unfractionated and low‐molecular‐weight heparin thromboprophylaxis: a meta‐analysis.Blood.2005;106:2710–2715.
- ,.A safety analysis of thromboprophylaxis in acute medical illness.Thromb Haemost.2003;89:590–591.
- ,,,,.How complete is the evidence for thromboembolism prophylaxis in general medicine patients? A meta‐analysis of randomized controlled trials.J Hosp Med.2009;4:289–297.
- The Joint Commission on the Accreditation of Healthcare Organizations. Venous Thromboembolism (VTE) Core Measure Set. Available at: http://www.jointcommission.org/PerformanceMeasurement/PerformanceMeasurement/VTE.htm. Accessed June 1,2009.
- ,,, et al.Potentially inappropriate medication use in hospitalized elders.J Hosp Med.2008;3:91–102.
- ,,,.Comorbidity measures for use with administrative data.Med Care.1998;36:8–27.
- ,,,,,.Identification of in‐hospital complications from claims data. Is it valid?Med Care.2000;38:785–795.
- ,,,.Cost utility of substituting enoxaparin for unfractionated heparin for prophylaxis of venous thrombosis in the hospitalized medical patient.J Hosp Med.2006;1:168–176.
- ,,,.Cost effectiveness of thromboprophylaxis with a low‐molecular‐weight heparin versus unfractionated heparin in acutely ill medical inpatients.Am J Manag Care.2004;10:632–642.
- ,,,.Comparison of the two‐year outcomes and costs of prophylaxis in medical patients at risk of venous thromboembolism.Thromb Haemost.2008;100:810–820.
- ,,, et al.Cost effectiveness of enoxaparin as prophylaxis against venous thromboembolic complications in acutely ill medical inpatients: modelling study from the hospital perspective in Germany.Pharmacoeconomics.2006;24:571–591.
Copyright © 2012 Society of Hospital Medicine
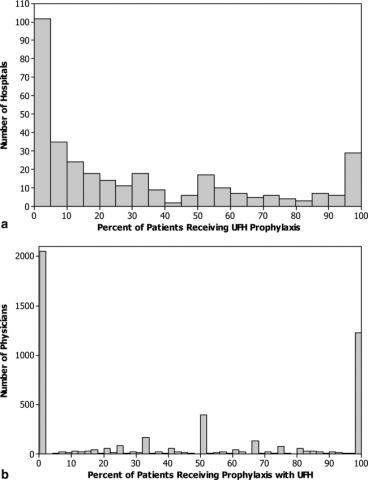
Predictors of Medication Adherence
In the outpatient setting, medication adherence (defined as percentage of prescribed medication doses taken by a patient during a specific time period) ranges between 40% and 80% for chronic conditions.1 During acute care hospitalization, changes are often made to patients' medication regimens, which can be confusing and contribute to nonadherence, medication errors, and harmful adverse events.2 Indeed, it is estimated that almost half of patients encounter a medication error after discharge, and approximately 12%17% experience an adverse drug event after returning home.36 It is likely that some of these adverse events may be the result of medication nonadherence.7 Improved patientprovider communication, systems to reconcile prehospitalization and posthospitalization medications, as well as development of mechanisms to enhance adherence, may prevent many of these errors and have become new targets for quality improvement.4, 8 Although postdischarge medication adherence is a crucial target for avoiding adverse events and rehospitalization, few studies have focused on understanding its incidence and predictors, in particular, patient demographic factors such as age and insurance status.911
In addition, few studies have looked at general and posthospital adherence in a population where health literacy is measured, an important area because medication changes during hospitalization may be particularly confusing for patients with low health literacy.11, 12 Health literacy is defined as the degree to which an individual has the capacity to obtain, process, and understand basic health information and services needed to make appropriate health decisions.13 Prior outpatient research shows that low health literacy is associated with poor patient understanding of the medication regimen and instructions for medication use, which may contribute to postdischarge medication nonadherence.14, 15 Understanding the factors associated with postdischarge medication adherence could help refine interventions that are oriented toward improving transitions in care, patient safety, and reducing unnecessary rehospitalization.
We report here on factors associated with postdischarge medication adherence using data from the Pharmacist Intervention for Low Literacy in Cardiovascular Disease (PILL‐CVD) study.16
METHODS
Study and Participants
PILL‐CVD was a federally funded, 2‐site randomized controlled trial using pharmacist‐assisted medication reconciliation, inpatient pharmacist counseling, low‐literacy adherence aids, and telephone follow‐up that aimed to decrease rates of serious medication errors after hospital discharge.16 The study targeted patients with cardiovascular disease (hospitalized on cardiology or general medical or geriatric services for acute coronary syndromes [ACS] or acute decompensated heart failure [ADHF]) at 2 large academic hospitals, Brigham and Women's Hospital (BWH) and Vanderbilt University Hospital (VUH).
Subjects were eligible for enrollment if they met criteria for ACS or ADHF, were likely to be discharged to home as determined by the primary medical team at the time of study enrollment, and took primary responsibility for administering their medications prior to admission (caregivers could be involved in medication management after discharge). Exclusion criteria included severe visual or hearing impairment, inability to communicate in English or Spanish, active psychiatric illness, dementia, delirium, illness too severe to participate, lack of a home phone number, being in police custody, or participation in another intensive medication adherence program (eg, due to renal transplant).
Out of 6416 patients originally screened for possible enrollment, 862 were randomly assigned to receive usual care or usual care plus the intervention, and 851 remained in the study.16 Both the main study and this secondary data analysis were approved by the Institutional Review Boards of each site.
Baseline Measures
Following informed consent and study enrollment, a variety of baseline data were collected on study participants from medical records and patient interview, including primary language, demographic information (age, race, insurance status, income, and education level), cognition (through administration of the 05‐point MiniCog scale),17 and level of health literacy (through use of the 036‐point short form of the Test of Functional Health Literacy in Adults [s‐TOFHLA] scale).18 Baseline information was also collected on medication use, including number of preadmission medications, measurement of self‐reported adherence prior to admission (using the Morisky scale, a validated 04‐point questionnaire shown to correlate with disease control and indicative of general patterns of adherence),19 and a medication understanding score, adapted from other instruments, which quantifies understanding of the indication, dose, and frequency of up to 5 randomly selected preadmission medications on a 03‐point scale.16, 20, 21
Outcome Measures
Outcomes were collected 30 days postdischarge through a structured questionnaire, administered by telephone. Only patients who completed this call are included in the present analysis. Postdischarge medication adherence was assessed by asking patients to report the number of days out of the previous week they had taken each medication from their postdischarge regimen exactly as prescribed.22 A score was calculated for each medication as the proportion of adherent days (eg, if a patient reported missing 2 days of a medication in the previous week, then adherence would be 5/7 or 71%). A global postdischarge adherence score was then derived for each patient by averaging the adherence score for all regularly scheduled medications. This quantitative measure focused on adherence to medications patients knew they should be taking and did not measure medication discrepancies (sometimes termed unintentional nonadherence).
Analysis
Patient characteristics were summarized and reported using simple descriptive statistics. Candidate predictors of postdischarge medication adherence were chosen a priori from patient characteristics assessed during hospital admission. These included patient age, gender, race, ethnicity, marital status, insurance, years of education, presence of primary care physician (PCP), study site, number of preadmission medications, medication understanding, baseline adherence, cognition, and health literacy. Unadjusted results were calculated using univariable linear regression, with each patient's adherence score as the dependent variable and each predictor as the independent variable. Adjusted results were then derived using multivariable linear regression with all the candidate predictors in the model.
Lastly, because of missing data for some predictors, in particular baseline adherence and medication understanding, multiple imputation techniques were used to impute missing data and increase statistical power.23 We used the Markov Chain Monte Carlo (MCMC) method for multiple imputation, which generally assumes that the data came from a normal distribution and that the missing data are missing at random. Because of the essentially normal distribution of the data, and because the amount of missing data was so small (<1% for almost all variables, 5% for baseline adherence, and 8% for medication understanding), we expected little bias and present the complete case analysis, which maximized statistical power.
Two‐sided P values <0.05 were considered significant, and SAS version 9.2 (Cary, NC) was used for all analyses.
RESULTS
Table 1 shows descriptive baseline patient characteristics of study sample (responders) as well as nonresponders at 30 days. For the responders, the mean age of the 646 patients was 61.2 years, 94.7% were insured, and 19.3% had inadequate or marginal health literacy. Patients were prescribed an average of 8 preadmission medications. Most patients (92.3%) had a regular PCP prior to admission. Nonresponders had nonsignificant trends towards having lower health literacy, medication understanding, and baseline medication adherence.
| Characteristic | Total N, 30‐Day Respondents | Value | Total N, Nonrespondents | Value |
|---|---|---|---|---|
| ||||
| Age, mean in yr (SD) | 646 | 61.2 (13.5) | 45 | 55.4 (14.3) |
| Gender, N (percentage) | 646 | 45 | ||
| Female | 272 (42.1) | 18 (40.0) | ||
| Male | 374 (57.9) | 27 (60.0) | ||
| Race, N (percentage) | 643 | 45 | ||
| White | 511 (79.5) | 32 (71.1) | ||
| Black | 104 (16.2) | 11 (24.4) | ||
| Other | 28 (4.4) | 2 (4.4) | ||
| Ethnicity, N (percentage) | 639 | 45 | ||
| Hispanic | 24 (3.8) | 1 (2.2) | ||
| Not Hispanic | 615 (96.2) | 44 (97.8) | ||
| Marital status, N (percentage) | 646 | 45 | ||
| Married/cohabitate | 382 (59.1) | 20 (44.4) | ||
| Separated/divorced | 118 (18.3) | 11 (24.4) | ||
| Widowed | 81 (12.5) | 5 (11.1) | ||
| Never married | 65 (10.1) | 9 (2.0) | ||
| Insurance type, N (percentage) | 646 | 45 | ||
| Medicaid | 53 (8.2) | 5 (11.1) | ||
| Medicare | 270 (41.8) | 13 (28.9) | ||
| Private | 289 (44.7) | 19 (42.2) | ||
| Self‐pay | 34 (5.3) | 8 (17.8) | ||
| Years of education, mean in yr (SD) | 643 | 14.0 (3.1) | 45 | 13.3 (2.7) |
| Presence of PCP prior to admission, N (percentage) | 646 | 45 | ||
| Yes | 596 (92.3) | 38 (84.4) | ||
| No | 50 (7.74) | 7 (15.6) | ||
| Site, N (percentage) | 646 | 45 | ||
| Site 1 | 358 (55.4) | 8 (17.8) | ||
| Site 2 | 288 (44.6) | 37 (82.2) | ||
| No. of preadmission medications, mean no. (SD) | 641 | 7.8 (4.8) | 45 | 7.7 (5.4) |
| Medication understanding score, mean (SD)* | 597 | 2.4 (0.5) | 40 | 2.2 (0.62) |
| Health literacy (s‐TOFHLA) score, mean (SD) | 642 | 29.1 (8.9) | 45 | 26.0 (12.0) |
| Baseline adherence (SD) | 613 | 2.7 (1.1) | 45 | 2.4 (1.2) |
| MiniCog score, N (percentage) | 646 | 45 | ||
| Demented | 63 (9.8) | 5 (11.1) | ||
| Not demented | 583 (90.2) | 40 (88.9) | ||
The average postdischarge adherence score was 95% (standard deviation [SD] = 10.2%), and less than 10% of patients had an adherence score of less than 85%; overall the distribution was left‐skewed. Table 2 illustrates crude and adjusted parameter estimates for variables in the model. Table 3 shows significant findings in the fully adjusted model, which used multiple imputation techniques to account for missing data.
| Predictor | Crude Parameter Estimate (Beta) With 95% Confidence Intervals | P Value | Adjusted Parameter Estimate (Beta) With 95% Confidence Intervals | P Value |
|---|---|---|---|---|
| ||||
| Age per 10 yr | 0.010 (0.007, 0.020) | <0.0001 | 0.010 (0.002, 0.020) | 0.018 |
| Male gender | 0.012 (0.004, 0.028) | 0.137 | 0.003 (0.014, 0.020) | 0.727 |
| Race/ethnicity | ||||
| White | 0.011 (0.009, 0.031) | 0.266 | Ref | Ref |
| Black | 0.017 (0.038, 0.005) | 0.13 | 0.006 (0.017, 0.030) | 0.598 |
| Other | 0.010 (0.029, 0.049) | 0.599 | 0.017 (0.027, 0.062) | 0.446 |
| Hispanic/Latino | 0.005 (0.037, 0.047) | 0.803 | 0.036 (0.013, 0.085) | 0.149 |
| Marital status | ||||
| Married/cohabitate | 0.006 (0.011, 0.022) | 0.500 | Ref | Ref |
| Separated/divorced | 0.005 (0.025, 0.016) | 0.664 | 0.009 (0.014, 0.031) | 0.446 |
| Widowed | 0.001 (0.023, 0.025) | 0.922 | 0.013 (0.039, 0.013) | 0.338 |
| Never married | 0.009 (0.035, 0.018) | 0.515 | 0.004 (0.033, 0.025) | 0.784 |
| Insurance type | ||||
| Private | 0.008 (0.008, 0.024) | 0.347 | Ref | Ref |
| Medicaid | 0.046 (0.075, 0.018) | 0.002 | 0.026 (0.058, 0.007) | 0.121 |
| Medicare | 0.012 (0.004, 0.028) | 0.138 | 0.002 (0.023, 0.018) | 0.844 |
| Self‐pay | 0.027 (0.062, 0.008) | 0.135 | 0.029 (0.073, 0.015) | 0.202 |
| Years of education | 0.003 (0.0003, 0.005) | 0.028 | 0.0001 (0.003, 0.003) | 0.949 |
| Presence of PCP prior to admission | 0.007 (0.022, 0.037) | 0.630 | 0.002 (0.032, 0.036) | 0.888 |
| Site | 0.050 (0.065, 0.034) | <0.0001 | 0.038 (0.056, 0.021) | <0.0001 |
| No. of preadmission medications | 0.0003 (0.002, 0.001) | 0.684 | 0.0001 (0.002, 0.002) | 0.918 |
| Medication understanding score per point | 0.007 (0.009, 0.023) | 0.390 | 0.006 (0.011, 0.023) | 0.513 |
| Health literacy (s‐TOFHLA) score per 10 points | 0.0006 (0.008, 0.01) | 0.897 | 0.003 (0.008, 0.01) | 0.644 |
| Baseline adherence per point | 0.023 (0.016, 0.031) | <0.0001 | 0.017 (0.009, 0.024) | <0.0001 |
| Cognitive function | 0.004 (0.022, 0.031) | 0.757 | 0.008 (0.019, 0.036) | 0.549 |
| Predictor | Parameter Estimate (Beta) With 95% Confidence Intervals | P Value |
|---|---|---|
| ||
| Age per 10 yr | 0.010 (0.004, 0.020) | 0.004 |
| Insurance type | ||
| Private | Ref | Ref |
| Medicaid | 0.045 (0.076, 0.014) | 0.005 |
| Medicare | 0.010 (0.030, 0.010) | 0.333 |
| Self‐pay | 0.013 (0.050, 0.025) | 0.512 |
| Site | 0.036 (0.053, 0.019) | <0.0001 |
| Baseline adherence per point | 0.016 (0.008, 0.024) | <0.0001 |
Intervention arm was of borderline statistical significance in predicting postdischarge adherence (P = 0.052), and so was removed from the final model. Study site, age, insurance, and baseline adherence were the only significant independent predictors of postdischarge adherence in the fully adjusted model (Table 3). For example, for every 10‐year increase in age, patients had, on average, an adjusted 1% absolute increase in their adherence score (95% confidence interval [CI] 0.4% to 2.0%). For every 1‐point increase in baseline medication adherence (based on the Morisky scale), there was a 1.6% absolute increase in medication adherence (95% CI 0.8% to 2.4%). In unadjusted analyses, patients with Medicaid were less adherent with medications after discharge than were patients with private insurance. This difference became nonsignificant in adjusted analyses, but when analyses were repeated using multiple imputation techniques, the results again became statistically significantMedicaid insurance was associated with a 4.5% absolute decrease in postdischarge adherence compared with private insurance (95% CI 7.6% to 1.4%). Study site (specifically, Brigham and Women's Hospital) was also a significant predictor of greater postdischarge medication adherence. Years of education was a significant predictor of adherence in unadjusted analyses, but was not an independent predictor when adjusted for other factors. When baseline adherence was removed from the multiple imputation model, there were no changes in which factors were significant predictors of adherence.
DISCUSSION
In this study, we found that low baseline adherence, younger age, Medicaid insurance, and study site were significant predictors of lower 30‐day medication adherence. Of particular interest is our finding regarding baseline adherence, a simple measure to obtain on hospitalized patients. It is notable that in our study, education was not an independent significant predictor of postdischarge adherence, even when baseline adherence was removed from the model. The same is true for medication understanding, cognitive function, and health literacy.
Older patients appeared more adherent with medications in the month after hospital discharge, perhaps reflecting increased interaction with the healthcare system (appointments, number of physician interactions), a greater belief in the importance of chronic medication management, or a higher level of experience with managing medications. A similar relationship between age and adherence has been shown in outpatient studies of patients with hypertension, diabetes, and other chronic diseases.2427
Medicaid patients may be less likely to remain adherent because of the plan's limited coverage of medications relative to patients' ability to pay. For example, Medicaid in Tennessee covers the first 5 generic medications at no cost to the patient but has co‐payments for additional medications and for brand name drugs. Medicaid in Massachusetts has co‐payments of $1 to $3 for each medication. Alternatively, Medicaid insurance may be a marker for other patient characteristics associated with low adherence for which we were not fully able to adjust.
Site differences were also notable in this study; these differences could have been due to differences in insurance coverage in Tennessee versus Massachusetts (which has near‐universal coverage), differences in types of insurance (eg, fewer patients at Brigham and Women's Hospital had Medicaid than at Vanderbilt), cultural and geographic differences between the 2 locations, or other differences in transitional care between the 2 sites.
This study corroborates previous literature on medication adherence (specifically unintentional nonadherence) in the outpatient setting,4, 811 for example, on the association of younger age with low adherence in certain populations. On the other hand, it may contrast with previous literature which has sometimes shown a relationship between patient education or health literacy and medication adherence.14, 15, 2835 However, previous studies have not focused on the transition from inpatient to outpatient settings. Perhaps intensive medication education in the hospital, even under usual care, mitigates the effects of these factors on postdischarge adherence. Finally, baseline adherence seems to correlate with postdischarge adherence, a finding which makes intuitive sense and has been previously reported for specific medications.36
There are several limitations to this study. Although large, the study was performed at only 2 clinical sites where most patients were white and fairly well‐educated, perhaps because patients admitted to a tertiary care center with ACS or ADHF are more affluent than general medical inpatients as a whole; this may limit generalizability. Postdischarge medication adherence might have been higher than in other patient populations given the nature of the population, possible loss‐to‐follow‐up bias, and the fact that half of the subjects received an intervention designed to improve medication management after discharge; such low rates of nonadherence in our study may have reduced our ability to detect important predictors in our models. In addition, the period of follow‐up was 30 days, thus limiting our findings to short‐term postdischarge medication adherence. Postdischarge medication adherence was based on patient self‐report, which not only assumed that the patient was still managing his/her own medications after discharge, but may also be susceptible to both recall and social acceptability bias, which might overestimate our adherence scores, again limiting our ability to detect important predictors of nonadherence. However, other studies have shown a good correlation between self‐reported medication adherence and other more objective measures,37, 38 and recall was only for 7 days, a measure used previously in the literature39, 40 and one designed to reduce recall bias. Systematic underreporting in certain patient populations is less likely but possible.
In the future, research should focus on targeting patients who have low baseline adherence to evaluate the effects of various interventions on postdischarge medication outcomes. Repeating the study in a population with a high prevalence of low health literacy might be illuminating, given that previous studies have shown that patients with low health literacy have less ability to identify their medications and have less refill adherence.29, 30
In conclusion, in patients hospitalized with cardiovascular disease, predictors of lower postdischarge adherence include younger age, Medicaid insurance, and low baseline adherence. It may be prudent to assess baseline adherence and insurance type in hospitalized patients in order to identify those who may benefit from additional assistance to improve medication adherence and medication safety during transitions in care.
Acknowledgements
Meeting Presentations: SGIM New England Regional Meeting, oral presentation, Boston, MA, March 4, 2011; and SGIM National Meeting, poster presentation, Phoenix, AZ, May 6, 2011. Dr Schnipper had full access to all of the data in the study and takes responsibility for the integrity of the data and the accuracy of the data analysis.
Disclosures: Financial support was provided by R01 HL089755 (NHLBI, Kripalani), K23 HL077597 (NHLBI, Kripalani), K08 HL072806 (NHLBI, Schnipper), T32HP10251‐02 (Cohen), and by the Division of General Medicine, Massachusetts General Hospital and the Harvard Medical School Fellowship in General Medicine and Primary Care (Cohen). Dr Kripalani is a consultant to and holds equity in PictureRx, LLC, which makes patient education tools to improve medication management. PictureRx did not provide materials or funding for this study. All other authors disclose no relevant or financial conflicts of interest.
- ,.Adherence to medication.N Engl J Med.2005;353(5):487–497.
- ,,,.Posthospital medication discrepancies: prevalence and contributing factors.Arch Intern Med.2005;165(16):1842–1847.
- ,.Medication use in the transition from hospital to home.Ann Acad Med Singapore.2008;37(2):136–141.
- ,,,.Medical errors related to discontinuity of care from an inpatient to an outpatient setting.J Gen Intern Med.2003;18(8):646–651.
- ,,,,.The incidence and severity of adverse events affecting patients after discharge from the hospital.Ann Intern Med.2003;138(3):161–167.
- ,,,,.Adverse drug events occurring following hospital discharge.J Gen Intern Med.2005;20(4):317–323.
- ,,, et al.Role of pharmacist counseling in preventing adverse drug events after hospitalization.Arch Intern Med.2006;166(5):565–571.
- ,,.Reconcilable differences: correcting medication errors at hospital admission and discharge.Qual Saf Health Care.2006;15(2):122–126.
- ,.Risk of rehospitalization among bipolar disorder patients who are nonadherent to antipsychotic therapy after hospital discharge.Am J Health Syst Pharm.2009;66(4):358–365.
- ,,,,.Continuity and adherence to long‐term drug treatment by geriatric patients after hospital discharge: a prospective cohort study.Drugs Aging.2008;25(10):861–870.
- ,,,.Medication use among inner‐city patients after hospital discharge: patient‐reported barriers and solutions.Mayo Clin Proc.2008;83(5):529–535.
- ,,,,,.Relationship of health literacy to intentional and unintentional non‐adherence of hospital discharge medications.J Gen Intern Med.2012;27(2):173–178.
- Office of Disease Prevention and Health Promotion, US Department of Health and Human Services.Healthy People 2010. Available at: http://www.healthypeople.gov/Document/pdf/uih/2010uih.pdf. Accessed February 15,2012.
- ,,, et al.Literacy and misunderstanding prescription drug labels.Ann Intern Med.2006;145(12):887–894.
- ,,,,,.Predictors of medication self‐management skill in a low‐literacy population.J Gen Intern Med.2006;21(8):852–856.
- ,,, et al;for the PILL‐CVD Study Group.Rationale and design of the Pharmacist Intervention for Low Literacy in Cardiovascular Disease (PILL‐CVD) study.Circ Cardiovasc Qual Outcomes.2010;3(2):212–219.
- ,,,,.Simplifying detection of cognitive impairment: comparison of the Mini‐Cog and Mini‐Mental State Examination in a multiethnic sample.J Am Geriatr Soc.2005;53(5):871–874.
- .Short Test of Functional Health Literacy in Adults.Snow Camp, NC:Peppercorn Books and Press;1998.
- ,,,.Predictive validity of a medication adherence measure in an outpatient setting.J Clin Hypertens (Greenwich).2008;10(5):348–354.
- ,,,,,.Health literacy and medication understanding among hospitalized adults.J Hosp Med. In press.
- ,,,,,.Health literacy and medication understanding among hospitalized adults.J Hosp Med.2011;6(9):488–493.
- ,,.The summary of diabetes self‐care activities measure: results from 7 studies and a revised scale.Diabetes Care.2000;23(7):943–950.
- .Multiple Imputation for Nonresponse in Surveys.New York, NY:John Wiley 1987.
- ,,, et al.Medication adherence in HIV‐infected adults: effect of patient age, cognitive status, and substance abuse.AIDS.2004;18(suppl 1):S19–S25.
- ,,.Factors associated with antihypertensive drug compliance in 83,884 Chinese patients: a cohort study.J Epidemiol Community Health.2010;64(10):895–901.
- ,,,,,.Adherence to oral hypoglycemic agents in 26,782 Chinese patients: a cohort study.J Clin Pharmacol.2011;51(10):1474–1482.
- ,,,,.Effect of a pharmacy‐based health literacy intervention and patient characteristics on medication refill adherence in an urban health system.Ann Pharmacother.2010;44(1):80–87.
- ,,.Adherence to combination antiretroviral therapies in HIV patients of low health literacy.J Gen Intern Med.1999;14(5):267–273.
- ,,,,,.Factors associated with medication refill adherence in cardiovascular‐related diseases: a focus on health literacy.J Gen Intern Med.2006;21(12):1215–1221.
- ,,,,.Limited health literacy is a barrier to medication reconciliation in ambulatory care.J Gen Intern Med.2007;22(11):1523–1526.
- ,,,,.The impact of low health literacy on surgical practice.Am J Surg.2004;188(3):250–253.
- ,,,,.Relationships between beliefs about medications and adherence.Am J Health Syst Pharm.2009;66(7):657–664.
- ,,,.Health literacy and anticoagulation‐related outcomes among patients taking warfarin.J Gen Intern Med.2006;21(8):841–846.
- ,,,,,.Health literacy, antiretroviral adherence, and HIV‐RNA suppression: a longitudinal perspective.J Gen Intern Med.2006;21(8):835–840.
- ,,, et al.Risk factors for nonadherence to warfarin: results from the IN‐RANGE study.Pharmacoepidemiol Drug Saf.2008;17(9):853–860.
- ,,, et al.Predictors of low clopidogrel adherence following percutaneous coronary intervention.Am J Cardiol.2011;108(6):822–827.
- ,,,,,.Correlation between adherence rates measured by MEMS and self‐reported questionnaires: a meta‐analysis.Health Qual Life Outcomes.2010;8:99.
- ,,,,,.Concordance of adherence measurement using self‐reported adherence questionnaires and medication monitoring devices.Pharmacoeconomics.2010;28(12):1097–1107.
- ,,,.Polypharmacy and medication adherence in patients with type 2 diabetes.Diabetes Care.2003;26(5):1408–1412.
- ,,,.Improving adherence and reducing medication discrepancies in patients with diabetes.Ann Pharmacother.2003;37(7–8):962–969.
In the outpatient setting, medication adherence (defined as percentage of prescribed medication doses taken by a patient during a specific time period) ranges between 40% and 80% for chronic conditions.1 During acute care hospitalization, changes are often made to patients' medication regimens, which can be confusing and contribute to nonadherence, medication errors, and harmful adverse events.2 Indeed, it is estimated that almost half of patients encounter a medication error after discharge, and approximately 12%17% experience an adverse drug event after returning home.36 It is likely that some of these adverse events may be the result of medication nonadherence.7 Improved patientprovider communication, systems to reconcile prehospitalization and posthospitalization medications, as well as development of mechanisms to enhance adherence, may prevent many of these errors and have become new targets for quality improvement.4, 8 Although postdischarge medication adherence is a crucial target for avoiding adverse events and rehospitalization, few studies have focused on understanding its incidence and predictors, in particular, patient demographic factors such as age and insurance status.911
In addition, few studies have looked at general and posthospital adherence in a population where health literacy is measured, an important area because medication changes during hospitalization may be particularly confusing for patients with low health literacy.11, 12 Health literacy is defined as the degree to which an individual has the capacity to obtain, process, and understand basic health information and services needed to make appropriate health decisions.13 Prior outpatient research shows that low health literacy is associated with poor patient understanding of the medication regimen and instructions for medication use, which may contribute to postdischarge medication nonadherence.14, 15 Understanding the factors associated with postdischarge medication adherence could help refine interventions that are oriented toward improving transitions in care, patient safety, and reducing unnecessary rehospitalization.
We report here on factors associated with postdischarge medication adherence using data from the Pharmacist Intervention for Low Literacy in Cardiovascular Disease (PILL‐CVD) study.16
METHODS
Study and Participants
PILL‐CVD was a federally funded, 2‐site randomized controlled trial using pharmacist‐assisted medication reconciliation, inpatient pharmacist counseling, low‐literacy adherence aids, and telephone follow‐up that aimed to decrease rates of serious medication errors after hospital discharge.16 The study targeted patients with cardiovascular disease (hospitalized on cardiology or general medical or geriatric services for acute coronary syndromes [ACS] or acute decompensated heart failure [ADHF]) at 2 large academic hospitals, Brigham and Women's Hospital (BWH) and Vanderbilt University Hospital (VUH).
Subjects were eligible for enrollment if they met criteria for ACS or ADHF, were likely to be discharged to home as determined by the primary medical team at the time of study enrollment, and took primary responsibility for administering their medications prior to admission (caregivers could be involved in medication management after discharge). Exclusion criteria included severe visual or hearing impairment, inability to communicate in English or Spanish, active psychiatric illness, dementia, delirium, illness too severe to participate, lack of a home phone number, being in police custody, or participation in another intensive medication adherence program (eg, due to renal transplant).
Out of 6416 patients originally screened for possible enrollment, 862 were randomly assigned to receive usual care or usual care plus the intervention, and 851 remained in the study.16 Both the main study and this secondary data analysis were approved by the Institutional Review Boards of each site.
Baseline Measures
Following informed consent and study enrollment, a variety of baseline data were collected on study participants from medical records and patient interview, including primary language, demographic information (age, race, insurance status, income, and education level), cognition (through administration of the 05‐point MiniCog scale),17 and level of health literacy (through use of the 036‐point short form of the Test of Functional Health Literacy in Adults [s‐TOFHLA] scale).18 Baseline information was also collected on medication use, including number of preadmission medications, measurement of self‐reported adherence prior to admission (using the Morisky scale, a validated 04‐point questionnaire shown to correlate with disease control and indicative of general patterns of adherence),19 and a medication understanding score, adapted from other instruments, which quantifies understanding of the indication, dose, and frequency of up to 5 randomly selected preadmission medications on a 03‐point scale.16, 20, 21
Outcome Measures
Outcomes were collected 30 days postdischarge through a structured questionnaire, administered by telephone. Only patients who completed this call are included in the present analysis. Postdischarge medication adherence was assessed by asking patients to report the number of days out of the previous week they had taken each medication from their postdischarge regimen exactly as prescribed.22 A score was calculated for each medication as the proportion of adherent days (eg, if a patient reported missing 2 days of a medication in the previous week, then adherence would be 5/7 or 71%). A global postdischarge adherence score was then derived for each patient by averaging the adherence score for all regularly scheduled medications. This quantitative measure focused on adherence to medications patients knew they should be taking and did not measure medication discrepancies (sometimes termed unintentional nonadherence).
Analysis
Patient characteristics were summarized and reported using simple descriptive statistics. Candidate predictors of postdischarge medication adherence were chosen a priori from patient characteristics assessed during hospital admission. These included patient age, gender, race, ethnicity, marital status, insurance, years of education, presence of primary care physician (PCP), study site, number of preadmission medications, medication understanding, baseline adherence, cognition, and health literacy. Unadjusted results were calculated using univariable linear regression, with each patient's adherence score as the dependent variable and each predictor as the independent variable. Adjusted results were then derived using multivariable linear regression with all the candidate predictors in the model.
Lastly, because of missing data for some predictors, in particular baseline adherence and medication understanding, multiple imputation techniques were used to impute missing data and increase statistical power.23 We used the Markov Chain Monte Carlo (MCMC) method for multiple imputation, which generally assumes that the data came from a normal distribution and that the missing data are missing at random. Because of the essentially normal distribution of the data, and because the amount of missing data was so small (<1% for almost all variables, 5% for baseline adherence, and 8% for medication understanding), we expected little bias and present the complete case analysis, which maximized statistical power.
Two‐sided P values <0.05 were considered significant, and SAS version 9.2 (Cary, NC) was used for all analyses.
RESULTS
Table 1 shows descriptive baseline patient characteristics of study sample (responders) as well as nonresponders at 30 days. For the responders, the mean age of the 646 patients was 61.2 years, 94.7% were insured, and 19.3% had inadequate or marginal health literacy. Patients were prescribed an average of 8 preadmission medications. Most patients (92.3%) had a regular PCP prior to admission. Nonresponders had nonsignificant trends towards having lower health literacy, medication understanding, and baseline medication adherence.
| Characteristic | Total N, 30‐Day Respondents | Value | Total N, Nonrespondents | Value |
|---|---|---|---|---|
| ||||
| Age, mean in yr (SD) | 646 | 61.2 (13.5) | 45 | 55.4 (14.3) |
| Gender, N (percentage) | 646 | 45 | ||
| Female | 272 (42.1) | 18 (40.0) | ||
| Male | 374 (57.9) | 27 (60.0) | ||
| Race, N (percentage) | 643 | 45 | ||
| White | 511 (79.5) | 32 (71.1) | ||
| Black | 104 (16.2) | 11 (24.4) | ||
| Other | 28 (4.4) | 2 (4.4) | ||
| Ethnicity, N (percentage) | 639 | 45 | ||
| Hispanic | 24 (3.8) | 1 (2.2) | ||
| Not Hispanic | 615 (96.2) | 44 (97.8) | ||
| Marital status, N (percentage) | 646 | 45 | ||
| Married/cohabitate | 382 (59.1) | 20 (44.4) | ||
| Separated/divorced | 118 (18.3) | 11 (24.4) | ||
| Widowed | 81 (12.5) | 5 (11.1) | ||
| Never married | 65 (10.1) | 9 (2.0) | ||
| Insurance type, N (percentage) | 646 | 45 | ||
| Medicaid | 53 (8.2) | 5 (11.1) | ||
| Medicare | 270 (41.8) | 13 (28.9) | ||
| Private | 289 (44.7) | 19 (42.2) | ||
| Self‐pay | 34 (5.3) | 8 (17.8) | ||
| Years of education, mean in yr (SD) | 643 | 14.0 (3.1) | 45 | 13.3 (2.7) |
| Presence of PCP prior to admission, N (percentage) | 646 | 45 | ||
| Yes | 596 (92.3) | 38 (84.4) | ||
| No | 50 (7.74) | 7 (15.6) | ||
| Site, N (percentage) | 646 | 45 | ||
| Site 1 | 358 (55.4) | 8 (17.8) | ||
| Site 2 | 288 (44.6) | 37 (82.2) | ||
| No. of preadmission medications, mean no. (SD) | 641 | 7.8 (4.8) | 45 | 7.7 (5.4) |
| Medication understanding score, mean (SD)* | 597 | 2.4 (0.5) | 40 | 2.2 (0.62) |
| Health literacy (s‐TOFHLA) score, mean (SD) | 642 | 29.1 (8.9) | 45 | 26.0 (12.0) |
| Baseline adherence (SD) | 613 | 2.7 (1.1) | 45 | 2.4 (1.2) |
| MiniCog score, N (percentage) | 646 | 45 | ||
| Demented | 63 (9.8) | 5 (11.1) | ||
| Not demented | 583 (90.2) | 40 (88.9) | ||
The average postdischarge adherence score was 95% (standard deviation [SD] = 10.2%), and less than 10% of patients had an adherence score of less than 85%; overall the distribution was left‐skewed. Table 2 illustrates crude and adjusted parameter estimates for variables in the model. Table 3 shows significant findings in the fully adjusted model, which used multiple imputation techniques to account for missing data.
| Predictor | Crude Parameter Estimate (Beta) With 95% Confidence Intervals | P Value | Adjusted Parameter Estimate (Beta) With 95% Confidence Intervals | P Value |
|---|---|---|---|---|
| ||||
| Age per 10 yr | 0.010 (0.007, 0.020) | <0.0001 | 0.010 (0.002, 0.020) | 0.018 |
| Male gender | 0.012 (0.004, 0.028) | 0.137 | 0.003 (0.014, 0.020) | 0.727 |
| Race/ethnicity | ||||
| White | 0.011 (0.009, 0.031) | 0.266 | Ref | Ref |
| Black | 0.017 (0.038, 0.005) | 0.13 | 0.006 (0.017, 0.030) | 0.598 |
| Other | 0.010 (0.029, 0.049) | 0.599 | 0.017 (0.027, 0.062) | 0.446 |
| Hispanic/Latino | 0.005 (0.037, 0.047) | 0.803 | 0.036 (0.013, 0.085) | 0.149 |
| Marital status | ||||
| Married/cohabitate | 0.006 (0.011, 0.022) | 0.500 | Ref | Ref |
| Separated/divorced | 0.005 (0.025, 0.016) | 0.664 | 0.009 (0.014, 0.031) | 0.446 |
| Widowed | 0.001 (0.023, 0.025) | 0.922 | 0.013 (0.039, 0.013) | 0.338 |
| Never married | 0.009 (0.035, 0.018) | 0.515 | 0.004 (0.033, 0.025) | 0.784 |
| Insurance type | ||||
| Private | 0.008 (0.008, 0.024) | 0.347 | Ref | Ref |
| Medicaid | 0.046 (0.075, 0.018) | 0.002 | 0.026 (0.058, 0.007) | 0.121 |
| Medicare | 0.012 (0.004, 0.028) | 0.138 | 0.002 (0.023, 0.018) | 0.844 |
| Self‐pay | 0.027 (0.062, 0.008) | 0.135 | 0.029 (0.073, 0.015) | 0.202 |
| Years of education | 0.003 (0.0003, 0.005) | 0.028 | 0.0001 (0.003, 0.003) | 0.949 |
| Presence of PCP prior to admission | 0.007 (0.022, 0.037) | 0.630 | 0.002 (0.032, 0.036) | 0.888 |
| Site | 0.050 (0.065, 0.034) | <0.0001 | 0.038 (0.056, 0.021) | <0.0001 |
| No. of preadmission medications | 0.0003 (0.002, 0.001) | 0.684 | 0.0001 (0.002, 0.002) | 0.918 |
| Medication understanding score per point | 0.007 (0.009, 0.023) | 0.390 | 0.006 (0.011, 0.023) | 0.513 |
| Health literacy (s‐TOFHLA) score per 10 points | 0.0006 (0.008, 0.01) | 0.897 | 0.003 (0.008, 0.01) | 0.644 |
| Baseline adherence per point | 0.023 (0.016, 0.031) | <0.0001 | 0.017 (0.009, 0.024) | <0.0001 |
| Cognitive function | 0.004 (0.022, 0.031) | 0.757 | 0.008 (0.019, 0.036) | 0.549 |
| Predictor | Parameter Estimate (Beta) With 95% Confidence Intervals | P Value |
|---|---|---|
| ||
| Age per 10 yr | 0.010 (0.004, 0.020) | 0.004 |
| Insurance type | ||
| Private | Ref | Ref |
| Medicaid | 0.045 (0.076, 0.014) | 0.005 |
| Medicare | 0.010 (0.030, 0.010) | 0.333 |
| Self‐pay | 0.013 (0.050, 0.025) | 0.512 |
| Site | 0.036 (0.053, 0.019) | <0.0001 |
| Baseline adherence per point | 0.016 (0.008, 0.024) | <0.0001 |
Intervention arm was of borderline statistical significance in predicting postdischarge adherence (P = 0.052), and so was removed from the final model. Study site, age, insurance, and baseline adherence were the only significant independent predictors of postdischarge adherence in the fully adjusted model (Table 3). For example, for every 10‐year increase in age, patients had, on average, an adjusted 1% absolute increase in their adherence score (95% confidence interval [CI] 0.4% to 2.0%). For every 1‐point increase in baseline medication adherence (based on the Morisky scale), there was a 1.6% absolute increase in medication adherence (95% CI 0.8% to 2.4%). In unadjusted analyses, patients with Medicaid were less adherent with medications after discharge than were patients with private insurance. This difference became nonsignificant in adjusted analyses, but when analyses were repeated using multiple imputation techniques, the results again became statistically significantMedicaid insurance was associated with a 4.5% absolute decrease in postdischarge adherence compared with private insurance (95% CI 7.6% to 1.4%). Study site (specifically, Brigham and Women's Hospital) was also a significant predictor of greater postdischarge medication adherence. Years of education was a significant predictor of adherence in unadjusted analyses, but was not an independent predictor when adjusted for other factors. When baseline adherence was removed from the multiple imputation model, there were no changes in which factors were significant predictors of adherence.
DISCUSSION
In this study, we found that low baseline adherence, younger age, Medicaid insurance, and study site were significant predictors of lower 30‐day medication adherence. Of particular interest is our finding regarding baseline adherence, a simple measure to obtain on hospitalized patients. It is notable that in our study, education was not an independent significant predictor of postdischarge adherence, even when baseline adherence was removed from the model. The same is true for medication understanding, cognitive function, and health literacy.
Older patients appeared more adherent with medications in the month after hospital discharge, perhaps reflecting increased interaction with the healthcare system (appointments, number of physician interactions), a greater belief in the importance of chronic medication management, or a higher level of experience with managing medications. A similar relationship between age and adherence has been shown in outpatient studies of patients with hypertension, diabetes, and other chronic diseases.2427
Medicaid patients may be less likely to remain adherent because of the plan's limited coverage of medications relative to patients' ability to pay. For example, Medicaid in Tennessee covers the first 5 generic medications at no cost to the patient but has co‐payments for additional medications and for brand name drugs. Medicaid in Massachusetts has co‐payments of $1 to $3 for each medication. Alternatively, Medicaid insurance may be a marker for other patient characteristics associated with low adherence for which we were not fully able to adjust.
Site differences were also notable in this study; these differences could have been due to differences in insurance coverage in Tennessee versus Massachusetts (which has near‐universal coverage), differences in types of insurance (eg, fewer patients at Brigham and Women's Hospital had Medicaid than at Vanderbilt), cultural and geographic differences between the 2 locations, or other differences in transitional care between the 2 sites.
This study corroborates previous literature on medication adherence (specifically unintentional nonadherence) in the outpatient setting,4, 811 for example, on the association of younger age with low adherence in certain populations. On the other hand, it may contrast with previous literature which has sometimes shown a relationship between patient education or health literacy and medication adherence.14, 15, 2835 However, previous studies have not focused on the transition from inpatient to outpatient settings. Perhaps intensive medication education in the hospital, even under usual care, mitigates the effects of these factors on postdischarge adherence. Finally, baseline adherence seems to correlate with postdischarge adherence, a finding which makes intuitive sense and has been previously reported for specific medications.36
There are several limitations to this study. Although large, the study was performed at only 2 clinical sites where most patients were white and fairly well‐educated, perhaps because patients admitted to a tertiary care center with ACS or ADHF are more affluent than general medical inpatients as a whole; this may limit generalizability. Postdischarge medication adherence might have been higher than in other patient populations given the nature of the population, possible loss‐to‐follow‐up bias, and the fact that half of the subjects received an intervention designed to improve medication management after discharge; such low rates of nonadherence in our study may have reduced our ability to detect important predictors in our models. In addition, the period of follow‐up was 30 days, thus limiting our findings to short‐term postdischarge medication adherence. Postdischarge medication adherence was based on patient self‐report, which not only assumed that the patient was still managing his/her own medications after discharge, but may also be susceptible to both recall and social acceptability bias, which might overestimate our adherence scores, again limiting our ability to detect important predictors of nonadherence. However, other studies have shown a good correlation between self‐reported medication adherence and other more objective measures,37, 38 and recall was only for 7 days, a measure used previously in the literature39, 40 and one designed to reduce recall bias. Systematic underreporting in certain patient populations is less likely but possible.
In the future, research should focus on targeting patients who have low baseline adherence to evaluate the effects of various interventions on postdischarge medication outcomes. Repeating the study in a population with a high prevalence of low health literacy might be illuminating, given that previous studies have shown that patients with low health literacy have less ability to identify their medications and have less refill adherence.29, 30
In conclusion, in patients hospitalized with cardiovascular disease, predictors of lower postdischarge adherence include younger age, Medicaid insurance, and low baseline adherence. It may be prudent to assess baseline adherence and insurance type in hospitalized patients in order to identify those who may benefit from additional assistance to improve medication adherence and medication safety during transitions in care.
Acknowledgements
Meeting Presentations: SGIM New England Regional Meeting, oral presentation, Boston, MA, March 4, 2011; and SGIM National Meeting, poster presentation, Phoenix, AZ, May 6, 2011. Dr Schnipper had full access to all of the data in the study and takes responsibility for the integrity of the data and the accuracy of the data analysis.
Disclosures: Financial support was provided by R01 HL089755 (NHLBI, Kripalani), K23 HL077597 (NHLBI, Kripalani), K08 HL072806 (NHLBI, Schnipper), T32HP10251‐02 (Cohen), and by the Division of General Medicine, Massachusetts General Hospital and the Harvard Medical School Fellowship in General Medicine and Primary Care (Cohen). Dr Kripalani is a consultant to and holds equity in PictureRx, LLC, which makes patient education tools to improve medication management. PictureRx did not provide materials or funding for this study. All other authors disclose no relevant or financial conflicts of interest.
In the outpatient setting, medication adherence (defined as percentage of prescribed medication doses taken by a patient during a specific time period) ranges between 40% and 80% for chronic conditions.1 During acute care hospitalization, changes are often made to patients' medication regimens, which can be confusing and contribute to nonadherence, medication errors, and harmful adverse events.2 Indeed, it is estimated that almost half of patients encounter a medication error after discharge, and approximately 12%17% experience an adverse drug event after returning home.36 It is likely that some of these adverse events may be the result of medication nonadherence.7 Improved patientprovider communication, systems to reconcile prehospitalization and posthospitalization medications, as well as development of mechanisms to enhance adherence, may prevent many of these errors and have become new targets for quality improvement.4, 8 Although postdischarge medication adherence is a crucial target for avoiding adverse events and rehospitalization, few studies have focused on understanding its incidence and predictors, in particular, patient demographic factors such as age and insurance status.911
In addition, few studies have looked at general and posthospital adherence in a population where health literacy is measured, an important area because medication changes during hospitalization may be particularly confusing for patients with low health literacy.11, 12 Health literacy is defined as the degree to which an individual has the capacity to obtain, process, and understand basic health information and services needed to make appropriate health decisions.13 Prior outpatient research shows that low health literacy is associated with poor patient understanding of the medication regimen and instructions for medication use, which may contribute to postdischarge medication nonadherence.14, 15 Understanding the factors associated with postdischarge medication adherence could help refine interventions that are oriented toward improving transitions in care, patient safety, and reducing unnecessary rehospitalization.
We report here on factors associated with postdischarge medication adherence using data from the Pharmacist Intervention for Low Literacy in Cardiovascular Disease (PILL‐CVD) study.16
METHODS
Study and Participants
PILL‐CVD was a federally funded, 2‐site randomized controlled trial using pharmacist‐assisted medication reconciliation, inpatient pharmacist counseling, low‐literacy adherence aids, and telephone follow‐up that aimed to decrease rates of serious medication errors after hospital discharge.16 The study targeted patients with cardiovascular disease (hospitalized on cardiology or general medical or geriatric services for acute coronary syndromes [ACS] or acute decompensated heart failure [ADHF]) at 2 large academic hospitals, Brigham and Women's Hospital (BWH) and Vanderbilt University Hospital (VUH).
Subjects were eligible for enrollment if they met criteria for ACS or ADHF, were likely to be discharged to home as determined by the primary medical team at the time of study enrollment, and took primary responsibility for administering their medications prior to admission (caregivers could be involved in medication management after discharge). Exclusion criteria included severe visual or hearing impairment, inability to communicate in English or Spanish, active psychiatric illness, dementia, delirium, illness too severe to participate, lack of a home phone number, being in police custody, or participation in another intensive medication adherence program (eg, due to renal transplant).
Out of 6416 patients originally screened for possible enrollment, 862 were randomly assigned to receive usual care or usual care plus the intervention, and 851 remained in the study.16 Both the main study and this secondary data analysis were approved by the Institutional Review Boards of each site.
Baseline Measures
Following informed consent and study enrollment, a variety of baseline data were collected on study participants from medical records and patient interview, including primary language, demographic information (age, race, insurance status, income, and education level), cognition (through administration of the 05‐point MiniCog scale),17 and level of health literacy (through use of the 036‐point short form of the Test of Functional Health Literacy in Adults [s‐TOFHLA] scale).18 Baseline information was also collected on medication use, including number of preadmission medications, measurement of self‐reported adherence prior to admission (using the Morisky scale, a validated 04‐point questionnaire shown to correlate with disease control and indicative of general patterns of adherence),19 and a medication understanding score, adapted from other instruments, which quantifies understanding of the indication, dose, and frequency of up to 5 randomly selected preadmission medications on a 03‐point scale.16, 20, 21
Outcome Measures
Outcomes were collected 30 days postdischarge through a structured questionnaire, administered by telephone. Only patients who completed this call are included in the present analysis. Postdischarge medication adherence was assessed by asking patients to report the number of days out of the previous week they had taken each medication from their postdischarge regimen exactly as prescribed.22 A score was calculated for each medication as the proportion of adherent days (eg, if a patient reported missing 2 days of a medication in the previous week, then adherence would be 5/7 or 71%). A global postdischarge adherence score was then derived for each patient by averaging the adherence score for all regularly scheduled medications. This quantitative measure focused on adherence to medications patients knew they should be taking and did not measure medication discrepancies (sometimes termed unintentional nonadherence).
Analysis
Patient characteristics were summarized and reported using simple descriptive statistics. Candidate predictors of postdischarge medication adherence were chosen a priori from patient characteristics assessed during hospital admission. These included patient age, gender, race, ethnicity, marital status, insurance, years of education, presence of primary care physician (PCP), study site, number of preadmission medications, medication understanding, baseline adherence, cognition, and health literacy. Unadjusted results were calculated using univariable linear regression, with each patient's adherence score as the dependent variable and each predictor as the independent variable. Adjusted results were then derived using multivariable linear regression with all the candidate predictors in the model.
Lastly, because of missing data for some predictors, in particular baseline adherence and medication understanding, multiple imputation techniques were used to impute missing data and increase statistical power.23 We used the Markov Chain Monte Carlo (MCMC) method for multiple imputation, which generally assumes that the data came from a normal distribution and that the missing data are missing at random. Because of the essentially normal distribution of the data, and because the amount of missing data was so small (<1% for almost all variables, 5% for baseline adherence, and 8% for medication understanding), we expected little bias and present the complete case analysis, which maximized statistical power.
Two‐sided P values <0.05 were considered significant, and SAS version 9.2 (Cary, NC) was used for all analyses.
RESULTS
Table 1 shows descriptive baseline patient characteristics of study sample (responders) as well as nonresponders at 30 days. For the responders, the mean age of the 646 patients was 61.2 years, 94.7% were insured, and 19.3% had inadequate or marginal health literacy. Patients were prescribed an average of 8 preadmission medications. Most patients (92.3%) had a regular PCP prior to admission. Nonresponders had nonsignificant trends towards having lower health literacy, medication understanding, and baseline medication adherence.
| Characteristic | Total N, 30‐Day Respondents | Value | Total N, Nonrespondents | Value |
|---|---|---|---|---|
| ||||
| Age, mean in yr (SD) | 646 | 61.2 (13.5) | 45 | 55.4 (14.3) |
| Gender, N (percentage) | 646 | 45 | ||
| Female | 272 (42.1) | 18 (40.0) | ||
| Male | 374 (57.9) | 27 (60.0) | ||
| Race, N (percentage) | 643 | 45 | ||
| White | 511 (79.5) | 32 (71.1) | ||
| Black | 104 (16.2) | 11 (24.4) | ||
| Other | 28 (4.4) | 2 (4.4) | ||
| Ethnicity, N (percentage) | 639 | 45 | ||
| Hispanic | 24 (3.8) | 1 (2.2) | ||
| Not Hispanic | 615 (96.2) | 44 (97.8) | ||
| Marital status, N (percentage) | 646 | 45 | ||
| Married/cohabitate | 382 (59.1) | 20 (44.4) | ||
| Separated/divorced | 118 (18.3) | 11 (24.4) | ||
| Widowed | 81 (12.5) | 5 (11.1) | ||
| Never married | 65 (10.1) | 9 (2.0) | ||
| Insurance type, N (percentage) | 646 | 45 | ||
| Medicaid | 53 (8.2) | 5 (11.1) | ||
| Medicare | 270 (41.8) | 13 (28.9) | ||
| Private | 289 (44.7) | 19 (42.2) | ||
| Self‐pay | 34 (5.3) | 8 (17.8) | ||
| Years of education, mean in yr (SD) | 643 | 14.0 (3.1) | 45 | 13.3 (2.7) |
| Presence of PCP prior to admission, N (percentage) | 646 | 45 | ||
| Yes | 596 (92.3) | 38 (84.4) | ||
| No | 50 (7.74) | 7 (15.6) | ||
| Site, N (percentage) | 646 | 45 | ||
| Site 1 | 358 (55.4) | 8 (17.8) | ||
| Site 2 | 288 (44.6) | 37 (82.2) | ||
| No. of preadmission medications, mean no. (SD) | 641 | 7.8 (4.8) | 45 | 7.7 (5.4) |
| Medication understanding score, mean (SD)* | 597 | 2.4 (0.5) | 40 | 2.2 (0.62) |
| Health literacy (s‐TOFHLA) score, mean (SD) | 642 | 29.1 (8.9) | 45 | 26.0 (12.0) |
| Baseline adherence (SD) | 613 | 2.7 (1.1) | 45 | 2.4 (1.2) |
| MiniCog score, N (percentage) | 646 | 45 | ||
| Demented | 63 (9.8) | 5 (11.1) | ||
| Not demented | 583 (90.2) | 40 (88.9) | ||
The average postdischarge adherence score was 95% (standard deviation [SD] = 10.2%), and less than 10% of patients had an adherence score of less than 85%; overall the distribution was left‐skewed. Table 2 illustrates crude and adjusted parameter estimates for variables in the model. Table 3 shows significant findings in the fully adjusted model, which used multiple imputation techniques to account for missing data.
| Predictor | Crude Parameter Estimate (Beta) With 95% Confidence Intervals | P Value | Adjusted Parameter Estimate (Beta) With 95% Confidence Intervals | P Value |
|---|---|---|---|---|
| ||||
| Age per 10 yr | 0.010 (0.007, 0.020) | <0.0001 | 0.010 (0.002, 0.020) | 0.018 |
| Male gender | 0.012 (0.004, 0.028) | 0.137 | 0.003 (0.014, 0.020) | 0.727 |
| Race/ethnicity | ||||
| White | 0.011 (0.009, 0.031) | 0.266 | Ref | Ref |
| Black | 0.017 (0.038, 0.005) | 0.13 | 0.006 (0.017, 0.030) | 0.598 |
| Other | 0.010 (0.029, 0.049) | 0.599 | 0.017 (0.027, 0.062) | 0.446 |
| Hispanic/Latino | 0.005 (0.037, 0.047) | 0.803 | 0.036 (0.013, 0.085) | 0.149 |
| Marital status | ||||
| Married/cohabitate | 0.006 (0.011, 0.022) | 0.500 | Ref | Ref |
| Separated/divorced | 0.005 (0.025, 0.016) | 0.664 | 0.009 (0.014, 0.031) | 0.446 |
| Widowed | 0.001 (0.023, 0.025) | 0.922 | 0.013 (0.039, 0.013) | 0.338 |
| Never married | 0.009 (0.035, 0.018) | 0.515 | 0.004 (0.033, 0.025) | 0.784 |
| Insurance type | ||||
| Private | 0.008 (0.008, 0.024) | 0.347 | Ref | Ref |
| Medicaid | 0.046 (0.075, 0.018) | 0.002 | 0.026 (0.058, 0.007) | 0.121 |
| Medicare | 0.012 (0.004, 0.028) | 0.138 | 0.002 (0.023, 0.018) | 0.844 |
| Self‐pay | 0.027 (0.062, 0.008) | 0.135 | 0.029 (0.073, 0.015) | 0.202 |
| Years of education | 0.003 (0.0003, 0.005) | 0.028 | 0.0001 (0.003, 0.003) | 0.949 |
| Presence of PCP prior to admission | 0.007 (0.022, 0.037) | 0.630 | 0.002 (0.032, 0.036) | 0.888 |
| Site | 0.050 (0.065, 0.034) | <0.0001 | 0.038 (0.056, 0.021) | <0.0001 |
| No. of preadmission medications | 0.0003 (0.002, 0.001) | 0.684 | 0.0001 (0.002, 0.002) | 0.918 |
| Medication understanding score per point | 0.007 (0.009, 0.023) | 0.390 | 0.006 (0.011, 0.023) | 0.513 |
| Health literacy (s‐TOFHLA) score per 10 points | 0.0006 (0.008, 0.01) | 0.897 | 0.003 (0.008, 0.01) | 0.644 |
| Baseline adherence per point | 0.023 (0.016, 0.031) | <0.0001 | 0.017 (0.009, 0.024) | <0.0001 |
| Cognitive function | 0.004 (0.022, 0.031) | 0.757 | 0.008 (0.019, 0.036) | 0.549 |
| Predictor | Parameter Estimate (Beta) With 95% Confidence Intervals | P Value |
|---|---|---|
| ||
| Age per 10 yr | 0.010 (0.004, 0.020) | 0.004 |
| Insurance type | ||
| Private | Ref | Ref |
| Medicaid | 0.045 (0.076, 0.014) | 0.005 |
| Medicare | 0.010 (0.030, 0.010) | 0.333 |
| Self‐pay | 0.013 (0.050, 0.025) | 0.512 |
| Site | 0.036 (0.053, 0.019) | <0.0001 |
| Baseline adherence per point | 0.016 (0.008, 0.024) | <0.0001 |
Intervention arm was of borderline statistical significance in predicting postdischarge adherence (P = 0.052), and so was removed from the final model. Study site, age, insurance, and baseline adherence were the only significant independent predictors of postdischarge adherence in the fully adjusted model (Table 3). For example, for every 10‐year increase in age, patients had, on average, an adjusted 1% absolute increase in their adherence score (95% confidence interval [CI] 0.4% to 2.0%). For every 1‐point increase in baseline medication adherence (based on the Morisky scale), there was a 1.6% absolute increase in medication adherence (95% CI 0.8% to 2.4%). In unadjusted analyses, patients with Medicaid were less adherent with medications after discharge than were patients with private insurance. This difference became nonsignificant in adjusted analyses, but when analyses were repeated using multiple imputation techniques, the results again became statistically significantMedicaid insurance was associated with a 4.5% absolute decrease in postdischarge adherence compared with private insurance (95% CI 7.6% to 1.4%). Study site (specifically, Brigham and Women's Hospital) was also a significant predictor of greater postdischarge medication adherence. Years of education was a significant predictor of adherence in unadjusted analyses, but was not an independent predictor when adjusted for other factors. When baseline adherence was removed from the multiple imputation model, there were no changes in which factors were significant predictors of adherence.
DISCUSSION
In this study, we found that low baseline adherence, younger age, Medicaid insurance, and study site were significant predictors of lower 30‐day medication adherence. Of particular interest is our finding regarding baseline adherence, a simple measure to obtain on hospitalized patients. It is notable that in our study, education was not an independent significant predictor of postdischarge adherence, even when baseline adherence was removed from the model. The same is true for medication understanding, cognitive function, and health literacy.
Older patients appeared more adherent with medications in the month after hospital discharge, perhaps reflecting increased interaction with the healthcare system (appointments, number of physician interactions), a greater belief in the importance of chronic medication management, or a higher level of experience with managing medications. A similar relationship between age and adherence has been shown in outpatient studies of patients with hypertension, diabetes, and other chronic diseases.2427
Medicaid patients may be less likely to remain adherent because of the plan's limited coverage of medications relative to patients' ability to pay. For example, Medicaid in Tennessee covers the first 5 generic medications at no cost to the patient but has co‐payments for additional medications and for brand name drugs. Medicaid in Massachusetts has co‐payments of $1 to $3 for each medication. Alternatively, Medicaid insurance may be a marker for other patient characteristics associated with low adherence for which we were not fully able to adjust.
Site differences were also notable in this study; these differences could have been due to differences in insurance coverage in Tennessee versus Massachusetts (which has near‐universal coverage), differences in types of insurance (eg, fewer patients at Brigham and Women's Hospital had Medicaid than at Vanderbilt), cultural and geographic differences between the 2 locations, or other differences in transitional care between the 2 sites.
This study corroborates previous literature on medication adherence (specifically unintentional nonadherence) in the outpatient setting,4, 811 for example, on the association of younger age with low adherence in certain populations. On the other hand, it may contrast with previous literature which has sometimes shown a relationship between patient education or health literacy and medication adherence.14, 15, 2835 However, previous studies have not focused on the transition from inpatient to outpatient settings. Perhaps intensive medication education in the hospital, even under usual care, mitigates the effects of these factors on postdischarge adherence. Finally, baseline adherence seems to correlate with postdischarge adherence, a finding which makes intuitive sense and has been previously reported for specific medications.36
There are several limitations to this study. Although large, the study was performed at only 2 clinical sites where most patients were white and fairly well‐educated, perhaps because patients admitted to a tertiary care center with ACS or ADHF are more affluent than general medical inpatients as a whole; this may limit generalizability. Postdischarge medication adherence might have been higher than in other patient populations given the nature of the population, possible loss‐to‐follow‐up bias, and the fact that half of the subjects received an intervention designed to improve medication management after discharge; such low rates of nonadherence in our study may have reduced our ability to detect important predictors in our models. In addition, the period of follow‐up was 30 days, thus limiting our findings to short‐term postdischarge medication adherence. Postdischarge medication adherence was based on patient self‐report, which not only assumed that the patient was still managing his/her own medications after discharge, but may also be susceptible to both recall and social acceptability bias, which might overestimate our adherence scores, again limiting our ability to detect important predictors of nonadherence. However, other studies have shown a good correlation between self‐reported medication adherence and other more objective measures,37, 38 and recall was only for 7 days, a measure used previously in the literature39, 40 and one designed to reduce recall bias. Systematic underreporting in certain patient populations is less likely but possible.
In the future, research should focus on targeting patients who have low baseline adherence to evaluate the effects of various interventions on postdischarge medication outcomes. Repeating the study in a population with a high prevalence of low health literacy might be illuminating, given that previous studies have shown that patients with low health literacy have less ability to identify their medications and have less refill adherence.29, 30
In conclusion, in patients hospitalized with cardiovascular disease, predictors of lower postdischarge adherence include younger age, Medicaid insurance, and low baseline adherence. It may be prudent to assess baseline adherence and insurance type in hospitalized patients in order to identify those who may benefit from additional assistance to improve medication adherence and medication safety during transitions in care.
Acknowledgements
Meeting Presentations: SGIM New England Regional Meeting, oral presentation, Boston, MA, March 4, 2011; and SGIM National Meeting, poster presentation, Phoenix, AZ, May 6, 2011. Dr Schnipper had full access to all of the data in the study and takes responsibility for the integrity of the data and the accuracy of the data analysis.
Disclosures: Financial support was provided by R01 HL089755 (NHLBI, Kripalani), K23 HL077597 (NHLBI, Kripalani), K08 HL072806 (NHLBI, Schnipper), T32HP10251‐02 (Cohen), and by the Division of General Medicine, Massachusetts General Hospital and the Harvard Medical School Fellowship in General Medicine and Primary Care (Cohen). Dr Kripalani is a consultant to and holds equity in PictureRx, LLC, which makes patient education tools to improve medication management. PictureRx did not provide materials or funding for this study. All other authors disclose no relevant or financial conflicts of interest.
- ,.Adherence to medication.N Engl J Med.2005;353(5):487–497.
- ,,,.Posthospital medication discrepancies: prevalence and contributing factors.Arch Intern Med.2005;165(16):1842–1847.
- ,.Medication use in the transition from hospital to home.Ann Acad Med Singapore.2008;37(2):136–141.
- ,,,.Medical errors related to discontinuity of care from an inpatient to an outpatient setting.J Gen Intern Med.2003;18(8):646–651.
- ,,,,.The incidence and severity of adverse events affecting patients after discharge from the hospital.Ann Intern Med.2003;138(3):161–167.
- ,,,,.Adverse drug events occurring following hospital discharge.J Gen Intern Med.2005;20(4):317–323.
- ,,, et al.Role of pharmacist counseling in preventing adverse drug events after hospitalization.Arch Intern Med.2006;166(5):565–571.
- ,,.Reconcilable differences: correcting medication errors at hospital admission and discharge.Qual Saf Health Care.2006;15(2):122–126.
- ,.Risk of rehospitalization among bipolar disorder patients who are nonadherent to antipsychotic therapy after hospital discharge.Am J Health Syst Pharm.2009;66(4):358–365.
- ,,,,.Continuity and adherence to long‐term drug treatment by geriatric patients after hospital discharge: a prospective cohort study.Drugs Aging.2008;25(10):861–870.
- ,,,.Medication use among inner‐city patients after hospital discharge: patient‐reported barriers and solutions.Mayo Clin Proc.2008;83(5):529–535.
- ,,,,,.Relationship of health literacy to intentional and unintentional non‐adherence of hospital discharge medications.J Gen Intern Med.2012;27(2):173–178.
- Office of Disease Prevention and Health Promotion, US Department of Health and Human Services.Healthy People 2010. Available at: http://www.healthypeople.gov/Document/pdf/uih/2010uih.pdf. Accessed February 15,2012.
- ,,, et al.Literacy and misunderstanding prescription drug labels.Ann Intern Med.2006;145(12):887–894.
- ,,,,,.Predictors of medication self‐management skill in a low‐literacy population.J Gen Intern Med.2006;21(8):852–856.
- ,,, et al;for the PILL‐CVD Study Group.Rationale and design of the Pharmacist Intervention for Low Literacy in Cardiovascular Disease (PILL‐CVD) study.Circ Cardiovasc Qual Outcomes.2010;3(2):212–219.
- ,,,,.Simplifying detection of cognitive impairment: comparison of the Mini‐Cog and Mini‐Mental State Examination in a multiethnic sample.J Am Geriatr Soc.2005;53(5):871–874.
- .Short Test of Functional Health Literacy in Adults.Snow Camp, NC:Peppercorn Books and Press;1998.
- ,,,.Predictive validity of a medication adherence measure in an outpatient setting.J Clin Hypertens (Greenwich).2008;10(5):348–354.
- ,,,,,.Health literacy and medication understanding among hospitalized adults.J Hosp Med. In press.
- ,,,,,.Health literacy and medication understanding among hospitalized adults.J Hosp Med.2011;6(9):488–493.
- ,,.The summary of diabetes self‐care activities measure: results from 7 studies and a revised scale.Diabetes Care.2000;23(7):943–950.
- .Multiple Imputation for Nonresponse in Surveys.New York, NY:John Wiley 1987.
- ,,, et al.Medication adherence in HIV‐infected adults: effect of patient age, cognitive status, and substance abuse.AIDS.2004;18(suppl 1):S19–S25.
- ,,.Factors associated with antihypertensive drug compliance in 83,884 Chinese patients: a cohort study.J Epidemiol Community Health.2010;64(10):895–901.
- ,,,,,.Adherence to oral hypoglycemic agents in 26,782 Chinese patients: a cohort study.J Clin Pharmacol.2011;51(10):1474–1482.
- ,,,,.Effect of a pharmacy‐based health literacy intervention and patient characteristics on medication refill adherence in an urban health system.Ann Pharmacother.2010;44(1):80–87.
- ,,.Adherence to combination antiretroviral therapies in HIV patients of low health literacy.J Gen Intern Med.1999;14(5):267–273.
- ,,,,,.Factors associated with medication refill adherence in cardiovascular‐related diseases: a focus on health literacy.J Gen Intern Med.2006;21(12):1215–1221.
- ,,,,.Limited health literacy is a barrier to medication reconciliation in ambulatory care.J Gen Intern Med.2007;22(11):1523–1526.
- ,,,,.The impact of low health literacy on surgical practice.Am J Surg.2004;188(3):250–253.
- ,,,,.Relationships between beliefs about medications and adherence.Am J Health Syst Pharm.2009;66(7):657–664.
- ,,,.Health literacy and anticoagulation‐related outcomes among patients taking warfarin.J Gen Intern Med.2006;21(8):841–846.
- ,,,,,.Health literacy, antiretroviral adherence, and HIV‐RNA suppression: a longitudinal perspective.J Gen Intern Med.2006;21(8):835–840.
- ,,, et al.Risk factors for nonadherence to warfarin: results from the IN‐RANGE study.Pharmacoepidemiol Drug Saf.2008;17(9):853–860.
- ,,, et al.Predictors of low clopidogrel adherence following percutaneous coronary intervention.Am J Cardiol.2011;108(6):822–827.
- ,,,,,.Correlation between adherence rates measured by MEMS and self‐reported questionnaires: a meta‐analysis.Health Qual Life Outcomes.2010;8:99.
- ,,,,,.Concordance of adherence measurement using self‐reported adherence questionnaires and medication monitoring devices.Pharmacoeconomics.2010;28(12):1097–1107.
- ,,,.Polypharmacy and medication adherence in patients with type 2 diabetes.Diabetes Care.2003;26(5):1408–1412.
- ,,,.Improving adherence and reducing medication discrepancies in patients with diabetes.Ann Pharmacother.2003;37(7–8):962–969.
- ,.Adherence to medication.N Engl J Med.2005;353(5):487–497.
- ,,,.Posthospital medication discrepancies: prevalence and contributing factors.Arch Intern Med.2005;165(16):1842–1847.
- ,.Medication use in the transition from hospital to home.Ann Acad Med Singapore.2008;37(2):136–141.
- ,,,.Medical errors related to discontinuity of care from an inpatient to an outpatient setting.J Gen Intern Med.2003;18(8):646–651.
- ,,,,.The incidence and severity of adverse events affecting patients after discharge from the hospital.Ann Intern Med.2003;138(3):161–167.
- ,,,,.Adverse drug events occurring following hospital discharge.J Gen Intern Med.2005;20(4):317–323.
- ,,, et al.Role of pharmacist counseling in preventing adverse drug events after hospitalization.Arch Intern Med.2006;166(5):565–571.
- ,,.Reconcilable differences: correcting medication errors at hospital admission and discharge.Qual Saf Health Care.2006;15(2):122–126.
- ,.Risk of rehospitalization among bipolar disorder patients who are nonadherent to antipsychotic therapy after hospital discharge.Am J Health Syst Pharm.2009;66(4):358–365.
- ,,,,.Continuity and adherence to long‐term drug treatment by geriatric patients after hospital discharge: a prospective cohort study.Drugs Aging.2008;25(10):861–870.
- ,,,.Medication use among inner‐city patients after hospital discharge: patient‐reported barriers and solutions.Mayo Clin Proc.2008;83(5):529–535.
- ,,,,,.Relationship of health literacy to intentional and unintentional non‐adherence of hospital discharge medications.J Gen Intern Med.2012;27(2):173–178.
- Office of Disease Prevention and Health Promotion, US Department of Health and Human Services.Healthy People 2010. Available at: http://www.healthypeople.gov/Document/pdf/uih/2010uih.pdf. Accessed February 15,2012.
- ,,, et al.Literacy and misunderstanding prescription drug labels.Ann Intern Med.2006;145(12):887–894.
- ,,,,,.Predictors of medication self‐management skill in a low‐literacy population.J Gen Intern Med.2006;21(8):852–856.
- ,,, et al;for the PILL‐CVD Study Group.Rationale and design of the Pharmacist Intervention for Low Literacy in Cardiovascular Disease (PILL‐CVD) study.Circ Cardiovasc Qual Outcomes.2010;3(2):212–219.
- ,,,,.Simplifying detection of cognitive impairment: comparison of the Mini‐Cog and Mini‐Mental State Examination in a multiethnic sample.J Am Geriatr Soc.2005;53(5):871–874.
- .Short Test of Functional Health Literacy in Adults.Snow Camp, NC:Peppercorn Books and Press;1998.
- ,,,.Predictive validity of a medication adherence measure in an outpatient setting.J Clin Hypertens (Greenwich).2008;10(5):348–354.
- ,,,,,.Health literacy and medication understanding among hospitalized adults.J Hosp Med. In press.
- ,,,,,.Health literacy and medication understanding among hospitalized adults.J Hosp Med.2011;6(9):488–493.
- ,,.The summary of diabetes self‐care activities measure: results from 7 studies and a revised scale.Diabetes Care.2000;23(7):943–950.
- .Multiple Imputation for Nonresponse in Surveys.New York, NY:John Wiley 1987.
- ,,, et al.Medication adherence in HIV‐infected adults: effect of patient age, cognitive status, and substance abuse.AIDS.2004;18(suppl 1):S19–S25.
- ,,.Factors associated with antihypertensive drug compliance in 83,884 Chinese patients: a cohort study.J Epidemiol Community Health.2010;64(10):895–901.
- ,,,,,.Adherence to oral hypoglycemic agents in 26,782 Chinese patients: a cohort study.J Clin Pharmacol.2011;51(10):1474–1482.
- ,,,,.Effect of a pharmacy‐based health literacy intervention and patient characteristics on medication refill adherence in an urban health system.Ann Pharmacother.2010;44(1):80–87.
- ,,.Adherence to combination antiretroviral therapies in HIV patients of low health literacy.J Gen Intern Med.1999;14(5):267–273.
- ,,,,,.Factors associated with medication refill adherence in cardiovascular‐related diseases: a focus on health literacy.J Gen Intern Med.2006;21(12):1215–1221.
- ,,,,.Limited health literacy is a barrier to medication reconciliation in ambulatory care.J Gen Intern Med.2007;22(11):1523–1526.
- ,,,,.The impact of low health literacy on surgical practice.Am J Surg.2004;188(3):250–253.
- ,,,,.Relationships between beliefs about medications and adherence.Am J Health Syst Pharm.2009;66(7):657–664.
- ,,,.Health literacy and anticoagulation‐related outcomes among patients taking warfarin.J Gen Intern Med.2006;21(8):841–846.
- ,,,,,.Health literacy, antiretroviral adherence, and HIV‐RNA suppression: a longitudinal perspective.J Gen Intern Med.2006;21(8):835–840.
- ,,, et al.Risk factors for nonadherence to warfarin: results from the IN‐RANGE study.Pharmacoepidemiol Drug Saf.2008;17(9):853–860.
- ,,, et al.Predictors of low clopidogrel adherence following percutaneous coronary intervention.Am J Cardiol.2011;108(6):822–827.
- ,,,,,.Correlation between adherence rates measured by MEMS and self‐reported questionnaires: a meta‐analysis.Health Qual Life Outcomes.2010;8:99.
- ,,,,,.Concordance of adherence measurement using self‐reported adherence questionnaires and medication monitoring devices.Pharmacoeconomics.2010;28(12):1097–1107.
- ,,,.Polypharmacy and medication adherence in patients with type 2 diabetes.Diabetes Care.2003;26(5):1408–1412.
- ,,,.Improving adherence and reducing medication discrepancies in patients with diabetes.Ann Pharmacother.2003;37(7–8):962–969.
Copyright © 2012 Society of Hospital Medicine
Press Ganey Analyst Explains Implications of Hospital Value-Based Purchasing
Seven percent of Medicare hospital DRGs: That is, potentially, how much Medicare reimbursement will be in play from CMS' hospital value-based purchasing (HVBP) quality initiatives by Fiscal Year 2017, Nell Buhlman, MBA, vice president of clinical products for Press Ganey Associates, said during a Sunday pre-course at SHM 2012. How many of you know your hospital’s profit margin on Medicare?” she posed to the audience. “Is it 7%?”
Buhlman outlined various components of CMS’ quality initiatives for hospitals, which could add up to millions of dollars per year for an average-sized hospital. By 2017 quality measures impacting on reimbursement will include the HCAHPS (Hospital Consumer Assessment of Healthcare Providers and Systems), core clinical measures, penalties for higher-than-expected 30-day readmission rates, and meaningful-use reductions.
Hospitals are capable of significant quality improvement, “but the importance of hitting the hospital quality targets every single time will grow,” she said.
“Improving quality is fantastic, but even better is improving faster than everyone else,” Buhlman said, adding that the smallest things can sometimes make a big difference on outcomes scores. She offered the example of giving a notepad and pen to hospitalized patients so they can write down the questions they want to ask their doctor for the next visit.
Seven percent of Medicare hospital DRGs: That is, potentially, how much Medicare reimbursement will be in play from CMS' hospital value-based purchasing (HVBP) quality initiatives by Fiscal Year 2017, Nell Buhlman, MBA, vice president of clinical products for Press Ganey Associates, said during a Sunday pre-course at SHM 2012. How many of you know your hospital’s profit margin on Medicare?” she posed to the audience. “Is it 7%?”
Buhlman outlined various components of CMS’ quality initiatives for hospitals, which could add up to millions of dollars per year for an average-sized hospital. By 2017 quality measures impacting on reimbursement will include the HCAHPS (Hospital Consumer Assessment of Healthcare Providers and Systems), core clinical measures, penalties for higher-than-expected 30-day readmission rates, and meaningful-use reductions.
Hospitals are capable of significant quality improvement, “but the importance of hitting the hospital quality targets every single time will grow,” she said.
“Improving quality is fantastic, but even better is improving faster than everyone else,” Buhlman said, adding that the smallest things can sometimes make a big difference on outcomes scores. She offered the example of giving a notepad and pen to hospitalized patients so they can write down the questions they want to ask their doctor for the next visit.
Seven percent of Medicare hospital DRGs: That is, potentially, how much Medicare reimbursement will be in play from CMS' hospital value-based purchasing (HVBP) quality initiatives by Fiscal Year 2017, Nell Buhlman, MBA, vice president of clinical products for Press Ganey Associates, said during a Sunday pre-course at SHM 2012. How many of you know your hospital’s profit margin on Medicare?” she posed to the audience. “Is it 7%?”
Buhlman outlined various components of CMS’ quality initiatives for hospitals, which could add up to millions of dollars per year for an average-sized hospital. By 2017 quality measures impacting on reimbursement will include the HCAHPS (Hospital Consumer Assessment of Healthcare Providers and Systems), core clinical measures, penalties for higher-than-expected 30-day readmission rates, and meaningful-use reductions.
Hospitals are capable of significant quality improvement, “but the importance of hitting the hospital quality targets every single time will grow,” she said.
“Improving quality is fantastic, but even better is improving faster than everyone else,” Buhlman said, adding that the smallest things can sometimes make a big difference on outcomes scores. She offered the example of giving a notepad and pen to hospitalized patients so they can write down the questions they want to ask their doctor for the next visit.
Applicable Themes, Big-Picture Thinking Take Root at HM12
Sitting in the back of a conference room at the San Diego Convention Center on Sunday morning, Benjamin Frizner, MD, listens intently as a panel of HM experts debates the finer points of how best to implement and manage multidisciplinary rounds. The conversation, one of dozens to be tackled at a daylong pre-course on practice management, gave Dr. Frizner and dozens of physicians around him applicable advice, new viewpoints, and time to think about the big picture.
Welcome to HM12.
"The topics are focused to a lot of the problems we are facing," says Dr. Frizner, director of the hospitalist program at Saint Agnes Hospital in Baltimore. "It really gives us the whole day to just focus."
Of course, the four-day meeting is only just starting. Sunday is dedicated to eight pre-courses that offer CME credits, including a new session, "How to Improve Performance in CMS' Value-Based Purchasing Program." Other pre-courses dealt with ABIM Maintenance of Certification, critical care, perioperative care, and hands-on training in ultrasound and other medical procedures.
The annual meeting continues Monday, April 2, and includes the Research, Innovations, and Clinical Vignettes (RIV) poster competition and plenary addresses from Patrick Conway, MD, MSc, FAAP, SFHM, a pediatric hospitalist and chief medical officer of the Centers for Medicare & Medicaid Services (CMS); political commentator Norman Ornstein, PhD, MA, BA; and HM pioneer Robert Wachter, MD, MHM.
"This is the best meeting I've ever been to," says Madonna Ringswald, DO, medical director of the hospitalist program at Baptist Hospital Northeast in La Grange, Ky., who attended the practice management pre-course. "If you can’t find a lecture [that appeals to you], there’s something wrong with you."
Sitting in the back of a conference room at the San Diego Convention Center on Sunday morning, Benjamin Frizner, MD, listens intently as a panel of HM experts debates the finer points of how best to implement and manage multidisciplinary rounds. The conversation, one of dozens to be tackled at a daylong pre-course on practice management, gave Dr. Frizner and dozens of physicians around him applicable advice, new viewpoints, and time to think about the big picture.
Welcome to HM12.
"The topics are focused to a lot of the problems we are facing," says Dr. Frizner, director of the hospitalist program at Saint Agnes Hospital in Baltimore. "It really gives us the whole day to just focus."
Of course, the four-day meeting is only just starting. Sunday is dedicated to eight pre-courses that offer CME credits, including a new session, "How to Improve Performance in CMS' Value-Based Purchasing Program." Other pre-courses dealt with ABIM Maintenance of Certification, critical care, perioperative care, and hands-on training in ultrasound and other medical procedures.
The annual meeting continues Monday, April 2, and includes the Research, Innovations, and Clinical Vignettes (RIV) poster competition and plenary addresses from Patrick Conway, MD, MSc, FAAP, SFHM, a pediatric hospitalist and chief medical officer of the Centers for Medicare & Medicaid Services (CMS); political commentator Norman Ornstein, PhD, MA, BA; and HM pioneer Robert Wachter, MD, MHM.
"This is the best meeting I've ever been to," says Madonna Ringswald, DO, medical director of the hospitalist program at Baptist Hospital Northeast in La Grange, Ky., who attended the practice management pre-course. "If you can’t find a lecture [that appeals to you], there’s something wrong with you."
Sitting in the back of a conference room at the San Diego Convention Center on Sunday morning, Benjamin Frizner, MD, listens intently as a panel of HM experts debates the finer points of how best to implement and manage multidisciplinary rounds. The conversation, one of dozens to be tackled at a daylong pre-course on practice management, gave Dr. Frizner and dozens of physicians around him applicable advice, new viewpoints, and time to think about the big picture.
Welcome to HM12.
"The topics are focused to a lot of the problems we are facing," says Dr. Frizner, director of the hospitalist program at Saint Agnes Hospital in Baltimore. "It really gives us the whole day to just focus."
Of course, the four-day meeting is only just starting. Sunday is dedicated to eight pre-courses that offer CME credits, including a new session, "How to Improve Performance in CMS' Value-Based Purchasing Program." Other pre-courses dealt with ABIM Maintenance of Certification, critical care, perioperative care, and hands-on training in ultrasound and other medical procedures.
The annual meeting continues Monday, April 2, and includes the Research, Innovations, and Clinical Vignettes (RIV) poster competition and plenary addresses from Patrick Conway, MD, MSc, FAAP, SFHM, a pediatric hospitalist and chief medical officer of the Centers for Medicare & Medicaid Services (CMS); political commentator Norman Ornstein, PhD, MA, BA; and HM pioneer Robert Wachter, MD, MHM.
"This is the best meeting I've ever been to," says Madonna Ringswald, DO, medical director of the hospitalist program at Baptist Hospital Northeast in La Grange, Ky., who attended the practice management pre-course. "If you can’t find a lecture [that appeals to you], there’s something wrong with you."
ABIM Maintenance of Certification (MOC) Pre-Course Is Learning Experience
Recertification is a fact of life for physicians. But at today’s ABIM Maintenance of Certification pre-course, the conversation is about more than just answers. It’s about the questions.
“When you take the actual recertification exam, it’s an exam,” Ethan Cumbler, MD, FACP, of University of Colorado Denver, says between leading question-and-answer sessions at the Hm12 pre-course this afternoon. “You find out whether it’s pass or fail. But when you go through this process of getting to look at the questions, look at all the answers, ask questions, discuss it as a group for the controversies - that’s an entirely different process."
Dr. Cumbler also tells pre-course attendees that the MOC is more than an evaluation.
“What this is is a learning process," he says, "and I think the people who come want to be part of that."
Recertification is a fact of life for physicians. But at today’s ABIM Maintenance of Certification pre-course, the conversation is about more than just answers. It’s about the questions.
“When you take the actual recertification exam, it’s an exam,” Ethan Cumbler, MD, FACP, of University of Colorado Denver, says between leading question-and-answer sessions at the Hm12 pre-course this afternoon. “You find out whether it’s pass or fail. But when you go through this process of getting to look at the questions, look at all the answers, ask questions, discuss it as a group for the controversies - that’s an entirely different process."
Dr. Cumbler also tells pre-course attendees that the MOC is more than an evaluation.
“What this is is a learning process," he says, "and I think the people who come want to be part of that."
Recertification is a fact of life for physicians. But at today’s ABIM Maintenance of Certification pre-course, the conversation is about more than just answers. It’s about the questions.
“When you take the actual recertification exam, it’s an exam,” Ethan Cumbler, MD, FACP, of University of Colorado Denver, says between leading question-and-answer sessions at the Hm12 pre-course this afternoon. “You find out whether it’s pass or fail. But when you go through this process of getting to look at the questions, look at all the answers, ask questions, discuss it as a group for the controversies - that’s an entirely different process."
Dr. Cumbler also tells pre-course attendees that the MOC is more than an evaluation.
“What this is is a learning process," he says, "and I think the people who come want to be part of that."
Talking Shop: Hospitalists eager to adopt computerized physician order entry (CPOE)
With pre-course participants finishing up lunch today, four hospitalists from three hospitals are talking shop. Two of the hospitals are in the process of implementing computerized physician order entry (CPOE), and the third hospital is on track to do the same but got delayed. Each of the hospitalists expresses cautious optimism about the outcomes.
“It’s a necessary evil,” says Gaurav T. Parikh, MD, a Cogent HMG hospitalist practicing at City Hospital in Martinsburg, W.V. “Once we start using it—if it really makes things easier—then it should give us more flexibility. You can use it anywhere in the hospital.
"Sometimes I leave a patient’s room and go to another patient, and then remember, gee, I forget to order something for that first patient.”
With CPOE, Dr. Parikh can enter the additional prescription at a computer terminal or try to reach a nurse on that floor by phone, who then places the order.
Jaydeep Patel, MD, MBA, hospitalist at Grant Medical Center in Columbus,Ohio, says he used CPOE in residency and eagerly is awaiting its implementation at Grant. “I really liked it. There’s just less chance for error, as opposed to 15 charts on the rack,” he says.
Dr. Parikh says his hospital tried for two years to get physicians to enter the date and time on prescriptions. “It didn’t happen,” he says, noting CPOE puts an electronic signature on every prescription. He also says the hospital will have an easier time pulling data on practice. “In a time of increased demands for data and quality, it will help you big time," he adds. "But it won’t necessarily save us time.”
Larry Beresford is a freelance writer covering HM12.
With pre-course participants finishing up lunch today, four hospitalists from three hospitals are talking shop. Two of the hospitals are in the process of implementing computerized physician order entry (CPOE), and the third hospital is on track to do the same but got delayed. Each of the hospitalists expresses cautious optimism about the outcomes.
“It’s a necessary evil,” says Gaurav T. Parikh, MD, a Cogent HMG hospitalist practicing at City Hospital in Martinsburg, W.V. “Once we start using it—if it really makes things easier—then it should give us more flexibility. You can use it anywhere in the hospital.
"Sometimes I leave a patient’s room and go to another patient, and then remember, gee, I forget to order something for that first patient.”
With CPOE, Dr. Parikh can enter the additional prescription at a computer terminal or try to reach a nurse on that floor by phone, who then places the order.
Jaydeep Patel, MD, MBA, hospitalist at Grant Medical Center in Columbus,Ohio, says he used CPOE in residency and eagerly is awaiting its implementation at Grant. “I really liked it. There’s just less chance for error, as opposed to 15 charts on the rack,” he says.
Dr. Parikh says his hospital tried for two years to get physicians to enter the date and time on prescriptions. “It didn’t happen,” he says, noting CPOE puts an electronic signature on every prescription. He also says the hospital will have an easier time pulling data on practice. “In a time of increased demands for data and quality, it will help you big time," he adds. "But it won’t necessarily save us time.”
Larry Beresford is a freelance writer covering HM12.
With pre-course participants finishing up lunch today, four hospitalists from three hospitals are talking shop. Two of the hospitals are in the process of implementing computerized physician order entry (CPOE), and the third hospital is on track to do the same but got delayed. Each of the hospitalists expresses cautious optimism about the outcomes.
“It’s a necessary evil,” says Gaurav T. Parikh, MD, a Cogent HMG hospitalist practicing at City Hospital in Martinsburg, W.V. “Once we start using it—if it really makes things easier—then it should give us more flexibility. You can use it anywhere in the hospital.
"Sometimes I leave a patient’s room and go to another patient, and then remember, gee, I forget to order something for that first patient.”
With CPOE, Dr. Parikh can enter the additional prescription at a computer terminal or try to reach a nurse on that floor by phone, who then places the order.
Jaydeep Patel, MD, MBA, hospitalist at Grant Medical Center in Columbus,Ohio, says he used CPOE in residency and eagerly is awaiting its implementation at Grant. “I really liked it. There’s just less chance for error, as opposed to 15 charts on the rack,” he says.
Dr. Parikh says his hospital tried for two years to get physicians to enter the date and time on prescriptions. “It didn’t happen,” he says, noting CPOE puts an electronic signature on every prescription. He also says the hospital will have an easier time pulling data on practice. “In a time of increased demands for data and quality, it will help you big time," he adds. "But it won’t necessarily save us time.”
Larry Beresford is a freelance writer covering HM12.

HM12 Kicks Off: Hundreds Dive into Pre-Courses; SHM Expects 3,000 Attendees
HM12 kicked off this morning with hundreds attending eight pre-courses and many more registering for the annual meeting. SHM expects more than 3,000 to attend the four-day gathering at the San Diego Convention Center.
The Hospitalist will be delivering daily news updates and analysis throughout the annual meeting. Check back or download the HM12 at Hand web application to stay abreast of the latest news.
Today's pre-courses are as follows:

- Advanced Interactive Critical Care, 7.75 credits;
- CMS’s Value-Based Purchasing Program, 3.75 credits;
- Medical Procedures, 7.5 credits;
- Portable Ultrasounds, 3.75 credits;
- Perioperative Medicine, 7.75 credits; and
- Practice Management, 7.5 credits.
HM12 kicked off this morning with hundreds attending eight pre-courses and many more registering for the annual meeting. SHM expects more than 3,000 to attend the four-day gathering at the San Diego Convention Center.
The Hospitalist will be delivering daily news updates and analysis throughout the annual meeting. Check back or download the HM12 at Hand web application to stay abreast of the latest news.
Today's pre-courses are as follows:
- Advanced Interactive Critical Care, 7.75 credits;
- CMS’s Value-Based Purchasing Program, 3.75 credits;
- Medical Procedures, 7.5 credits;
- Portable Ultrasounds, 3.75 credits;
- Perioperative Medicine, 7.75 credits; and
- Practice Management, 7.5 credits.
HM12 kicked off this morning with hundreds attending eight pre-courses and many more registering for the annual meeting. SHM expects more than 3,000 to attend the four-day gathering at the San Diego Convention Center.
The Hospitalist will be delivering daily news updates and analysis throughout the annual meeting. Check back or download the HM12 at Hand web application to stay abreast of the latest news.
Today's pre-courses are as follows:
- Advanced Interactive Critical Care, 7.75 credits;
- CMS’s Value-Based Purchasing Program, 3.75 credits;
- Medical Procedures, 7.5 credits;
- Portable Ultrasounds, 3.75 credits;
- Perioperative Medicine, 7.75 credits; and
- Practice Management, 7.5 credits.