User login
Pressure to Expand Scope of Practice Extends to Most U.S. Hospitalists
Eric M. Siegal, MD, SFHM, vividly recalls the moment when he realized “scope creep” had become a problem. A hospitalist partner who was working a night shift admitted a young man who had been in a high-speed motor vehicle accident. The hospitalist did so because the general surgeon did not want to come into the hospital.
Dr. Siegal, currently the medical director of critical-care medicine at Aurora St. Luke’s Medical Center in Milwaukee, remembers looking at his partner and asking, “What the hell are you doing admitting a trauma patient? You’re an internist!”
Dr. Siegal’s partner responded, “I’m just trying to show value.”
“That was an ‘a-ha’ moment for me,” says Dr. Siegal, a member of SHM’s board of directors. It was at that point he began to understand that the expansion strategy used by many HM services—to demonstrate value by agreeing to comanage or admit patients for their primary-care (PCP) and specialist colleagues—had produced some unintended negative consequences. “Hospitalists,” he says, “are like the spackle of the hospital. Sometimes spackle is good; it hides flaws and imperfections. But at other times, people use spackle to fix major structural problems.”
Scope creep, mission creep, scut work: There are numerous ways to describe the phenomenon. In basic terms, hospitalists have been pressured to expand their scope of practice to manage all hospitalized patients. Hospitalist leaders differ about how much of an issue this really is, as managing hospitalized patients is the definition of hospitalist work. Burke T. Kealey, MD, SFHM, medical director of hospital specialties at HealthPartners Medical Group in St. Paul, Minn., and an SHM board member, points out that “one man’s scope creep is another man’s practice-builder.” John Nelson, MD, MHM, co-founder and past president of SHM and medical director of hospitalist services at Overlake Hospital in Bellevue, Wash., says the expanding service trend is prevalent, but whether “it’s a problem depends on your point of view. The same stressful evolution occurs in every specialty. We are not unique in that regard.”
The trick, according to HM leaders, is to understand the dynamics that drive scope creep, then work proactively to address the problem.
Evolving Scope of Practice
It was not so long ago that hospitalist groups, seen by many in medicine as the new kids on the block, were perceived as a threat to their primary-care and specialist colleagues. To establish themselves, hospitalists began to demonstrate value by comanaging patients for their surgical colleagues, especially orthopedists. Some studies, notably those conducted by Mayo Clinic-based hospitalists, appeared to demonstrate that using hospitalists to help comanage orthopedic surgical patients results in improved outcomes.1,2
Dr. Siegal, however, points out that a closer parsing of those studies reveals that such outcomes as decreased time to surgery and length of stay (LOS) were better for patients with complex medical comorbidities, rather than all patients, which supports his argument that hospitalist comanagement makes most sense when applied to select groups of surgical patients.3

—Eric M. Siegal, MD, SFHM, SHM board member, medical director of critical-care medicine, Aurora St. Luke’s Medical Center, Milwaukee
As HM sprouted roots, clinicians across the country began to see an increase in requests for their services from primary-care physicians (PCPs) and subspecialists, as hospitalists freed them from rounding on patients and allowed them to concentrate on procedures for higher billings. Over the past 10 years, the expansion has been rapid, converging with multiple factors: increasing numbers of uninsured patients, an aging physician workforce, and diminishing reimbursement, to name a few.
Nailing down the extent to which comanagement has expanded HM’s scope of practice as a medical specialty is a slippery exercise. Some HM groups handle comanagement well; others do not. Dr. Kealey says that admitting and comanagement patterns are dependent on the culture of the institution. For example, in one of HealthPartners’ home hospitals, all internal-medicine subspecialties, including neurology, are admitted and managed by hospitalists with a subspecialty consult.
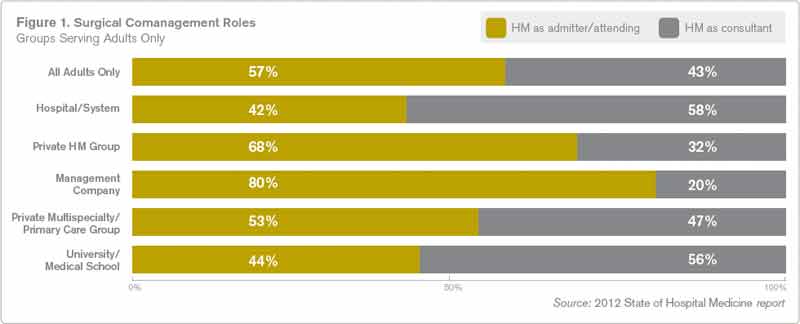
The 2012 State of Hospital Medicine report survey revealed that 85% of respondent hospitalist groups provide surgical comanagement services (see Figure 1, below). That figure has not changed since SHM’s 2005-2006 survey, the last time the question was asked.
Another 20% of respondent hospitalist groups reported providing medical subspecialty comanagement, according to the 2012 report. Dr. Kealey, who is board liaison to SHM’s Practice Analysis Committee, says plans are in the works to add specific questions to the survey to assess another big change in the comanagement arena: a shift from hospitalists acting as consultants with the specialist serving as attending physician to a model in which the hospitalist admits the patient and serves as attending, with the specialist/proceduralist in a consulting role.
So What’s the Problem?
Hospitalists have been both the utility player and the superstar, providing great value to their healthcare teams, says Ken Simone, DO, SFHM, a hospitalist practice-management consultant and CEO of Hospitalist and Practice Solutions in Veazie, Maine. He believes hospitalist program expansions are typically a positive thing.

“Historically, most hospital medicine programs have embraced the call for assistance from both their colleagues and the C-suite,” says Dr. Simone, a Team Hospitalist member.
Dr. Siegal, in his HM07 presentation “Managing Comanagement: How to Play in the Sandbox without Having to Eat Mud Pies” and in journal articles, has cautioned against assuming that all hospitalized patients, irrespective of diagnosis or comorbidities, should be seen by a hospitalist.3 Such a directive can produce a host of unintended negative consequences. Most notably, it can:
- Confuse patients, families, and the care team about who is ultimately responsible for oversight of the patient’s care;
- Place hospitalists in the position of assuming responsibility for patients whose conditions are outside their scope of practice;
- Delay the initiation of appropriate, specialized care;
- Overwork an already stretched hospitalist team, which can lead to burnout; and
- Increase exposure to medical liability by placing hospitalists in situations where they are in over their heads, or by creating novel opportunities for miscommunication between hospitalists and surgeons or specialists.
Pressure Points
Scope creep’s root cause has multiple layers. It can be driven by overworked physicians; by local shortages in a particular specialty; by the bottom line, when procedure-focused physicians and surgeons want to divest themselves of day-to-day management of hospitalized patients; by lifestyle preferences; or by hospitalists’ success.
Jerome C. Siy, MD, SFHM, department head of hospital medicine for HealthPartners and recipient of the 2009 SHM Award for Clinical Excellence, believes the single most important factor behind the pressure to manage more hospitalized patients is the necessity to provide more thorough care when specialists or residents cannot.

“The hours of coverage are expanding in every specialty to a 24/7 model,” he says. “Since we hospitalists were in the hospital already, it became more routine for other services to ask us to get initial orders and the history and physical started, as a bridge to a better coverage model.”
Dr. Kealey says the “bridge” is a point of concern for many HM groups, especially when the pressure comes from hospital administrators attempting to attract specialists. Hospitalists have the right in such situations, says Dr. Siy, to feel undersupported or that they lack crucial knowledge or skill sets. Still, Dr. Kealey sees requests from other physician groups as a positive thing for hospitalists.
“We’re going to be managing more in the future,” he says, noting his HM group first drew up a comanagement agreement with orthopedic surgeons 17 years ago. “We want to go there thoughtfully and carefully. We shouldn’t put our foot down and say no to new opportunity.”
Rules of Engagement
Nearly every hospitalist leader agrees that the key to protecting against scope creep resides with thoughtful, proactive planning. Make sure, they say, that your group is ready to manage the patients you’re being asked to manage (see “Define and Protect Your Scope of Practice,” p. 35).
—Michael Radzienda, MD, SFHM, regional chief medical officer, Sound Physicians, Boston
Michael Radzienda, MD, SFHM, regional chief medical officer at Sound Physicians in the greater Boston area, agrees with Dr. Kealey in that he sees opportunity where others might perceive burden. For example, he notes, the advent of value-based purchasing initiatives, linking payment to quality, will create “huge opportunities for hospitalists.” More than 50% of the quality core measures in these initiatives are related to the Surgical Care Improvement Project (SCIP).4
“Now, more than ever, hospitalists need to align with their partners in the hospital C-suite to help them be successful around those targets,” Dr. Radzienda says. However, he adds, “it behooves the HM teams to be very methodical and not rush this.”
Crafting clear rules of engagement must be handled properly and thoughtfully at the outset, Dr. Radzienda explains, and developing mutual trust and respect between the parties is the most essential step. Logistically, this can present problems.
“Getting surgeons and hospitalists together at a table is hard work,” he says. “But I can’t underscore that more: This requires a relationship. And it’s not something that is done via email exchange or memoranda through the respective practices’ business managers.”

It’s also critical to have nursing on board, says Julie Weegman, RN, MA, OCN, director of nursing and medical surgical services at HealthPartners’ Regions Hospital in St. Paul. “Communication is key in this kind of arrangement,” she says. “Nurses could potentially be put in a bad position if there are tensions between hospitalists and the specialty departments.”
That isn’t the case at Regions, though, where the comanagement agreement between orthopedics and HM has been clearly established, Weegman says. Questions about the surgical site, activity, and weight-bearing are referred to surgeons, while chronic disease management, blood pressure, glucose monitoring, etc., usually are handled by hospitalists.
Dr. Radzienda stresses that patients must remain at the center of the equation. “At three o’clock in the morning, with the post-op ortho patient who is having pain, nausea, or bleeding, it cannot be a multistep process to decide which doc is going to take that call and deliver on the patient’s needs,” he says.
Dr. Nelson, who co-founded SHM and serves as The Hospitalist’s practice-management columnist, cautions that service agreements are not a panacea. “This won’t totally solve your problems,” he says, “because every doctor is authorized to violate agreements if they see fit and if they can prove their patient is the exception to the rule.”
The bottom-line test for Dr. Siegal: Consider the patient’s best interests. Ask yourself, he advises, “if your mother came into the hospital with a head bleed, who would you want her to see first? Hospitalists are not interchangeable with neurosurgeons, and yet, unfortunately, we have started marketing ourselves as being adequate replacements for people who have spent far more time training in a specialty.
“As an intensivist, I’ve got a bit of experience with head bleeds,” he says. “But the neurosurgeon still knows more.”
Gretchen Henkel is a freelance writer in central California.
References
- Huddleston JM, Long KH, Naessens JM, et al. Medical and surgical co-management after elective hip and knee arthroplasty: a randomized, controlled trial. Ann Intern Med. 2004;141(1): 28-38.
- Roy A, Heckman MG, Roy V. Associations between the hospitalist model of care and quality-of-care-related outcomes in patients undergoing hip fracture surgery. Mayo Clin Proc. 2006;81(1):28-31.
- Siegal EM. Just because you can, doesn’t mean that you should: A call for the rational application of hospitalist comanagement. J Hosp Med. 2008;3(5):398-402.
- The Joint Commission. Surgical Care Improvement Project. The Joint Commission website. Available at: http://www.jointcommission.org/surgical_care_improvement_project/. Accessed Sept. 30, 2012.
Eric M. Siegal, MD, SFHM, vividly recalls the moment when he realized “scope creep” had become a problem. A hospitalist partner who was working a night shift admitted a young man who had been in a high-speed motor vehicle accident. The hospitalist did so because the general surgeon did not want to come into the hospital.
Dr. Siegal, currently the medical director of critical-care medicine at Aurora St. Luke’s Medical Center in Milwaukee, remembers looking at his partner and asking, “What the hell are you doing admitting a trauma patient? You’re an internist!”
Dr. Siegal’s partner responded, “I’m just trying to show value.”
“That was an ‘a-ha’ moment for me,” says Dr. Siegal, a member of SHM’s board of directors. It was at that point he began to understand that the expansion strategy used by many HM services—to demonstrate value by agreeing to comanage or admit patients for their primary-care (PCP) and specialist colleagues—had produced some unintended negative consequences. “Hospitalists,” he says, “are like the spackle of the hospital. Sometimes spackle is good; it hides flaws and imperfections. But at other times, people use spackle to fix major structural problems.”
Scope creep, mission creep, scut work: There are numerous ways to describe the phenomenon. In basic terms, hospitalists have been pressured to expand their scope of practice to manage all hospitalized patients. Hospitalist leaders differ about how much of an issue this really is, as managing hospitalized patients is the definition of hospitalist work. Burke T. Kealey, MD, SFHM, medical director of hospital specialties at HealthPartners Medical Group in St. Paul, Minn., and an SHM board member, points out that “one man’s scope creep is another man’s practice-builder.” John Nelson, MD, MHM, co-founder and past president of SHM and medical director of hospitalist services at Overlake Hospital in Bellevue, Wash., says the expanding service trend is prevalent, but whether “it’s a problem depends on your point of view. The same stressful evolution occurs in every specialty. We are not unique in that regard.”
The trick, according to HM leaders, is to understand the dynamics that drive scope creep, then work proactively to address the problem.
Evolving Scope of Practice
It was not so long ago that hospitalist groups, seen by many in medicine as the new kids on the block, were perceived as a threat to their primary-care and specialist colleagues. To establish themselves, hospitalists began to demonstrate value by comanaging patients for their surgical colleagues, especially orthopedists. Some studies, notably those conducted by Mayo Clinic-based hospitalists, appeared to demonstrate that using hospitalists to help comanage orthopedic surgical patients results in improved outcomes.1,2
Dr. Siegal, however, points out that a closer parsing of those studies reveals that such outcomes as decreased time to surgery and length of stay (LOS) were better for patients with complex medical comorbidities, rather than all patients, which supports his argument that hospitalist comanagement makes most sense when applied to select groups of surgical patients.3
—Eric M. Siegal, MD, SFHM, SHM board member, medical director of critical-care medicine, Aurora St. Luke’s Medical Center, Milwaukee
As HM sprouted roots, clinicians across the country began to see an increase in requests for their services from primary-care physicians (PCPs) and subspecialists, as hospitalists freed them from rounding on patients and allowed them to concentrate on procedures for higher billings. Over the past 10 years, the expansion has been rapid, converging with multiple factors: increasing numbers of uninsured patients, an aging physician workforce, and diminishing reimbursement, to name a few.
Nailing down the extent to which comanagement has expanded HM’s scope of practice as a medical specialty is a slippery exercise. Some HM groups handle comanagement well; others do not. Dr. Kealey says that admitting and comanagement patterns are dependent on the culture of the institution. For example, in one of HealthPartners’ home hospitals, all internal-medicine subspecialties, including neurology, are admitted and managed by hospitalists with a subspecialty consult.
The 2012 State of Hospital Medicine report survey revealed that 85% of respondent hospitalist groups provide surgical comanagement services (see Figure 1, below). That figure has not changed since SHM’s 2005-2006 survey, the last time the question was asked.
Another 20% of respondent hospitalist groups reported providing medical subspecialty comanagement, according to the 2012 report. Dr. Kealey, who is board liaison to SHM’s Practice Analysis Committee, says plans are in the works to add specific questions to the survey to assess another big change in the comanagement arena: a shift from hospitalists acting as consultants with the specialist serving as attending physician to a model in which the hospitalist admits the patient and serves as attending, with the specialist/proceduralist in a consulting role.
So What’s the Problem?
Hospitalists have been both the utility player and the superstar, providing great value to their healthcare teams, says Ken Simone, DO, SFHM, a hospitalist practice-management consultant and CEO of Hospitalist and Practice Solutions in Veazie, Maine. He believes hospitalist program expansions are typically a positive thing.
“Historically, most hospital medicine programs have embraced the call for assistance from both their colleagues and the C-suite,” says Dr. Simone, a Team Hospitalist member.
Dr. Siegal, in his HM07 presentation “Managing Comanagement: How to Play in the Sandbox without Having to Eat Mud Pies” and in journal articles, has cautioned against assuming that all hospitalized patients, irrespective of diagnosis or comorbidities, should be seen by a hospitalist.3 Such a directive can produce a host of unintended negative consequences. Most notably, it can:
- Confuse patients, families, and the care team about who is ultimately responsible for oversight of the patient’s care;
- Place hospitalists in the position of assuming responsibility for patients whose conditions are outside their scope of practice;
- Delay the initiation of appropriate, specialized care;
- Overwork an already stretched hospitalist team, which can lead to burnout; and
- Increase exposure to medical liability by placing hospitalists in situations where they are in over their heads, or by creating novel opportunities for miscommunication between hospitalists and surgeons or specialists.
Pressure Points
Scope creep’s root cause has multiple layers. It can be driven by overworked physicians; by local shortages in a particular specialty; by the bottom line, when procedure-focused physicians and surgeons want to divest themselves of day-to-day management of hospitalized patients; by lifestyle preferences; or by hospitalists’ success.
Jerome C. Siy, MD, SFHM, department head of hospital medicine for HealthPartners and recipient of the 2009 SHM Award for Clinical Excellence, believes the single most important factor behind the pressure to manage more hospitalized patients is the necessity to provide more thorough care when specialists or residents cannot.
“The hours of coverage are expanding in every specialty to a 24/7 model,” he says. “Since we hospitalists were in the hospital already, it became more routine for other services to ask us to get initial orders and the history and physical started, as a bridge to a better coverage model.”
Dr. Kealey says the “bridge” is a point of concern for many HM groups, especially when the pressure comes from hospital administrators attempting to attract specialists. Hospitalists have the right in such situations, says Dr. Siy, to feel undersupported or that they lack crucial knowledge or skill sets. Still, Dr. Kealey sees requests from other physician groups as a positive thing for hospitalists.
“We’re going to be managing more in the future,” he says, noting his HM group first drew up a comanagement agreement with orthopedic surgeons 17 years ago. “We want to go there thoughtfully and carefully. We shouldn’t put our foot down and say no to new opportunity.”
Rules of Engagement
Nearly every hospitalist leader agrees that the key to protecting against scope creep resides with thoughtful, proactive planning. Make sure, they say, that your group is ready to manage the patients you’re being asked to manage (see “Define and Protect Your Scope of Practice,” p. 35).
—Michael Radzienda, MD, SFHM, regional chief medical officer, Sound Physicians, Boston
Michael Radzienda, MD, SFHM, regional chief medical officer at Sound Physicians in the greater Boston area, agrees with Dr. Kealey in that he sees opportunity where others might perceive burden. For example, he notes, the advent of value-based purchasing initiatives, linking payment to quality, will create “huge opportunities for hospitalists.” More than 50% of the quality core measures in these initiatives are related to the Surgical Care Improvement Project (SCIP).4
“Now, more than ever, hospitalists need to align with their partners in the hospital C-suite to help them be successful around those targets,” Dr. Radzienda says. However, he adds, “it behooves the HM teams to be very methodical and not rush this.”
Crafting clear rules of engagement must be handled properly and thoughtfully at the outset, Dr. Radzienda explains, and developing mutual trust and respect between the parties is the most essential step. Logistically, this can present problems.
“Getting surgeons and hospitalists together at a table is hard work,” he says. “But I can’t underscore that more: This requires a relationship. And it’s not something that is done via email exchange or memoranda through the respective practices’ business managers.”
It’s also critical to have nursing on board, says Julie Weegman, RN, MA, OCN, director of nursing and medical surgical services at HealthPartners’ Regions Hospital in St. Paul. “Communication is key in this kind of arrangement,” she says. “Nurses could potentially be put in a bad position if there are tensions between hospitalists and the specialty departments.”
That isn’t the case at Regions, though, where the comanagement agreement between orthopedics and HM has been clearly established, Weegman says. Questions about the surgical site, activity, and weight-bearing are referred to surgeons, while chronic disease management, blood pressure, glucose monitoring, etc., usually are handled by hospitalists.
Dr. Radzienda stresses that patients must remain at the center of the equation. “At three o’clock in the morning, with the post-op ortho patient who is having pain, nausea, or bleeding, it cannot be a multistep process to decide which doc is going to take that call and deliver on the patient’s needs,” he says.
Dr. Nelson, who co-founded SHM and serves as The Hospitalist’s practice-management columnist, cautions that service agreements are not a panacea. “This won’t totally solve your problems,” he says, “because every doctor is authorized to violate agreements if they see fit and if they can prove their patient is the exception to the rule.”
The bottom-line test for Dr. Siegal: Consider the patient’s best interests. Ask yourself, he advises, “if your mother came into the hospital with a head bleed, who would you want her to see first? Hospitalists are not interchangeable with neurosurgeons, and yet, unfortunately, we have started marketing ourselves as being adequate replacements for people who have spent far more time training in a specialty.
“As an intensivist, I’ve got a bit of experience with head bleeds,” he says. “But the neurosurgeon still knows more.”
Gretchen Henkel is a freelance writer in central California.
References
- Huddleston JM, Long KH, Naessens JM, et al. Medical and surgical co-management after elective hip and knee arthroplasty: a randomized, controlled trial. Ann Intern Med. 2004;141(1): 28-38.
- Roy A, Heckman MG, Roy V. Associations between the hospitalist model of care and quality-of-care-related outcomes in patients undergoing hip fracture surgery. Mayo Clin Proc. 2006;81(1):28-31.
- Siegal EM. Just because you can, doesn’t mean that you should: A call for the rational application of hospitalist comanagement. J Hosp Med. 2008;3(5):398-402.
- The Joint Commission. Surgical Care Improvement Project. The Joint Commission website. Available at: http://www.jointcommission.org/surgical_care_improvement_project/. Accessed Sept. 30, 2012.
Five Ways to Enhance Your Hospital Medicine Group's Efficiency

Is there a role in HM for industrial engineering or industrial efficiency models? Jonathan Turner, PhD, thinks so. He is an industrial-engineer-turned-hospital-engineer whose job is to help make hospital care safer, faster, less costly, and more satisfying. He has few peers in this role, although any hospitalist group in the vicinity of a college department of engineering could seek out similar expertise there. Real-world problems make the best research projects, he says.
“I wrote my thesis on how a vascular surgery department could use computer simulation models to help balance multiple objectives in scheduling residents,” says Turner, who earned his doctorate at Northwestern University in Evanston, Ill.
His thesis examined, among other things, the need for pre-operative continuity of care and resident exposure to a variety of surgical experiences. He also found himself hanging around Northwestern’s Feinberg School of Medicine in Chicago at a time when Mark Williams, MD, MHM, chief of the division of hospital medicine, was looking for ways to build collaboration between Northwestern’s medical school, hospital, and department of engineering.
“Our objectives were the same,” says Turner, who was hired by Dr. Williams in May 2011.
Turner says many of the challenges of managing an HM group—making patient rounds better, improving length of stay (LOS) and throughput, or deciding how to incorporate technology into practice—can be scrutinized with an efficiency lens. At Northwestern, he optimized the HM group schedule and made it more appealing to the physicians. He examined the incremental costs incurred by patient handoffs and the effectiveness of consultations with medical specialists. He tackled technology, teamwork, and wait-time issues. He even helped surgeons standardize their instrument trays.
But every hospitalist group—from the three-FTE teams covering rural hospitals to high-volume groups with dozens of moving parts—has developed inefficient habits. Experts say most groups have never even thought of the problems, let alone the solutions—for example, regularly inputting data into spreadsheets that no one ever looks at.
Efficiency is an essential target for quality initiatives in the hospital, although the word means different things to different people. It typically involves trade-offs that need to be balanced if the system as a whole is to benefit. What makes an individual practice more efficient could make a group’s less so—and vice versa. What helps one department’s bottom line can harm another’s. Enhancing hospitalists’ work-life balance through schedule modification could make life harder for nurses.
-Jonathan Turner, PhD
One current example that cuts across HM groups of all shapes and sizes is the discharge process. Hospitalist groups speeding up discharges might lead to inadequately prepared patients leaving the hospital, which could mean post-discharge crises, which could lead to unnecessary readmissions, which certainly will mean government penalties. Pure efficiency, in terms of maximizing caseloads, also can conflict with patient safety or patient satisfaction. In many healthcare settings, approaching 100% of capacity limits the ability to respond to surges in demand, Turner says. That usually leads to backups, long waits, dissatisfaction, and even diversions from the ED, he explains.
HM groups have pursued a variety of tools and strategies to enhance efficiency. “One of the things we try to show is that you use these methods every day—but you can be more systematic in how you apply them,” Turner says. The character and personality of practicing hospitalists, who tend to be more quality-minded and focused on systems, might make them more open to becoming efficiency experts and willing to try new approaches.
Still, when engineers talk about efficiency, hospital professionals might feel that it cramps their practice style. “I need to be willing to listen to their concerns,” says Turner, who in September began a new position as director of systems engineering at University Hospital in Augusta, Ga.
“I don’t want to turn patients into widgets. I’d rather be thought of as an axe sharpener—helping people do their work more easily,” he says. “You can’t satisfy everybody, but you at least need to listen to everybody when you try to make their work lives more efficient.”
Following are some examples of how hospitalist groups have improved the efficiency of important aspects of their practice.
1. Specialized Care Plans
It is well known that some of the most challenging hospital patients consume a disproportionate share of costs and resources, says Rick Hilger, MD, SFHM, a hospitalist with HealthPartners at Regions Hospital in St. Paul, Minn. It can be controversial to suggest that these difficult patients should receive special handling, but Dr. Hilger, who presented a poster on the topic at HM12, says the current system isn’t safe for patients or sustainable in the long run.3
At Regions, about 70 high-utilizing patients have been given an ongoing, specialized care plan that is easily accessible in their electronic health record (EHR) whenever they present at a HealthPartners clinic, ED, or hospital. Patients include those with a history of drug-seeking behaviors, antisocial behavior disorders, aggression or noncompliance in the hospital, and a variety of traumatic brain injuries or memory deficits that might cause them to give a different story to every medical provider. They also include patients who simply have very complex medical conditions.
Referrals for a specialized care plan can come from any hospital staff member. A care-planning committee representing HM, case management, social work, emergency medicine, and administrative staffs meets monthly to review cases and decide if each patient would benefit from a specialized care plan. It offers quick access in the EHR to a cover page with common clinical scenarios, recent tests and procedures, and a template for optimal care that can save a lot of time and prevent duplicative or uncoordinated treatments, Dr. Hilger says. It also ensures that clinicians give a consistent message to the patient.
“Our mantra is that we want care plans that are easy to create, easy to find, easy to use, and likely to lead to better coordination of care,” he says. “We also say that if everybody has a specialized care plan, then nobody does. We want the provider—whether physician, case manager, or nurse—to walk away saying that the care plan saved them time and led to safer care.”
In its first two months, Regions saw a 68% reduction in total ED visits and hospital admissions for the 43 patients with specialized care plans.
2. Scheduling Models
A number of scheduling models are used for deploying hospitalists in larger groups, including seven on/seven off, five on/five off, weekdays versus weekends, zoned staffing, and admitters versus rounders. Research has shown an incremental cost for every handoff, and creating a work schedule that results in fewer handoffs might make patients more satisfied. But that goal needs to be balanced against provider schedules with an eye toward keeping caseloads localized in the hospital.
Shalini Chandra, MD, MS, FHM, a hospitalist at Johns Hopkins Bayview Medical Center in Baltimore, was co-presenter of a HM12 workshop on how to use performance-improvement principles to improve HM group schedules. She says the schedule needs to account for such variables as when hospitalists are assigned new patients, are required to interact with the ED, and are devoted to patient contact versus paperwork, which normally is greater at admission and discharge.
“You need to find the sweet spot between the hospital’s needs, the patient’s needs, and the doctor’s needs,” she says. “Our physicians felt they were being penalized for discharging patients in a timely manner [by receiving more new cases]. We had to go back and say, ‘OK, if somebody is doing a four-day stretch, how can we distribute patients more equitably?’”
Dr. Chandra’s quality team mapped out the entire admissions process and identified key metrics, then devised a model called CICLE (Creating Incentives and Continuity Leading to Efficiency in Hospital Medicine) for its four-day shift. The first day, which can be a long one, is front-loaded with new admissions. But on Day Two and Day Three, the hospitalist is largely protected from new admissions, thereby preserving the incentive to discharge patients when they are ready.
CICLE also results in fewer handoffs, with a third of patients seen by only one hospitalist, Dr. Chandra explains. That in turn translates into decreased LOS and cost.
The four-day schedule at Hopkins is complicated by the need to respond to other demands on the system, and Dr. Chandra says only 60 percent of the hospitalist caseload is scheduled this way.

—Rick Hilger, MD, SFHM
3. Individual Flexibility
The best schedule in the world can be turned upside down by vacations, sickness, or an open position that goes unfilled for months. Accounting for the nuances can be a full-time job.
At Northwestern, the hospitalist group is converting to scheduling software called Lightning Bolt (www.lightning-bolt.com) that provides flexibility to respond to varying needs among the 70-plus members of the group, including such needs as attending their children’s soccer games, says Charlotta Weaver, MD, assistant professor of medicine.
“An enormous amount of time, both administrative and medical, gets devoted to scheduling,” she says.
Each hospital and HM group is different, and each physician has varying desires from the schedule. “Things are constantly changing,” Dr. Weaver says. “People come and go or need to change jobs, there are changes in FTE allocations, physicians may get research grants, and there can be changes in hospital structure or service lines.”
The schedule also needs to facilitate “day trading” between members of the group, and Northwestern is experimenting with some new approaches, including pairing up two physicians on one service line and letting them work out their own schedules.
The group also needs a way to respond to admission surges beyond the capacity of scheduled physicians, which can be hard to predict, and the days when physicians call in sick.
“We have tried to develop a robust system of ‘jeopardy’ for first- and second-line backup,” Dr. Weaver says. Everyone in the hospitalist group has jeopardy one or two weeks per year, where they are in line to be called in if needed.
Franziska Jovin, MD, FHM, a hospitalist at the University of Pittsburgh Medical Center, says her group struggles with predicting patient peaks and valleys.
“One of our hospitalist teams is responsible for the transitional-care unit, and not every patient on that unit has to be seen every day,” Dr. Jovin says. “This person is already scheduled to work, but the responsibilities are not time-dependent. So we can pull in that doctor as needed to cover higher demand on the acute side.”
As most hospitalists know the winter months are busier, “and we staff accordingly,” she says, in response to higher incidence of flu, pneumonia, and the like.
4. Structured Rounds
Another challenge to scheduling is the rounding model used for daily care planning in the hospital. Various models have tried to address competing concerns of geography, schedule efficiency, and the needs of hospitalists, nurses, and other staff. At Emory Healthcare in Atlanta, an approach called Structured Interdisciplinary Bedside Rounds (SIBR) was described during an HM12 workshop and in a prize-winning poster presented by Christina Payne, MD (see “The Innovation Express,” May 2012, p. 27).
Dr. Payne described how SIBR works with two teaching hospitalist services on a 24-bed “accountable-care unit” at Emory University Hospital. Each team has a resident, three interns, a social worker, and the patient’s nurse, with the attending standing by.
“We round on each patient every day—beginning and ending on time,” 12 patients per hour, with five brisk minutes to report on each patient, she says. Rounding starts when the patient’s primary intern and nurse are both present in the patient’s room, and only ends when a plan of care for the day has been articulated—using a standardized script with safety and discharge planning checklists. The second intern enters the plan, in real time, into the EHR.
In addition to the time efficiency, this approach has posted positive outcomes, namely a 53% reduction in in-hospital mortality on the unit and an 11% reduction in LOS. With new residents and interns rotating through the unit every month, “We acknowledge to them that this will be difficult and they will be uncomfortable at first,” Dr. Payne says, “but by Week Two, we’re a well-oiled machine.”
Similar approaches have been implemented at other Emory hospitals.
5. NPP Mobilization
Many hospitalist groups have integrated nonphysician providers (NPPs, or nurse practitioners and physician assistants) into the group’s practice or are considering such a move. Tracy Cardin, ACNP-BC, a nurse practitioner in hospital practice at the University of Chicago Medical Center, says it’s important to ask why a group is considering a role for NPPs.
“Is it to promote efficiency? Is it because you can’t attract enough physicians?” she says. “Clarify your hopes for the position and how you will define success.” She also says HM group leaders need to factor in the time needed to hire, orient, and train an NPP, with mentoring that includes structured teaching and feedback.
There are a lot of models for deploying NPPs, says Cardin, a Team Hospitalist member.
“We utilize shared billing and teams of a hospitalist and nurse practitioner. This allows the physician to see a larger number of patients and brings more than one set of eyes and ears to the complex patient,” she says. “We’ve developed a process over the past six years where the hospitalist and NPP together go over the patient list every day. Both will see the patient, but the NPP commonly writes the notes and orders.”
Cardin emphasizes NPPs cost less than physicians and “can do many of the same things,” but “they are not free.” The most resourceful HM group’s use NPPs to extend the physician’s practice. “They can carry a pager and respond to small crises that come up, or see the patient on discharge day,” she says. “In other settings, the NPP does admissions, serves on quality projects, takes on a patient cohort based on diagnosis, or calls the primary-care physician at discharge.”
Efficiency can be a tough nut to crack in the hospital. Turner, the engineer, says HM groups need to “remember that the hospital is a very complex environment, with cascades of reactions and downstream effects.”
Hospitalists need the support of other professionals, and quality-improvement (QI) initiatives need sufficient time and resources to succeed.
One way to start advancing the efficiency agenda is to look for bright spots among the hospitalist group’s members. “Talk to them,” Turner says. “Find out how they do their jobs. Learn from them.”
Larry Beresford is a freelance author in Oakland, Calif.
References
- Yu D, Sanches S. Lean inpatient unit base care model [abstract]. J Hosp Med. 2012;7(Suppl 2):S107.
- Payne C, Odetoyinbo D, Castle B, et al. A dual hospital care and training model: structured interdisciplinary team rounds in an accountable care unit [abstract]. J Hosp Med. 2012;7(Suppl 2):S125.
- Hilger R, Quirk R, Dahms R. Use of restriction care plans to decrease medically unnecessary admissions and emergency department visits [abstract]. J Hosp Med. 2012;7(Suppl 2):S2.
- Premier. Year Three: QUEST Collaborative Findings. Premier website. Available at: http://www.premierinc.com/quality-safety/tools-services/quest/year3/quest-year-3-collaborative-findings.pdf. Accessed Sept. 26, 2012.
Is there a role in HM for industrial engineering or industrial efficiency models? Jonathan Turner, PhD, thinks so. He is an industrial-engineer-turned-hospital-engineer whose job is to help make hospital care safer, faster, less costly, and more satisfying. He has few peers in this role, although any hospitalist group in the vicinity of a college department of engineering could seek out similar expertise there. Real-world problems make the best research projects, he says.
“I wrote my thesis on how a vascular surgery department could use computer simulation models to help balance multiple objectives in scheduling residents,” says Turner, who earned his doctorate at Northwestern University in Evanston, Ill.
His thesis examined, among other things, the need for pre-operative continuity of care and resident exposure to a variety of surgical experiences. He also found himself hanging around Northwestern’s Feinberg School of Medicine in Chicago at a time when Mark Williams, MD, MHM, chief of the division of hospital medicine, was looking for ways to build collaboration between Northwestern’s medical school, hospital, and department of engineering.
“Our objectives were the same,” says Turner, who was hired by Dr. Williams in May 2011.
Turner says many of the challenges of managing an HM group—making patient rounds better, improving length of stay (LOS) and throughput, or deciding how to incorporate technology into practice—can be scrutinized with an efficiency lens. At Northwestern, he optimized the HM group schedule and made it more appealing to the physicians. He examined the incremental costs incurred by patient handoffs and the effectiveness of consultations with medical specialists. He tackled technology, teamwork, and wait-time issues. He even helped surgeons standardize their instrument trays.
But every hospitalist group—from the three-FTE teams covering rural hospitals to high-volume groups with dozens of moving parts—has developed inefficient habits. Experts say most groups have never even thought of the problems, let alone the solutions—for example, regularly inputting data into spreadsheets that no one ever looks at.
Efficiency is an essential target for quality initiatives in the hospital, although the word means different things to different people. It typically involves trade-offs that need to be balanced if the system as a whole is to benefit. What makes an individual practice more efficient could make a group’s less so—and vice versa. What helps one department’s bottom line can harm another’s. Enhancing hospitalists’ work-life balance through schedule modification could make life harder for nurses.
-Jonathan Turner, PhD
One current example that cuts across HM groups of all shapes and sizes is the discharge process. Hospitalist groups speeding up discharges might lead to inadequately prepared patients leaving the hospital, which could mean post-discharge crises, which could lead to unnecessary readmissions, which certainly will mean government penalties. Pure efficiency, in terms of maximizing caseloads, also can conflict with patient safety or patient satisfaction. In many healthcare settings, approaching 100% of capacity limits the ability to respond to surges in demand, Turner says. That usually leads to backups, long waits, dissatisfaction, and even diversions from the ED, he explains.
HM groups have pursued a variety of tools and strategies to enhance efficiency. “One of the things we try to show is that you use these methods every day—but you can be more systematic in how you apply them,” Turner says. The character and personality of practicing hospitalists, who tend to be more quality-minded and focused on systems, might make them more open to becoming efficiency experts and willing to try new approaches.
Still, when engineers talk about efficiency, hospital professionals might feel that it cramps their practice style. “I need to be willing to listen to their concerns,” says Turner, who in September began a new position as director of systems engineering at University Hospital in Augusta, Ga.
“I don’t want to turn patients into widgets. I’d rather be thought of as an axe sharpener—helping people do their work more easily,” he says. “You can’t satisfy everybody, but you at least need to listen to everybody when you try to make their work lives more efficient.”
Following are some examples of how hospitalist groups have improved the efficiency of important aspects of their practice.
1. Specialized Care Plans
It is well known that some of the most challenging hospital patients consume a disproportionate share of costs and resources, says Rick Hilger, MD, SFHM, a hospitalist with HealthPartners at Regions Hospital in St. Paul, Minn. It can be controversial to suggest that these difficult patients should receive special handling, but Dr. Hilger, who presented a poster on the topic at HM12, says the current system isn’t safe for patients or sustainable in the long run.3
At Regions, about 70 high-utilizing patients have been given an ongoing, specialized care plan that is easily accessible in their electronic health record (EHR) whenever they present at a HealthPartners clinic, ED, or hospital. Patients include those with a history of drug-seeking behaviors, antisocial behavior disorders, aggression or noncompliance in the hospital, and a variety of traumatic brain injuries or memory deficits that might cause them to give a different story to every medical provider. They also include patients who simply have very complex medical conditions.
Referrals for a specialized care plan can come from any hospital staff member. A care-planning committee representing HM, case management, social work, emergency medicine, and administrative staffs meets monthly to review cases and decide if each patient would benefit from a specialized care plan. It offers quick access in the EHR to a cover page with common clinical scenarios, recent tests and procedures, and a template for optimal care that can save a lot of time and prevent duplicative or uncoordinated treatments, Dr. Hilger says. It also ensures that clinicians give a consistent message to the patient.
“Our mantra is that we want care plans that are easy to create, easy to find, easy to use, and likely to lead to better coordination of care,” he says. “We also say that if everybody has a specialized care plan, then nobody does. We want the provider—whether physician, case manager, or nurse—to walk away saying that the care plan saved them time and led to safer care.”
In its first two months, Regions saw a 68% reduction in total ED visits and hospital admissions for the 43 patients with specialized care plans.
2. Scheduling Models
A number of scheduling models are used for deploying hospitalists in larger groups, including seven on/seven off, five on/five off, weekdays versus weekends, zoned staffing, and admitters versus rounders. Research has shown an incremental cost for every handoff, and creating a work schedule that results in fewer handoffs might make patients more satisfied. But that goal needs to be balanced against provider schedules with an eye toward keeping caseloads localized in the hospital.
Shalini Chandra, MD, MS, FHM, a hospitalist at Johns Hopkins Bayview Medical Center in Baltimore, was co-presenter of a HM12 workshop on how to use performance-improvement principles to improve HM group schedules. She says the schedule needs to account for such variables as when hospitalists are assigned new patients, are required to interact with the ED, and are devoted to patient contact versus paperwork, which normally is greater at admission and discharge.
“You need to find the sweet spot between the hospital’s needs, the patient’s needs, and the doctor’s needs,” she says. “Our physicians felt they were being penalized for discharging patients in a timely manner [by receiving more new cases]. We had to go back and say, ‘OK, if somebody is doing a four-day stretch, how can we distribute patients more equitably?’”
Dr. Chandra’s quality team mapped out the entire admissions process and identified key metrics, then devised a model called CICLE (Creating Incentives and Continuity Leading to Efficiency in Hospital Medicine) for its four-day shift. The first day, which can be a long one, is front-loaded with new admissions. But on Day Two and Day Three, the hospitalist is largely protected from new admissions, thereby preserving the incentive to discharge patients when they are ready.
CICLE also results in fewer handoffs, with a third of patients seen by only one hospitalist, Dr. Chandra explains. That in turn translates into decreased LOS and cost.
The four-day schedule at Hopkins is complicated by the need to respond to other demands on the system, and Dr. Chandra says only 60 percent of the hospitalist caseload is scheduled this way.
—Rick Hilger, MD, SFHM
3. Individual Flexibility
The best schedule in the world can be turned upside down by vacations, sickness, or an open position that goes unfilled for months. Accounting for the nuances can be a full-time job.
At Northwestern, the hospitalist group is converting to scheduling software called Lightning Bolt (www.lightning-bolt.com) that provides flexibility to respond to varying needs among the 70-plus members of the group, including such needs as attending their children’s soccer games, says Charlotta Weaver, MD, assistant professor of medicine.
“An enormous amount of time, both administrative and medical, gets devoted to scheduling,” she says.
Each hospital and HM group is different, and each physician has varying desires from the schedule. “Things are constantly changing,” Dr. Weaver says. “People come and go or need to change jobs, there are changes in FTE allocations, physicians may get research grants, and there can be changes in hospital structure or service lines.”
The schedule also needs to facilitate “day trading” between members of the group, and Northwestern is experimenting with some new approaches, including pairing up two physicians on one service line and letting them work out their own schedules.
The group also needs a way to respond to admission surges beyond the capacity of scheduled physicians, which can be hard to predict, and the days when physicians call in sick.
“We have tried to develop a robust system of ‘jeopardy’ for first- and second-line backup,” Dr. Weaver says. Everyone in the hospitalist group has jeopardy one or two weeks per year, where they are in line to be called in if needed.
Franziska Jovin, MD, FHM, a hospitalist at the University of Pittsburgh Medical Center, says her group struggles with predicting patient peaks and valleys.
“One of our hospitalist teams is responsible for the transitional-care unit, and not every patient on that unit has to be seen every day,” Dr. Jovin says. “This person is already scheduled to work, but the responsibilities are not time-dependent. So we can pull in that doctor as needed to cover higher demand on the acute side.”
As most hospitalists know the winter months are busier, “and we staff accordingly,” she says, in response to higher incidence of flu, pneumonia, and the like.
4. Structured Rounds
Another challenge to scheduling is the rounding model used for daily care planning in the hospital. Various models have tried to address competing concerns of geography, schedule efficiency, and the needs of hospitalists, nurses, and other staff. At Emory Healthcare in Atlanta, an approach called Structured Interdisciplinary Bedside Rounds (SIBR) was described during an HM12 workshop and in a prize-winning poster presented by Christina Payne, MD (see “The Innovation Express,” May 2012, p. 27).
Dr. Payne described how SIBR works with two teaching hospitalist services on a 24-bed “accountable-care unit” at Emory University Hospital. Each team has a resident, three interns, a social worker, and the patient’s nurse, with the attending standing by.
“We round on each patient every day—beginning and ending on time,” 12 patients per hour, with five brisk minutes to report on each patient, she says. Rounding starts when the patient’s primary intern and nurse are both present in the patient’s room, and only ends when a plan of care for the day has been articulated—using a standardized script with safety and discharge planning checklists. The second intern enters the plan, in real time, into the EHR.
In addition to the time efficiency, this approach has posted positive outcomes, namely a 53% reduction in in-hospital mortality on the unit and an 11% reduction in LOS. With new residents and interns rotating through the unit every month, “We acknowledge to them that this will be difficult and they will be uncomfortable at first,” Dr. Payne says, “but by Week Two, we’re a well-oiled machine.”
Similar approaches have been implemented at other Emory hospitals.
5. NPP Mobilization
Many hospitalist groups have integrated nonphysician providers (NPPs, or nurse practitioners and physician assistants) into the group’s practice or are considering such a move. Tracy Cardin, ACNP-BC, a nurse practitioner in hospital practice at the University of Chicago Medical Center, says it’s important to ask why a group is considering a role for NPPs.
“Is it to promote efficiency? Is it because you can’t attract enough physicians?” she says. “Clarify your hopes for the position and how you will define success.” She also says HM group leaders need to factor in the time needed to hire, orient, and train an NPP, with mentoring that includes structured teaching and feedback.
There are a lot of models for deploying NPPs, says Cardin, a Team Hospitalist member.
“We utilize shared billing and teams of a hospitalist and nurse practitioner. This allows the physician to see a larger number of patients and brings more than one set of eyes and ears to the complex patient,” she says. “We’ve developed a process over the past six years where the hospitalist and NPP together go over the patient list every day. Both will see the patient, but the NPP commonly writes the notes and orders.”
Cardin emphasizes NPPs cost less than physicians and “can do many of the same things,” but “they are not free.” The most resourceful HM group’s use NPPs to extend the physician’s practice. “They can carry a pager and respond to small crises that come up, or see the patient on discharge day,” she says. “In other settings, the NPP does admissions, serves on quality projects, takes on a patient cohort based on diagnosis, or calls the primary-care physician at discharge.”
Efficiency can be a tough nut to crack in the hospital. Turner, the engineer, says HM groups need to “remember that the hospital is a very complex environment, with cascades of reactions and downstream effects.”
Hospitalists need the support of other professionals, and quality-improvement (QI) initiatives need sufficient time and resources to succeed.
One way to start advancing the efficiency agenda is to look for bright spots among the hospitalist group’s members. “Talk to them,” Turner says. “Find out how they do their jobs. Learn from them.”
Larry Beresford is a freelance author in Oakland, Calif.
References
- Yu D, Sanches S. Lean inpatient unit base care model [abstract]. J Hosp Med. 2012;7(Suppl 2):S107.
- Payne C, Odetoyinbo D, Castle B, et al. A dual hospital care and training model: structured interdisciplinary team rounds in an accountable care unit [abstract]. J Hosp Med. 2012;7(Suppl 2):S125.
- Hilger R, Quirk R, Dahms R. Use of restriction care plans to decrease medically unnecessary admissions and emergency department visits [abstract]. J Hosp Med. 2012;7(Suppl 2):S2.
- Premier. Year Three: QUEST Collaborative Findings. Premier website. Available at: http://www.premierinc.com/quality-safety/tools-services/quest/year3/quest-year-3-collaborative-findings.pdf. Accessed Sept. 26, 2012.
Hospitalists' Voices to be Heard on Capitol Hill
Every year, hundreds of thousands of people from all parts of the country travel to Washington, D.C., and visit Congress. Regardless of the organizations they represent, almost all of them have one thing in common: They go to Capitol Hill with an “ask.”
Some ask for a vote on a particular piece of legislation; some request funding for their projects. Regardless, there is almost always an ask.
But hospitalists are different, according to SHM Public Policy Committee chair Ron Greeno, MD, FCCP, MHM, and committee member Brad Flansbaum, DO, MPH, SFHM. They are featured in a new video about “Hospitalists on the Hill,” SHM’s day to meet with members of Congress.
Rather than lobbying or asking for assistance, hospitalists bring solutions to the healthcare problems currently vexing communities throughout the country. By introducing the hospitalist model and its role in quality improvement (QI) to some of the most influential government figures in public health, hospitalists who make the visit to Capitol Hill help to spread some of the best practices in hospital-based healthcare and share their personal experiences at the same time.
“Every constituency that comes in is asking them for something,” Dr. Greeno says in one of the SHM-produced videos. “We don’t ask for anything. We offer. We offer our expertise. We offer to help them make better decisions than they would make otherwise.”
That contribution matters to members of Congress and their healthcare staff. Drs. Greeno and Flansbaum are “Hill Day” veterans who have seen firsthand how legislators and their staff absorb SHM’s message and materials.
“I thought that if we are leaving materials behind, that the minute we walk out of the office, it was going in the trash,” Dr. Greeno says. “That’s not what happens. They read this stuff.”
In 2013, Hospitalists on the Hill will take place May 16, the day before the official start of HM’s annual meeting at the Gaylord National Resort & Convention Center in National Harbor, Md., just a few minutes south of Washington, D.C. The agenda is ambitious, starting with a briefing about what to expect when meeting Congress members on Capitol Hill, followed by a full day of meetings with policymakers, regulators, and their staff.
“We spend our day going back and forth, from the Senate side of the Capitol to the House side of the Capitol, in and out of the office buildings, walking the halls of Congress,” Dr. Greeno says. “It’s a blast. It’s so interesting. And we’re getting a chance to sit down and deliver our message.”
For Dr. Flansbaum, it’s an opportunity to promote action in Washington.
“It really brings government to life,” he says. “You realize that, as bottlenecked as things might be sometimes, things have to get done.”
HM13 attendees can sign-up for Hospitalists on the Hill during annual-meeing registration. For more information, visit www.hospitalmedicine2013.org/onthehill.
Brendon Shank is SHM’s associate vice president of communications.
We Welcome the Newest SHM Members
Enter text here
Enter text here
Enter text here
Register Now for Hospital Medicine 2013
HM12 in San Diego was the largest gathering of hospitalists in history. Approximately 2,700 hospitalists shared in the common successes and challenges facing HM and the healthcare system.
Organizers expect HM13 will have the same energy and even more opportunities for education and networking. The annual meeting returns to the nation’s capital this spring, with pre-courses beginning May 16 at the Gaylord National Resort & Convention Center in National Harbor, Md. The three-day regular meeting begins May 17.
Registration is available at www.hospitalmedicine2013.org. The meeting website is the top source for news about program updates, educational sessions, and special promotions.
Here are five tips for planning your trip to HM13:
- Request time off early and coordinate with colleagues. Now is the time to request the time off.
- Register soon. Early registration discounts only apply for the next few months. And pre-courses often fill up quickly.
- Consider your options. Come a day early for valuable pre-courses or SHM’s “Hospitalists on the Hill” visit to Washington, D.C.
- Make a vacation of it. Take advantage of all that Washington has to offer by staying through the following weekend.
- Network ahead of time. Many hospitalists use the annual meeting for valuable career networking. Get started early by booking meetings and telling colleagues via Facebook, Twitter, and LinkedIn that you’re attending.
SHM Committee Applications due December 3
Are you looking to make a big impact on hospital medicine? Are you ready to network with innovative leaders in the specialty?
Now is the time to take the lead: Apply for a position on one of SHM’s many committees. Dec. 3 is the deadline for nominations.
The 2013-2014 term will commence May 17, 2013, and run through April 2014. Appointments will be made in February, at which time nominees will be told whether they were placed on a committee.
For more information or to apply, visit www.hospitalmedicine.org/committees.
Fellows Application Deadline Approaching for SHM Members
More than 1,000 SHM members have become Fellows, Senior Fellows, or Masters in Hospital Medicine. The FHM, SFHM, and MHM designations are SHM’s exclusive way for members to concretely demonstrate their experience and commitment to quality improvement (QI) and other core tenets of the specialty.
Successful candidates will be inducted as Fellows during the plenary sessions at HM13, May 16-19 in National Harbor, Md.
For the first time, hospitalists can apply online at www.hospitalmedicine.org/fellows.
New 'Meaningful Use' Exemption is Valuable Option for Growing Number of Hospitalists
Hospital-based eligible professionals do not qualify for the Medicare or Medicaid electronic health record (EHR) incentive program or the impending payment penalties for not being “meaningful users” of EHR technology.
A hospital-based “eligible professional” (EP) is defined by the Centers for Medicare & Medicaid Services (CMS) as an EP who furnishes 90% or more of their covered professional services in either the inpatient or emergency departments of a hospital. This exemption applies to most hospitalists and recognizes they have very little control over whether their respective institutions invest in this technology.
Although this 90% threshold should qualify most hospitalists for the exemption, it does not tell the entire story. A growing number of hospitalists are spending time rounding in skilled nursing or other post-acute facilities, and some are focusing the entirety of their practice in the post-acute setting. Under the current CMS definition, these hospitalists are not hospital-based and will, therefore, be subject to the upcoming penalties for not being meaningful users of EHR technology.
Contrary to the 90% threshold, the reality for post-acute hospitalists is that when it comes to EHRs, they are no different than their hospital-based colleagues. A hospitalist, irrespective of setting, has very little control over what kind of technology, if any, a facility invests in.
For hospitalists who are rounding or spending more of their practice time in post-acute facilities, this mechanical classification based on practice location alone is problematic. A physician-implemented EHR is not practical and does not make sense given the unique practice patterns of hospitalists. Although SHM remains strongly committed to the promise represented by health information technology (HIT), SHM consistently has noted to CMS that hospitalist practice does not always fit the confines of their rulemaking.
Hospitalists should not be penalized for failure to implement their own HIT, because they already use facility EHRs or lack control over the availability of EHR systems. It is for these reasons that SHM has been a strong advocate for an additional exemption that works for hospitalists—an exemption that recognizes lack of control of availability.
In August, CMS released the final rule for Stage 2 of Meaningful Use, and the voice of hospitalists was clearly heard. The rule includes an SHM advanced-hardship exemption acknowledging that EPs who practice in multiple locations, such as nursing homes, could face a significant hardship as they would have no way to control the use of Certified EHR Technology (CEHRT). In promulgating the exemption, CMS specifically states that a “physician merely sees patients at the center or home, and does not have any other interest in the facility; they would exert little to no influence over whether the nursing home, center, or other similar outpatient site adopts and implements CEHRT.” Hospitalists seeking this exemption would need to apply annually for up to five years.
This hardship exemption could apply to hospitalists who work in multiple facilities outside of hospitals, such as nursing homes. Although imperfect due to the time-limited nature, the exemption represents a victory in the effort to differentiate HM from traditional practice patterns. It is precisely this difference that makes HM uniquely positioned to lead changes in the healthcare system.
Josh Boswell is SHM’s interim senior manager of government relations.
Turnover for Hospitalist Groups Steady at 10%
How many hospitalists left your group during the past year? If you're lucky, your group is one of the 36% of adult medicine groups that had no turnover at all. The proportion of groups with no turnover has ranged from a low of 32% (in the 2008-2009 SHM Focused Survey) to a high of 39% (2005-2006 and 2007-2008 SHM biannual surveys), so the 2012 results appear to be right in line with previous years.
But what about the groups that did encounter turnover? SHM's 2012 State of Hospital Medicine Report, which is based on 2011 data, reported a median turnover rate of 10% for nonacademic HM groups serving adults only. That's a little higher than last year's rate but lower than the rate reported in the 2010 SHM/MGMA survey. (It's worth keeping in mind that, in 2012, SHM conducted its own survey separate from MGMA, so the results might not be directly comparable to the previous two years' SHM/MGMA surveys.)
What part of the country you practice in and who employs you matters. In 2012, groups in the Western region of the U.S. reported only about 5% turnover, compared with 10% or 11% in other parts of the country. Turnover also varied by ownership/employment model: Groups employed by management companies and university/medical schools reported higher-than-median turnover; private hospitalist groups and those employed by multispecialty groups reported lower turnover. And medium-sized groups (five to 19 hospitalist FTEs) reported higher turnover than very small or larger groups.
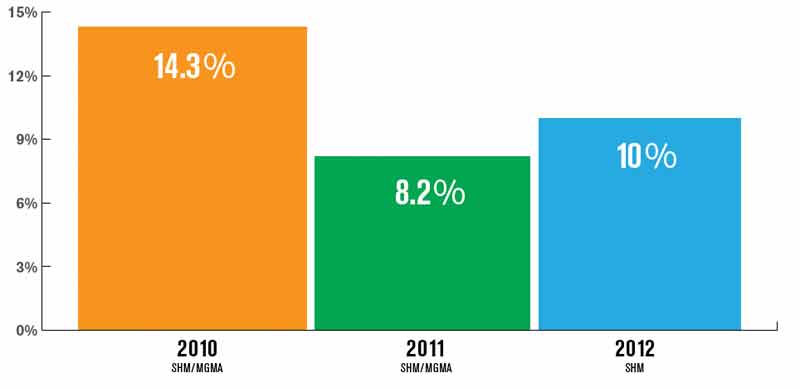
The report also includes turnover rates for physician assistants (PAs) and nurse practitioners (NPs). Interestingly, turnover was much lower among NPs and PAs, with around 70% of the adult medicine groups who used NP/PAs reporting no NP/PA turnover at all.
Some folks have speculated that hospitalist turnover will decline as the supply of hospitalists begins to catch up with demand, which seems reasonable. Although we can't assess turnover data at this level of granularity, I'm guessing that turnover in highly-sought-after metropolitan markets, such as Washington, New York City, and Seattle, already is trending lower than in areas that are harder to recruit to.
But as far back as its 2005-2006 survey, SHM reported median turnover of 9%—not meaningfully different from this year's survey results. I suspect hospitalist turnover will continue to hover in the 10% to 15% range for the foreseeable future. Part of that figure can be attributed to the fact that significant numbers of hospitalists working in remote locations are international medical graduates on H-1B and J-1 visas. They typically make a three-year commitment, then move on to a more desirable location. But I think it's also because of the kinds of people who are attracted to hospital medicine.
As my colleague John Nelson, MD, MHM, likes to say, "hospitalists tend to want to date their practice, rather than marry it."
HM jobs have low barriers to entry and exit, at least compared with traditional primary care, which involves building an infrastructure and a panel of patients over many years. HM likely will continue to attract clinicians who enjoy looking around and changing jobs periodically. It will be interesting to see what the next few years bring to our specialty.
Leslie Flores is a partner in Nelson Flores Hospital Medicine Consultants and SHM Practice Analysis Committee member.
How many hospitalists left your group during the past year? If you're lucky, your group is one of the 36% of adult medicine groups that had no turnover at all. The proportion of groups with no turnover has ranged from a low of 32% (in the 2008-2009 SHM Focused Survey) to a high of 39% (2005-2006 and 2007-2008 SHM biannual surveys), so the 2012 results appear to be right in line with previous years.
But what about the groups that did encounter turnover? SHM's 2012 State of Hospital Medicine Report, which is based on 2011 data, reported a median turnover rate of 10% for nonacademic HM groups serving adults only. That's a little higher than last year's rate but lower than the rate reported in the 2010 SHM/MGMA survey. (It's worth keeping in mind that, in 2012, SHM conducted its own survey separate from MGMA, so the results might not be directly comparable to the previous two years' SHM/MGMA surveys.)
What part of the country you practice in and who employs you matters. In 2012, groups in the Western region of the U.S. reported only about 5% turnover, compared with 10% or 11% in other parts of the country. Turnover also varied by ownership/employment model: Groups employed by management companies and university/medical schools reported higher-than-median turnover; private hospitalist groups and those employed by multispecialty groups reported lower turnover. And medium-sized groups (five to 19 hospitalist FTEs) reported higher turnover than very small or larger groups.
The report also includes turnover rates for physician assistants (PAs) and nurse practitioners (NPs). Interestingly, turnover was much lower among NPs and PAs, with around 70% of the adult medicine groups who used NP/PAs reporting no NP/PA turnover at all.
Some folks have speculated that hospitalist turnover will decline as the supply of hospitalists begins to catch up with demand, which seems reasonable. Although we can't assess turnover data at this level of granularity, I'm guessing that turnover in highly-sought-after metropolitan markets, such as Washington, New York City, and Seattle, already is trending lower than in areas that are harder to recruit to.
But as far back as its 2005-2006 survey, SHM reported median turnover of 9%—not meaningfully different from this year's survey results. I suspect hospitalist turnover will continue to hover in the 10% to 15% range for the foreseeable future. Part of that figure can be attributed to the fact that significant numbers of hospitalists working in remote locations are international medical graduates on H-1B and J-1 visas. They typically make a three-year commitment, then move on to a more desirable location. But I think it's also because of the kinds of people who are attracted to hospital medicine.
As my colleague John Nelson, MD, MHM, likes to say, "hospitalists tend to want to date their practice, rather than marry it."
HM jobs have low barriers to entry and exit, at least compared with traditional primary care, which involves building an infrastructure and a panel of patients over many years. HM likely will continue to attract clinicians who enjoy looking around and changing jobs periodically. It will be interesting to see what the next few years bring to our specialty.
Leslie Flores is a partner in Nelson Flores Hospital Medicine Consultants and SHM Practice Analysis Committee member.
Off-Label Use of Antipsychotics for Dementia Patients Discouraged
Hospitalists can play a major role in reducing deaths that come as a result of off-label prescriptions for antipsychotic drugs being given to dementia patients, according to the Centers for Medicare & Medicaid Services (CMS) and SHM.
In a letter to hospitalist leaders, SHM encouraged hospitalists to “partner with others in your clinical work environment to reduce the use of antipsychotics for treating behavioral problems in patients with dementia. We believe that hospitalists have an important role to play in this initiative; hospital-based clinicians frequently care for patients with dementia and are responsible for medications prescribed during a patient’s hospitalization and at discharge.”
The joint education effort by CMS and SHM is based on an April 2011 report from the U.S. Department of Health and Human Services’ Office of Inspector General (OIG) that found that antipsychotic medications sometimes are used to treat patients with dementia for off-label reasons (e.g. “behaviors”) or against black-box warnings despite potential dangers to patients’ health.
An earlier warning from the FDA in 2008 outlined the potential dangers as:
- Increased risk (60% to 70%) of death in older adults with dementia;
- Prolongation of the QT interval on electrocardiogram, particularly with intravenous haloperidol use;
- Increased risk of stroke and TIAs; and
- Worsening cognitive function.
The letter to hospitalists noted the necessary changes and the need for collaboration between SHM, its members, and hospital leaders. “Increased prescriber training and system practice changes will help reduce unnecessary antipsychotic drug prescribing,” the letter stated. “SHM looks forward to an ongoing collaboration with members and hospital leaders on this important patient safety concern.”