User login
Flaxseed
Linum usitatissimum, an annual plant native to the eastern Mediterranean and India and better known as flax (or linseed, several decades ago), was cultivated in ancient Egypt and Ethiopia and used for many purposes, including as an ingredient in medicine, soap, and hair products. The oil from the seeds of the plant is thought to possess significant health benefits. Flaxseed oil is one of the richest sources of omega-3 fatty acids, in particular, alpha-linolenic acid (ALA), which represents more than 50% of its total fatty acid content (Br. J. Nutr. 2009;101:440-5; Medical Herbalism: The science and practice of herbal medicine. Healing Arts Press: Rochester, Vt., 2003, p. 57). In addition, flaxseeds are rich in dietary fiber and lignans, which are phytoestrogens with antioxidant properties.

Antioxidant, anti-inflammatory, and antiapoptotic properties have been associated with flaxseed oil and warrant medical consideration. The substantial anti-inflammatory activity of L. usitatissimum has been ascribed to its primary active constituent, ALA (57%), which suppresses arachidonic acid metabolism, thus inhibiting the synthesis of proinflammatory n-6 eicosanoids and reducing vascular permeability (Inflammopharmacology 2010;18:127-36).
In a randomized, double-blind, placebo-controlled application test in 2009, De Spirt et al. studied the cutaneous effects of supplementation with flaxseed or borage oil for 12 weeks in two groups of women (n = 45) aged 18-65 years with sensitive and dry skin. Fifteen women were included in each group, and 15 were randomized to a placebo control group. The placebo group received medium-chain fatty acids. The flaxseed oil included ALA and linoleic acid, and the borage oil contained linoleic and gamma-linolenic acids. ALA contributed to the significant rise in total fatty acids in plasma seen in the flaxseed oil group at weeks 6 and 12. An increase in gamma-linolenic acid was noted in the borage oil group. Erythema, roughness, and scaling were decreased in both treatment groups compared with baseline, while skin hydration was markedly elevated after 12 weeks. In addition, transepidermal water loss was diminished by 10% after 6 weeks in both oil treatment groups, with further reductions after 12 weeks in the flaxseed oil group. The investigators concluded that intervention with dietary lipids can manifest as skin improvements (Br. J. Nutr. 2009;101:440-5).
In 2010, Kaithwas and Majumdar evaluated the anti-inflammatory potential of flaxseed fixed oil against castor oil–induced diarrhea, turpentine oil–induced joint edema, and formaldehyde-induced and complete Freund’s adjuvant (CFA)-induced arthritis in Wistar albino rats. They found that flaxseed oil dose-dependently inhibited the adverse effects of castor oil and turpentine oil as well as CFA, and a significant inhibitory effect was also exerted by flaxseed oil against formaldehyde-induced proliferation of global edematous arthritis. Flaxseed oil also significantly diminished the secondary lesions engendered by CFA by dint of a delayed hypersensitivity reaction. The authors concluded that the significant anti-inflammatory activity imparted by L. usitatissimum fixed oil suggests its therapeutic viability for inflammatory conditions, such as rheumatoid arthritis (Inflammopharmacology 2010;18:127-36).
Recently, de Souza et al. studied the effects on skin wounds in rats of a semisolid formulation of flaxseed oil (1%, 5%, or 10%). The investigators assessed the contraction/re-epithelialization of the wound and resistance to mechanical traction in incisional and excisional models, respectively. They found that the groups treated with flaxseed oil concentrations of 1% or 5% largely started re-epithelialization earlier than the petroleum jelly control group, and achieved 100% re-epithelialization on the 14th day after injury, as compared to 33% of animals in the petroleum jelly group. The investigators concluded that flaxseed oil, at low concentrations, exhibits potential in a solid pharmaceutical preparation, for use in dermal repair (Evid. Based. Complement. Alternat. Med. 2012;2012:270752).
Early in 2012, Tülüce et al. set out to ascertain the antioxidant and antiapoptotic effects of flaxseed oil exerted against ultraviolet C–induced damage in rats. They divided animals into three groups: control, UVC alone, and UVC and flaxseed oil. UVC light exposure lasted for 1 hour twice daily for four weeks in the two exposure groups. In the flaxseed oil group, the oil was administered by gavage prior to each irradiation (4 mL/kg ). The investigators noted that malondialdehyde and protein carbonyl levels were higher in the UVC group than in the controls, but such levels were reduced in the flaxseed oil group compared with the UVC-only group, in skin, lens, and sera. Also, the activities of glutathione peroxidase and superoxide dismutase were found to be higher in the skin, lens, and sera of the flaxseed oil group as compared to the UVC-only group. In addition, retinal apoptosis was lower in the flaxseed group than in the UVC group. The researchers concluded that flaxseed oil may be useful in conferring a photoprotective effect against UVC-induced damage, as manifested in protein carbonylation and reactive oxygen species generation, in rats (Toxicol. Ind. Health. 2012;28:99-107).
Conclusion
Flaxseed oil has gained recent attention for its salutary effects as part of the diet. Rich in omega-3 essential fatty acids and lignans, flaxseed oil has been found to improve fatty acid profiles. Significantly, emerging evidence points to beneficial cutaneous effects derived from dietary use of flaxseed oil. However, more research is necessary to determine whether the beneficial constituents of flaxseed oil can be harnessed in topical products.
Dr. Baumann is in private practice in Miami Beach.
Linum usitatissimum, an annual plant native to the eastern Mediterranean and India and better known as flax (or linseed, several decades ago), was cultivated in ancient Egypt and Ethiopia and used for many purposes, including as an ingredient in medicine, soap, and hair products. The oil from the seeds of the plant is thought to possess significant health benefits. Flaxseed oil is one of the richest sources of omega-3 fatty acids, in particular, alpha-linolenic acid (ALA), which represents more than 50% of its total fatty acid content (Br. J. Nutr. 2009;101:440-5; Medical Herbalism: The science and practice of herbal medicine. Healing Arts Press: Rochester, Vt., 2003, p. 57). In addition, flaxseeds are rich in dietary fiber and lignans, which are phytoestrogens with antioxidant properties.
Antioxidant, anti-inflammatory, and antiapoptotic properties have been associated with flaxseed oil and warrant medical consideration. The substantial anti-inflammatory activity of L. usitatissimum has been ascribed to its primary active constituent, ALA (57%), which suppresses arachidonic acid metabolism, thus inhibiting the synthesis of proinflammatory n-6 eicosanoids and reducing vascular permeability (Inflammopharmacology 2010;18:127-36).
In a randomized, double-blind, placebo-controlled application test in 2009, De Spirt et al. studied the cutaneous effects of supplementation with flaxseed or borage oil for 12 weeks in two groups of women (n = 45) aged 18-65 years with sensitive and dry skin. Fifteen women were included in each group, and 15 were randomized to a placebo control group. The placebo group received medium-chain fatty acids. The flaxseed oil included ALA and linoleic acid, and the borage oil contained linoleic and gamma-linolenic acids. ALA contributed to the significant rise in total fatty acids in plasma seen in the flaxseed oil group at weeks 6 and 12. An increase in gamma-linolenic acid was noted in the borage oil group. Erythema, roughness, and scaling were decreased in both treatment groups compared with baseline, while skin hydration was markedly elevated after 12 weeks. In addition, transepidermal water loss was diminished by 10% after 6 weeks in both oil treatment groups, with further reductions after 12 weeks in the flaxseed oil group. The investigators concluded that intervention with dietary lipids can manifest as skin improvements (Br. J. Nutr. 2009;101:440-5).
In 2010, Kaithwas and Majumdar evaluated the anti-inflammatory potential of flaxseed fixed oil against castor oil–induced diarrhea, turpentine oil–induced joint edema, and formaldehyde-induced and complete Freund’s adjuvant (CFA)-induced arthritis in Wistar albino rats. They found that flaxseed oil dose-dependently inhibited the adverse effects of castor oil and turpentine oil as well as CFA, and a significant inhibitory effect was also exerted by flaxseed oil against formaldehyde-induced proliferation of global edematous arthritis. Flaxseed oil also significantly diminished the secondary lesions engendered by CFA by dint of a delayed hypersensitivity reaction. The authors concluded that the significant anti-inflammatory activity imparted by L. usitatissimum fixed oil suggests its therapeutic viability for inflammatory conditions, such as rheumatoid arthritis (Inflammopharmacology 2010;18:127-36).
Recently, de Souza et al. studied the effects on skin wounds in rats of a semisolid formulation of flaxseed oil (1%, 5%, or 10%). The investigators assessed the contraction/re-epithelialization of the wound and resistance to mechanical traction in incisional and excisional models, respectively. They found that the groups treated with flaxseed oil concentrations of 1% or 5% largely started re-epithelialization earlier than the petroleum jelly control group, and achieved 100% re-epithelialization on the 14th day after injury, as compared to 33% of animals in the petroleum jelly group. The investigators concluded that flaxseed oil, at low concentrations, exhibits potential in a solid pharmaceutical preparation, for use in dermal repair (Evid. Based. Complement. Alternat. Med. 2012;2012:270752).
Early in 2012, Tülüce et al. set out to ascertain the antioxidant and antiapoptotic effects of flaxseed oil exerted against ultraviolet C–induced damage in rats. They divided animals into three groups: control, UVC alone, and UVC and flaxseed oil. UVC light exposure lasted for 1 hour twice daily for four weeks in the two exposure groups. In the flaxseed oil group, the oil was administered by gavage prior to each irradiation (4 mL/kg ). The investigators noted that malondialdehyde and protein carbonyl levels were higher in the UVC group than in the controls, but such levels were reduced in the flaxseed oil group compared with the UVC-only group, in skin, lens, and sera. Also, the activities of glutathione peroxidase and superoxide dismutase were found to be higher in the skin, lens, and sera of the flaxseed oil group as compared to the UVC-only group. In addition, retinal apoptosis was lower in the flaxseed group than in the UVC group. The researchers concluded that flaxseed oil may be useful in conferring a photoprotective effect against UVC-induced damage, as manifested in protein carbonylation and reactive oxygen species generation, in rats (Toxicol. Ind. Health. 2012;28:99-107).
Conclusion
Flaxseed oil has gained recent attention for its salutary effects as part of the diet. Rich in omega-3 essential fatty acids and lignans, flaxseed oil has been found to improve fatty acid profiles. Significantly, emerging evidence points to beneficial cutaneous effects derived from dietary use of flaxseed oil. However, more research is necessary to determine whether the beneficial constituents of flaxseed oil can be harnessed in topical products.
Dr. Baumann is in private practice in Miami Beach.
You: The next YouTube star
Each month, more than 4 billion hours of video are watched on YouTube. It’s not all for Justin Bieber (though much of it is). People across the globe are flocking to YouTube for medical information and advice. Why not take advantage of this interested audience and free service?
Videos can be made simply, using tools you already have, or they can be done professionally in a studio. Although there are some advantages to professionally produced videos, the beauty of YouTube and the user-generated content movement is that these frills are unnecessary. The most important factor is not the quality of the video, but rather, the quality of the content. Videos that capture your true personality and that deliver useful content to viewers will be successful, regardless of how they are produced.
Videos are powerful on many levels: They’re a platform to educate your patients and prospective patients and market your practice. They showcase you both as a person and a physician. And video content is 50 times more likely to appear on the first page of search engine results than text-only content.
Though you could go to your local camera or electronics store and spend a small fortune on video equipment, I suggest you start off with what you have on hand, such as your smart phone or webcam. Choose a well-lighted, quiet area in your office or at home, such as in front of a bookcase. Outline a script, read through it a few times so that it sounds natural, then videotape yourself and see how it looks.
You won’t be perfect on the first take, but that’s OK. The beauty of short 1- to 2-minute videos is that they’re easy to reshoot.
For your first video, I suggest doing an introduction. Your goal is to appear approachable, friendly, and trustworthy. Introduce yourself and share some personal information, such as where you grew up, where you went to school, your favorite sports teams, your hobbies – anything that provides an opportunity for viewers to connect with you on a personal level. Look straight at the camera, smile often, and speak clearly. Keep it under 90 seconds.
Then do another 90-second video welcoming patients to your practice. Mention your expertise, clinical interests, and anything else that makes your practice stand out.
You’ll find that generating content for videos isn’t difficult. Make videos of procedures that you’re expert in, post-op instructions that you repeat frequently, or cosmetic procedures that patients often inquire about.
Create a channel on a video-sharing site such as YouTube or Vimeo, and upload your videos one at a time. You can then embed those videos on your practice website or blog (see last month’s column on blogging).
Here are some of my best practices for making videos:
• Before you start, ask yourself, "Why would someone want to watch this video?"
• Make a single point in each video and stay focused.
• Choose a well-lighted, quiet area for recording. Place the light source in front of you. Back lighting can create shadows.
• Consider composition. You don’t have to be in the center of the frame. You can be off to one side, especially if you’re including something behind you in the shot, or if you are using props. But always look into the camera.
• Use props when relevant.
• Keep videos under 2 minutes.
• Have a script or an outline, but never read from it.
• Tell stories. Patients will remember them better than statistics.
• Rehearse, rehearse, rehearse.
• Be conversational and smile.
• Watch each take so you can make appropriate changes.
• Don’t waste time trying to make a video "go viral."
• Share your videos on Twitter, Facebook, or other social sharing sites.
When you’re done, have someone from your office view the video critically. Are you looking into the camera or over the heads of the viewers? Are you smiling enough? Do you have too many vocal fillers like "um" and "pretty much?" Are you easily seen and heard? It is interesting and worthy of an audience?
Finally, share your video with me @dermdoc on Twitter. You can count on a retweet.
Dr. Benabio is in private practice in San Diego. Visit his consumer health blog; connect with him on Twitter @Dermdoc, and on Facebook.

New Year’s resolutions
The holiday season has come and gone with alarming speed; and now, ’tis the season for resolutions, turning over a new leaf, promising – yet again – to break all those bad habits once and for all.
I can’t presume to know what your professional bad habits are, but I do know the ones I get asked about the most. The following "top ten list" might provide some inspiration for assembling a list of your own:
1. Start on time. So many doctors complain of running behind. Guess what? Your patients complain about that too. Waiting is the most common patient complaint, and you can’t hope to run on time if you don’t start on time. No single change will improve your efficiency more than this.
2. Organize your Internet time. I confess, this one is on my own list most years. E-mail needs to be answered, and your office’s Twitter feed and Facebook page need updating; but do it before or after office hours. It’s just too easy to start clicking that mouse, and suddenly you’re half an hour behind.
3. Permit fewer interruptions. Phone calls and pharmaceutical reps seem to be the big interrupters in most offices. Make some rules, and stick to them. I’ll stop to take an emergency call, or one from an immediate family member; all others get routed to the nurses or are returned at lunch or after hours. Reps make appointments, like everybody else – and only if they have something new to talk about.
4. Organize samples. See my column on this subject. We strip all the space-wasting packaging off our samples and store them, alphabetically, in cardboard "parts" bins, available in many industrial catalogs. Besides always knowing what you have, you’ll always know what you’re out of; and your staff will waste far less time tracking samples down. Also, a bin system makes logging samples in and out much easier, should that become a requirement – as the FDA keeps promising.
5. Clear your "horizontal file cabinet." That’s the mess on your desk, all the paperwork you never seem to get to (probably because you’re tweeting or answering e-mail). Set aside an hour or two and get it all done. You’ll find some interesting stuff in there. Then, for every piece of paper that arrives on your desk from now on, follow the DDD Rule: Do it, Delegate it, or Destroy it. Don’t start a new mess.
6. Keep a closer eye on your office finances. Most physicians delegate the bookkeeping, and that’s fine. But ignoring the financial side creates an atmosphere that facilitates embezzlement. Set aside a couple of hours each month to review the books personally. And make sure your employees know you’re doing it.
7. Make sure your long-range financial planning is on track. This is another task physicians tend to "set and forget," but the Great Recession was an eye-opener for many of us. Once a year, sit down with your accountant and planner, and make sure your investments are well diversified and all other aspects of your finances – budgets, credit ratings, insurance coverage, tax situations, college savings, estate plans, and retirement accounts – are in the best shape possible. Now would be a good time.
8. Pay down your debt. Debt can destroy the best-laid retirement plans; many learned this the hard way when the "bubble" burst. If you carry significant debt, set up a plan to pay it off as soon as you can.
9. Take more vacations. Remember Eastern’s First Law: Your last words will NOT be, "I wish I had spent more time in the office." This is the year to start spending more time enjoying your life, your friends and family, and the world. As John Lennon said, "Life is what happens to you while you’re busy making other plans."
10. Look at yourself. A private practice lives or dies on the personalities of its physicians, and your staff copies your personality and style. Take a hard, honest look at yourself. Identify your negative personality traits and work to eliminate them. If you have any difficulty finding the things that need changing . . . ask your spouse. He or she will be happy to outline them for you, in great detail.
Dr. Eastern practices dermatology and dermatologic surgery in Belleville, N.J. T

Marijuana most popular drug of abuse among teens
WASHINGTON – Marijuana remains popular with U.S. teenagers, with steady and even rising rates of use, according to a key federal survey.
This year’s data from the annual Monitoring the Future survey found that marijuana was the No. 1 drug used by students in the 8th, 10th, and 12th grades. About 35% of high school seniors said they smoked pot in the past year, consistent with 2011 usage. Daily use among seniors also stayed flat, at around 7%.

Of concern is the declining number of seniors who view marijuana use as risky. Only 20% of seniors said occasional use was harmful, the lowest rate recorded since 1983. Higher numbers of 8th and 10th graders consider pot smoking to be risky, but those figures declined as well.
Dr. Nora D. Volkow, director of the National Institute on Drug Abuse, said that teen perception of harm might be decreasing in part because of the ongoing debate over legalized medical marijuana and recent state efforts that decriminalized recreational use.
Previous NIDA studies have shown that teens believe that anything used for medicinal purposes – such as prescription painkillers – are inherently less dangerous. Also, many teens will not use drugs because they are illegal. Without laws prohibiting use, "that deterrent is not present," Dr. Volkow said at a press conference called by NIDA.
But marijuana is not harmless, Dr. Volkow noted. A study published earlier this year found that heavy marijuana use in the teen years contributed to lower IQs and impaired mental abilities (Proc. Natl. Acad. Sci. USA 2012;109:E2657-64 [doi:10.1073/pnas.1206820109]).
"We are increasingly concerned that regular or daily use of marijuana is robbing many young people of their potential to achieve and excel in school or other aspects of life," she said.

Synthetic marijuana, also known as spice or K-2, was the second most popular drug among high school seniors, with 11% reporting they had used it in the past year. A little more than 4% of 8th graders said they’d used the substance.
Dr. Volkow cautioned that synthetic cannabinoids were just as dangerous as is the plant form, and possibly more so, given that the active drug could be concentrated. Many ingredients that can be found in synthetic marijuana have been banned by the Drug Enforcement Administration.
Prescription drug abuse continues to be of concern. Among seniors, Adderall was the third most used drug. About 8% said they had used the prescription stimulant in the previous year, often for a nonmedical use. Vicodin was close behind, with 7.5% of seniors having used it within the past year. The majority of 12th graders (68%) said they were given the prescription medications by friends or relatives; 38% said they had bought the drug from friends or relatives, about a third said they had gotten it by prescription, and 22% said they took it from friends or relatives.
So called "bath salts" were included in the Monitoring the Future survey this year for the first time. "Bath salts" is the street name for a group of designer amphetamine-like stimulants that are sold over the counter. Only 1.3% of seniors reported using the products, a relatively low rate that may reflect heavy publicity about their dangers, Gil Kerlikowske, director of the White House Office of National Drug Control Policy, said at the briefing.
The survey also showed that both tobacco and alcohol use have declined significantly over the years. Alcohol use is at its lowest since the survey began in 1975. About 70% of high school seniors said they’d ever used alcohol, down from a peak of 90%.
For tobacco, there were significant declines in lifetime use among 8th graders: 16% in 2012 compared with a peak of 50% in 1996. For 10th graders, 28% said they had ever smoked tobacco, down from a peak of 61% in 1996. Rates of use of smokeless tobacco and other tobacco products continued to stay steady.
"So as we look at these numbers and we look again in trying to determine what they tell us, I think they identify the areas where we need to pay attention and don’t become complacent," Dr. Volkow said.
More than 45,000 students from 395 public and private schools took part in the Monitoring the Future survey this year. Since 1975, the survey has measured the drug, alcohol, and cigarette use and related attitudes of U.S. high school seniors; 8th and 10th graders were added to the survey in 1991. The survey is funded by NIDA and conducted by University of Michigan investigators led by Lloyd Johnston, Ph.D.
WASHINGTON – Marijuana remains popular with U.S. teenagers, with steady and even rising rates of use, according to a key federal survey.
This year’s data from the annual Monitoring the Future survey found that marijuana was the No. 1 drug used by students in the 8th, 10th, and 12th grades. About 35% of high school seniors said they smoked pot in the past year, consistent with 2011 usage. Daily use among seniors also stayed flat, at around 7%.
Of concern is the declining number of seniors who view marijuana use as risky. Only 20% of seniors said occasional use was harmful, the lowest rate recorded since 1983. Higher numbers of 8th and 10th graders consider pot smoking to be risky, but those figures declined as well.
Dr. Nora D. Volkow, director of the National Institute on Drug Abuse, said that teen perception of harm might be decreasing in part because of the ongoing debate over legalized medical marijuana and recent state efforts that decriminalized recreational use.
Previous NIDA studies have shown that teens believe that anything used for medicinal purposes – such as prescription painkillers – are inherently less dangerous. Also, many teens will not use drugs because they are illegal. Without laws prohibiting use, "that deterrent is not present," Dr. Volkow said at a press conference called by NIDA.
But marijuana is not harmless, Dr. Volkow noted. A study published earlier this year found that heavy marijuana use in the teen years contributed to lower IQs and impaired mental abilities (Proc. Natl. Acad. Sci. USA 2012;109:E2657-64 [doi:10.1073/pnas.1206820109]).
"We are increasingly concerned that regular or daily use of marijuana is robbing many young people of their potential to achieve and excel in school or other aspects of life," she said.
Synthetic marijuana, also known as spice or K-2, was the second most popular drug among high school seniors, with 11% reporting they had used it in the past year. A little more than 4% of 8th graders said they’d used the substance.
Dr. Volkow cautioned that synthetic cannabinoids were just as dangerous as is the plant form, and possibly more so, given that the active drug could be concentrated. Many ingredients that can be found in synthetic marijuana have been banned by the Drug Enforcement Administration.
Prescription drug abuse continues to be of concern. Among seniors, Adderall was the third most used drug. About 8% said they had used the prescription stimulant in the previous year, often for a nonmedical use. Vicodin was close behind, with 7.5% of seniors having used it within the past year. The majority of 12th graders (68%) said they were given the prescription medications by friends or relatives; 38% said they had bought the drug from friends or relatives, about a third said they had gotten it by prescription, and 22% said they took it from friends or relatives.
So called "bath salts" were included in the Monitoring the Future survey this year for the first time. "Bath salts" is the street name for a group of designer amphetamine-like stimulants that are sold over the counter. Only 1.3% of seniors reported using the products, a relatively low rate that may reflect heavy publicity about their dangers, Gil Kerlikowske, director of the White House Office of National Drug Control Policy, said at the briefing.
The survey also showed that both tobacco and alcohol use have declined significantly over the years. Alcohol use is at its lowest since the survey began in 1975. About 70% of high school seniors said they’d ever used alcohol, down from a peak of 90%.
For tobacco, there were significant declines in lifetime use among 8th graders: 16% in 2012 compared with a peak of 50% in 1996. For 10th graders, 28% said they had ever smoked tobacco, down from a peak of 61% in 1996. Rates of use of smokeless tobacco and other tobacco products continued to stay steady.
"So as we look at these numbers and we look again in trying to determine what they tell us, I think they identify the areas where we need to pay attention and don’t become complacent," Dr. Volkow said.
More than 45,000 students from 395 public and private schools took part in the Monitoring the Future survey this year. Since 1975, the survey has measured the drug, alcohol, and cigarette use and related attitudes of U.S. high school seniors; 8th and 10th graders were added to the survey in 1991. The survey is funded by NIDA and conducted by University of Michigan investigators led by Lloyd Johnston, Ph.D.
AT A PRESS CONFERENCE CALLED BY THE NATIONAL INSTITUTE ON DRUG ABUSE
Major Finding: One in five high school seniors believe marijuana use is harmful.
Data Source: Monitoring the Future, a survey of 45,449 U.S. teens in the 8th, 10th, and 12th grades.
Disclosures: The study is funded by the National Institute on Drug Abuse.

Pediatric Hospitalist Certification Options Still Up for Debate
While the debate about whether pediatric hospitalists should obtain certification is alive and well, the majority of hospitalists favor further education through fellowships, or a recognition of focused practice for the subspecialty.
When asked in a recent poll by The Hospitalist which certification options pediatric hospital medicine should pursue, 40% of respondents preferred having a recognition of focused practice for pediatric hospitalists, similar to that of adult hospitalists; 25% thought a one-year fellowship should be in place; and 9% would keep the status quo. Currently, there is no specific certification option for pediatric hospitalists. Still, the topic has raised some strong opinions and remains popular fodder for debate among hospitalists.
"I think it is clear the vast majority of pediatric hospitalists believe there are skills necessary to function at a high level in pediatric hospitalist medicine that are not gained during just three years of pediatric residency," says Douglas W. Carlson, MD, SFHM, SHM's representative to the Joint Council of Pediatric Hospital Medicine.
Dr. Carlson says he considers two-year fellowships the best option. However, he does see the possible negative consequences to further education. "If we go to a fellowship, I am worried we will turn off that pipeline [of bright young physicians] … particularly when so many medical students in residency are coming out with such huge debt," he adds.
Rather than debating which result is best, Mark Shen, MD, SFHM, medical director of hospital medicine at Dell Children's Medical Center in Austin, Texas, is more interested in the "why"of the matter."Whatever result comes out will be well thought through," he says. "In my mind, I would be more interested in what the underlying thought process is in the decision more than anything else."
Visit our website for more information about pediatric hospitalist certification.
ITL: Physician Reviews of HM-Relevant Research
Clinical question: What are the relative predictive values of the HEMORR2HAGES, ATRIA, and HAS-BLED risk-prediction schemes?
Background: The tools predict bleeding risk in patients anticoagulated for atrial fibrillation (afib), but it is unknown which is the best for predicting clinically relevant bleeding.
Study design: Post-hoc analysis.
Setting: Data previously collected for the AMADEUS trial (2,293 patients taking warfarin; 251 had at least one clinically relevant bleeding event) were used to test each of the three bleeding-risk-prediction schemes on the same data set.
Synopsis: Using three analysis methods (net reclassification improvement, receiver-operating characteristic [ROC], and decision-curve analysis), the researchers compared the three schemes’ performance. HAS-BLED performed best in all three of the analysis methods.
The HAS-BLED score calculation requires the following patient information: history of hypertension, renal disease, liver disease, stroke, prior major bleeding event, and labile INR; age >65; and use of antiplatelet agents, aspirin, and alcohol.
Bottom line: HAS-BLED was the best of the three schemes, although all three had only modest ability to predict clinically relevant bleeding.
Citation: Apostolakis S, Lane DA, Guo Y, et al. Performance of the HEMORR2HAGES, ATRIA and HAS-BLED bleeding risk-prediction scores in patients with atrial fibrillation undergoing anticoagulation. J Am Coll Cardiol. 2012;60(9):861-867.
Visit our website for more physician reviews of recent HM-relevant literature.
Changes in Hospital Glycemic Control
The prevalence of diabetes mellitus continues to increase, now affecting almost 26 million people in the United States alone.[1] Hospitalizations associated with diabetes also continue to rise,[2] and nearly 50% of the $174 billion annual costs related to diabetes care in the United States are for inpatient hospital stays.[3] In recent years, inpatient glucose control has received considerable attention, and consensus statements for glucose targets have been published.[4, 5, 6]
A number of developments support the rationale for tracking and reporting inpatient glucose control. For instance, there are clinical scenarios where treatment of hyperglycemia has been shown to lead to better patient outcomes.[6, 7, 8, 9] Second, several organizations have recognized the value of better inpatient glucose management and have developed educational resources to assist practitioners and their institutions toward achieving that goal.[10, 11, 12, 13, 14] Finally, pay‐for‐performance requirements are emerging that are relevant to inpatient diabetes management.[15, 16]
Reports on the status of inpatient glucose control in large samples of US hospitals are now becoming available, and their findings suggest differences on the basis of hospital size, hospital type, and geographic location.[17, 18] However, these reports represent cross‐sectional studies, and little is known about trends in hospital glucose control over time. To determine whether changes were occurring, we obtained inpatient point‐of‐care blood glucose (POC‐BG) data from 126 hospitals for January to December 2009 and compared these with glycemic control data collected from the same hospitals for January to December 2007,[19] separately analyzing measurements from the intensive care unit (ICU) and the non‐intensive care unit (non‐ICU).
METHODS
Data Collection
The methods we used for data collection have been described previously.[18, 19, 20] Hospitals in the study used standard bedside glucose meters downloaded to the Remote Automated Laboratory System‐Plus (RALS‐Plus) (Medical Automation Systems, Charlottesville, VA). We originally evaluated data for adult inpatients for the period from January to December 2007[19]; for this study, we extracted POC‐BG from the same hospitals for the period from January to December 2009. Data excluded measurements obtained in emergency departments. Patient‐specific data (age, sex, race, and diagnoses) were not provided by hospitals, but individual patients could be distinguished by a unique identifier and also by location (ICU vs non‐ICU).
Hospital Selection
The characteristics of the 126 hospitals have been published previously.[19] However, hospital characteristics for 2009 were reevaluated for this analysis using the same methods already described for 2007[19] to determine whether any changes had occurred. Briefly, hospital characteristics during 2009 were determined via a combination of accessing the hospital Web site, consulting the Hospital Blue Book (Billian's HealthDATA; Billian Publishing Inc., Atlanta, Georgia), and determining membership in the Council of Teaching Hospitals and Health Systems of the Association of American Medical Colleges. The characteristics of the hospitals were size (number of beds), type (academic, urban community, or rural), and geographic region (Northeast, Midwest, South, or West). Per the Hospital Blue Book, a rural hospital is a hospital that operates outside of a metropolitan statistical area, typically with fewer than 100 beds, whereas an urban hospital is located within a metropolitan statistical area, typically with more than 100 beds. Institutions provided written permission to remotely access their glucose data and combine it with other hospitals into a single database for analysis. Patient data were deidentified, and consent to retrospective analysis and reporting was waived. The analysis was considered exempt by the Mayo Clinic Institutional Review Board. Participating hospitals were guaranteed confidentiality regarding their data.
Statistical Analysis
ICU and non‐ICU glucose datasets were differentiated on the basis of the download location designated by the RALS‐Plus database. As previously described, patient‐day‐weighted mean POC‐BG values were calculated as means of daily POC‐BG averaged per patient across all days during the hospital stay.[18, 19] We determined the overall patient‐day‐weighted mean values, and also the proportion of patient‐day‐weighted mean values greater than 180, 200, 250, 300, 350, and 400 mg/dL.[18, 19] We also examined the data to determine if there were any changes in the proportion of patient hospital days when there was at least 1 value <70 mg/dL or <40 mg/dL.
Differences in patient‐day‐weighted mean POC‐BG values between the years 2007 and 2009 were assessed in a mixed‐effects model with the term of year as the fixed effect and hospital characteristics as the random effect. The glucose trends between years 2007 and 2009 were examined to identify any differentiation by hospital characteristics by conducting mixed‐effects models using the terms of year, hospital characteristics (hospital size by bed capacity, hospital type, or geographic region), and interaction between year as the fixed effects and hospital characteristics as the random effect. These analyses were performed separately for ICU patients and non‐ICU patients. Values were compared between data obtained in 2009 and that obtained previously in 2007 using the Pearson [2] test. The means within the same category of hospital characteristics were compared for the years 2007 and 2009.
RESULTS
Characteristics of Participating Hospitals
Fewer than half of the 126 hospitals had changes in characteristics from 2007 to 2009 (size and type [Table 1]). There were 71 hospitals whose characteristics did not change compared to when the previous analysis was performed. The rest (n = 55) had changes in their characteristics that resulted in a net redistribution in the number of beds in the <200 and 200 to 299 categories, and a change in the rural/urban categories. These changes slightly altered the distributions by hospital size and hospital type compared to those in the previous analysis (Table 1). The regional distribution of the 126 hospitals was 41 (32.5%) in the South, 37 (29.4%) in the Midwest, 28 (22.2%) in the West, and 20 (15.9%) in the Northeast.[19]
| Characteristic | 2007, No. (%) [N = 126] | 2009, No. (%) [N = 126] |
|---|---|---|
| Hospital size, no. of beds | ||
| <200 | 48 (38.1) | 45 (35.7) |
| 200299 | 25 (19.8) | 28 (22.2) |
| 300399 | 17 (13.5) | 17 (13.5) |
| 400 | 36 (28.6) | 36 (28.6) |
| Hospital type | ||
| Academic | 11 (8.7) | 11 (8.7) |
| Urban | 69 (54.8) | 79 (62.7) |
| Rural | 46 (36.5) | 36 (28.6) |
Changes in Glycemic Control
For 2007, we analyzed a total of 12,541,929 POC‐BG measurements for 1,010,705 patients, and for 2009, we analyzed a total of 10,659,418 measurements for 656,206 patients. For ICU patients, a mean of 4.6 POC‐BG measurements per day was obtained in 2009 compared to a mean of 4.7 POC‐BG measurements per day in 2007. For non‐ICU patients, the POC‐BG mean was 3.1 per day in 2009 vs 2.9 per day in 2007.
For non‐ICU data, the patient‐day‐weighted mean POC‐BG values decreased in 2009 by 5 mg/dL compared with the 2007 values (154 mg/dL vs 159 mg/dL, respectively; P < 0.001), and were clinically unchanged in the ICU data (167 mg/dL vs 166 mg/dL, respectively; P < 0.001). For non‐ICU data, the proportion of patient‐day‐weighted mean POC‐BG values in any hyperglycemia category decreased in 2009 compared with those in 2007 among all patients (all P < 0.001) (Figure 1). For the ICU data, there was no significant difference (all P > 0.20; not shown) from 2007 to 2009.

In the ICU data, 2.9% of patient days on average had at least 1 POC‐BG value <70 mg/dL in both 2007 and 2009 (P = 0.67). There were fewer patient days with values <40 mg/dL in 2009 (1.1%) compared to 2007 (1.4%) in the ICU (P < 0.001). In the non‐ICU data, the mean percentage of patient days with a value <70 mg/dL was higher in 2009 (5.1%) than in 2007 (4.7%) (P < 0.001); however, there were actually fewer patient days in 2009 on average with a value <40 mg/dL (0.84% vs 1.1% for 2009 vs 2007; P < 0.001).
Changes in Glycemic Control by Hospital Characteristics
Next, changes in glucose levels between the 2 analytic periods were evaluated according to hospital characteristics. Significant interactions were found between the year and each of the hospital characteristics both for the ICU group (Table 2) and for the non‐ICU group (Table 3) (all P < 0.001 for interaction terms). In the ICU data, changes were generally small but significant on the basis of hospital size, hospital type, and geographic region, and these changes were not necessarily in the same direction, because there were increases in patient‐day‐weighted mean glucose values in some categories, whereas there were decreases in others. For instance, hospitals with <200 inpatient beds experienced no significant change in ICU glycemic control, whereas those with 200 to 299 beds or >400 beds had an increase in patient‐day‐weighted mean values, and ones with 300 to 399 beds had a decrease. In regard to hospital type, only ICUs in academic medical institutions had a significant change over time in patient‐day‐weighted mean glucose levels, and these changes were toward higher values. ICUs in institutions in the Northeast and West had significantly higher glucose levels between the 2 periods, whereas those in the Midwest and South demonstrated lower glucose levels. In contrast to the different trends in ICU data by hospital characteristics, non‐ICU glucose control improved for hospitals of all sizes and types, and in all regions, over time.
| Characteristic | Year 2007, mg/dL | Year 2009, mg/dL | P Value |
|---|---|---|---|
| |||
| Overall | 166 (1) | 167 (1) | <0.001 |
| Hospital size, no. of beds | |||
| <200 | 175 (2) | 174 (2) | 0.19 |
| 200299 | 164 (2) | 165 (2) | 0.009 |
| 300399 | 166 (3) | 164 (3) | <0.002 |
| 400 | 157 (2) | 160 (2) | <0.001 |
| Hospital type | |||
| Academic | 150 (3) | 156 (4) | <0.001 |
| Rural | 172 (2) | 172 (2) | 0.94 |
| Urban | 166 (1) | 166 (1) | 0.61 |
| Region | |||
| Northeast | 165 (3) | 167 (3) | 0.003 |
| Midwest | 169 (2) | 168 (2) | 0.007 |
| South | 168 (2) | 167 (2) | <0.001 |
| West | 160 (2) | 165 (2) | <0.001 |
| Characteristic | Year 2007, mg/dL | Year 2009, mg/dL | P Value |
|---|---|---|---|
| |||
| Overall | 159 (1) | 154 (1) | <0.001 |
| Hospital size, no. of beds | |||
| <200 | 162 (2) | 158 (2) | <0.001 |
| 200299 | 156 (2) | 152 (2) | <0.001 |
| 300399 | 158 (3) | 151 (3) | <0.001 |
| 400 | 156 (2) | 151 (2) | < 0.001 |
| Hospital type | |||
| Academic | 162 (3) | 159 (3) | <0.001 |
| Rural | 161 (2) | 156 (2) | <0.001 |
| Urban | 157 (1) | 152 (1) | <0.001 |
| Region | |||
| Northeast | 162 (3) | 158 (3) | <0.001 |
| Midwest | 157 (2) | 149 (2) | <0.001 |
| South | 160 (2) | 157 (2) | <0.001 |
| West | 156 (2) | 151 (2) | <0.001 |
DISCUSSION
Optimal management of hospital hyperglycemia is now advocated by a number of professional societies and organizations.[10, 11, 12, 13] One of the next major tasks in the area of inpatient diabetes management will be how to identify and evaluate changes in glycemic control among US hospitals over time. Respondents to a recent survey of hospitals indicated that most institutions are now attempting to initiate quality improvement programs for the management of inpatients with diabetes.[21] These initiatives may translate into objective changes that could be monitored on a national level. However, few data exist on trends in glucose control in US hospitals. In our analysis, POC‐BG data from 126 hospitals collected in 2009 were compared to data obtained from the same hospitals in 2007. Our findings, and the methods of data collection and analysis described previously,[18, 19] demonstrate how such data can be used as a national benchmarking process for inpatient glucose control.
At all levels of hyperglycemia, significant decreases in patient‐day‐weighted mean values were found in non‐ICU data but not in ICU data. During the time these data were collected, recommendations about glucose targets in the critically ill were in a state of flux.[22, 23, 24, 25, 26, 27] Thus, the lack of hyperglycemia improvement in the ICU data between 2007 and 2009 may reflect the reluctance of providers to aggressively manage hyperglycemia because of recent reports linking increased mortality to tight glucose control.[25, 28, 29, 30] The differences in patient‐day‐weighted mean glucose values detected in the non‐ICU data between the 2 analytic periods were statistically significant, but were otherwise small and may not have clinical implications as far as an association with improved patient outcomes. Ongoing longitudinal analysis is required to establish whether these improvements in non‐ICU glucose control will persist over time.
Changes in glycemic control between the 2 periods were also noted when data were stratified according to hospital characteristics. Differences in glucose control in ICU data were not consistently better or worse, but varied by category of hospital characteristics (hospital size, hospital type, and geographic region). Other than academic hospitals and hospitals in the West, changes in the ICU data were small and likely do not have clinical importance. Analysis of non‐ICU data, however, showed consistent improvement within all 3 categories. Some hospital characteristics did change between the 2 study periods: there were fewer hospitals with <200 beds, more hospitals with 200 to 299 beds, a decrease in hospitals identified as rural, and an increase in hospitals designated as urban. Our previous analyses have indicated that hospital characteristics should be considered when examining national inpatient glucose data.[18, 19] In this analysis there was a statistically significant interaction between the year for which data were analyzed and each category of hospital characteristics. It is unclear how these evolving characteristics could have impacted inpatient glucose control. A change in hospital characteristics may in fact represent a change in resources to manage inpatient hyperglycemia. Future studies with nationally aggregated inpatient glucose data that assess longitudinal changes in glucose data may also have to account for variations in hospital characteristics over time in addition to the characteristics of the hospitals themselves.
Differences in hypoglycemia frequency, as calculated as the proportion of patient hospital days, were also detected. In the ICU data, the percentage of days with at least 1 value <70 mg/dL was similar between 2007 and 2009, but the proportion of days with at least 1 value <40 mg/dL was less in 2009, suggesting that institutions as a whole in this analysis may have been more focused on reducing the frequency of severe hypoglycemia. However, in the non‐ICU, there were more days in 2009 with a value <70 mg/dL, but fewer with a value <40 mg/dL. In noncritically ill patients, institutions likely continue to attempt to find the best balance between optimizing glycemic control while minimizing the risk of hypoglycemia. It should be pointed out, however, that overall, the frequency of hypoglycemia, particularly severe hypoglycemia, was quite low in this analysis, as it has been in our previous reports.[18, 19] An examination of hypoglycemia frequency by hospital characteristic to evaluate differences in this metric would be of interest in a future analysis.
The limitations of these data have been previously outlined,[18, 19] and they include the lack of patient‐level data such as demographics and the lack of information on diagnoses that allow adjustment of comparisons by the severity of illness. Moreover, without detailed treatment‐specific information (such as type of insulin protocol), one cannot establish the basis for longitudinal differences in glucose control. Volunteer‐dependent hospital involvement that creates selection bias may skew data toward those who are aware that they are witnessing a successful reduction in hyperglycemia. Finally, POC‐BG may not be the optimal method for assessing glycemic control. The limitations of current methods of evaluating inpatient glycemic control were recently reviewed.[31] Nonetheless, POC‐BG measurements remain the richest source of data on hospital hyperglycemia because of their widespread use and large sample size. A data warehouse of nearly 600 hospitals now exists,[18] which will permit future longitudinal analyses of glucose control in even larger samples.
Despite such limitations, our findings do represent the first analysis of trends in glucose control in a large cross‐section of US hospitals. Over 2 years, non‐ICU hyperglycemia improved among hospitals of all sizes and types and in all regions, whereas similar improvement did not occur in ICU hyperglycemia. Continued analysis will determine whether these trends continue. For those hospitals that are achieving better glucose control in non‐ICU patients, more information is needed on how they are accomplishing this so that protocols can be standardized and disseminated.
Acknowledgments
Disclosures: This project was supported entirely by The Epsilon Group Virginia, LLC, Charlottesville, Virginia, and a contractual arrangement is in place between the Mayo Clinic, Scottsdale, Arizona, and The Epsilon Group. The Mayo Clinic does not endorse the products mentioned in this article. The authors report no conflicts of interest.
- 2011 National Diabetes Fact Sheet.Diagnosed and undiagnosed diabetes in the United States, all ages, 2010.Atlanta, GA:Centers for Disease Control and Prevention;2011 [updated 2011]. Available at: http://www.cdc.gov/diabetes/pubs/estimates11.htm#2. Accessed November 23, 2012.
- Diabetes Data and Trends.Atlanta, GA:Centers for Disease Control and Prevention;2009 [updated 2009]. Available at: http://www.cdc.gov/diabetes/statistics/dmany/fig1.htm. Accessed November 23, 2012.
- American Diabetes Association. Economic costs of diabetes in the U.S. In 2007 [published correction appears in Diabetes Care. 2008;31(6):1271.]. Diabetes Care. 2008;31(3):596–615.
- , , , et al.;American College of Endocrinology Task Force on Inpatient Diabetes Metabolic Control. American College of Endocrinology position statement on inpatient diabetes and metabolic control. Endocr Pract. 2004;10(1):77–82.
- ACE/ADA Task Force on Inpatient Diabetes. American College of Endocrinology and American Diabetes Association consensus statement on inpatient diabetes and glycemic control. Endocr Pract. 2006;12(4):458–468.
- , , , et al.;American Association of Clinical Endocrinologists; American Diabetes Association. American Association of Clinical Endocrinologists and American Diabetes Association consensus statement on inpatient glycemic control. Diabetes Care. 2009;32(6):1119–1131.
- ;DIGAMI (Diabetes Mellitus, Insulin Glucose Infusion in Acute Myocardial Infarction) Study Group. Prospective randomised study of intensive insulin treatment on long term survival after acute myocardial infarction in patients with diabetes mellitus. BMJ. 1997;314(7093):1512–1515.
- , , , et al.;American Diabetes Association Diabetes in Hospitals Writing Committee. Management of diabetes and hyperglycemia in hospitals [published correction appears in Diabetes Care. 2004;27(5):1255; Diabetes Care. 2004;27(3):856]. Diabetes Care. 2004;27(2):553–591.
- , , , , . Inpatient management of diabetes and hyperglycemia among general medicine patients at a large teaching hospital. J Hosp Med. 2006;1(3):145–150.
- , , , , ;Society of Hospital Medicine Glycemic Control Task Force. Society of Hospital Medicine Glycemic Control Task Force summary: practical recommendations for assessing the impact of glycemic control efforts. J Hosp Med. 2008;3(5 suppl):66–75.
- , , , , , . Adherence to surgical care improvement project measures and the association with postoperative infections. JAMA. 2010;303(24):2479–2485.
- Glycemic Control Resource Room.Philadelphia, PA:Society of Hospital Medicine;2008. Available at: http://www.hospitalmedicine.org/ResourceRoomRedesign/GlycemicControl.cfm. Accessed November 23, 2012.
- Inpatient Glycemic Control Resource Center.Jacksonville, FL:American Association of Clinical Endocrinologists;2011. Available at: http://resources.aace.com. Accessed November 23, 2012.
- , , , et al.;Endocrine Society. Management of hyperglycemia in hospitalized patients in non‐critical care setting: an endocrine society clinical practice guideline. J Clin Endocrinol Metab. 2012;97(1):16–38.
- Hospital Quality Initiative.Baltimore, MD:Centers for Medicare and Medicaid Services;2012 [updated 2012]. Available at: http://www.cms.gov/HospitalQualityInits/08_HospitalRHQDAPU.asp. Accessed November 23, 2012.
- Hospital‐Acquired Conditions (Present on Admission Indicator).Baltimore, MD:Centers for Medicare and Medicaid Services;2012 [updated 2012]. Available at: http://www.cms.gov/hospitalacqcond/06_hospital‐acquired_conditions.asp. Accessed November 23, 2012.
- , , , et al. Evaluation of hospital glycemic control at US academic medical centers. J Hosp Med. 2009;4(1):35–44.
- , , , . Update on inpatient glycemic control in hospitals in the United States. Endocr Pract. 2011;17(6):853–861.
- , , , , , . Inpatient glucose control: a glycemic survey of 126 U.S. hospitals. J Hosp Med. 2009;4(9):E7–E14.
- , , , , . Inpatient point‐of‐care bedside glucose testing: preliminary data on use of connectivity informatics to measure hospital glycemic control. Diabetes Technol Ther. 2007;9(6):493–500.
- , , , , , . Diabetes and hyperglycemia quality improvement efforts in hospitals in the United States: current status, practice variation, and barriers to implementation. Endocr Pract. 2010;16(2):219–230.
- , , , et al. Intensive insulin therapy in critically ill patients. N Engl J Med. 2001;345(19):1359–1367.
- , , , et al. Intensive insulin therapy in the medical ICU. N Engl J Med. 2006;354(5):449–461.
- , , , et al.;German Competence Network Sepsis (SepNet). Intensive insulin therapy and pentastarch resuscitation in severe sepsis. N Engl J Med. 2008;358(2):125–139.
- , , , et al.;NICE‐SUGAR Study Investigators. Intensive versus conventional glucose control in critically ill patients. N Engl J Med. 2009;360(13):1283–1297.
- , , , et al. A prospective randomised multi‐centre controlled trial on tight glucose control by intensive insulin therapy in adult intensive care units: the Glucontrol study. Intensive Care Med. 2009;35(10):1738–1748.
- , , . Benefits and risks of tight glucose control in critically ill adults: a meta‐analysis [published correction appears in JAMA. 2009;301(9):936]. JAMA. 2008;300(8):933–944.
- , . Severe hypoglycemia in critically ill patients: risk factors and outcomes. Crit Care Med. 2007;35(10):2262–2267.
- , , , et al. Relationship between spontaneous and iatrogenic hypoglycemia and mortality in patients hospitalized with acute myocardial infarction. JAMA. 2009;301(15):1556–1564.
- , , , et al. Hypoglycemia and outcome in critically ill patients. Mayo Clin Proc. 2010;85(3):217–224.
- , , , . Assessing inpatient glycemic control: what are the next steps?J Diabetes Sci Technol. 2012;6(2):421–427.
The prevalence of diabetes mellitus continues to increase, now affecting almost 26 million people in the United States alone.[1] Hospitalizations associated with diabetes also continue to rise,[2] and nearly 50% of the $174 billion annual costs related to diabetes care in the United States are for inpatient hospital stays.[3] In recent years, inpatient glucose control has received considerable attention, and consensus statements for glucose targets have been published.[4, 5, 6]
A number of developments support the rationale for tracking and reporting inpatient glucose control. For instance, there are clinical scenarios where treatment of hyperglycemia has been shown to lead to better patient outcomes.[6, 7, 8, 9] Second, several organizations have recognized the value of better inpatient glucose management and have developed educational resources to assist practitioners and their institutions toward achieving that goal.[10, 11, 12, 13, 14] Finally, pay‐for‐performance requirements are emerging that are relevant to inpatient diabetes management.[15, 16]
Reports on the status of inpatient glucose control in large samples of US hospitals are now becoming available, and their findings suggest differences on the basis of hospital size, hospital type, and geographic location.[17, 18] However, these reports represent cross‐sectional studies, and little is known about trends in hospital glucose control over time. To determine whether changes were occurring, we obtained inpatient point‐of‐care blood glucose (POC‐BG) data from 126 hospitals for January to December 2009 and compared these with glycemic control data collected from the same hospitals for January to December 2007,[19] separately analyzing measurements from the intensive care unit (ICU) and the non‐intensive care unit (non‐ICU).
METHODS
Data Collection
The methods we used for data collection have been described previously.[18, 19, 20] Hospitals in the study used standard bedside glucose meters downloaded to the Remote Automated Laboratory System‐Plus (RALS‐Plus) (Medical Automation Systems, Charlottesville, VA). We originally evaluated data for adult inpatients for the period from January to December 2007[19]; for this study, we extracted POC‐BG from the same hospitals for the period from January to December 2009. Data excluded measurements obtained in emergency departments. Patient‐specific data (age, sex, race, and diagnoses) were not provided by hospitals, but individual patients could be distinguished by a unique identifier and also by location (ICU vs non‐ICU).
Hospital Selection
The characteristics of the 126 hospitals have been published previously.[19] However, hospital characteristics for 2009 were reevaluated for this analysis using the same methods already described for 2007[19] to determine whether any changes had occurred. Briefly, hospital characteristics during 2009 were determined via a combination of accessing the hospital Web site, consulting the Hospital Blue Book (Billian's HealthDATA; Billian Publishing Inc., Atlanta, Georgia), and determining membership in the Council of Teaching Hospitals and Health Systems of the Association of American Medical Colleges. The characteristics of the hospitals were size (number of beds), type (academic, urban community, or rural), and geographic region (Northeast, Midwest, South, or West). Per the Hospital Blue Book, a rural hospital is a hospital that operates outside of a metropolitan statistical area, typically with fewer than 100 beds, whereas an urban hospital is located within a metropolitan statistical area, typically with more than 100 beds. Institutions provided written permission to remotely access their glucose data and combine it with other hospitals into a single database for analysis. Patient data were deidentified, and consent to retrospective analysis and reporting was waived. The analysis was considered exempt by the Mayo Clinic Institutional Review Board. Participating hospitals were guaranteed confidentiality regarding their data.
Statistical Analysis
ICU and non‐ICU glucose datasets were differentiated on the basis of the download location designated by the RALS‐Plus database. As previously described, patient‐day‐weighted mean POC‐BG values were calculated as means of daily POC‐BG averaged per patient across all days during the hospital stay.[18, 19] We determined the overall patient‐day‐weighted mean values, and also the proportion of patient‐day‐weighted mean values greater than 180, 200, 250, 300, 350, and 400 mg/dL.[18, 19] We also examined the data to determine if there were any changes in the proportion of patient hospital days when there was at least 1 value <70 mg/dL or <40 mg/dL.
Differences in patient‐day‐weighted mean POC‐BG values between the years 2007 and 2009 were assessed in a mixed‐effects model with the term of year as the fixed effect and hospital characteristics as the random effect. The glucose trends between years 2007 and 2009 were examined to identify any differentiation by hospital characteristics by conducting mixed‐effects models using the terms of year, hospital characteristics (hospital size by bed capacity, hospital type, or geographic region), and interaction between year as the fixed effects and hospital characteristics as the random effect. These analyses were performed separately for ICU patients and non‐ICU patients. Values were compared between data obtained in 2009 and that obtained previously in 2007 using the Pearson [2] test. The means within the same category of hospital characteristics were compared for the years 2007 and 2009.
RESULTS
Characteristics of Participating Hospitals
Fewer than half of the 126 hospitals had changes in characteristics from 2007 to 2009 (size and type [Table 1]). There were 71 hospitals whose characteristics did not change compared to when the previous analysis was performed. The rest (n = 55) had changes in their characteristics that resulted in a net redistribution in the number of beds in the <200 and 200 to 299 categories, and a change in the rural/urban categories. These changes slightly altered the distributions by hospital size and hospital type compared to those in the previous analysis (Table 1). The regional distribution of the 126 hospitals was 41 (32.5%) in the South, 37 (29.4%) in the Midwest, 28 (22.2%) in the West, and 20 (15.9%) in the Northeast.[19]
| Characteristic | 2007, No. (%) [N = 126] | 2009, No. (%) [N = 126] |
|---|---|---|
| Hospital size, no. of beds | ||
| <200 | 48 (38.1) | 45 (35.7) |
| 200299 | 25 (19.8) | 28 (22.2) |
| 300399 | 17 (13.5) | 17 (13.5) |
| 400 | 36 (28.6) | 36 (28.6) |
| Hospital type | ||
| Academic | 11 (8.7) | 11 (8.7) |
| Urban | 69 (54.8) | 79 (62.7) |
| Rural | 46 (36.5) | 36 (28.6) |
Changes in Glycemic Control
For 2007, we analyzed a total of 12,541,929 POC‐BG measurements for 1,010,705 patients, and for 2009, we analyzed a total of 10,659,418 measurements for 656,206 patients. For ICU patients, a mean of 4.6 POC‐BG measurements per day was obtained in 2009 compared to a mean of 4.7 POC‐BG measurements per day in 2007. For non‐ICU patients, the POC‐BG mean was 3.1 per day in 2009 vs 2.9 per day in 2007.
For non‐ICU data, the patient‐day‐weighted mean POC‐BG values decreased in 2009 by 5 mg/dL compared with the 2007 values (154 mg/dL vs 159 mg/dL, respectively; P < 0.001), and were clinically unchanged in the ICU data (167 mg/dL vs 166 mg/dL, respectively; P < 0.001). For non‐ICU data, the proportion of patient‐day‐weighted mean POC‐BG values in any hyperglycemia category decreased in 2009 compared with those in 2007 among all patients (all P < 0.001) (Figure 1). For the ICU data, there was no significant difference (all P > 0.20; not shown) from 2007 to 2009.
In the ICU data, 2.9% of patient days on average had at least 1 POC‐BG value <70 mg/dL in both 2007 and 2009 (P = 0.67). There were fewer patient days with values <40 mg/dL in 2009 (1.1%) compared to 2007 (1.4%) in the ICU (P < 0.001). In the non‐ICU data, the mean percentage of patient days with a value <70 mg/dL was higher in 2009 (5.1%) than in 2007 (4.7%) (P < 0.001); however, there were actually fewer patient days in 2009 on average with a value <40 mg/dL (0.84% vs 1.1% for 2009 vs 2007; P < 0.001).
Changes in Glycemic Control by Hospital Characteristics
Next, changes in glucose levels between the 2 analytic periods were evaluated according to hospital characteristics. Significant interactions were found between the year and each of the hospital characteristics both for the ICU group (Table 2) and for the non‐ICU group (Table 3) (all P < 0.001 for interaction terms). In the ICU data, changes were generally small but significant on the basis of hospital size, hospital type, and geographic region, and these changes were not necessarily in the same direction, because there were increases in patient‐day‐weighted mean glucose values in some categories, whereas there were decreases in others. For instance, hospitals with <200 inpatient beds experienced no significant change in ICU glycemic control, whereas those with 200 to 299 beds or >400 beds had an increase in patient‐day‐weighted mean values, and ones with 300 to 399 beds had a decrease. In regard to hospital type, only ICUs in academic medical institutions had a significant change over time in patient‐day‐weighted mean glucose levels, and these changes were toward higher values. ICUs in institutions in the Northeast and West had significantly higher glucose levels between the 2 periods, whereas those in the Midwest and South demonstrated lower glucose levels. In contrast to the different trends in ICU data by hospital characteristics, non‐ICU glucose control improved for hospitals of all sizes and types, and in all regions, over time.
| Characteristic | Year 2007, mg/dL | Year 2009, mg/dL | P Value |
|---|---|---|---|
| |||
| Overall | 166 (1) | 167 (1) | <0.001 |
| Hospital size, no. of beds | |||
| <200 | 175 (2) | 174 (2) | 0.19 |
| 200299 | 164 (2) | 165 (2) | 0.009 |
| 300399 | 166 (3) | 164 (3) | <0.002 |
| 400 | 157 (2) | 160 (2) | <0.001 |
| Hospital type | |||
| Academic | 150 (3) | 156 (4) | <0.001 |
| Rural | 172 (2) | 172 (2) | 0.94 |
| Urban | 166 (1) | 166 (1) | 0.61 |
| Region | |||
| Northeast | 165 (3) | 167 (3) | 0.003 |
| Midwest | 169 (2) | 168 (2) | 0.007 |
| South | 168 (2) | 167 (2) | <0.001 |
| West | 160 (2) | 165 (2) | <0.001 |
| Characteristic | Year 2007, mg/dL | Year 2009, mg/dL | P Value |
|---|---|---|---|
| |||
| Overall | 159 (1) | 154 (1) | <0.001 |
| Hospital size, no. of beds | |||
| <200 | 162 (2) | 158 (2) | <0.001 |
| 200299 | 156 (2) | 152 (2) | <0.001 |
| 300399 | 158 (3) | 151 (3) | <0.001 |
| 400 | 156 (2) | 151 (2) | < 0.001 |
| Hospital type | |||
| Academic | 162 (3) | 159 (3) | <0.001 |
| Rural | 161 (2) | 156 (2) | <0.001 |
| Urban | 157 (1) | 152 (1) | <0.001 |
| Region | |||
| Northeast | 162 (3) | 158 (3) | <0.001 |
| Midwest | 157 (2) | 149 (2) | <0.001 |
| South | 160 (2) | 157 (2) | <0.001 |
| West | 156 (2) | 151 (2) | <0.001 |
DISCUSSION
Optimal management of hospital hyperglycemia is now advocated by a number of professional societies and organizations.[10, 11, 12, 13] One of the next major tasks in the area of inpatient diabetes management will be how to identify and evaluate changes in glycemic control among US hospitals over time. Respondents to a recent survey of hospitals indicated that most institutions are now attempting to initiate quality improvement programs for the management of inpatients with diabetes.[21] These initiatives may translate into objective changes that could be monitored on a national level. However, few data exist on trends in glucose control in US hospitals. In our analysis, POC‐BG data from 126 hospitals collected in 2009 were compared to data obtained from the same hospitals in 2007. Our findings, and the methods of data collection and analysis described previously,[18, 19] demonstrate how such data can be used as a national benchmarking process for inpatient glucose control.
At all levels of hyperglycemia, significant decreases in patient‐day‐weighted mean values were found in non‐ICU data but not in ICU data. During the time these data were collected, recommendations about glucose targets in the critically ill were in a state of flux.[22, 23, 24, 25, 26, 27] Thus, the lack of hyperglycemia improvement in the ICU data between 2007 and 2009 may reflect the reluctance of providers to aggressively manage hyperglycemia because of recent reports linking increased mortality to tight glucose control.[25, 28, 29, 30] The differences in patient‐day‐weighted mean glucose values detected in the non‐ICU data between the 2 analytic periods were statistically significant, but were otherwise small and may not have clinical implications as far as an association with improved patient outcomes. Ongoing longitudinal analysis is required to establish whether these improvements in non‐ICU glucose control will persist over time.
Changes in glycemic control between the 2 periods were also noted when data were stratified according to hospital characteristics. Differences in glucose control in ICU data were not consistently better or worse, but varied by category of hospital characteristics (hospital size, hospital type, and geographic region). Other than academic hospitals and hospitals in the West, changes in the ICU data were small and likely do not have clinical importance. Analysis of non‐ICU data, however, showed consistent improvement within all 3 categories. Some hospital characteristics did change between the 2 study periods: there were fewer hospitals with <200 beds, more hospitals with 200 to 299 beds, a decrease in hospitals identified as rural, and an increase in hospitals designated as urban. Our previous analyses have indicated that hospital characteristics should be considered when examining national inpatient glucose data.[18, 19] In this analysis there was a statistically significant interaction between the year for which data were analyzed and each category of hospital characteristics. It is unclear how these evolving characteristics could have impacted inpatient glucose control. A change in hospital characteristics may in fact represent a change in resources to manage inpatient hyperglycemia. Future studies with nationally aggregated inpatient glucose data that assess longitudinal changes in glucose data may also have to account for variations in hospital characteristics over time in addition to the characteristics of the hospitals themselves.
Differences in hypoglycemia frequency, as calculated as the proportion of patient hospital days, were also detected. In the ICU data, the percentage of days with at least 1 value <70 mg/dL was similar between 2007 and 2009, but the proportion of days with at least 1 value <40 mg/dL was less in 2009, suggesting that institutions as a whole in this analysis may have been more focused on reducing the frequency of severe hypoglycemia. However, in the non‐ICU, there were more days in 2009 with a value <70 mg/dL, but fewer with a value <40 mg/dL. In noncritically ill patients, institutions likely continue to attempt to find the best balance between optimizing glycemic control while minimizing the risk of hypoglycemia. It should be pointed out, however, that overall, the frequency of hypoglycemia, particularly severe hypoglycemia, was quite low in this analysis, as it has been in our previous reports.[18, 19] An examination of hypoglycemia frequency by hospital characteristic to evaluate differences in this metric would be of interest in a future analysis.
The limitations of these data have been previously outlined,[18, 19] and they include the lack of patient‐level data such as demographics and the lack of information on diagnoses that allow adjustment of comparisons by the severity of illness. Moreover, without detailed treatment‐specific information (such as type of insulin protocol), one cannot establish the basis for longitudinal differences in glucose control. Volunteer‐dependent hospital involvement that creates selection bias may skew data toward those who are aware that they are witnessing a successful reduction in hyperglycemia. Finally, POC‐BG may not be the optimal method for assessing glycemic control. The limitations of current methods of evaluating inpatient glycemic control were recently reviewed.[31] Nonetheless, POC‐BG measurements remain the richest source of data on hospital hyperglycemia because of their widespread use and large sample size. A data warehouse of nearly 600 hospitals now exists,[18] which will permit future longitudinal analyses of glucose control in even larger samples.
Despite such limitations, our findings do represent the first analysis of trends in glucose control in a large cross‐section of US hospitals. Over 2 years, non‐ICU hyperglycemia improved among hospitals of all sizes and types and in all regions, whereas similar improvement did not occur in ICU hyperglycemia. Continued analysis will determine whether these trends continue. For those hospitals that are achieving better glucose control in non‐ICU patients, more information is needed on how they are accomplishing this so that protocols can be standardized and disseminated.
Acknowledgments
Disclosures: This project was supported entirely by The Epsilon Group Virginia, LLC, Charlottesville, Virginia, and a contractual arrangement is in place between the Mayo Clinic, Scottsdale, Arizona, and The Epsilon Group. The Mayo Clinic does not endorse the products mentioned in this article. The authors report no conflicts of interest.
- 2011 National Diabetes Fact Sheet.Diagnosed and undiagnosed diabetes in the United States, all ages, 2010.Atlanta, GA:Centers for Disease Control and Prevention;2011 [updated 2011]. Available at: http://www.cdc.gov/diabetes/pubs/estimates11.htm#2. Accessed November 23, 2012.
- Diabetes Data and Trends.Atlanta, GA:Centers for Disease Control and Prevention;2009 [updated 2009]. Available at: http://www.cdc.gov/diabetes/statistics/dmany/fig1.htm. Accessed November 23, 2012.
- American Diabetes Association. Economic costs of diabetes in the U.S. In 2007 [published correction appears in Diabetes Care. 2008;31(6):1271.]. Diabetes Care. 2008;31(3):596–615.
- , , , et al.;American College of Endocrinology Task Force on Inpatient Diabetes Metabolic Control. American College of Endocrinology position statement on inpatient diabetes and metabolic control. Endocr Pract. 2004;10(1):77–82.
- ACE/ADA Task Force on Inpatient Diabetes. American College of Endocrinology and American Diabetes Association consensus statement on inpatient diabetes and glycemic control. Endocr Pract. 2006;12(4):458–468.
- , , , et al.;American Association of Clinical Endocrinologists; American Diabetes Association. American Association of Clinical Endocrinologists and American Diabetes Association consensus statement on inpatient glycemic control. Diabetes Care. 2009;32(6):1119–1131.
- ;DIGAMI (Diabetes Mellitus, Insulin Glucose Infusion in Acute Myocardial Infarction) Study Group. Prospective randomised study of intensive insulin treatment on long term survival after acute myocardial infarction in patients with diabetes mellitus. BMJ. 1997;314(7093):1512–1515.
- , , , et al.;American Diabetes Association Diabetes in Hospitals Writing Committee. Management of diabetes and hyperglycemia in hospitals [published correction appears in Diabetes Care. 2004;27(5):1255; Diabetes Care. 2004;27(3):856]. Diabetes Care. 2004;27(2):553–591.
- , , , , . Inpatient management of diabetes and hyperglycemia among general medicine patients at a large teaching hospital. J Hosp Med. 2006;1(3):145–150.
- , , , , ;Society of Hospital Medicine Glycemic Control Task Force. Society of Hospital Medicine Glycemic Control Task Force summary: practical recommendations for assessing the impact of glycemic control efforts. J Hosp Med. 2008;3(5 suppl):66–75.
- , , , , , . Adherence to surgical care improvement project measures and the association with postoperative infections. JAMA. 2010;303(24):2479–2485.
- Glycemic Control Resource Room.Philadelphia, PA:Society of Hospital Medicine;2008. Available at: http://www.hospitalmedicine.org/ResourceRoomRedesign/GlycemicControl.cfm. Accessed November 23, 2012.
- Inpatient Glycemic Control Resource Center.Jacksonville, FL:American Association of Clinical Endocrinologists;2011. Available at: http://resources.aace.com. Accessed November 23, 2012.
- , , , et al.;Endocrine Society. Management of hyperglycemia in hospitalized patients in non‐critical care setting: an endocrine society clinical practice guideline. J Clin Endocrinol Metab. 2012;97(1):16–38.
- Hospital Quality Initiative.Baltimore, MD:Centers for Medicare and Medicaid Services;2012 [updated 2012]. Available at: http://www.cms.gov/HospitalQualityInits/08_HospitalRHQDAPU.asp. Accessed November 23, 2012.
- Hospital‐Acquired Conditions (Present on Admission Indicator).Baltimore, MD:Centers for Medicare and Medicaid Services;2012 [updated 2012]. Available at: http://www.cms.gov/hospitalacqcond/06_hospital‐acquired_conditions.asp. Accessed November 23, 2012.
- , , , et al. Evaluation of hospital glycemic control at US academic medical centers. J Hosp Med. 2009;4(1):35–44.
- , , , . Update on inpatient glycemic control in hospitals in the United States. Endocr Pract. 2011;17(6):853–861.
- , , , , , . Inpatient glucose control: a glycemic survey of 126 U.S. hospitals. J Hosp Med. 2009;4(9):E7–E14.
- , , , , . Inpatient point‐of‐care bedside glucose testing: preliminary data on use of connectivity informatics to measure hospital glycemic control. Diabetes Technol Ther. 2007;9(6):493–500.
- , , , , , . Diabetes and hyperglycemia quality improvement efforts in hospitals in the United States: current status, practice variation, and barriers to implementation. Endocr Pract. 2010;16(2):219–230.
- , , , et al. Intensive insulin therapy in critically ill patients. N Engl J Med. 2001;345(19):1359–1367.
- , , , et al. Intensive insulin therapy in the medical ICU. N Engl J Med. 2006;354(5):449–461.
- , , , et al.;German Competence Network Sepsis (SepNet). Intensive insulin therapy and pentastarch resuscitation in severe sepsis. N Engl J Med. 2008;358(2):125–139.
- , , , et al.;NICE‐SUGAR Study Investigators. Intensive versus conventional glucose control in critically ill patients. N Engl J Med. 2009;360(13):1283–1297.
- , , , et al. A prospective randomised multi‐centre controlled trial on tight glucose control by intensive insulin therapy in adult intensive care units: the Glucontrol study. Intensive Care Med. 2009;35(10):1738–1748.
- , , . Benefits and risks of tight glucose control in critically ill adults: a meta‐analysis [published correction appears in JAMA. 2009;301(9):936]. JAMA. 2008;300(8):933–944.
- , . Severe hypoglycemia in critically ill patients: risk factors and outcomes. Crit Care Med. 2007;35(10):2262–2267.
- , , , et al. Relationship between spontaneous and iatrogenic hypoglycemia and mortality in patients hospitalized with acute myocardial infarction. JAMA. 2009;301(15):1556–1564.
- , , , et al. Hypoglycemia and outcome in critically ill patients. Mayo Clin Proc. 2010;85(3):217–224.
- , , , . Assessing inpatient glycemic control: what are the next steps?J Diabetes Sci Technol. 2012;6(2):421–427.
Copyright © 2012 Society of Hospital Medicine
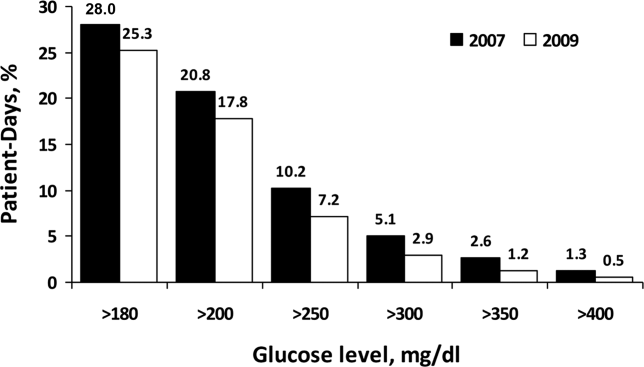
Prediction Mortality and Adverse Events
Favorable health outcomes are more likely to occur when the healthcare team quickly identifies and responds to patients at risk.[1, 2, 3] However, the treatment process can break down during handoffs if the clinical condition and active issues are not well communicated.[4] Patients whose decline cannot be reversed also challenge the health team. Many are referred to hospice late,[5] and some do not receive the type of end‐of‐life care matching their preferences.[6]
Progress toward the elusive goal of more effective and efficient care might be made via an industrial engineering approach, mass customization, in which bundles of services are delivered based on the anticipated needs of subsets of patients.[7, 8] An underlying rationale is the frequent finding that a small proportion of individuals experiences the majority of the events of interest, commonly referenced as the Pareto principle.[7] Clinical prediction rules can help identify these high‐risk subsets.[9] However, as more condition‐specific rules become available, the clinical team faces logistical challenges when attempting to incorporate these into practice. For example, which team member will be responsible for generating the prediction and communicating the level of risk? What actions should follow for a given level of risk? What should be done for patients with conditions not addressed by an existing rule?
In this study, we present our rationale for health systems to implement a process for generating mortality predictions at the time of admission on most, if not all, adult patients as a context for the activities of the various clinical team members. Recent studies demonstrate that in‐hospital or 30‐day mortality can be predicted with substantial accuracy using information available at the time of admission.[10, 11, 12, 13, 14, 15, 16, 17, 18, 19] Relationships are beginning to be explored among the risk factors for mortality and other outcomes such as length of stay, unplanned transfers to intensive care units, 30‐day readmissions, and extended care facility placement.[10, 20, 21, 22] We extend this work by examining how a number of adverse events can be understood through their relationship with the risk of dying. We begin by deriving and validating a new mortality prediction rule using information feasible for our institution to use in its implementation.
METHODS
The prediction rule was derived from data on all inpatients (n = 56,003) 18 to 99 years old from St. Joseph Mercy Hospital, Ann Arbor from 2008 to 2009. This is a community‐based, tertiary‐care center. We reference derivation cases as D1, validation cases from the same hospital in the following year (2010) as V1, and data from a second hospital in 2010 as V2. The V2 hospital belonged to the same parent health corporation and shared some physician specialists with D1 and V1 but had separate medical and nursing staff.
The primary outcome predicted is 30‐day mortality from the time of admission. We chose 30‐day rather than in‐hospital mortality to address concerns of potential confounding of duration of hospital stay and likelihood of dying in the hospital.[23] Risk factors were considered for inclusion into the prediction rule based on their prevalence, conceptual, and univariable association with death (details provided in the Supporting information, Appendix I and II, in the online version of this article). The types of risk factors considered were patient diagnoses as of the time of admission obtained from hospital administrative data and grouped by the 2011 Clinical Classification Software (
Prediction Rule Derivation Using D1 Dataset
Random forest procedures with a variety of variable importance measures were used with D1 data to reduce the number of potential predictor variables.[24] Model‐based recursive partitioning, a technique that combines features of multivariable logistic regression and classification and regression trees, was then used to develop the multivariable prediction model.[25, 26] Model building was done in R, employing functions provided as part of the randomForest and party packages. The final prediction rule consisted of 4 multivariable logistic regression models, each being specific to 1 of 4 possible population subgroups: females with/females without previous hospitalizations, and males with/males without previous hospitalizations. Each logistic regression model contains exactly the same predictor variables; however, the regression coefficients are subgroup specific. Therefore, the predicted probability of 30‐day mortality for a patient having a given set of predictor variables depends on the subgroup to which the patient is a member.
Validation, Discrimination, Calibration
The prediction rule was validated by generating a predicted probability of 30‐day mortality for each patient in V1 and V2, using their observed risk factor information combined with the scoring weights (ie, regression coefficients) derived from D1, then comparing predicted vs actual outcomes. Discriminatory accuracy is reported as the area under the receiver operating characteristic (ROC) curve that can range from 0.5 indicating pure chance, to 1.0 or perfect prediction.[27] Values above 0.8 are often interpreted as indicating strong predictive relationships, values between 0.7 and 0.79 as modest, and values between 0.6 and 0.69 as weak.[28] Model calibration was tested in all datasets across 20 intervals representing the spectrum of mortality risk, by assessing whether or not the 95% confidence limits for the actual proportion of patients dying encompassed the mean predicted mortality for the interval. These 20 intervals were defined using 5 percentile increments of the probability of dying for D1. The use of intervals based on percentiles ensures similarity in the level of predicted risk within an interval for V1 and V2, while allowing the proportion of patients contained within that interval to vary across hospitals.
Relationships With Other Adverse Events
We then used each patient's calculated probability of 30‐day mortality to predict the occurrence of other adverse events. We first derived scoring weights (ie, regression parameter estimates) from logistic regression models designed to relate each secondary outcome to the predicted 30‐day mortality using D1 data. These scoring weights were then respectively applied to the V1 and V2 patients' predicted 30‐day mortality rate to generate their predicted probabilities for: in‐hospital death, a stay in an intensive care unit at some point during the hospitalization, the occurrence of a condition not present on admission (a complication, see the Supporting information, Appendix I, in the online version of this article), palliative care status at the time of discharge (International Classification of Diseases, 9th Revision code V66.7), 30‐day readmission, and death within 180 days (determined for the first hospitalization of the patient in the calendar year, using hospital administrative data and the Social Security Death Index). Additionally, for V1 patients but not V2 due to unavailability of data, we predicted the occurrence of an unplanned transfer to an intensive care unit within the first 24 hours for those not admitted to the intensive care unit (ICU), and resuscitative efforts for cardiopulmonary arrests (code blue, as determined from hospital paging records and resuscitation documentation, with the realization that some resuscitations within the intensive care units might be undercaptured by this approach). Predicted vs actual outcomes were assessed using SAS version 9.2 by examining the areas under the receiver operating curves generated by the PROC LOGISTIC ROC.
Implications for Care Redesign
To illustrate how the mortality prediction provides a context for organizing the work of multiple health professionals, we created 5 risk strata[10] based on quintiles of D1 mortality risk. To display the time frame in which the peak risk of death occurs, we plotted the unadjusted hazard function per strata using SAS PROC LIFETEST.
RESULTS
Table 1 displays the risk factors used in the 30‐day mortality prediction rule, their distribution in the populations of interest, and the frequency of the outcomes of interest. The derivation (D1) and validation (V1) populations were clinically similar; the patients of hospital V2 differed in the proportion of risk factors and outcomes. The scoring weights or parameter estimates for the risk factors are given in the Appendix (see Supporting Information, Appendix I, in the online version of this article).
| Hospital A | Hospital V2 | ||
|---|---|---|---|
| D1 Derivation, N = 56,003 | V1 Validation, N = 28,441 | V2 Validation, N = 14,867 | |
| |||
| The 24 risk factors used in the prediction rule | |||
| Age in years, mean (standard deviation) | 59.8 (19.8) | 60.2 (19.8) | 66.4 (20.2) |
| Female | 33,185 (59.3%) | 16,992 (59.7%) | 8,935 (60.1%) |
| Respiratory failure on admission | 2,235 (4.0%) | 1,198 (4.2%) | 948 (6.4%) |
| Previous hospitalization | 19,560 (34.9%) | 10,155 (35.7%) | 5,925 (39.9%) |
| Hospitalization billed as an emergency admission[38] | 30,116 (53.8%) | 15,445 (54.3%) | 11,272 (75.8%) |
| Admitted to medicine service | 29,472 (52.6%) | 16,260 (57.2%) | 11,870 (79.8%) |
| Heart failure at the time of admission | 7,558 (13.5%) | 4,046 (14.2%) | 2,492 (16.8%) |
| Injury such as fractures or trauma at the time of admission | 7,007 (12.5%) | 3,612 (12.7%) | 2,205 (14.8%) |
| Sepsis at the time of admission | 2,278 (4.1%) | 1,025 (3.6%) | 850 (5.7%) |
| Current or past atrial fibrillation | 8,329 (14.9%) | 4,657 (16.4%) | 2,533 (17.0%) |
| Current or past metastatic cancer | 2,216 (4.0%) | 1,109 (3.9%) | 428 (2.9%) |
| Current or past cancer without metastases | 5,260 (9.34%) | 2,668 (9.4%) | 1,248 (8.4%) |
| Current or past history of leukemia or lymphoma | 1,025 (1.8%) | 526 (1.9%) | 278 (1.9%) |
| Current or past cognitive deficiency | 3,708 (6.6%) | 1,973 (6.9%) | 2,728 (18.4%) |
| Current or past history of other neurological conditions (such as Parkinson's disease, multiple sclerosis, epilepsy, coma, stupor, brain damage) | 4,671 (8.3%) | 2,537 (8.9%) | 1,606 (10.8%) |
| Maximum serum blood urea nitrogen (mg/dL), continuous | 21.9 (15.1) | 21.8 (15.1) | 25.9 (18.2) |
| Maximum white blood count (1,000/UL), continuous | 2.99 (4.00) | 3.10 (4.12) | 3.15 (3.81) |
| Minimum platelet count (1,000/UL), continuous | 240.5 (85.5) | 228.0 (79.6) | 220.0 (78.6) |
| Minimum hemoglobin (g/dL), continuous | 12.3 (1.83) | 12.3 (1.9) | 12.1 (1.9) |
| Minimum serum albumin (g/dL) <3.14, binary indicator | 11,032 (19.7%) | 3,848 (13.53%) | 2,235 (15.0%) |
| Minimum arterial pH <7.3, binary indicator | 1,095 (2.0%) | 473 (1.7%) | 308 (2.1%) |
| Minimum arterial pO2 (mm Hg) <85, binary indicator | 1,827 (3.3%) | 747 (2.6%) | 471 (3.2%) |
| Maximum serum troponin (ng/mL) >0.4, binary indicator | 6,268 (11.2%) | 1,154 (4.1%) | 2,312 (15.6%) |
| Maximum serum lactate (mEq/L) >4.0, binary indicator | 533 (1.0%) | 372 (1.3%) | 106 (0.7%) |
| Outcomes of interest | |||
| 30‐day mortalityprimary outcome of interest | 2,775 (5.0%) | 1,412 (5.0%) | 1,193 (8.0%) |
| In‐hospital mortality | 1,392 (2.5%) | 636 (2.2%) | 467 (3.1%) |
| 180‐day mortality (deaths/first hospitalization for patient that year) | 2,928/38,995 (7.5%) | 1,657/21,377 (7.8%) | 1,180/10,447 (11.3%) |
| Unplanned transfer to ICU within first 24 hours/number of patients with data not admitted to ICU | 434/46,647 (0.9%) | 276/25,920 (1.1%) | NA |
| Ever in ICU during hospitalization/those with ICU information available | 5,906/55,998 (10.6%) | 3,191/28,429 (11.2%) | 642/14,848 (4.32%) |
| Any complication | 6,768 (12.1%) | 2,447 (8.6%) | 868 (5.8%) |
| Cardiopulmonary arrest | 228 (0.4%) | 151 (0.5%) | NA |
| Patients discharged with palliative care V code | 1,151 (2.1%) | 962 (3.4%) | 340 (2.3%) |
| 30‐day rehospitalization/patients discharged alive | 6,616/54,606 (12.1%) | 3,602/27,793 (13.0%) | 2,002/14,381 (13.9%) |
Predicting 30‐Day Mortality
The areas under the ROC (95% confidence interval [CI]) for the D1, V1, and V2 populations were 0.876 (95% CI, 0.870‐0.882), 0.885 (95% CI, 0.877‐0.893), and 0.883 (95% CI, 0.875‐0.892), respectively. The calibration curves for all 3 populations are shown in Figure 1. The overlap of symbols indicates that the level of predicted risk matched actual mortality for most intervals, with slight underprediction for those in the highest risk percentiles.

Example of Risk Strata
Figure 2 displays the relationship between the predicted probability of dying within 30 days and the outcomes of interest for V1, and illustrates the Pareto principle for defining high‐ and low‐risk subgroups. Most of the 30‐day deaths (74.7% of D1, 74.2% of V1, and 85.3% of V2) occurred in the small subset of patients with a predicted probability of death exceeding 0.067 (the top quintile of risk of D1, the top 18 % of V1, and the top 29.8% of V2). In contrast, the mortality rate for those with a predicted risk of 0.0033 was 0.02% for the lowest quintile of risk in D1, 0.07% for the 19.3% having the lowest risk in V1, and 0% for the 9.7% of patients with the lowest risk in V2. Figure 3 indicates that the risk for dying peaks within the first few days of the hospitalization. Moreover, those in the high‐risk group remained at elevated risk relative to the lower risk strata for at least 100 days.
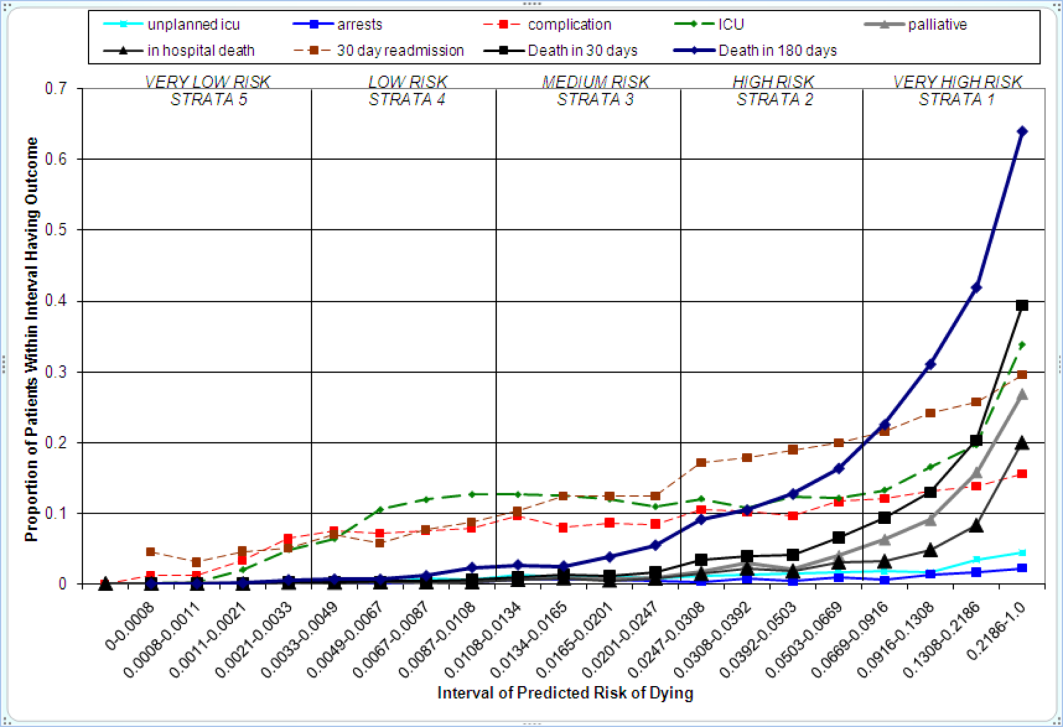
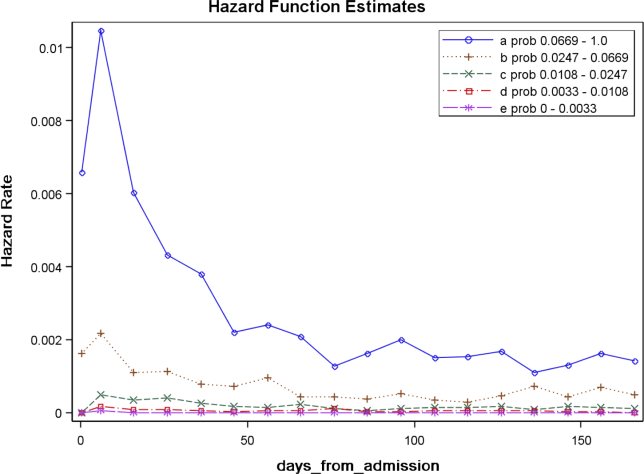
Relationships With Other Outcomes of Interest
The graphical curves of Figure 2 represent the occurrence of adverse events. The rising slopes indicate the risk for other events increases with the risk of dying within 30 days (for details and data for D1 and V2, see the Supporting Information, Appendix II, in the online version of this article). The strength of these relationships is quantified by the areas under the ROC curve (Table 2). The probability of 30‐day mortality strongly predicted the occurrence of in‐hospital death, palliative care status, and death within 180 days; modestly predicted having an unplanned transfer to an ICU within the first 24 hours of the hospitalization and undergoing resuscitative efforts for cardiopulmonary arrest; and weakly predicted intensive care unit use at some point in the hospitalization, occurrence of a condition not present on admission (complication), and being rehospitalized within 30 days
| Outcome | Hospital A | Hospital V2 | |
|---|---|---|---|
| D1Derivation | V1Validation | V2Validation | |
| |||
| Unplanned transfer to an ICU within the first 24 hours (for those not admitted to an ICU) | 0.712 (0.690‐0.734) | 0.735 (0.709‐0.761) | NA |
| Resuscitation efforts for cardiopulmonary arrest | 0.709 (0.678‐0.739) | 0.737 (0.700‐0.775) | NA |
| ICU stay at some point during the hospitalization | 0.659 (0.652‐0.666) | 0.663 (0.654‐0.672) | 0.702 (0.682‐0.722) |
| Intrahospital complication (condition not present on admission) | 0.682 (0.676‐0.689) | 0.624 (0.613‐0.635) | 0.646 (0.628‐0.664) |
| Palliative care status | 0.883 (0.875‐0.891) | 0.887 (0.878‐0.896) | 0.900 (0.888‐0.912) |
| Death within hospitalization | 0.861 (0.852‐0.870) | 0.875 (0.862‐0.887) | 0.880 (0.866‐0.893) |
| 30‐day readmission | 0.685 (0.679‐0.692) | 0.685 (0.676‐0.694) | 0.677 (0.665‐0.689) |
| Death within 180 days | 0.890 (0.885‐0.896) | 0.889 (0.882‐0.896) | 0.873 (0.864‐0.883) |
DISCUSSION
The primary contribution of our work concerns the number and strength of associations between the probability of dying within 30 days and other events, and the implications for organizing the healthcare delivery model. We also add to the growing evidence that death within 30 days can be accurately predicted at the time of admission from demographic information, modest levels of diagnostic information, and clinical laboratory values. We developed a new prediction rule with excellent accuracy that compares well to a rule recently developed by the Kaiser Permanente system.[13, 14] Feasibility considerations are likely to be the ultimate determinant of which prediction rule a health system chooses.[13, 14, 29] An independent evaluation of the candidate rules applied to the same data is required to compare their accuracy.
These results suggest a context for the coordination of clinical care processes, although mortality risk is not the only domain health systems must address. For illustrative purposes, we will refer to the risk strata shown in Figure 2. After the decisions to admit the patient to the hospital and whether or not surgical intervention is needed, the next decision concerns the level and type of nursing care needed.[10] Recent studies continue to show challenges both with unplanned transfers to intensive care units[21] and care delivered that is consistently concordant with patient wishes.[6, 30] The level of risk for multiple adverse outcomes suggests stratum 1 patients would be the priority group for perfecting the placement and preference assessment process. Our institution is currently piloting an internal placement guideline recommending that nonpalliative patients in the top 2.5 percentile of mortality risk be placed initially in either an intensive or intermediate care unit to receive the potential benefit of higher nursing staffing levels.[31] However, mortality risk cannot be the only criterion used for placement, as demonstrated by its relatively weak association with overall ICU utilization. Our findings may reflect the role of unmeasured factors such as the need for mechanical ventilation, patient preference for comfort care, bed availability, change in patient condition after admission, and inconsistent application of admission criteria.[17, 21, 32, 33, 34]
After the placement decision, the team could decide if the usual level of monitoring, physician rounding, and care coordination would be adequate for the level of risk or whether an additional anticipatory approach is needed. The weak relationship between the risk of death and incidence of complications, although not a new finding,[35, 36] suggests routine surveillance activities need to be conducted on all patients regardless of risk to detect a complication, but that a rescue plan be developed in advance for high mortality risk patients, for example strata 1 and 2, in the event they should develop a complication.[36] Inclusion of the patient's risk strata as part of the routine hand‐off communication among hospitalists, nurses, and other team members could provide a succinct common alert for the likelihood of adverse events.
The 30‐day mortality risk also informs the transition care plan following hospitalization, given the strong association with death in 180 days and the persistent level of this risk (Figure 3). Again, communication of the risk status (stratum 1) to the team caring for the patient after the hospitalization provides a common reference for prognosis and level of attention needed. However, the prediction accuracy is not sufficient to refer high‐risk patients into hospice, but rather, to identify the high‐risk subset having the most urgent need to have their preferences for future end‐of‐life care understood and addressed. The weak relationship of mortality risk with 30‐day readmissions indicates that our rule would have a limited role in identifying readmission risk per se. Others have noted the difficulty in accurately predicting readmissions, most likely because the underlying causes are multifactorial.[37] Our results suggest that 1 dynamic for readmission is the risk of dying, and so the underlying causes of this risk should be addressed in the transition plan.
There are a number of limitations with our study. First, this rule was developed and validated on data from only 2 institutions, assembled retrospectively, with diagnostic information determined from administrative data. One cannot assume the accuracy will carry over to other institutions[29] or when there is diagnostic uncertainty at the time of admission. Second, the 30‐day mortality risk should not be used as the sole criterion for determining the service intensity for individual patients because of issues with calibration, interpretation of risk, and confounding. The calibration curves (Figure 2) show the slight underprediction of the risk of dying for high‐risk groups. Other studies have also noted problems with precise calibration in validation datasets.[13, 14] Caution is also needed in the interpretation of what it means to be at high risk. Most patients in stratum 1 were alive at 30 days; therefore, being at high risk is not a death sentence. Furthermore, the relative weights of the risk factors reflect (ie, are confounded by) the level of treatment rendered. Some deaths within the higher‐risk percentiles undoubtedly occurred in patients choosing a palliative rather than a curative approach, perhaps partially explaining the slight underprediction of deaths. Conversely, the low mortality experienced by patients within the lower‐risk strata may indicate the treatment provided was effective. Low mortality risk does not imply less care is needed.
A third limitation is that we have not defined the thresholds of risk that should trigger placement and care intensity, although we provide examples on how this could be done. Each institution will need to calibrate the thresholds and associated decision‐making processes according to its own environment.[14] Interested readers can explore the sensitivity and specificity of various thresholds\ by using the tables in the Appendix (see the Supporting information, Appendix II, in the online version of this article). Finally, we do not know if identifying the mortality risk on admission will lead to better outcomes[19, 29]
CONCLUSIONS
Death within 30 days can be predicted with information known at the time of admission, and is associated with the risk of having other adverse events. We believe the probability of death can be used to define strata of risk that provide a succinct common reference point for the multidisciplinary team to anticipate the clinical course of subsets of patients and intervene with proportional intensity.
Acknowledgments
This work benefited from multiple conversations with Patricia Posa, RN, MSA, Elizabeth Van Hoek, MHSA, and the Redesigning Care Task Force of St. Joseph Mercy Hospital, Ann Arbor, Michigan.
Disclosure: Nothing to report.
- , , , et al. Importance of time to reperfusion for 30‐day and late survival and recovery of left ventricular function after primary angioplasty for acute myocardial infarction. J Am Coll Cardiol. 1998;32:1312–1319.
- , , , et al. Early goal‐directed therapy in the treatment of severe sepsis and septic shock. N Engl J Med. 2001;345:1368–1377.
- ATLANTIS, ECASS, NINDS rt‐PA Study Group Investigators. Association of outcome with early stroke treatment: pooled analysis of ATLANTIS, ECASS, and NINDS rt‐PA stroke trials. Lancet. 2004;363:768–774.
- , , , et al. Handoffs causing patient harm: a survey of medical and surgical house staff. Jt Comm J Qual Patient Saf. 2008;34:563–570.
- National Hospice and Palliative Care Organization. NHPCO facts and figures: hospice care in America 2010 Edition. Available at: http://www.nhpco.org. Accessed October 3,2011.
- , , , , . End‐of‐life discussions, goal attainment, and distress at the end of life: predictors and outcomes of receipt of care consistent with preferences. J Clin Oncol. 2010;28:1203–1208.
- Committee on Quality of Health Care in America, Institute of Medicine (IOM).Crossing the Quality Chasm: A New Health System for the 21st Century.Washington, DC:National Academies Press;2001.
- , , , et al. The surviving sepsis campaign: results of an international guideline‐based performance improvement program targeting severe sepsis. Intensive Care Med. 2010;36:222–231.
- , , , et al. A prediction rule to identify low‐risk patients with community‐acquired pneumonia. N Engl J Med. 1997;336:243–250.
- , . The simple clinical score predicts mortality for 30 days after admission to an acute medical unit. Q J Med. 2006;99:771–781.
- , , , et al. Enhancement of claims data to improve risk adjustment of hospital mortality. JAMA. 2007;297:71–76.
- , , . Using automated clinical data for risk adjustment. Med Care. 2007;45:789–805.
- , , , , , . Risk‐adjusting hospital inpatient mortality using automated inpatient, outpatient, and laboratory databases. Med Care. 2008;46:232–239.
- , , , . The Kaiser Permanente inpatient risk adjustment methodology was valid in an external patient population. J Clin Epidemiol. 2010;63:798–803.
- , , , , . An improved medical admissions risk system using multivariable fractional polynomial logistic regression modeling. Q J Med. 2010;103:23–32.
- , , , , . Risk scoring systems for adults admitted to the emergency department: a systematic review. Scand J Trauma Resusc Emerg Med. 2010;18:8.
- , , , , . Derivation and validation of a model to predict daily risk of death in hospital. Med Care. 2011;49:734–743.
- , , , . Prediction of hospital mortality from admission laboratory data and patient age: a simple model. Emerg Med Australas. 2011;23:354–363.
- , , . Predicting death: an empirical evaluation of predictive tools for mortality. Arch Intern Med. 2011;171:1721–1726.
- , , , . Length of stay predictions: improvements through the use of automated laboratory and comorbidity variables. Med Care. 2010;48:739–744.
- , , , , , . Intra‐hospital transfers to a higher level of care: contribution to total hospital and intensive care unit (ICU) mortality and length of stay (LOS). J Hosp Med. 2011;6:74–80.
- , , , et al. An automated model to identify heart failure patients at risk for 30‐day readmission or death using electronic medical record data. Med Care. 2010;48:981–988.
- , , , , , . Mortality trends during a program that publicly reported hospital performance. Med Care. 2002;40:879–890.
- , . Classification and regression by randomForest. R News. 2002;2:18–22.
- , , . Model‐based recursive partitioning. J Comput Graph Stat. 2008;17:492–514.
- , , , .Classification and Regression Trees.Belmont, CA:Wadsworth Inc.,1984.
- , , , , . Evaluating the yield of medical tests. JAMA. 1982;247:2543–2546.
- , , , . Risk stratification and therapeutic decision making in acute coronary syndromes. JAMA. 2000;284:876–878.
- , . Why is a good clinical prediction rule so hard to find?Arch Intern Med. 2011;171:1701–1702.
- , , . Advance directives and outcomes of surrogate decision making before death. N Engl J Med. 2010;362:1211–1218.
- , , , , , . Nurse staffing and inpatient hospital mortality. N Engl J Med. 2011;364:1037–1045.
- , , , et al. Survival of critically ill patients hospitalized in and out of intensive care. Crit Care Med. 2007;35:449–457.
- , , . How decisions are made to admit patients to medical intensive care units (MICUs): a survey of MICU directors at academic medical centers across the United States. Crit Care Med. 2008;36:414–420.
- , . Rethinking rapid response teams. JAMA. 2010;204:1375–1376.
- , , , . Hospital and patient characteristics associated with death after surgery: a study of adverse occurrence and failure to rescue. Med Care. 1992;30:615–629.
- , , . Variation in hospital mortality associated with inpatient surgery. N Engl J Med. 2009;361:1368–1375.
- , , , et al. Risk prediction models for hospital readmission: a systematic review. JAMA. 2011;306:1688–1698.
- Department of Health and Human Services, Centers for Medicare and Medicaid Services, CMS Manual System, Pub 100–04 Medicare Claims Processing, November 3, 2006. Available at: http://www. cms.gov/Regulations‐and‐Guidance/Guidance/Transmittals/Downloads/R1104CP.pdf. Accessed September 5,2012.
Favorable health outcomes are more likely to occur when the healthcare team quickly identifies and responds to patients at risk.[1, 2, 3] However, the treatment process can break down during handoffs if the clinical condition and active issues are not well communicated.[4] Patients whose decline cannot be reversed also challenge the health team. Many are referred to hospice late,[5] and some do not receive the type of end‐of‐life care matching their preferences.[6]
Progress toward the elusive goal of more effective and efficient care might be made via an industrial engineering approach, mass customization, in which bundles of services are delivered based on the anticipated needs of subsets of patients.[7, 8] An underlying rationale is the frequent finding that a small proportion of individuals experiences the majority of the events of interest, commonly referenced as the Pareto principle.[7] Clinical prediction rules can help identify these high‐risk subsets.[9] However, as more condition‐specific rules become available, the clinical team faces logistical challenges when attempting to incorporate these into practice. For example, which team member will be responsible for generating the prediction and communicating the level of risk? What actions should follow for a given level of risk? What should be done for patients with conditions not addressed by an existing rule?
In this study, we present our rationale for health systems to implement a process for generating mortality predictions at the time of admission on most, if not all, adult patients as a context for the activities of the various clinical team members. Recent studies demonstrate that in‐hospital or 30‐day mortality can be predicted with substantial accuracy using information available at the time of admission.[10, 11, 12, 13, 14, 15, 16, 17, 18, 19] Relationships are beginning to be explored among the risk factors for mortality and other outcomes such as length of stay, unplanned transfers to intensive care units, 30‐day readmissions, and extended care facility placement.[10, 20, 21, 22] We extend this work by examining how a number of adverse events can be understood through their relationship with the risk of dying. We begin by deriving and validating a new mortality prediction rule using information feasible for our institution to use in its implementation.
METHODS
The prediction rule was derived from data on all inpatients (n = 56,003) 18 to 99 years old from St. Joseph Mercy Hospital, Ann Arbor from 2008 to 2009. This is a community‐based, tertiary‐care center. We reference derivation cases as D1, validation cases from the same hospital in the following year (2010) as V1, and data from a second hospital in 2010 as V2. The V2 hospital belonged to the same parent health corporation and shared some physician specialists with D1 and V1 but had separate medical and nursing staff.
The primary outcome predicted is 30‐day mortality from the time of admission. We chose 30‐day rather than in‐hospital mortality to address concerns of potential confounding of duration of hospital stay and likelihood of dying in the hospital.[23] Risk factors were considered for inclusion into the prediction rule based on their prevalence, conceptual, and univariable association with death (details provided in the Supporting information, Appendix I and II, in the online version of this article). The types of risk factors considered were patient diagnoses as of the time of admission obtained from hospital administrative data and grouped by the 2011 Clinical Classification Software (
Prediction Rule Derivation Using D1 Dataset
Random forest procedures with a variety of variable importance measures were used with D1 data to reduce the number of potential predictor variables.[24] Model‐based recursive partitioning, a technique that combines features of multivariable logistic regression and classification and regression trees, was then used to develop the multivariable prediction model.[25, 26] Model building was done in R, employing functions provided as part of the randomForest and party packages. The final prediction rule consisted of 4 multivariable logistic regression models, each being specific to 1 of 4 possible population subgroups: females with/females without previous hospitalizations, and males with/males without previous hospitalizations. Each logistic regression model contains exactly the same predictor variables; however, the regression coefficients are subgroup specific. Therefore, the predicted probability of 30‐day mortality for a patient having a given set of predictor variables depends on the subgroup to which the patient is a member.
Validation, Discrimination, Calibration
The prediction rule was validated by generating a predicted probability of 30‐day mortality for each patient in V1 and V2, using their observed risk factor information combined with the scoring weights (ie, regression coefficients) derived from D1, then comparing predicted vs actual outcomes. Discriminatory accuracy is reported as the area under the receiver operating characteristic (ROC) curve that can range from 0.5 indicating pure chance, to 1.0 or perfect prediction.[27] Values above 0.8 are often interpreted as indicating strong predictive relationships, values between 0.7 and 0.79 as modest, and values between 0.6 and 0.69 as weak.[28] Model calibration was tested in all datasets across 20 intervals representing the spectrum of mortality risk, by assessing whether or not the 95% confidence limits for the actual proportion of patients dying encompassed the mean predicted mortality for the interval. These 20 intervals were defined using 5 percentile increments of the probability of dying for D1. The use of intervals based on percentiles ensures similarity in the level of predicted risk within an interval for V1 and V2, while allowing the proportion of patients contained within that interval to vary across hospitals.
Relationships With Other Adverse Events
We then used each patient's calculated probability of 30‐day mortality to predict the occurrence of other adverse events. We first derived scoring weights (ie, regression parameter estimates) from logistic regression models designed to relate each secondary outcome to the predicted 30‐day mortality using D1 data. These scoring weights were then respectively applied to the V1 and V2 patients' predicted 30‐day mortality rate to generate their predicted probabilities for: in‐hospital death, a stay in an intensive care unit at some point during the hospitalization, the occurrence of a condition not present on admission (a complication, see the Supporting information, Appendix I, in the online version of this article), palliative care status at the time of discharge (International Classification of Diseases, 9th Revision code V66.7), 30‐day readmission, and death within 180 days (determined for the first hospitalization of the patient in the calendar year, using hospital administrative data and the Social Security Death Index). Additionally, for V1 patients but not V2 due to unavailability of data, we predicted the occurrence of an unplanned transfer to an intensive care unit within the first 24 hours for those not admitted to the intensive care unit (ICU), and resuscitative efforts for cardiopulmonary arrests (code blue, as determined from hospital paging records and resuscitation documentation, with the realization that some resuscitations within the intensive care units might be undercaptured by this approach). Predicted vs actual outcomes were assessed using SAS version 9.2 by examining the areas under the receiver operating curves generated by the PROC LOGISTIC ROC.
Implications for Care Redesign
To illustrate how the mortality prediction provides a context for organizing the work of multiple health professionals, we created 5 risk strata[10] based on quintiles of D1 mortality risk. To display the time frame in which the peak risk of death occurs, we plotted the unadjusted hazard function per strata using SAS PROC LIFETEST.
RESULTS
Table 1 displays the risk factors used in the 30‐day mortality prediction rule, their distribution in the populations of interest, and the frequency of the outcomes of interest. The derivation (D1) and validation (V1) populations were clinically similar; the patients of hospital V2 differed in the proportion of risk factors and outcomes. The scoring weights or parameter estimates for the risk factors are given in the Appendix (see Supporting Information, Appendix I, in the online version of this article).
| Hospital A | Hospital V2 | ||
|---|---|---|---|
| D1 Derivation, N = 56,003 | V1 Validation, N = 28,441 | V2 Validation, N = 14,867 | |
| |||
| The 24 risk factors used in the prediction rule | |||
| Age in years, mean (standard deviation) | 59.8 (19.8) | 60.2 (19.8) | 66.4 (20.2) |
| Female | 33,185 (59.3%) | 16,992 (59.7%) | 8,935 (60.1%) |
| Respiratory failure on admission | 2,235 (4.0%) | 1,198 (4.2%) | 948 (6.4%) |
| Previous hospitalization | 19,560 (34.9%) | 10,155 (35.7%) | 5,925 (39.9%) |
| Hospitalization billed as an emergency admission[38] | 30,116 (53.8%) | 15,445 (54.3%) | 11,272 (75.8%) |
| Admitted to medicine service | 29,472 (52.6%) | 16,260 (57.2%) | 11,870 (79.8%) |
| Heart failure at the time of admission | 7,558 (13.5%) | 4,046 (14.2%) | 2,492 (16.8%) |
| Injury such as fractures or trauma at the time of admission | 7,007 (12.5%) | 3,612 (12.7%) | 2,205 (14.8%) |
| Sepsis at the time of admission | 2,278 (4.1%) | 1,025 (3.6%) | 850 (5.7%) |
| Current or past atrial fibrillation | 8,329 (14.9%) | 4,657 (16.4%) | 2,533 (17.0%) |
| Current or past metastatic cancer | 2,216 (4.0%) | 1,109 (3.9%) | 428 (2.9%) |
| Current or past cancer without metastases | 5,260 (9.34%) | 2,668 (9.4%) | 1,248 (8.4%) |
| Current or past history of leukemia or lymphoma | 1,025 (1.8%) | 526 (1.9%) | 278 (1.9%) |
| Current or past cognitive deficiency | 3,708 (6.6%) | 1,973 (6.9%) | 2,728 (18.4%) |
| Current or past history of other neurological conditions (such as Parkinson's disease, multiple sclerosis, epilepsy, coma, stupor, brain damage) | 4,671 (8.3%) | 2,537 (8.9%) | 1,606 (10.8%) |
| Maximum serum blood urea nitrogen (mg/dL), continuous | 21.9 (15.1) | 21.8 (15.1) | 25.9 (18.2) |
| Maximum white blood count (1,000/UL), continuous | 2.99 (4.00) | 3.10 (4.12) | 3.15 (3.81) |
| Minimum platelet count (1,000/UL), continuous | 240.5 (85.5) | 228.0 (79.6) | 220.0 (78.6) |
| Minimum hemoglobin (g/dL), continuous | 12.3 (1.83) | 12.3 (1.9) | 12.1 (1.9) |
| Minimum serum albumin (g/dL) <3.14, binary indicator | 11,032 (19.7%) | 3,848 (13.53%) | 2,235 (15.0%) |
| Minimum arterial pH <7.3, binary indicator | 1,095 (2.0%) | 473 (1.7%) | 308 (2.1%) |
| Minimum arterial pO2 (mm Hg) <85, binary indicator | 1,827 (3.3%) | 747 (2.6%) | 471 (3.2%) |
| Maximum serum troponin (ng/mL) >0.4, binary indicator | 6,268 (11.2%) | 1,154 (4.1%) | 2,312 (15.6%) |
| Maximum serum lactate (mEq/L) >4.0, binary indicator | 533 (1.0%) | 372 (1.3%) | 106 (0.7%) |
| Outcomes of interest | |||
| 30‐day mortalityprimary outcome of interest | 2,775 (5.0%) | 1,412 (5.0%) | 1,193 (8.0%) |
| In‐hospital mortality | 1,392 (2.5%) | 636 (2.2%) | 467 (3.1%) |
| 180‐day mortality (deaths/first hospitalization for patient that year) | 2,928/38,995 (7.5%) | 1,657/21,377 (7.8%) | 1,180/10,447 (11.3%) |
| Unplanned transfer to ICU within first 24 hours/number of patients with data not admitted to ICU | 434/46,647 (0.9%) | 276/25,920 (1.1%) | NA |
| Ever in ICU during hospitalization/those with ICU information available | 5,906/55,998 (10.6%) | 3,191/28,429 (11.2%) | 642/14,848 (4.32%) |
| Any complication | 6,768 (12.1%) | 2,447 (8.6%) | 868 (5.8%) |
| Cardiopulmonary arrest | 228 (0.4%) | 151 (0.5%) | NA |
| Patients discharged with palliative care V code | 1,151 (2.1%) | 962 (3.4%) | 340 (2.3%) |
| 30‐day rehospitalization/patients discharged alive | 6,616/54,606 (12.1%) | 3,602/27,793 (13.0%) | 2,002/14,381 (13.9%) |
Predicting 30‐Day Mortality
The areas under the ROC (95% confidence interval [CI]) for the D1, V1, and V2 populations were 0.876 (95% CI, 0.870‐0.882), 0.885 (95% CI, 0.877‐0.893), and 0.883 (95% CI, 0.875‐0.892), respectively. The calibration curves for all 3 populations are shown in Figure 1. The overlap of symbols indicates that the level of predicted risk matched actual mortality for most intervals, with slight underprediction for those in the highest risk percentiles.
Example of Risk Strata
Figure 2 displays the relationship between the predicted probability of dying within 30 days and the outcomes of interest for V1, and illustrates the Pareto principle for defining high‐ and low‐risk subgroups. Most of the 30‐day deaths (74.7% of D1, 74.2% of V1, and 85.3% of V2) occurred in the small subset of patients with a predicted probability of death exceeding 0.067 (the top quintile of risk of D1, the top 18 % of V1, and the top 29.8% of V2). In contrast, the mortality rate for those with a predicted risk of 0.0033 was 0.02% for the lowest quintile of risk in D1, 0.07% for the 19.3% having the lowest risk in V1, and 0% for the 9.7% of patients with the lowest risk in V2. Figure 3 indicates that the risk for dying peaks within the first few days of the hospitalization. Moreover, those in the high‐risk group remained at elevated risk relative to the lower risk strata for at least 100 days.
Relationships With Other Outcomes of Interest
The graphical curves of Figure 2 represent the occurrence of adverse events. The rising slopes indicate the risk for other events increases with the risk of dying within 30 days (for details and data for D1 and V2, see the Supporting Information, Appendix II, in the online version of this article). The strength of these relationships is quantified by the areas under the ROC curve (Table 2). The probability of 30‐day mortality strongly predicted the occurrence of in‐hospital death, palliative care status, and death within 180 days; modestly predicted having an unplanned transfer to an ICU within the first 24 hours of the hospitalization and undergoing resuscitative efforts for cardiopulmonary arrest; and weakly predicted intensive care unit use at some point in the hospitalization, occurrence of a condition not present on admission (complication), and being rehospitalized within 30 days
| Outcome | Hospital A | Hospital V2 | |
|---|---|---|---|
| D1Derivation | V1Validation | V2Validation | |
| |||
| Unplanned transfer to an ICU within the first 24 hours (for those not admitted to an ICU) | 0.712 (0.690‐0.734) | 0.735 (0.709‐0.761) | NA |
| Resuscitation efforts for cardiopulmonary arrest | 0.709 (0.678‐0.739) | 0.737 (0.700‐0.775) | NA |
| ICU stay at some point during the hospitalization | 0.659 (0.652‐0.666) | 0.663 (0.654‐0.672) | 0.702 (0.682‐0.722) |
| Intrahospital complication (condition not present on admission) | 0.682 (0.676‐0.689) | 0.624 (0.613‐0.635) | 0.646 (0.628‐0.664) |
| Palliative care status | 0.883 (0.875‐0.891) | 0.887 (0.878‐0.896) | 0.900 (0.888‐0.912) |
| Death within hospitalization | 0.861 (0.852‐0.870) | 0.875 (0.862‐0.887) | 0.880 (0.866‐0.893) |
| 30‐day readmission | 0.685 (0.679‐0.692) | 0.685 (0.676‐0.694) | 0.677 (0.665‐0.689) |
| Death within 180 days | 0.890 (0.885‐0.896) | 0.889 (0.882‐0.896) | 0.873 (0.864‐0.883) |
DISCUSSION
The primary contribution of our work concerns the number and strength of associations between the probability of dying within 30 days and other events, and the implications for organizing the healthcare delivery model. We also add to the growing evidence that death within 30 days can be accurately predicted at the time of admission from demographic information, modest levels of diagnostic information, and clinical laboratory values. We developed a new prediction rule with excellent accuracy that compares well to a rule recently developed by the Kaiser Permanente system.[13, 14] Feasibility considerations are likely to be the ultimate determinant of which prediction rule a health system chooses.[13, 14, 29] An independent evaluation of the candidate rules applied to the same data is required to compare their accuracy.
These results suggest a context for the coordination of clinical care processes, although mortality risk is not the only domain health systems must address. For illustrative purposes, we will refer to the risk strata shown in Figure 2. After the decisions to admit the patient to the hospital and whether or not surgical intervention is needed, the next decision concerns the level and type of nursing care needed.[10] Recent studies continue to show challenges both with unplanned transfers to intensive care units[21] and care delivered that is consistently concordant with patient wishes.[6, 30] The level of risk for multiple adverse outcomes suggests stratum 1 patients would be the priority group for perfecting the placement and preference assessment process. Our institution is currently piloting an internal placement guideline recommending that nonpalliative patients in the top 2.5 percentile of mortality risk be placed initially in either an intensive or intermediate care unit to receive the potential benefit of higher nursing staffing levels.[31] However, mortality risk cannot be the only criterion used for placement, as demonstrated by its relatively weak association with overall ICU utilization. Our findings may reflect the role of unmeasured factors such as the need for mechanical ventilation, patient preference for comfort care, bed availability, change in patient condition after admission, and inconsistent application of admission criteria.[17, 21, 32, 33, 34]
After the placement decision, the team could decide if the usual level of monitoring, physician rounding, and care coordination would be adequate for the level of risk or whether an additional anticipatory approach is needed. The weak relationship between the risk of death and incidence of complications, although not a new finding,[35, 36] suggests routine surveillance activities need to be conducted on all patients regardless of risk to detect a complication, but that a rescue plan be developed in advance for high mortality risk patients, for example strata 1 and 2, in the event they should develop a complication.[36] Inclusion of the patient's risk strata as part of the routine hand‐off communication among hospitalists, nurses, and other team members could provide a succinct common alert for the likelihood of adverse events.
The 30‐day mortality risk also informs the transition care plan following hospitalization, given the strong association with death in 180 days and the persistent level of this risk (Figure 3). Again, communication of the risk status (stratum 1) to the team caring for the patient after the hospitalization provides a common reference for prognosis and level of attention needed. However, the prediction accuracy is not sufficient to refer high‐risk patients into hospice, but rather, to identify the high‐risk subset having the most urgent need to have their preferences for future end‐of‐life care understood and addressed. The weak relationship of mortality risk with 30‐day readmissions indicates that our rule would have a limited role in identifying readmission risk per se. Others have noted the difficulty in accurately predicting readmissions, most likely because the underlying causes are multifactorial.[37] Our results suggest that 1 dynamic for readmission is the risk of dying, and so the underlying causes of this risk should be addressed in the transition plan.
There are a number of limitations with our study. First, this rule was developed and validated on data from only 2 institutions, assembled retrospectively, with diagnostic information determined from administrative data. One cannot assume the accuracy will carry over to other institutions[29] or when there is diagnostic uncertainty at the time of admission. Second, the 30‐day mortality risk should not be used as the sole criterion for determining the service intensity for individual patients because of issues with calibration, interpretation of risk, and confounding. The calibration curves (Figure 2) show the slight underprediction of the risk of dying for high‐risk groups. Other studies have also noted problems with precise calibration in validation datasets.[13, 14] Caution is also needed in the interpretation of what it means to be at high risk. Most patients in stratum 1 were alive at 30 days; therefore, being at high risk is not a death sentence. Furthermore, the relative weights of the risk factors reflect (ie, are confounded by) the level of treatment rendered. Some deaths within the higher‐risk percentiles undoubtedly occurred in patients choosing a palliative rather than a curative approach, perhaps partially explaining the slight underprediction of deaths. Conversely, the low mortality experienced by patients within the lower‐risk strata may indicate the treatment provided was effective. Low mortality risk does not imply less care is needed.
A third limitation is that we have not defined the thresholds of risk that should trigger placement and care intensity, although we provide examples on how this could be done. Each institution will need to calibrate the thresholds and associated decision‐making processes according to its own environment.[14] Interested readers can explore the sensitivity and specificity of various thresholds\ by using the tables in the Appendix (see the Supporting information, Appendix II, in the online version of this article). Finally, we do not know if identifying the mortality risk on admission will lead to better outcomes[19, 29]
CONCLUSIONS
Death within 30 days can be predicted with information known at the time of admission, and is associated with the risk of having other adverse events. We believe the probability of death can be used to define strata of risk that provide a succinct common reference point for the multidisciplinary team to anticipate the clinical course of subsets of patients and intervene with proportional intensity.
Acknowledgments
This work benefited from multiple conversations with Patricia Posa, RN, MSA, Elizabeth Van Hoek, MHSA, and the Redesigning Care Task Force of St. Joseph Mercy Hospital, Ann Arbor, Michigan.
Disclosure: Nothing to report.
- , , , et al. Importance of time to reperfusion for 30‐day and late survival and recovery of left ventricular function after primary angioplasty for acute myocardial infarction. J Am Coll Cardiol. 1998;32:1312–1319.
- , , , et al. Early goal‐directed therapy in the treatment of severe sepsis and septic shock. N Engl J Med. 2001;345:1368–1377.
- ATLANTIS, ECASS, NINDS rt‐PA Study Group Investigators. Association of outcome with early stroke treatment: pooled analysis of ATLANTIS, ECASS, and NINDS rt‐PA stroke trials. Lancet. 2004;363:768–774.
- , , , et al. Handoffs causing patient harm: a survey of medical and surgical house staff. Jt Comm J Qual Patient Saf. 2008;34:563–570.
- National Hospice and Palliative Care Organization. NHPCO facts and figures: hospice care in America 2010 Edition. Available at: http://www.nhpco.org. Accessed October 3,2011.
- , , , , . End‐of‐life discussions, goal attainment, and distress at the end of life: predictors and outcomes of receipt of care consistent with preferences. J Clin Oncol. 2010;28:1203–1208.
- Committee on Quality of Health Care in America, Institute of Medicine (IOM).Crossing the Quality Chasm: A New Health System for the 21st Century.Washington, DC:National Academies Press;2001.
- , , , et al. The surviving sepsis campaign: results of an international guideline‐based performance improvement program targeting severe sepsis. Intensive Care Med. 2010;36:222–231.
- , , , et al. A prediction rule to identify low‐risk patients with community‐acquired pneumonia. N Engl J Med. 1997;336:243–250.
- , . The simple clinical score predicts mortality for 30 days after admission to an acute medical unit. Q J Med. 2006;99:771–781.
- , , , et al. Enhancement of claims data to improve risk adjustment of hospital mortality. JAMA. 2007;297:71–76.
- , , . Using automated clinical data for risk adjustment. Med Care. 2007;45:789–805.
- , , , , , . Risk‐adjusting hospital inpatient mortality using automated inpatient, outpatient, and laboratory databases. Med Care. 2008;46:232–239.
- , , , . The Kaiser Permanente inpatient risk adjustment methodology was valid in an external patient population. J Clin Epidemiol. 2010;63:798–803.
- , , , , . An improved medical admissions risk system using multivariable fractional polynomial logistic regression modeling. Q J Med. 2010;103:23–32.
- , , , , . Risk scoring systems for adults admitted to the emergency department: a systematic review. Scand J Trauma Resusc Emerg Med. 2010;18:8.
- , , , , . Derivation and validation of a model to predict daily risk of death in hospital. Med Care. 2011;49:734–743.
- , , , . Prediction of hospital mortality from admission laboratory data and patient age: a simple model. Emerg Med Australas. 2011;23:354–363.
- , , . Predicting death: an empirical evaluation of predictive tools for mortality. Arch Intern Med. 2011;171:1721–1726.
- , , , . Length of stay predictions: improvements through the use of automated laboratory and comorbidity variables. Med Care. 2010;48:739–744.
- , , , , , . Intra‐hospital transfers to a higher level of care: contribution to total hospital and intensive care unit (ICU) mortality and length of stay (LOS). J Hosp Med. 2011;6:74–80.
- , , , et al. An automated model to identify heart failure patients at risk for 30‐day readmission or death using electronic medical record data. Med Care. 2010;48:981–988.
- , , , , , . Mortality trends during a program that publicly reported hospital performance. Med Care. 2002;40:879–890.
- , . Classification and regression by randomForest. R News. 2002;2:18–22.
- , , . Model‐based recursive partitioning. J Comput Graph Stat. 2008;17:492–514.
- , , , .Classification and Regression Trees.Belmont, CA:Wadsworth Inc.,1984.
- , , , , . Evaluating the yield of medical tests. JAMA. 1982;247:2543–2546.
- , , , . Risk stratification and therapeutic decision making in acute coronary syndromes. JAMA. 2000;284:876–878.
- , . Why is a good clinical prediction rule so hard to find?Arch Intern Med. 2011;171:1701–1702.
- , , . Advance directives and outcomes of surrogate decision making before death. N Engl J Med. 2010;362:1211–1218.
- , , , , , . Nurse staffing and inpatient hospital mortality. N Engl J Med. 2011;364:1037–1045.
- , , , et al. Survival of critically ill patients hospitalized in and out of intensive care. Crit Care Med. 2007;35:449–457.
- , , . How decisions are made to admit patients to medical intensive care units (MICUs): a survey of MICU directors at academic medical centers across the United States. Crit Care Med. 2008;36:414–420.
- , . Rethinking rapid response teams. JAMA. 2010;204:1375–1376.
- , , , . Hospital and patient characteristics associated with death after surgery: a study of adverse occurrence and failure to rescue. Med Care. 1992;30:615–629.
- , , . Variation in hospital mortality associated with inpatient surgery. N Engl J Med. 2009;361:1368–1375.
- , , , et al. Risk prediction models for hospital readmission: a systematic review. JAMA. 2011;306:1688–1698.
- Department of Health and Human Services, Centers for Medicare and Medicaid Services, CMS Manual System, Pub 100–04 Medicare Claims Processing, November 3, 2006. Available at: http://www. cms.gov/Regulations‐and‐Guidance/Guidance/Transmittals/Downloads/R1104CP.pdf. Accessed September 5,2012.
Copyright © 2012 Society of Hospital Medicine
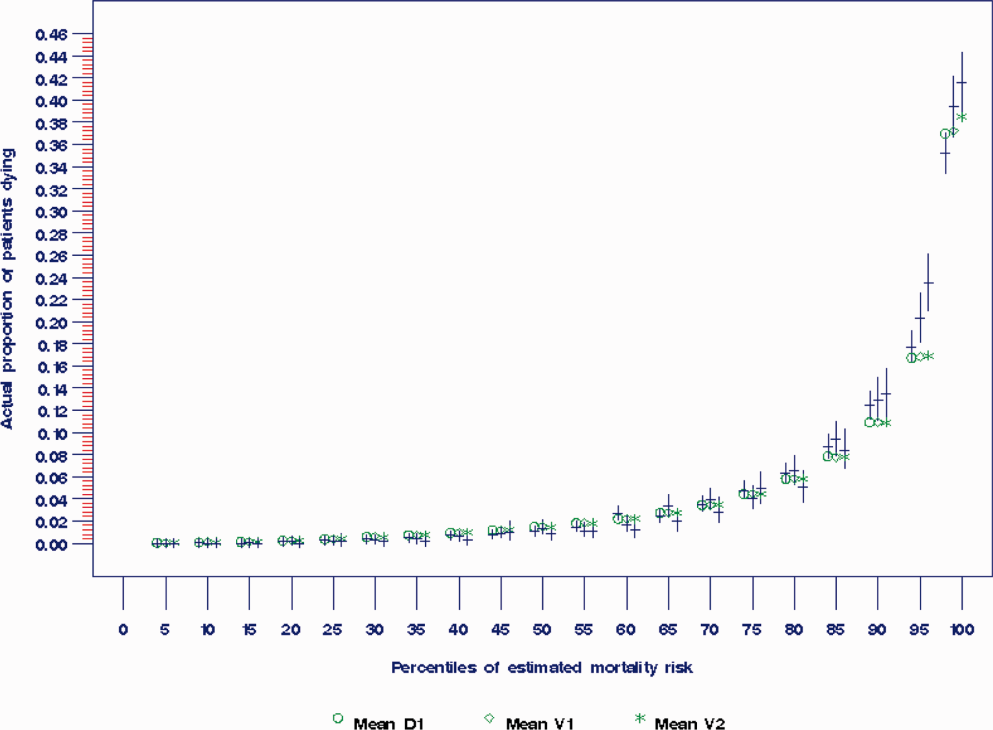
Dr. Raul Ruiz goes to Washington
Dr. Raul Ruiz has traded in his white coat for an office on Capitol Hill. An emergency physician from California’s Coachella Valley, Dr. Ruiz is the newest physician, and one of three democrat physicians, serving in Congress. When the 113th Congress begins on Jan. 3, Dr. Ruiz said he will focus on physician payment reform as well as addressing disparities in income, healthcare, and education.
Unlike many congressional physicians – the majority of whom are Republicans – Dr. Ruiz said he wants to keep some Affordable Care Act provisions in place, while ensuring the health care workforce can support them. To find out more about Dr. Ruiz, check out our video.
Docs to Congress: SGR fix can't wait
The American Medical Association, the American College of Family Physicians, the American College of Physicians, the American College of Surgeons, and the American Osteopathic Association together met with more than a dozen lawmakers.
The American Medical Association, the American College of Family Physicians, the American College of Physicians, the American College of Surgeons, and the American Osteopathic Association together met with more than a dozen lawmakers.
The American Medical Association, the American College of Family Physicians, the American College of Physicians, the American College of Surgeons, and the American Osteopathic Association together met with more than a dozen lawmakers.