User login
Does a higher frequency of difficult patient encounters lead to lower quality care?
Background Difficult patient encounters in the primary care office are frequent and are associated with physician burnout. However, their relationship to patient care outcomes is not known.
Objective To determine the effect of difficult encounters on patient health outcomes and the role of physician dissatisfaction and burnout as mediators of this effect.
Design A total of 422 physicians were sorted into 3 clusters based on perceived frequency of difficult patient encounters in their practices. Patient charts were audited to assess the quality of hypertension and diabetes management and preventive care based on national guidelines. Summary measures of quality and errors were compared among the 3 physician clusters.
Results Of the 1384 patients, 359 were cared for by high-cluster physicians (those who had a high frequency of difficult encounters), 871 by medium-cluster physicians, and 154 by low-cluster physicians. Dissatisfaction and burnout were higher among physicians reporting higher frequencies of difficult encounters. However, quality of patient care and management errors were similar across all 3 groups.
Conclusions Physician perception of frequent difficult encounters was not associated with worse patient care quality or more medical errors. Future studies should investigate whether other patient outcomes, including acute care and patient satisfaction, are affected by difficult encounters.
Physicians who have high numbers of difficult patient encounters are more likely to report burnout and related stressor effects than are colleagues with fewer difficult encounters.1 More of them also perceive that they provide suboptimal care than do colleagues who report fewer difficult patients.1 These were some of the findings taken from the Minimizing Error, Maximizing Outcome (MEMO) Study that we conducted from 2001 to 2005.1 But these findings prompted us to wonder: Is that perception accurate?
Whether physicians reporting high numbers of difficult patient encounters actually provide poorer care is unknown. In a recent study of physicians from one large primary care system, patient panels that were more challenging—as determined by higher rates of underinsured, minority, and non-English-speaking patients—were associated with lower quality care.2 Hinchey and Jackson found that 2 weeks after initial presentation, patients involved in difficult encounters at a walk-in clinic experienced worsening physical symptoms.3 However, this study did not address whether difficult patient encounters affected the care rendered by providers to patients in general.
A detailed, rigorous model describing the interplay and relationships among difficult encounters, adverse physician outcomes (eg, burnout, dissatisfaction), and patient health outcomes has yet to be developed. To better understand the effects of these interactions, we revisited data from the MEMO study.
The findings that prompted another look at the data
When we conducted the MEMO study, we surveyed 422 physicians working in 119 primary care clinics in the upper Midwest and New York City.4 Almost half (49%) of the physicians reported moderately or highly stressful jobs; 27% reported burnout; and 30% were at least moderately likely to leave their practices within 2 years. Of these physicians, 113 (27%) reported high numbers of difficult encounters, which corresponds with other reports of 10% to 37% in primary care settings.5-7 These 113 physicians were 12.2 times more likely to report burnout compared with colleagues with fewer difficult encounters.1 They also reported lower job satisfaction, increased stress, more time pressure, and greater intent to leave practice, which are also echoed in other studies.8-10
We found in our study (and at least one other) that physicians experiencing burnout are often younger and female, work long hours, and practice in a medicine subspecialty.1,11 Many physicians who care for difficult patients report that they secretly hope these patients will not return.6
Our hypothesis
We hypothesized that frequent difficult encounters may amplify an adverse work environment, and that physicians facing time pressure and a lack of work control brought on by these encounters might be unable to sustain a high standard of care for their overall patient load.
METHODS
Participants
Physician and patient participants and design of the MEMO study are described in detail elsewhere.12 The following, though, is a recap:
We recruited 422 general internists and family physicians from 119 ambulatory care clinics in New York City and the upper Midwest. These regions offered a diverse patient and payer mix. Physicians were asked via on-site presentations and mailed invitations to complete a survey derived from focus groups and the Physician Worklife Survey.13,14
We also recruited up to 8 patients per participating physician via mailed invitations. Inclusion criteria were a minimum age of 18; a diagnosis of at least one target condition (hypertension, diabetes, congestive heart failure); ability to read in English, Spanish, or Chinese; and at least 2 visits with their primary physician in the previous year.
Here we report on outcomes for those patients with diabetes and hypertension.
Measures
When we initially conducted the study, physicians completed an 8-item Burden of Difficult Encounters measure designed to approximate the frequency of difficult encounters experienced. Latent cluster analyses of this survey measure defined 3 distinct groups of physicians: those who estimated a high, medium, and low frequency of difficult encounters in their practices. Via chart audits, we determined quality of care and errors related to guideline-recommended management and preventive care for hypertension and diabetes. Details of these audits are found elsewhere.4
We defined quality care for hypertension as successful blood pressure control (<140/90), and for diabetes, successful control of hemoglobin A1c (≤7.5) and blood pressure (<135/80). One quality point was awarded for each of these 3 measures if achieved for at least 50% of recorded visits over an 18-month period. We calculated the quality score as the proportion of total possible quality points (with 100%=best).
We defined errors as guideline non-adherence and missed opportunities for prevention or management, tailored to each patient’s age, sex, and diagnoses. We calculated the error score as the proportion of total applicable error points (maximum=15; 0%=best). We assigned an error point for each missing process of care, including missed treatment opportunities, inattention to behavioral factors, guideline nonadherence, lack of tobacco use documentation, and missed prevention activities, such as mammograms, cervical cancer screening, colon cancer screening, and depression assessment.
We normalized scores to a range of 0 to 100 by dividing the number of quality or error points by the number of applicable items and multiplying by 100. We calculated quality and error scores for hypertension or diabetes for each patient and averaged them to determine total scores per physician.
Data analysis
Latent cluster analyses identified 3 distinct clusters of physicians based on their reported frequency of difficult encounters.1 We used a 2-level hierarchical linear model of patients nested under physicians to assess if a higher number of perceived difficult patients was associated with poorer patient care, as measured by quality of care and medical errors, controlling for physician age, sex, and racial/ethnic minority status. To further adjust for negatively biased standard errors (physicians recruited from the same clinics, for example), we applied the Huber-White sandwich estimator.15,16
We analyzed the association between levels of difficult patients and patient outcomes following a conceptual model. Using Cluster 3 (low frequency of difficult encounters) as the reference group, we tested the direct association of Cluster 1 (high frequency of difficult encounters) and Cluster 2 (medium frequency of encounters) with patient outcomes (eg, errors in diabetes and hypertension management, missed prevention activities, quality benchmarks met). We also tested the adjusted influence of Clusters 1 and 2 on patient outcomes, controlling for the mediators of burnout and satisfaction. Finally, we examined the direct influence of Clusters 1 and 2 on the mediators of burnout and satisfaction.
RESULTS
A total of 449 physicians from 119 clinics consented to participate in MEMO (59.8% of those approached), and 94% of these (n=422) completed the survey.4 Compared with participants, nonparticipants did not differ significantly by specialty or sex. Physicians were evenly divided between general internists (51.9%) and family physicians (48.1%). The mean age was 43 (range, 29-89), 44.4% were women, most (83.3%) worked full-time, and 22.0% were from a racial or ethnic minority group. Specific results of the Burden of Encounters measure, depicted in TABLE 1, have been reported previously.1
TABLE 1
Burden of Difficult Encounters measure1
Latent cluster analyses of this survey measure were used to assign physicians to one of 3 clusters: those who estimated a low, medium, or high frequency of difficult encounters in their practice.
| How often do the following interactions occur? (1=never; 4=often) | |
|---|---|
| Patients who: | No. of physicians providing ratings of 3 or 4 (%); n=422 |
| Visit regularly, but ignore medical advice | 155 (37) |
| Have expectations for care that are unrealistic | 68 (16) |
| Insist on being prescribed an unnecessary drug | 58 (14) |
| Insist on an unnecessary test | 54 (13) |
| Persistently complain, although you have done everything possible to help | 50 (12) |
| Do not express appropriate respect | 16 (4) |
| Show dissatisfaction with your care | 4 (1) |
| Are verbally abusive | 1 (0.2) |
Physicians were more likely to sort into the high (n=113) and medium (n=268) frequency of difficult encounter clusters as opposed to the low-frequency cluster (n=41) (TABLE 2). Of the 1384 patients whose records were audited, 359 were cared for by high-cluster physicians, 871 by medium-cluster physicians, and 154 by low-cluster physicians. Patients had a mean age of 59.6, 65.6% were women, and they had an average of 4.5 chronic medical conditions. A greater percentage of patients with physicians in the high-frequency cluster had a diagnosis of hypertension, compared with the medium cluster (92.4% vs 87.7%; P<.05). Patients did not differ across physician clusters by age, sex, prevalence of diabetes, or number of chronic diagnoses.
TABLE 2
Physician characteristics across frequency clusters (n=422)1
| Physician characteristic | Frequency-of-difficult-encounter cluster | ||
|---|---|---|---|
| High, % (n=113) | Medium, % (n=268) | Low, % (n=41) | |
| Family physicians (vs general internists) | 41.6 | 49.6 | 58.5 |
| Age, mean (SD) | 40.8 (9.0)*† | 43.3 (9.0) | 46.1 (13.4) |
| Female sex | 50.4† | 44.6‡ | 26.8 |
| Racial/ethnic minority | |||
| • Black or African American | 8.0 | 4.1‡ | 14.6 |
| • Asian | 13.3 | 11.9 | 9.8 |
| • Hispanic or Latino | 6.6 | 3.1 | 0 |
| • Other | 6.2 | 3.4 | 0 |
| Full-time work status | 83.8 | 83.5 | 80.5 |
| Exact probability tests were used to contrast proportional differences. *P<.05 for high vs medium frequency of difficult encounter clusters. †P<.05 for high vs low frequency of difficult encounter clusters. ‡P<.05 for medium vs low frequency of difficult encounter clusters. | |||
We examined the relationship between perceived frequency of difficult encounters and patient outcomes using a double-mediation model with physician burnout and satisfaction as mediators. We found that the greater the perceived number of difficult encounters, the greater the burnout and job dissatisfaction. For example, on a 5-point Likert scale measuring burnout where 1 = no burnout and 5 = significant and persistent burnout, medium-cluster physicians scored 0.48 points higher than the low-cluster physician cohort. High-cluster physicians scored 0.84 points higher than their low-cluster colleagues (both P<.05). Similarly, high-cluster physicians were less satisfied with their jobs; on a 5-point scale where 1 = low satisfaction and 5 = high satisfaction, high-cluster physicians scored 0.60 points lower than low-cluster physicians (P<.05).
Yet, there was no clear association between perceived frequency of difficult encounters and patient outcomes. High-cluster physicians had a 5.57% lower overall error rate compared with low-cluster physicians (P<.05), although this was not true for specific errors, such as those in hypertension or diabetes management, where rates were similar. High-cluster physicians also had a 7.68% lower overall quality rate (P<.05), although, again, this was not true for management of specific conditions such as hypertension and diabetes, where rates were similar. In sum, in our double-mediation model, there was no consistent influence of a physician’s difficult-encounter cluster on patient outcomes, even when including physician burnout and level of satisfaction as mediators.
DISCUSSION
Our principal finding is that the perception of frequent difficult encounters—while associated with significant physician burnout and dissatisfaction—was not associated with worse quality of patient care or higher rates of error. Physicians with a high volume of difficult encounters and burnout maintained standards of care for their patients comparable to those of their peers who experienced less frequent difficult encounters. We propose several hypotheses to explain this observation.
First, the Conservation of Resources (COR) Theory suggests that when resources are depleted or stressed by work demands (difficult encounters), burnout will result.17 In response, burned-out individuals will reduce their resource expenditure (attention, time) and focus their resources on the most important aspects of their work—in our case, measured quality of care. In the physician-patient communication literature, Williams et al suggest that burned-out physicians use a strictly biomedical style of communication,18 which is less resource intensive than more patient-centered forms of communication.19 Thus, while a physician may be burned out and dissatisfied, she or he will focus communication on key clinical aspects of the encounter (the presenting complaint, necessary preventive care) while de-emphasizing the psychosocial aspects of care. Consequently, a physician may be burned out by difficult encounters, but may continue to provide adequate patient care.
Second, these results may reflect (in part) the professional socialization of physicians. The rigors of medical school and residency training provide physicians with a high level of personal hardiness. The nursing literature defines hardiness as the interrelatedness of 3 factors controlled by the individual through lifestyle: control of the environment, commitment to self-fulfilling goals, and reasonable levels of challenge in daily life. Thomsens et al found that these traits serve as buffers to protect individuals from the psychological repercussions of stress.20
Nikou designed a study to investigate the relationships among hardiness, stress, and health-promoting behaviors in students attending a nursing student conference.21 The results indicated that hardiness was inversely related to stress and positively related to health-promoting behaviors. Thus, while physicians face challenging and difficult encounters and become burned out and dissatisfied, they are able to deliver acceptable patient care due to the buffering effect of their professional socialization.
Third, physicians’ responses to performance measurement pressures—ubiquitous in the culture of primary care medicine today—may also contribute to our findings. Physicians are called on to meet both national and local standards of care, and are expected to keep patients satisfied. Such objectives may be tied to financial incentives.22 In this environment, many doctors are likely to respond so that quality measures are met, even when faced with a challenging patient encounter. Higashi et al found that the quality of care delivered to patients was better as the number of chronic conditions increased.23 Others have argued that current clinical practice guidelines, which have driven quality measurement, have led to unintended consequences—for example, polypharmacy with inadequate consideration of adverse drug-drug interactions.22,24,25
Study limitations. This study is limited by its sample size, which may have restricted our ability to discern small but meaningful differences in quality and errors. In addition, enrollment bias—given that a small number of patients per physician were enrolled—could have muted potential positive findings. If possible, future studies should include outcomes from entire patient panels.
While the objective recording of quality and errors is a strength of this study, data on the frequency of difficult encounters were cross-sectional. As a result, causal relationships between physician-experienced difficulty and patient outcomes were not possible to determine.
Lastly, throughout this study the term “patient outcomes” has been limited to the particular medical outcomes used in our investigation. But it is well recognized that important patient outcomes could also include measures such as satisfaction, trust, medication adherence, and costs.
More to explore. We found that the perception of frequent difficult patient encounters was not associated with poorer patient outcomes, even in the setting of physician dissatisfaction and burnout. Although difficult encounters were associated with physician burnout and job dissatisfaction, it appears that physicians who perceived very frequent difficult patient encounters had comparable standards of care relative to their peers who reported fewer difficult encounters.
Future research should examine additional patient outcomes related to chronic conditions and acute care and their relationship to difficult encounters. Furthermore, other potential consequences of difficult encounters need to be explored, especially those that may result from poor physician-patient communication such as medication adherence, patient satisfaction, and trust.
CORRESPONDENCE
Perry G. An, MD, Newton-Wellesley Hospital, 2014 Washington Street, 2nd Floor, Newton, MA 02462; [email protected]
1. An PG, Rabatin JS, Manwell LB, et al. Burden of difficult patient encounters in primary care: data from the Minimizing Error, Maximizing Outcome Study. Arch Intern Med. 2009;169:410-414.
2. Hong CS, Atlas SJ, Chang Y, et al. Relationship between patient panel characteristics and primary care physician clinical performance rankings. JAMA. 2010;304:1107-1113.
3. Hinchey SA, Jackson JL. A cohort study assessing difficult patient encounters in a walk-in primary care clinic, predictors and outcomes. J Gen Intern Med. 2011;26:588-594.
4. Linzer M, Manwell LB, Williams ES, et al. Working conditions in primary care: physician reactions and care quality. Ann Intern Med. 2009;151:28-36.
5. Jackson JL, Kroenke K. Difficult patient encounters in the ambulatory clinic: clinical predictors and outcomes. Arch Intern Med. 1999;159:1069-1075.
6. Hahn SR, Kroenke K, Spitzer RL, et al. The difficult patient: prevalence, psychopathology, and functional impairment. J Gen Intern Med. 1996;11:1-8.
7. Hahn SR, Thompson KS, Wills TA, et al. The difficult doctor-patient relationship: somatization, personality and psychopathology. J Clin Epidemiol. 1994;47:647-657.
8. Wetterneck TB, Linzer M, McMurray JE, et al. Worklife and satisfaction of general internists. Arch Intern Med. 2002;162:649-656.
9. Calnan M, Wainwright D, Forsythe M, et al. General practice. All stressed up and nowhere to go? Health Serv J. 2000;110:28-29.
10. Mathers N, Jones N, Hannay D. Heartsink patients: a study of their general practitioners. Br J Gen Pract. 1995;45:293-296.
11. Krebs EE, Garrett JM, Konrad TR. The difficult doctor? Characteristics of physicians who report frustration with patients: an analysis of survey data. BMC Health Serv Res. 2006;6:128-135.
12. Linzer M, Manwell LB, Mundt M, et al. Organizational climate, stress, and error in primary care: the MEMO study. In: Advances in Patient Safety: From Research to Implementation. Vol. 1. AHRQ publication no. 050021 (1). Rockville, Md: Agency for Healthcare Research and Quality, 2005:65-77. Available at: http://www.ncbi.nlm.nih.gov/books/NBK20448. Accessed February 16, 2012.
13. Konrad TR, Williams ES, Linzer M, et al. Measuring physician job satisfaction in a changing workplace and a challenging environment. Med Care. 1999;37:1174-1182.
14. Williams ES, Konrad TR, Linzer M, et al. Refining the measurement of physician job satisfaction: results from the Physician Worklife Study. Med Care. 1999;37:1140-1154.
15. Huber PJ. Proceedings of the Fifth Berkeley Symposium on Mathematical Statistics and Probability. Berkeley, Calif: University of California Press; 1967:221–233.
16. White H. Maximum likelihood estimation of misspecified models. Econometrica. 1982;50:1-25.
17. Hobfoll SE. Conservation of resources: a new attempt at conceptualizing stress. Am Psychol. 1989;44:513-524.
18. Williams ES, Lawrence ER, Campbell KS, et al. The effect of emotional exhaustion and depersonalization on physician-patient communication: a theoretical model, implications, and directions for future research. Adv Health Care Manag. 2009;8:3-20.
19. Roter DL, Stewart M, Putnam SM, et al. Communication patterns of primary care physicians. JAMA. 1997;277:350-356.
20. Thomsens SB, Arnetz P, Nolan J, et al. Individual and organizational well-being in psychiatric nursing. J Adv Nursing. 1999;30:749-757.
21. Nikou VR. The relationships of hardiness, stress, and health-promoting behaviors in undergraduate female nursing students. Paper presented at: Promoting Students’ Success, 14th International Nursing Research Congress, Sigma Theta Tau International; July 12, 2003; St. Thomas, US Virgin Islands.
22. Stearns CR, Gonzales R, Camargo CA Jr, et al. Antibiotic prescriptions are associated with increased patient satisfaction with emergency department visits for acute respiratory tract infections. Acad Emerg Med. 2009;16:934-941.
23. Higashi T, Wenger NS, Adams JL, et al. Relationship between number of medical conditions and quality of care. N Engl J Med. 2007;356:2496-2504.
24. Boyd CM, Darer J, Boult C, et al. Clinical practice guidelines and quality of care for older patients with multiple comorbid disease: implications for pay for performance. JAMA. 2005;294:716-724.
25. Linder JA, Singer DE. Desire for antibiotics and antibiotic prescribing for adults with upper respiratory tract infections. J Gen Intern Med. 2003;18:795-801.
Background Difficult patient encounters in the primary care office are frequent and are associated with physician burnout. However, their relationship to patient care outcomes is not known.
Objective To determine the effect of difficult encounters on patient health outcomes and the role of physician dissatisfaction and burnout as mediators of this effect.
Design A total of 422 physicians were sorted into 3 clusters based on perceived frequency of difficult patient encounters in their practices. Patient charts were audited to assess the quality of hypertension and diabetes management and preventive care based on national guidelines. Summary measures of quality and errors were compared among the 3 physician clusters.
Results Of the 1384 patients, 359 were cared for by high-cluster physicians (those who had a high frequency of difficult encounters), 871 by medium-cluster physicians, and 154 by low-cluster physicians. Dissatisfaction and burnout were higher among physicians reporting higher frequencies of difficult encounters. However, quality of patient care and management errors were similar across all 3 groups.
Conclusions Physician perception of frequent difficult encounters was not associated with worse patient care quality or more medical errors. Future studies should investigate whether other patient outcomes, including acute care and patient satisfaction, are affected by difficult encounters.
Physicians who have high numbers of difficult patient encounters are more likely to report burnout and related stressor effects than are colleagues with fewer difficult encounters.1 More of them also perceive that they provide suboptimal care than do colleagues who report fewer difficult patients.1 These were some of the findings taken from the Minimizing Error, Maximizing Outcome (MEMO) Study that we conducted from 2001 to 2005.1 But these findings prompted us to wonder: Is that perception accurate?
Whether physicians reporting high numbers of difficult patient encounters actually provide poorer care is unknown. In a recent study of physicians from one large primary care system, patient panels that were more challenging—as determined by higher rates of underinsured, minority, and non-English-speaking patients—were associated with lower quality care.2 Hinchey and Jackson found that 2 weeks after initial presentation, patients involved in difficult encounters at a walk-in clinic experienced worsening physical symptoms.3 However, this study did not address whether difficult patient encounters affected the care rendered by providers to patients in general.
A detailed, rigorous model describing the interplay and relationships among difficult encounters, adverse physician outcomes (eg, burnout, dissatisfaction), and patient health outcomes has yet to be developed. To better understand the effects of these interactions, we revisited data from the MEMO study.
The findings that prompted another look at the data
When we conducted the MEMO study, we surveyed 422 physicians working in 119 primary care clinics in the upper Midwest and New York City.4 Almost half (49%) of the physicians reported moderately or highly stressful jobs; 27% reported burnout; and 30% were at least moderately likely to leave their practices within 2 years. Of these physicians, 113 (27%) reported high numbers of difficult encounters, which corresponds with other reports of 10% to 37% in primary care settings.5-7 These 113 physicians were 12.2 times more likely to report burnout compared with colleagues with fewer difficult encounters.1 They also reported lower job satisfaction, increased stress, more time pressure, and greater intent to leave practice, which are also echoed in other studies.8-10
We found in our study (and at least one other) that physicians experiencing burnout are often younger and female, work long hours, and practice in a medicine subspecialty.1,11 Many physicians who care for difficult patients report that they secretly hope these patients will not return.6
Our hypothesis
We hypothesized that frequent difficult encounters may amplify an adverse work environment, and that physicians facing time pressure and a lack of work control brought on by these encounters might be unable to sustain a high standard of care for their overall patient load.
METHODS
Participants
Physician and patient participants and design of the MEMO study are described in detail elsewhere.12 The following, though, is a recap:
We recruited 422 general internists and family physicians from 119 ambulatory care clinics in New York City and the upper Midwest. These regions offered a diverse patient and payer mix. Physicians were asked via on-site presentations and mailed invitations to complete a survey derived from focus groups and the Physician Worklife Survey.13,14
We also recruited up to 8 patients per participating physician via mailed invitations. Inclusion criteria were a minimum age of 18; a diagnosis of at least one target condition (hypertension, diabetes, congestive heart failure); ability to read in English, Spanish, or Chinese; and at least 2 visits with their primary physician in the previous year.
Here we report on outcomes for those patients with diabetes and hypertension.
Measures
When we initially conducted the study, physicians completed an 8-item Burden of Difficult Encounters measure designed to approximate the frequency of difficult encounters experienced. Latent cluster analyses of this survey measure defined 3 distinct groups of physicians: those who estimated a high, medium, and low frequency of difficult encounters in their practices. Via chart audits, we determined quality of care and errors related to guideline-recommended management and preventive care for hypertension and diabetes. Details of these audits are found elsewhere.4
We defined quality care for hypertension as successful blood pressure control (<140/90), and for diabetes, successful control of hemoglobin A1c (≤7.5) and blood pressure (<135/80). One quality point was awarded for each of these 3 measures if achieved for at least 50% of recorded visits over an 18-month period. We calculated the quality score as the proportion of total possible quality points (with 100%=best).
We defined errors as guideline non-adherence and missed opportunities for prevention or management, tailored to each patient’s age, sex, and diagnoses. We calculated the error score as the proportion of total applicable error points (maximum=15; 0%=best). We assigned an error point for each missing process of care, including missed treatment opportunities, inattention to behavioral factors, guideline nonadherence, lack of tobacco use documentation, and missed prevention activities, such as mammograms, cervical cancer screening, colon cancer screening, and depression assessment.
We normalized scores to a range of 0 to 100 by dividing the number of quality or error points by the number of applicable items and multiplying by 100. We calculated quality and error scores for hypertension or diabetes for each patient and averaged them to determine total scores per physician.
Data analysis
Latent cluster analyses identified 3 distinct clusters of physicians based on their reported frequency of difficult encounters.1 We used a 2-level hierarchical linear model of patients nested under physicians to assess if a higher number of perceived difficult patients was associated with poorer patient care, as measured by quality of care and medical errors, controlling for physician age, sex, and racial/ethnic minority status. To further adjust for negatively biased standard errors (physicians recruited from the same clinics, for example), we applied the Huber-White sandwich estimator.15,16
We analyzed the association between levels of difficult patients and patient outcomes following a conceptual model. Using Cluster 3 (low frequency of difficult encounters) as the reference group, we tested the direct association of Cluster 1 (high frequency of difficult encounters) and Cluster 2 (medium frequency of encounters) with patient outcomes (eg, errors in diabetes and hypertension management, missed prevention activities, quality benchmarks met). We also tested the adjusted influence of Clusters 1 and 2 on patient outcomes, controlling for the mediators of burnout and satisfaction. Finally, we examined the direct influence of Clusters 1 and 2 on the mediators of burnout and satisfaction.
RESULTS
A total of 449 physicians from 119 clinics consented to participate in MEMO (59.8% of those approached), and 94% of these (n=422) completed the survey.4 Compared with participants, nonparticipants did not differ significantly by specialty or sex. Physicians were evenly divided between general internists (51.9%) and family physicians (48.1%). The mean age was 43 (range, 29-89), 44.4% were women, most (83.3%) worked full-time, and 22.0% were from a racial or ethnic minority group. Specific results of the Burden of Encounters measure, depicted in TABLE 1, have been reported previously.1
TABLE 1
Burden of Difficult Encounters measure1
Latent cluster analyses of this survey measure were used to assign physicians to one of 3 clusters: those who estimated a low, medium, or high frequency of difficult encounters in their practice.
| How often do the following interactions occur? (1=never; 4=often) | |
|---|---|
| Patients who: | No. of physicians providing ratings of 3 or 4 (%); n=422 |
| Visit regularly, but ignore medical advice | 155 (37) |
| Have expectations for care that are unrealistic | 68 (16) |
| Insist on being prescribed an unnecessary drug | 58 (14) |
| Insist on an unnecessary test | 54 (13) |
| Persistently complain, although you have done everything possible to help | 50 (12) |
| Do not express appropriate respect | 16 (4) |
| Show dissatisfaction with your care | 4 (1) |
| Are verbally abusive | 1 (0.2) |
Physicians were more likely to sort into the high (n=113) and medium (n=268) frequency of difficult encounter clusters as opposed to the low-frequency cluster (n=41) (TABLE 2). Of the 1384 patients whose records were audited, 359 were cared for by high-cluster physicians, 871 by medium-cluster physicians, and 154 by low-cluster physicians. Patients had a mean age of 59.6, 65.6% were women, and they had an average of 4.5 chronic medical conditions. A greater percentage of patients with physicians in the high-frequency cluster had a diagnosis of hypertension, compared with the medium cluster (92.4% vs 87.7%; P<.05). Patients did not differ across physician clusters by age, sex, prevalence of diabetes, or number of chronic diagnoses.
TABLE 2
Physician characteristics across frequency clusters (n=422)1
| Physician characteristic | Frequency-of-difficult-encounter cluster | ||
|---|---|---|---|
| High, % (n=113) | Medium, % (n=268) | Low, % (n=41) | |
| Family physicians (vs general internists) | 41.6 | 49.6 | 58.5 |
| Age, mean (SD) | 40.8 (9.0)*† | 43.3 (9.0) | 46.1 (13.4) |
| Female sex | 50.4† | 44.6‡ | 26.8 |
| Racial/ethnic minority | |||
| • Black or African American | 8.0 | 4.1‡ | 14.6 |
| • Asian | 13.3 | 11.9 | 9.8 |
| • Hispanic or Latino | 6.6 | 3.1 | 0 |
| • Other | 6.2 | 3.4 | 0 |
| Full-time work status | 83.8 | 83.5 | 80.5 |
| Exact probability tests were used to contrast proportional differences. *P<.05 for high vs medium frequency of difficult encounter clusters. †P<.05 for high vs low frequency of difficult encounter clusters. ‡P<.05 for medium vs low frequency of difficult encounter clusters. | |||
We examined the relationship between perceived frequency of difficult encounters and patient outcomes using a double-mediation model with physician burnout and satisfaction as mediators. We found that the greater the perceived number of difficult encounters, the greater the burnout and job dissatisfaction. For example, on a 5-point Likert scale measuring burnout where 1 = no burnout and 5 = significant and persistent burnout, medium-cluster physicians scored 0.48 points higher than the low-cluster physician cohort. High-cluster physicians scored 0.84 points higher than their low-cluster colleagues (both P<.05). Similarly, high-cluster physicians were less satisfied with their jobs; on a 5-point scale where 1 = low satisfaction and 5 = high satisfaction, high-cluster physicians scored 0.60 points lower than low-cluster physicians (P<.05).
Yet, there was no clear association between perceived frequency of difficult encounters and patient outcomes. High-cluster physicians had a 5.57% lower overall error rate compared with low-cluster physicians (P<.05), although this was not true for specific errors, such as those in hypertension or diabetes management, where rates were similar. High-cluster physicians also had a 7.68% lower overall quality rate (P<.05), although, again, this was not true for management of specific conditions such as hypertension and diabetes, where rates were similar. In sum, in our double-mediation model, there was no consistent influence of a physician’s difficult-encounter cluster on patient outcomes, even when including physician burnout and level of satisfaction as mediators.
DISCUSSION
Our principal finding is that the perception of frequent difficult encounters—while associated with significant physician burnout and dissatisfaction—was not associated with worse quality of patient care or higher rates of error. Physicians with a high volume of difficult encounters and burnout maintained standards of care for their patients comparable to those of their peers who experienced less frequent difficult encounters. We propose several hypotheses to explain this observation.
First, the Conservation of Resources (COR) Theory suggests that when resources are depleted or stressed by work demands (difficult encounters), burnout will result.17 In response, burned-out individuals will reduce their resource expenditure (attention, time) and focus their resources on the most important aspects of their work—in our case, measured quality of care. In the physician-patient communication literature, Williams et al suggest that burned-out physicians use a strictly biomedical style of communication,18 which is less resource intensive than more patient-centered forms of communication.19 Thus, while a physician may be burned out and dissatisfied, she or he will focus communication on key clinical aspects of the encounter (the presenting complaint, necessary preventive care) while de-emphasizing the psychosocial aspects of care. Consequently, a physician may be burned out by difficult encounters, but may continue to provide adequate patient care.
Second, these results may reflect (in part) the professional socialization of physicians. The rigors of medical school and residency training provide physicians with a high level of personal hardiness. The nursing literature defines hardiness as the interrelatedness of 3 factors controlled by the individual through lifestyle: control of the environment, commitment to self-fulfilling goals, and reasonable levels of challenge in daily life. Thomsens et al found that these traits serve as buffers to protect individuals from the psychological repercussions of stress.20
Nikou designed a study to investigate the relationships among hardiness, stress, and health-promoting behaviors in students attending a nursing student conference.21 The results indicated that hardiness was inversely related to stress and positively related to health-promoting behaviors. Thus, while physicians face challenging and difficult encounters and become burned out and dissatisfied, they are able to deliver acceptable patient care due to the buffering effect of their professional socialization.
Third, physicians’ responses to performance measurement pressures—ubiquitous in the culture of primary care medicine today—may also contribute to our findings. Physicians are called on to meet both national and local standards of care, and are expected to keep patients satisfied. Such objectives may be tied to financial incentives.22 In this environment, many doctors are likely to respond so that quality measures are met, even when faced with a challenging patient encounter. Higashi et al found that the quality of care delivered to patients was better as the number of chronic conditions increased.23 Others have argued that current clinical practice guidelines, which have driven quality measurement, have led to unintended consequences—for example, polypharmacy with inadequate consideration of adverse drug-drug interactions.22,24,25
Study limitations. This study is limited by its sample size, which may have restricted our ability to discern small but meaningful differences in quality and errors. In addition, enrollment bias—given that a small number of patients per physician were enrolled—could have muted potential positive findings. If possible, future studies should include outcomes from entire patient panels.
While the objective recording of quality and errors is a strength of this study, data on the frequency of difficult encounters were cross-sectional. As a result, causal relationships between physician-experienced difficulty and patient outcomes were not possible to determine.
Lastly, throughout this study the term “patient outcomes” has been limited to the particular medical outcomes used in our investigation. But it is well recognized that important patient outcomes could also include measures such as satisfaction, trust, medication adherence, and costs.
More to explore. We found that the perception of frequent difficult patient encounters was not associated with poorer patient outcomes, even in the setting of physician dissatisfaction and burnout. Although difficult encounters were associated with physician burnout and job dissatisfaction, it appears that physicians who perceived very frequent difficult patient encounters had comparable standards of care relative to their peers who reported fewer difficult encounters.
Future research should examine additional patient outcomes related to chronic conditions and acute care and their relationship to difficult encounters. Furthermore, other potential consequences of difficult encounters need to be explored, especially those that may result from poor physician-patient communication such as medication adherence, patient satisfaction, and trust.
CORRESPONDENCE
Perry G. An, MD, Newton-Wellesley Hospital, 2014 Washington Street, 2nd Floor, Newton, MA 02462; [email protected]
1. An PG, Rabatin JS, Manwell LB, et al. Burden of difficult patient encounters in primary care: data from the Minimizing Error, Maximizing Outcome Study. Arch Intern Med. 2009;169:410-414.
2. Hong CS, Atlas SJ, Chang Y, et al. Relationship between patient panel characteristics and primary care physician clinical performance rankings. JAMA. 2010;304:1107-1113.
3. Hinchey SA, Jackson JL. A cohort study assessing difficult patient encounters in a walk-in primary care clinic, predictors and outcomes. J Gen Intern Med. 2011;26:588-594.
4. Linzer M, Manwell LB, Williams ES, et al. Working conditions in primary care: physician reactions and care quality. Ann Intern Med. 2009;151:28-36.
5. Jackson JL, Kroenke K. Difficult patient encounters in the ambulatory clinic: clinical predictors and outcomes. Arch Intern Med. 1999;159:1069-1075.
6. Hahn SR, Kroenke K, Spitzer RL, et al. The difficult patient: prevalence, psychopathology, and functional impairment. J Gen Intern Med. 1996;11:1-8.
7. Hahn SR, Thompson KS, Wills TA, et al. The difficult doctor-patient relationship: somatization, personality and psychopathology. J Clin Epidemiol. 1994;47:647-657.
8. Wetterneck TB, Linzer M, McMurray JE, et al. Worklife and satisfaction of general internists. Arch Intern Med. 2002;162:649-656.
9. Calnan M, Wainwright D, Forsythe M, et al. General practice. All stressed up and nowhere to go? Health Serv J. 2000;110:28-29.
10. Mathers N, Jones N, Hannay D. Heartsink patients: a study of their general practitioners. Br J Gen Pract. 1995;45:293-296.
11. Krebs EE, Garrett JM, Konrad TR. The difficult doctor? Characteristics of physicians who report frustration with patients: an analysis of survey data. BMC Health Serv Res. 2006;6:128-135.
12. Linzer M, Manwell LB, Mundt M, et al. Organizational climate, stress, and error in primary care: the MEMO study. In: Advances in Patient Safety: From Research to Implementation. Vol. 1. AHRQ publication no. 050021 (1). Rockville, Md: Agency for Healthcare Research and Quality, 2005:65-77. Available at: http://www.ncbi.nlm.nih.gov/books/NBK20448. Accessed February 16, 2012.
13. Konrad TR, Williams ES, Linzer M, et al. Measuring physician job satisfaction in a changing workplace and a challenging environment. Med Care. 1999;37:1174-1182.
14. Williams ES, Konrad TR, Linzer M, et al. Refining the measurement of physician job satisfaction: results from the Physician Worklife Study. Med Care. 1999;37:1140-1154.
15. Huber PJ. Proceedings of the Fifth Berkeley Symposium on Mathematical Statistics and Probability. Berkeley, Calif: University of California Press; 1967:221–233.
16. White H. Maximum likelihood estimation of misspecified models. Econometrica. 1982;50:1-25.
17. Hobfoll SE. Conservation of resources: a new attempt at conceptualizing stress. Am Psychol. 1989;44:513-524.
18. Williams ES, Lawrence ER, Campbell KS, et al. The effect of emotional exhaustion and depersonalization on physician-patient communication: a theoretical model, implications, and directions for future research. Adv Health Care Manag. 2009;8:3-20.
19. Roter DL, Stewart M, Putnam SM, et al. Communication patterns of primary care physicians. JAMA. 1997;277:350-356.
20. Thomsens SB, Arnetz P, Nolan J, et al. Individual and organizational well-being in psychiatric nursing. J Adv Nursing. 1999;30:749-757.
21. Nikou VR. The relationships of hardiness, stress, and health-promoting behaviors in undergraduate female nursing students. Paper presented at: Promoting Students’ Success, 14th International Nursing Research Congress, Sigma Theta Tau International; July 12, 2003; St. Thomas, US Virgin Islands.
22. Stearns CR, Gonzales R, Camargo CA Jr, et al. Antibiotic prescriptions are associated with increased patient satisfaction with emergency department visits for acute respiratory tract infections. Acad Emerg Med. 2009;16:934-941.
23. Higashi T, Wenger NS, Adams JL, et al. Relationship between number of medical conditions and quality of care. N Engl J Med. 2007;356:2496-2504.
24. Boyd CM, Darer J, Boult C, et al. Clinical practice guidelines and quality of care for older patients with multiple comorbid disease: implications for pay for performance. JAMA. 2005;294:716-724.
25. Linder JA, Singer DE. Desire for antibiotics and antibiotic prescribing for adults with upper respiratory tract infections. J Gen Intern Med. 2003;18:795-801.
Keeping older patients healthy and safe as they travel
• Advise older adults to prepare a health travel kit containing all their medications and medical supplies, a list of chronic conditions, and emergency contact information, and to pack it in their carry-on luggage. C
• Instruct patients who will be airborne for ≥4 hours to stay hydrated, avoid alcohol and sedating drugs, and either do seated calf exercises or get up and move about the cabin periodically. B
• Remind patients who will spend time in developing countries to drink only bottled beverages, eat only hot food and fruit that can be peeled, and avoid ice cubes and food from street vendors. B
Strength of recommendation (SOR)
A Good-quality patient-oriented evidence
B Inconsistent or limited-quality patient-oriented evidence
C Consensus, usual practice, opinion, disease-oriented evidence, case series
CASE Larry R, a 77-year-old retired college professor, comes in for a checkup because he is planning a trip to Kenya—on a safari he describes excitedly as “the trip of a lifetime.” He’ll be going with a group, but before he signs on he wants to be sure you think he can manage the tour’s “moderate pace.” He also thinks that he’ll “need to get some shots.”
The patient is overweight (BMI 29) and smokes a pipe daily. He has a history of hypertension, hyperlipidemia, and mild osteoarthritis in both knees and hips, all of which are well controlled.
What would you advise Professor R about the health care preparations needed for his big trip?
Chances are you have patients like Professor R—retired and relatively healthy, and endowed with a sense of adventure and the financial resources that make it possible to visit distant lands. With the nation’s 78 million baby boomers starting to reach retirement age—the oldest cohort turned 65 in 2011—you’re likely to see increasing numbers of older patients with plans for international travel in the years ahead.1
Like their younger counterparts, older people travel for a variety of reasons: Some have planned for decades to take the “trip of a lifetime” when they retire. Others plan longer excursions, sometimes referred to as an adult “gap year,” to relive a long-ago experience, volunteer in an underdeveloped country, or hike and bird watch in a rainforest. Many more are immigrants who travel to visit relatives or friends in their country of origin, usually a lower-income, environmentally depressed locale with a higher incidence of infectious diseases like malaria, typhoid, and hepatitis A. 2
And while the older traveler will have to take many of the same steps to stay healthy as his or her younger counterpart, it is the older traveler who is more likely to have chronic conditions and special needs that require additional preparation. With careful planning, however, even those with decreased faculties, ranging from impaired vision or hearing to mild cognitive impairment, can safely travel abroad.3
A pretravel visit is your opportunity to assess the patient’s fitness to make the trip being planned, ensure optimal management of chronic conditions while traveling, and identify (and recommend steps to mitigate) travel-related risks.

Morbidity and mortality abroad: A review of the risks
Although much pretravel advice centers on the prevention of tropical infectious diseases, such infections account for a very small percentage of deaths of Americans outside of the United States.1 In fact, the major health risks facing older adults traveling abroad are similar to those they face at home: Cardiovascular events are responsible for the preponderance of deaths and for half of all travel-related illnesses.1
International travel can be physically demanding for older individuals and injuries are common, accounting for a large proportion of deaths of Americans overseas4 and an estimated 25% to 38% of travel-related incidents.1,5 A third of injury-related deaths of US citizens traveling abroad involve traffic accidents, followed by homicide (17% of cases) and drowning (13%).1,5 Thus, injury prevention and management of chronic conditions are key issues to address in a pretravel consult.
Even small steps help safeguard older travelers
Older patients planning to travel abroad should schedule an appointment at least 4 to 6 weeks before their departure.2 Ask about the locale, political and environmental climate, length of stay, location and type of accommodations, accessibility to health care, and activities planned,6 which will enable you to offer both general and destination-specific health and safety tips. When advising older adults with complex comorbidities and/or particularly high-risk itineraries, referral to a travel medicine specialist should be strongly considered.
Exercise. Encourage older patients to initiate a graduated exercise program, starting several months before the trip.3 Even a modest improvement in endurance, strength, and flexibility can reduce the likelihood of injury.
Luggage. The right luggage can benefit your patients. Recommend that older patients purchase lightweight suitcases with wheels, which are easier to maneuver in and out of airports6 and less likely to cause muscle strain or musculoskeletal injury.
Insurance. If an individual becomes ill or sustains an injury overseas, the right insurance can be crucial. Advise older adults to review their health insurance policy to see whether it provides overseas coverage. If not, suggest they consider a short-term supplemental policy to cover medical care and evacuation, if needed. Recommend trip cancellation insurance, as well.
Patients should pack pills, medical supplies in a carry-on kit
Encourage all older travelers to compile a personalized travel health kit equipped with common over-the-counter (OTC) medications, prescription drugs, and any personal medical supplies they’ll need, such as a continuous positive airway pressure (CPAP) machine.1,3 Remind patients to take an ample supply of both prescription and OTC drugs, each in its original labeled container.3,6 Buying medications outside the United States is not advisable, given the variation in international regulatory standards. Stress the importance of keeping the kit in a carry-on bag.
The health kit should also include descriptions of the patient’s preexisting medical conditions, which you or a nurse or medical assistant in the practice can help to prepare; a list of prescription drugs he or she takes (using both the generic and brand names); and a copy of a recent electrocardiogram, if available, along with contact information in case of an emergency.1,3,6 A patient who uses injectable medication, such as insulin, should obtain a letter (on the practice’s letterhead) from the prescribing physician and be prepared to show the letter to airport security personnel.3,6
Staying safe in the air
The lower barometric and oxygen partial pressures found in aircraft cabins, which are pressurized at 5000 to 8000 feet, can affect both the respiratory and cardiovascular systems of older adults—particularly those with pulmonary or cardiac disorders.6,7 Individuals who do not routinely require oxygen and are able to walk the equivalent of one city block or climb one flight of stairs without shortness of breath should have little trouble compensating for the reduced oxygen in the cabin.3 Patients with stable heart failure, including New York Heart Association grades III and IV, can tolerate flights of up to one hour without additional oxygen.7
Advise older adults who will require oxygen that they are not permitted to bring their own oxygen canisters onboard an airplane.1 In-flight oxygen needs to be ordered at least 7 days before departure, and there may be a charge.7 Most airlines have medical consultants available to help patients who will need oxygen or other medical provisions.7 In addition, tour companies or travel consultants can help older patients with special needs ensure that they have access to oxygen or other medical supplies at their destination.
Thrombosis—the other in-flight risk
Sometimes referred to as “economy class syndrome” or “traveler’s thrombosis,” the venous stasis of air travel is responsible for a 3-fold increase in the risk of venous thromboembolism (VTE).8 While fatal pulmonary embolism is rare, duration of travel and risk of VTE follow a dose-response relationship, with each 2-hour increase in flight time conferring an additional 18% risk.8 Other risk factors for VTE include varicose veins, metastatic cancer, major surgery within the past 2 weeks, prior VTE, and BMI >40. Advanced age increases travelers’ risk of VTE, as well.7,8 The absolute risk, however, is low.
Among travelers older than 50 years, symptomatic VTE occurs at an estimated rate of one in 600 for flights >4 hours and one in 500 for flights >12 hours.9,10 While there is no evidence that first-class seating lowers the risk, there are preventive measures that patients can take.11
Tell patients to stay hydrated, drinking plenty of fluids but avoiding alcohol during flights of ≥4 hours’ duration. Sedating drugs should be avoided, as well. Advise anyone planning a long flight to either do seated exercises (intermittent calf contractions) or to periodically get up and walk about the cabin.9 You may also want to recommend that patients purchase below-the-knee elastic compression stockings to help decrease venous stasis.12
There is no evidence to recommend the use of aspirin to prevent VTE.12,13 But you may consider prescribing a single 40-mg dose of enoxaparin for a patient who has multiple risk factors and will be airborne for >6 hours.13
Promote safety and comfort on the ground
It is crucial to remind all travelers about the risks associated with traveling in motor vehicles in other countries. Remind patients to wear seat belts whenever they’re available; exercise caution regarding public transportation, which may be overcrowded and have an increased risk of pickpockets and robbery; and avoid riding on motorcycles and scooters. If they do opt to ride on a scooter, tell them that it’s imperative that they wear a helmet.
Minimize the effects of jet lag
Travelers of any age may experience jet lag, which occurs when the individual’s circadian clock cannot keep pace with travel across time zones.14 Notably, however, older people appear to suffer less than their younger counterparts.3 Patients traveling great distances are not likely to avoid jet lag completely, of course. Recommend the following strategies:
Start adjusting your schedule in the week before you depart, gradually shifting 2 hours toward congruence with the time zone at your destination.14
Help reset your circadian rhythm through exposure to bright light, in the morning after eastward travel and in the evening after westward travel.14
Take it easy at first. An itinerary that accounts for initial fatigue is an important nonpharmacologic management strategy.14
Avoid sedating medications, including antihistamines, tranquilizers, anti-motion sickness agents, and benzodiazepines, as these can increase falls and confusion in older adults and make jet lag worse.3
Take melatonin. A dose of 0.5 to 5 mg, taken at bedtime, may promote sleep and decrease jet lag symptoms in travelers crossing multiple time zones.14
Prepare patients to cope with heat …
Unusually hot, humid weather increases morbidity and mortality in the elderly,3,15 and older patients traveling to such climates will need to take extra precautions. Strenuous exercise in the heat should be avoided, because both thirst and the capacity to conserve salt and water decrease with age.16 Acclimatization is helped by rest, air-conditioning, loose cotton clothing, brimmed hats, and cool baths or showers.3 Diuretics may have to be adjusted for fluids lost by increased perspiration, and a discussion about a dose reduction should be included in the pretravel consult for patients who take diuretics and will be traveling to a hot, humid climate.
… and increases in altitude
For older adults, exposure to a moderate altitude (<2500 meters) is initially associated with hypoxemia and a reduced exercise capacity, until acclimatization occurs by Day 5.17,18 Although older adults generally acclimatize well, advise them to limit their activities for the first few days at a higher altitude. This is especially important for patients with coronary artery disease (CAD).
To further ease the effects of a higher altitude, advise patients to drink plenty of fluids, but little or no alcohol.19 Review the medications of an older patient who will be spending time at very high altitude. Rarely, antihypertensive medication may need to be adjusted. The body compensates for lower oxygen with a faster heart rate, and some antihypertensives may interfere with this compensatory mechanism.3
Precautions (and prophylaxis) may prevent travelers’ diarrhea
Diarrhea—among the most common travel-related conditions20—affects an estimated 30% to 70% of international travelers.2 The incidence is highest among visitors to developing countries. Most (80%-90%) of travelers’ diarrhea is due to bacterial infection,21 10% of cases are caused by parasites, and 5% to 8% by viral infection.2,22
Although increasing age lowers the risk of travelers’ diarrhea,1 older patients traveling to developing areas should be cautioned to only eat food that is served hot or fruit they can peel themselves; drink only bottled water and sealed liquids; and avoid salad, ice, and food from street vendors.1 Studies have shown, however, that tourists often get diarrhea despite these safety measures.2
Treatment and prophylaxis. Prophylactic antibiotics can prevent travelers’ diarrhea. But the increased sun sensitivity, drug-drug interactions, and gastrointestinal (GI) adverse effects associated with antibiotics limit their usefulness. Prophylaxis is indicated, however, for older adults for whom the complications of dehydration would likely be so severe that the benefits of using antibiotics to prevent diarrhea clearly outweigh the risks.23
Fluoroquinolones are a first-line treatment for travelers’ diarrhea. But increasing microbial resistance to this class of drugs, especially among Campylobacter isolates,24 may limit their usefulness in some destinations.25 Azithromycin is recommended in such cases, and has been shown to be equally effective.26,27 Single-dose therapy is well established with fluoroquinolones, but the best regimen for azithromycin (1 vs 3 days) is still under evaluation.28,29 Along with instructions on when to take an antibiotic, travelers should be given prescriptions for treatment of travelers’ diarrhea before the start of their trip. Suggest that patients purchase oral rehydration packets to take on their trip, and stress the importance of using them and staying hydrated if diarrhea develops.
Decreased upper GI acidity due to acid-blocking medications such as proton-pump inhibitors can increase the risk for many infections, including salmonella and cholera. Patients taking such medications should be made aware of the risk, and the risks vs benefits of temporarily stopping them should be discussed. Vaccination against cholera should not routinely be recommended.29,30
Vaccines and pills protect against preventable diseases
An impending trip abroad also presents an opportunity to review the patient’s immunization status, catch up on recommended vaccines, and determine whether any additional vaccinations are needed.
Herpes zoster (HZ). Patients older than 60 years should receive a single dose of the HZ vaccine, whether or not they have a history of this condition. Because this is a live virus-containing vaccine, however, it should not be given to anyone who is immunocompromised.31
MMR booster. Adults born before 1957 can be considered immune from both measles and mumps, but not rubella. There is no data on immunization to rubella, but guidelines do not recommend MMR vaccination in the elderly.1
Pneumococcal polyvalent-23 (PPV-23). One dose of the PPV-23 vaccine is indicated for all adults at age 65. This is especially important for travelers, as the prevalence of pneumococcal disease is likely higher in crowded, urban environments within less developed countries.31
Tetanus. Although tetanus is mainly a disease of the elderly, only 45% of men ages 70 years or older and 21% of women in this age group were found to have protective antibodies.1,32 In 2011, the Advisory Committee on Immunization Practices (ACIP) recommended one dose of tetanus and diphtheria toxoid (Td) every 10 years, with a single dose of tetanus toxoid, diphtheria toxoid, and acellular pertussis (Tdap) vaccine given in place of Td for adults older than 65.33 Despite ACIP’s recommendation, the vaccine’s use in adults 65 years and older is an off-label indication, as Tdap is only approved for use in those 11 to 64 years of age.33
Additional vaccines are recommended for travelers, with some indicated for all travelers and others that are destination-specific (TABLE).
TABLE
Which travel-related vaccines does your patient need?
| Disease | Type of vaccine | Primary course | Booster/ follow-up | Route | For which destinations? |
|---|---|---|---|---|---|
| Vaccines for all travelers | |||||
| Hepatitis A* | Killed virus | 2 doses (6-18 mo apart)† | None | IM | All |
| Hepatitis B* | Recombinant viral antigen | 3 doses (0, 1, 6 mo) | None | IM | All |
| Influenza | Inactivated viral | Single dose | Annually | IM | All |
| Typhoid | Capsular polysaccharide Live attenuated bacteria | Single dose 4 doses (0, 2, 4, 6 mo) | 2-3 y 5 y | IM Oral | All |
| Vaccines for travelers to select destinations | |||||
| Japanese encephalitis | Inactivated viral | 2 doses (28 d apart) | Unknown | IM | Rural Asia‡ |
| Meningococcus | Quadrivalent conjugated polysaccharide | Single dose | >10 y | IM | Sub-Saharan Africa; Saudi Arabia |
| Polio | Inactivated viral | Single dose if patient had childhood series | None | SC; IM | Anyplace where polio still occurs |
| Rabies | Inactivated cell culture viral | 3 doses (0, 7, 21-28 d) | None unless exposure occurs | IM | |
| Yellow fever | Live attenuated virus | Single dose | 10 y | SC | Sub-Saharan Africa; tropical South America |
| IM, intramuscular; SC, subcutaneous. *A combined hepatitis A/B vaccine is approved for use in older adults. †Second dose may be delayed up to 8 years without diminished efficacy. ‡Required only for prolonged stays in rural areas of Asia. Adapted from: Mandell GL, Bennett JE, Dolin R, eds. Principles and Practice of Infectious Diseases. 7th ed. Philadelphia, Pa: Elsevier; 2010. | |||||
Meds and safety measures can minimize malaria risk
The risk of acquiring malaria differs significantly among travelers, based on destination, duration and type of travel, and season. Choice of antimalarial agents (eg, atovaquone/proguanil, chloroquine, doxycycline, mefloquine, and primaquine) should be made on an individual basis after considering these factors, as well as the resistance patterns of the countries on the patient’s itinerary, his or her medical history, and the adverse effects profile of potential agents. Because many older adults take multiple medications, the possibility of drug-drug interactions must be considered.1 You’ll find destination-specific recommendations on malaria prevention on the Centers for Disease Control and Prevention’s Travelers’ Health Web site, listed in “Travel and health: Resources for patients and physicians”. For guidance on the best drug to prescribe, you can also consult a travel medicine specialist.2
Access-able Travel Source Web site provides information for older adult travelers with special needs who need help traveling with oxygen or getting around despite decreased mobility (www.access-able.com/tips/).
American Diabetes Association publishes detailed information about traveling with diabetes (http://www.diabetes.org/living-with-diabetes/know-your-rights/discrimination/public-accommodations/air-travel-and-diabetes/).
Bureau of Consular Affairs publishes information regarding VISA and security requirements at various destinations and travel warnings (http://travel.state.gov/about/about_304.html).
Centers for Disease Control and Prevention publishes “The Yellow Book”—a reference for clinicians who advise international travelers about health risks. There is also a range of other travel-related information on its Travelers’ Health Web site (www.cdc.gov/travel/).
International Travel Medicine Society provides a global travel clinic directory (http://www.istm.org/Webforms/Searchclinics/Default.aspx?SearchType=advanced).
Transportation Security Administration Web site provides information on what can be brought on-board a plane. See “Can I bring my … through the checkpoint?” (http://apps.tsa.dhs.gov/mytsa/cib_home.aspx).
Travel Health Online offers a list of medical providers around the world (www.tripprep.com/scripts).
World Health Organization’s Travel and Health Web site provides free access to selected chapters of its book, “International Travel and Health 2012,” as well as interactive maps, information about infectious diseases and food safety, and more (www.who.int/ith/en/).
Patients should be mindful of mosquitos. Stress the importance of preventing mosquito bites (as much as possible). Advise patients traveling to mosquito-infested areas to use insect repellents containing 30% N-diethyl-meta-toluamide (DEET) and permethrin-treated clothing.34 Tell them, too, to wear long sleeves, pants, and footwear that provides full coverage.35 Ensuring that sleeping areas are properly screened or air-conditioned will further reduce the likelihood of mosquito bites.36
CASE After seeing the chief complaint listed as “Traveling to Kenya” on Professor R’s chart, you quickly review the CDC’s Travelers’ Health Web site. You encourage him to stay with his tour group and to wear a seatbelt whenever possible. You also review how to make a personalized travel health kit, and encourage him to register with the Smart Traveler Enrollment Program (STEP) (detailed at https://step.state.gov/rep) before leaving for the safari. You strongly suggest that he consider purchasing additional medical evacuation insurance, as well.
Given the prevalence of travelers’ diarrhea, along with dengue and malaria, in Kenya, you review food and water safety and avoidance of insect-transmitted diseases with the patient, and write a prescription for ciprofloxacin to be taken if he develops diarrhea. Professor R is not at high risk for VTE, but you encourage him to stay hydrated, avoid sedating medications, and be diligent about mobilization during lengthy flights. You recommend melatonin for jet lag.
To adjust to the heat, you recommend that he avoid strenuous exercise in the first few days and drink sufficient fluids throughout the trip. You administer the Tdap vaccine, an adult polio booster, and the hepatitis A vaccine, verify that he has received his pneumococcal and influenza vaccines, and prescribe an antimalarial medication.
And as you walk him toward the door, you offer him one final piece of advice: Take plenty of pictures.
CORRESPONDENCE
Jeffrey D. Schlaudecker, MD, The Christ Hospital/University of Cincinnati Family Medicine Residency Program, 2123 Auburn Avenue #340, Cincinnati, OH 45219; [email protected]
1. Reed CM. Travel recommendations for older adults. Clin Geriatr Med. 2007;23:687-713, ix.
2. Centers for Disease Control and Prevention. Health Information for International Travel 2012. New York, NY:Oxford University Press; 2012. Available at http://wwwnc.cdc.gov/travel/page/yellowboth-2012-home.htm. Accessed December 18, 2012.
3. Cooper MC. The elderly travellers. Travel Med Infect Dis. 2006;4:218-222.
4. Guse CE, Cortes LM, Hargarten SW, et al. Fatal injuries of US citizens abroad. J Travel Med. 2007;14:279-287
5. Tonellato DJ, Guse CE, Hargarten SW. Injury deaths of US citizens abroad: new data source, old travel problem. J Travel Med. 2009;16:304-310.
6. Fenner P. Fitness to travel - assessment in the elderly and medically impaired. Aust Fam Physician. 2007;36:312-315.
7. Smith D, Toff W, Joy M, et al. Fitness to fly for passengers with cardiovascular disease. Heart. 2010;96(suppl 2):Sii1-S16.
8. Chandra D, Parisini E, Mozaffarian D. Meta-analysis: travel and risk for venous thromboembolism. Ann Intern Med. 2009;151:180-190.
9. Gavish I, Brenner B. Air travel and the risk of thromboembolism. Intern Emerg Med. 2011;6:113-116.
10. Ansari MT, Cheung BM, Qing Huang J, et al. Traveler’s thrombosis: a systematic review. J Travel Med. 2005;12:142-154.
11. Schwarz T, Siegert G, Oettler W, et al. Venous thrombosis after long-haul flights. Arch Intern Med. 2003;163:2759-2764.
12. Cesarone MR, Belcaro G, Errichi BM, et al. The LONFLIT4—Concorde Deep Venous Thrombosis and Edema Study: prevention with travel stockings. Angiology. 2003;54:143-154.
13. Cesarone MR, Belcaro G, Nicolaides AN, et al. Venous thrombosis from air travel: the LONFLIT3 study—prevention with aspirin vs low-molecular-weight heparin (LMWH) in high-risk subjects: a randomized trial. Angiology. 2002;53:1-6.
14. Sack RL. Clinical practice. Jet lag. N Engl J Med. 2010: 440-447.
15. Davies I, O’Neill PA, McLean KA, et al. Age-associated alterations in thirst and arginine vasopressin in response to a water or sodium load. Age Ageing. 1995;24:151-159.
16. Rikkert MG, Melis RJ, Claassen JA. Heat waves and dehydration in the elderly. BMJ. 2009;339:b2663.-
17. Levine BD, Zuckerman JH, deFilippi CR. Effect of high-altitude exposure in the elderly: the Tenth Mountain Division study. Circulation. 1997;96:1224-1232.
18. Agostoni P, Cattadori G, Guazzi M, et al. Effects of simulated altitude-induced hypoxia on exercise capacity in patients with chronic heart failure. Am J Med. 2000;109:450-455.
19. Higgins JP, Tuttle T, Higgins JA. Altitude and the heart: is going high safe for your cardiac patient? Am Heart J. 2010;159:25-32.
20. Gautret P, Schlagenhauf P, Gaudart J, et al. Multicenter EuroTravNet/GeoSentinel study of travel-related infectious diseases in Europe. Emerg Infect Dis. 2009;15:1783-1790.
21. Adachi JA, Jiang ZD, Mathewson JJ, et al. Enteroaggregative Escherichia coli as a major etiologic agent in traveler’s diarrhea in 3 regions of the world. Clin Infect Dis. 2001;32:1706-1709.
22. Black RE. Epidemiology of travelers’ diarrhea and relative importance of various pathogens. Rev Infect Dis. 1990;12 (suppl 1):S73-S79.
23. Rendi-Wagner P, Kollaritsch H. Drug prophylaxis for travelers’ diarrhea. Clin Infect Dis. 2002;34:628-633.
24. Butzler JP. Campylobacter, from obscurity to celebrity. Clin Microbiol Infect. 2004;10:868-876.
25. Hoge CW, Gambel JM, Srijan A, et al. Trends in antibiotic resistance among diarrheal pathogens isolated in Thailand over 15 years. Clin Infect Dis. 1998;26:341-345.
26. Adachi JA, Ericsson CD, Jiang ZD, et al. Azithromycin found to be comparable to levofloxacin for the treatment of US travelers with acute diarrhea acquired in Mexico. Clin Infect Dis. 2003;37:1165-1171.
27. Tribble DR, Sanders JW, Pang LW, et al. Traveler’s diarrhea in Thailand: randomized, double-blind trial comparing single-dose and 3-day azithromycin-based regimens with a 3-day levofloxacin regimen. Clin Infect Dis. 2007;44:338-346.
28. Shanks GD, Smoak BL, Aleman GM, et al. Single dose of azithromycin or three-day course of ciprofloxacin as therapy for epidemic dysentery in Kenya. Acute Dysentery Study Group. Clin Infect Dis. 1999;29:942-943.
29. Heatley RV, Sobala GM. Acid suppression and the gastric flora. Baillieres Clin Gastroenterol. 1993;7:167-181.
30. Hill DR, Ford L, Lalloo DG. Oral cholera vaccines: use in clinical practice. Lancet Infect Dis. 2006;6:361-373.
31. Vaughn JA, Miller RA. Update on immunizations in adults. Am Fam Physician. 2011;84:1015-1020.
32. Gergen PJ, McQuillan GM, Kiely M, et al. A population-based serologic survey of immunity to tetanus in the United States. N Engl J Med. 1995;332:761-766.
33. World Health Organization. Typhoid vaccines: WHO position paper. Wkly Epidemiol Rec. 2008;83:49-59.
34. Fradin MS, Day JF. Comparative efficacy of insect repellents against mosquito bites. N Engl J Med. 2002;347:13-18.
35. Soto J, Medina F, Dember N, et al. Efficacy of permethrin-impregnated uniforms in the prevention of malaria and leishmaniasis in Colombian soldiers. Clin Infect Dis. 1995;21:599-602.
36. Freedman DO. Clinical practice. Malaria prevention in short-term travelers. N Engl J Med. 2008;359:603-612.
• Advise older adults to prepare a health travel kit containing all their medications and medical supplies, a list of chronic conditions, and emergency contact information, and to pack it in their carry-on luggage. C
• Instruct patients who will be airborne for ≥4 hours to stay hydrated, avoid alcohol and sedating drugs, and either do seated calf exercises or get up and move about the cabin periodically. B
• Remind patients who will spend time in developing countries to drink only bottled beverages, eat only hot food and fruit that can be peeled, and avoid ice cubes and food from street vendors. B
Strength of recommendation (SOR)
A Good-quality patient-oriented evidence
B Inconsistent or limited-quality patient-oriented evidence
C Consensus, usual practice, opinion, disease-oriented evidence, case series
CASE Larry R, a 77-year-old retired college professor, comes in for a checkup because he is planning a trip to Kenya—on a safari he describes excitedly as “the trip of a lifetime.” He’ll be going with a group, but before he signs on he wants to be sure you think he can manage the tour’s “moderate pace.” He also thinks that he’ll “need to get some shots.”
The patient is overweight (BMI 29) and smokes a pipe daily. He has a history of hypertension, hyperlipidemia, and mild osteoarthritis in both knees and hips, all of which are well controlled.
What would you advise Professor R about the health care preparations needed for his big trip?
Chances are you have patients like Professor R—retired and relatively healthy, and endowed with a sense of adventure and the financial resources that make it possible to visit distant lands. With the nation’s 78 million baby boomers starting to reach retirement age—the oldest cohort turned 65 in 2011—you’re likely to see increasing numbers of older patients with plans for international travel in the years ahead.1
Like their younger counterparts, older people travel for a variety of reasons: Some have planned for decades to take the “trip of a lifetime” when they retire. Others plan longer excursions, sometimes referred to as an adult “gap year,” to relive a long-ago experience, volunteer in an underdeveloped country, or hike and bird watch in a rainforest. Many more are immigrants who travel to visit relatives or friends in their country of origin, usually a lower-income, environmentally depressed locale with a higher incidence of infectious diseases like malaria, typhoid, and hepatitis A. 2
And while the older traveler will have to take many of the same steps to stay healthy as his or her younger counterpart, it is the older traveler who is more likely to have chronic conditions and special needs that require additional preparation. With careful planning, however, even those with decreased faculties, ranging from impaired vision or hearing to mild cognitive impairment, can safely travel abroad.3
A pretravel visit is your opportunity to assess the patient’s fitness to make the trip being planned, ensure optimal management of chronic conditions while traveling, and identify (and recommend steps to mitigate) travel-related risks.
Morbidity and mortality abroad: A review of the risks
Although much pretravel advice centers on the prevention of tropical infectious diseases, such infections account for a very small percentage of deaths of Americans outside of the United States.1 In fact, the major health risks facing older adults traveling abroad are similar to those they face at home: Cardiovascular events are responsible for the preponderance of deaths and for half of all travel-related illnesses.1
International travel can be physically demanding for older individuals and injuries are common, accounting for a large proportion of deaths of Americans overseas4 and an estimated 25% to 38% of travel-related incidents.1,5 A third of injury-related deaths of US citizens traveling abroad involve traffic accidents, followed by homicide (17% of cases) and drowning (13%).1,5 Thus, injury prevention and management of chronic conditions are key issues to address in a pretravel consult.
Even small steps help safeguard older travelers
Older patients planning to travel abroad should schedule an appointment at least 4 to 6 weeks before their departure.2 Ask about the locale, political and environmental climate, length of stay, location and type of accommodations, accessibility to health care, and activities planned,6 which will enable you to offer both general and destination-specific health and safety tips. When advising older adults with complex comorbidities and/or particularly high-risk itineraries, referral to a travel medicine specialist should be strongly considered.
Exercise. Encourage older patients to initiate a graduated exercise program, starting several months before the trip.3 Even a modest improvement in endurance, strength, and flexibility can reduce the likelihood of injury.
Luggage. The right luggage can benefit your patients. Recommend that older patients purchase lightweight suitcases with wheels, which are easier to maneuver in and out of airports6 and less likely to cause muscle strain or musculoskeletal injury.
Insurance. If an individual becomes ill or sustains an injury overseas, the right insurance can be crucial. Advise older adults to review their health insurance policy to see whether it provides overseas coverage. If not, suggest they consider a short-term supplemental policy to cover medical care and evacuation, if needed. Recommend trip cancellation insurance, as well.
Patients should pack pills, medical supplies in a carry-on kit
Encourage all older travelers to compile a personalized travel health kit equipped with common over-the-counter (OTC) medications, prescription drugs, and any personal medical supplies they’ll need, such as a continuous positive airway pressure (CPAP) machine.1,3 Remind patients to take an ample supply of both prescription and OTC drugs, each in its original labeled container.3,6 Buying medications outside the United States is not advisable, given the variation in international regulatory standards. Stress the importance of keeping the kit in a carry-on bag.
The health kit should also include descriptions of the patient’s preexisting medical conditions, which you or a nurse or medical assistant in the practice can help to prepare; a list of prescription drugs he or she takes (using both the generic and brand names); and a copy of a recent electrocardiogram, if available, along with contact information in case of an emergency.1,3,6 A patient who uses injectable medication, such as insulin, should obtain a letter (on the practice’s letterhead) from the prescribing physician and be prepared to show the letter to airport security personnel.3,6
Staying safe in the air
The lower barometric and oxygen partial pressures found in aircraft cabins, which are pressurized at 5000 to 8000 feet, can affect both the respiratory and cardiovascular systems of older adults—particularly those with pulmonary or cardiac disorders.6,7 Individuals who do not routinely require oxygen and are able to walk the equivalent of one city block or climb one flight of stairs without shortness of breath should have little trouble compensating for the reduced oxygen in the cabin.3 Patients with stable heart failure, including New York Heart Association grades III and IV, can tolerate flights of up to one hour without additional oxygen.7
Advise older adults who will require oxygen that they are not permitted to bring their own oxygen canisters onboard an airplane.1 In-flight oxygen needs to be ordered at least 7 days before departure, and there may be a charge.7 Most airlines have medical consultants available to help patients who will need oxygen or other medical provisions.7 In addition, tour companies or travel consultants can help older patients with special needs ensure that they have access to oxygen or other medical supplies at their destination.
Thrombosis—the other in-flight risk
Sometimes referred to as “economy class syndrome” or “traveler’s thrombosis,” the venous stasis of air travel is responsible for a 3-fold increase in the risk of venous thromboembolism (VTE).8 While fatal pulmonary embolism is rare, duration of travel and risk of VTE follow a dose-response relationship, with each 2-hour increase in flight time conferring an additional 18% risk.8 Other risk factors for VTE include varicose veins, metastatic cancer, major surgery within the past 2 weeks, prior VTE, and BMI >40. Advanced age increases travelers’ risk of VTE, as well.7,8 The absolute risk, however, is low.
Among travelers older than 50 years, symptomatic VTE occurs at an estimated rate of one in 600 for flights >4 hours and one in 500 for flights >12 hours.9,10 While there is no evidence that first-class seating lowers the risk, there are preventive measures that patients can take.11
Tell patients to stay hydrated, drinking plenty of fluids but avoiding alcohol during flights of ≥4 hours’ duration. Sedating drugs should be avoided, as well. Advise anyone planning a long flight to either do seated exercises (intermittent calf contractions) or to periodically get up and walk about the cabin.9 You may also want to recommend that patients purchase below-the-knee elastic compression stockings to help decrease venous stasis.12
There is no evidence to recommend the use of aspirin to prevent VTE.12,13 But you may consider prescribing a single 40-mg dose of enoxaparin for a patient who has multiple risk factors and will be airborne for >6 hours.13
Promote safety and comfort on the ground
It is crucial to remind all travelers about the risks associated with traveling in motor vehicles in other countries. Remind patients to wear seat belts whenever they’re available; exercise caution regarding public transportation, which may be overcrowded and have an increased risk of pickpockets and robbery; and avoid riding on motorcycles and scooters. If they do opt to ride on a scooter, tell them that it’s imperative that they wear a helmet.
Minimize the effects of jet lag
Travelers of any age may experience jet lag, which occurs when the individual’s circadian clock cannot keep pace with travel across time zones.14 Notably, however, older people appear to suffer less than their younger counterparts.3 Patients traveling great distances are not likely to avoid jet lag completely, of course. Recommend the following strategies:
Start adjusting your schedule in the week before you depart, gradually shifting 2 hours toward congruence with the time zone at your destination.14
Help reset your circadian rhythm through exposure to bright light, in the morning after eastward travel and in the evening after westward travel.14
Take it easy at first. An itinerary that accounts for initial fatigue is an important nonpharmacologic management strategy.14
Avoid sedating medications, including antihistamines, tranquilizers, anti-motion sickness agents, and benzodiazepines, as these can increase falls and confusion in older adults and make jet lag worse.3
Take melatonin. A dose of 0.5 to 5 mg, taken at bedtime, may promote sleep and decrease jet lag symptoms in travelers crossing multiple time zones.14
Prepare patients to cope with heat …
Unusually hot, humid weather increases morbidity and mortality in the elderly,3,15 and older patients traveling to such climates will need to take extra precautions. Strenuous exercise in the heat should be avoided, because both thirst and the capacity to conserve salt and water decrease with age.16 Acclimatization is helped by rest, air-conditioning, loose cotton clothing, brimmed hats, and cool baths or showers.3 Diuretics may have to be adjusted for fluids lost by increased perspiration, and a discussion about a dose reduction should be included in the pretravel consult for patients who take diuretics and will be traveling to a hot, humid climate.
… and increases in altitude
For older adults, exposure to a moderate altitude (<2500 meters) is initially associated with hypoxemia and a reduced exercise capacity, until acclimatization occurs by Day 5.17,18 Although older adults generally acclimatize well, advise them to limit their activities for the first few days at a higher altitude. This is especially important for patients with coronary artery disease (CAD).
To further ease the effects of a higher altitude, advise patients to drink plenty of fluids, but little or no alcohol.19 Review the medications of an older patient who will be spending time at very high altitude. Rarely, antihypertensive medication may need to be adjusted. The body compensates for lower oxygen with a faster heart rate, and some antihypertensives may interfere with this compensatory mechanism.3
Precautions (and prophylaxis) may prevent travelers’ diarrhea
Diarrhea—among the most common travel-related conditions20—affects an estimated 30% to 70% of international travelers.2 The incidence is highest among visitors to developing countries. Most (80%-90%) of travelers’ diarrhea is due to bacterial infection,21 10% of cases are caused by parasites, and 5% to 8% by viral infection.2,22
Although increasing age lowers the risk of travelers’ diarrhea,1 older patients traveling to developing areas should be cautioned to only eat food that is served hot or fruit they can peel themselves; drink only bottled water and sealed liquids; and avoid salad, ice, and food from street vendors.1 Studies have shown, however, that tourists often get diarrhea despite these safety measures.2
Treatment and prophylaxis. Prophylactic antibiotics can prevent travelers’ diarrhea. But the increased sun sensitivity, drug-drug interactions, and gastrointestinal (GI) adverse effects associated with antibiotics limit their usefulness. Prophylaxis is indicated, however, for older adults for whom the complications of dehydration would likely be so severe that the benefits of using antibiotics to prevent diarrhea clearly outweigh the risks.23
Fluoroquinolones are a first-line treatment for travelers’ diarrhea. But increasing microbial resistance to this class of drugs, especially among Campylobacter isolates,24 may limit their usefulness in some destinations.25 Azithromycin is recommended in such cases, and has been shown to be equally effective.26,27 Single-dose therapy is well established with fluoroquinolones, but the best regimen for azithromycin (1 vs 3 days) is still under evaluation.28,29 Along with instructions on when to take an antibiotic, travelers should be given prescriptions for treatment of travelers’ diarrhea before the start of their trip. Suggest that patients purchase oral rehydration packets to take on their trip, and stress the importance of using them and staying hydrated if diarrhea develops.
Decreased upper GI acidity due to acid-blocking medications such as proton-pump inhibitors can increase the risk for many infections, including salmonella and cholera. Patients taking such medications should be made aware of the risk, and the risks vs benefits of temporarily stopping them should be discussed. Vaccination against cholera should not routinely be recommended.29,30
Vaccines and pills protect against preventable diseases
An impending trip abroad also presents an opportunity to review the patient’s immunization status, catch up on recommended vaccines, and determine whether any additional vaccinations are needed.
Herpes zoster (HZ). Patients older than 60 years should receive a single dose of the HZ vaccine, whether or not they have a history of this condition. Because this is a live virus-containing vaccine, however, it should not be given to anyone who is immunocompromised.31
MMR booster. Adults born before 1957 can be considered immune from both measles and mumps, but not rubella. There is no data on immunization to rubella, but guidelines do not recommend MMR vaccination in the elderly.1
Pneumococcal polyvalent-23 (PPV-23). One dose of the PPV-23 vaccine is indicated for all adults at age 65. This is especially important for travelers, as the prevalence of pneumococcal disease is likely higher in crowded, urban environments within less developed countries.31
Tetanus. Although tetanus is mainly a disease of the elderly, only 45% of men ages 70 years or older and 21% of women in this age group were found to have protective antibodies.1,32 In 2011, the Advisory Committee on Immunization Practices (ACIP) recommended one dose of tetanus and diphtheria toxoid (Td) every 10 years, with a single dose of tetanus toxoid, diphtheria toxoid, and acellular pertussis (Tdap) vaccine given in place of Td for adults older than 65.33 Despite ACIP’s recommendation, the vaccine’s use in adults 65 years and older is an off-label indication, as Tdap is only approved for use in those 11 to 64 years of age.33
Additional vaccines are recommended for travelers, with some indicated for all travelers and others that are destination-specific (TABLE).
TABLE
Which travel-related vaccines does your patient need?
| Disease | Type of vaccine | Primary course | Booster/ follow-up | Route | For which destinations? |
|---|---|---|---|---|---|
| Vaccines for all travelers | |||||
| Hepatitis A* | Killed virus | 2 doses (6-18 mo apart)† | None | IM | All |
| Hepatitis B* | Recombinant viral antigen | 3 doses (0, 1, 6 mo) | None | IM | All |
| Influenza | Inactivated viral | Single dose | Annually | IM | All |
| Typhoid | Capsular polysaccharide Live attenuated bacteria | Single dose 4 doses (0, 2, 4, 6 mo) | 2-3 y 5 y | IM Oral | All |
| Vaccines for travelers to select destinations | |||||
| Japanese encephalitis | Inactivated viral | 2 doses (28 d apart) | Unknown | IM | Rural Asia‡ |
| Meningococcus | Quadrivalent conjugated polysaccharide | Single dose | >10 y | IM | Sub-Saharan Africa; Saudi Arabia |
| Polio | Inactivated viral | Single dose if patient had childhood series | None | SC; IM | Anyplace where polio still occurs |
| Rabies | Inactivated cell culture viral | 3 doses (0, 7, 21-28 d) | None unless exposure occurs | IM | |
| Yellow fever | Live attenuated virus | Single dose | 10 y | SC | Sub-Saharan Africa; tropical South America |
| IM, intramuscular; SC, subcutaneous. *A combined hepatitis A/B vaccine is approved for use in older adults. †Second dose may be delayed up to 8 years without diminished efficacy. ‡Required only for prolonged stays in rural areas of Asia. Adapted from: Mandell GL, Bennett JE, Dolin R, eds. Principles and Practice of Infectious Diseases. 7th ed. Philadelphia, Pa: Elsevier; 2010. | |||||
Meds and safety measures can minimize malaria risk
The risk of acquiring malaria differs significantly among travelers, based on destination, duration and type of travel, and season. Choice of antimalarial agents (eg, atovaquone/proguanil, chloroquine, doxycycline, mefloquine, and primaquine) should be made on an individual basis after considering these factors, as well as the resistance patterns of the countries on the patient’s itinerary, his or her medical history, and the adverse effects profile of potential agents. Because many older adults take multiple medications, the possibility of drug-drug interactions must be considered.1 You’ll find destination-specific recommendations on malaria prevention on the Centers for Disease Control and Prevention’s Travelers’ Health Web site, listed in “Travel and health: Resources for patients and physicians”. For guidance on the best drug to prescribe, you can also consult a travel medicine specialist.2
Access-able Travel Source Web site provides information for older adult travelers with special needs who need help traveling with oxygen or getting around despite decreased mobility (www.access-able.com/tips/).
American Diabetes Association publishes detailed information about traveling with diabetes (http://www.diabetes.org/living-with-diabetes/know-your-rights/discrimination/public-accommodations/air-travel-and-diabetes/).
Bureau of Consular Affairs publishes information regarding VISA and security requirements at various destinations and travel warnings (http://travel.state.gov/about/about_304.html).
Centers for Disease Control and Prevention publishes “The Yellow Book”—a reference for clinicians who advise international travelers about health risks. There is also a range of other travel-related information on its Travelers’ Health Web site (www.cdc.gov/travel/).
International Travel Medicine Society provides a global travel clinic directory (http://www.istm.org/Webforms/Searchclinics/Default.aspx?SearchType=advanced).
Transportation Security Administration Web site provides information on what can be brought on-board a plane. See “Can I bring my … through the checkpoint?” (http://apps.tsa.dhs.gov/mytsa/cib_home.aspx).
Travel Health Online offers a list of medical providers around the world (www.tripprep.com/scripts).
World Health Organization’s Travel and Health Web site provides free access to selected chapters of its book, “International Travel and Health 2012,” as well as interactive maps, information about infectious diseases and food safety, and more (www.who.int/ith/en/).
Patients should be mindful of mosquitos. Stress the importance of preventing mosquito bites (as much as possible). Advise patients traveling to mosquito-infested areas to use insect repellents containing 30% N-diethyl-meta-toluamide (DEET) and permethrin-treated clothing.34 Tell them, too, to wear long sleeves, pants, and footwear that provides full coverage.35 Ensuring that sleeping areas are properly screened or air-conditioned will further reduce the likelihood of mosquito bites.36
CASE After seeing the chief complaint listed as “Traveling to Kenya” on Professor R’s chart, you quickly review the CDC’s Travelers’ Health Web site. You encourage him to stay with his tour group and to wear a seatbelt whenever possible. You also review how to make a personalized travel health kit, and encourage him to register with the Smart Traveler Enrollment Program (STEP) (detailed at https://step.state.gov/rep) before leaving for the safari. You strongly suggest that he consider purchasing additional medical evacuation insurance, as well.
Given the prevalence of travelers’ diarrhea, along with dengue and malaria, in Kenya, you review food and water safety and avoidance of insect-transmitted diseases with the patient, and write a prescription for ciprofloxacin to be taken if he develops diarrhea. Professor R is not at high risk for VTE, but you encourage him to stay hydrated, avoid sedating medications, and be diligent about mobilization during lengthy flights. You recommend melatonin for jet lag.
To adjust to the heat, you recommend that he avoid strenuous exercise in the first few days and drink sufficient fluids throughout the trip. You administer the Tdap vaccine, an adult polio booster, and the hepatitis A vaccine, verify that he has received his pneumococcal and influenza vaccines, and prescribe an antimalarial medication.
And as you walk him toward the door, you offer him one final piece of advice: Take plenty of pictures.
CORRESPONDENCE
Jeffrey D. Schlaudecker, MD, The Christ Hospital/University of Cincinnati Family Medicine Residency Program, 2123 Auburn Avenue #340, Cincinnati, OH 45219; [email protected]
1. Reed CM. Travel recommendations for older adults. Clin Geriatr Med. 2007;23:687-713, ix.
2. Centers for Disease Control and Prevention. Health Information for International Travel 2012. New York, NY:Oxford University Press; 2012. Available at http://wwwnc.cdc.gov/travel/page/yellowboth-2012-home.htm. Accessed December 18, 2012.
3. Cooper MC. The elderly travellers. Travel Med Infect Dis. 2006;4:218-222.
4. Guse CE, Cortes LM, Hargarten SW, et al. Fatal injuries of US citizens abroad. J Travel Med. 2007;14:279-287
5. Tonellato DJ, Guse CE, Hargarten SW. Injury deaths of US citizens abroad: new data source, old travel problem. J Travel Med. 2009;16:304-310.
6. Fenner P. Fitness to travel - assessment in the elderly and medically impaired. Aust Fam Physician. 2007;36:312-315.
7. Smith D, Toff W, Joy M, et al. Fitness to fly for passengers with cardiovascular disease. Heart. 2010;96(suppl 2):Sii1-S16.
8. Chandra D, Parisini E, Mozaffarian D. Meta-analysis: travel and risk for venous thromboembolism. Ann Intern Med. 2009;151:180-190.
9. Gavish I, Brenner B. Air travel and the risk of thromboembolism. Intern Emerg Med. 2011;6:113-116.
10. Ansari MT, Cheung BM, Qing Huang J, et al. Traveler’s thrombosis: a systematic review. J Travel Med. 2005;12:142-154.
11. Schwarz T, Siegert G, Oettler W, et al. Venous thrombosis after long-haul flights. Arch Intern Med. 2003;163:2759-2764.
12. Cesarone MR, Belcaro G, Errichi BM, et al. The LONFLIT4—Concorde Deep Venous Thrombosis and Edema Study: prevention with travel stockings. Angiology. 2003;54:143-154.
13. Cesarone MR, Belcaro G, Nicolaides AN, et al. Venous thrombosis from air travel: the LONFLIT3 study—prevention with aspirin vs low-molecular-weight heparin (LMWH) in high-risk subjects: a randomized trial. Angiology. 2002;53:1-6.
14. Sack RL. Clinical practice. Jet lag. N Engl J Med. 2010: 440-447.
15. Davies I, O’Neill PA, McLean KA, et al. Age-associated alterations in thirst and arginine vasopressin in response to a water or sodium load. Age Ageing. 1995;24:151-159.
16. Rikkert MG, Melis RJ, Claassen JA. Heat waves and dehydration in the elderly. BMJ. 2009;339:b2663.-
17. Levine BD, Zuckerman JH, deFilippi CR. Effect of high-altitude exposure in the elderly: the Tenth Mountain Division study. Circulation. 1997;96:1224-1232.
18. Agostoni P, Cattadori G, Guazzi M, et al. Effects of simulated altitude-induced hypoxia on exercise capacity in patients with chronic heart failure. Am J Med. 2000;109:450-455.
19. Higgins JP, Tuttle T, Higgins JA. Altitude and the heart: is going high safe for your cardiac patient? Am Heart J. 2010;159:25-32.
20. Gautret P, Schlagenhauf P, Gaudart J, et al. Multicenter EuroTravNet/GeoSentinel study of travel-related infectious diseases in Europe. Emerg Infect Dis. 2009;15:1783-1790.
21. Adachi JA, Jiang ZD, Mathewson JJ, et al. Enteroaggregative Escherichia coli as a major etiologic agent in traveler’s diarrhea in 3 regions of the world. Clin Infect Dis. 2001;32:1706-1709.
22. Black RE. Epidemiology of travelers’ diarrhea and relative importance of various pathogens. Rev Infect Dis. 1990;12 (suppl 1):S73-S79.
23. Rendi-Wagner P, Kollaritsch H. Drug prophylaxis for travelers’ diarrhea. Clin Infect Dis. 2002;34:628-633.
24. Butzler JP. Campylobacter, from obscurity to celebrity. Clin Microbiol Infect. 2004;10:868-876.
25. Hoge CW, Gambel JM, Srijan A, et al. Trends in antibiotic resistance among diarrheal pathogens isolated in Thailand over 15 years. Clin Infect Dis. 1998;26:341-345.
26. Adachi JA, Ericsson CD, Jiang ZD, et al. Azithromycin found to be comparable to levofloxacin for the treatment of US travelers with acute diarrhea acquired in Mexico. Clin Infect Dis. 2003;37:1165-1171.
27. Tribble DR, Sanders JW, Pang LW, et al. Traveler’s diarrhea in Thailand: randomized, double-blind trial comparing single-dose and 3-day azithromycin-based regimens with a 3-day levofloxacin regimen. Clin Infect Dis. 2007;44:338-346.
28. Shanks GD, Smoak BL, Aleman GM, et al. Single dose of azithromycin or three-day course of ciprofloxacin as therapy for epidemic dysentery in Kenya. Acute Dysentery Study Group. Clin Infect Dis. 1999;29:942-943.
29. Heatley RV, Sobala GM. Acid suppression and the gastric flora. Baillieres Clin Gastroenterol. 1993;7:167-181.
30. Hill DR, Ford L, Lalloo DG. Oral cholera vaccines: use in clinical practice. Lancet Infect Dis. 2006;6:361-373.
31. Vaughn JA, Miller RA. Update on immunizations in adults. Am Fam Physician. 2011;84:1015-1020.
32. Gergen PJ, McQuillan GM, Kiely M, et al. A population-based serologic survey of immunity to tetanus in the United States. N Engl J Med. 1995;332:761-766.
33. World Health Organization. Typhoid vaccines: WHO position paper. Wkly Epidemiol Rec. 2008;83:49-59.
34. Fradin MS, Day JF. Comparative efficacy of insect repellents against mosquito bites. N Engl J Med. 2002;347:13-18.
35. Soto J, Medina F, Dember N, et al. Efficacy of permethrin-impregnated uniforms in the prevention of malaria and leishmaniasis in Colombian soldiers. Clin Infect Dis. 1995;21:599-602.
36. Freedman DO. Clinical practice. Malaria prevention in short-term travelers. N Engl J Med. 2008;359:603-612.
Speed your diagnosis of this gallbladder disorder
• Use the Rome III guidelines to diagnose and treat functional gallbladder disorder; when this benchmark is followed, cholecystectomy results in ~90% resolution rate. B
• Keep in mind that classic biliary symptoms, particularly right upper quadrant pain, pain after eating, and reproduction of pain with cholecystokinin injection, are highly predictive of a successful postoperative outcome. C
• Offer cholecystectomy to patients who present with classic biliary symptoms and an abnormal hepatobiliary iminodiacetic acid (HIDA) scan. C
Strength of recommendation (SOR)
A Good-quality patient-oriented evidence
B Inconsistent or limited-quality patient-oriented evidence
C Consensus, usual practice, opinion, disease-oriented evidence, case series
CASE Dionne J, a 38-year-old woman with a BMI of 32, presents with a 2-month history of right upper abdominal pain. The pain is intermittent and often begins after eating, she reports, particularly when a meal includes fatty foods. She has no nausea, vomiting, diarrhea, constipation, or fever, and the pain is not getting progressively worse.
When the pain comes on, Ms. J says, it lasts about an hour, sometimes less. It is colicky in nature, and not relieved with bowel movements or position change. The patient tried ranitidine 150 mg twice a day for 2 weeks, with no relief. You suspect functional gallbladder disorder. But is Ms. J a candidate for a cholecystectomy? What would you do next?
Over the past 2 decades, the incidence of cholecystectomies due to functional gallbladder disorder (FGBD) has multiplied, going from about 5% to 20% to 25%.1 But definitive information about the etiology of FGBD has not kept pace.
Although the Rome III diagnostic guidelines for FGBD, published in 2006,2 remain the standard of care, a number of more recent studies have added to our understanding of this disorder. This review of the diagnosis and treatment of FGBD incorporates both the Rome III guidelines and the latest findings. The text and tables that follow can help you recognize this clinical entity earlier, minimize the number of tests needed to arrive at a definitive diagnosis, and establish a plan of care that is consistent with both the guidelines and the evidence.
As obesity rates rise, so does gallbladder dysfunction
Obesity has been shown to produce a chronic proinflammatory state throughout the body,3-6 which has been linked to fatty infiltration of the gallbladder (among other organs) and impaired contractility.3,6-9
A study by Al-Azzawi et al highlighted the importance of increased fat in the gallbladder wall as a key cause of dysmotility.10 The researchers compared wall thickness, inflammation, and the amount of fat in the walls of gallbladders that had been removed for both acalculous and calculous disease with the characteristics of gallbladders removed for reasons unrelated to organ dysfunction (the controls). Those with dysmotility, they found, had more fat in the wall but the same wall thickness as the controls. The amount of fat in the walls was similar for the acalculous and the calculous groups, but the gallbladders in which stones were found had more inflammation and increased wall thickness.10
Several other studies have found evidence of both inflammation and fatty deposits in the walls of gallbladders removed for acalculous disease.2,4,11-13
In one study, researchers found chronic inflammation in 99% of gallbladders removed from patients who had classic biliary symptoms but no gallstones.11
FGBD appears to be initiated by fatty infiltration of the gallbladder wall, causing increasing levels of inflammation and steatocholecystitis that lead to poor motility.3,4,6-10 This in turn alters bile composition, which can lead to sludge and stone formation.2,6,10 The finding by Al-Azzawi et al of greater thickness and inflammation in the walls of gallbladders with calculi suggests that gallstones result from progressively worsening inflammation and dysmotility.10
Steps to take for a definitive diagnosis
A diagnosis of FGBD requires a history of classic gallbladder symptoms, many but not all of which are specified in the Rome III diagnostic criteria (TABLE). Classic symptoms include nausea, vomiting, right upper quadrant pain, pain after eating, and reproduction of pain with cholecystokinin (CCK) injection. Cramping, bloating, reflux, diarrhea, fullness, and epigastric pain are atypical symptoms.2,11
TABLE
Rome III diagnostic criteria for functional gallbladder disorder
Must include episodes of pain located in the epigastrium and/or right upper quadrant and all of the following findings:
|
| Supportive criteria |
The pain may present with one or more of the following findings:
|
| Source: Behar et al. Gastroenterology. 2006;130:1498-1509.2 Used with permission from Elsevier. |
Rule out structural causes
There is no single test for FGBD, and a definitive diagnosis can be made only after structural causes of the symptoms (eg, gallstones, tumor, sclerosis, and cirrhosis) have been ruled out (ALGORITHM).2 Initial tests include liver and pancreatic enzyme laboratory screening and an ultrasound of the upper right quadrant. In patients with FGBD, both the lab tests and the ultrasound will be normal.
ALGORITHM
Diagnostic workup and management of functional gallbladder disorder (Rome III)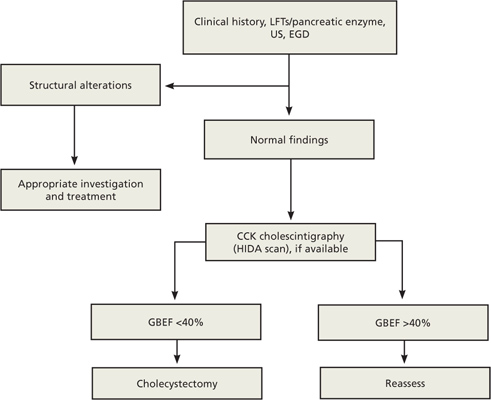
CCK, cholecystokinin; EGD, esophagogastroduodenoscopy; GBEF, gallbladder ejection fraction; HIDA, hepatobiliary iminodiacetic acid; LFTs, liver function tests; US, ultrasound.
Source: Behar J et al. Gastroenterology. 2006;130:1498-1509.2 Used with permission from Elsevier.
The Rome III guidelines also call for an esophagogastroduodenoscopy (EGD) to rule out esophagitis, gastritis, and duodenitis, although some researchers have held that if the other tests are normal, this test need not be done.12 If the EGD is also normal—or not done—a hepatobiliary iminodiacetic acid (HIDA) scan is the next step in the diagnostic pathway. The scan tests the gallbladder’s ejection fraction (EF), revealing the percentage of radioactive dye ejected from the organ after CCK is injected (FIGURE).2 The injection of CCK should be done over a minimum of 30 minutes, the guidelines specify. The shorter the time frame used for the injection, the less likely that the pain will be reproduced or that the EF findings will be reliable.14
FIGURE
Abnormal vs normal HIDA scans: What you’ll see
The larger amount of contrast dye retained in the abnormal scan (A) compared with the normal scan (B) is evidence of a poor ejection fraction.
Most researchers define a normal EF as >35%,10,11,13 but the Rome III criteria use a cutoff of 40%. A patient who has an EF <40% and meets the other guideline criteria is diagnosed with FGBD.
CASE On physical examination, Ms. J has pain in the right upper quadrant, with no guarding or rebound, and normal bowel sounds. Her liver and pancreatic enzyme tests are normal, and an ultrasound shows no sludge, no stones, and mild edema of the gallbladder wall. The patient declines an EGD because of the cost but undergoes a HIDA scan—which reveals that she has an EF of 25%.
Will cholecystectomy bring long-term relief?
There are 2 options for a patient diagnosed with FGBD—medical management, consisting of lifestyle modifications such as dietary change and weight loss and medication for symptom relief—or cholecystectomy. Surgery should be offered to any individual who, like Ms. J, meets the Rome III diagnostic criteria and has an abnormal HIDA scan. Recent studies have raised questions about the correlation between HIDA results and postoperative relief,11,12 however, and indicate that patients who have classic biliary symptoms and a normal HIDA scan often have good postoperative outcomes, as well.11,15
A careful workup is key to ensuring maximal benefit from surgery. The resolution of symptoms with a cholecystectomy when the Rome III criteria are followed for patient selection has been found to be close to 90%.11,15-20 Two recent studies have examined the resolution rate for FGBD, with conflicting results.11,12 Both studies were based on long-term postoperative follow-up, ranging from 6 to 24 months. The main difference was the selection bias used in determining eligibility for the study.
The initial selection criteria for the study by Carr et al (N=93) were presenting symptoms (either classic or atypical), followed by a typical workup. The long-term resolution rate for those with classic gallbladder symptoms was 88%11—close to the 90% associated with the Rome III guidelines. The study by Singhal et al (N=141)12 was done retrospectively, using objective data from tests (ie, normal ultrasound and liver biochemistries and abnormal HIDA) rather than patient history as the criteria for inclusion. Among participants in the Singhal study, the long-term resolution rate was just 57%.
Ironically, the patients in the Carr study who had atypical symptoms had mixed postoperative results. The rate of long-term resolution for this cohort was 57%—the same as the overall resolution rate found by Singhal et al.11,12 The fact that a group of patients who presented atypically had the same postoperative resolution rate as those for whom tests (rather than symptoms) were used as the selection criteria illustrates the importance of presenting symptoms as a prognostic indicator.
CASE Ms. J opts for a cholecystectomy and you refer her to a general surgeon. At her annual exam the following year, she reports that she has been symptom free since the surgery.
CORRESPONDENCE
David I. Croteau, MD, FAAFP, LRMC Family Medical Center, 300 Parkview Place, Lakeland, FL 33805; [email protected]
1. Majeski J. Gallbladder ejection fraction: an accurate evaluation of symptomatic acalculous gallbladder disease. Int Surg. 2003;88:95-99.
2. Behar J, Corazziari E, Guelrud M, et al. Functional gallbladder and sphincter of Oddi disorders. Gastroenterology. 2006;130:1498-1509.
3. Goldblatt MI, Swartz-Basile DA, Al-Azzawi HH, et al. Nonalcoholic fatty gallbladder disease: the Influence of diet in lean and obese mice. J Gastrointest Surg. 2006;10:193-201.
4. Chung-Jyi. Steatocholecystitis and fatty gallbladder disease. Dig Dis Sci. 2009;54:1857-1863.
5. Bastard JP, Maachi M, Lagathu C, et al. Recent advances in the relationship between obesity, inflammation, and insulin resistance. Eur Cytokine Netw. 2006;17:4-12.
6. Pitt HA. Hepato-pancreato-biliary fat: the good, the bad and the ugly. HPB (Oxford). 2007;9:92-97.
7. Merg AR, Kalinowski SE, Hinkhouse MM, et al. Mechanisms of impaired gallbladder contractile response in chronic acalculous cholecystitis. J Gastrointest Surg. 2002;6:432-437.
8. Amaral J, Xiao ZL, Chen Q, et al. Gallbladder muscle dysfunction in patients with chronic acalculous disease. Gastroenterology. 2001;120:506-511.
9. Portincasa P, Ciaula AD, Baldassarre G, et al. Gallbladder motor function in gallstone patients: sonographic and in vitro studies on the role of gallstones, smooth muscle function, and gallbladder wall inflammation. J Hepatol. 1994;21:430-440.
10. Al-Azzawi HH, Nakeeb A, Saxena R, et al. Cholecystosteatosis: an explanation for increased cholecystectomy rates. J Gastrointest Surg. 2007;11:835-843.
11. Carr JA, Walls J, Bryan LJ, et al. The treatment of gallbladder dyskinesia based upon symptoms: results of a 2-year, prospective, nonrandomized, concurrent cohort study. Surg Laparosc Endosc Percutan Tech. 2009;19:222-226.
12. Singhal V, Szeto P, Norman H, et al. Biliary dyskinesia: how effective is cholecystectomy? J Gastrointest Surg. 2012;16:135-141.
13. Francis G, Baillie J. Gallbladder dyskinesia: fact or fiction? Curr Gastroenterol Rep. 2011;13:188-192.
14. Ziessman HA. Nuclear medicine hepatobiliary imaging. Clin Gastroenterol Hepatol. 2010;8:111-116.
15. Delgado-Aros S, Cremonini R, Bredenoord AJ, et al. Systemic review and meta-analysis: does gallbladder ejection fraction on cholecystokinin cholescintigraphy predict outcome after cholecystectomy in suspected functional biliary pain? Aliment Pharmacol Ther. 2003;18:167-174.
16. Patel PA, Lamb JJ, Hogle NJ, et al. Therapeutic efficacy of laparoscopic cholecystectomy in the treatment of biliary dyskinesia. Am J Surg. 2004;187:209-212.
17. Mahid SS, Jafri NS, Brangers BC, et al. Meta-analysis of cholecystectomy in symptomatic patients with positive hepatoiminodiacetic acid scan results without gallstones. Arch Surg. 2009;144:180-187.
18. Hansel SL, DiBaise JK. Functional gallbladder disorder: gallbladder dyskinesia. Gastroenterol Clin North Am. 2010;39:369-379.
19. Canfield AJ, Hetz SP, Shriver JP, et al. Biliary dyskinesia: a study of more than 200 patients and review of the literature. J Gastrointest Surg. 1998;2:443-448.
20. Jagannath SB, Singh VK, Cruz-Correa M, et al. A long-term cohort study of outcome after cholecystectomy for chronic acalculous cholecystitis. Am J Surg. 2003;185:91-95.
| Pain after gallbladder surgery? Consider sphincter of Oddi dysfunction David Ivan Croteau, MD, FAAFP |
David Ivan Croteau, MD, FAAFP
Lakeland Regional Medical Center, Lakeland, Fla
[email protected]
The author reported no potential conflict of interest relevant to this article.
| Pain after gallbladder surgery? Consider sphincter of Oddi dysfunction David Ivan Croteau, MD, FAAFP |
David Ivan Croteau, MD, FAAFP
Lakeland Regional Medical Center, Lakeland, Fla
[email protected]
The author reported no potential conflict of interest relevant to this article.
| Pain after gallbladder surgery? Consider sphincter of Oddi dysfunction David Ivan Croteau, MD, FAAFP |
David Ivan Croteau, MD, FAAFP
Lakeland Regional Medical Center, Lakeland, Fla
[email protected]
The author reported no potential conflict of interest relevant to this article.
• Use the Rome III guidelines to diagnose and treat functional gallbladder disorder; when this benchmark is followed, cholecystectomy results in ~90% resolution rate. B
• Keep in mind that classic biliary symptoms, particularly right upper quadrant pain, pain after eating, and reproduction of pain with cholecystokinin injection, are highly predictive of a successful postoperative outcome. C
• Offer cholecystectomy to patients who present with classic biliary symptoms and an abnormal hepatobiliary iminodiacetic acid (HIDA) scan. C
Strength of recommendation (SOR)
A Good-quality patient-oriented evidence
B Inconsistent or limited-quality patient-oriented evidence
C Consensus, usual practice, opinion, disease-oriented evidence, case series
CASE Dionne J, a 38-year-old woman with a BMI of 32, presents with a 2-month history of right upper abdominal pain. The pain is intermittent and often begins after eating, she reports, particularly when a meal includes fatty foods. She has no nausea, vomiting, diarrhea, constipation, or fever, and the pain is not getting progressively worse.
When the pain comes on, Ms. J says, it lasts about an hour, sometimes less. It is colicky in nature, and not relieved with bowel movements or position change. The patient tried ranitidine 150 mg twice a day for 2 weeks, with no relief. You suspect functional gallbladder disorder. But is Ms. J a candidate for a cholecystectomy? What would you do next?
Over the past 2 decades, the incidence of cholecystectomies due to functional gallbladder disorder (FGBD) has multiplied, going from about 5% to 20% to 25%.1 But definitive information about the etiology of FGBD has not kept pace.
Although the Rome III diagnostic guidelines for FGBD, published in 2006,2 remain the standard of care, a number of more recent studies have added to our understanding of this disorder. This review of the diagnosis and treatment of FGBD incorporates both the Rome III guidelines and the latest findings. The text and tables that follow can help you recognize this clinical entity earlier, minimize the number of tests needed to arrive at a definitive diagnosis, and establish a plan of care that is consistent with both the guidelines and the evidence.
As obesity rates rise, so does gallbladder dysfunction
Obesity has been shown to produce a chronic proinflammatory state throughout the body,3-6 which has been linked to fatty infiltration of the gallbladder (among other organs) and impaired contractility.3,6-9
A study by Al-Azzawi et al highlighted the importance of increased fat in the gallbladder wall as a key cause of dysmotility.10 The researchers compared wall thickness, inflammation, and the amount of fat in the walls of gallbladders that had been removed for both acalculous and calculous disease with the characteristics of gallbladders removed for reasons unrelated to organ dysfunction (the controls). Those with dysmotility, they found, had more fat in the wall but the same wall thickness as the controls. The amount of fat in the walls was similar for the acalculous and the calculous groups, but the gallbladders in which stones were found had more inflammation and increased wall thickness.10
Several other studies have found evidence of both inflammation and fatty deposits in the walls of gallbladders removed for acalculous disease.2,4,11-13
In one study, researchers found chronic inflammation in 99% of gallbladders removed from patients who had classic biliary symptoms but no gallstones.11
FGBD appears to be initiated by fatty infiltration of the gallbladder wall, causing increasing levels of inflammation and steatocholecystitis that lead to poor motility.3,4,6-10 This in turn alters bile composition, which can lead to sludge and stone formation.2,6,10 The finding by Al-Azzawi et al of greater thickness and inflammation in the walls of gallbladders with calculi suggests that gallstones result from progressively worsening inflammation and dysmotility.10
Steps to take for a definitive diagnosis
A diagnosis of FGBD requires a history of classic gallbladder symptoms, many but not all of which are specified in the Rome III diagnostic criteria (TABLE). Classic symptoms include nausea, vomiting, right upper quadrant pain, pain after eating, and reproduction of pain with cholecystokinin (CCK) injection. Cramping, bloating, reflux, diarrhea, fullness, and epigastric pain are atypical symptoms.2,11
TABLE
Rome III diagnostic criteria for functional gallbladder disorder
Must include episodes of pain located in the epigastrium and/or right upper quadrant and all of the following findings:
|
| Supportive criteria |
The pain may present with one or more of the following findings:
|
| Source: Behar et al. Gastroenterology. 2006;130:1498-1509.2 Used with permission from Elsevier. |
Rule out structural causes
There is no single test for FGBD, and a definitive diagnosis can be made only after structural causes of the symptoms (eg, gallstones, tumor, sclerosis, and cirrhosis) have been ruled out (ALGORITHM).2 Initial tests include liver and pancreatic enzyme laboratory screening and an ultrasound of the upper right quadrant. In patients with FGBD, both the lab tests and the ultrasound will be normal.
ALGORITHM
Diagnostic workup and management of functional gallbladder disorder (Rome III)
CCK, cholecystokinin; EGD, esophagogastroduodenoscopy; GBEF, gallbladder ejection fraction; HIDA, hepatobiliary iminodiacetic acid; LFTs, liver function tests; US, ultrasound.
Source: Behar J et al. Gastroenterology. 2006;130:1498-1509.2 Used with permission from Elsevier.
The Rome III guidelines also call for an esophagogastroduodenoscopy (EGD) to rule out esophagitis, gastritis, and duodenitis, although some researchers have held that if the other tests are normal, this test need not be done.12 If the EGD is also normal—or not done—a hepatobiliary iminodiacetic acid (HIDA) scan is the next step in the diagnostic pathway. The scan tests the gallbladder’s ejection fraction (EF), revealing the percentage of radioactive dye ejected from the organ after CCK is injected (FIGURE).2 The injection of CCK should be done over a minimum of 30 minutes, the guidelines specify. The shorter the time frame used for the injection, the less likely that the pain will be reproduced or that the EF findings will be reliable.14
FIGURE
Abnormal vs normal HIDA scans: What you’ll see
The larger amount of contrast dye retained in the abnormal scan (A) compared with the normal scan (B) is evidence of a poor ejection fraction.
Most researchers define a normal EF as >35%,10,11,13 but the Rome III criteria use a cutoff of 40%. A patient who has an EF <40% and meets the other guideline criteria is diagnosed with FGBD.
CASE On physical examination, Ms. J has pain in the right upper quadrant, with no guarding or rebound, and normal bowel sounds. Her liver and pancreatic enzyme tests are normal, and an ultrasound shows no sludge, no stones, and mild edema of the gallbladder wall. The patient declines an EGD because of the cost but undergoes a HIDA scan—which reveals that she has an EF of 25%.
Will cholecystectomy bring long-term relief?
There are 2 options for a patient diagnosed with FGBD—medical management, consisting of lifestyle modifications such as dietary change and weight loss and medication for symptom relief—or cholecystectomy. Surgery should be offered to any individual who, like Ms. J, meets the Rome III diagnostic criteria and has an abnormal HIDA scan. Recent studies have raised questions about the correlation between HIDA results and postoperative relief,11,12 however, and indicate that patients who have classic biliary symptoms and a normal HIDA scan often have good postoperative outcomes, as well.11,15
A careful workup is key to ensuring maximal benefit from surgery. The resolution of symptoms with a cholecystectomy when the Rome III criteria are followed for patient selection has been found to be close to 90%.11,15-20 Two recent studies have examined the resolution rate for FGBD, with conflicting results.11,12 Both studies were based on long-term postoperative follow-up, ranging from 6 to 24 months. The main difference was the selection bias used in determining eligibility for the study.
The initial selection criteria for the study by Carr et al (N=93) were presenting symptoms (either classic or atypical), followed by a typical workup. The long-term resolution rate for those with classic gallbladder symptoms was 88%11—close to the 90% associated with the Rome III guidelines. The study by Singhal et al (N=141)12 was done retrospectively, using objective data from tests (ie, normal ultrasound and liver biochemistries and abnormal HIDA) rather than patient history as the criteria for inclusion. Among participants in the Singhal study, the long-term resolution rate was just 57%.
Ironically, the patients in the Carr study who had atypical symptoms had mixed postoperative results. The rate of long-term resolution for this cohort was 57%—the same as the overall resolution rate found by Singhal et al.11,12 The fact that a group of patients who presented atypically had the same postoperative resolution rate as those for whom tests (rather than symptoms) were used as the selection criteria illustrates the importance of presenting symptoms as a prognostic indicator.
CASE Ms. J opts for a cholecystectomy and you refer her to a general surgeon. At her annual exam the following year, she reports that she has been symptom free since the surgery.
CORRESPONDENCE
David I. Croteau, MD, FAAFP, LRMC Family Medical Center, 300 Parkview Place, Lakeland, FL 33805; [email protected]
1. Majeski J. Gallbladder ejection fraction: an accurate evaluation of symptomatic acalculous gallbladder disease. Int Surg. 2003;88:95-99.
2. Behar J, Corazziari E, Guelrud M, et al. Functional gallbladder and sphincter of Oddi disorders. Gastroenterology. 2006;130:1498-1509.
3. Goldblatt MI, Swartz-Basile DA, Al-Azzawi HH, et al. Nonalcoholic fatty gallbladder disease: the Influence of diet in lean and obese mice. J Gastrointest Surg. 2006;10:193-201.
4. Chung-Jyi. Steatocholecystitis and fatty gallbladder disease. Dig Dis Sci. 2009;54:1857-1863.
5. Bastard JP, Maachi M, Lagathu C, et al. Recent advances in the relationship between obesity, inflammation, and insulin resistance. Eur Cytokine Netw. 2006;17:4-12.
6. Pitt HA. Hepato-pancreato-biliary fat: the good, the bad and the ugly. HPB (Oxford). 2007;9:92-97.
7. Merg AR, Kalinowski SE, Hinkhouse MM, et al. Mechanisms of impaired gallbladder contractile response in chronic acalculous cholecystitis. J Gastrointest Surg. 2002;6:432-437.
8. Amaral J, Xiao ZL, Chen Q, et al. Gallbladder muscle dysfunction in patients with chronic acalculous disease. Gastroenterology. 2001;120:506-511.
9. Portincasa P, Ciaula AD, Baldassarre G, et al. Gallbladder motor function in gallstone patients: sonographic and in vitro studies on the role of gallstones, smooth muscle function, and gallbladder wall inflammation. J Hepatol. 1994;21:430-440.
10. Al-Azzawi HH, Nakeeb A, Saxena R, et al. Cholecystosteatosis: an explanation for increased cholecystectomy rates. J Gastrointest Surg. 2007;11:835-843.
11. Carr JA, Walls J, Bryan LJ, et al. The treatment of gallbladder dyskinesia based upon symptoms: results of a 2-year, prospective, nonrandomized, concurrent cohort study. Surg Laparosc Endosc Percutan Tech. 2009;19:222-226.
12. Singhal V, Szeto P, Norman H, et al. Biliary dyskinesia: how effective is cholecystectomy? J Gastrointest Surg. 2012;16:135-141.
13. Francis G, Baillie J. Gallbladder dyskinesia: fact or fiction? Curr Gastroenterol Rep. 2011;13:188-192.
14. Ziessman HA. Nuclear medicine hepatobiliary imaging. Clin Gastroenterol Hepatol. 2010;8:111-116.
15. Delgado-Aros S, Cremonini R, Bredenoord AJ, et al. Systemic review and meta-analysis: does gallbladder ejection fraction on cholecystokinin cholescintigraphy predict outcome after cholecystectomy in suspected functional biliary pain? Aliment Pharmacol Ther. 2003;18:167-174.
16. Patel PA, Lamb JJ, Hogle NJ, et al. Therapeutic efficacy of laparoscopic cholecystectomy in the treatment of biliary dyskinesia. Am J Surg. 2004;187:209-212.
17. Mahid SS, Jafri NS, Brangers BC, et al. Meta-analysis of cholecystectomy in symptomatic patients with positive hepatoiminodiacetic acid scan results without gallstones. Arch Surg. 2009;144:180-187.
18. Hansel SL, DiBaise JK. Functional gallbladder disorder: gallbladder dyskinesia. Gastroenterol Clin North Am. 2010;39:369-379.
19. Canfield AJ, Hetz SP, Shriver JP, et al. Biliary dyskinesia: a study of more than 200 patients and review of the literature. J Gastrointest Surg. 1998;2:443-448.
20. Jagannath SB, Singh VK, Cruz-Correa M, et al. A long-term cohort study of outcome after cholecystectomy for chronic acalculous cholecystitis. Am J Surg. 2003;185:91-95.
Is Chest Pain Related to Prior Fracture?
ANSWER
The radiograph demonstrates evidence of previous surgery on the sternum. There also is evidence of scarring or discoid atelectasis along the left mid lung.
Of note, though, is a soft tissue mass (about 5 to 6 cm) within the left pulmonary apex. This lesion could represent a rounded infiltrate, an atypical infection such as a mycetoma, or possibly a pulmonary neoplasm.
Since the patient was stable, he was placed on antibiotics with instructions to follow up with his primary care provider for further work-up on the mass. The patient did follow up; the lesion persisted and subsequent biopsy confirmed carcinoma.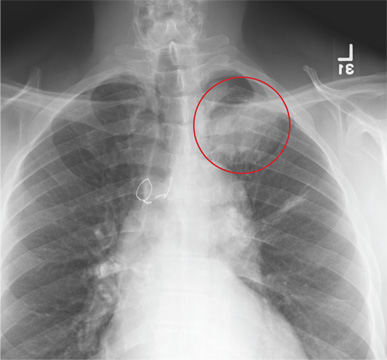
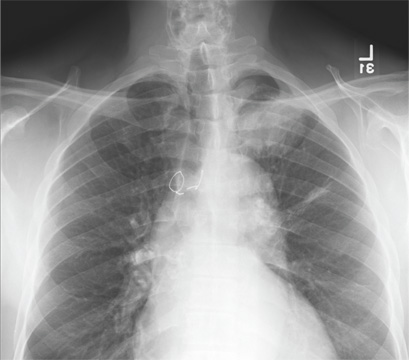
A 61-year-old man presents to your urgent care center for evaluation of “chest pain” he has been experiencing for almost four weeks. He denies any injury or trauma. He describes the pain as “sharp” and “stabbing” and says occasionally it is associated with breathing, localized primarily to the left side. There is no radiation of the pain. He denies fever, nausea, weight loss, night sweats, and hemoptysis. He has smoked a half-pack of cigarettes daily for more than 40 years. His medical history is otherwise unremarkable, except that he was told he had “high blood pressure” and he had his sternum repaired several years ago, following fracture in an accident. Vital signs are as follows: temperature, 36.4°C; blood pressure, 174/100 mm Hg; ventricular rate, 88 beats/min; respiratory rate, 20 breaths/min; and O2 saturation, 100% on room air. He appears to be in no obvious distress. Lung sounds are normal, as is the rest of the physical examination. You obtain a chest radiograph. What is your impression?

Man in Distress With Lower Extremity Pain
ANSWER
The ECG is diagnostic for a septal and anterolateral ST-elevated myocardial infarction (STEMI), suggestive of a recent MI versus left ventricular aneurysm. The ECG is also diagnostic for a recent inferior wall STEMI.
There are Q waves in leads V1 to V5 and a 2-mm ST elevation in V2 to V6, as well as a T-wave inversion (TWI) in V2 to V6 and lead 1. A 1-mm ST elevation, TWI, and small Q waves are noted in leads II, III, and aVF (inferior leads).
The patient’s abnormal troponin T level assisted with the differential diagnosis. The patient’s normal CK-MB pattern, combined with an elevated troponin T with ECG changes and chest pain reported about one week earlier, supported the diagnosis of a recent acute MI (within the past week).
The stress test was canceled. Cardiac catheterization was performed and showed a 100% mid left anterior descending (LAD) stenosis, with left to left collaterals, and an 80% right coronary artery (RCA) stenosis. No left ventricular aneurysm was noted.
Interventions included an urgent percutaneous intervention (PCI) coronary stent placement to the LAD and a staged PCI to the RCA at a later date.

A 53-year-old white man is referred for an adenosine myocardial perfusion scan stress test prior to left femoral popliteal bypass graft surgery. An ECG obtained one month ago was interpreted as normal. A transthoracic echocardiogram at that time revealed a normal left ventricular ejection fraction (> 55%) with normal wall motion and no pathologic valvular heart disease. The patient is in distress due to left lower extremity vascular ischemic rest pain. He admits that earlier this morning, he was slightly dyspneic. However, he denies chest pain. He admits to not taking aspirin (162 mg Q day) as prescribed for the past two days. He also reports an 88–pack-year smoking history. Pulmonary function tests support mild obstructive emphysematous changes. The patient is 68” tall and weighs 128 lb (BMI, 19.5). His vital signs include: a blood pressure of 128/82 mm Hg; ventricular rate, 94 beats/min; respiratory rate, 20 breaths/min; and O2 saturation, 90% on room air. He is afebrile. Pertinent physical findings include no jugular venous distention and no bilateral carotid, femoral, or abdominal bruits. The neurologic exam is unremarkable. The cardiac exam reveals a regular rate and rhythm with an S3 gallop; there is no S4, murmur, or click. There is no peripheral edema. Femoral pulses are +1. Pedal pulses are absent. Stat cardiac enzymes reveal a normal CK-MB (3.3 U/L) and an elevated troponin T level (0.117 μg/L; normal, 0.00 to 0.03). The complete blood count, prothrombin time/partial thromboplastin time/INR tests, and other chemistry panels all yield normal results. This patient’s ECG shows the following: a ventricular rate of 90 beats/min; PR interval, 135 ms; QRS duration, 96 ms; QT/QTc interval, 394/476 ms; P axis, 67°; R axis, 68°; and T axis, 172°. What is your interpretation of this ECG?
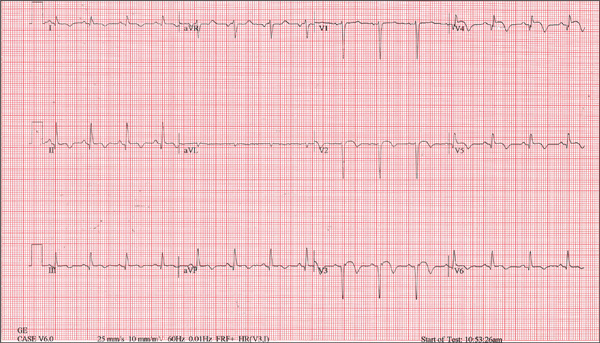
Edematous Changes Coincide with New Job
ANSWER
The correct answer is gram-negative bacteria (choice “d”); Pseudomonas is the most likely culprit. Candida albicans (choice “a”), a yeast, is an unlikely cause of this problem and even more unlikely to show up on a bacterial culture. Coagulase-positive staph aureus (choice “b”) is typically associated with infections involving the acute onset of redness, pain, swelling, and pus formation, not the indolent, chronic, low-grade process seen in this case. Trichophyton rubrum (choice “c”) is a dermatophyte, the most common fungal cause of athlete’s feet. The bacterial culture could not have grown a dermatophyte, which needs special media and conditions to grow.
DISCUSSSION
Gram-negative interweb impetigo is a relatively common dermatologic entity, which can be caused by any number of organisms found in fecal material. Pseudomonas, Klebsiella, Proteus, and Acinetobacter are among the more common culprits. These types of infections tend to be much more indolent than the more common staph- and strep-caused cellulitis, which are more likely to create acute redness, swelling, pain, and pus.
Both types of bacterial infections need certain conditions in order to develop. These include excessive heat, sweat, and perhaps most significantly, a break in the skin barrier. Ironically, these fissures are often caused by dermatophytes, in the form of tinea pedis, which is, of course, far better known for causing rashes of the foot.
But tinea pedis is more likely to be found between the third and fourth or the fourth and fifth toes. It creates itching and maceration but rarely causes diffuse redness or edema, and even more rarely leads to pain (unless there is a secondary bacterial infection). As mentioned, given the indolence of this infective process, a culture result showing staph or strep was unlikely.
The culture in this case showed Proteus, for which the minocycline was predictably effective. The rationale for obtaining the acid-fast culture was the possibility of finding Mycobacteria species such as M fortuitum, which is known to cause chronic indolent infections in feet and legs. These, however, more typically manifest with solitary eroded or ulcerated lesions. (Minocycline would have been effective against this organism.)
The use of the topical econazole served two purposes: While this was clearly not classic tinea pedis, it was still possible a dermatophyte or a yeast could have played a role in the creation of the initial fissuring; econazole will help control this, long term. Econazole also has significant antibacterial action and is particularly useful to help prevent future flares.
A 50-year-old man presents with a six-month history of worsening redness, swelling, and pain in the interdigital web spaces of both feet. Numerous treatments—most recently, a two-month course of terbinafine 250 mg/d—have not induced any change. The problem manifested as mild cracking between the first and second toes, dorsal aspect, and slowly spread laterally to involve all four web spaces. This pro-cess coincided with the start of a new job in which the patient is on his feet, wearing steel-toed boots, for 12 hours per day in a hot environment. Assuming the problem was athlete’s foot, he tried OTC clotrimazole and terbinafine creams; neither helped at all. In fact, the patient’s pain is now so bad that he has difficult walking. There is no history of smoking, diabetes, or other serious health problems. Examination shows distinct demarcated, dusky-red, edematous changes largely confined to the dorsal aspect. The actual deep interdigital space and the volar aspects of these areas are spared. Slight epidermal fissuring is seen on the dorsal aspect of each web space, from which a small amount of fluid can be coaxed. The fluid is sent for bacterial and acid-fast cultures. In the meantime, the patient is prescribed oral minocycline 100 bid and topical econazole cream and in-structed to return in two weeks. At that time, his condition is almost completely resolved.

Primary care participation ready to rise in 2013
A new report finds that 49% of surveyed primary care physicians expect to participate in an accountable care organization in the next year. Twenty percent already are in ACOs, and most of them are contracting with commercial payers and Medicaid.
Why this dramatic jump? At the end of the day, it is all about the shift from volume-based reimbursement (fee for service) to value-based reimbursement. ACOs are a means to an end, not the end itself. If we will get paid for squeezing waste out of our current system and look at the best way to do it, the elements of an ACO logically fall into place.2
We attribute the big jump in primary care participation to three main factors:
1. Primary care will drive value.
The highest-impact targets for ACOs are:
• Prevention and wellness.
• Chronic disease management.
• Care transitions and navigation.
• Reduced hospitalizations.
• Multispecialty care coordination of complex patients.
While not a monopoly of primary care, all of these opportunities are in your wheelhouse. That is why the Medicare Shared Savings Program ACO regulations correctly require every ACO to include primary care providers. Consequently, primary care providers are being heavily recruited by ACOs.
2. Primary care will derive benefits.
Most ACOs are compensated by receiving some percentage, usually 50%, of savings for a patient population if quality and patient satisfaction metrics are also met. For an ACO to be successful, distribution of savings should be in proportion to their contribution. Primary care physicians should contract only with ACOs that recognize this fundamental connection.
The distribution must be an incentive for every participant to contribute as much value as possible. That will not happen unless the savings distribution is based on merit. As noted, primary care stands to contribute more value, and thus merit more distributions, than any other ACO participant.
The dysfunctions of the fee-for-service system have left primary care underpaid. Now, with the compensation model shifting leverage from costs to savings, primary care physicians are stepping up to close this gap.
3. Primary care is realizing that ACOs are for real.
The move to value-based reimbursement is being driven by unsustainable health care costs, not "Obamacare" or the U.S. Supreme Court. The "fiscal cliff" will have more impact on the growth of ACOs than the Affordable Care Act, as it is forcing us to look at the main drivers of the deficit – entitlements such as Social Security, Medicaid, and Medicare. Notwithstanding, many physicians were waiting until after the election to get serious about ACOs.
3a. This column
(Just kidding!)
So, for these reasons, it is not surprising that primary care physicians are now jumping into ACOs. That said, it is still pretty startling to see a 250% increase in 1 year, which was probably a 250% jump from the year before. Thank you for stepping up to help save American health care.
References
1. Accountable Care Organizations: How Will Payer and Provider Adoption of This Model Impact Prescribing Trends in Cardiometabolic Diseases? Decision Resources, October 2012.
2. As covered in prior articles, besides value-based reimbursement, there are seven other essential elements for a successful ACO: primary care, culture, administration, information technology, patient engagement, scale, and best practices.
Mr. Bobbitt is a senior partner and head of the Health Law Group at the Smith Anderson law firm in Raleigh, N.C. He has many years’ experience assisting physicians to form integrated delivery systems. He has spoken and written nationally to primary care physicians on the strategies and practicalities of forming or joining ACOs. This article is meant to be educational and does not constitute legal advice. For additional information, readers may contact the author at [email protected] or 919-821-6612.
Tailored Health IT Improves VTE Rates
Electronic decision support significantly improves VTE prophylaxis and hospital-acquired VTE rates, according to a new study in the Journal of Hospital Medicine.
The report, "Improving Hospital Venous Thromboembolism Prophylaxis With Electronic Decision Report," saw overall medical service prophylaxis rise to 82.1% from 61.9% (P<0.001) and pharmacologic VTE prophylaxis increase to 74.5% from 59% (P<0.001).
"Healthcare leaders talk about information technology (IT) as a means toward effecting improvements in quality and patient safety and, most of the time, they view that and discuss that in terms of the actual IT system being implemented," says lead author Rohit Bhalla, MD, MPH, associate professor of clinical medicine at Albert Einstein College of Medicine in New York City. "What our intervention really got to was once you've implemented an IT system ... how can it be modified, vis-à-vis decision support, so that it provides an even better result than you get with the product that comes out of the box."
Tailoring a health IT system to improve outcomes requires interdisciplinary work that includes quality officers, physicians, IT staff, and programmers. Hospitalist and fellow author Jason Adelman, MD, MS, patient safety officer at Montefiore Medical Center in the Bronx, N.Y., where the study was conducted, says that the research can help generate future buy-in from physicians who don't value electronic decision support tools.
It can "ease the swallowing of the bitter pill to know that it really makes a difference," Dr. Adelman says. "Don't be up in arms when you're forced to do something a little bit extra, because it really works."
Visit our website for more information about health information technology.
TeamSTEPPS Initiative Teaches Teamwork to Healthcare Providers
University of Minnesota hospitalist Karyn Baum, MD, MSEd, directs one of six regional training centers for Team Strategies and Tools to Enhance Performance and Patient Safety (TeamSTEPPS), an evidence-based, multimedia curriculum, tool set, and system for healthcare organizations to improve their teamwork.
Using the TeamSTEPPS approach, Dr. Baum collaborated with hospitalist Albertine Beard, MD, and the charge nurse on a 28-bed medical unit at the Minneapolis VA Medical Center to present a half-day training session for all VA staff, including four hospitalists. The seminar mixed didactics, discussions, and simulations, similar to traditional role-playing techniques but using a high-fidelity manikin that talks and displays vital signs.
"Teamwork is a set of knowledge, skills, and attitudes that lead to the creation of a culture where it’s about us as a team, not about who is highest in the hierarchy," Dr. Baum says. Hospitalists want to be leaders, "but we have a responsibility to be intentional leaders, learning the skills and modeling them," she adds.
Improved teamwork benefits patients through more effective communication and reduction in medical errors, Dr. Baum says, "but it also helps to create a healthy environment in which to work, where we all have each other’s backs."
TeamSTEPPS, developed jointly by the federal Agency for Healthcare Research and Quality (AHRQ) and the Department of Defense, has reached 25% to 30% of U.S. hospitals by annually training about 700 masters. The masters then go back to their institutions and share the techniques.
Read more about why improving teamwork is good for your patients.
FDA approves teduglutide for short bowel syndrome
The Food and Drug Administration on Dec. 21 approved teduglutide, to be marketed under the trade name Gattex, to treat adults with short bowel syndrome (SBS) who need parenteral nutrition.
Teduglutide, a recombinant analogue of human glucagon-like peptide-2 (GLP-2), was unanimously recommended for approval by an FDA advisory panel in October. It is a once-daily subcutaneous injection that helps improve intestinal absorption of fluids and nutrients, reducing the frequency and volume of parenteral nutrition.
"Considering Gattex has been shown to significantly reduce or in some cases even eliminate the requirement for parenteral support, it may become a cornerstone therapy in the management of short bowel syndrome." Dr. Ken Fujioka of the Nutrition and Metabolic Research Center, Scripps Clinic, Del Mar, Calif., said in a statement issued by Gattex’s maker, NPA Pharmaceuticals.
It is the third drug to be approved by the FDA for SBS patients who are dependent on parenteral nutrition. Somatropin (Zorbtive) was approved in 2003 and glutamine (Nutrestore) in 2004.
"Today’s approval expands the available treatment options for patients with this life-threatening condition," Dr. Victoria Kusiak, deputy director of the Office of Drug Evaluation III in the FDA Center for Drug Evaluation and Research, said in a statement. "Because Gattex may cause other serious health conditions, it is critical that patients and health care professionals understand the drug’s potential and known safety risks."
Teduglutide therapy increases the risk of developing cancer and polyps in the intestine, obstructions in the intestine, gallbladder disease, biliary tract disease, and pancreatic disease. The drug will have a Risk Evaluation and Mitigation Strategy, consisting of a communication plan and training for prescribers, according to the FDA.
Pivotal data on the drug were published in September in Gastroenterology (Gastroenterology 2012 Sept. 13 [doi:10.1053/j.gastro.2012.09.007]).