User login
Advocacy on Healthcare Issues Made Faster, Easier for Hospitalists
Patient-level and institution-level advocacy often come naturally to physicians and health professionals. This level of involvement is integral to providing the best care for patients. Interestingly, a 2006 JAMA study showed that physicians overwhelmingly rated political involvement and collective advocacy as important to their work as healthcare professionals, at 91.6% and 97.0%, respectively. In practice, however, only about a quarter of respondents in the study participated in either type of activity in the past three years.1
Part of SHM’s advocacy goal is to help hospitalists bridge the divide between their attitudes about political advocacy and their behavior.
Any number of barriers might exist for hospitalists to take action and participate in political action and health policy. Anecdotally, these range from a lack of comfort around the issues to lack of time to the opacity of the process to the unclear impact of individual efforts.
As a medical society, SHM serves a pivotal role in representing the views and perspectives of hospitalists in the health policy arena. Still, these efforts could be greatly intensified with more robust involvement from members. One tactic used by the society is advocacy action alerts that encourage members to engage directly with their elected representatives on policy issues of interest to hospitalists.
For example, a recent alert illustrated the potentially devastating impact of the impending budget sequester. As a budget-deficit and spending reduction mechanism, the budget sequester is poised to institute across-the-board cuts to defense and nondefense spending. For its part, the U.S. Department of Health and Human Services will see an approximate 8.2% cut in its budget, removing critical money from health programs and research funding. These are programs and research efforts in which hospitalists participate.
The action alert culminates with a customizable message that can be easily sent to members of Congress. Quick and easy, the action alert allows SHM members to participate in advocacy efforts with very little time investment. By sending messages to Congress, SHM members are able to share their expertise and perspectives on health policy, as both health professionals and constituents.
The impact of a single message to Congress, of course, is not always clear or easily definable. Advocacy, unfortunately, does not often show immediate results and requires a nuanced, multifaceted, long-term strategy. However, input directly from constituents is consistently rated among the most influential tactics for influencing Congress, and that includes emails, phone calls and in-person visits.2
SHM will continue to ask members to join in its advocacy efforts and, at the next annual meeting, invites all members to partake in in-person visits with their members of Congress during Hospitalists on the Hill. Medicine is as much about the systems as it is the one-on-one interactions; politics is no different. By communicating and meeting with lawmakers one on one, SHM members will continue to have a meaningful impact on the policies that frame the healthcare system. Join us as we continue to grow these efforts.
For more information about Hospitalists on the Hill, visit www.hospitalmedicine2013.org/advocacy.
Joshua Lapps is SHM’s government relations specialist.
References
- Gruen RL, Campbell EG, Blumenthal D. Public roles of US physicians: community participation, political involvement, and collective advocacy. JAMA. 2006;296(20):2467-2475.
- The Partnership for A More Perfect Union at the Congressional Management Foundation. Communicating with Congress: Perceptions of Citizen Advocacy on Capitol Hill. Congressional Management Foundation website. Available at: http://www.congressfoundation.org/projects/communicating-with-congress/perceptions-of-citizen-advocacy-on-capitol-hill. Accessed Nov. 1, 2012.
Society of Hospital Medicine's CODE-H Returns in January
Staying up to date on the latest techniques for optimal coding can be daunting, but you don't have to do it alone. SHM's exclusive CODE-H program enables hospitalists (and others in their practice) to learn best practices in coding from national experts in the field. It also allows participants to ask questions of other hospitalists who may be experiencing similar coding challenges.
CODE-H works through SHM's new online collaboration space, HMX (www.hmxchange.org), and provides live webinar sessions with expert faculty, downloadable resources, and a discussion forum for participants to ask questions and provide answers.
Previous CODE-H participants can extend their CODE-H subscriptions. The extension is $300, and free for prior participants who refer an individual or group to CODE-H.
For more information, visit www.hospitalmedicine.org/codeh.
Fellow in Hospital Medicine Spotlight: Leah Berkery, MD, FHM

Undergraduate education: Cornell University, Ithaca, N.Y.
Medical school: Cornell University Medical College, New York City.
Notable: Dr. Berkery formed and developed the VTE prophylaxis committee at St. Peter’s; because of her efforts, appropriate VTE prophylaxis increased to 95% from 75%, new VTE stewardship rounds were created, and the hospital was able to anticipate new VTE preventive-care regulations and respond to them quickly and effectively. Combining her preventive medicine and IT knowledge, she is a member of the St. Peter’s Hospital CareLink Clinical Leadership Team, where she reviews and designs order sets for forthcoming computerized physician order entry (CPOE) systems.
FYI: In her spare time, Dr. Berkery is a Zumba instructor. She is a diehard New York Yankees fan and loves traveling.
Quotable: “My fellow status in SHM demonstrates my commitment to hospital medicine as a lifelong career, and shows that I am dedicated not just to hospital medicine, but to the hospital system itself.”
Financial Support Increases for Hospital Medicine Programs
There are various things that each of us look for in the 2012 State of Hospital Medicine report (www.hospitalmedicine.org/survey). Many of us look to see what has happened to compensation, while others look at productivity information. There is also, however, a subset of us that focuses on trends in the financial support for hospitalist programs. Certainly those of us who manage HM practices want to justify to our clients that the cost of our services is appropriate. It’s never easy going to administration and asking for more money in these uncertain times.
Those in the business of providing “turnkey” services often have to ask for more financial support during a contract term in order to keep up with physician salary increases. It’s vital that we understand not just the cost and revenue equation, but also how those factors impact the financial support for the program. With looming budget cuts, uncertainty surrounding the impacts of value-based purchasing, readmission penalties, and a stagnant economy, we must continue to ensure that our programs are cost-efficient, all the while maintaining quality patient care.

The 2012 State of Hospital Medicine report shows that the cost of providing hospitalist services is on the rise (see Table 1). The median level of financial support per FTE for nonacademic HM groups serving adults was $140,204. This figure is up 6.6% from the 2011 median of $131,564. There are regional differences in the data, with the median support cost highest in the South at $159,258 per FTE. This might be due to the fact that hospitalist compensation tends to be higher in the South than in other parts of the country, while professional fee reimbursements tend to be lower. Another finding borne out by the data is that very small programs tend to require more financial support per FTE than do larger programs. This makes sense given the ability to spread fixed costs out over the larger model and the increased productivity that comes with the larger model.
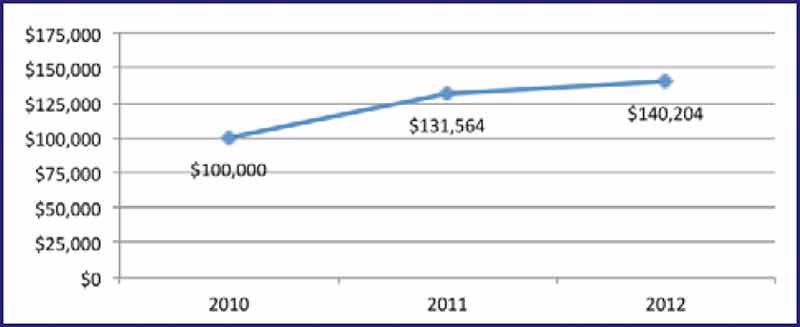
The 2012 State of Hospital Medicine report also offers a unique opportunity to look at factors that might be contributing to the increase in financial support. Compensation, or labor cost, which constitutes the majority of program costs, rose 6% to $233,855 for adult medicine hospitalists. At the same time, the median number of annual encounters for adult hospitalists declined by 6.4% from the 2011 level, while collections per encounter for adult hospitalists increased 13%. The intersection of all these variables (compensation, encounters, collections, and even size and staffing models) affect the cost of a program and the resulting support required to operate it.
In a time of uncertainty about where healthcare is headed, we need as much information as possible to make informed decisions. It is crucially important that we understand the relationships between physician compensation, the scope of our service, the revenue we generate, and the impact these factors have on cost.
The 2012 State of Hospitalist Medicine report is the best source for all of us to get the information we need to make these informed decisions. I would encourage every HM leader to review and understand the information that is so critical to the success of any hospitalist program.
Dan Fuller is president and founder of IN Compass Health and is a member of SHM’s Practice Analysis Committee.
There are various things that each of us look for in the 2012 State of Hospital Medicine report (www.hospitalmedicine.org/survey). Many of us look to see what has happened to compensation, while others look at productivity information. There is also, however, a subset of us that focuses on trends in the financial support for hospitalist programs. Certainly those of us who manage HM practices want to justify to our clients that the cost of our services is appropriate. It’s never easy going to administration and asking for more money in these uncertain times.
Those in the business of providing “turnkey” services often have to ask for more financial support during a contract term in order to keep up with physician salary increases. It’s vital that we understand not just the cost and revenue equation, but also how those factors impact the financial support for the program. With looming budget cuts, uncertainty surrounding the impacts of value-based purchasing, readmission penalties, and a stagnant economy, we must continue to ensure that our programs are cost-efficient, all the while maintaining quality patient care.
The 2012 State of Hospital Medicine report shows that the cost of providing hospitalist services is on the rise (see Table 1). The median level of financial support per FTE for nonacademic HM groups serving adults was $140,204. This figure is up 6.6% from the 2011 median of $131,564. There are regional differences in the data, with the median support cost highest in the South at $159,258 per FTE. This might be due to the fact that hospitalist compensation tends to be higher in the South than in other parts of the country, while professional fee reimbursements tend to be lower. Another finding borne out by the data is that very small programs tend to require more financial support per FTE than do larger programs. This makes sense given the ability to spread fixed costs out over the larger model and the increased productivity that comes with the larger model.
The 2012 State of Hospital Medicine report also offers a unique opportunity to look at factors that might be contributing to the increase in financial support. Compensation, or labor cost, which constitutes the majority of program costs, rose 6% to $233,855 for adult medicine hospitalists. At the same time, the median number of annual encounters for adult hospitalists declined by 6.4% from the 2011 level, while collections per encounter for adult hospitalists increased 13%. The intersection of all these variables (compensation, encounters, collections, and even size and staffing models) affect the cost of a program and the resulting support required to operate it.
In a time of uncertainty about where healthcare is headed, we need as much information as possible to make informed decisions. It is crucially important that we understand the relationships between physician compensation, the scope of our service, the revenue we generate, and the impact these factors have on cost.
The 2012 State of Hospitalist Medicine report is the best source for all of us to get the information we need to make these informed decisions. I would encourage every HM leader to review and understand the information that is so critical to the success of any hospitalist program.
Dan Fuller is president and founder of IN Compass Health and is a member of SHM’s Practice Analysis Committee.
Journal of Hospital Medicine (JHM) Goes Monthly
The Journal of Hospital Medicine (JHM), SHM’s specialty-leading, peer-reviewed journal, will go from publishing nine issues each year to publishing 12 monthly issues, starting with the January 2013 issue.
The expansion is a natural but important one to editor in chief Andrew D. Auerbach, MD, MPH. Specifically, it is a positive indicator for the entire specialty.
“The transition to a monthly publication is an important milestone for JHM, because it means the field of hospital medicine continues to grow as an academic discipline in the quality and quantity of the scholarly work it is producing,” Dr. Auerbach says.
In 2012, SHM added additional pages to each JHM issue to accommodate the quantity of accepted submissions to the publication.
The addition of three issues per year is just one of many new developments, Dr. Auerbach adds.
“The journal makes this transition as it also completes implementation of a more efficient peer-review process, which provides excellent feedback to authors in a timely fashion. For example, authors can expect feedback from the journal within 28 days currently, as opposed to 50 or more days in the past,” he says. “This allows JHM and authors to ensure their work is published in a timely manner, which increases impact of the manuscript and furthers the field.”
Established in 2006, the Journal of Hospital Medicine now reaches nearly 9,000 hospitalists and others.
Soaring Healthcare Expenses Draw Attention to Price Transparency As Cost Control
As efforts intensify to rein in the soaring cost of healthcare, greater attention is being paid to the cost-control potential of price transparency. Initially envisioned as a consumer-driven dynamic, price transparency beckons physicians to consider much more seriously the cost impacts of their diagnostic and treatment decisions.
Consumer-Driven Approach
The U.S. Department of Health and Human Services (HHS) regards price transparency as an important weapon in its armamentarium of “value-driven” approaches to drive down the cost of healthcare. By unleashing the energy of the savvy shopper and empowering consumers with the ability to compare the price and quality of healthcare services, they can make informed choices of their doctors and hospitals. In turn, HHS hopes to motivate the entire system to provide better care for less money.
That “empowered consumerism” principle is the guiding impetus for the Affordable Care Act’s state-regulated health insurance exchange apparatus, which, beginning in 2014, will present a side-by-side comparison of health plan choices, premium costs, and out-of-pocket copays in a way that is designed to help consumers shop for better-value health plans.
Some health plans are using price transparency to nudge consumers to choose lower-cost healthcare service options. Anthem BlueCross BlueShield, for example, has launched the Compass SmartShopper program (www.compasssmartshopper.com), which gives members in New Hampshire, Connecticut, and Indiana $50 to $200 if they get a diagnostic test or surgical procedure at a less expensive facility. Anthem notes that the cost for the same service can vary greatly. For example, hernia repairs range in price from $4,026 to $7,498, and colonoscopies range from $1,450 to $2,973.
New price transparency tools also are available (HealthCareBlueBook.com and FairHealthConsumer.org, for example) to help consumers who face high deductibles or out-of-pocket costs to find “fair prices” for surgeries, hospital stays, doctor visits, and medical tests—and shop accordingly.
Despite these developments, however, there is limited evidence that the “empowered consumerism” approach to price transparency will spur consumers to choose lower-cost providers. Some experts note that many consumers equate higher-cost providers with higher quality, and caution that healthcare cost-profiling initiatives might even have the perverse effect of deterring them from seeking these providers.1 Cost measures, they argue, must be tied to quality information in order to neutralize the typical association of high costs with higher quality.1
Provider-Driven Approach
There are healthcare price transparency initiatives that address the supply side of the healthcare cost equation. These initiatives seek to educate physicians about the ways in which their clinical decisions drive cost and affect what patients pay for care. Some believe that this approach has the potential to make a much bigger dent in cost containment than the empowered-consumerism approach.
“Ninety percent of healthcare cost comes from a physician’s pen, but a lot of that spending doesn’t help patients get better,” says Neel Shah, MD, a Harvard-affiliated OBGYN and executive director of Costs of Care (www.costsofcare.org), a nonprofit aimed at empowering both patients and their caregivers to deflate medical bills. The challenge, he adds, is making physicians aware of how their decisions can inflate costs unnecessarily, and giving them the training and tools they need to take appropriate action.
“Just as the patient-safety movement helped caregivers think about how to prevent unintended harm, a new movement is needed to educate doctors, nurses, and other caregivers about the cost and value of their decisions, so they can avoid waste and protect patients from unintended financial harms as well,” Dr. Shah says.
Costs of Care recently launched its Teaching Value Project, which employs Web-based video education modules to help medical students and residents learn to optimize both quality and cost in clinical decision-making.
“We’re also developing an iPhone app to put cost and quality information at physicians’ fingertips at the critical moment when medical decisions are made,” Dr. Shah adds. “Just being able to see the price variation—an ultrasound versus a CT scan, a generic versus a brand-name medication, or the cost of a marginally valuable test—can help drive physician ordering behavior.”
Hospitalist Impacts
Robert A. Bessler, MD, CEO of Tacoma, Wash.-based hospitalist management firm Sound Physicians, says his hospitalists spend about $2 million a year “with their pen or computerized physician order entry.” A quarter of the cost is pharmacy-related, and the “majority of the rest is from bed-days.”
“The most expensive thing we do is make the decision to admit,” Dr. Bessler notes. “With hospitals switching from revenue centers to cost centers in a population health/ACO [accountable-care organization] environment, an increasingly important part of the hospitalist’s job will be asking
questions, such as, ‘Could this patient go to a nursing home tonight from the ER?’ and ‘Can my colleague in the post-acute environment take care of this patient, with the same effective outcome, if we provide more intense services in the nursing home, going forward?’”
Because most diagnostic testing is done on the front end of an inpatient’s stay, the hospitalist’s main contribution to cost control is to get that diagnosis right and use consults to answer specific questions, Dr. Bessler explains. “There is a direct correlation between the number of consults and the volume of procedures which lead to higher inpatient costs,” he adds.
As hospitals convert to value-based care models, and pressure increases on hospitalists to ramp up their analysis and sharing of cost data and resource utilization, not all physicians will find that conversion easy.

—Neel Shah, MD, executive director, Costs of Care
“We are trained to take good care of our patients, not to be financial stewards of the healthcare system,” says SHM Public Policy Committee member Bradley Flansbaum, DO, MPH, SFHM. “Now, physicians are being asked to do both—to watch our resource use without looking like we’re selling out to payors. You’re putting physicians in a difficult position. Will they say to patients, ‘You can’t have this service’? When does being pragmatic stewards of resources become rationing?” he cautions.
Dr. Shah concedes that there is a perceived tension between “what’s best” for my patient and “what’s best” for society. “We, as a profession, haven’t given serious attention to how to navigate those tensions,” he says.
Dr. Flansbaum, a hospitalist at Lenox Hill Hospital in New York City, says it’s time to start down the transparency road.
“Otherwise, we will have a centralized body making these decisions for us,” he says.
Christopher Guadagnino is a freelance medical writer in Philadelphia.
Reference
As efforts intensify to rein in the soaring cost of healthcare, greater attention is being paid to the cost-control potential of price transparency. Initially envisioned as a consumer-driven dynamic, price transparency beckons physicians to consider much more seriously the cost impacts of their diagnostic and treatment decisions.
Consumer-Driven Approach
The U.S. Department of Health and Human Services (HHS) regards price transparency as an important weapon in its armamentarium of “value-driven” approaches to drive down the cost of healthcare. By unleashing the energy of the savvy shopper and empowering consumers with the ability to compare the price and quality of healthcare services, they can make informed choices of their doctors and hospitals. In turn, HHS hopes to motivate the entire system to provide better care for less money.
That “empowered consumerism” principle is the guiding impetus for the Affordable Care Act’s state-regulated health insurance exchange apparatus, which, beginning in 2014, will present a side-by-side comparison of health plan choices, premium costs, and out-of-pocket copays in a way that is designed to help consumers shop for better-value health plans.
Some health plans are using price transparency to nudge consumers to choose lower-cost healthcare service options. Anthem BlueCross BlueShield, for example, has launched the Compass SmartShopper program (www.compasssmartshopper.com), which gives members in New Hampshire, Connecticut, and Indiana $50 to $200 if they get a diagnostic test or surgical procedure at a less expensive facility. Anthem notes that the cost for the same service can vary greatly. For example, hernia repairs range in price from $4,026 to $7,498, and colonoscopies range from $1,450 to $2,973.
New price transparency tools also are available (HealthCareBlueBook.com and FairHealthConsumer.org, for example) to help consumers who face high deductibles or out-of-pocket costs to find “fair prices” for surgeries, hospital stays, doctor visits, and medical tests—and shop accordingly.
Despite these developments, however, there is limited evidence that the “empowered consumerism” approach to price transparency will spur consumers to choose lower-cost providers. Some experts note that many consumers equate higher-cost providers with higher quality, and caution that healthcare cost-profiling initiatives might even have the perverse effect of deterring them from seeking these providers.1 Cost measures, they argue, must be tied to quality information in order to neutralize the typical association of high costs with higher quality.1
Provider-Driven Approach
There are healthcare price transparency initiatives that address the supply side of the healthcare cost equation. These initiatives seek to educate physicians about the ways in which their clinical decisions drive cost and affect what patients pay for care. Some believe that this approach has the potential to make a much bigger dent in cost containment than the empowered-consumerism approach.
“Ninety percent of healthcare cost comes from a physician’s pen, but a lot of that spending doesn’t help patients get better,” says Neel Shah, MD, a Harvard-affiliated OBGYN and executive director of Costs of Care (www.costsofcare.org), a nonprofit aimed at empowering both patients and their caregivers to deflate medical bills. The challenge, he adds, is making physicians aware of how their decisions can inflate costs unnecessarily, and giving them the training and tools they need to take appropriate action.
“Just as the patient-safety movement helped caregivers think about how to prevent unintended harm, a new movement is needed to educate doctors, nurses, and other caregivers about the cost and value of their decisions, so they can avoid waste and protect patients from unintended financial harms as well,” Dr. Shah says.
Costs of Care recently launched its Teaching Value Project, which employs Web-based video education modules to help medical students and residents learn to optimize both quality and cost in clinical decision-making.
“We’re also developing an iPhone app to put cost and quality information at physicians’ fingertips at the critical moment when medical decisions are made,” Dr. Shah adds. “Just being able to see the price variation—an ultrasound versus a CT scan, a generic versus a brand-name medication, or the cost of a marginally valuable test—can help drive physician ordering behavior.”
Hospitalist Impacts
Robert A. Bessler, MD, CEO of Tacoma, Wash.-based hospitalist management firm Sound Physicians, says his hospitalists spend about $2 million a year “with their pen or computerized physician order entry.” A quarter of the cost is pharmacy-related, and the “majority of the rest is from bed-days.”
“The most expensive thing we do is make the decision to admit,” Dr. Bessler notes. “With hospitals switching from revenue centers to cost centers in a population health/ACO [accountable-care organization] environment, an increasingly important part of the hospitalist’s job will be asking
questions, such as, ‘Could this patient go to a nursing home tonight from the ER?’ and ‘Can my colleague in the post-acute environment take care of this patient, with the same effective outcome, if we provide more intense services in the nursing home, going forward?’”
Because most diagnostic testing is done on the front end of an inpatient’s stay, the hospitalist’s main contribution to cost control is to get that diagnosis right and use consults to answer specific questions, Dr. Bessler explains. “There is a direct correlation between the number of consults and the volume of procedures which lead to higher inpatient costs,” he adds.
As hospitals convert to value-based care models, and pressure increases on hospitalists to ramp up their analysis and sharing of cost data and resource utilization, not all physicians will find that conversion easy.
—Neel Shah, MD, executive director, Costs of Care
“We are trained to take good care of our patients, not to be financial stewards of the healthcare system,” says SHM Public Policy Committee member Bradley Flansbaum, DO, MPH, SFHM. “Now, physicians are being asked to do both—to watch our resource use without looking like we’re selling out to payors. You’re putting physicians in a difficult position. Will they say to patients, ‘You can’t have this service’? When does being pragmatic stewards of resources become rationing?” he cautions.
Dr. Shah concedes that there is a perceived tension between “what’s best” for my patient and “what’s best” for society. “We, as a profession, haven’t given serious attention to how to navigate those tensions,” he says.
Dr. Flansbaum, a hospitalist at Lenox Hill Hospital in New York City, says it’s time to start down the transparency road.
“Otherwise, we will have a centralized body making these decisions for us,” he says.
Christopher Guadagnino is a freelance medical writer in Philadelphia.
Reference
Miscommunication Sometimes a Stumbling Block in Hospitalist-Provider Interactions

—Tracy Cardin, ACNP-BC, nurse practitioner, hospital medicine section, University of Chicago Medical Center, Team Hospitalist member
As leaders of patient-care teams, hospitalists communicate with a wide array of care providers—case managers, nurses, pharmacists, trainees, and social workers to name a few. When the number of regular contacts increases, so, too, does the chance for miscommunication.
“Hospitalists are very non-discriminatory. We can miscommunicate with anybody,” says Jack Percelay, MD, FAAP, MP, SFHM, a pediatric hospitalist at Hunterdon Medical Center in New York City. “We all get burned at different times and that reminds us of the need to be careful, redundant, and very specific when communicating.”
How a hospitalist expresses important information with members of the care team affects the quality of patient care and the efficiency with which it’s delivered, says Sandeep Sachdeva, MD, FACP, a hospitalist at Swedish Medical Center in Seattle and a clinical assistant professor of medicine at the University of Washington. The following five scenarios demonstrate general areas of hospitalist-provider miscommunication and corrective actions that can be taken to reduce communication errors.
Facilitate Teamwork
Scenario: An attending hospitalist quickly discusses with residents the plan of care for several patients and doesn’t invite questions, assuming the residents understand everything he is saying. For the most part, the residents comprehend the information, but some are uncertain on the more complex points. Nonetheless, no one asks questions for fear of being perceived as unintelligent or unprepared.
Corrective action: Miscommunication often is not about what’s said, but about what’s unsaid, says Sandeep Sachdeva, MD, FACP, a hospitalist at Swedish Medical Center in Seattle and a clinical assistant professor of medicine at the University of Washington. Opportunities for communication are missed when hierarchical barriers lead more experienced physicians to skip over information they believe others know and less experienced physicians to refrain from asking questions, he says.
Adopting a team approach that encourages inquiry helps to open lines of communication between attendings and residents, Dr. Sachdeva says. “In my experience, the more questions I ask not only helps me, but helps the other person, too,” he says. “The intellectual back and forth stimulates the mind and fosters collaboration.”
To facilitate teamwork, hospitalists must be respectful of other people’s experience, Dr. Percelay says.
“A hospitalist might feel his knowledge area is up to a level 8 out of 10, but he has to realize that something very clear to him won’t be as clear to someone used to working at the 5 or 6 level,” he says. “The hospitalist really needs to talk out loud and explain the situation to make sure everyone is on the same page.”
Seek to Understand
Scenario: A nurse practitioner comprehensively communicates the plan of care to a patient and her family. A short time later, and before advising the nurse practitioner, a hospitalist visits the patient and outlines substantial changes to the plan. The nurse practitioner loses credibility with the patient and family, and throughout the rest of the hospital stay the patient questions the accuracy of the information the nurse practitioner provided. The patient also wonders if the entire HM team is on the same page and providing a high level of care.
Corrective action: A hospitalist should communicate changes in a patient’s plan of care with all pertinent care-team members before informing the patient or the family, says Tracy Cardin, ACNP-BC, a nurse practitioner in the hospital medicine section at University of Chicago Medical Center and Team Hospitalist member.
It demonstrates to the patient that the HM team is in sync and avoids patient confusion. It also gives the hospitalist and team members an opportunity to discuss the change and the reasoning behind it, Cardin says.
“I think it’s important for hospitalists to stop and understand where other providers are coming from before they try to make themselves understood,” she says. “Once they understand why someone is proposing to manage a patient a certain way, it may help them communicate their plan and what they want to do differently.”
By first seeking to understand, Cardin says, a hospitalist might also realize that their plan isn’t the best option, or that a better plan can be developed through compromise.
“There have been times where I’ve had a particular treatment modality that I believed was correct and a non-physician provider recommended another, and I leaned toward what they recommended because they presented a solid case for it,” says O’Neil Pyke, MD, SFHM, chief medical officer for Medicus Healthcare Solutions, a healthcare consulting and staffing company based in Salem, N.H. “Similarly, there have been times where they’ve explained their treatment plan and I’ve said no.”
The key is listening before making a final decision, he notes.
Standardize Handoffs
Scenario: A hospitalist signing out fails to communicate a patient’s end-of-life wishes to the hospitalist assuming care. The patient has a DNR, however, when the patient stops breathing, a Code Blue is called and the patient is revived.
Corrective action: It’s essential for hospitalist teams to adopt a standard process for handing off patients to new providers during shift changes, says Peter Thompson, MD, chief of clinical operations for Apogee Physicians, a physician-owned and operated hospitalist group based in Phoenix.
Mandatory off-service notes that follow a set template are one simple approach, says Kenneth G. Simone, DO, SFHM, president of Hospitalist and Practice Solutions, a hospitalist practice management consultation company based in Veazie, Maine. The off-service notes can include a patient’s SOAP (subject, objective, assessment, and plan) note, as well as address code status, current medication list, primary-care physician, and family contact name and number.
“This simple tool dramatically reduces miscommunication and errors that occur during care transitions,” Dr. Simone says. “I implemented this approach when I was directing a hospitalist program and it worked remarkably well.”
Experts agree handoffs always work best when providers can communicate face-to-face. The incoming provider can get a better feel of what’s happening with the patient; the outgoing provider can make sure that the information conveyed is understood, says Christina Lackner, PA-C, lead physician assistant for the Collaborative Inpatient Medical Service (CIMS) at Johns Hopkins Bayview Medical Center in Baltimore.
Regardless of how the handoffs are conducted, Lackner says they should be as detailed as possible.
“Physicians that I’ve gotten the best sign out from are the ones who clearly convey what they want, state specifically what they did and what they’re looking for, and give me a little background on the patient,” she says. “Also, to double check that I’m comprehending the information, they ask me questions to make sure I’m giving them the right answers.”

—O’Neil Pyke, MD, SFHM, chief medical officer, Medicus Healthcare Solutions, Salem, N.H.
Organized Rounds
Scenario: A hospitalist neglects to inform the social worker that a stroke patient is resistant to outpatient physical therapy because he can’t afford the care and lacks a means of transportation to the facility. The social worker spends considerable time arranging for the physical therapy. After being discharged from the hospital, the patient doesn’t adhere to the therapy regimen.
Corrective action: Holding multidisciplinary patient-care rounds in which the social worker and other providers (nurses, pharmacists, case managers, etc.) actively participate can have a positive impact on communication and collaboration, Dr. Simone says. In addition to reviewing the treatment approach and clinical response, teams can discuss discharge planning, insurance coverage, and patient adherence.
“These rounds must be well organized, so they do not become time consuming and decrease the efficiency of all involved,” Dr. Simone says, adding some HM groups impose a time limit of two minutes per patient or discuss only the most acute patients or those approaching discharge.
If interdisciplinary rounds aren’t possible, hospitalists can work with other providers to develop content expectations that should be entered in the patient’s chart daily or as appropriate, Dr, Simone says. Each provider would then be required to read the daily entry in the patient’s progress note.
“As the head of the interdisciplinary team, hospitalists have to make sure what they are trying to do gets dispersed to all the members of the team,” Dr. Pyke says. “The progress record is probably the most consistent way to do that.”
Many electronic health record (EHR) systems don’t provide as much detail as traditional written records, Dr. Pyke says. He advises hospitalists teams use an EHR that, in addition to providing templated information, can transcribe doctors’ dictated notes in real time.
Proven Methods
Scenario: An expensive, broad-spectrum antibiotic is administered to a patient in the ED because doctors haven’t identified the offending organism. Once stabilized, the patient is transferred to the medical floor. Rather than switching to a less expensive, equally effective medication when the culture results come back, the hospitalist continues ordering the expensive drug.
Corrective action: HM teams can develop treatment approaches to common medical conditions based on data in the literature that defines best practices, Dr. Simone says. These evidence-based clinical order sets can be pre-printed so that each hospitalist can approach the same diagnostic workup and treatment in a standardized manner.
“It encourages physicians to utilize proven methods,” he says.
Dr. Pyke recommends hospitalists input medication orders in the computer system. Physician order entry forces the hospitalist to look at the patient record, which makes it more likely they order the appropriate intervention, he says.
“Because the physician is going off of solid information about that particular patient, there’s less chance of a mistake happening or something getting overlooked,” Dr. Pyke says.
Lisa Ryan is a freelance writer in New Jersey.
—Tracy Cardin, ACNP-BC, nurse practitioner, hospital medicine section, University of Chicago Medical Center, Team Hospitalist member
As leaders of patient-care teams, hospitalists communicate with a wide array of care providers—case managers, nurses, pharmacists, trainees, and social workers to name a few. When the number of regular contacts increases, so, too, does the chance for miscommunication.
“Hospitalists are very non-discriminatory. We can miscommunicate with anybody,” says Jack Percelay, MD, FAAP, MP, SFHM, a pediatric hospitalist at Hunterdon Medical Center in New York City. “We all get burned at different times and that reminds us of the need to be careful, redundant, and very specific when communicating.”
How a hospitalist expresses important information with members of the care team affects the quality of patient care and the efficiency with which it’s delivered, says Sandeep Sachdeva, MD, FACP, a hospitalist at Swedish Medical Center in Seattle and a clinical assistant professor of medicine at the University of Washington. The following five scenarios demonstrate general areas of hospitalist-provider miscommunication and corrective actions that can be taken to reduce communication errors.
Facilitate Teamwork
Scenario: An attending hospitalist quickly discusses with residents the plan of care for several patients and doesn’t invite questions, assuming the residents understand everything he is saying. For the most part, the residents comprehend the information, but some are uncertain on the more complex points. Nonetheless, no one asks questions for fear of being perceived as unintelligent or unprepared.
Corrective action: Miscommunication often is not about what’s said, but about what’s unsaid, says Sandeep Sachdeva, MD, FACP, a hospitalist at Swedish Medical Center in Seattle and a clinical assistant professor of medicine at the University of Washington. Opportunities for communication are missed when hierarchical barriers lead more experienced physicians to skip over information they believe others know and less experienced physicians to refrain from asking questions, he says.
Adopting a team approach that encourages inquiry helps to open lines of communication between attendings and residents, Dr. Sachdeva says. “In my experience, the more questions I ask not only helps me, but helps the other person, too,” he says. “The intellectual back and forth stimulates the mind and fosters collaboration.”
To facilitate teamwork, hospitalists must be respectful of other people’s experience, Dr. Percelay says.
“A hospitalist might feel his knowledge area is up to a level 8 out of 10, but he has to realize that something very clear to him won’t be as clear to someone used to working at the 5 or 6 level,” he says. “The hospitalist really needs to talk out loud and explain the situation to make sure everyone is on the same page.”
Seek to Understand
Scenario: A nurse practitioner comprehensively communicates the plan of care to a patient and her family. A short time later, and before advising the nurse practitioner, a hospitalist visits the patient and outlines substantial changes to the plan. The nurse practitioner loses credibility with the patient and family, and throughout the rest of the hospital stay the patient questions the accuracy of the information the nurse practitioner provided. The patient also wonders if the entire HM team is on the same page and providing a high level of care.
Corrective action: A hospitalist should communicate changes in a patient’s plan of care with all pertinent care-team members before informing the patient or the family, says Tracy Cardin, ACNP-BC, a nurse practitioner in the hospital medicine section at University of Chicago Medical Center and Team Hospitalist member.
It demonstrates to the patient that the HM team is in sync and avoids patient confusion. It also gives the hospitalist and team members an opportunity to discuss the change and the reasoning behind it, Cardin says.
“I think it’s important for hospitalists to stop and understand where other providers are coming from before they try to make themselves understood,” she says. “Once they understand why someone is proposing to manage a patient a certain way, it may help them communicate their plan and what they want to do differently.”
By first seeking to understand, Cardin says, a hospitalist might also realize that their plan isn’t the best option, or that a better plan can be developed through compromise.
“There have been times where I’ve had a particular treatment modality that I believed was correct and a non-physician provider recommended another, and I leaned toward what they recommended because they presented a solid case for it,” says O’Neil Pyke, MD, SFHM, chief medical officer for Medicus Healthcare Solutions, a healthcare consulting and staffing company based in Salem, N.H. “Similarly, there have been times where they’ve explained their treatment plan and I’ve said no.”
The key is listening before making a final decision, he notes.
Standardize Handoffs
Scenario: A hospitalist signing out fails to communicate a patient’s end-of-life wishes to the hospitalist assuming care. The patient has a DNR, however, when the patient stops breathing, a Code Blue is called and the patient is revived.
Corrective action: It’s essential for hospitalist teams to adopt a standard process for handing off patients to new providers during shift changes, says Peter Thompson, MD, chief of clinical operations for Apogee Physicians, a physician-owned and operated hospitalist group based in Phoenix.
Mandatory off-service notes that follow a set template are one simple approach, says Kenneth G. Simone, DO, SFHM, president of Hospitalist and Practice Solutions, a hospitalist practice management consultation company based in Veazie, Maine. The off-service notes can include a patient’s SOAP (subject, objective, assessment, and plan) note, as well as address code status, current medication list, primary-care physician, and family contact name and number.
“This simple tool dramatically reduces miscommunication and errors that occur during care transitions,” Dr. Simone says. “I implemented this approach when I was directing a hospitalist program and it worked remarkably well.”
Experts agree handoffs always work best when providers can communicate face-to-face. The incoming provider can get a better feel of what’s happening with the patient; the outgoing provider can make sure that the information conveyed is understood, says Christina Lackner, PA-C, lead physician assistant for the Collaborative Inpatient Medical Service (CIMS) at Johns Hopkins Bayview Medical Center in Baltimore.
Regardless of how the handoffs are conducted, Lackner says they should be as detailed as possible.
“Physicians that I’ve gotten the best sign out from are the ones who clearly convey what they want, state specifically what they did and what they’re looking for, and give me a little background on the patient,” she says. “Also, to double check that I’m comprehending the information, they ask me questions to make sure I’m giving them the right answers.”
—O’Neil Pyke, MD, SFHM, chief medical officer, Medicus Healthcare Solutions, Salem, N.H.
Organized Rounds
Scenario: A hospitalist neglects to inform the social worker that a stroke patient is resistant to outpatient physical therapy because he can’t afford the care and lacks a means of transportation to the facility. The social worker spends considerable time arranging for the physical therapy. After being discharged from the hospital, the patient doesn’t adhere to the therapy regimen.
Corrective action: Holding multidisciplinary patient-care rounds in which the social worker and other providers (nurses, pharmacists, case managers, etc.) actively participate can have a positive impact on communication and collaboration, Dr. Simone says. In addition to reviewing the treatment approach and clinical response, teams can discuss discharge planning, insurance coverage, and patient adherence.
“These rounds must be well organized, so they do not become time consuming and decrease the efficiency of all involved,” Dr. Simone says, adding some HM groups impose a time limit of two minutes per patient or discuss only the most acute patients or those approaching discharge.
If interdisciplinary rounds aren’t possible, hospitalists can work with other providers to develop content expectations that should be entered in the patient’s chart daily or as appropriate, Dr, Simone says. Each provider would then be required to read the daily entry in the patient’s progress note.
“As the head of the interdisciplinary team, hospitalists have to make sure what they are trying to do gets dispersed to all the members of the team,” Dr. Pyke says. “The progress record is probably the most consistent way to do that.”
Many electronic health record (EHR) systems don’t provide as much detail as traditional written records, Dr. Pyke says. He advises hospitalists teams use an EHR that, in addition to providing templated information, can transcribe doctors’ dictated notes in real time.
Proven Methods
Scenario: An expensive, broad-spectrum antibiotic is administered to a patient in the ED because doctors haven’t identified the offending organism. Once stabilized, the patient is transferred to the medical floor. Rather than switching to a less expensive, equally effective medication when the culture results come back, the hospitalist continues ordering the expensive drug.
Corrective action: HM teams can develop treatment approaches to common medical conditions based on data in the literature that defines best practices, Dr. Simone says. These evidence-based clinical order sets can be pre-printed so that each hospitalist can approach the same diagnostic workup and treatment in a standardized manner.
“It encourages physicians to utilize proven methods,” he says.
Dr. Pyke recommends hospitalists input medication orders in the computer system. Physician order entry forces the hospitalist to look at the patient record, which makes it more likely they order the appropriate intervention, he says.
“Because the physician is going off of solid information about that particular patient, there’s less chance of a mistake happening or something getting overlooked,” Dr. Pyke says.
Lisa Ryan is a freelance writer in New Jersey.
The Global Hospitalist

Born, raised, educated, and trained in the shadow of the Statue of Liberty, Nick Fitterman, MD, FACP, SFHM, is as New York as New Yorkers get. After 14 years in private practice, he “saw the handwriting on the wall” and founded a hospitalist program in the community hospital down the street. He served six years as HM group director at Huntington (N.Y.) Hospital, immersing himself in patient care and the inner workings of the health system.
Six months ago, he moved into a new, full-time administrative position as medical director of group health management for North Shore Long Island Jewish Health System, a 16-hospital system that includes 408-bed Huntington. The post is in a newly created department and focuses on “connecting parts of our healthcare system that will help serve us in the new landscape of healthcare reform as we move from individual health to population health, as we move from a model of illness to a model of wellness,” he says.
“Parts are already in our system, and my job is to link them together, help build up what needs to be built up, and to fill gaps where they exist,” he says.
Dr. Fitterman, who joined Team Hospitalist earlier this year, plans to continue working a few hospitalist shifts a month with his former group, but his new mission is clear: “Getting providers to recognize the need and the sense of urgency to redesign the way they practice medicine,” he says.
Question: What is the biggest difference between outpatient and inpatient care?
Answer: There are two significant differences. One would be the acuity of the patient. The outpatient is not as acutely ill as those in the hospital. That’s one of the things that drew me to hospital medicine. The other big difference is continuity; it is lost in the hospital. In outpatient medicine, I was able to take care of multiple generations of the same family over many years. In hospital medicine, I would only see an individual patient for three to five days.
Q: What do you like most about working as a hospitalist?
A: I enjoy the challenge of taking care of the acutely ill. An illness may be compressed into a few days, and you need to figure out quickly, and take action that has meaningful impact swiftly. I find that challenging. The other thing that I found quite challenging is the opportunity for hospitalists to help create and execute policy in the hospital that will impact the care of the whole community. As a hospitalist, you can be involved in drafting and executing policy that will impact literally tens of thousands of lives in your community. In your office, you will be more limited to the average 2,500-patient panel that an internist has.
Q: Why have you dedicated yourself to committee work?
A: I encourage any early-career physician to get involved in committees. I entered into a lot of committees … and then I broadened my committee involvement to have a better idea of all the on-goings in the hospital. It also served as a teaching vehicle, to help me understand that people are working on things just like you want to. Committee work allows you to collaborate with people who have mutual interests, instead of feeling like you’re at the end of a process and being prescribed some policy.
Q: It sounds like you’re seeing patients less and doing more what you consider “population health.” How has your experience as a hospitalist helped you in your new position?
A: All of the committee work that I did set the tone for these changes in my career. And that committee work included committee work in my practice, committee work at the hospital, committee work in national organizations, such as SHM and the American College of Physicians.
Q: When you speak about population health, what types of problems and solutions are you looking at?
A: It’s important to recognize that healthcare is only a small part of population health. Now, understanding the other side of social issues that impact our patients, you can bring to them the best healthcare possible, but if we don’t address those other needs or at least recognize them and steer them to a place where they help them with those needs, our care will not be as meaningful as we hope.
Q: Can you give an example?
A: The asthmatic who’s in your ED four times a year and gets excellent care but gets discharged home with an inability to get their medicine or to take their medicines appropriately or to reduce an environmental exposure that keeps triggering the asthmatic exacerbations. These are all the things that population health must now consider. We cannot confine ourselves simply to what we do behind closed doors of the office or within the four walls of a hospital.
Q: How much of your new job is the offspring of regulations coming down the pipe from healthcare reform?
A: Not so much because of the regulations. The changes we are seeing are driven by the market, driven by employers, and by states. Yes, the Affordable Care Act has an impact, but hopefully only to accelerate changes that we already saw taking shape. Our hope is to create a system that will provide that help to the individual and help the population to do that or reduce per-capita cost, but also by enriching the lives of providers and, of course, doing this before the regulations tell us how before someone tells us how to do it.
Q: As a former chief resident, what advice do you have for trainees entering into a new paradigm of medicine?
A: They should consider the population and not just the individual. They should consider the model wellness and not just illness to focus on in an acute-care setting. They should be trained and well-prepared. This is what hospitalist medicine does quite well: to continuously look at quality improvement and PDSA [Plan-Do-Study-Act] cycles. It should be common that they are reviewing quality metrics and planning on how they can get better as a group or even as an individual in a practice and the concept of team medicine.
Q: What is the biggest challenge hospitalists face today?
A: We need to be better versed in the change equation, how to manage change. That’s the biggest challenge.
Q: Tell me about your work with SHM. What does the society mean to you?
A: The society has really helped me understand the process in managing change, in quality-improvement cycles. Having participated in one of the mentored implementation programs [Project BOOST], I was afforded an opportunity to be coached by experts in the field. The toolkits on the SHM website I found very helpful. It was a mini-fellowship, if you will. If I didn’t take the interest that I have in SHM, I don’t think I would have either known the opportunities I have or availed myself of all the opportunities SHM can provide.
Q: What has the senior fellowship in HM meant to you?
A: It was a proud moment standing up with the first class of Senior Fellows in Hospital Medicine. We all recognize the importance of embracing the movement, recognizing the need to help lead this movement, and how we can impact the lives of hospitalist patients in our community by bringing to bear the quality initiatives, the call for focus on quality in hospital medicine that this specialty has.
Richard Quinn is a freelance writer in New Jersey.
Hospitalists Take Greater Role in Assessing and Treating Pain
A multidisciplinary pain-management research group at Mount Sinai School of Medicine in New York City has been evaluating numerical pain-rating scales, independent predictors of severe pain, their association with patient satisfaction rates, and improved inpatient pain outcomes resulting from targeted interventions with physicians. However, they found that while overall pain scores on medicine floors were lower than for surgical patients, they were also less responsive to the targeted interventions.
The group is piloting a program to promote pain champions in its department of medicine and encourage hospitalists to partner with nurses in focusing on pain assessment and treatment.
David L. Reich, MD, an anesthesiologist at Mount Sinai who leads the pain group, and colleagues recently published results from their research in the American Journal of Medical Quality.1 Pain increasingly will be an issue for hospitals and hospitalists, he says, with two pain-related questions now included on the Hospital Consumer Assessment of Healthcare Providers and Systems (HCAHPS) survey that is part of the government’s value-based purchasing initiative.
“It is our belief that unrelieved pain is an overall driver of other patient-reported metrics,” Dr. Reich says.
Andrew Dunn, MD, SFHM, head of the hospitalist service at Mount Sinai, acknowledges that medicine floors have been less successful at improving pain management, in part because the patient population is so much more heterogeneous.
“One thing that did not work was to have the pain team join medical rounds. That’s just not systematic or robust enough,” Dr. Dunn says. “We have piloted a program where patients’ pain scores are now delivered twice a day in reports to nurse managers and floor medical directors.”
Consecutive reports of pain scores of 5 or more (on a scale of 0 to 10) trigger consideration of a consultation with either the anesthesiology pain-management service or palliative-care service.
Reference
iPad Rollout at UC-Irvine Medical Center Prompts Security Measures
The University of California’s Irvine Medical Center has been issuing iPads to its incoming class of 100 medical students and to all 18 resident physicians in its department of emergency medicine.1 The entire medical curriculum is on the iPad and employs document sharing via the SharePoint collaborative software platform, says Adam Gold, the medical center’s director of emerging technologies.
But the use of these new technologies and subsequent clamoring by students, professors, physicians, and other staff to connect their own mobile devices to the network have led to the establishment of security and management guidelines for monitoring technology use, now spelled out in the new “Bring Your Own Device” policy, Gold explains.
Reference
The University of California’s Irvine Medical Center has been issuing iPads to its incoming class of 100 medical students and to all 18 resident physicians in its department of emergency medicine.1 The entire medical curriculum is on the iPad and employs document sharing via the SharePoint collaborative software platform, says Adam Gold, the medical center’s director of emerging technologies.
But the use of these new technologies and subsequent clamoring by students, professors, physicians, and other staff to connect their own mobile devices to the network have led to the establishment of security and management guidelines for monitoring technology use, now spelled out in the new “Bring Your Own Device” policy, Gold explains.