User login
ONLINE EXCLUSIVE: CMO Discusses 7-on/7-off Schedule at Swedish Hospital Medicine in Seattle
Click here to listen to Dr. Danielsson
Click here to listen to Dr. Danielsson
Click here to listen to Dr. Danielsson
Society of Hospital Medicine Launches Online Training Program for Hospitalists
Hospitalists play an increasingly pivotal role in ensuring the highest quality and safety for patients in hospitals. The implementation of healthcare reform has only heightened the importance of hospital quality and patient safety for hospitalists. To enable education and advancement of quality improvement (QI), SHM has developed the Hospital Quality & Patient Safety (HQPS) Online Academy (http://www.hospitalmedicine.org/hqps).
The HQPS Online Academy consists of Internet-based modules that provide training not included in traditional medical education. These modules bridge the gap between the conceptualization and practice of quality in hospitals, helping hospitalists to prepare and lead quality initiatives to improve patient outcomes. The modules allow healthcare providers to explore and evaluate current quality initiatives and practices, as well as reflect on ways to improve core measures within their hospital.
Each module focuses on a core principle of QI and patient safety, and provides three AMA PRA Category 1 credits.
SHM members who are insured with The Doctors Company can earn a 5% risk-management credit by completing the first five HQPS modules (see below). Eligible members also enjoy premium savings through a 5% program discount and a claims-free credit of up to 25%.
HQPS Online Academy modules
- Quality measurement and stakeholder interests
- Teamwork and communication
- Organizational knowledge and leadership skills
- Patient safety principles
- Quality and safety improvement methods and skills (RCA and FMEA)
Survey Shows Five-Year Decrease in Employee Benefits, Paid Time Off for Hospitalists
For the first time in several years, SHM included questions about employee benefits and paid time off in its 2012 State of Hospital Medicine survey. The median value of benefits per physician FTE reported by HM groups serving adults only was $26,000, according to the 2012 survey. But what a surprise it was when survey respondents in 2007 reported median benefits of $31,900.
I admit to being flummoxed by the decrease. The definition of “benefits” was identical in both surveys. The only difference is that in 2007, SHM collected actual benefit cost for each individual on the individual questionnaire; in 2012, we asked for the average benefits per FTE for the group. One possible explanation is that some respondents simply guessed about the average, because they didn’t have to report data for individual doctors. Of course, it’s also possible that groups are requiring physicians to pay a higher proportion of insurance premiums or are reducing retirement plan contributions due to the weak economy. But in the work I do with hospitalist groups around the country, I rarely see benefit costs below about $35,000.
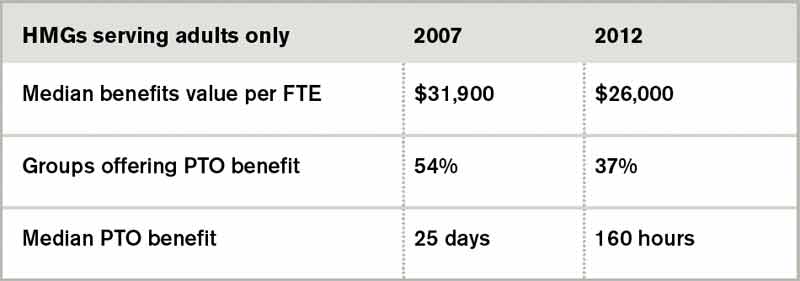
Source: 2012 State of Hospital Medicine report
Another interesting finding from the 2012 survey is that 37% of adult medicine groups reported offering paid time off (PTO), down from 54% in 2007. Even among groups using a seven-on/seven-off schedule, the PTO rate was only 44%. Does this represent a survey design or respondent input error, differences in respondent populations, or an actual shift in the prevalence of PTO benefits? I suspect it’s the latter, because the median amount of PTO time awarded has also declined. In 2007, adult HMGs reported a median of 25 PTO days annually. In 2012, the median for those groups offering PTO was 160 hours of PTO, which represents somewhere around 13 to 20 days, depending on shift length.
Why might PTO benefits be declining? I suppose it could be belt-tightening associated with the poor economy. But I think many HM groups simply have found PTO benefits difficult to administer and fraught with unintended consequences. Many groups are so thinly staffed that for someone to take a PTO day, someone else must work extra to cover. Then, when the covering doctor takes PTO, the first doctor must work extra—effectively offsetting the value of PTO. And if a hospitalist takes PTO and also works extra shifts in the same pay period, do these two offset each other? Or does the doctor get paid for both the PTO days and the extra shift days?
For clinicians such as hospitalists, whose work is defined in highly variable, shift-based schedules that include a lot of night and weekend work, it becomes very difficult to determine which of the days not worked were PTO days versus just days the doctor wasn’t scheduled.
Personally, I don’t think it makes much sense for most hospitalists to have PTO. Don’t get me wrong—I think hospitalists should be paid well and have generous amounts of time off in exchange for long, challenging workdays and a disproportionate amount of night and weekend work. But arbitrarily assigning some of the days not worked as PTO while others are just unscheduled days seems unnecessarily complex.
Time will tell if the specialty as a whole agrees with me or not.
Leslie Flores is a principal in Nelson Flores Hospital Medicine Consultants and a member of SHM’s Practice Analysis Committee.
For the first time in several years, SHM included questions about employee benefits and paid time off in its 2012 State of Hospital Medicine survey. The median value of benefits per physician FTE reported by HM groups serving adults only was $26,000, according to the 2012 survey. But what a surprise it was when survey respondents in 2007 reported median benefits of $31,900.
I admit to being flummoxed by the decrease. The definition of “benefits” was identical in both surveys. The only difference is that in 2007, SHM collected actual benefit cost for each individual on the individual questionnaire; in 2012, we asked for the average benefits per FTE for the group. One possible explanation is that some respondents simply guessed about the average, because they didn’t have to report data for individual doctors. Of course, it’s also possible that groups are requiring physicians to pay a higher proportion of insurance premiums or are reducing retirement plan contributions due to the weak economy. But in the work I do with hospitalist groups around the country, I rarely see benefit costs below about $35,000.
Source: 2012 State of Hospital Medicine report
Another interesting finding from the 2012 survey is that 37% of adult medicine groups reported offering paid time off (PTO), down from 54% in 2007. Even among groups using a seven-on/seven-off schedule, the PTO rate was only 44%. Does this represent a survey design or respondent input error, differences in respondent populations, or an actual shift in the prevalence of PTO benefits? I suspect it’s the latter, because the median amount of PTO time awarded has also declined. In 2007, adult HMGs reported a median of 25 PTO days annually. In 2012, the median for those groups offering PTO was 160 hours of PTO, which represents somewhere around 13 to 20 days, depending on shift length.
Why might PTO benefits be declining? I suppose it could be belt-tightening associated with the poor economy. But I think many HM groups simply have found PTO benefits difficult to administer and fraught with unintended consequences. Many groups are so thinly staffed that for someone to take a PTO day, someone else must work extra to cover. Then, when the covering doctor takes PTO, the first doctor must work extra—effectively offsetting the value of PTO. And if a hospitalist takes PTO and also works extra shifts in the same pay period, do these two offset each other? Or does the doctor get paid for both the PTO days and the extra shift days?
For clinicians such as hospitalists, whose work is defined in highly variable, shift-based schedules that include a lot of night and weekend work, it becomes very difficult to determine which of the days not worked were PTO days versus just days the doctor wasn’t scheduled.
Personally, I don’t think it makes much sense for most hospitalists to have PTO. Don’t get me wrong—I think hospitalists should be paid well and have generous amounts of time off in exchange for long, challenging workdays and a disproportionate amount of night and weekend work. But arbitrarily assigning some of the days not worked as PTO while others are just unscheduled days seems unnecessarily complex.
Time will tell if the specialty as a whole agrees with me or not.
Leslie Flores is a principal in Nelson Flores Hospital Medicine Consultants and a member of SHM’s Practice Analysis Committee.
Hospital Medicine Advocates Aid in Securing $10 Million for National Quality Forum
Hospitalists on the Hill
WHEN: May 16, 2013
WHERE: Washington, D.C.
HOW: Register today at www.hospitalmedicine2013.org/onthehill Space is limited.
The American Taxpayer Relief Act, which was signed into law Jan. 3 to stave off the fiscal cliff, contained a little-mentioned provision that reauthorized $10 million in Medicare funding for the National Quality Forum (NQF). Hospitalists, taking on the role of policy advocates, helped secure this reauthorization and score a victory for national quality-improvement (QI) efforts.
The NQF is a nonprofit organization established to create consensus around national priorities and measures for performing reporting and improvement in healthcare. It receives funding through a variety of sources ranging from public funds, private organizations and membership dues. Since 2009, it has received $10 million annually from a U.S. Department of Health and Human Services contract. That contract, a significant portion of NQF funding, was set to end in 2012.
The Stand for Quality coalition, composed of healthcare organizations supportive of the NQF, helps ensure that Congress sustains funding and support of performance measurement reporting and QI. SHM historically has been a strong proponent of the NQF, pitching in at the start of Stand for Quality four years ago this month. As it became clear that the federal contract for the NQF was not likely to be renewed by Congress for the 2013 calendar year, the member organizations of Stand for Quality were asked to step up to the plate in any way they could.
Jumping at the opportunity to assist, SHM linked hospitalists to their members of Congress in support of the NQF. Through members of SHM's Public Policy and Performance Measurement and Reporting committees, SHM connected with congressional offices and urged them to join a sign-on letter from the office of U.S. Sen. Mark Begich (D-Alaska) office in support of continued NQF funding. Letters between members of Congress are a way that legislators internally lobby on behalf of a particular issue. Hearing from their constituents can help persuade a legislator to act.
Sharing professional expertise also can inform a legislator's decisions. SHM members have a wealth of specialized knowledge and experiences that greatly benefit health policy discussions. In December 2012, SHM was asked to join NQF staffers and several other organizations on Capitol Hill for visits with select members of Congress, including several physician-legislators. These meetings were designed to raise the profile of the important work NQF is doing for QI and to make sure that NQF funding was not forgotten in any debt deal.
Mangla Gulati, MD, FACP, FHM, a hospitalist and SHM member, participated in these visits on behalf of hospital medicine and provided much-needed physician input on the importance of NQF's work.
The benefits of in-person visits are mutual: Members of Congress learn more about the real-life effects of a particular policy and, according to Dr. Gulati, "the visits to the Hill were a very valuable experience and shed a whole new light on the challenges we face in medicine."
Taken together, these advocacy tactics—coalition-building, contacting congressional offices, and in-person visits in Washington—were crucial to securing NQF's funding reauthorization and are critical tools for the advocacy work at SHM. The most concrete and impactful advocacy includes positioning hospitalists on the front line and sharing their perspectives and experiences with policymakers and their staffs.
We hope you'll heed this call and join SHM in Washington, D.C., May 16 for Hospitalists on the Hill, part of SHM's annual meeting. For more information and to register, go to www.hospitalmedicine2013.org/onthehill.
Joshua Lapps is SHM's government relations specialist.
We Welcome the Newest SHM Members
- D. Davis, MD, Alabama
- V. Palabindala, Alabama
- V. Do, Arizona
- G. Khera, MD, Arizona
- A. Afrashteh, MD, California
- P. Alegarbes, California
- J. Close, California
- B. Davis, DO , California
- J. Eng, MD, California
- C. Liao, MD, California
- A. Manoharan, MBBS, California
- K. Martinez, California
- K. Mothkuri, MD, California
- M. Ochner, MD, MPH, California
- T. Ososkova, MD, California
- H. Selke, MD, California
- M. Sethi, MD, California
- S. Sonti, MD, California
- C. Tsay, California
- D. Virnich, MD, MBA, California
- A. Montoya, FNP, Colorado
- J. Nickelsen, MD, Colorado
- V. Kota, MD, Connecticut
- S. Kim, MD, Delaware
- N. Serafimova, MD, Delaware
- S. Brulte, MD, Florida
- A. Camacho, AN P, Florida
- E. Carter, MD, Florida
- C. Cesa, MD, Florida
- K. Eaton, PA-C, Florida
- N. Harris, MD, Florida
- T. Jones, MD, Florida
- A. Karmand, MD, Florida
- A. Laila, MD, Florida
- M. Lane, MD, Florida
- L. Leisch, MD, Florida
- V. Ngo, MD, Florida
- H. Patel, DO , Florida
- M. Pop, MD, Florida
- A. Rahman, MD, Florida
- J. Whynot, MD, Florida
- P. Amene, MBBS, Georgia
- A. Bawa, MD, Georgia
- J. Dee, Georgia
- C. Henritz, DO , Georgia
- Y. Imran, MD, Georgia
- J. Mikell, MD, Georgia
- D. Nagarajan, MD, Georgia
- L. Porter, MD, Georgia
- K. Thykeson, MD, Idaho
- C. Beveridge, Illinois
- R. Helfrich, MD, Illinois
- R. Kellum, MD, Illinois
- T. Mahmood, MD, Illinois
- D. Patel, MD, Illinois
- M. Regala, MD, Illinois
- H. Sandhu, MD, Illinois
- U. Tekin, MD, Illinois
- D. Azad, MD, FACP, MPH, Indiana
- J. Light, MD, Indiana
- P. Marpu, MD, Indiana
- N. Paul, ACNP, Indiana
- C. Bowers, MD, Kansas
- L. Fanucchi, MD, MPH, Kentucky
- S. Kad, MD, FACP, MPH, MS, USAR , Kentucky
HMX Term of the Month: Achievement Points
Awarded to a hospital by comparing an individual hospital’s performance measure rates during a certain period with all hospitals’ rates during the baseline period.
Awarded to a hospital by comparing an individual hospital’s performance measure rates during a certain period with all hospitals’ rates during the baseline period.
Awarded to a hospital by comparing an individual hospital’s performance measure rates during a certain period with all hospitals’ rates during the baseline period.
Fellow in Hospital Medicine Spotlight: Katherine Hochman, MD, MBA, FHM

Dr. Hochman is assistant chief of medicine service and director of the hospitalist program at New York University Medical Center (NYUMC) in New York City. She is a clinical assistant professor at New York University School of Medicine. She earned her Fellow in Hospital Medicine designation in 2008.
Undergraduate education: University of Pennsylvania, Philadelphia.
Medical school: University of Miami Miller School of Medicine.
Notable: In 2004, Dr. Hochman was the first and only hospitalist at NYUMC. Today, there are 23.5 hospitalists in the program, thanks to her work in founding the NYU Hospitalist Group. Although she and her team struggled with recruiting hospitalists to work nights and weekends, her directorship of the NYU Hospitalist Scholars program, which combines clinical work and research mentorship, has helped the group attract physicians for those shifts.
As director, she and other hospitalists have created the NYC Hospitalist Directors’ Consortium, which meets regularly through SHM. Dr. Hochman has mentored and passed on her hospitalist passion to dozens of graduate students, residents, and post-doctoral fellows. As a result of her mentorship and dedication to education, she was awarded the 2003 Firm Chief Award for Outstanding Medical Student Teaching and the 2005 NYU Teacher of the Year Award.
FYI: A mother of three, Dr. Hochman still finds time to follow her passion for museum visits. Her favorite haunt is the Museum of Modern Art. She has even staged innovative team-building events using themed museum tours. She also coaches an indoor soccer club.
Quotable: "The SHM fellowship is an important distinction for me. It shows a continued commitment to the field of hospital medicine."
Is Your Hospital Medicine Group a Good Candidate for Project BOOST?
Does your team have:
- Eagerness to improve their discharge processes and reduce unnecessary readmissions and avoidable adverse events in the post-discharge period?
- A multidisciplinary team in place capable of working collaboratively to redesign existing care processes?
- A dedicated leader to manage the process of tailoring the BOOST intervention to your site’s needs and implementing BOOST?
- Support of at least one executive sponsor who can meet with the team monthly?
- Access to data support personnel needed to collect baseline and post-implementation data?
Soaring Medicare Costs for Unplanned Hospitalizations Underscore Need to Reduce Readmissions
- According to research published in the New England Journal of Medicine, about 1 in 5 hospitalized Medicare beneficiaries were readmitted within 30 days after discharge. Unplanned rehospitalizations cost Medicare $17.4 billion in 2004.
- The Project BOOST toolkit has been downloaded more than 4,000 times.
- Project BOOST has been implemented at more than 150 sites nationwide.
- Early data from six sites that have implemented Project BOOST reveal a reduction in 30-day readmission rates to 11.2% from 14.2%, as well as a 21% reduction in 30-day, all-cause readmission rates.
Source: www.hospitalmedicine.org
Hospitalists Urged to Help Reduce 30-Day Readmission Rate
For hospitals across the country, 2013 is the year to address readmissions and find practical solutions. In January, the Journal of the American Medical Association dedicated
an entire issue to the vexing problem of hospital readmissions. In his audio summary of the issue, JAMA editor Howard Bauchner, MD, notes that it “came together organically,” based on increased submissions and attention to 30-day readmissions.
Among nearly a dozen articles focused on readmissions, discharge, and transitions of care, Project BOOST principal investigator Mark V. Williams, MD, FACP, MHM, makes the case for a community-based approach in an editorial titled “A Requirement to Reduce Readmissions: Take Care of the Patient, Not Just the Disease.” In the piece, he advocates for “broad patient-centered approaches that engage all members of a care team, especially front-line clinicians and use proven quality-improvement [QI] methods.” He goes on to link the concepts to the principles taught by Project BOOST.
After all, readmissions are expensive, and not just for hospitals, which is why private insurers and the Centers for Medicare & Medicaid Services (CMS) are investing resources to improve discharge processes, reduce readmissions, and reduce costs.
Many adverse events that happen after discharge are predictable using assessment tools and methods in the Project BOOST program, Dr. Williams says. Hospitalists can—and should, according to many—improve the system to protect patients.
And while systemwide change doesn’t happen overnight, it does have to start somewhere, as leaders at the 150-plus Project BOOST sites nationwide can attest Now is the time to begin planning to join the Project BOOST 2013 cohort. Applications will be accepted through this summer; training will begin in the fall. But participation is limited, and successful applicants often need time to prepare their applications, which must include letters of support from a site executive and the development of a multidisciplinary team. For more information, visit www.hospitalmedicine.org/boost.
Brendon Shank is SHM’s associate vice president of communications.