User login
Hospital Value‐Based Purchasing
The Centers for Medicaid and Medicare Services' (CMS) Hospital Inpatient Value‐Based Purchasing (VBP) Program, which was signed into law as part of the Patient Protection and Affordable Care Act of 2010, aims to incentivize inpatient providers to deliver high‐value, as opposed to high‐volume, healthcare.[1] Beginning on October 1, 2012, the start of the 2013 fiscal year (FY), hospitals participating in the VBP program became eligible for a variety of performance‐based incentive payments from CMS. These payments are based on an acute care hospital's ability to meet performance measurements in 6 care domains: (1) patient safety, (2) care coordination, (3) clinical processes and outcomes, (4) population or community health, (5) efficiency and cost reduction, and (6) patient‐ and caregiver‐centered experience.[2] The VBP program's ultimate purpose is to enable CMS to improve the health of Medicare beneficiaries by purchasing better care for them at a lower cost. These 3 characteristics of careimproved health, improved care, and lower costsare the foundation of CMS' conception of value.[1, 2] They are closely related to an economic conception of value, which is the difference between an intervention's benefit and its cost.
Although in principle not a new idea, the formal mandate of hospitals to provide high‐value healthcare through financial incentives marks an important change in Medicare and Medicaid policy. In this opportune review of VBP, we first discuss the relevant historical changes in the reimbursement environment of US hospitals that have set the stage for VBP. We then describe the structure of CMS' VBP program, with a focus on which facilities are eligible to participate in the program, the specific outcomes measured and incentivized, how rewards and penalties are allocated, and how the program will be funded. In an effort to anticipate some of the issues that lie ahead, we then highlight a number of potential challenges to the success of VBP, and discuss how VBP will impact the delivery and reimbursement of inpatient care services. We conclude by examining how the VBP program is likely to evolve over time.
HISTORICAL CONTEXT FOR VBP
Over the last decade, CMS has embarked on a number of initiatives to incentivize the provision of higher‐quality and more cost‐effective care. For example, in 2003, CMS implemented a national pay‐for‐performance (P4P) pilot project called the Premier Hospital Quality Incentive Demonstration (HQID).[3, 4] HQID, which ran for 6 years, tracked and rewarded the performance of 216 hospitals in 6 healthcare service domains: (1) acute myocardial infarction (AMI), (2) congestive heart failure (CHF), (3) pneumonia, (4) coronary artery bypass graft surgery, (5) hip and knee replacement surgery, and (6) perioperative management of surgical patients (including prevention of surgical site infections).[4] CMS then introduced its Hospital Compare Web site in 2005 to facilitate public reporting of hospital‐level quality outcomes.[3, 5] This Web site provides the public with access to data on hospital performance across a wide array of measures of process quality, clinical outcomes, spending, and resource utilization.[5] Next, in October 2008, CMS stopped reimbursing hospitals for a number of costly and common hospital‐acquired complications, including hospital‐acquired bloodstream infections and urinary tract infections, patient falls, and pressure ulcers.[3, 6] VBP is the latest and most comprehensive step that CMS has taken in its decade‐long effort to shift from volume to value‐based compensation for inpatient care.
Although CMS appears fully invested in using performance incentives to increase healthcare value, existing evidence of the effects of P4P on patient outcomes remains quite mixed.[7] On one hand, an analysis of an inpatient P4P program sponsored by the United Kingdom's National Health Service's (NHS) suggests that P4P may improve quality and save lives; indeed, hospitals that participated in the NHS P4P program significantly reduced inpatient mortality from pneumonia, saving an estimated 890 lives.[8] Additional empirical work suggests that the HQID was also associated with early improvements in healthcare quality.[9] However, a subsequent long‐term analysis found that participation in HQID had no discernible effect on 30‐day mortality rates.[10] Moreover, a meta‐analysis of P4P incentives for individual practitioners found few methodologically robust studies of P4P for clinicians and concluded that P4P's effects on individual practice patterns and outcomes remain largely uncertain.[11]
VBP: STRUCTURE AND DESIGN
This section reviews the structure of the VBP program. We describe current VBP eligibility criteria and sources of funding for the program, how hospitals participating in VBP are evaluated, and how VBP incentives for FY 2013 have been calculated.
Hospital Eligibility for VBP
All acute care hospitals in the United States (excluding Maryland) that are not psychiatric hospitals, rehabilitation hospitals, long‐term care facilities, children's hospitals, or cancer hospitals are eligible to participate in VBP in FY 2013 (full eligibility criteria is outlined in Table 1). For FY 2013, CMS chose to incentivize measures in just 2 care domains: (1) clinical processes of care and (2) patient experience of care. To be eligible for VBP in FY 2013, a hospital must report at least 10 cases each in at least 4 of 12 measures included in the clinical processes of care domain (Table 2), and/or must have at least 100 completed Hospital Consumer Assessment of Healthcare Providers and Systems (HCAHPS). Designed and validated by CMS, the HCAHPS survey provides hospitals with a standardized instrument for gathering information about patient satisfaction with, and perspectives on, their hospital care.[12] HCAHPS will be used to assess 8 patient experience of care measures (Table 3).
|
| Inclusion criteria |
| Acute care hospital |
| Located in all 50 US states or District of Columbia (excluding Maryland) |
| Has at least 10 cases in at least 4 of 12 clinical process of care measures and/or at least 100 completed HCAHPS surveys |
| Exclusion criteria |
| Psychiatric, rehabilitation, long‐term care, children's or cancer hospital |
| Does not participate in Hospital Inpatient Quality Reporting Program during the VBP performance period |
| Cited by the Secretary of HHS for significant patient safety violations during performance period |
| Hospital does not meet minimum reporting requirements for number of cases, process measures, and surveys needed to participate in VBP |
| Disease Process | Process of Care Measure |
|---|---|
| |
| Acute myocardial infarction | Fibrinolytic therapy received within 30 minutes of hospital arrival |
| Primary percutaneous coronary intervention received within 90 minutes of hospital arrival | |
| Heart failure | Discharge instructions provided |
| Pneumonia | Blood cultures performed in the emergency department prior to initial antibiotic received in hospital |
| Initial antibiotic selection for community‐acquired pneumonia in immunocompetent patient | |
| Healthcare‐associated infections | Prophylactic antibiotic received within 1 hour prior to surgical incision |
| Prophylactic antibiotic selection for surgical patients | |
| Prophylactic antibiotics discontinued within 24 hours after surgery ends | |
| Cardiac surgery patients with controlled 6:00 am postoperative serum glucose | |
| Surgeries | Surgery patients on ‐blocker prior to arrival that received ‐blocker during perioperative period |
| Surgery patients with recommended venous thromboembolism prophylaxis ordered | |
| Surgery patients who received appropriate venous thromboembolism prophylaxis within 24 hours prior to surgery to 24 hours after surgery | |
| Communication with nurses |
| Communication with doctors |
| Responsiveness of hospital staff |
| Pain management |
| Communication about medicines |
| Cleanliness and quietness of hospital environment |
| Discharge information |
| Overall rating of hospital |
Participation in the program is mandatory for eligible hospitals, and CMS estimates that more than 3000 facilities across the United States will participate in FY 2013. Roughly $850 million dollars in VBP incentives will be paid out to these participating hospitals in FY 2013. The program is being financed through a 1% across‐the‐board reduction in FY 2013 diagnosis‐related group (DRG)‐based inpatient payments to participating hospitals. On December 20, 2012, CMS publically announced FY 2013 VBP incentives for all participating hospitals. Each hospital's incentive is retroactive and based on its performance between July 1, 2011 and March 31, 2012.
All data used for calculating VBP incentives is reported to CMS through its Hospital Inpatient Quality Reporting (Hospital IQR) Program, a national program instituted in 2003 that rewards hospitals for reporting designated quality measures. As of 2007, approximately 95% of eligible US hospitals were using the Hospital IQR program.[1] Measures evaluated via chart abstracts and surveys reflect a hospital's performance for its entire patient population, whereas measures assessed with claims data reflect hospital performance only for Medicare patients.
Evaluation of Hospitals
In FY 2013, hospital VBP incentive payments will be based entirely on performance in 2 domains: (1) clinical processes of care (weighted 70%) and (2) patient experience of care (weighted 30%). For each domain, CMS will evaluate each hospital's improvement over time as well as achievement compared to other hospitals in the VBP program. By assessing and rewarding both achievement and improvement, CMS will ensure that lower‐performing hospitals will still be rewarded for making substantial improvements in quality. To evaluate the first metricimprovement over timeCMS will compare a hospital's performance during a given reporting period with its baseline performance 2 years prior to this block of time. A hospital receives improvement points for improving its performance over time. To assess the second metricachievement compared to other hospitals in the VBP programCMS will compare each hospital's performance during a reporting period with the baseline performance (eg, performance 2 years prior to reporting period) of all other hospitals in the VBP program. A hospital is awarded achievement points if its performance exceeds the 50th percentile of all hospitals during the baseline performance period. Improvement scores range from 0 to 9, whereas achievement scores range from 0 to 10. The greater of a hospital's improvement and achievement scores on each VBP measure are used to calculate each hospital's total earned clinical care domain score and total earned HCAHPS base score. Hospitals that lack baseline performance data, which is required to assess improvement, will be evaluated solely on the basis of achievement points.[1] The total earned clinical care domain score is multiplied by 70% to reach the clinical care domain's contribution to a hospital's total performance score.
Each hospital's total patient experience domain, or HCAHPS performance, score consists of 2 components: a total earned HCAHPS base score as described above and a consistency score. The consistency score evaluates the reliability of a hospital's performance across all 8 patient experience of care measures (Table 3). If a hospital is above the 50th percentile of all hospital scores during the baseline period on all 8 measures, then it receives 100% of its consistency points. If a hospital is at the 0 percentile for a given measure, then it receives 0 consistency points for all measures. This provision promotes consistency by harshly penalizing hospitals with extremely poor performance on any 1 specific measure. If 1 or more measures are between the 0 and 50th percentiles, then it will receive a consistency score that takes into account how many measures were below the 50th percentile and their distance from this threshold. Each hospital's total HCAHPS performance score (the sum of total earned HCAHPS base points and consistency points) is then multiplied by 30% to arrive at the patient experience of care domain's contribution to a hospital's total performance score.
Importantly, CMS excluded from its VBP initiative 10 clinical process measures reported in the Hospital IQR Program because they are topped out; that is, almost all hospitals already perform them at very high rates (Table 4). Examples of these topped out process measures include administration of aspirin to all patients with AMI on arrival at the hospital; counseling of patients with AMI, CHF, and pneumonia about smoking cessation; and prescribing angiotensin‐converting enzyme inhibitors or angiotensin receptor blockers to patients with CHF and left ventricular dysfunction.[1]
| Disease Process | Measure |
|---|---|
| |
| Acute myocardial infarction | Aspirin administered on arrival to the emergency department |
| ACEI or ARB prescribed on discharge | |
| Patient counseled about smoking cessation | |
| ‐Blocker prescribed on discharge | |
| Aspirin prescribed at discharge | |
| Heart failure | Patient counseled about smoking cessation |
| Evaluation of left ventricular systolic function | |
| ACEI or ARB prescribed for left ventricular systolic dysfunction | |
| Pneumonia | Patient counseled about smoking cessation |
| Surgical Care Improvement Project | Surgery patients with appropriate hair removal |
Calculation of VBP Incentives and Public Reporting
A hospital's total performance score for FY 2013 is equal to the sum of 70% of its clinical care domain score and 30% of its total HCAHPS performance score. This total performance score is entered into a linear mathematical formula to calculate each hospital's incentive payment. CMS projects that VBP will lead to a net increase in Medicare payments for one‐half of hospitals and a net decrease in payments for the other half of participating facilities.[1]
In December 2012, CMS publicly disclosed information about the initial performance of each hospital in the VBP program. Reported information included: (1) hospital performance for each applicable performance measure, (2) hospital performance by disease condition or procedure, and (3) hospital's total performance score. Initial analyses of this performance data revealed that 1557 hospitals will receive bonus payments under VBP in FY 2013, whereas 1427 hospitals will lose money under this program. Treasure Valley Hospital, a 10‐bed physician‐owned hospital in Boise, Idaho, will receive a 0.83% increase in Medicare payments, the largest payment increase under VBP in 2013. Conversely, Auburn Community Hospital in upstate New York, will suffer the most severe payment reduction: 0.9% per Medicare admission. The penalty will cost Auburn Hospital about $100,000, which is slightly more than 0.1% of its yearly $85 million operating budget.[13] For almost two‐thirds of participating hospitals, FY 2013 Medicare payments will change by 0.25%.[13] Additional information about VBP payments for FY 2013, including the number of hospitals who received VBP incentives and the size and range of these payments, is now accessible to the public through CMS' Hospital Compare Web site (
CHALLENGES OF VBP
As the Medicare VBP program evolves, and hospitals confront ever‐larger financial incentives to deliver high‐value as opposed to high‐volume care, it will be important to recognize limitations of the VBP program as they arise. Here we briefly discuss several conceptual and implementation challenges that physicians and policymakers should consider when assessing the merits of VBP in promoting high‐quality healthcare.
Rigorous and Continuous Evaluation of VBP Programs
The main premise of using VBP to incentivize hospitals to deliver high‐quality cost‐effective care is that the process measures used to determine hospital quality do impact patient outcomes. However, it is already well established that improvements in measures of process quality are not always associated with improvements in patient outcomes.[14, 15, 16] Moreover, incentivizing specific process measures encourages hospitals to shift resources away from other aspects of care delivery, which may have ambiguous, or even deleterious, effects on patient outcomes. Although incentives ideally push hospitals to shift resources away from low‐quality care toward high‐quality care, in practice this is not always the case. Hospital resources may instead be drawn away from areas that are not yet incented by VBP, but for which improvements in quality of care are desperately needed. The same empirical focus behind using VBP to incentivize hospitals to improve patient outcomes efficiently should be used to evaluate whether VBP is continually meeting its stated goals: reducing overall patient morbidity and mortality and improving patient satisfaction at ideally lower cost. The experience of the US education system with public policies designed to improve student testing performance may serve as a cautionary example here. Such policies, which provide financial rewards to schools whose students perform well on standardized tests, can indeed raise testing performance. However, these policies also lead educators to teach to the test, and to neglect important topics that are not tested on standardized exams.[17]
Prioritization of Process Measures
As payment incentives for VBP currently stand, process measures are weighted equally regardless of the clinical benefits they generate and the resources required to achieve improvements in process quality. For instance, 2 process measures, continuing home ‐blocker medications for patients with coronary artery disease undergoing surgery and early percutaneous coronary intervention for patients with AMI, may be weighted equally as process measures although both their clinical benefits and the costs of implementation are very different. Some hospitals responding to VBP incentives may choose to invest in areas where their ability to earn VBP incentive payments is high and the costs of improvement are low, although those areas may not be where interventions are most needed because clinical outcomes could be most improved. Recognizing that process measures have heterogeneous benefits and costs of implementation is important when prioritizing their reimbursement in VBP.
Measuring Improvements in Hospital Quality
Tying hospital financial compensation to hospital quality implies that measures of hospital quality should be robust. To incentivize hospitals to improve quality not only relative to other hospitals but to themselves in the past, the VBP program has established a baseline performance for each hospital. Each hospital is compared to its baseline performance in subsequent evaluation periods. Thus, properly measuring a hospital's baseline performance is important. During a given baseline period, some hospitals may have better or worse outcomes than their steady state due to random variation alone. Some hospitals deemed to have a low baseline will experience improvements in quality that are not related to active efforts to improve quality but through chance alone. Similarly, some hospitals deemed to have a high baseline will experience reductions in quality through chance. Of course, neither of these changes should be subject to differences in reimbursement because they do not reflect actual organizational changes made by the hospitals. The VBP program has made significant efforts to address this issue by requiring participating hospitals to have a large enough sample of cases such that estimated rates of process quality adherence meet a reliability threshold (ie, are likely to be consistent over time rather than vary substantially through chance alone). However, not all process measures exhibit high reliability, particularly those for which adverse events are rare (eg, foreign objects retained after surgery, air embolisms, and blood incompatibility). Ultimately, CMS's decision to balance the need for statistically reliable data with the goal of including as many hospitals as possible in the VBP program will require ongoing reevaluation of this issue.
Choosing Hospital Comparators Appropriately
In the current VBP program, hospitals will be evaluated in part by how they compare to hospitals nationally. However, studies of regional variation in healthcare have demonstrated large variations in practice patterns across the United States,[18, 19, 20] raising the question of whether hospitals should, at least initially, be compared to hospitals in the same geographic area. Although the ultimate goal of VBP should be to hold hospitals to a national standard, local practice patterns are not easily modified within 1‐ to 2‐year timeframes. Initially comparing hospitals to a national rather than local standard may unfairly penalize hospitals that are relative underperformers nationally but overperformers regionally. Although CMS's policy to reward improvement within hospitals over time mitigates issues arising from a cross‐sectional comparison of hospitals, the issue still remains if many hospitals within a region not only underperform relative to other hospitals nationally but also fail to demonstrate improvement. More broadly, this issue extends to differences across hospitals in factors that impact their ability to meet VBP goals. These factors may include, for example, hospital size, profitability, patient case and insurance mix, and presence of an electronic medical record. Comparing hospitals with vastly different abilities to achieve VBP goals and improve quickly may amount to inequitable policy.
Continual Evaluation of Topped‐Out Measures
Process measures that are met at high rates at nearly all hospitals are not used in evaluations by CMS for VBP. An assumption underlying CMS' decision to not reward hospitals for achieving these topped‐out measures is that once physicians and hospitals make cognitive and system‐level improvements that improve process quality, these gains will persist after the incentive is removed. Thus, CMS hopes and anticipates that although performance incentives will make it easier for well‐meaning physicians to learn to do the right thing, doctors will continue to do the right things for patients after these incentives are removed.[21, 22] Although this assumption may generally be accurate, it is important to continue to evaluate whether measures that are currently topped out continue to remain adequately performed, because rewarding new quality measures will necessarily lead hospitals to reallocate resources away from other clinical activities. Although we hope that the continued public reporting of topped‐out measures will prevent declines in performance on these measures, policy makers and clinicians should be aware that the lack of financial incentives for topped‐out measures may result in declines in quality. To this point, an analysis of 35 Kaiser Permanente facilities from 1997 to 2007 demonstrated that the removal of financial incentives for diabetic retinopathy and cervical cancer screening was associated with subsequent declines in performance of 3% and 1.6% per year, respectively.[23]
Will VBP Incentives Be Large Enough to Change Practice Patterns?
The VBP Program's ability to influence change depends, at least in part, on how the incentives offered under this program compare to the magnitude of the investments that hospitals must make to achieve a given reward. In general, larger incentives are necessary to motivate more significant changes in behavior or to influence organizations to invest the resources needed to achieve change. The incentives offered under VBP in FY 2013 are quite modest. Almost two‐thirds of participating hospitals will see their FY 2013 Medicare revenues change by 0.25%, roughly $125,000 at most.[13, 24] Although these incentives may motivate hospitals that can improve performance and achievement with very modest investments, they may have little impact on organizations that need to make significant upfront investments in care processes to achieve sustainable improvements in care quality. As CMS increases the size of VBP incentives over the next 2 to 4 years, it will also hold hospitals accountable for a broader and increasingly complex set of outcomes. Improving these outcomes may require investments in areas such as information technology and process improvement that far surpass the VBP incentive reward.
Moreover, prior research suggests that financial incentives like those available under VBP may contribute only slightly to performance improvements when public reporting already exists. For example, in a 2‐year study of 613 US hospitals implementing pay‐for‐performance plus public reporting or public reporting only, pay for performance plus public reporting was associated with only a 2.6% to 4.1% increase in a composite measure of quality when compared to hospitals with public reporting only.[9] Similarly, a study of 54 hospitals participating in the CMS pay for performance pilot initiative found no significant improvement in quality of care or outcomes for AMI when compared to 446 control hospitals.[25] A long‐term analysis of pay for performance in the Medicare Premier Hospital Quality Incentive Demonstration found that participation in the program had no discernible effect on 30‐day mortality rates.[10] Finally, a study of physician medical groups contracting with a large network healthcare maintenance organization found that the implementation of pay for performance did not result in major before and after improvements in clinical quality compared to a control group of medical groups.[26]
High‐Value Care Is Not Always Low‐Cost Care
Not surprisingly, the clinical process measures included in CMS' hospital VBP program evaluate a select and relatively small group of high‐value and low‐cost interventions (eg, appropriate administration of antibiotics and tight control of serum glucose in surgical patients). However, an important body of work has demonstrated that high‐cost care (eg, intensive inpatient hospital care for common acute medical conditions) may also be highly valuable in terms of improving survival.[20, 27, 28, 29, 30] As the hospital VBP program evolves, its overseers will need to consider whether to include additional incentives for high‐value high‐cost healthcare services. Such considerations will likely become increasingly salient as healthcare delivery organizations move toward capitated delivery models. In particular, the VBP program's Medicare Spending Per Beneficiary measure, which quantifies inpatient and subsequent outpatient spending per beneficiary after a given hospitalization episode, will need to distinguish between higher‐spending hospitals that provide highly effective care (eg, care that reduces mortality and readmissions) and facilities that provide less‐effective care.
FUTURE OF VBP
Although the future of VBP is unknown, CMS is likely to modify the program in a number of ways over the next 3 to 5 years. First, CMS will likely expand the breadth and focus of incentivized measures in the VBP program. In FY 2014, for example, CMS is adding a set of 3, 30‐day mortality outcome measures to VBP: 30‐day risk‐adjusted mortality for AMI, CHF, and pneumonia.[1] A hospital's performance with respect to these outcomes will represent 25% of its total performance score in 2014, whereas the clinical process of care and patient experience of care domains will account for 45% and 30% of this score, respectively. In 2015, patient experience and outcome measures will account for 30% each in a hospital's performance score, whereas process and efficiency measures will each account for 20% of this score, respectively. The composition of this performance score evidences a shift away from rewarding process‐based measures and toward incentivizing measures of clinical outcomes and patient satisfaction, the latter of which may be highly subjective and more representative of a hospital's catchment population than of a hospital's care itself.[31] Additional measures in the domains of patient safety, care coordination, population and community health, emergency room wait times, and cost control may also be added to the VBP program in FY 2015 to FY 2017. Furthermore, CMS will continue to reevaluate the appropriateness of measures that are already included in VBP and will stop incentivizing measures that have become topped out, or are no longer supported by the National Quality Forum.[1, 13]
Second, CMS has established an annual gradual increase of 0.25% in the percentage of each hospital's inpatient DRG‐based payment that is at stake under VBP. In FY 2014, for example, participating hospitals will be required to contribute 1.25% of inpatient DRG payments to the VBP program. This percentage is likely to increase to 2% or more by 2017.[1, 32]
Third, expansions of the VBP program complement a number of other quality improvement efforts overseen by CMS, including the Hospital Readmissions Reduction Program. Effective for discharges beginning on October 1, 2012, hospitals with excess readmissions for AMI, CHF, and pneumonia are at risk for reimbursement reductions for all Medicare admissions in proportion to the rate of excess rehospitalizations. Some of the same concerns about the hospital VBP program outlined above have also been raised for this program, namely, whether readmission penalties will be large enough to impact hospital behavior, whether readmissions are even preventable,[33, 34] and whether adjustments in hospital‐level policies will reduce admissions that are known to be heavily influenced by patient economic and social factors that are outside of a hospital's control.[35, 36] Despite the limitations of VBP and the challenges that lie ahead, there is optimism that rewarding hospitals that provide high‐value rather than high‐volume care will not only improve outcomes of hospitalized patients in the United States, but will potentially be able to do so at a lower cost. Encouraging hospitals to improve their quality of care may also have important spillover effects on other healthcare domains. For example, hospitals that adopt systems to ensure prompt delivery of antibiotics to patients with pneumonia may also observe positive spillover effects with the prompt antibiotic management of other acute infectious illnesses that are not covered by VBP. VBP may have spillover effects on medical malpractice liability and defensive medicine as well. Indeed, financial incentives to practice higher‐quality evidenced‐based care may reduce medical malpractice liability and defensive medicine.
The government's ultimate goal in implementing VBP is to identify a broad and clinically relevant set of outcome measures that can be used to incentivize hospitals to deliver high‐quality as opposed to high‐volume healthcare. The first wave of outcome measures has already been instituted. It remains to be seen whether the incentive rewards of Medicare's hospital VBP program will be large enough that hospitals feel compelled to improve and compete for them.
- Centers for Medicare and Medicaid Services. Hospital Value‐Based Purchasing Web site. 2013. Available at: http://www.cms.gov/Medicare/Quality‐Initiatives‐Patient‐Assessment‐Instruments/hospital‐value‐based‐purchasing/index.html. Accessed March 4, 2013.
- , . Value‐based purchasing—national programs to move from volume to value. N Engl J Med. 2012;367:292–295.
- , . Hospital value‐based purchasing: will Medicare's new policy exacerbate disparities? Circ Cardiovasc Qual Outcomes. 2012;5:148–149.
- Centers for Medicare and Medicaid Services. CMS/premier hospital quality incentive demonstration (QHID). 2013. Available at: https://www.premierinc.com/quality‐safety/tools‐services/p4p/hqi/faqs.jsp. Accessed March 5, 2013.
- Centers for Medicare and Medicaid Services. Hospital Compare Web site. 2013. Available at: http://www.medicare.gov/hospitalcompare. Accessed March 4, 2013.
- , , . “Never events”: not every hospital‐acquired infection is preventable. Clin Infect Dis. 2009;49:743–746.
- . Will pay for performance improve quality of care? The answer is in the details. N Engl J Med. 2012;367:1852–1853.
- , , , , , . Reduced mortality with hospital pay for performance in England. N Engl J Med. 2012;367:1821–1828.
- , , , et al. Public reporting and pay for performance in hospital quality improvement. N Engl J Med. 2007;356:486–496.
- , , , . The long‐term effect of premier pay for performance on patient outcomes. N Engl J Med. 2012;366:1606–1615.
- , , , , . Does performance‐based remuneration for individual health care practitioners affect patient care?: a systematic review. Ann Intern Med. 2012;157:889–899.
- Centers for Medicare and Medicaid Services. Hospital Consumer Assessment Of Healthcare Providers and Systems Web site. 2013. Available at: http://www.hcahpsonline.org. Accessed March 5, 2013.
- . Medicare discloses hospitals' bonuses, penalties based on quality. Kaiser Health News. December 20, 2012. Available at: http://www.kaiserhealthnews.org/stories/2012/december/21/medicare‐hospitals‐value‐based‐purchasing.aspx?referrer=search. Accessed March 26, 2013.
- , , , . Hospital quality and intensity of spending: is there an association? Health Aff (Millwood). 2009;28:w566–w572.
- , , , et al. Association between performance measures and clinical outcomes for patients hospitalized with heart failure. JAMA. 2007;297:61–70.
- , , . The advantages and disadvantages of process‐based measures of health care quality. Int J Qual Health Care. 2001;13:469–474.
- . Accountability, incentives and behavior: the impact of high‐stakes testing in the Chicago public schools. J Public Econ. 2005;89:761–796.
- , , , , , . The implications of regional variations in Medicare spending. Part 1: the content, quality, and accessibility of care. Ann Intern Med. 2003;138:273–287.
- . Medical care—is more always better? N Engl J Med. 2003;349:1665–1667.
- , , . Hospital spending and inpatient mortality: evidence from California: an observational study. Ann Intern Med. 2011;154:160–167.
- . Making it easy to do it right. N Engl J Med. 2001;345:991–993.
- , , , . A high rate of compliance with neonatal intensive care unit transfusion guidelines persists even after a program to improve transfusion guideline compliance ended. Transfusion. 2011;51:2519–2520.
- , , , et al. The impact of removing financial incentives from clinical quality indicators: longitudinal analysis of four Kaiser Permanente indicators. BMJ. 2010;340:c1898.
- , . Medicare's new hospital value‐based purchasing program is likely to have only a small impact on hospital payments. Health Aff (Millwood). 2012;31:1932–1940.
- , , , et al. Pay for performance, quality of care, and outcomes in acute myocardial infarction. JAMA. 2007;297:2373–2380.
- , , . Can you get what you pay for? Pay‐for‐performance and the quality of healthcare providers. Rand J Econ. 2010;41:64–91.
- , , , . Spending and mortality in US acute care hospitals. Am J Manag Care. 2013;19:e46–e54.
- , , , , , . Development and validation of hospital “end‐of‐life” treatment intensity measures. Med Care. 2009;47:1098–1105.
- , , , et al. Looking forward, looking back: assessing variations in hospital resource use and outcomes for elderly patients with heart failure. Circ Cardiovasc Qual Outcomes. 2009;2:548–557.
- , , , et al. Association of hospital spending intensity with mortality and readmission rates in Ontario hospitals. JAMA. 2012;307:1037–1045.
- , , . Patient satisfaction with hospital care: effects of demographic and institutional characteristics. Med Care. 2000;38:325–334.
- , , . Linking performance with payment: implementing the Physician Value‐Based Payment Modifier. JAMA. 2012;308:2089–2090.
- , , , , . Proportion of hospital readmissions deemed avoidable: a systematic review. CMAJ. 2011;183:E391–E402.
- , , , et al. Incidence of potentially avoidable urgent readmissions and their relation to all‐cause urgent readmissions. CMAJ. 2011;183:E1067–E1072.
- , . Thirty‐day readmissions—truth and consequences. N Engl J Med. 2012;366:1366–1369.
- , , . Thirty‐day readmission rates for Medicare beneficiaries by race and site of care. JAMA. 2011;305:675–681.
The Centers for Medicaid and Medicare Services' (CMS) Hospital Inpatient Value‐Based Purchasing (VBP) Program, which was signed into law as part of the Patient Protection and Affordable Care Act of 2010, aims to incentivize inpatient providers to deliver high‐value, as opposed to high‐volume, healthcare.[1] Beginning on October 1, 2012, the start of the 2013 fiscal year (FY), hospitals participating in the VBP program became eligible for a variety of performance‐based incentive payments from CMS. These payments are based on an acute care hospital's ability to meet performance measurements in 6 care domains: (1) patient safety, (2) care coordination, (3) clinical processes and outcomes, (4) population or community health, (5) efficiency and cost reduction, and (6) patient‐ and caregiver‐centered experience.[2] The VBP program's ultimate purpose is to enable CMS to improve the health of Medicare beneficiaries by purchasing better care for them at a lower cost. These 3 characteristics of careimproved health, improved care, and lower costsare the foundation of CMS' conception of value.[1, 2] They are closely related to an economic conception of value, which is the difference between an intervention's benefit and its cost.
Although in principle not a new idea, the formal mandate of hospitals to provide high‐value healthcare through financial incentives marks an important change in Medicare and Medicaid policy. In this opportune review of VBP, we first discuss the relevant historical changes in the reimbursement environment of US hospitals that have set the stage for VBP. We then describe the structure of CMS' VBP program, with a focus on which facilities are eligible to participate in the program, the specific outcomes measured and incentivized, how rewards and penalties are allocated, and how the program will be funded. In an effort to anticipate some of the issues that lie ahead, we then highlight a number of potential challenges to the success of VBP, and discuss how VBP will impact the delivery and reimbursement of inpatient care services. We conclude by examining how the VBP program is likely to evolve over time.
HISTORICAL CONTEXT FOR VBP
Over the last decade, CMS has embarked on a number of initiatives to incentivize the provision of higher‐quality and more cost‐effective care. For example, in 2003, CMS implemented a national pay‐for‐performance (P4P) pilot project called the Premier Hospital Quality Incentive Demonstration (HQID).[3, 4] HQID, which ran for 6 years, tracked and rewarded the performance of 216 hospitals in 6 healthcare service domains: (1) acute myocardial infarction (AMI), (2) congestive heart failure (CHF), (3) pneumonia, (4) coronary artery bypass graft surgery, (5) hip and knee replacement surgery, and (6) perioperative management of surgical patients (including prevention of surgical site infections).[4] CMS then introduced its Hospital Compare Web site in 2005 to facilitate public reporting of hospital‐level quality outcomes.[3, 5] This Web site provides the public with access to data on hospital performance across a wide array of measures of process quality, clinical outcomes, spending, and resource utilization.[5] Next, in October 2008, CMS stopped reimbursing hospitals for a number of costly and common hospital‐acquired complications, including hospital‐acquired bloodstream infections and urinary tract infections, patient falls, and pressure ulcers.[3, 6] VBP is the latest and most comprehensive step that CMS has taken in its decade‐long effort to shift from volume to value‐based compensation for inpatient care.
Although CMS appears fully invested in using performance incentives to increase healthcare value, existing evidence of the effects of P4P on patient outcomes remains quite mixed.[7] On one hand, an analysis of an inpatient P4P program sponsored by the United Kingdom's National Health Service's (NHS) suggests that P4P may improve quality and save lives; indeed, hospitals that participated in the NHS P4P program significantly reduced inpatient mortality from pneumonia, saving an estimated 890 lives.[8] Additional empirical work suggests that the HQID was also associated with early improvements in healthcare quality.[9] However, a subsequent long‐term analysis found that participation in HQID had no discernible effect on 30‐day mortality rates.[10] Moreover, a meta‐analysis of P4P incentives for individual practitioners found few methodologically robust studies of P4P for clinicians and concluded that P4P's effects on individual practice patterns and outcomes remain largely uncertain.[11]
VBP: STRUCTURE AND DESIGN
This section reviews the structure of the VBP program. We describe current VBP eligibility criteria and sources of funding for the program, how hospitals participating in VBP are evaluated, and how VBP incentives for FY 2013 have been calculated.
Hospital Eligibility for VBP
All acute care hospitals in the United States (excluding Maryland) that are not psychiatric hospitals, rehabilitation hospitals, long‐term care facilities, children's hospitals, or cancer hospitals are eligible to participate in VBP in FY 2013 (full eligibility criteria is outlined in Table 1). For FY 2013, CMS chose to incentivize measures in just 2 care domains: (1) clinical processes of care and (2) patient experience of care. To be eligible for VBP in FY 2013, a hospital must report at least 10 cases each in at least 4 of 12 measures included in the clinical processes of care domain (Table 2), and/or must have at least 100 completed Hospital Consumer Assessment of Healthcare Providers and Systems (HCAHPS). Designed and validated by CMS, the HCAHPS survey provides hospitals with a standardized instrument for gathering information about patient satisfaction with, and perspectives on, their hospital care.[12] HCAHPS will be used to assess 8 patient experience of care measures (Table 3).
|
| Inclusion criteria |
| Acute care hospital |
| Located in all 50 US states or District of Columbia (excluding Maryland) |
| Has at least 10 cases in at least 4 of 12 clinical process of care measures and/or at least 100 completed HCAHPS surveys |
| Exclusion criteria |
| Psychiatric, rehabilitation, long‐term care, children's or cancer hospital |
| Does not participate in Hospital Inpatient Quality Reporting Program during the VBP performance period |
| Cited by the Secretary of HHS for significant patient safety violations during performance period |
| Hospital does not meet minimum reporting requirements for number of cases, process measures, and surveys needed to participate in VBP |
| Disease Process | Process of Care Measure |
|---|---|
| |
| Acute myocardial infarction | Fibrinolytic therapy received within 30 minutes of hospital arrival |
| Primary percutaneous coronary intervention received within 90 minutes of hospital arrival | |
| Heart failure | Discharge instructions provided |
| Pneumonia | Blood cultures performed in the emergency department prior to initial antibiotic received in hospital |
| Initial antibiotic selection for community‐acquired pneumonia in immunocompetent patient | |
| Healthcare‐associated infections | Prophylactic antibiotic received within 1 hour prior to surgical incision |
| Prophylactic antibiotic selection for surgical patients | |
| Prophylactic antibiotics discontinued within 24 hours after surgery ends | |
| Cardiac surgery patients with controlled 6:00 am postoperative serum glucose | |
| Surgeries | Surgery patients on ‐blocker prior to arrival that received ‐blocker during perioperative period |
| Surgery patients with recommended venous thromboembolism prophylaxis ordered | |
| Surgery patients who received appropriate venous thromboembolism prophylaxis within 24 hours prior to surgery to 24 hours after surgery | |
| Communication with nurses |
| Communication with doctors |
| Responsiveness of hospital staff |
| Pain management |
| Communication about medicines |
| Cleanliness and quietness of hospital environment |
| Discharge information |
| Overall rating of hospital |
Participation in the program is mandatory for eligible hospitals, and CMS estimates that more than 3000 facilities across the United States will participate in FY 2013. Roughly $850 million dollars in VBP incentives will be paid out to these participating hospitals in FY 2013. The program is being financed through a 1% across‐the‐board reduction in FY 2013 diagnosis‐related group (DRG)‐based inpatient payments to participating hospitals. On December 20, 2012, CMS publically announced FY 2013 VBP incentives for all participating hospitals. Each hospital's incentive is retroactive and based on its performance between July 1, 2011 and March 31, 2012.
All data used for calculating VBP incentives is reported to CMS through its Hospital Inpatient Quality Reporting (Hospital IQR) Program, a national program instituted in 2003 that rewards hospitals for reporting designated quality measures. As of 2007, approximately 95% of eligible US hospitals were using the Hospital IQR program.[1] Measures evaluated via chart abstracts and surveys reflect a hospital's performance for its entire patient population, whereas measures assessed with claims data reflect hospital performance only for Medicare patients.
Evaluation of Hospitals
In FY 2013, hospital VBP incentive payments will be based entirely on performance in 2 domains: (1) clinical processes of care (weighted 70%) and (2) patient experience of care (weighted 30%). For each domain, CMS will evaluate each hospital's improvement over time as well as achievement compared to other hospitals in the VBP program. By assessing and rewarding both achievement and improvement, CMS will ensure that lower‐performing hospitals will still be rewarded for making substantial improvements in quality. To evaluate the first metricimprovement over timeCMS will compare a hospital's performance during a given reporting period with its baseline performance 2 years prior to this block of time. A hospital receives improvement points for improving its performance over time. To assess the second metricachievement compared to other hospitals in the VBP programCMS will compare each hospital's performance during a reporting period with the baseline performance (eg, performance 2 years prior to reporting period) of all other hospitals in the VBP program. A hospital is awarded achievement points if its performance exceeds the 50th percentile of all hospitals during the baseline performance period. Improvement scores range from 0 to 9, whereas achievement scores range from 0 to 10. The greater of a hospital's improvement and achievement scores on each VBP measure are used to calculate each hospital's total earned clinical care domain score and total earned HCAHPS base score. Hospitals that lack baseline performance data, which is required to assess improvement, will be evaluated solely on the basis of achievement points.[1] The total earned clinical care domain score is multiplied by 70% to reach the clinical care domain's contribution to a hospital's total performance score.
Each hospital's total patient experience domain, or HCAHPS performance, score consists of 2 components: a total earned HCAHPS base score as described above and a consistency score. The consistency score evaluates the reliability of a hospital's performance across all 8 patient experience of care measures (Table 3). If a hospital is above the 50th percentile of all hospital scores during the baseline period on all 8 measures, then it receives 100% of its consistency points. If a hospital is at the 0 percentile for a given measure, then it receives 0 consistency points for all measures. This provision promotes consistency by harshly penalizing hospitals with extremely poor performance on any 1 specific measure. If 1 or more measures are between the 0 and 50th percentiles, then it will receive a consistency score that takes into account how many measures were below the 50th percentile and their distance from this threshold. Each hospital's total HCAHPS performance score (the sum of total earned HCAHPS base points and consistency points) is then multiplied by 30% to arrive at the patient experience of care domain's contribution to a hospital's total performance score.
Importantly, CMS excluded from its VBP initiative 10 clinical process measures reported in the Hospital IQR Program because they are topped out; that is, almost all hospitals already perform them at very high rates (Table 4). Examples of these topped out process measures include administration of aspirin to all patients with AMI on arrival at the hospital; counseling of patients with AMI, CHF, and pneumonia about smoking cessation; and prescribing angiotensin‐converting enzyme inhibitors or angiotensin receptor blockers to patients with CHF and left ventricular dysfunction.[1]
| Disease Process | Measure |
|---|---|
| |
| Acute myocardial infarction | Aspirin administered on arrival to the emergency department |
| ACEI or ARB prescribed on discharge | |
| Patient counseled about smoking cessation | |
| ‐Blocker prescribed on discharge | |
| Aspirin prescribed at discharge | |
| Heart failure | Patient counseled about smoking cessation |
| Evaluation of left ventricular systolic function | |
| ACEI or ARB prescribed for left ventricular systolic dysfunction | |
| Pneumonia | Patient counseled about smoking cessation |
| Surgical Care Improvement Project | Surgery patients with appropriate hair removal |
Calculation of VBP Incentives and Public Reporting
A hospital's total performance score for FY 2013 is equal to the sum of 70% of its clinical care domain score and 30% of its total HCAHPS performance score. This total performance score is entered into a linear mathematical formula to calculate each hospital's incentive payment. CMS projects that VBP will lead to a net increase in Medicare payments for one‐half of hospitals and a net decrease in payments for the other half of participating facilities.[1]
In December 2012, CMS publicly disclosed information about the initial performance of each hospital in the VBP program. Reported information included: (1) hospital performance for each applicable performance measure, (2) hospital performance by disease condition or procedure, and (3) hospital's total performance score. Initial analyses of this performance data revealed that 1557 hospitals will receive bonus payments under VBP in FY 2013, whereas 1427 hospitals will lose money under this program. Treasure Valley Hospital, a 10‐bed physician‐owned hospital in Boise, Idaho, will receive a 0.83% increase in Medicare payments, the largest payment increase under VBP in 2013. Conversely, Auburn Community Hospital in upstate New York, will suffer the most severe payment reduction: 0.9% per Medicare admission. The penalty will cost Auburn Hospital about $100,000, which is slightly more than 0.1% of its yearly $85 million operating budget.[13] For almost two‐thirds of participating hospitals, FY 2013 Medicare payments will change by 0.25%.[13] Additional information about VBP payments for FY 2013, including the number of hospitals who received VBP incentives and the size and range of these payments, is now accessible to the public through CMS' Hospital Compare Web site (
CHALLENGES OF VBP
As the Medicare VBP program evolves, and hospitals confront ever‐larger financial incentives to deliver high‐value as opposed to high‐volume care, it will be important to recognize limitations of the VBP program as they arise. Here we briefly discuss several conceptual and implementation challenges that physicians and policymakers should consider when assessing the merits of VBP in promoting high‐quality healthcare.
Rigorous and Continuous Evaluation of VBP Programs
The main premise of using VBP to incentivize hospitals to deliver high‐quality cost‐effective care is that the process measures used to determine hospital quality do impact patient outcomes. However, it is already well established that improvements in measures of process quality are not always associated with improvements in patient outcomes.[14, 15, 16] Moreover, incentivizing specific process measures encourages hospitals to shift resources away from other aspects of care delivery, which may have ambiguous, or even deleterious, effects on patient outcomes. Although incentives ideally push hospitals to shift resources away from low‐quality care toward high‐quality care, in practice this is not always the case. Hospital resources may instead be drawn away from areas that are not yet incented by VBP, but for which improvements in quality of care are desperately needed. The same empirical focus behind using VBP to incentivize hospitals to improve patient outcomes efficiently should be used to evaluate whether VBP is continually meeting its stated goals: reducing overall patient morbidity and mortality and improving patient satisfaction at ideally lower cost. The experience of the US education system with public policies designed to improve student testing performance may serve as a cautionary example here. Such policies, which provide financial rewards to schools whose students perform well on standardized tests, can indeed raise testing performance. However, these policies also lead educators to teach to the test, and to neglect important topics that are not tested on standardized exams.[17]
Prioritization of Process Measures
As payment incentives for VBP currently stand, process measures are weighted equally regardless of the clinical benefits they generate and the resources required to achieve improvements in process quality. For instance, 2 process measures, continuing home ‐blocker medications for patients with coronary artery disease undergoing surgery and early percutaneous coronary intervention for patients with AMI, may be weighted equally as process measures although both their clinical benefits and the costs of implementation are very different. Some hospitals responding to VBP incentives may choose to invest in areas where their ability to earn VBP incentive payments is high and the costs of improvement are low, although those areas may not be where interventions are most needed because clinical outcomes could be most improved. Recognizing that process measures have heterogeneous benefits and costs of implementation is important when prioritizing their reimbursement in VBP.
Measuring Improvements in Hospital Quality
Tying hospital financial compensation to hospital quality implies that measures of hospital quality should be robust. To incentivize hospitals to improve quality not only relative to other hospitals but to themselves in the past, the VBP program has established a baseline performance for each hospital. Each hospital is compared to its baseline performance in subsequent evaluation periods. Thus, properly measuring a hospital's baseline performance is important. During a given baseline period, some hospitals may have better or worse outcomes than their steady state due to random variation alone. Some hospitals deemed to have a low baseline will experience improvements in quality that are not related to active efforts to improve quality but through chance alone. Similarly, some hospitals deemed to have a high baseline will experience reductions in quality through chance. Of course, neither of these changes should be subject to differences in reimbursement because they do not reflect actual organizational changes made by the hospitals. The VBP program has made significant efforts to address this issue by requiring participating hospitals to have a large enough sample of cases such that estimated rates of process quality adherence meet a reliability threshold (ie, are likely to be consistent over time rather than vary substantially through chance alone). However, not all process measures exhibit high reliability, particularly those for which adverse events are rare (eg, foreign objects retained after surgery, air embolisms, and blood incompatibility). Ultimately, CMS's decision to balance the need for statistically reliable data with the goal of including as many hospitals as possible in the VBP program will require ongoing reevaluation of this issue.
Choosing Hospital Comparators Appropriately
In the current VBP program, hospitals will be evaluated in part by how they compare to hospitals nationally. However, studies of regional variation in healthcare have demonstrated large variations in practice patterns across the United States,[18, 19, 20] raising the question of whether hospitals should, at least initially, be compared to hospitals in the same geographic area. Although the ultimate goal of VBP should be to hold hospitals to a national standard, local practice patterns are not easily modified within 1‐ to 2‐year timeframes. Initially comparing hospitals to a national rather than local standard may unfairly penalize hospitals that are relative underperformers nationally but overperformers regionally. Although CMS's policy to reward improvement within hospitals over time mitigates issues arising from a cross‐sectional comparison of hospitals, the issue still remains if many hospitals within a region not only underperform relative to other hospitals nationally but also fail to demonstrate improvement. More broadly, this issue extends to differences across hospitals in factors that impact their ability to meet VBP goals. These factors may include, for example, hospital size, profitability, patient case and insurance mix, and presence of an electronic medical record. Comparing hospitals with vastly different abilities to achieve VBP goals and improve quickly may amount to inequitable policy.
Continual Evaluation of Topped‐Out Measures
Process measures that are met at high rates at nearly all hospitals are not used in evaluations by CMS for VBP. An assumption underlying CMS' decision to not reward hospitals for achieving these topped‐out measures is that once physicians and hospitals make cognitive and system‐level improvements that improve process quality, these gains will persist after the incentive is removed. Thus, CMS hopes and anticipates that although performance incentives will make it easier for well‐meaning physicians to learn to do the right thing, doctors will continue to do the right things for patients after these incentives are removed.[21, 22] Although this assumption may generally be accurate, it is important to continue to evaluate whether measures that are currently topped out continue to remain adequately performed, because rewarding new quality measures will necessarily lead hospitals to reallocate resources away from other clinical activities. Although we hope that the continued public reporting of topped‐out measures will prevent declines in performance on these measures, policy makers and clinicians should be aware that the lack of financial incentives for topped‐out measures may result in declines in quality. To this point, an analysis of 35 Kaiser Permanente facilities from 1997 to 2007 demonstrated that the removal of financial incentives for diabetic retinopathy and cervical cancer screening was associated with subsequent declines in performance of 3% and 1.6% per year, respectively.[23]
Will VBP Incentives Be Large Enough to Change Practice Patterns?
The VBP Program's ability to influence change depends, at least in part, on how the incentives offered under this program compare to the magnitude of the investments that hospitals must make to achieve a given reward. In general, larger incentives are necessary to motivate more significant changes in behavior or to influence organizations to invest the resources needed to achieve change. The incentives offered under VBP in FY 2013 are quite modest. Almost two‐thirds of participating hospitals will see their FY 2013 Medicare revenues change by 0.25%, roughly $125,000 at most.[13, 24] Although these incentives may motivate hospitals that can improve performance and achievement with very modest investments, they may have little impact on organizations that need to make significant upfront investments in care processes to achieve sustainable improvements in care quality. As CMS increases the size of VBP incentives over the next 2 to 4 years, it will also hold hospitals accountable for a broader and increasingly complex set of outcomes. Improving these outcomes may require investments in areas such as information technology and process improvement that far surpass the VBP incentive reward.
Moreover, prior research suggests that financial incentives like those available under VBP may contribute only slightly to performance improvements when public reporting already exists. For example, in a 2‐year study of 613 US hospitals implementing pay‐for‐performance plus public reporting or public reporting only, pay for performance plus public reporting was associated with only a 2.6% to 4.1% increase in a composite measure of quality when compared to hospitals with public reporting only.[9] Similarly, a study of 54 hospitals participating in the CMS pay for performance pilot initiative found no significant improvement in quality of care or outcomes for AMI when compared to 446 control hospitals.[25] A long‐term analysis of pay for performance in the Medicare Premier Hospital Quality Incentive Demonstration found that participation in the program had no discernible effect on 30‐day mortality rates.[10] Finally, a study of physician medical groups contracting with a large network healthcare maintenance organization found that the implementation of pay for performance did not result in major before and after improvements in clinical quality compared to a control group of medical groups.[26]
High‐Value Care Is Not Always Low‐Cost Care
Not surprisingly, the clinical process measures included in CMS' hospital VBP program evaluate a select and relatively small group of high‐value and low‐cost interventions (eg, appropriate administration of antibiotics and tight control of serum glucose in surgical patients). However, an important body of work has demonstrated that high‐cost care (eg, intensive inpatient hospital care for common acute medical conditions) may also be highly valuable in terms of improving survival.[20, 27, 28, 29, 30] As the hospital VBP program evolves, its overseers will need to consider whether to include additional incentives for high‐value high‐cost healthcare services. Such considerations will likely become increasingly salient as healthcare delivery organizations move toward capitated delivery models. In particular, the VBP program's Medicare Spending Per Beneficiary measure, which quantifies inpatient and subsequent outpatient spending per beneficiary after a given hospitalization episode, will need to distinguish between higher‐spending hospitals that provide highly effective care (eg, care that reduces mortality and readmissions) and facilities that provide less‐effective care.
FUTURE OF VBP
Although the future of VBP is unknown, CMS is likely to modify the program in a number of ways over the next 3 to 5 years. First, CMS will likely expand the breadth and focus of incentivized measures in the VBP program. In FY 2014, for example, CMS is adding a set of 3, 30‐day mortality outcome measures to VBP: 30‐day risk‐adjusted mortality for AMI, CHF, and pneumonia.[1] A hospital's performance with respect to these outcomes will represent 25% of its total performance score in 2014, whereas the clinical process of care and patient experience of care domains will account for 45% and 30% of this score, respectively. In 2015, patient experience and outcome measures will account for 30% each in a hospital's performance score, whereas process and efficiency measures will each account for 20% of this score, respectively. The composition of this performance score evidences a shift away from rewarding process‐based measures and toward incentivizing measures of clinical outcomes and patient satisfaction, the latter of which may be highly subjective and more representative of a hospital's catchment population than of a hospital's care itself.[31] Additional measures in the domains of patient safety, care coordination, population and community health, emergency room wait times, and cost control may also be added to the VBP program in FY 2015 to FY 2017. Furthermore, CMS will continue to reevaluate the appropriateness of measures that are already included in VBP and will stop incentivizing measures that have become topped out, or are no longer supported by the National Quality Forum.[1, 13]
Second, CMS has established an annual gradual increase of 0.25% in the percentage of each hospital's inpatient DRG‐based payment that is at stake under VBP. In FY 2014, for example, participating hospitals will be required to contribute 1.25% of inpatient DRG payments to the VBP program. This percentage is likely to increase to 2% or more by 2017.[1, 32]
Third, expansions of the VBP program complement a number of other quality improvement efforts overseen by CMS, including the Hospital Readmissions Reduction Program. Effective for discharges beginning on October 1, 2012, hospitals with excess readmissions for AMI, CHF, and pneumonia are at risk for reimbursement reductions for all Medicare admissions in proportion to the rate of excess rehospitalizations. Some of the same concerns about the hospital VBP program outlined above have also been raised for this program, namely, whether readmission penalties will be large enough to impact hospital behavior, whether readmissions are even preventable,[33, 34] and whether adjustments in hospital‐level policies will reduce admissions that are known to be heavily influenced by patient economic and social factors that are outside of a hospital's control.[35, 36] Despite the limitations of VBP and the challenges that lie ahead, there is optimism that rewarding hospitals that provide high‐value rather than high‐volume care will not only improve outcomes of hospitalized patients in the United States, but will potentially be able to do so at a lower cost. Encouraging hospitals to improve their quality of care may also have important spillover effects on other healthcare domains. For example, hospitals that adopt systems to ensure prompt delivery of antibiotics to patients with pneumonia may also observe positive spillover effects with the prompt antibiotic management of other acute infectious illnesses that are not covered by VBP. VBP may have spillover effects on medical malpractice liability and defensive medicine as well. Indeed, financial incentives to practice higher‐quality evidenced‐based care may reduce medical malpractice liability and defensive medicine.
The government's ultimate goal in implementing VBP is to identify a broad and clinically relevant set of outcome measures that can be used to incentivize hospitals to deliver high‐quality as opposed to high‐volume healthcare. The first wave of outcome measures has already been instituted. It remains to be seen whether the incentive rewards of Medicare's hospital VBP program will be large enough that hospitals feel compelled to improve and compete for them.
The Centers for Medicaid and Medicare Services' (CMS) Hospital Inpatient Value‐Based Purchasing (VBP) Program, which was signed into law as part of the Patient Protection and Affordable Care Act of 2010, aims to incentivize inpatient providers to deliver high‐value, as opposed to high‐volume, healthcare.[1] Beginning on October 1, 2012, the start of the 2013 fiscal year (FY), hospitals participating in the VBP program became eligible for a variety of performance‐based incentive payments from CMS. These payments are based on an acute care hospital's ability to meet performance measurements in 6 care domains: (1) patient safety, (2) care coordination, (3) clinical processes and outcomes, (4) population or community health, (5) efficiency and cost reduction, and (6) patient‐ and caregiver‐centered experience.[2] The VBP program's ultimate purpose is to enable CMS to improve the health of Medicare beneficiaries by purchasing better care for them at a lower cost. These 3 characteristics of careimproved health, improved care, and lower costsare the foundation of CMS' conception of value.[1, 2] They are closely related to an economic conception of value, which is the difference between an intervention's benefit and its cost.
Although in principle not a new idea, the formal mandate of hospitals to provide high‐value healthcare through financial incentives marks an important change in Medicare and Medicaid policy. In this opportune review of VBP, we first discuss the relevant historical changes in the reimbursement environment of US hospitals that have set the stage for VBP. We then describe the structure of CMS' VBP program, with a focus on which facilities are eligible to participate in the program, the specific outcomes measured and incentivized, how rewards and penalties are allocated, and how the program will be funded. In an effort to anticipate some of the issues that lie ahead, we then highlight a number of potential challenges to the success of VBP, and discuss how VBP will impact the delivery and reimbursement of inpatient care services. We conclude by examining how the VBP program is likely to evolve over time.
HISTORICAL CONTEXT FOR VBP
Over the last decade, CMS has embarked on a number of initiatives to incentivize the provision of higher‐quality and more cost‐effective care. For example, in 2003, CMS implemented a national pay‐for‐performance (P4P) pilot project called the Premier Hospital Quality Incentive Demonstration (HQID).[3, 4] HQID, which ran for 6 years, tracked and rewarded the performance of 216 hospitals in 6 healthcare service domains: (1) acute myocardial infarction (AMI), (2) congestive heart failure (CHF), (3) pneumonia, (4) coronary artery bypass graft surgery, (5) hip and knee replacement surgery, and (6) perioperative management of surgical patients (including prevention of surgical site infections).[4] CMS then introduced its Hospital Compare Web site in 2005 to facilitate public reporting of hospital‐level quality outcomes.[3, 5] This Web site provides the public with access to data on hospital performance across a wide array of measures of process quality, clinical outcomes, spending, and resource utilization.[5] Next, in October 2008, CMS stopped reimbursing hospitals for a number of costly and common hospital‐acquired complications, including hospital‐acquired bloodstream infections and urinary tract infections, patient falls, and pressure ulcers.[3, 6] VBP is the latest and most comprehensive step that CMS has taken in its decade‐long effort to shift from volume to value‐based compensation for inpatient care.
Although CMS appears fully invested in using performance incentives to increase healthcare value, existing evidence of the effects of P4P on patient outcomes remains quite mixed.[7] On one hand, an analysis of an inpatient P4P program sponsored by the United Kingdom's National Health Service's (NHS) suggests that P4P may improve quality and save lives; indeed, hospitals that participated in the NHS P4P program significantly reduced inpatient mortality from pneumonia, saving an estimated 890 lives.[8] Additional empirical work suggests that the HQID was also associated with early improvements in healthcare quality.[9] However, a subsequent long‐term analysis found that participation in HQID had no discernible effect on 30‐day mortality rates.[10] Moreover, a meta‐analysis of P4P incentives for individual practitioners found few methodologically robust studies of P4P for clinicians and concluded that P4P's effects on individual practice patterns and outcomes remain largely uncertain.[11]
VBP: STRUCTURE AND DESIGN
This section reviews the structure of the VBP program. We describe current VBP eligibility criteria and sources of funding for the program, how hospitals participating in VBP are evaluated, and how VBP incentives for FY 2013 have been calculated.
Hospital Eligibility for VBP
All acute care hospitals in the United States (excluding Maryland) that are not psychiatric hospitals, rehabilitation hospitals, long‐term care facilities, children's hospitals, or cancer hospitals are eligible to participate in VBP in FY 2013 (full eligibility criteria is outlined in Table 1). For FY 2013, CMS chose to incentivize measures in just 2 care domains: (1) clinical processes of care and (2) patient experience of care. To be eligible for VBP in FY 2013, a hospital must report at least 10 cases each in at least 4 of 12 measures included in the clinical processes of care domain (Table 2), and/or must have at least 100 completed Hospital Consumer Assessment of Healthcare Providers and Systems (HCAHPS). Designed and validated by CMS, the HCAHPS survey provides hospitals with a standardized instrument for gathering information about patient satisfaction with, and perspectives on, their hospital care.[12] HCAHPS will be used to assess 8 patient experience of care measures (Table 3).
|
| Inclusion criteria |
| Acute care hospital |
| Located in all 50 US states or District of Columbia (excluding Maryland) |
| Has at least 10 cases in at least 4 of 12 clinical process of care measures and/or at least 100 completed HCAHPS surveys |
| Exclusion criteria |
| Psychiatric, rehabilitation, long‐term care, children's or cancer hospital |
| Does not participate in Hospital Inpatient Quality Reporting Program during the VBP performance period |
| Cited by the Secretary of HHS for significant patient safety violations during performance period |
| Hospital does not meet minimum reporting requirements for number of cases, process measures, and surveys needed to participate in VBP |
| Disease Process | Process of Care Measure |
|---|---|
| |
| Acute myocardial infarction | Fibrinolytic therapy received within 30 minutes of hospital arrival |
| Primary percutaneous coronary intervention received within 90 minutes of hospital arrival | |
| Heart failure | Discharge instructions provided |
| Pneumonia | Blood cultures performed in the emergency department prior to initial antibiotic received in hospital |
| Initial antibiotic selection for community‐acquired pneumonia in immunocompetent patient | |
| Healthcare‐associated infections | Prophylactic antibiotic received within 1 hour prior to surgical incision |
| Prophylactic antibiotic selection for surgical patients | |
| Prophylactic antibiotics discontinued within 24 hours after surgery ends | |
| Cardiac surgery patients with controlled 6:00 am postoperative serum glucose | |
| Surgeries | Surgery patients on ‐blocker prior to arrival that received ‐blocker during perioperative period |
| Surgery patients with recommended venous thromboembolism prophylaxis ordered | |
| Surgery patients who received appropriate venous thromboembolism prophylaxis within 24 hours prior to surgery to 24 hours after surgery | |
| Communication with nurses |
| Communication with doctors |
| Responsiveness of hospital staff |
| Pain management |
| Communication about medicines |
| Cleanliness and quietness of hospital environment |
| Discharge information |
| Overall rating of hospital |
Participation in the program is mandatory for eligible hospitals, and CMS estimates that more than 3000 facilities across the United States will participate in FY 2013. Roughly $850 million dollars in VBP incentives will be paid out to these participating hospitals in FY 2013. The program is being financed through a 1% across‐the‐board reduction in FY 2013 diagnosis‐related group (DRG)‐based inpatient payments to participating hospitals. On December 20, 2012, CMS publically announced FY 2013 VBP incentives for all participating hospitals. Each hospital's incentive is retroactive and based on its performance between July 1, 2011 and March 31, 2012.
All data used for calculating VBP incentives is reported to CMS through its Hospital Inpatient Quality Reporting (Hospital IQR) Program, a national program instituted in 2003 that rewards hospitals for reporting designated quality measures. As of 2007, approximately 95% of eligible US hospitals were using the Hospital IQR program.[1] Measures evaluated via chart abstracts and surveys reflect a hospital's performance for its entire patient population, whereas measures assessed with claims data reflect hospital performance only for Medicare patients.
Evaluation of Hospitals
In FY 2013, hospital VBP incentive payments will be based entirely on performance in 2 domains: (1) clinical processes of care (weighted 70%) and (2) patient experience of care (weighted 30%). For each domain, CMS will evaluate each hospital's improvement over time as well as achievement compared to other hospitals in the VBP program. By assessing and rewarding both achievement and improvement, CMS will ensure that lower‐performing hospitals will still be rewarded for making substantial improvements in quality. To evaluate the first metricimprovement over timeCMS will compare a hospital's performance during a given reporting period with its baseline performance 2 years prior to this block of time. A hospital receives improvement points for improving its performance over time. To assess the second metricachievement compared to other hospitals in the VBP programCMS will compare each hospital's performance during a reporting period with the baseline performance (eg, performance 2 years prior to reporting period) of all other hospitals in the VBP program. A hospital is awarded achievement points if its performance exceeds the 50th percentile of all hospitals during the baseline performance period. Improvement scores range from 0 to 9, whereas achievement scores range from 0 to 10. The greater of a hospital's improvement and achievement scores on each VBP measure are used to calculate each hospital's total earned clinical care domain score and total earned HCAHPS base score. Hospitals that lack baseline performance data, which is required to assess improvement, will be evaluated solely on the basis of achievement points.[1] The total earned clinical care domain score is multiplied by 70% to reach the clinical care domain's contribution to a hospital's total performance score.
Each hospital's total patient experience domain, or HCAHPS performance, score consists of 2 components: a total earned HCAHPS base score as described above and a consistency score. The consistency score evaluates the reliability of a hospital's performance across all 8 patient experience of care measures (Table 3). If a hospital is above the 50th percentile of all hospital scores during the baseline period on all 8 measures, then it receives 100% of its consistency points. If a hospital is at the 0 percentile for a given measure, then it receives 0 consistency points for all measures. This provision promotes consistency by harshly penalizing hospitals with extremely poor performance on any 1 specific measure. If 1 or more measures are between the 0 and 50th percentiles, then it will receive a consistency score that takes into account how many measures were below the 50th percentile and their distance from this threshold. Each hospital's total HCAHPS performance score (the sum of total earned HCAHPS base points and consistency points) is then multiplied by 30% to arrive at the patient experience of care domain's contribution to a hospital's total performance score.
Importantly, CMS excluded from its VBP initiative 10 clinical process measures reported in the Hospital IQR Program because they are topped out; that is, almost all hospitals already perform them at very high rates (Table 4). Examples of these topped out process measures include administration of aspirin to all patients with AMI on arrival at the hospital; counseling of patients with AMI, CHF, and pneumonia about smoking cessation; and prescribing angiotensin‐converting enzyme inhibitors or angiotensin receptor blockers to patients with CHF and left ventricular dysfunction.[1]
| Disease Process | Measure |
|---|---|
| |
| Acute myocardial infarction | Aspirin administered on arrival to the emergency department |
| ACEI or ARB prescribed on discharge | |
| Patient counseled about smoking cessation | |
| ‐Blocker prescribed on discharge | |
| Aspirin prescribed at discharge | |
| Heart failure | Patient counseled about smoking cessation |
| Evaluation of left ventricular systolic function | |
| ACEI or ARB prescribed for left ventricular systolic dysfunction | |
| Pneumonia | Patient counseled about smoking cessation |
| Surgical Care Improvement Project | Surgery patients with appropriate hair removal |
Calculation of VBP Incentives and Public Reporting
A hospital's total performance score for FY 2013 is equal to the sum of 70% of its clinical care domain score and 30% of its total HCAHPS performance score. This total performance score is entered into a linear mathematical formula to calculate each hospital's incentive payment. CMS projects that VBP will lead to a net increase in Medicare payments for one‐half of hospitals and a net decrease in payments for the other half of participating facilities.[1]
In December 2012, CMS publicly disclosed information about the initial performance of each hospital in the VBP program. Reported information included: (1) hospital performance for each applicable performance measure, (2) hospital performance by disease condition or procedure, and (3) hospital's total performance score. Initial analyses of this performance data revealed that 1557 hospitals will receive bonus payments under VBP in FY 2013, whereas 1427 hospitals will lose money under this program. Treasure Valley Hospital, a 10‐bed physician‐owned hospital in Boise, Idaho, will receive a 0.83% increase in Medicare payments, the largest payment increase under VBP in 2013. Conversely, Auburn Community Hospital in upstate New York, will suffer the most severe payment reduction: 0.9% per Medicare admission. The penalty will cost Auburn Hospital about $100,000, which is slightly more than 0.1% of its yearly $85 million operating budget.[13] For almost two‐thirds of participating hospitals, FY 2013 Medicare payments will change by 0.25%.[13] Additional information about VBP payments for FY 2013, including the number of hospitals who received VBP incentives and the size and range of these payments, is now accessible to the public through CMS' Hospital Compare Web site (
CHALLENGES OF VBP
As the Medicare VBP program evolves, and hospitals confront ever‐larger financial incentives to deliver high‐value as opposed to high‐volume care, it will be important to recognize limitations of the VBP program as they arise. Here we briefly discuss several conceptual and implementation challenges that physicians and policymakers should consider when assessing the merits of VBP in promoting high‐quality healthcare.
Rigorous and Continuous Evaluation of VBP Programs
The main premise of using VBP to incentivize hospitals to deliver high‐quality cost‐effective care is that the process measures used to determine hospital quality do impact patient outcomes. However, it is already well established that improvements in measures of process quality are not always associated with improvements in patient outcomes.[14, 15, 16] Moreover, incentivizing specific process measures encourages hospitals to shift resources away from other aspects of care delivery, which may have ambiguous, or even deleterious, effects on patient outcomes. Although incentives ideally push hospitals to shift resources away from low‐quality care toward high‐quality care, in practice this is not always the case. Hospital resources may instead be drawn away from areas that are not yet incented by VBP, but for which improvements in quality of care are desperately needed. The same empirical focus behind using VBP to incentivize hospitals to improve patient outcomes efficiently should be used to evaluate whether VBP is continually meeting its stated goals: reducing overall patient morbidity and mortality and improving patient satisfaction at ideally lower cost. The experience of the US education system with public policies designed to improve student testing performance may serve as a cautionary example here. Such policies, which provide financial rewards to schools whose students perform well on standardized tests, can indeed raise testing performance. However, these policies also lead educators to teach to the test, and to neglect important topics that are not tested on standardized exams.[17]
Prioritization of Process Measures
As payment incentives for VBP currently stand, process measures are weighted equally regardless of the clinical benefits they generate and the resources required to achieve improvements in process quality. For instance, 2 process measures, continuing home ‐blocker medications for patients with coronary artery disease undergoing surgery and early percutaneous coronary intervention for patients with AMI, may be weighted equally as process measures although both their clinical benefits and the costs of implementation are very different. Some hospitals responding to VBP incentives may choose to invest in areas where their ability to earn VBP incentive payments is high and the costs of improvement are low, although those areas may not be where interventions are most needed because clinical outcomes could be most improved. Recognizing that process measures have heterogeneous benefits and costs of implementation is important when prioritizing their reimbursement in VBP.
Measuring Improvements in Hospital Quality
Tying hospital financial compensation to hospital quality implies that measures of hospital quality should be robust. To incentivize hospitals to improve quality not only relative to other hospitals but to themselves in the past, the VBP program has established a baseline performance for each hospital. Each hospital is compared to its baseline performance in subsequent evaluation periods. Thus, properly measuring a hospital's baseline performance is important. During a given baseline period, some hospitals may have better or worse outcomes than their steady state due to random variation alone. Some hospitals deemed to have a low baseline will experience improvements in quality that are not related to active efforts to improve quality but through chance alone. Similarly, some hospitals deemed to have a high baseline will experience reductions in quality through chance. Of course, neither of these changes should be subject to differences in reimbursement because they do not reflect actual organizational changes made by the hospitals. The VBP program has made significant efforts to address this issue by requiring participating hospitals to have a large enough sample of cases such that estimated rates of process quality adherence meet a reliability threshold (ie, are likely to be consistent over time rather than vary substantially through chance alone). However, not all process measures exhibit high reliability, particularly those for which adverse events are rare (eg, foreign objects retained after surgery, air embolisms, and blood incompatibility). Ultimately, CMS's decision to balance the need for statistically reliable data with the goal of including as many hospitals as possible in the VBP program will require ongoing reevaluation of this issue.
Choosing Hospital Comparators Appropriately
In the current VBP program, hospitals will be evaluated in part by how they compare to hospitals nationally. However, studies of regional variation in healthcare have demonstrated large variations in practice patterns across the United States,[18, 19, 20] raising the question of whether hospitals should, at least initially, be compared to hospitals in the same geographic area. Although the ultimate goal of VBP should be to hold hospitals to a national standard, local practice patterns are not easily modified within 1‐ to 2‐year timeframes. Initially comparing hospitals to a national rather than local standard may unfairly penalize hospitals that are relative underperformers nationally but overperformers regionally. Although CMS's policy to reward improvement within hospitals over time mitigates issues arising from a cross‐sectional comparison of hospitals, the issue still remains if many hospitals within a region not only underperform relative to other hospitals nationally but also fail to demonstrate improvement. More broadly, this issue extends to differences across hospitals in factors that impact their ability to meet VBP goals. These factors may include, for example, hospital size, profitability, patient case and insurance mix, and presence of an electronic medical record. Comparing hospitals with vastly different abilities to achieve VBP goals and improve quickly may amount to inequitable policy.
Continual Evaluation of Topped‐Out Measures
Process measures that are met at high rates at nearly all hospitals are not used in evaluations by CMS for VBP. An assumption underlying CMS' decision to not reward hospitals for achieving these topped‐out measures is that once physicians and hospitals make cognitive and system‐level improvements that improve process quality, these gains will persist after the incentive is removed. Thus, CMS hopes and anticipates that although performance incentives will make it easier for well‐meaning physicians to learn to do the right thing, doctors will continue to do the right things for patients after these incentives are removed.[21, 22] Although this assumption may generally be accurate, it is important to continue to evaluate whether measures that are currently topped out continue to remain adequately performed, because rewarding new quality measures will necessarily lead hospitals to reallocate resources away from other clinical activities. Although we hope that the continued public reporting of topped‐out measures will prevent declines in performance on these measures, policy makers and clinicians should be aware that the lack of financial incentives for topped‐out measures may result in declines in quality. To this point, an analysis of 35 Kaiser Permanente facilities from 1997 to 2007 demonstrated that the removal of financial incentives for diabetic retinopathy and cervical cancer screening was associated with subsequent declines in performance of 3% and 1.6% per year, respectively.[23]
Will VBP Incentives Be Large Enough to Change Practice Patterns?
The VBP Program's ability to influence change depends, at least in part, on how the incentives offered under this program compare to the magnitude of the investments that hospitals must make to achieve a given reward. In general, larger incentives are necessary to motivate more significant changes in behavior or to influence organizations to invest the resources needed to achieve change. The incentives offered under VBP in FY 2013 are quite modest. Almost two‐thirds of participating hospitals will see their FY 2013 Medicare revenues change by 0.25%, roughly $125,000 at most.[13, 24] Although these incentives may motivate hospitals that can improve performance and achievement with very modest investments, they may have little impact on organizations that need to make significant upfront investments in care processes to achieve sustainable improvements in care quality. As CMS increases the size of VBP incentives over the next 2 to 4 years, it will also hold hospitals accountable for a broader and increasingly complex set of outcomes. Improving these outcomes may require investments in areas such as information technology and process improvement that far surpass the VBP incentive reward.
Moreover, prior research suggests that financial incentives like those available under VBP may contribute only slightly to performance improvements when public reporting already exists. For example, in a 2‐year study of 613 US hospitals implementing pay‐for‐performance plus public reporting or public reporting only, pay for performance plus public reporting was associated with only a 2.6% to 4.1% increase in a composite measure of quality when compared to hospitals with public reporting only.[9] Similarly, a study of 54 hospitals participating in the CMS pay for performance pilot initiative found no significant improvement in quality of care or outcomes for AMI when compared to 446 control hospitals.[25] A long‐term analysis of pay for performance in the Medicare Premier Hospital Quality Incentive Demonstration found that participation in the program had no discernible effect on 30‐day mortality rates.[10] Finally, a study of physician medical groups contracting with a large network healthcare maintenance organization found that the implementation of pay for performance did not result in major before and after improvements in clinical quality compared to a control group of medical groups.[26]
High‐Value Care Is Not Always Low‐Cost Care
Not surprisingly, the clinical process measures included in CMS' hospital VBP program evaluate a select and relatively small group of high‐value and low‐cost interventions (eg, appropriate administration of antibiotics and tight control of serum glucose in surgical patients). However, an important body of work has demonstrated that high‐cost care (eg, intensive inpatient hospital care for common acute medical conditions) may also be highly valuable in terms of improving survival.[20, 27, 28, 29, 30] As the hospital VBP program evolves, its overseers will need to consider whether to include additional incentives for high‐value high‐cost healthcare services. Such considerations will likely become increasingly salient as healthcare delivery organizations move toward capitated delivery models. In particular, the VBP program's Medicare Spending Per Beneficiary measure, which quantifies inpatient and subsequent outpatient spending per beneficiary after a given hospitalization episode, will need to distinguish between higher‐spending hospitals that provide highly effective care (eg, care that reduces mortality and readmissions) and facilities that provide less‐effective care.
FUTURE OF VBP
Although the future of VBP is unknown, CMS is likely to modify the program in a number of ways over the next 3 to 5 years. First, CMS will likely expand the breadth and focus of incentivized measures in the VBP program. In FY 2014, for example, CMS is adding a set of 3, 30‐day mortality outcome measures to VBP: 30‐day risk‐adjusted mortality for AMI, CHF, and pneumonia.[1] A hospital's performance with respect to these outcomes will represent 25% of its total performance score in 2014, whereas the clinical process of care and patient experience of care domains will account for 45% and 30% of this score, respectively. In 2015, patient experience and outcome measures will account for 30% each in a hospital's performance score, whereas process and efficiency measures will each account for 20% of this score, respectively. The composition of this performance score evidences a shift away from rewarding process‐based measures and toward incentivizing measures of clinical outcomes and patient satisfaction, the latter of which may be highly subjective and more representative of a hospital's catchment population than of a hospital's care itself.[31] Additional measures in the domains of patient safety, care coordination, population and community health, emergency room wait times, and cost control may also be added to the VBP program in FY 2015 to FY 2017. Furthermore, CMS will continue to reevaluate the appropriateness of measures that are already included in VBP and will stop incentivizing measures that have become topped out, or are no longer supported by the National Quality Forum.[1, 13]
Second, CMS has established an annual gradual increase of 0.25% in the percentage of each hospital's inpatient DRG‐based payment that is at stake under VBP. In FY 2014, for example, participating hospitals will be required to contribute 1.25% of inpatient DRG payments to the VBP program. This percentage is likely to increase to 2% or more by 2017.[1, 32]
Third, expansions of the VBP program complement a number of other quality improvement efforts overseen by CMS, including the Hospital Readmissions Reduction Program. Effective for discharges beginning on October 1, 2012, hospitals with excess readmissions for AMI, CHF, and pneumonia are at risk for reimbursement reductions for all Medicare admissions in proportion to the rate of excess rehospitalizations. Some of the same concerns about the hospital VBP program outlined above have also been raised for this program, namely, whether readmission penalties will be large enough to impact hospital behavior, whether readmissions are even preventable,[33, 34] and whether adjustments in hospital‐level policies will reduce admissions that are known to be heavily influenced by patient economic and social factors that are outside of a hospital's control.[35, 36] Despite the limitations of VBP and the challenges that lie ahead, there is optimism that rewarding hospitals that provide high‐value rather than high‐volume care will not only improve outcomes of hospitalized patients in the United States, but will potentially be able to do so at a lower cost. Encouraging hospitals to improve their quality of care may also have important spillover effects on other healthcare domains. For example, hospitals that adopt systems to ensure prompt delivery of antibiotics to patients with pneumonia may also observe positive spillover effects with the prompt antibiotic management of other acute infectious illnesses that are not covered by VBP. VBP may have spillover effects on medical malpractice liability and defensive medicine as well. Indeed, financial incentives to practice higher‐quality evidenced‐based care may reduce medical malpractice liability and defensive medicine.
The government's ultimate goal in implementing VBP is to identify a broad and clinically relevant set of outcome measures that can be used to incentivize hospitals to deliver high‐quality as opposed to high‐volume healthcare. The first wave of outcome measures has already been instituted. It remains to be seen whether the incentive rewards of Medicare's hospital VBP program will be large enough that hospitals feel compelled to improve and compete for them.
- Centers for Medicare and Medicaid Services. Hospital Value‐Based Purchasing Web site. 2013. Available at: http://www.cms.gov/Medicare/Quality‐Initiatives‐Patient‐Assessment‐Instruments/hospital‐value‐based‐purchasing/index.html. Accessed March 4, 2013.
- , . Value‐based purchasing—national programs to move from volume to value. N Engl J Med. 2012;367:292–295.
- , . Hospital value‐based purchasing: will Medicare's new policy exacerbate disparities? Circ Cardiovasc Qual Outcomes. 2012;5:148–149.
- Centers for Medicare and Medicaid Services. CMS/premier hospital quality incentive demonstration (QHID). 2013. Available at: https://www.premierinc.com/quality‐safety/tools‐services/p4p/hqi/faqs.jsp. Accessed March 5, 2013.
- Centers for Medicare and Medicaid Services. Hospital Compare Web site. 2013. Available at: http://www.medicare.gov/hospitalcompare. Accessed March 4, 2013.
- , , . “Never events”: not every hospital‐acquired infection is preventable. Clin Infect Dis. 2009;49:743–746.
- . Will pay for performance improve quality of care? The answer is in the details. N Engl J Med. 2012;367:1852–1853.
- , , , , , . Reduced mortality with hospital pay for performance in England. N Engl J Med. 2012;367:1821–1828.
- , , , et al. Public reporting and pay for performance in hospital quality improvement. N Engl J Med. 2007;356:486–496.
- , , , . The long‐term effect of premier pay for performance on patient outcomes. N Engl J Med. 2012;366:1606–1615.
- , , , , . Does performance‐based remuneration for individual health care practitioners affect patient care?: a systematic review. Ann Intern Med. 2012;157:889–899.
- Centers for Medicare and Medicaid Services. Hospital Consumer Assessment Of Healthcare Providers and Systems Web site. 2013. Available at: http://www.hcahpsonline.org. Accessed March 5, 2013.
- . Medicare discloses hospitals' bonuses, penalties based on quality. Kaiser Health News. December 20, 2012. Available at: http://www.kaiserhealthnews.org/stories/2012/december/21/medicare‐hospitals‐value‐based‐purchasing.aspx?referrer=search. Accessed March 26, 2013.
- , , , . Hospital quality and intensity of spending: is there an association? Health Aff (Millwood). 2009;28:w566–w572.
- , , , et al. Association between performance measures and clinical outcomes for patients hospitalized with heart failure. JAMA. 2007;297:61–70.
- , , . The advantages and disadvantages of process‐based measures of health care quality. Int J Qual Health Care. 2001;13:469–474.
- . Accountability, incentives and behavior: the impact of high‐stakes testing in the Chicago public schools. J Public Econ. 2005;89:761–796.
- , , , , , . The implications of regional variations in Medicare spending. Part 1: the content, quality, and accessibility of care. Ann Intern Med. 2003;138:273–287.
- . Medical care—is more always better? N Engl J Med. 2003;349:1665–1667.
- , , . Hospital spending and inpatient mortality: evidence from California: an observational study. Ann Intern Med. 2011;154:160–167.
- . Making it easy to do it right. N Engl J Med. 2001;345:991–993.
- , , , . A high rate of compliance with neonatal intensive care unit transfusion guidelines persists even after a program to improve transfusion guideline compliance ended. Transfusion. 2011;51:2519–2520.
- , , , et al. The impact of removing financial incentives from clinical quality indicators: longitudinal analysis of four Kaiser Permanente indicators. BMJ. 2010;340:c1898.
- , . Medicare's new hospital value‐based purchasing program is likely to have only a small impact on hospital payments. Health Aff (Millwood). 2012;31:1932–1940.
- , , , et al. Pay for performance, quality of care, and outcomes in acute myocardial infarction. JAMA. 2007;297:2373–2380.
- , , . Can you get what you pay for? Pay‐for‐performance and the quality of healthcare providers. Rand J Econ. 2010;41:64–91.
- , , , . Spending and mortality in US acute care hospitals. Am J Manag Care. 2013;19:e46–e54.
- , , , , , . Development and validation of hospital “end‐of‐life” treatment intensity measures. Med Care. 2009;47:1098–1105.
- , , , et al. Looking forward, looking back: assessing variations in hospital resource use and outcomes for elderly patients with heart failure. Circ Cardiovasc Qual Outcomes. 2009;2:548–557.
- , , , et al. Association of hospital spending intensity with mortality and readmission rates in Ontario hospitals. JAMA. 2012;307:1037–1045.
- , , . Patient satisfaction with hospital care: effects of demographic and institutional characteristics. Med Care. 2000;38:325–334.
- , , . Linking performance with payment: implementing the Physician Value‐Based Payment Modifier. JAMA. 2012;308:2089–2090.
- , , , , . Proportion of hospital readmissions deemed avoidable: a systematic review. CMAJ. 2011;183:E391–E402.
- , , , et al. Incidence of potentially avoidable urgent readmissions and their relation to all‐cause urgent readmissions. CMAJ. 2011;183:E1067–E1072.
- , . Thirty‐day readmissions—truth and consequences. N Engl J Med. 2012;366:1366–1369.
- , , . Thirty‐day readmission rates for Medicare beneficiaries by race and site of care. JAMA. 2011;305:675–681.
- Centers for Medicare and Medicaid Services. Hospital Value‐Based Purchasing Web site. 2013. Available at: http://www.cms.gov/Medicare/Quality‐Initiatives‐Patient‐Assessment‐Instruments/hospital‐value‐based‐purchasing/index.html. Accessed March 4, 2013.
- , . Value‐based purchasing—national programs to move from volume to value. N Engl J Med. 2012;367:292–295.
- , . Hospital value‐based purchasing: will Medicare's new policy exacerbate disparities? Circ Cardiovasc Qual Outcomes. 2012;5:148–149.
- Centers for Medicare and Medicaid Services. CMS/premier hospital quality incentive demonstration (QHID). 2013. Available at: https://www.premierinc.com/quality‐safety/tools‐services/p4p/hqi/faqs.jsp. Accessed March 5, 2013.
- Centers for Medicare and Medicaid Services. Hospital Compare Web site. 2013. Available at: http://www.medicare.gov/hospitalcompare. Accessed March 4, 2013.
- , , . “Never events”: not every hospital‐acquired infection is preventable. Clin Infect Dis. 2009;49:743–746.
- . Will pay for performance improve quality of care? The answer is in the details. N Engl J Med. 2012;367:1852–1853.
- , , , , , . Reduced mortality with hospital pay for performance in England. N Engl J Med. 2012;367:1821–1828.
- , , , et al. Public reporting and pay for performance in hospital quality improvement. N Engl J Med. 2007;356:486–496.
- , , , . The long‐term effect of premier pay for performance on patient outcomes. N Engl J Med. 2012;366:1606–1615.
- , , , , . Does performance‐based remuneration for individual health care practitioners affect patient care?: a systematic review. Ann Intern Med. 2012;157:889–899.
- Centers for Medicare and Medicaid Services. Hospital Consumer Assessment Of Healthcare Providers and Systems Web site. 2013. Available at: http://www.hcahpsonline.org. Accessed March 5, 2013.
- . Medicare discloses hospitals' bonuses, penalties based on quality. Kaiser Health News. December 20, 2012. Available at: http://www.kaiserhealthnews.org/stories/2012/december/21/medicare‐hospitals‐value‐based‐purchasing.aspx?referrer=search. Accessed March 26, 2013.
- , , , . Hospital quality and intensity of spending: is there an association? Health Aff (Millwood). 2009;28:w566–w572.
- , , , et al. Association between performance measures and clinical outcomes for patients hospitalized with heart failure. JAMA. 2007;297:61–70.
- , , . The advantages and disadvantages of process‐based measures of health care quality. Int J Qual Health Care. 2001;13:469–474.
- . Accountability, incentives and behavior: the impact of high‐stakes testing in the Chicago public schools. J Public Econ. 2005;89:761–796.
- , , , , , . The implications of regional variations in Medicare spending. Part 1: the content, quality, and accessibility of care. Ann Intern Med. 2003;138:273–287.
- . Medical care—is more always better? N Engl J Med. 2003;349:1665–1667.
- , , . Hospital spending and inpatient mortality: evidence from California: an observational study. Ann Intern Med. 2011;154:160–167.
- . Making it easy to do it right. N Engl J Med. 2001;345:991–993.
- , , , . A high rate of compliance with neonatal intensive care unit transfusion guidelines persists even after a program to improve transfusion guideline compliance ended. Transfusion. 2011;51:2519–2520.
- , , , et al. The impact of removing financial incentives from clinical quality indicators: longitudinal analysis of four Kaiser Permanente indicators. BMJ. 2010;340:c1898.
- , . Medicare's new hospital value‐based purchasing program is likely to have only a small impact on hospital payments. Health Aff (Millwood). 2012;31:1932–1940.
- , , , et al. Pay for performance, quality of care, and outcomes in acute myocardial infarction. JAMA. 2007;297:2373–2380.
- , , . Can you get what you pay for? Pay‐for‐performance and the quality of healthcare providers. Rand J Econ. 2010;41:64–91.
- , , , . Spending and mortality in US acute care hospitals. Am J Manag Care. 2013;19:e46–e54.
- , , , , , . Development and validation of hospital “end‐of‐life” treatment intensity measures. Med Care. 2009;47:1098–1105.
- , , , et al. Looking forward, looking back: assessing variations in hospital resource use and outcomes for elderly patients with heart failure. Circ Cardiovasc Qual Outcomes. 2009;2:548–557.
- , , , et al. Association of hospital spending intensity with mortality and readmission rates in Ontario hospitals. JAMA. 2012;307:1037–1045.
- , , . Patient satisfaction with hospital care: effects of demographic and institutional characteristics. Med Care. 2000;38:325–334.
- , , . Linking performance with payment: implementing the Physician Value‐Based Payment Modifier. JAMA. 2012;308:2089–2090.
- , , , , . Proportion of hospital readmissions deemed avoidable: a systematic review. CMAJ. 2011;183:E391–E402.
- , , , et al. Incidence of potentially avoidable urgent readmissions and their relation to all‐cause urgent readmissions. CMAJ. 2011;183:E1067–E1072.
- , . Thirty‐day readmissions—truth and consequences. N Engl J Med. 2012;366:1366–1369.
- , , . Thirty‐day readmission rates for Medicare beneficiaries by race and site of care. JAMA. 2011;305:675–681.
Medications and Pediatric Deterioration
In recent years, many hospitals have implemented rapid response systems (RRSs) in efforts to reduce mortality outside the intensive care unit (ICU). Rapid response systems include 2 clinical components (efferent and afferent limbs) and 2 organizational components (process improvement and administrative limbs).[1, 2] The efferent limb includes medical emergency teams (METs) that can be summoned to hospital wards to rescue deteriorating patients. The afferent limb identifies patients at risk of deterioration using tools such as early warning scores and triggers a MET response when appropriate.[2] The process‐improvement limb evaluates and optimizes the RRS. The administrative limb implements the RRS and supports its ongoing operation. The effectiveness of most RRSs depends upon the ward team making the decision to escalate care by activating the MET. Barriers to activating the MET may include reduced situational awareness,[3, 4] hierarchical barriers to calling for help,[3, 4, 5, 6, 7, 8] fear of criticism,[3, 8, 9] and other hospital safety cultural barriers.[3, 4, 8]
Proactive critical‐care outreach[10, 11, 12, 13] or rover[14] teams seek to reduce barriers to activation and improve outcomes by systematically identifying and evaluating at‐risk patients without relying on requests for assistance from the ward team. Structured similarly to early warning scores, surveillance tools intended for rover teams might improve their ability to rapidly identify at‐risk patients throughout a hospital. They could combine vital signs with other variables, such as diagnostic and therapeutic interventions that reflect the ward team's early, evolving concern. In particular, the incorporation of medications associated with deterioration may enhance the performance of surveillance tools.
Medications may be associated with deterioration in one of several ways. They could play a causal role in deterioration (ie, opioids causing respiratory insufficiency), represent clinical worsening and anticipation of possible deterioration (ie, broad‐spectrum antibiotics for a positive blood culture), or represent rescue therapies for early deterioration (ie, antihistamines for allergic reactions). In each case, the associated therapeutic classes could be considered sentinel markers of clinical deterioration.
Combined with vital signs and other risk factors, therapeutic classes could serve as useful components of surveillance tools to detect signs of early, evolving deterioration and flag at‐risk patients for evaluation. As a first step, we sought to identify therapeutic classes associated with clinical deterioration. This effort to improve existing afferent tools falls within the process‐improvement limb of RRSs.
PATIENTS AND METHODS
Study Design
We performed a case‐crossover study of children who experienced clinical deterioration. An alternative to the matched case‐control design, the case‐crossover design involves longitudinal within‐subject comparisons exclusively of case subjects such that an individual serves as his or her own control. It is most effective when studying intermittent exposures that result in transient changes in the risk of an acute event,[15, 16, 17] making it appropriate for our study.
Using the case‐crossover design, we compared a discrete time period in close proximity to the deterioration event, called the hazard interval, with earlier time periods in the hospitalization, called the control intervals.[15, 16, 17] In our primary analysis (Figure 1B), we defined the durations of these intervals as follows: We first censored the 2 hours immediately preceding the clinical deterioration event (hours 0 to 2). We made this decision a priori to exclude medications used after deterioration was recognized and resuscitation had already begun. The 12‐hour period immediately preceding the censored interval was the hazard interval (hours 2 to 14). Each 12‐hour period immediately preceding the hazard interval was a control interval (hours 14 to 26, 26 to 38, 38 to 50, and 50 to 62). Depending on the child's length of stay prior to the deterioration event, each hazard interval had 14 control intervals for comparison. In sensitivity analysis, we altered the durations of these intervals (see below).
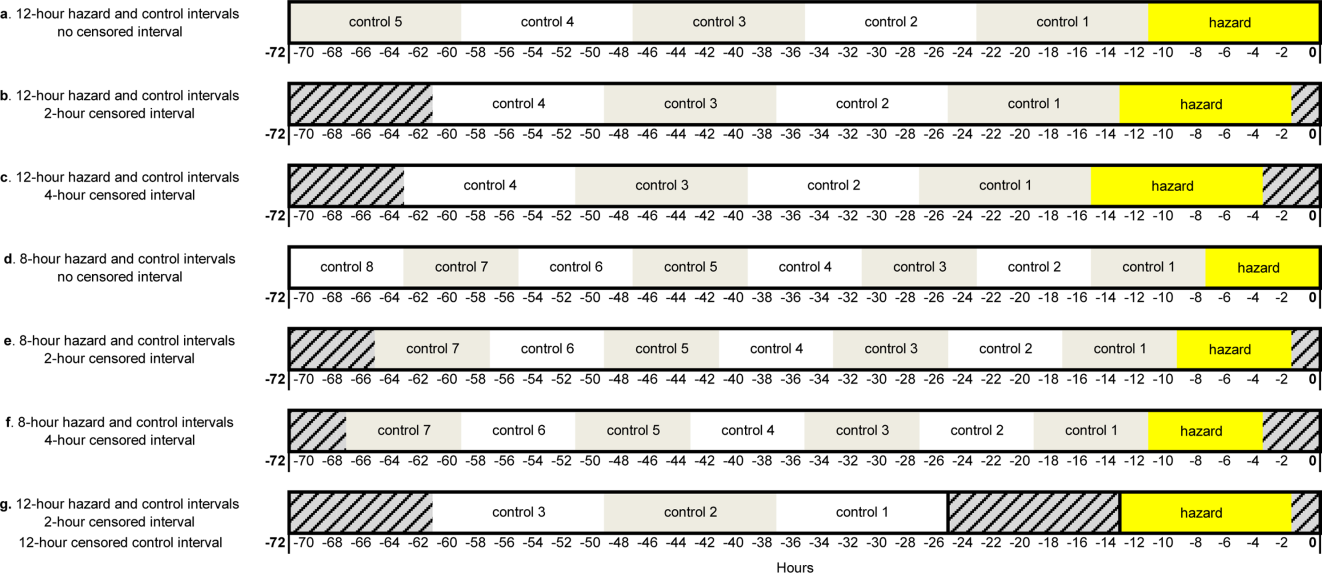
Study Setting and Participants
We performed this study among children age <18 years who experienced clinical deterioration between January 1, 2005, and December 31, 2008, after being hospitalized on a general medical or surgical unit at The Children's Hospital of Philadelphia for 24 hours. Clinical deterioration was a composite outcome defined as cardiopulmonary arrest (CPA), acute respiratory compromise (ARC), or urgent ICU transfer. Cardiopulmonary arrest events required either pulselessness or a pulse with inadequate perfusion treated with chest compressions and/or defibrillation. Acute respiratory compromise events required respiratory insufficiency treated with bag‐valve‐mask or invasive airway interventions. Urgent ICU transfers included 1 of the following outcomes in the 12 hours after transfer: death, CPA, intubation, initiation of noninvasive ventilation, or administration of a vasoactive medication infusion used for the treatment of shock. Time zero was the time of the CPA/ARC, or the time at which the child arrived in the ICU for urgent transfers. These subjects also served as the cases for a previously published case‐control study evaluating different risk factors for deterioration.[18] The institutional review board of The Children's Hospital of Philadelphia approved the study.
At the time of the study, the hospital did not have a formal RRS. An immediate‐response code‐blue team was available throughout the study period for emergencies occurring outside the ICU. Physicians could also page the pediatric ICU fellow to discuss patients who did not require immediate assistance from the code‐blue team but were clinically deteriorating. There were no established triggering criteria.
Medication Exposures
Intravenous (IV) medications administered in the 72 hours prior to clinical deterioration were considered the exposures of interest. Each medication was included in 1 therapeutic classes assigned in the hospital's formulary (Lexicomp, Hudson, OH).[19] In order to determine which therapeutic classes to evaluate, we performed a power calculation using the sampsi_mcc package for Stata 12 (StataCorp, College Station, TX). We estimated that we would have 3 matched control intervals per hazard interval. We found that, in order to detect a minimum odds ratio of 3.0 with 80% power, a therapeutic class had to be administered in 5% of control periods. All therapeutic classes meeting that requirement were included in the analysis and are listed in Table 1. (See lists of the individual medications comprising each class in the Supporting Information, Tables 124, in the online version of this article.)
| Therapeutic Class | No. of Control Intervals | % |
|---|---|---|
| ||
| Sedatives | 107 | 25 |
| Antiemetics | 92 | 22 |
| Third‐ and fourth‐generation cephalosporins | 83 | 20 |
| Antihistamines | 74 | 17 |
| Antidotes to hypersensitivity reactions (diphenhydramine) | 65 | 15 |
| Gastric acid secretion inhibitors | 62 | 15 |
| Loop diuretics | 62 | 15 |
| Anti‐inflammatory agents | 61 | 14 |
| Penicillin antibiotics | 61 | 14 |
| Benzodiazepines | 59 | 14 |
| Hypnotics | 58 | 14 |
| Narcotic analgesics (full opioid agonists) | 54 | 13 |
| Antianxiety agents | 53 | 13 |
| Systemic corticosteroids | 53 | 13 |
| Glycopeptide antibiotics (vancomycin) | 46 | 11 |
| Anaerobic antibiotics | 45 | 11 |
| Histamine H2 antagonists | 41 | 10 |
| Antifungal agents | 37 | 9 |
| Phenothiazine derivatives | 37 | 9 |
| Adrenal corticosteroids | 35 | 8 |
| Antiviral agents | 30 | 7 |
| Aminoglycoside antibiotics | 26 | 6 |
| Narcotic analgesics (partial opioid agonists) | 26 | 6 |
| PPIs | 26 | 6 |
Data Collection
Data were abstracted from the electronic medication administration record (Sunrise Clinical Manager; Allscripts, Chicago, IL) into a database. For each subject, we recorded the name and time of administration of each IV medication given in the 72 hours preceding deterioration, as well as demographic, event, and hospitalization characteristics.
Statistical Analysis
We used univariable conditional logistic regression to evaluate the association between each therapeutic class and the composite outcome of clinical deterioration in the primary analysis. Because cases serve as their own controls in the case‐crossover design, this method inherently adjusts for all subject‐specific time‐invariant confounding variables, such as patient demographics, disease, and hospital‐ward characteristics.[15]
Sensitivity Analysis
Our primary analysis used a 2‐hour censored interval and 12‐hour hazard and control intervals. Excluding the censored interval from analysis was a conservative approach that we chose because our goal was to identify therapeutic classes associated with deterioration during a phase in which adverse outcomes may be prevented with early intervention. In order to test whether our findings were stable across different lengths of censored, hazard, and control intervals, we performed a sensitivity analysis, also using conditional logistic regression, on all therapeutic classes that were significant (P<0.05) in primary analysis. In 6 iterations of the sensitivity analysis, we varied the length of the hazard and control intervals between 8 and 12 hours, and the length of the censored interval between 0 and 4 hours (Figure 1AF). In a seventh iteration, we used a variant of the primary analysis in which we censored the first control interval (Figure 1G).
RESULTS
We identified 12 CPAs, 41 ARCs, and 699 ICU transfers during the study period. Of these 752 events, 141 (19%) were eligible as cases according to our inclusion criteria.[18] (A flowchart demonstrating the identification of eligible cases is provided in Supporting Table 25 in the online version of this article.) Of the 81% excluded, 37% were ICU transfers who did not meet urgent criteria. Another 31% were excluded because they were hospitalized for <24 hours at the time of the event, making their analysis in a case‐crossover design using 12‐hour periods impossible. Event characteristics, demographics, and hospitalization characteristics are shown in Table 2.
| n | % | |
|---|---|---|
| ||
| Type of event | ||
| CPA | 4 | 3 |
| ARC | 29 | 20 |
| Urgent ICU transfer | 108 | 77 |
| Demographics | ||
| Age | ||
| 0<6 months | 17 | 12 |
| 6<12 months | 22 | 16 |
| 1<4 years | 34 | 24 |
| 4<10 years | 26 | 18 |
| 10<18 years | 42 | 30 |
| Sex | ||
| F | 60 | 43 |
| M | 81 | 57 |
| Race | ||
| White | 69 | 49 |
| Black/African American | 49 | 35 |
| Asian/Pacific Islander | 0 | 0 |
| Other | 23 | 16 |
| Ethnicity | ||
| Non‐Hispanic | 127 | 90 |
| Hispanic | 14 | 10 |
| Hospitalization | ||
| Surgical service | 4 | 3 |
| Survived to hospital discharge | 107 | 76 |
Primary Analysis
A total of 141 hazard intervals and 487 control intervals were included in the primary analysis, the results of which are shown in Table 3. Among the antimicrobial therapeutic classes, glycopeptide antibiotics (vancomycin), anaerobic antibiotics, third‐generation and fourth‐generation cephalosporins, and aminoglycoside antibiotics were significant. All of the anti‐inflammatory therapeutic classes, including systemic corticosteroids, anti‐inflammatory agents, and adrenal corticosteroids, were significant. All of the sedatives, hypnotics, and antianxiety therapeutic classes, including sedatives, benzodiazepines, hypnotics, and antianxiety agents, were significant. Among the narcotic analgesic therapeutic classes, only 1 class, narcotic analgesics (full opioid agonists), was significant. None of the gastrointestinal therapeutic classes were significant. Among the classes classified as other, loop diuretics and antidotes to hypersensitivity reactions (diphenhydramine) were significant.
| OR | LCI | UCI | P Value | |
|---|---|---|---|---|
| ||||
| Antimicrobial therapeutic classes | ||||
| Glycopeptide antibiotics (vancomycin) | 5.84 | 2.01 | 16.98 | 0.001 |
| Anaerobic antibiotics | 5.33 | 1.36 | 20.94 | 0.02 |
| Third‐ and fourth‐generation cephalosporins | 2.78 | 1.15 | 6.69 | 0.02 |
| Aminoglycoside antibiotics | 2.90 | 1.11 | 7.56 | 0.03 |
| Penicillin antibiotics | 2.40 | 0.9 | 6.4 | 0.08 |
| Antiviral agents | 1.52 | 0.20 | 11.46 | 0.68 |
| Antifungal agents | 1.06 | 0.44 | 2.58 | 0.89 |
| Corticosteroids and other anti‐inflammatory therapeutic classes* | ||||
| Systemic corticosteroids | 3.69 | 1.09 | 12.55 | 0.04 |
| Anti‐inflammatory agents | 3.69 | 1.09 | 12.55 | 0.04 |
| Adrenal corticosteroids | 3.69 | 1.09 | 12.55 | 0.04 |
| Sedatives, hypnotics, and antianxiety therapeutic classes | ||||
| Sedatives | 3.48 | 1.78 | 6.78 | <0.001 |
| Benzodiazepines | 2.71 | 1.36 | 5.40 | 0.01 |
| Hypnotics | 2.54 | 1.27 | 5.09 | 0.01 |
| Antianxiety agents | 2.28 | 1.06 | 4.91 | 0.04 |
| Narcotic analgesic therapeutic classes | ||||
| Narcotic analgesics (full opioid agonists) | 2.48 | 1.07 | 5.73 | 0.03 |
| Narcotic analgesics (partial opioid agonists) | 1.97 | 0.57 | 6.85 | 0.29 |
| GI therapeutic classes | ||||
| Antiemetics | 0.57 | 0.22 | 1.48 | 0.25 |
| PPIs | 2.05 | 0.58 | 7.25 | 0.26 |
| Phenothiazine derivatives | 0.47 | 0.12 | 1.83 | 0.27 |
| Gastric acid secretion inhibitors | 1.71 | 0.61 | 4.81 | 0.31 |
| Histamine H2 antagonists | 0.95 | 0.17 | 5.19 | 0.95 |
| Other therapeutic classes | ||||
| Loop diuretics | 2.87 | 1.28 | 6.47 | 0.01 |
| Antidotes to hypersensitivity reactions (diphenhydramine) | 2.45 | 1.15 | 5.23 | 0.02 |
| Antihistamines | 2.00 | 0.97 | 4.12 | 0.06 |
Sensitivity Analysis
Of the 14 classes that were significant in primary analysis, we carried 9 forward to sensitivity analysis. The 5 that were not carried forward overlapped substantially with other classes that were carried forward. The decision of which overlapping class to carry forward was based upon (1) parsimony and (2) clinical relevance. This is described briefly in the footnotes to Table 3 (see Supporting information in the online version of this article for a full description of this process). Figure 2 presents the odds ratios and their 95% confidence intervals for the sensitivity analysis of each therapeutic class that was significant in primary analysis. Loop diuretics remained significantly associated with deterioration in all 7 iterations. Glycopeptide antibiotics (vancomycin), third‐generation and fourth‐generation cephalosporins, systemic corticosteroids, and benzodiazepines were significant in 6. Anaerobic antibiotics and narcotic analgesics (full opioid agonists) were significant in 5, and aminoglycoside antibiotics and antidotes to hypersensitivity reactions (diphenhydramine) in 4.
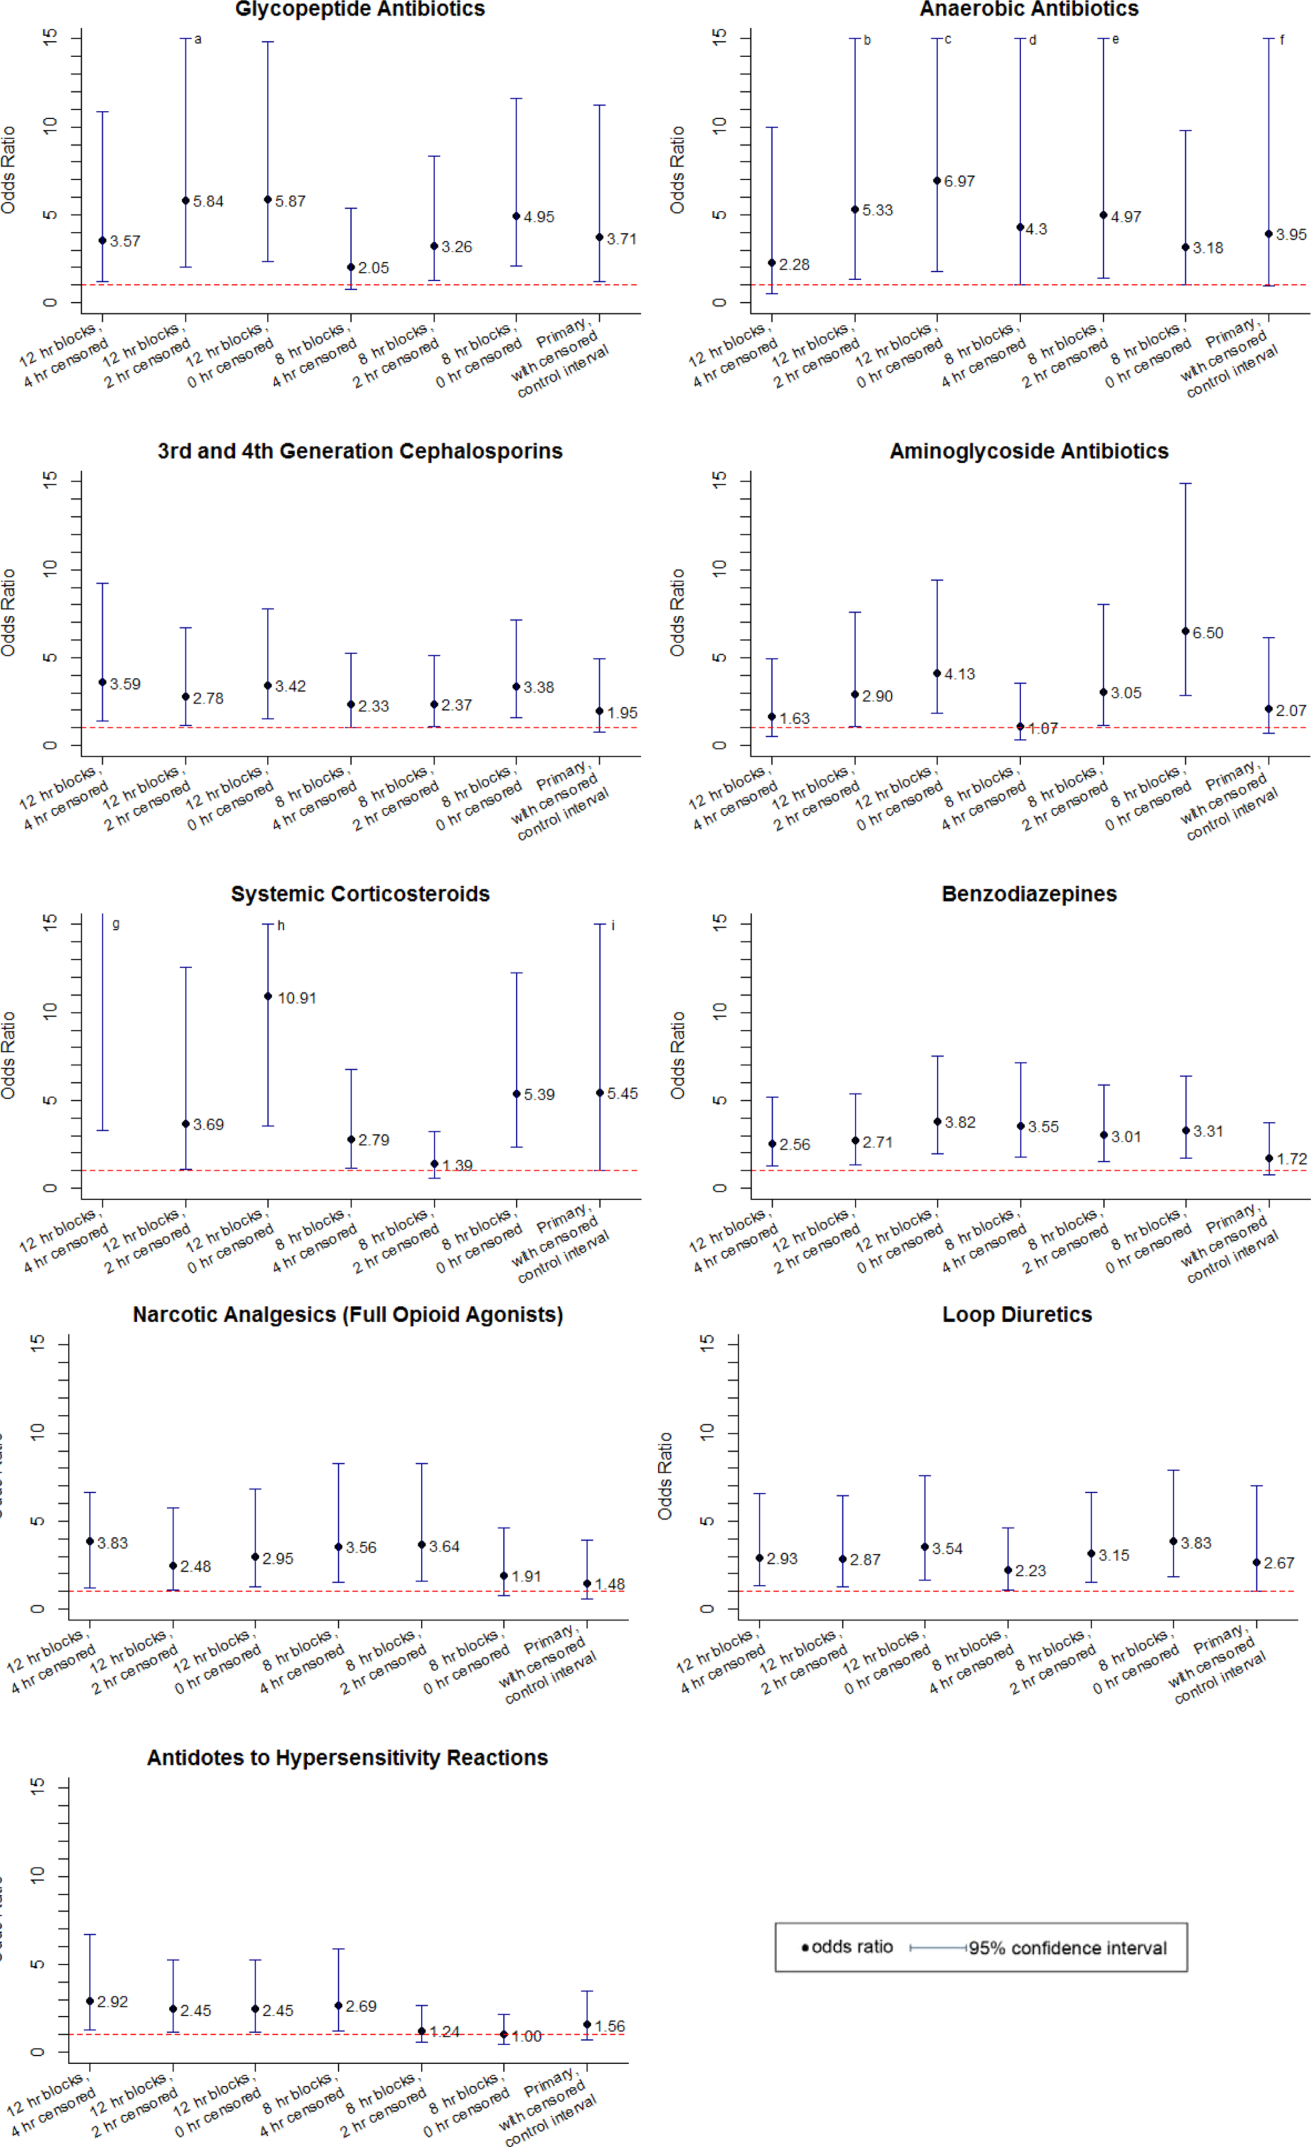
DISCUSSION
We identified 9 therapeutic classes which were associated with a 2.5‐fold to 5.8‐fold increased risk of clinical deterioration. The results were robust to sensitivity analysis. Given their temporal association to the deterioration events, these therapeutic classes may serve as sentinels of early deterioration and are candidate variables to combine with vital signs and other risk factors in a surveillance tool for rover teams or an early warning score.
Although most early warning scores intended for use at the bedside are based upon vital signs and clinical observations, a few also include medications. Monaghan's Pediatric Early Warning Score, the basis for many modified scores used in children's hospitals throughout the world, assigns points for children requiring frequent doses of nebulized medication.[20, 21, 22] Nebulized epinephrine is a component of the Bristol Paediatric Early Warning Tool.[23] The number of medications administered in the preceding 24 hours was included in an early version of the Bedside Paediatric Early Warning System Score.[24] Adding IV antibiotics to the Maximum Modified Early Warning Score improved prediction of the need for higher care utilization among hospitalized adults.[25]
In order to determine the role of the IV medications we found to be associated with clinical deterioration, the necessary next step is to develop a multivariable predictive model to determine if they improve the performance of existing early warning scores in identifying deteriorating patients. Although simplicity is an important characteristic of hand‐calculated early warning scores, integration of a more complex scoring system with more variables, such as these medications, into the electronic health record would allow for automated scoring, eliminating the need to sacrifice score performance to keep the tool simple. Integration into the electronic health record would have the additional benefit of making the score available to clinicians who are not at the bedside. Such tools would be especially useful for remote surveillance for deterioration by critical‐care outreach or rover teams.
Our study has several limitations. First, the sample size was small, and although we sought to minimize the likelihood of chance associations by performing sensitivity analysis, these findings should be confirmed in a larger study. Second, we only evaluated IV medications. Medications administered by other routes could also be associated with clinical deterioration and should be analyzed in future studies. Third, we excluded children hospitalized for <24 hours, as well as transfers that did not meet urgent criteria. These may be limitations because (1) the first 24 hours of hospitalization may be a high‐risk period, and (2) patients who were on trajectories toward severe deterioration and received interventions that prevented further deterioration but did not meet urgent transfer criteria were excluded. It may be that the children we included as cases were at increased risk of deterioration that is either more difficult to recognize early, or more difficult to treat effectively without ICU interventions. Finally, we acknowledge that in some cases the therapeutic classes were associated with deterioration in a causal fashion, and in others the medications administered did not cause deterioration but were signs of therapeutic interventions that were initiated in response to clinical worsening. Identifying the specific indications for administration of drugs used in response to clinical worsening may have resulted in stronger associations with deterioration. However, these indications are often complex, multifactorial, and poorly documented in real time. This limits the ability to automate their detection using the electronic health record, the ultimate goal of this line of research.
CONCLUSION
We used a case‐crossover approach to identify therapeutic classes that are associated with increased risk of clinical deterioration in hospitalized children on pediatric wards. These sentinel therapeutic classes may serve as useful components of electronic health recordbased surveillance tools to detect signs of early, evolving deterioration and flag at‐risk patients for critical‐care outreach or rover team review. Future research should focus on evaluating whether including these therapeutic classes in early warning scores improves their accuracy in detecting signs of deterioration and determining if providing this information as clinical decision support improves patient outcomes.
Acknowledgments
Disclosures: This study was funded by The Children's Hospital of Philadelphia Center for Pediatric Clinical Effectiveness Pilot Grant and the University of Pennsylvania Provost's Undergraduate Research Mentoring Program. Drs. Bonafide and Keren also receive funding from the Pennsylvania Health Research Formula Fund Award from the Pennsylvania Department of Health for research in pediatric hospital quality, safety, and costs. The authors have no other conflicts of interest to report.
- , , , et al. Findings of the first consensus conference on medical emergency teams. Crit Care Med. 2006;34(9):2463–2478.
- , , , et al. “Identifying the hospitalised patient in crisis”—a consensus conference on the afferent limb of rapid response systems. Resuscitation. 2010;81(4):375–382.
- , , , . Attitudes and barriers to a medical emergency team system at a tertiary paediatric hospital. Resuscitation. 2011;82(2):167–174.
- , , , et al. Why don't hospital staff activate the rapid response system (RRS)? How frequently is it needed and can the process be improved? Implement Sci. 2011;6:39.
- , . Failure of the afferent limb: a persistent problem in rapid response systems. Resuscitation. 2011;82(7):797–798.
- , , . Understanding how rapid response systems may improve safety for the acutely ill patient: learning from the frontline. BMJ Qual Saf. 2012;21(2):135–144.
- , , . How RNs rescue patients: a qualitative study of RNs' perceived involvement in rapid response teams. Qual Saf Health Care. 2010;19(5):1–4.
- , , , et al. A survey of nurses' beliefs about the medical emergency team system in a Canadian tertiary hospital. Am J Crit Care. 2010;19(1):74–83.
- , , , et al. Nurses' attitudes to a medical emergency team service in a teaching hospital. Qual Saf Health Care. 2006;15(6):427–432.
- , , , et al. Introducing critical care outreach: a ward‐randomised trial of phased introduction in a general hospital. Intensive Care Med. 2004;30(7):1398–1404.
- . Out of our reach? Assessing the impact of introducing a critical care outreach service. Anaesthesia. 2003;58(9):882–885.
- , , . Effect of the critical care outreach team on patient survival to discharge from hospital and readmission to critical care: non‐randomised population based study. BMJ. 2003;327(7422):1014.
- , , , et al. Successful implementation of a family and patient activated rapid response team in an adult level 1 trauma center. Resuscitation. 2010;81(12):1676–1681.
- , , , et al. Beyond rapid response teams: instituting a “Rover Team” improves the management of at‐risk patients, facilitates proactive interventions, and improves outcomes. In: Henriksen K, Battles JB, Keyes MA, Grady ML, eds. Advances in Patient Safety: New Directions and Alternative Approaches. Rockville, MD: Agency for Healthcare Research and Quality; 2008.
- , . The case‐crossover study design in pharmacoepidemiology. Stat Methods Med Res. 2009;18(1):53–65.
- , , , et al. Comparison of the statistical efficiency of case‐crossover and case‐control designs: application to severe cutaneous adverse reactions. J Clin Epidemiol. 2001;54(12):1218–1227.
- . The case‐crossover design: a method for studying transient effects on the risk of acute events. Am J Epidemiol. 1991;133(2):144–153.
- , , , , , . Development of a score to predict clinical deterioration in hospitalized children. J Hosp Med. 2012;7(4):345–349.
- Lexicomp. Available at: http://www.lexi.com. Accessed July 26, 2012.
- , , , , , . Sensitivity of the Pediatric Early Warning Score to identify patient deterioration. Pediatrics. 2010;125(4):e763–e769.
- . Detecting and managing deterioration in children. Paediatr Nurs. 2005;17(1):32–35.
- , , , , . Prospective evaluation of a pediatric inpatient early warning scoring system. J Spec Pediatr Nurs. 2009;14(2):79–85.
- , , . Promoting care for acutely ill children—development and evaluation of a Paediatric Early Warning Tool. Intensive Crit Care Nurs. 2006;22(2):73–81.
- , , . The Pediatric Early Warning System Score: a severity of illness score to predict urgent medical need in hospitalized children. J Crit Care. 2006;21(3):271–278.
- , , , , , . Performance of the maximum modified early warning score to predict the need for higher care utilization among admitted emergency department patients. J Hosp Med. 2010;5(1):E46–E52.
In recent years, many hospitals have implemented rapid response systems (RRSs) in efforts to reduce mortality outside the intensive care unit (ICU). Rapid response systems include 2 clinical components (efferent and afferent limbs) and 2 organizational components (process improvement and administrative limbs).[1, 2] The efferent limb includes medical emergency teams (METs) that can be summoned to hospital wards to rescue deteriorating patients. The afferent limb identifies patients at risk of deterioration using tools such as early warning scores and triggers a MET response when appropriate.[2] The process‐improvement limb evaluates and optimizes the RRS. The administrative limb implements the RRS and supports its ongoing operation. The effectiveness of most RRSs depends upon the ward team making the decision to escalate care by activating the MET. Barriers to activating the MET may include reduced situational awareness,[3, 4] hierarchical barriers to calling for help,[3, 4, 5, 6, 7, 8] fear of criticism,[3, 8, 9] and other hospital safety cultural barriers.[3, 4, 8]
Proactive critical‐care outreach[10, 11, 12, 13] or rover[14] teams seek to reduce barriers to activation and improve outcomes by systematically identifying and evaluating at‐risk patients without relying on requests for assistance from the ward team. Structured similarly to early warning scores, surveillance tools intended for rover teams might improve their ability to rapidly identify at‐risk patients throughout a hospital. They could combine vital signs with other variables, such as diagnostic and therapeutic interventions that reflect the ward team's early, evolving concern. In particular, the incorporation of medications associated with deterioration may enhance the performance of surveillance tools.
Medications may be associated with deterioration in one of several ways. They could play a causal role in deterioration (ie, opioids causing respiratory insufficiency), represent clinical worsening and anticipation of possible deterioration (ie, broad‐spectrum antibiotics for a positive blood culture), or represent rescue therapies for early deterioration (ie, antihistamines for allergic reactions). In each case, the associated therapeutic classes could be considered sentinel markers of clinical deterioration.
Combined with vital signs and other risk factors, therapeutic classes could serve as useful components of surveillance tools to detect signs of early, evolving deterioration and flag at‐risk patients for evaluation. As a first step, we sought to identify therapeutic classes associated with clinical deterioration. This effort to improve existing afferent tools falls within the process‐improvement limb of RRSs.
PATIENTS AND METHODS
Study Design
We performed a case‐crossover study of children who experienced clinical deterioration. An alternative to the matched case‐control design, the case‐crossover design involves longitudinal within‐subject comparisons exclusively of case subjects such that an individual serves as his or her own control. It is most effective when studying intermittent exposures that result in transient changes in the risk of an acute event,[15, 16, 17] making it appropriate for our study.
Using the case‐crossover design, we compared a discrete time period in close proximity to the deterioration event, called the hazard interval, with earlier time periods in the hospitalization, called the control intervals.[15, 16, 17] In our primary analysis (Figure 1B), we defined the durations of these intervals as follows: We first censored the 2 hours immediately preceding the clinical deterioration event (hours 0 to 2). We made this decision a priori to exclude medications used after deterioration was recognized and resuscitation had already begun. The 12‐hour period immediately preceding the censored interval was the hazard interval (hours 2 to 14). Each 12‐hour period immediately preceding the hazard interval was a control interval (hours 14 to 26, 26 to 38, 38 to 50, and 50 to 62). Depending on the child's length of stay prior to the deterioration event, each hazard interval had 14 control intervals for comparison. In sensitivity analysis, we altered the durations of these intervals (see below).
Study Setting and Participants
We performed this study among children age <18 years who experienced clinical deterioration between January 1, 2005, and December 31, 2008, after being hospitalized on a general medical or surgical unit at The Children's Hospital of Philadelphia for 24 hours. Clinical deterioration was a composite outcome defined as cardiopulmonary arrest (CPA), acute respiratory compromise (ARC), or urgent ICU transfer. Cardiopulmonary arrest events required either pulselessness or a pulse with inadequate perfusion treated with chest compressions and/or defibrillation. Acute respiratory compromise events required respiratory insufficiency treated with bag‐valve‐mask or invasive airway interventions. Urgent ICU transfers included 1 of the following outcomes in the 12 hours after transfer: death, CPA, intubation, initiation of noninvasive ventilation, or administration of a vasoactive medication infusion used for the treatment of shock. Time zero was the time of the CPA/ARC, or the time at which the child arrived in the ICU for urgent transfers. These subjects also served as the cases for a previously published case‐control study evaluating different risk factors for deterioration.[18] The institutional review board of The Children's Hospital of Philadelphia approved the study.
At the time of the study, the hospital did not have a formal RRS. An immediate‐response code‐blue team was available throughout the study period for emergencies occurring outside the ICU. Physicians could also page the pediatric ICU fellow to discuss patients who did not require immediate assistance from the code‐blue team but were clinically deteriorating. There were no established triggering criteria.
Medication Exposures
Intravenous (IV) medications administered in the 72 hours prior to clinical deterioration were considered the exposures of interest. Each medication was included in 1 therapeutic classes assigned in the hospital's formulary (Lexicomp, Hudson, OH).[19] In order to determine which therapeutic classes to evaluate, we performed a power calculation using the sampsi_mcc package for Stata 12 (StataCorp, College Station, TX). We estimated that we would have 3 matched control intervals per hazard interval. We found that, in order to detect a minimum odds ratio of 3.0 with 80% power, a therapeutic class had to be administered in 5% of control periods. All therapeutic classes meeting that requirement were included in the analysis and are listed in Table 1. (See lists of the individual medications comprising each class in the Supporting Information, Tables 124, in the online version of this article.)
| Therapeutic Class | No. of Control Intervals | % |
|---|---|---|
| ||
| Sedatives | 107 | 25 |
| Antiemetics | 92 | 22 |
| Third‐ and fourth‐generation cephalosporins | 83 | 20 |
| Antihistamines | 74 | 17 |
| Antidotes to hypersensitivity reactions (diphenhydramine) | 65 | 15 |
| Gastric acid secretion inhibitors | 62 | 15 |
| Loop diuretics | 62 | 15 |
| Anti‐inflammatory agents | 61 | 14 |
| Penicillin antibiotics | 61 | 14 |
| Benzodiazepines | 59 | 14 |
| Hypnotics | 58 | 14 |
| Narcotic analgesics (full opioid agonists) | 54 | 13 |
| Antianxiety agents | 53 | 13 |
| Systemic corticosteroids | 53 | 13 |
| Glycopeptide antibiotics (vancomycin) | 46 | 11 |
| Anaerobic antibiotics | 45 | 11 |
| Histamine H2 antagonists | 41 | 10 |
| Antifungal agents | 37 | 9 |
| Phenothiazine derivatives | 37 | 9 |
| Adrenal corticosteroids | 35 | 8 |
| Antiviral agents | 30 | 7 |
| Aminoglycoside antibiotics | 26 | 6 |
| Narcotic analgesics (partial opioid agonists) | 26 | 6 |
| PPIs | 26 | 6 |
Data Collection
Data were abstracted from the electronic medication administration record (Sunrise Clinical Manager; Allscripts, Chicago, IL) into a database. For each subject, we recorded the name and time of administration of each IV medication given in the 72 hours preceding deterioration, as well as demographic, event, and hospitalization characteristics.
Statistical Analysis
We used univariable conditional logistic regression to evaluate the association between each therapeutic class and the composite outcome of clinical deterioration in the primary analysis. Because cases serve as their own controls in the case‐crossover design, this method inherently adjusts for all subject‐specific time‐invariant confounding variables, such as patient demographics, disease, and hospital‐ward characteristics.[15]
Sensitivity Analysis
Our primary analysis used a 2‐hour censored interval and 12‐hour hazard and control intervals. Excluding the censored interval from analysis was a conservative approach that we chose because our goal was to identify therapeutic classes associated with deterioration during a phase in which adverse outcomes may be prevented with early intervention. In order to test whether our findings were stable across different lengths of censored, hazard, and control intervals, we performed a sensitivity analysis, also using conditional logistic regression, on all therapeutic classes that were significant (P<0.05) in primary analysis. In 6 iterations of the sensitivity analysis, we varied the length of the hazard and control intervals between 8 and 12 hours, and the length of the censored interval between 0 and 4 hours (Figure 1AF). In a seventh iteration, we used a variant of the primary analysis in which we censored the first control interval (Figure 1G).
RESULTS
We identified 12 CPAs, 41 ARCs, and 699 ICU transfers during the study period. Of these 752 events, 141 (19%) were eligible as cases according to our inclusion criteria.[18] (A flowchart demonstrating the identification of eligible cases is provided in Supporting Table 25 in the online version of this article.) Of the 81% excluded, 37% were ICU transfers who did not meet urgent criteria. Another 31% were excluded because they were hospitalized for <24 hours at the time of the event, making their analysis in a case‐crossover design using 12‐hour periods impossible. Event characteristics, demographics, and hospitalization characteristics are shown in Table 2.
| n | % | |
|---|---|---|
| ||
| Type of event | ||
| CPA | 4 | 3 |
| ARC | 29 | 20 |
| Urgent ICU transfer | 108 | 77 |
| Demographics | ||
| Age | ||
| 0<6 months | 17 | 12 |
| 6<12 months | 22 | 16 |
| 1<4 years | 34 | 24 |
| 4<10 years | 26 | 18 |
| 10<18 years | 42 | 30 |
| Sex | ||
| F | 60 | 43 |
| M | 81 | 57 |
| Race | ||
| White | 69 | 49 |
| Black/African American | 49 | 35 |
| Asian/Pacific Islander | 0 | 0 |
| Other | 23 | 16 |
| Ethnicity | ||
| Non‐Hispanic | 127 | 90 |
| Hispanic | 14 | 10 |
| Hospitalization | ||
| Surgical service | 4 | 3 |
| Survived to hospital discharge | 107 | 76 |
Primary Analysis
A total of 141 hazard intervals and 487 control intervals were included in the primary analysis, the results of which are shown in Table 3. Among the antimicrobial therapeutic classes, glycopeptide antibiotics (vancomycin), anaerobic antibiotics, third‐generation and fourth‐generation cephalosporins, and aminoglycoside antibiotics were significant. All of the anti‐inflammatory therapeutic classes, including systemic corticosteroids, anti‐inflammatory agents, and adrenal corticosteroids, were significant. All of the sedatives, hypnotics, and antianxiety therapeutic classes, including sedatives, benzodiazepines, hypnotics, and antianxiety agents, were significant. Among the narcotic analgesic therapeutic classes, only 1 class, narcotic analgesics (full opioid agonists), was significant. None of the gastrointestinal therapeutic classes were significant. Among the classes classified as other, loop diuretics and antidotes to hypersensitivity reactions (diphenhydramine) were significant.
| OR | LCI | UCI | P Value | |
|---|---|---|---|---|
| ||||
| Antimicrobial therapeutic classes | ||||
| Glycopeptide antibiotics (vancomycin) | 5.84 | 2.01 | 16.98 | 0.001 |
| Anaerobic antibiotics | 5.33 | 1.36 | 20.94 | 0.02 |
| Third‐ and fourth‐generation cephalosporins | 2.78 | 1.15 | 6.69 | 0.02 |
| Aminoglycoside antibiotics | 2.90 | 1.11 | 7.56 | 0.03 |
| Penicillin antibiotics | 2.40 | 0.9 | 6.4 | 0.08 |
| Antiviral agents | 1.52 | 0.20 | 11.46 | 0.68 |
| Antifungal agents | 1.06 | 0.44 | 2.58 | 0.89 |
| Corticosteroids and other anti‐inflammatory therapeutic classes* | ||||
| Systemic corticosteroids | 3.69 | 1.09 | 12.55 | 0.04 |
| Anti‐inflammatory agents | 3.69 | 1.09 | 12.55 | 0.04 |
| Adrenal corticosteroids | 3.69 | 1.09 | 12.55 | 0.04 |
| Sedatives, hypnotics, and antianxiety therapeutic classes | ||||
| Sedatives | 3.48 | 1.78 | 6.78 | <0.001 |
| Benzodiazepines | 2.71 | 1.36 | 5.40 | 0.01 |
| Hypnotics | 2.54 | 1.27 | 5.09 | 0.01 |
| Antianxiety agents | 2.28 | 1.06 | 4.91 | 0.04 |
| Narcotic analgesic therapeutic classes | ||||
| Narcotic analgesics (full opioid agonists) | 2.48 | 1.07 | 5.73 | 0.03 |
| Narcotic analgesics (partial opioid agonists) | 1.97 | 0.57 | 6.85 | 0.29 |
| GI therapeutic classes | ||||
| Antiemetics | 0.57 | 0.22 | 1.48 | 0.25 |
| PPIs | 2.05 | 0.58 | 7.25 | 0.26 |
| Phenothiazine derivatives | 0.47 | 0.12 | 1.83 | 0.27 |
| Gastric acid secretion inhibitors | 1.71 | 0.61 | 4.81 | 0.31 |
| Histamine H2 antagonists | 0.95 | 0.17 | 5.19 | 0.95 |
| Other therapeutic classes | ||||
| Loop diuretics | 2.87 | 1.28 | 6.47 | 0.01 |
| Antidotes to hypersensitivity reactions (diphenhydramine) | 2.45 | 1.15 | 5.23 | 0.02 |
| Antihistamines | 2.00 | 0.97 | 4.12 | 0.06 |
Sensitivity Analysis
Of the 14 classes that were significant in primary analysis, we carried 9 forward to sensitivity analysis. The 5 that were not carried forward overlapped substantially with other classes that were carried forward. The decision of which overlapping class to carry forward was based upon (1) parsimony and (2) clinical relevance. This is described briefly in the footnotes to Table 3 (see Supporting information in the online version of this article for a full description of this process). Figure 2 presents the odds ratios and their 95% confidence intervals for the sensitivity analysis of each therapeutic class that was significant in primary analysis. Loop diuretics remained significantly associated with deterioration in all 7 iterations. Glycopeptide antibiotics (vancomycin), third‐generation and fourth‐generation cephalosporins, systemic corticosteroids, and benzodiazepines were significant in 6. Anaerobic antibiotics and narcotic analgesics (full opioid agonists) were significant in 5, and aminoglycoside antibiotics and antidotes to hypersensitivity reactions (diphenhydramine) in 4.
DISCUSSION
We identified 9 therapeutic classes which were associated with a 2.5‐fold to 5.8‐fold increased risk of clinical deterioration. The results were robust to sensitivity analysis. Given their temporal association to the deterioration events, these therapeutic classes may serve as sentinels of early deterioration and are candidate variables to combine with vital signs and other risk factors in a surveillance tool for rover teams or an early warning score.
Although most early warning scores intended for use at the bedside are based upon vital signs and clinical observations, a few also include medications. Monaghan's Pediatric Early Warning Score, the basis for many modified scores used in children's hospitals throughout the world, assigns points for children requiring frequent doses of nebulized medication.[20, 21, 22] Nebulized epinephrine is a component of the Bristol Paediatric Early Warning Tool.[23] The number of medications administered in the preceding 24 hours was included in an early version of the Bedside Paediatric Early Warning System Score.[24] Adding IV antibiotics to the Maximum Modified Early Warning Score improved prediction of the need for higher care utilization among hospitalized adults.[25]
In order to determine the role of the IV medications we found to be associated with clinical deterioration, the necessary next step is to develop a multivariable predictive model to determine if they improve the performance of existing early warning scores in identifying deteriorating patients. Although simplicity is an important characteristic of hand‐calculated early warning scores, integration of a more complex scoring system with more variables, such as these medications, into the electronic health record would allow for automated scoring, eliminating the need to sacrifice score performance to keep the tool simple. Integration into the electronic health record would have the additional benefit of making the score available to clinicians who are not at the bedside. Such tools would be especially useful for remote surveillance for deterioration by critical‐care outreach or rover teams.
Our study has several limitations. First, the sample size was small, and although we sought to minimize the likelihood of chance associations by performing sensitivity analysis, these findings should be confirmed in a larger study. Second, we only evaluated IV medications. Medications administered by other routes could also be associated with clinical deterioration and should be analyzed in future studies. Third, we excluded children hospitalized for <24 hours, as well as transfers that did not meet urgent criteria. These may be limitations because (1) the first 24 hours of hospitalization may be a high‐risk period, and (2) patients who were on trajectories toward severe deterioration and received interventions that prevented further deterioration but did not meet urgent transfer criteria were excluded. It may be that the children we included as cases were at increased risk of deterioration that is either more difficult to recognize early, or more difficult to treat effectively without ICU interventions. Finally, we acknowledge that in some cases the therapeutic classes were associated with deterioration in a causal fashion, and in others the medications administered did not cause deterioration but were signs of therapeutic interventions that were initiated in response to clinical worsening. Identifying the specific indications for administration of drugs used in response to clinical worsening may have resulted in stronger associations with deterioration. However, these indications are often complex, multifactorial, and poorly documented in real time. This limits the ability to automate their detection using the electronic health record, the ultimate goal of this line of research.
CONCLUSION
We used a case‐crossover approach to identify therapeutic classes that are associated with increased risk of clinical deterioration in hospitalized children on pediatric wards. These sentinel therapeutic classes may serve as useful components of electronic health recordbased surveillance tools to detect signs of early, evolving deterioration and flag at‐risk patients for critical‐care outreach or rover team review. Future research should focus on evaluating whether including these therapeutic classes in early warning scores improves their accuracy in detecting signs of deterioration and determining if providing this information as clinical decision support improves patient outcomes.
Acknowledgments
Disclosures: This study was funded by The Children's Hospital of Philadelphia Center for Pediatric Clinical Effectiveness Pilot Grant and the University of Pennsylvania Provost's Undergraduate Research Mentoring Program. Drs. Bonafide and Keren also receive funding from the Pennsylvania Health Research Formula Fund Award from the Pennsylvania Department of Health for research in pediatric hospital quality, safety, and costs. The authors have no other conflicts of interest to report.
In recent years, many hospitals have implemented rapid response systems (RRSs) in efforts to reduce mortality outside the intensive care unit (ICU). Rapid response systems include 2 clinical components (efferent and afferent limbs) and 2 organizational components (process improvement and administrative limbs).[1, 2] The efferent limb includes medical emergency teams (METs) that can be summoned to hospital wards to rescue deteriorating patients. The afferent limb identifies patients at risk of deterioration using tools such as early warning scores and triggers a MET response when appropriate.[2] The process‐improvement limb evaluates and optimizes the RRS. The administrative limb implements the RRS and supports its ongoing operation. The effectiveness of most RRSs depends upon the ward team making the decision to escalate care by activating the MET. Barriers to activating the MET may include reduced situational awareness,[3, 4] hierarchical barriers to calling for help,[3, 4, 5, 6, 7, 8] fear of criticism,[3, 8, 9] and other hospital safety cultural barriers.[3, 4, 8]
Proactive critical‐care outreach[10, 11, 12, 13] or rover[14] teams seek to reduce barriers to activation and improve outcomes by systematically identifying and evaluating at‐risk patients without relying on requests for assistance from the ward team. Structured similarly to early warning scores, surveillance tools intended for rover teams might improve their ability to rapidly identify at‐risk patients throughout a hospital. They could combine vital signs with other variables, such as diagnostic and therapeutic interventions that reflect the ward team's early, evolving concern. In particular, the incorporation of medications associated with deterioration may enhance the performance of surveillance tools.
Medications may be associated with deterioration in one of several ways. They could play a causal role in deterioration (ie, opioids causing respiratory insufficiency), represent clinical worsening and anticipation of possible deterioration (ie, broad‐spectrum antibiotics for a positive blood culture), or represent rescue therapies for early deterioration (ie, antihistamines for allergic reactions). In each case, the associated therapeutic classes could be considered sentinel markers of clinical deterioration.
Combined with vital signs and other risk factors, therapeutic classes could serve as useful components of surveillance tools to detect signs of early, evolving deterioration and flag at‐risk patients for evaluation. As a first step, we sought to identify therapeutic classes associated with clinical deterioration. This effort to improve existing afferent tools falls within the process‐improvement limb of RRSs.
PATIENTS AND METHODS
Study Design
We performed a case‐crossover study of children who experienced clinical deterioration. An alternative to the matched case‐control design, the case‐crossover design involves longitudinal within‐subject comparisons exclusively of case subjects such that an individual serves as his or her own control. It is most effective when studying intermittent exposures that result in transient changes in the risk of an acute event,[15, 16, 17] making it appropriate for our study.
Using the case‐crossover design, we compared a discrete time period in close proximity to the deterioration event, called the hazard interval, with earlier time periods in the hospitalization, called the control intervals.[15, 16, 17] In our primary analysis (Figure 1B), we defined the durations of these intervals as follows: We first censored the 2 hours immediately preceding the clinical deterioration event (hours 0 to 2). We made this decision a priori to exclude medications used after deterioration was recognized and resuscitation had already begun. The 12‐hour period immediately preceding the censored interval was the hazard interval (hours 2 to 14). Each 12‐hour period immediately preceding the hazard interval was a control interval (hours 14 to 26, 26 to 38, 38 to 50, and 50 to 62). Depending on the child's length of stay prior to the deterioration event, each hazard interval had 14 control intervals for comparison. In sensitivity analysis, we altered the durations of these intervals (see below).
Study Setting and Participants
We performed this study among children age <18 years who experienced clinical deterioration between January 1, 2005, and December 31, 2008, after being hospitalized on a general medical or surgical unit at The Children's Hospital of Philadelphia for 24 hours. Clinical deterioration was a composite outcome defined as cardiopulmonary arrest (CPA), acute respiratory compromise (ARC), or urgent ICU transfer. Cardiopulmonary arrest events required either pulselessness or a pulse with inadequate perfusion treated with chest compressions and/or defibrillation. Acute respiratory compromise events required respiratory insufficiency treated with bag‐valve‐mask or invasive airway interventions. Urgent ICU transfers included 1 of the following outcomes in the 12 hours after transfer: death, CPA, intubation, initiation of noninvasive ventilation, or administration of a vasoactive medication infusion used for the treatment of shock. Time zero was the time of the CPA/ARC, or the time at which the child arrived in the ICU for urgent transfers. These subjects also served as the cases for a previously published case‐control study evaluating different risk factors for deterioration.[18] The institutional review board of The Children's Hospital of Philadelphia approved the study.
At the time of the study, the hospital did not have a formal RRS. An immediate‐response code‐blue team was available throughout the study period for emergencies occurring outside the ICU. Physicians could also page the pediatric ICU fellow to discuss patients who did not require immediate assistance from the code‐blue team but were clinically deteriorating. There were no established triggering criteria.
Medication Exposures
Intravenous (IV) medications administered in the 72 hours prior to clinical deterioration were considered the exposures of interest. Each medication was included in 1 therapeutic classes assigned in the hospital's formulary (Lexicomp, Hudson, OH).[19] In order to determine which therapeutic classes to evaluate, we performed a power calculation using the sampsi_mcc package for Stata 12 (StataCorp, College Station, TX). We estimated that we would have 3 matched control intervals per hazard interval. We found that, in order to detect a minimum odds ratio of 3.0 with 80% power, a therapeutic class had to be administered in 5% of control periods. All therapeutic classes meeting that requirement were included in the analysis and are listed in Table 1. (See lists of the individual medications comprising each class in the Supporting Information, Tables 124, in the online version of this article.)
| Therapeutic Class | No. of Control Intervals | % |
|---|---|---|
| ||
| Sedatives | 107 | 25 |
| Antiemetics | 92 | 22 |
| Third‐ and fourth‐generation cephalosporins | 83 | 20 |
| Antihistamines | 74 | 17 |
| Antidotes to hypersensitivity reactions (diphenhydramine) | 65 | 15 |
| Gastric acid secretion inhibitors | 62 | 15 |
| Loop diuretics | 62 | 15 |
| Anti‐inflammatory agents | 61 | 14 |
| Penicillin antibiotics | 61 | 14 |
| Benzodiazepines | 59 | 14 |
| Hypnotics | 58 | 14 |
| Narcotic analgesics (full opioid agonists) | 54 | 13 |
| Antianxiety agents | 53 | 13 |
| Systemic corticosteroids | 53 | 13 |
| Glycopeptide antibiotics (vancomycin) | 46 | 11 |
| Anaerobic antibiotics | 45 | 11 |
| Histamine H2 antagonists | 41 | 10 |
| Antifungal agents | 37 | 9 |
| Phenothiazine derivatives | 37 | 9 |
| Adrenal corticosteroids | 35 | 8 |
| Antiviral agents | 30 | 7 |
| Aminoglycoside antibiotics | 26 | 6 |
| Narcotic analgesics (partial opioid agonists) | 26 | 6 |
| PPIs | 26 | 6 |
Data Collection
Data were abstracted from the electronic medication administration record (Sunrise Clinical Manager; Allscripts, Chicago, IL) into a database. For each subject, we recorded the name and time of administration of each IV medication given in the 72 hours preceding deterioration, as well as demographic, event, and hospitalization characteristics.
Statistical Analysis
We used univariable conditional logistic regression to evaluate the association between each therapeutic class and the composite outcome of clinical deterioration in the primary analysis. Because cases serve as their own controls in the case‐crossover design, this method inherently adjusts for all subject‐specific time‐invariant confounding variables, such as patient demographics, disease, and hospital‐ward characteristics.[15]
Sensitivity Analysis
Our primary analysis used a 2‐hour censored interval and 12‐hour hazard and control intervals. Excluding the censored interval from analysis was a conservative approach that we chose because our goal was to identify therapeutic classes associated with deterioration during a phase in which adverse outcomes may be prevented with early intervention. In order to test whether our findings were stable across different lengths of censored, hazard, and control intervals, we performed a sensitivity analysis, also using conditional logistic regression, on all therapeutic classes that were significant (P<0.05) in primary analysis. In 6 iterations of the sensitivity analysis, we varied the length of the hazard and control intervals between 8 and 12 hours, and the length of the censored interval between 0 and 4 hours (Figure 1AF). In a seventh iteration, we used a variant of the primary analysis in which we censored the first control interval (Figure 1G).
RESULTS
We identified 12 CPAs, 41 ARCs, and 699 ICU transfers during the study period. Of these 752 events, 141 (19%) were eligible as cases according to our inclusion criteria.[18] (A flowchart demonstrating the identification of eligible cases is provided in Supporting Table 25 in the online version of this article.) Of the 81% excluded, 37% were ICU transfers who did not meet urgent criteria. Another 31% were excluded because they were hospitalized for <24 hours at the time of the event, making their analysis in a case‐crossover design using 12‐hour periods impossible. Event characteristics, demographics, and hospitalization characteristics are shown in Table 2.
| n | % | |
|---|---|---|
| ||
| Type of event | ||
| CPA | 4 | 3 |
| ARC | 29 | 20 |
| Urgent ICU transfer | 108 | 77 |
| Demographics | ||
| Age | ||
| 0<6 months | 17 | 12 |
| 6<12 months | 22 | 16 |
| 1<4 years | 34 | 24 |
| 4<10 years | 26 | 18 |
| 10<18 years | 42 | 30 |
| Sex | ||
| F | 60 | 43 |
| M | 81 | 57 |
| Race | ||
| White | 69 | 49 |
| Black/African American | 49 | 35 |
| Asian/Pacific Islander | 0 | 0 |
| Other | 23 | 16 |
| Ethnicity | ||
| Non‐Hispanic | 127 | 90 |
| Hispanic | 14 | 10 |
| Hospitalization | ||
| Surgical service | 4 | 3 |
| Survived to hospital discharge | 107 | 76 |
Primary Analysis
A total of 141 hazard intervals and 487 control intervals were included in the primary analysis, the results of which are shown in Table 3. Among the antimicrobial therapeutic classes, glycopeptide antibiotics (vancomycin), anaerobic antibiotics, third‐generation and fourth‐generation cephalosporins, and aminoglycoside antibiotics were significant. All of the anti‐inflammatory therapeutic classes, including systemic corticosteroids, anti‐inflammatory agents, and adrenal corticosteroids, were significant. All of the sedatives, hypnotics, and antianxiety therapeutic classes, including sedatives, benzodiazepines, hypnotics, and antianxiety agents, were significant. Among the narcotic analgesic therapeutic classes, only 1 class, narcotic analgesics (full opioid agonists), was significant. None of the gastrointestinal therapeutic classes were significant. Among the classes classified as other, loop diuretics and antidotes to hypersensitivity reactions (diphenhydramine) were significant.
| OR | LCI | UCI | P Value | |
|---|---|---|---|---|
| ||||
| Antimicrobial therapeutic classes | ||||
| Glycopeptide antibiotics (vancomycin) | 5.84 | 2.01 | 16.98 | 0.001 |
| Anaerobic antibiotics | 5.33 | 1.36 | 20.94 | 0.02 |
| Third‐ and fourth‐generation cephalosporins | 2.78 | 1.15 | 6.69 | 0.02 |
| Aminoglycoside antibiotics | 2.90 | 1.11 | 7.56 | 0.03 |
| Penicillin antibiotics | 2.40 | 0.9 | 6.4 | 0.08 |
| Antiviral agents | 1.52 | 0.20 | 11.46 | 0.68 |
| Antifungal agents | 1.06 | 0.44 | 2.58 | 0.89 |
| Corticosteroids and other anti‐inflammatory therapeutic classes* | ||||
| Systemic corticosteroids | 3.69 | 1.09 | 12.55 | 0.04 |
| Anti‐inflammatory agents | 3.69 | 1.09 | 12.55 | 0.04 |
| Adrenal corticosteroids | 3.69 | 1.09 | 12.55 | 0.04 |
| Sedatives, hypnotics, and antianxiety therapeutic classes | ||||
| Sedatives | 3.48 | 1.78 | 6.78 | <0.001 |
| Benzodiazepines | 2.71 | 1.36 | 5.40 | 0.01 |
| Hypnotics | 2.54 | 1.27 | 5.09 | 0.01 |
| Antianxiety agents | 2.28 | 1.06 | 4.91 | 0.04 |
| Narcotic analgesic therapeutic classes | ||||
| Narcotic analgesics (full opioid agonists) | 2.48 | 1.07 | 5.73 | 0.03 |
| Narcotic analgesics (partial opioid agonists) | 1.97 | 0.57 | 6.85 | 0.29 |
| GI therapeutic classes | ||||
| Antiemetics | 0.57 | 0.22 | 1.48 | 0.25 |
| PPIs | 2.05 | 0.58 | 7.25 | 0.26 |
| Phenothiazine derivatives | 0.47 | 0.12 | 1.83 | 0.27 |
| Gastric acid secretion inhibitors | 1.71 | 0.61 | 4.81 | 0.31 |
| Histamine H2 antagonists | 0.95 | 0.17 | 5.19 | 0.95 |
| Other therapeutic classes | ||||
| Loop diuretics | 2.87 | 1.28 | 6.47 | 0.01 |
| Antidotes to hypersensitivity reactions (diphenhydramine) | 2.45 | 1.15 | 5.23 | 0.02 |
| Antihistamines | 2.00 | 0.97 | 4.12 | 0.06 |
Sensitivity Analysis
Of the 14 classes that were significant in primary analysis, we carried 9 forward to sensitivity analysis. The 5 that were not carried forward overlapped substantially with other classes that were carried forward. The decision of which overlapping class to carry forward was based upon (1) parsimony and (2) clinical relevance. This is described briefly in the footnotes to Table 3 (see Supporting information in the online version of this article for a full description of this process). Figure 2 presents the odds ratios and their 95% confidence intervals for the sensitivity analysis of each therapeutic class that was significant in primary analysis. Loop diuretics remained significantly associated with deterioration in all 7 iterations. Glycopeptide antibiotics (vancomycin), third‐generation and fourth‐generation cephalosporins, systemic corticosteroids, and benzodiazepines were significant in 6. Anaerobic antibiotics and narcotic analgesics (full opioid agonists) were significant in 5, and aminoglycoside antibiotics and antidotes to hypersensitivity reactions (diphenhydramine) in 4.
DISCUSSION
We identified 9 therapeutic classes which were associated with a 2.5‐fold to 5.8‐fold increased risk of clinical deterioration. The results were robust to sensitivity analysis. Given their temporal association to the deterioration events, these therapeutic classes may serve as sentinels of early deterioration and are candidate variables to combine with vital signs and other risk factors in a surveillance tool for rover teams or an early warning score.
Although most early warning scores intended for use at the bedside are based upon vital signs and clinical observations, a few also include medications. Monaghan's Pediatric Early Warning Score, the basis for many modified scores used in children's hospitals throughout the world, assigns points for children requiring frequent doses of nebulized medication.[20, 21, 22] Nebulized epinephrine is a component of the Bristol Paediatric Early Warning Tool.[23] The number of medications administered in the preceding 24 hours was included in an early version of the Bedside Paediatric Early Warning System Score.[24] Adding IV antibiotics to the Maximum Modified Early Warning Score improved prediction of the need for higher care utilization among hospitalized adults.[25]
In order to determine the role of the IV medications we found to be associated with clinical deterioration, the necessary next step is to develop a multivariable predictive model to determine if they improve the performance of existing early warning scores in identifying deteriorating patients. Although simplicity is an important characteristic of hand‐calculated early warning scores, integration of a more complex scoring system with more variables, such as these medications, into the electronic health record would allow for automated scoring, eliminating the need to sacrifice score performance to keep the tool simple. Integration into the electronic health record would have the additional benefit of making the score available to clinicians who are not at the bedside. Such tools would be especially useful for remote surveillance for deterioration by critical‐care outreach or rover teams.
Our study has several limitations. First, the sample size was small, and although we sought to minimize the likelihood of chance associations by performing sensitivity analysis, these findings should be confirmed in a larger study. Second, we only evaluated IV medications. Medications administered by other routes could also be associated with clinical deterioration and should be analyzed in future studies. Third, we excluded children hospitalized for <24 hours, as well as transfers that did not meet urgent criteria. These may be limitations because (1) the first 24 hours of hospitalization may be a high‐risk period, and (2) patients who were on trajectories toward severe deterioration and received interventions that prevented further deterioration but did not meet urgent transfer criteria were excluded. It may be that the children we included as cases were at increased risk of deterioration that is either more difficult to recognize early, or more difficult to treat effectively without ICU interventions. Finally, we acknowledge that in some cases the therapeutic classes were associated with deterioration in a causal fashion, and in others the medications administered did not cause deterioration but were signs of therapeutic interventions that were initiated in response to clinical worsening. Identifying the specific indications for administration of drugs used in response to clinical worsening may have resulted in stronger associations with deterioration. However, these indications are often complex, multifactorial, and poorly documented in real time. This limits the ability to automate their detection using the electronic health record, the ultimate goal of this line of research.
CONCLUSION
We used a case‐crossover approach to identify therapeutic classes that are associated with increased risk of clinical deterioration in hospitalized children on pediatric wards. These sentinel therapeutic classes may serve as useful components of electronic health recordbased surveillance tools to detect signs of early, evolving deterioration and flag at‐risk patients for critical‐care outreach or rover team review. Future research should focus on evaluating whether including these therapeutic classes in early warning scores improves their accuracy in detecting signs of deterioration and determining if providing this information as clinical decision support improves patient outcomes.
Acknowledgments
Disclosures: This study was funded by The Children's Hospital of Philadelphia Center for Pediatric Clinical Effectiveness Pilot Grant and the University of Pennsylvania Provost's Undergraduate Research Mentoring Program. Drs. Bonafide and Keren also receive funding from the Pennsylvania Health Research Formula Fund Award from the Pennsylvania Department of Health for research in pediatric hospital quality, safety, and costs. The authors have no other conflicts of interest to report.
- , , , et al. Findings of the first consensus conference on medical emergency teams. Crit Care Med. 2006;34(9):2463–2478.
- , , , et al. “Identifying the hospitalised patient in crisis”—a consensus conference on the afferent limb of rapid response systems. Resuscitation. 2010;81(4):375–382.
- , , , . Attitudes and barriers to a medical emergency team system at a tertiary paediatric hospital. Resuscitation. 2011;82(2):167–174.
- , , , et al. Why don't hospital staff activate the rapid response system (RRS)? How frequently is it needed and can the process be improved? Implement Sci. 2011;6:39.
- , . Failure of the afferent limb: a persistent problem in rapid response systems. Resuscitation. 2011;82(7):797–798.
- , , . Understanding how rapid response systems may improve safety for the acutely ill patient: learning from the frontline. BMJ Qual Saf. 2012;21(2):135–144.
- , , . How RNs rescue patients: a qualitative study of RNs' perceived involvement in rapid response teams. Qual Saf Health Care. 2010;19(5):1–4.
- , , , et al. A survey of nurses' beliefs about the medical emergency team system in a Canadian tertiary hospital. Am J Crit Care. 2010;19(1):74–83.
- , , , et al. Nurses' attitudes to a medical emergency team service in a teaching hospital. Qual Saf Health Care. 2006;15(6):427–432.
- , , , et al. Introducing critical care outreach: a ward‐randomised trial of phased introduction in a general hospital. Intensive Care Med. 2004;30(7):1398–1404.
- . Out of our reach? Assessing the impact of introducing a critical care outreach service. Anaesthesia. 2003;58(9):882–885.
- , , . Effect of the critical care outreach team on patient survival to discharge from hospital and readmission to critical care: non‐randomised population based study. BMJ. 2003;327(7422):1014.
- , , , et al. Successful implementation of a family and patient activated rapid response team in an adult level 1 trauma center. Resuscitation. 2010;81(12):1676–1681.
- , , , et al. Beyond rapid response teams: instituting a “Rover Team” improves the management of at‐risk patients, facilitates proactive interventions, and improves outcomes. In: Henriksen K, Battles JB, Keyes MA, Grady ML, eds. Advances in Patient Safety: New Directions and Alternative Approaches. Rockville, MD: Agency for Healthcare Research and Quality; 2008.
- , . The case‐crossover study design in pharmacoepidemiology. Stat Methods Med Res. 2009;18(1):53–65.
- , , , et al. Comparison of the statistical efficiency of case‐crossover and case‐control designs: application to severe cutaneous adverse reactions. J Clin Epidemiol. 2001;54(12):1218–1227.
- . The case‐crossover design: a method for studying transient effects on the risk of acute events. Am J Epidemiol. 1991;133(2):144–153.
- , , , , , . Development of a score to predict clinical deterioration in hospitalized children. J Hosp Med. 2012;7(4):345–349.
- Lexicomp. Available at: http://www.lexi.com. Accessed July 26, 2012.
- , , , , , . Sensitivity of the Pediatric Early Warning Score to identify patient deterioration. Pediatrics. 2010;125(4):e763–e769.
- . Detecting and managing deterioration in children. Paediatr Nurs. 2005;17(1):32–35.
- , , , , . Prospective evaluation of a pediatric inpatient early warning scoring system. J Spec Pediatr Nurs. 2009;14(2):79–85.
- , , . Promoting care for acutely ill children—development and evaluation of a Paediatric Early Warning Tool. Intensive Crit Care Nurs. 2006;22(2):73–81.
- , , . The Pediatric Early Warning System Score: a severity of illness score to predict urgent medical need in hospitalized children. J Crit Care. 2006;21(3):271–278.
- , , , , , . Performance of the maximum modified early warning score to predict the need for higher care utilization among admitted emergency department patients. J Hosp Med. 2010;5(1):E46–E52.
- , , , et al. Findings of the first consensus conference on medical emergency teams. Crit Care Med. 2006;34(9):2463–2478.
- , , , et al. “Identifying the hospitalised patient in crisis”—a consensus conference on the afferent limb of rapid response systems. Resuscitation. 2010;81(4):375–382.
- , , , . Attitudes and barriers to a medical emergency team system at a tertiary paediatric hospital. Resuscitation. 2011;82(2):167–174.
- , , , et al. Why don't hospital staff activate the rapid response system (RRS)? How frequently is it needed and can the process be improved? Implement Sci. 2011;6:39.
- , . Failure of the afferent limb: a persistent problem in rapid response systems. Resuscitation. 2011;82(7):797–798.
- , , . Understanding how rapid response systems may improve safety for the acutely ill patient: learning from the frontline. BMJ Qual Saf. 2012;21(2):135–144.
- , , . How RNs rescue patients: a qualitative study of RNs' perceived involvement in rapid response teams. Qual Saf Health Care. 2010;19(5):1–4.
- , , , et al. A survey of nurses' beliefs about the medical emergency team system in a Canadian tertiary hospital. Am J Crit Care. 2010;19(1):74–83.
- , , , et al. Nurses' attitudes to a medical emergency team service in a teaching hospital. Qual Saf Health Care. 2006;15(6):427–432.
- , , , et al. Introducing critical care outreach: a ward‐randomised trial of phased introduction in a general hospital. Intensive Care Med. 2004;30(7):1398–1404.
- . Out of our reach? Assessing the impact of introducing a critical care outreach service. Anaesthesia. 2003;58(9):882–885.
- , , . Effect of the critical care outreach team on patient survival to discharge from hospital and readmission to critical care: non‐randomised population based study. BMJ. 2003;327(7422):1014.
- , , , et al. Successful implementation of a family and patient activated rapid response team in an adult level 1 trauma center. Resuscitation. 2010;81(12):1676–1681.
- , , , et al. Beyond rapid response teams: instituting a “Rover Team” improves the management of at‐risk patients, facilitates proactive interventions, and improves outcomes. In: Henriksen K, Battles JB, Keyes MA, Grady ML, eds. Advances in Patient Safety: New Directions and Alternative Approaches. Rockville, MD: Agency for Healthcare Research and Quality; 2008.
- , . The case‐crossover study design in pharmacoepidemiology. Stat Methods Med Res. 2009;18(1):53–65.
- , , , et al. Comparison of the statistical efficiency of case‐crossover and case‐control designs: application to severe cutaneous adverse reactions. J Clin Epidemiol. 2001;54(12):1218–1227.
- . The case‐crossover design: a method for studying transient effects on the risk of acute events. Am J Epidemiol. 1991;133(2):144–153.
- , , , , , . Development of a score to predict clinical deterioration in hospitalized children. J Hosp Med. 2012;7(4):345–349.
- Lexicomp. Available at: http://www.lexi.com. Accessed July 26, 2012.
- , , , , , . Sensitivity of the Pediatric Early Warning Score to identify patient deterioration. Pediatrics. 2010;125(4):e763–e769.
- . Detecting and managing deterioration in children. Paediatr Nurs. 2005;17(1):32–35.
- , , , , . Prospective evaluation of a pediatric inpatient early warning scoring system. J Spec Pediatr Nurs. 2009;14(2):79–85.
- , , . Promoting care for acutely ill children—development and evaluation of a Paediatric Early Warning Tool. Intensive Crit Care Nurs. 2006;22(2):73–81.
- , , . The Pediatric Early Warning System Score: a severity of illness score to predict urgent medical need in hospitalized children. J Crit Care. 2006;21(3):271–278.
- , , , , , . Performance of the maximum modified early warning score to predict the need for higher care utilization among admitted emergency department patients. J Hosp Med. 2010;5(1):E46–E52.
Copyright © 2013 Society of Hospital Medicine
Patients at Risk for 30‐Day Readmission
Readmissions to the hospital are common and costly.[1] However, identifying patients prospectively who are likely to be readmitted and who may benefit from interventions to reduce readmission risk has proven challenging, with published risk scores having only moderate ability to discriminate between patients likely and unlikely to be readmitted.[2] One reason for this may be that published studies have not typically focused on patients who are cognitively impaired, psychiatrically ill, have low health or English literacy, or have poor social supports, all of whom may represent a substantial fraction of readmitted patients.[2, 3, 4, 5]
Psychiatric disease, in particular, may contribute to increased readmission risk for nonpsychiatric (medical) illness, and is associated with increased utilization of healthcare resources.[6, 7, 8, 9, 10, 11] For example, patients with mental illness who were discharged from New York hospitals were more likely to be rehospitalized and had more costly readmissions than patients without these comorbidities, including a length of stay nearly 1 day longer on average.[7] An unmet need for treatment of substance abuse was projected to cost Tennessee $772 million of excess healthcare costs in 2000, mostly incurred through repeat hospitalizations and emergency department (ED) visits.[10]
Despite this, few investigators have considered the role of psychiatric disease and/or substance abuse in medical readmission risk. The purpose of the current study was to evaluate the role of psychiatric illness and substance abuse in unselected medical patients to determine their relative contributions to 30‐day all‐cause readmissions (ACR) and potentially avoidable readmissions (PAR).
METHODS
Patients and Setting
We conducted a retrospective cohort study of consecutive adult patients discharged from medicine services at Brigham and Women's Hospital (BWH), a 747‐bed tertiary referral center and teaching hospital, between July 1, 2009 and June 30, 2010. Most patients are cared for by resident housestaff teams at BWH (approximately 25% are cared for by physician assistants working directly with attending physicians), and approximately half receive primary care in the Partners system, which has a shared electronic medical record (EMR). Outpatient mental health services are provided by Partners‐associated mental health professionals including those at McLean Hospital and MassHealth (Medicaid)‐associated sites through the Massachusetts Behavioral Health Partnership. Exclusion criteria were death in the hospital or discharge to another acute care facility. We also excluded patients who left against medical advice (AMA). The study protocol was approved by the Partners Institutional Review Board.
Outcome
The primary outcomes were ACR and PAR within 30 days of discharge. First, we identified all 30‐day readmissions to BWH or to 2 other hospitals in the Partners Healthcare Network (previous studies have shown that 80% of all readmitted patients are readmitted to 1 of these 3 hospitals).[12] For patients with multiple readmissions, only the first readmission was included in the dataset.
To find potentially avoidable readmissions, administrative and billing data for these patients were processed using the SQLape (SQLape s.a.r.l., Corseaux, Switzerland) algorithm, which identifies PAR by excluding patients who undergo planned follow‐up treatment (such as a cycle of planned chemotherapy) or are readmitted for conditions unrelated in any way to the index hospitalization.[13, 14] Common complications of treatment are categorized as potentially avoidable, such as development of a deep venous thrombosis, a decubitus ulcer after prolonged bed rest, or bleeding complications after starting anticoagulation. Although the algorithm identifies theoretically preventable readmissions, the algorithm does not quantify how preventable they are, and these are thus referred to as potentially avoidable. This is similar to other admission metrics, such as the Agency for Healthcare Research and Quality's prevention quality indicators, which are created from a list of ambulatory care‐sensitive conditions.[15] SQLape has the advantage of being a specific tool for readmissions. Patients with 30‐day readmissions identified by SQLape as planned or unlikely to be avoidable were excluded in the PAR analysis, although still included in ACR analysis. In each case, the comparison group is patients without any readmission.
Predictors
Our predictors of interest included the overall prevalence of a psychiatric diagnosis or diagnosis of substance abuse, the presence of specific psychiatric diagnoses, and prescription of psychiatric medications to help assess the independent contribution of these comorbidities to readmission risk.
We used a combination of easily obtainable inpatient and outpatient clinical and administrative data to identify relevant patients. Patients were considered likely to be psychiatrically ill if they: (1) had a psychiatric diagnosis on their Partners outpatient EMR problem list and were prescribed a medication to treat that condition as an outpatient, or (2) had an International Classification of Diseases, 9th Revision diagnosis of a psychiatric illness at hospital discharge. Patients were considered to have moderate probability of disease if they: (1) had a psychiatric diagnosis on their outpatient problem list, or (2) were prescribed a medication intended to treat a psychiatric condition as an outpatient. Patients were considered unlikely to have psychiatric disease if none of these criteria were met. Patients were considered likely to have a substance abuse disorder if they had this diagnosis on their outpatient EMR, or were prescribed a medication to treat this condition (eg, buprenorphine/naloxone), or received inpatient consultation from a substance abuse treatment team during their inpatient hospitalization, and were considered unlikely if none of these were true. We also evaluated individual categories of psychiatric illness (schizophrenia, depression, anxiety, bipolar disorder) and of psychotropic medications (antidepressants, antipsychotics, anxiolytics).
Potential Confounders
Data on potential confounders, based on prior literature,[16, 17] collected at the index admission were derived from electronic administrative, clinical, and billing sources, including the Brigham Integrated Computer System and the Partners Clinical Data Repository. They included patient age, gender, ethnicity, primary language, marital status, insurance status, living situation prior to admission, discharge location, length of stay, Elixhauser comorbidity index,[18] total number of medications prescribed, and number of prior admissions and ED visits in the prior year.
Statistical Analysis
Bivariate comparisons of each of the predictors of ACR and PAR risk (ie, patients with a 30‐day ACR or PAR vs those not readmitted within 30 days) were conducted using 2 trend tests for ordinal predictors (eg, likelihood of psychiatric disease), and 2 or Fisher exact test for dichotomous predictors (eg, receipt of inpatient substance abuse counseling).
We then used multivariate logistic regression analysis to adjust for all of the potential confounders noted above, entering each variable related to psychiatric illness into the model separately (eg, likely psychiatric illness, number of psychiatric medications). In a secondary analysis, we removed potentially collinear variables from the final model; as this did not alter the results, the full model is presented. We also conducted a secondary analysis where we included patients who left against medical advice (AMA), which also did not alter the results. Two‐sided P values <0.05 were considered significant, and all analyses were performed using the SAS version 9.2 (SAS Institute, Inc., Cary, NC).
RESULTS
There were 7984 unique patients discharged during the study period. Patients were generally white and English speaking; just over half of admissions came from the ED (Table 1). Of note, nearly all patients were insured, as are almost all patients in Massachusetts. They had high degrees of comorbid illness and large numbers of prescribed medications. Nearly 30% had at least 1 hospital admission within the prior year.
| Characteristic | All Patients, N (%) | Not Readmitted, N (%) | ACR, N (%) | PAR N (%)a |
|---|---|---|---|---|
| ||||
| Study cohort | 6987 (100) | 5727 (72) | 1260 (18) | 388 (5.6) |
| Age, y | ||||
| <50 | 1663 (23.8) | 1343 (23.5) | 320 (25.4) | 85 (21.9) |
| 5165 | 2273 (32.5) | 1859 (32.5) | 414 (32.9) | 136 (35.1) |
| 6679 | 1444 (20.7) | 1176 (20.5) | 268 (18.6) | 80 (20.6) |
| >80 | 1607 (23.0) | 1349 (23.6) | 258 (16.1) | 87 (22.4) |
| Female | 3604 (51.6) | 2967 (51.8) | 637 (50.6) | 206 (53.1) |
| Race | ||||
| White | 5126 (73.4) | 4153 (72.5) | 973 (77.2) | 300 (77.3) |
| Black | 1075 (15.4) | 899 (15.7) | 176 (14.0) | 53 (13.7) |
| Hispanic | 562 (8.0) | 477 (8.3) | 85 (6.8) | 28 (7.2) |
| Other | 224 (3.2) | 198 (3.5) | 26 (2.1) | 7 (1.8) |
| Primary language | ||||
| English | 6345 (90.8) | 5180 (90.5) | 1165 (92.5) | 356 (91.8) |
| Marital status | ||||
| Married | 3642 (52.1) | 2942 (51.4) | 702 (55.7) | 214 (55.2) |
| Single, never married | 1662 (23.8) | 1393 (24.3) | 269 (21.4) | 73 (18.8) |
| Previously married | 1683 (24.1) | 1386 (24.2) | 289 (22.9) | 101 (26.0) |
| Insurance | ||||
| Medicare | 3550 (50.8) | 2949 (51.5) | 601 (47.7) | 188 (48.5) |
| Medicaid | 539 (7.7) | 430 (7.5) | 109 (8.7) | 33 (8.5) |
| Private | 2892 (41.4) | 2344 (40.9) | 548 (43.5) | 167 (43.0) |
| Uninsured | 6 (0.1) | 4 (0.1) | 2 (0.1) | 0 (0) |
| Source of index admission | ||||
| Clinic or home | 2136 (30.6) | 1711 (29.9) | 425 (33.7) | 117 (30.2) |
| Emergency department | 3592 (51.4) | 2999 (52.4) | 593 (47.1) | 181 (46.7) |
| Nursing facility | 1204 (17.2) | 977 (17.1) | 227 (18.0) | 84 (21.7) |
| Other | 55 (0.1) | 40 (0.7) | 15 (1.1) | 6 (1.6) |
| Length of stay, d | ||||
| 02 | 1757 (25.2) | 1556 (27.2) | 201 (16.0) | 55 (14.2) |
| 34 | 2200 (31.5) | 1842 (32.2) | 358 (28.4) | 105 (27.1) |
| 57 | 1521 (21.8) | 1214 (21.2) | 307 (24.4) | 101 (26.0) |
| >7 | 1509 (21.6) | 1115 (19.5) | 394 (31.3) | 127 (32.7) |
| Elixhauser comorbidity index score | ||||
| 01 | 1987 (28.4) | 1729 (30.2) | 258 (20.5) | 66 (17.0) |
| 27 | 1773 (25.4) | 1541 (26.9) | 232 (18.4) | 67 (17.3) |
| 813 | 1535 (22.0) | 1212 (21.2) | 323 (25.6) | 86 (22.2) |
| >13 | 1692 (24.2) | 1245 (21.7) | 447 (35.5) | 169 (43.6) |
| Medications prescribed as outpatient | ||||
| 06 | 1684 (24.1) | 1410 (24.6) | 274 (21.8) | 72 (18.6) |
| 79 | 1601 (22.9) | 1349 (23.6) | 252 (20.0) | 77 (19.9) |
| 1013 | 1836 (26.3) | 1508 (26.3) | 328 (26.0) | 107 (27.6) |
| >13 | 1866 (26.7) | 1460 (25.5) | 406 (32.2) | 132 (34.0) |
| Number of admissions in past year | ||||
| 0 | 4816 (68.9) | 4032 (70.4) | 784 (62.2) | 279 (71.9) |
| 15 | 2075 (29.7) | 1640 (28.6) | 435 (34.5) | 107 (27.6) |
| >5 | 96 (1.4) | 55 (1.0) | 41 (3.3) | 2 (0.5) |
| Number of ED visits in past year | ||||
| 0 | 4661 (66.7) | 3862 (67.4) | 799 (63.4) | 261 (67.3) |
| 15 | 2326 (33.3) | 1865 (32.6) | 461 (36.6) | 127 (32.7) |
All‐Cause Readmissions
After exclusion of 997 patients who died, were discharged to skilled nursing or rehabilitation facilities, or left AMA, 6987 patients were included (Figure 1). Of these, 1260 had a readmission (18%). Approximately half were considered unlikely to be psychiatrically ill, 22% were considered moderately likely, and 29% likely (Table 2).
| All‐Cause Readmission Analysis | Potentially Avoidable Readmission Analysis | |||||
|---|---|---|---|---|---|---|
| No. in Cohort (%) | % of Patients With ACR | P Valuea | No. in Cohort (%) | % of Patients With PAR | P Valuea | |
| ||||||
| Entire cohort | 6987 | 18.0 | 6115 | 6.3 | ||
| Likelihood of psychiatric illness | ||||||
| Unlikely | 3424 (49) | 16.5 | 3026 (49) | 5.6 | ||
| Moderate | 1564 (22) | 23.5 | 1302 (21) | 7.1 | ||
| Likely | 1999 (29) | 16.4 | 1787 (29) | 6.4 | ||
| Likely versus unlikely | 0.87 | 0.20 | ||||
| Moderate+likely versus unlikely | 0.001 | 0.02 | ||||
| Likelihood of substance abuse | 0.01 | 0.20 | ||||
| Unlikely | 5804 (83) | 18.7 | 5104 (83) | 6.5 | ||
| Likely | 1183 (17) | 14.8 | 1011 (17) | 5.4 | 0.14 | |
| Number of prescribed outpatient psychotropic medications | <0.001 | 0.04 | ||||
| 0 | 4420 (63) | 16.3 | 3931 (64) | 5.9 | ||
| 1 | 1725 (25) | 20.4 | 1481 (24) | 7.2 | ||
| 2 | 781 (11) | 22.3 | 653 (11) | 7.0 | ||
| >2 | 61 (1) | 23.0 | 50 (1) | 6.0 | ||
| Prescribed antidepressant | 1474 (21) | 20.6 | 0.005 | 1248 (20) | 6.2 | 0.77 |
| Prescribed antipsychotic | 375 (5) | 22.4 | 0.02 | 315 (5) | 7.6 | 0.34 |
| Prescribed mood stabilizer | 81 (1) | 18.5 | 0.91 | 69 (1) | 4.4 | 0.49 |
| Prescribed anxiolytic | 1814 (26) | 21.8 | <0.001 | 1537 (25) | 7.7 | 0.01 |
| Prescribed stimulant | 101 (2) | 26.7 | 0.02 | 83 (1) | 10.8 | 0.09 |
| Prescribed pharmacologic treatment for substance abuse | 79 (1) | 25.3 | 0.09 | 60 (1) | 1.7 | 0.14 |
| Number of psychiatric diagnoses on outpatient problem list | 0.31 | 0.74 | ||||
| 0 | 6405 (92) | 18.2 | 5509 (90) | 6.3 | ||
| 1 or more | 582 (8) | 16.5 | 474 (8) | 7.0 | ||
| Outpatient diagnosis of substance abuse | 159 (2) | 13.2 | 0.11 | 144 (2) | 4.2 | 0.28 |
| Outpatient diagnosis of any psychiatric illness | 582 (8) | 16.5 | 0.31 | 517 (8) | 8.0 | 0.73 |
| Discharge diagnosis of depression | 774 (11) | 17.7 | 0.80 | 690 (11) | 7.7 | 0.13 |
| Discharge diagnosis of schizophrenia | 56 (1) | 23.2 | 0.31 | 50 (1) | 14 | 0.03 |
| Discharge diagnosis of bipolar disorder | 101 (1) | 10.9 | 0.06 | 92 (2) | 2.2 | 0.10 |
| Discharge diagnosis of anxiety | 1192 (17) | 15.0 | 0.003 | 1080 (18) | 6.2 | 0.83 |
| Discharge diagnosis of substance abuse | 885 (13) | 14.8 | 0.008 | 803 (13) | 6.1 | 0.76 |
| Discharge diagnosis of any psychiatric illness | 1839 (26) | 16.0 | 0.008 | 1654 (27) | 6.6 | 0.63 |
| Substance abuse consultation as inpatient | 284 (4) | 14.4 | 0.11 | 252 (4) | 3.6 | 0.07 |
In bivariate analysis (Table 2), likelihood of psychiatric illness (P<0.01) and increasing numbers of prescribed outpatient psychiatric medications (P<0.01) were significantly associated with ACR. In multivariate analysis, each additional prescribed outpatient psychiatric medication increased ACR risk (odds ratio [OR]: 1.10, 95% confidence interval [CI]: 1.01‐1.20) or any prescription of an anxiolytic in particular (OR: 1.16, 95% CI: 1.001.35) was associated with increased risk of ACR, whereas discharge diagnoses of anxiety (OR: 0.82, 95% CI: 0.68‐0.99) and substance abuse (OR: 0.80, 95% CI: 0.65‐0.99) were associated with lower risk of ACR (Table 3).
| ACR, OR (95% CI) | PAR, OR (95% CI)a | |
|---|---|---|
| ||
| Likely psychiatric disease | 0.97 (0.82‐1.14) | 1.20 (0.92‐1.56) |
| Likely and possible psychiatric disease | 1.07 (0.94‐1.22) | 1.18 (0.94‐1.47) |
| Likely substance abuse | 0.83 (0.69‐0.99) | 0.85 (0.63‐1.16) |
| Psychiatric diagnosis on outpatient problem list | 0.97 (0.76‐1.23) | 1.04 (0.70‐1.55) |
| Substance abuse diagnosis on outpatient problem list | 0.63 (0.39‐1.02) | 0.65 (0.28‐1.52) |
| Increasing number of prescribed psychiatric medications | 1.10 (1.01‐1.20) | 1.00 (0.86‐1.16) |
| Outpatient prescription for antidepressant | 1.10 (0.94‐1.29) | 0.86 (0.66‐1.13) |
| Outpatient prescription for antipsychotic | 1.03 (0.79‐1.34) | 0.93 (0.59‐1.45) |
| Outpatient prescription for anxiolytic | 1.16 (1.001.35) | 1.13 (0.88‐1.44) |
| Outpatient prescription for methadone or buprenorphine | 1.15 (0.67‐1.98) | 0.18 (0.03‐1.36) |
| Discharge diagnosis of depression | 1.06 (0.86‐1.30) | 1.49 (1.09‐2.04) |
| Discharge diagnosis of schizophrenia | 1.43 (0.75‐2.74) | 2.63 (1.13‐6.13) |
| Discharge diagnosis of bipolar disorder | 0.53 (0.28‐1.02) | 0.35 (0.09‐1.45) |
| Discharge diagnosis of anxiety | 0.82 (0.68‐0.99) | 1.11 (0.83‐1.49) |
| Discharge diagnosis of substance abuse | 0.80 (0.65‐0.99) | 1.05 (0.75‐1.46) |
| Discharge diagnosis of any psychiatric illness | 0.88 (0.75‐1.02) | 1.22 (0.96‐1.56) |
| Addiction team consult while inpatient | 0.82 (0.58‐1.17) | 0.58 (0.29‐1.17) |
Potentially Avoidable Readmissions
After further exclusion of 872 patients who had unavoidable readmissions according to the SQLape algorithm, 6115 patients remained. Of these, 388 had a PAR within 30 days (6.3%, Table 1).
In bivariate analysis (Table 2), the likelihood of psychiatric illness (P=0.02), number of outpatient psychiatric medications (P=0.04), and prescription of anxiolytics (P=0.01) were significantly associated with PAR, as they were with ACR. A discharge diagnosis of schizophrenia was also associated with PAR (P=0.03).
In multivariate analysis, only discharge diagnoses of depression (OR: 1.49, 95% CI: 1.09‐2.04) and schizophrenia (OR: 2.63, 95% CI: 1.13‐6.13) were associated with PAR.
DISCUSSION
Comorbid psychiatric illness was common among patients admitted to the medicine wards. Patients with documented discharge diagnoses of depression or schizophrenia were at highest risk for a potentially avoidable 30‐day readmission, whereas those prescribed more psychiatric medications were at increased risk for ACR. These findings were independent of a comprehensive set of risk factors among medicine inpatients in this retrospective cohort study.
This study extends prior work indicating patients with psychiatric disease have increased healthcare utilization,[6, 7, 8, 9, 10, 11] by identifying at least 2 subpopulations of the psychiatrically ill (those with depression and schizophrenia) at particularly high risk for 30‐day PAR. To our knowledge, this is the first study to identify schizophrenia as a predictor of hospital readmission for medical illnesses. One prior study prospectively identified depression as increasing the 90‐day risk of readmission 3‐fold, although medication usage was not assessed,[6] and our report strengthens this association.
There are several possible explanations why these two subpopulations in particular would be more predisposed to readmissions that are potentially avoidable. It is known that patients with schizophrenia, for example, live on average 20 years less than the general population, and most of this excess mortality is due to medical illnesses.[20, 21] Reasons for this may include poor healthcare access, adverse effects of medication, and socioeconomic factors among others.[21, 22] All of these reasons may contribute to the increased PAR risk in this population, mediated, for example, by decreased ability to adhere to postdischarge care plans. Successful community‐based interventions to decrease these inequities have been described and could serve as a model for addressing the increased readmission risk in this population.[23]
Our finding that patients with a greater number of prescribed psychiatric medications are at increased risk for ACR may be expected, given other studies that have highlighted the crucial importance of medications in postdischarge adverse events, including readmissions.[24] Indeed, medication‐related errors and toxicities are the most common postdischarge adverse events experienced by patients.[25] Whether psychiatric medications are particularly prone to causing postdischarge adverse events or whether these medications represent greater psychiatric comorbidity cannot be answered by this study.
It was surprising but reassuring that substance abuse was not a predictor of short‐term readmissions as identified using our measures; in fact, a discharge diagnosis of substance abuse was associated with lower risk of ACR than comparator patients. It seems unlikely that we would have inadequate power to find such a result, as we found a statistically significant negative association in the ACR population, and 17% of our population overall was considered likely to have a substance abuse comorbidity. However, it is likely the burden of disease was underestimated given that we did not try to determine the contribution of long‐term substance abuse to medical diseases that may increase readmission risk (eg, liver cirrhosis from alcohol use). Unlike other conditions in our study, patients with substance abuse diagnoses at BWH can be seen by a dedicated multidisciplinary team while an inpatient to start treatment and plan for postdischarge follow‐up; this may have played a role in our findings.
A discharge diagnosis of anxiety was also somewhat protective against readmission, whereas a prescription of an anxiolytic (predominantly benzodiazepines) increased risk; many patients prescribed a benzodiazepine do not have a Diagnostic and Statistical Manual of Mental Disorders4th Edition (DSM‐IV) diagnosis of anxiety disorder, and thus these findings may reflect different patient populations. Discharging physicians may have used anxiety as a discharge diagnosis in patients in whom they suspected somatic complaints without organic basis; these patients may be at lower risk of readmission.
Discharge diagnoses of psychiatric illnesses were associated with ACR and PAR in our study, but outpatient diagnoses were not. This likely reflects greater severity of illness (documentation as a treated diagnosis on discharge indicates the illness was relevant during the hospitalization), but may also reflect inaccuracies of diagnosis and lack of assessment of severity in outpatient coding, which would bias toward null findings. Although many of the patients in our study were seen by primary care doctors within the Partners system, some patients had outside primary care physicians and we did not have access to these records. This may also have decreased our ability to find associations.
The findings of our study should be interpreted in the context of the study design. Our study was retrospective, which limited our ability to conclusively diagnose psychiatric disease presence or severity (as is true of most institutions, validated psychiatric screening was not routinely used at our institutions on hospital admission or discharge). However, we used a conservative scale to classify the likelihood of patients having psychiatric or substance abuse disorders, and we used other metrics to establish the presence of illness, such as the number of prescribed medications, inpatient consultation with a substance abuse service, and hospital discharge diagnoses. This approach also allowed us to quickly identify a large cohort unaffected by selection bias. Our study was single center, potentially limiting generalizability. Although we capture at least 80% of readmissions, we were not able to capture all readmissions, and we cannot rule out that patients readmitted elsewhere are different than those readmitted within the Partners system. Last, the SQLape algorithm is not perfectly sensitive or specific in identifying avoidable readmissions,[13] but it does eliminate many readmissions that are clearly unavoidable, creating an enriched cohort of patients whose readmissions are more likely to be avoidable and therefore potentially actionable.
We suggest that our study findings first be considered when risk stratifying patients before hospital discharge in terms of readmission risk. Patients with depression and schizophrenia would seem to merit postdischarge interventions to decrease their potentially avoidable readmissions. Compulsory community treatment (a feature of treatment in Canada and Australia that is ordered by clinicians) has been shown to decrease mortality due to medical illness in patients who have been hospitalized and are psychiatrically ill, and addition of these services to postdischarge care may be useful.[23] Inpatient physicians could work to ensure follow‐up not just with medical providers but with robust outpatient mental health programs to decrease potentially avoidable readmission risk, and administrators could work to ensure close linkages with these community resources. Studies evaluating the impact of these types of interventions would need to be conducted. Patients with polypharmacy, including psychiatric medications, may benefit from interventions to improve medication safety, such as enhanced medication reconciliation and pharmacist counseling.[26]
Our study suggests that patients with depression, those with schizophrenia, and those who have increased numbers of prescribed psychiatric medications should be considered at high risk for readmission for medical illnesses. Targeting interventions to these patients may be fruitful in preventing avoidable readmissions.
Acknowledgements
The authors thank Dr. Yves Eggli for screening the database for potentially avoidable readmissions using the SQLape algorithm.
Disclosures
Dr. Donz was supported by the Swiss National Science Foundation and the Swiss Foundation for MedicalBiological Scholarships. The authors otherwise have no conflicts of interest to disclose. The content is solely the responsibility of the authors and does not necessarily represent the official views of the US Department of Veterans Affairs.
- , , . Rehospitalizations among patients in the Medicare fee‐for‐service program. N Engl J Med. 2009;360(14):1418–1428.
- , , , et al. Risk prediction models for hospital readmission: a systematic review. JAMA. 2011;306(15):1688–1698.
- , . Hospital readmission as an accountability measure. JAMA. 2011;305(5):504–505.
- , , , , , . Postdischarge environmental and socioeconomic factors and the likelihood of early hospital readmission among community‐dwelling Medicare beneficiaries. Gerontologist. 2008;48(4):495–504.
- , , , , . Low health literacy and health outcomes: an updated systematic review. Ann Intern Med. 2011;155(2):97–107.
- , , , et al. Depression is a risk factor for rehospitalization in medical inpatients. Prim Care Companion J Clin Psychiatry. 2007;9(4):256–262.
- , , , . Mental illness and hospitalization for ambulatory care sensitive medical conditions. Med Care. 2008;46(12):1249–1256.
- , , , , , . Substance use treatment barriers for patients with frequent hospital admissions. J Subst Abuse Treat. 2010;38(1):22–30.
- , , , , . Managed care and the quality of substance abuse treatment. J Ment Health Policy Econ. 2002;5(4):163–174.
- , , , , . Unmet substance abuse treatment need, health services utilization, and cost: a population‐based emergency department study. Ann Emerg Med. 2005;45(2):118–127.
- , , , . Elderly Medicare inpatients with substance use disorders: characteristics and predictors of hospital readmissions over a four‐year interval. J Stud Alcohol. 2000;61(6):891–895.
- , , , et al. Rationale and design of the Pharmacist Intervention for Low Literacy in Cardiovascular Disease (PILL‐CVD) study. Circ Cardiovasc Qual Outcomes. 2010;3(2):212–219.
- , , , , , . Validation of the potentially avoidable hospital readmission rate as a routine indicator of the quality of hospital care. Med Care. 2006;44(11);972–981.
- , , , , , . Measuring potentially avoidable hospital readmissions. J Clin Epidemiol. 2002;55:573–587.
- Agency for Healthcare Research and Quality Quality Indicators. (April 7, 2006). Prevention Quality Indicators (PQI) Composite Measure Workgroup Final Report. Available at: http://www.qualityindicators.ahrq.gov/modules/pqi_resources.aspx. Accessed June 1, 2012.
- , , , et al. Hospital readmission in general medicine patients: a prediction model. J Gen Intern Med. 2010;25(3):211–219.
- , , , et al. Derivation and validation of an index to predict early death or unplanned readmission after discharge from hospital to the community. CMAJ. 2010;182(6):551–557.
- , , , . Comorbidity measures for use with administrative data. Med Care. Jan 1998;36(1):8–27.
- , , , , eds. Morbidity and mortality in people with serious mental illness. October 2006. National Association of State Mental Health Directors, Medical Directors Council. Available at: http://www.nasmhpd.org/docs/publications/MDCdocs/Mortality%20and%20 Mo rbidity%20Final%20Report%208.18.08.pdf. Accessed January 13, 2013.
- , , , . Mortality in individuals who have had psychiatric treatment: population‐based study in Nova Scotia. Br J Psychiat. 2005;187:552–558.
- , , , , , . Inequitable access for mentally ill patients to some medically necessary procedures. CMAJ. 2007;176(6):779–784.
- , , . Quality of medical care for people with and without comorbid mental illness and substance misuse: systematic review of comparative studies. Br J Psychiat. 2009;194:491–499.
- , , , , , . Reducing all‐cause mortality among patients with psychiatric disorders: a population‐based study. CMAJ. 2013;185(1):E50–E56.
- , , , et al. Incidence of potentially avoidable urgent readmissions and their relation to all‐cause urgent readmissions. CMAJ. 2011;183(14):E1067–E1072.
- , , , , . The incidence and severity of adverse events affecting patients after discharge from the hospital. Ann Intern Med. 2003;138(3):161–167.
- , , , . Hospital‐based medication reconciliation practices: a systematic review. Arch Intern Med. 2012;172(14):1057–1069.
Readmissions to the hospital are common and costly.[1] However, identifying patients prospectively who are likely to be readmitted and who may benefit from interventions to reduce readmission risk has proven challenging, with published risk scores having only moderate ability to discriminate between patients likely and unlikely to be readmitted.[2] One reason for this may be that published studies have not typically focused on patients who are cognitively impaired, psychiatrically ill, have low health or English literacy, or have poor social supports, all of whom may represent a substantial fraction of readmitted patients.[2, 3, 4, 5]
Psychiatric disease, in particular, may contribute to increased readmission risk for nonpsychiatric (medical) illness, and is associated with increased utilization of healthcare resources.[6, 7, 8, 9, 10, 11] For example, patients with mental illness who were discharged from New York hospitals were more likely to be rehospitalized and had more costly readmissions than patients without these comorbidities, including a length of stay nearly 1 day longer on average.[7] An unmet need for treatment of substance abuse was projected to cost Tennessee $772 million of excess healthcare costs in 2000, mostly incurred through repeat hospitalizations and emergency department (ED) visits.[10]
Despite this, few investigators have considered the role of psychiatric disease and/or substance abuse in medical readmission risk. The purpose of the current study was to evaluate the role of psychiatric illness and substance abuse in unselected medical patients to determine their relative contributions to 30‐day all‐cause readmissions (ACR) and potentially avoidable readmissions (PAR).
METHODS
Patients and Setting
We conducted a retrospective cohort study of consecutive adult patients discharged from medicine services at Brigham and Women's Hospital (BWH), a 747‐bed tertiary referral center and teaching hospital, between July 1, 2009 and June 30, 2010. Most patients are cared for by resident housestaff teams at BWH (approximately 25% are cared for by physician assistants working directly with attending physicians), and approximately half receive primary care in the Partners system, which has a shared electronic medical record (EMR). Outpatient mental health services are provided by Partners‐associated mental health professionals including those at McLean Hospital and MassHealth (Medicaid)‐associated sites through the Massachusetts Behavioral Health Partnership. Exclusion criteria were death in the hospital or discharge to another acute care facility. We also excluded patients who left against medical advice (AMA). The study protocol was approved by the Partners Institutional Review Board.
Outcome
The primary outcomes were ACR and PAR within 30 days of discharge. First, we identified all 30‐day readmissions to BWH or to 2 other hospitals in the Partners Healthcare Network (previous studies have shown that 80% of all readmitted patients are readmitted to 1 of these 3 hospitals).[12] For patients with multiple readmissions, only the first readmission was included in the dataset.
To find potentially avoidable readmissions, administrative and billing data for these patients were processed using the SQLape (SQLape s.a.r.l., Corseaux, Switzerland) algorithm, which identifies PAR by excluding patients who undergo planned follow‐up treatment (such as a cycle of planned chemotherapy) or are readmitted for conditions unrelated in any way to the index hospitalization.[13, 14] Common complications of treatment are categorized as potentially avoidable, such as development of a deep venous thrombosis, a decubitus ulcer after prolonged bed rest, or bleeding complications after starting anticoagulation. Although the algorithm identifies theoretically preventable readmissions, the algorithm does not quantify how preventable they are, and these are thus referred to as potentially avoidable. This is similar to other admission metrics, such as the Agency for Healthcare Research and Quality's prevention quality indicators, which are created from a list of ambulatory care‐sensitive conditions.[15] SQLape has the advantage of being a specific tool for readmissions. Patients with 30‐day readmissions identified by SQLape as planned or unlikely to be avoidable were excluded in the PAR analysis, although still included in ACR analysis. In each case, the comparison group is patients without any readmission.
Predictors
Our predictors of interest included the overall prevalence of a psychiatric diagnosis or diagnosis of substance abuse, the presence of specific psychiatric diagnoses, and prescription of psychiatric medications to help assess the independent contribution of these comorbidities to readmission risk.
We used a combination of easily obtainable inpatient and outpatient clinical and administrative data to identify relevant patients. Patients were considered likely to be psychiatrically ill if they: (1) had a psychiatric diagnosis on their Partners outpatient EMR problem list and were prescribed a medication to treat that condition as an outpatient, or (2) had an International Classification of Diseases, 9th Revision diagnosis of a psychiatric illness at hospital discharge. Patients were considered to have moderate probability of disease if they: (1) had a psychiatric diagnosis on their outpatient problem list, or (2) were prescribed a medication intended to treat a psychiatric condition as an outpatient. Patients were considered unlikely to have psychiatric disease if none of these criteria were met. Patients were considered likely to have a substance abuse disorder if they had this diagnosis on their outpatient EMR, or were prescribed a medication to treat this condition (eg, buprenorphine/naloxone), or received inpatient consultation from a substance abuse treatment team during their inpatient hospitalization, and were considered unlikely if none of these were true. We also evaluated individual categories of psychiatric illness (schizophrenia, depression, anxiety, bipolar disorder) and of psychotropic medications (antidepressants, antipsychotics, anxiolytics).
Potential Confounders
Data on potential confounders, based on prior literature,[16, 17] collected at the index admission were derived from electronic administrative, clinical, and billing sources, including the Brigham Integrated Computer System and the Partners Clinical Data Repository. They included patient age, gender, ethnicity, primary language, marital status, insurance status, living situation prior to admission, discharge location, length of stay, Elixhauser comorbidity index,[18] total number of medications prescribed, and number of prior admissions and ED visits in the prior year.
Statistical Analysis
Bivariate comparisons of each of the predictors of ACR and PAR risk (ie, patients with a 30‐day ACR or PAR vs those not readmitted within 30 days) were conducted using 2 trend tests for ordinal predictors (eg, likelihood of psychiatric disease), and 2 or Fisher exact test for dichotomous predictors (eg, receipt of inpatient substance abuse counseling).
We then used multivariate logistic regression analysis to adjust for all of the potential confounders noted above, entering each variable related to psychiatric illness into the model separately (eg, likely psychiatric illness, number of psychiatric medications). In a secondary analysis, we removed potentially collinear variables from the final model; as this did not alter the results, the full model is presented. We also conducted a secondary analysis where we included patients who left against medical advice (AMA), which also did not alter the results. Two‐sided P values <0.05 were considered significant, and all analyses were performed using the SAS version 9.2 (SAS Institute, Inc., Cary, NC).
RESULTS
There were 7984 unique patients discharged during the study period. Patients were generally white and English speaking; just over half of admissions came from the ED (Table 1). Of note, nearly all patients were insured, as are almost all patients in Massachusetts. They had high degrees of comorbid illness and large numbers of prescribed medications. Nearly 30% had at least 1 hospital admission within the prior year.
| Characteristic | All Patients, N (%) | Not Readmitted, N (%) | ACR, N (%) | PAR N (%)a |
|---|---|---|---|---|
| ||||
| Study cohort | 6987 (100) | 5727 (72) | 1260 (18) | 388 (5.6) |
| Age, y | ||||
| <50 | 1663 (23.8) | 1343 (23.5) | 320 (25.4) | 85 (21.9) |
| 5165 | 2273 (32.5) | 1859 (32.5) | 414 (32.9) | 136 (35.1) |
| 6679 | 1444 (20.7) | 1176 (20.5) | 268 (18.6) | 80 (20.6) |
| >80 | 1607 (23.0) | 1349 (23.6) | 258 (16.1) | 87 (22.4) |
| Female | 3604 (51.6) | 2967 (51.8) | 637 (50.6) | 206 (53.1) |
| Race | ||||
| White | 5126 (73.4) | 4153 (72.5) | 973 (77.2) | 300 (77.3) |
| Black | 1075 (15.4) | 899 (15.7) | 176 (14.0) | 53 (13.7) |
| Hispanic | 562 (8.0) | 477 (8.3) | 85 (6.8) | 28 (7.2) |
| Other | 224 (3.2) | 198 (3.5) | 26 (2.1) | 7 (1.8) |
| Primary language | ||||
| English | 6345 (90.8) | 5180 (90.5) | 1165 (92.5) | 356 (91.8) |
| Marital status | ||||
| Married | 3642 (52.1) | 2942 (51.4) | 702 (55.7) | 214 (55.2) |
| Single, never married | 1662 (23.8) | 1393 (24.3) | 269 (21.4) | 73 (18.8) |
| Previously married | 1683 (24.1) | 1386 (24.2) | 289 (22.9) | 101 (26.0) |
| Insurance | ||||
| Medicare | 3550 (50.8) | 2949 (51.5) | 601 (47.7) | 188 (48.5) |
| Medicaid | 539 (7.7) | 430 (7.5) | 109 (8.7) | 33 (8.5) |
| Private | 2892 (41.4) | 2344 (40.9) | 548 (43.5) | 167 (43.0) |
| Uninsured | 6 (0.1) | 4 (0.1) | 2 (0.1) | 0 (0) |
| Source of index admission | ||||
| Clinic or home | 2136 (30.6) | 1711 (29.9) | 425 (33.7) | 117 (30.2) |
| Emergency department | 3592 (51.4) | 2999 (52.4) | 593 (47.1) | 181 (46.7) |
| Nursing facility | 1204 (17.2) | 977 (17.1) | 227 (18.0) | 84 (21.7) |
| Other | 55 (0.1) | 40 (0.7) | 15 (1.1) | 6 (1.6) |
| Length of stay, d | ||||
| 02 | 1757 (25.2) | 1556 (27.2) | 201 (16.0) | 55 (14.2) |
| 34 | 2200 (31.5) | 1842 (32.2) | 358 (28.4) | 105 (27.1) |
| 57 | 1521 (21.8) | 1214 (21.2) | 307 (24.4) | 101 (26.0) |
| >7 | 1509 (21.6) | 1115 (19.5) | 394 (31.3) | 127 (32.7) |
| Elixhauser comorbidity index score | ||||
| 01 | 1987 (28.4) | 1729 (30.2) | 258 (20.5) | 66 (17.0) |
| 27 | 1773 (25.4) | 1541 (26.9) | 232 (18.4) | 67 (17.3) |
| 813 | 1535 (22.0) | 1212 (21.2) | 323 (25.6) | 86 (22.2) |
| >13 | 1692 (24.2) | 1245 (21.7) | 447 (35.5) | 169 (43.6) |
| Medications prescribed as outpatient | ||||
| 06 | 1684 (24.1) | 1410 (24.6) | 274 (21.8) | 72 (18.6) |
| 79 | 1601 (22.9) | 1349 (23.6) | 252 (20.0) | 77 (19.9) |
| 1013 | 1836 (26.3) | 1508 (26.3) | 328 (26.0) | 107 (27.6) |
| >13 | 1866 (26.7) | 1460 (25.5) | 406 (32.2) | 132 (34.0) |
| Number of admissions in past year | ||||
| 0 | 4816 (68.9) | 4032 (70.4) | 784 (62.2) | 279 (71.9) |
| 15 | 2075 (29.7) | 1640 (28.6) | 435 (34.5) | 107 (27.6) |
| >5 | 96 (1.4) | 55 (1.0) | 41 (3.3) | 2 (0.5) |
| Number of ED visits in past year | ||||
| 0 | 4661 (66.7) | 3862 (67.4) | 799 (63.4) | 261 (67.3) |
| 15 | 2326 (33.3) | 1865 (32.6) | 461 (36.6) | 127 (32.7) |
All‐Cause Readmissions
After exclusion of 997 patients who died, were discharged to skilled nursing or rehabilitation facilities, or left AMA, 6987 patients were included (Figure 1). Of these, 1260 had a readmission (18%). Approximately half were considered unlikely to be psychiatrically ill, 22% were considered moderately likely, and 29% likely (Table 2).
| All‐Cause Readmission Analysis | Potentially Avoidable Readmission Analysis | |||||
|---|---|---|---|---|---|---|
| No. in Cohort (%) | % of Patients With ACR | P Valuea | No. in Cohort (%) | % of Patients With PAR | P Valuea | |
| ||||||
| Entire cohort | 6987 | 18.0 | 6115 | 6.3 | ||
| Likelihood of psychiatric illness | ||||||
| Unlikely | 3424 (49) | 16.5 | 3026 (49) | 5.6 | ||
| Moderate | 1564 (22) | 23.5 | 1302 (21) | 7.1 | ||
| Likely | 1999 (29) | 16.4 | 1787 (29) | 6.4 | ||
| Likely versus unlikely | 0.87 | 0.20 | ||||
| Moderate+likely versus unlikely | 0.001 | 0.02 | ||||
| Likelihood of substance abuse | 0.01 | 0.20 | ||||
| Unlikely | 5804 (83) | 18.7 | 5104 (83) | 6.5 | ||
| Likely | 1183 (17) | 14.8 | 1011 (17) | 5.4 | 0.14 | |
| Number of prescribed outpatient psychotropic medications | <0.001 | 0.04 | ||||
| 0 | 4420 (63) | 16.3 | 3931 (64) | 5.9 | ||
| 1 | 1725 (25) | 20.4 | 1481 (24) | 7.2 | ||
| 2 | 781 (11) | 22.3 | 653 (11) | 7.0 | ||
| >2 | 61 (1) | 23.0 | 50 (1) | 6.0 | ||
| Prescribed antidepressant | 1474 (21) | 20.6 | 0.005 | 1248 (20) | 6.2 | 0.77 |
| Prescribed antipsychotic | 375 (5) | 22.4 | 0.02 | 315 (5) | 7.6 | 0.34 |
| Prescribed mood stabilizer | 81 (1) | 18.5 | 0.91 | 69 (1) | 4.4 | 0.49 |
| Prescribed anxiolytic | 1814 (26) | 21.8 | <0.001 | 1537 (25) | 7.7 | 0.01 |
| Prescribed stimulant | 101 (2) | 26.7 | 0.02 | 83 (1) | 10.8 | 0.09 |
| Prescribed pharmacologic treatment for substance abuse | 79 (1) | 25.3 | 0.09 | 60 (1) | 1.7 | 0.14 |
| Number of psychiatric diagnoses on outpatient problem list | 0.31 | 0.74 | ||||
| 0 | 6405 (92) | 18.2 | 5509 (90) | 6.3 | ||
| 1 or more | 582 (8) | 16.5 | 474 (8) | 7.0 | ||
| Outpatient diagnosis of substance abuse | 159 (2) | 13.2 | 0.11 | 144 (2) | 4.2 | 0.28 |
| Outpatient diagnosis of any psychiatric illness | 582 (8) | 16.5 | 0.31 | 517 (8) | 8.0 | 0.73 |
| Discharge diagnosis of depression | 774 (11) | 17.7 | 0.80 | 690 (11) | 7.7 | 0.13 |
| Discharge diagnosis of schizophrenia | 56 (1) | 23.2 | 0.31 | 50 (1) | 14 | 0.03 |
| Discharge diagnosis of bipolar disorder | 101 (1) | 10.9 | 0.06 | 92 (2) | 2.2 | 0.10 |
| Discharge diagnosis of anxiety | 1192 (17) | 15.0 | 0.003 | 1080 (18) | 6.2 | 0.83 |
| Discharge diagnosis of substance abuse | 885 (13) | 14.8 | 0.008 | 803 (13) | 6.1 | 0.76 |
| Discharge diagnosis of any psychiatric illness | 1839 (26) | 16.0 | 0.008 | 1654 (27) | 6.6 | 0.63 |
| Substance abuse consultation as inpatient | 284 (4) | 14.4 | 0.11 | 252 (4) | 3.6 | 0.07 |
In bivariate analysis (Table 2), likelihood of psychiatric illness (P<0.01) and increasing numbers of prescribed outpatient psychiatric medications (P<0.01) were significantly associated with ACR. In multivariate analysis, each additional prescribed outpatient psychiatric medication increased ACR risk (odds ratio [OR]: 1.10, 95% confidence interval [CI]: 1.01‐1.20) or any prescription of an anxiolytic in particular (OR: 1.16, 95% CI: 1.001.35) was associated with increased risk of ACR, whereas discharge diagnoses of anxiety (OR: 0.82, 95% CI: 0.68‐0.99) and substance abuse (OR: 0.80, 95% CI: 0.65‐0.99) were associated with lower risk of ACR (Table 3).
| ACR, OR (95% CI) | PAR, OR (95% CI)a | |
|---|---|---|
| ||
| Likely psychiatric disease | 0.97 (0.82‐1.14) | 1.20 (0.92‐1.56) |
| Likely and possible psychiatric disease | 1.07 (0.94‐1.22) | 1.18 (0.94‐1.47) |
| Likely substance abuse | 0.83 (0.69‐0.99) | 0.85 (0.63‐1.16) |
| Psychiatric diagnosis on outpatient problem list | 0.97 (0.76‐1.23) | 1.04 (0.70‐1.55) |
| Substance abuse diagnosis on outpatient problem list | 0.63 (0.39‐1.02) | 0.65 (0.28‐1.52) |
| Increasing number of prescribed psychiatric medications | 1.10 (1.01‐1.20) | 1.00 (0.86‐1.16) |
| Outpatient prescription for antidepressant | 1.10 (0.94‐1.29) | 0.86 (0.66‐1.13) |
| Outpatient prescription for antipsychotic | 1.03 (0.79‐1.34) | 0.93 (0.59‐1.45) |
| Outpatient prescription for anxiolytic | 1.16 (1.001.35) | 1.13 (0.88‐1.44) |
| Outpatient prescription for methadone or buprenorphine | 1.15 (0.67‐1.98) | 0.18 (0.03‐1.36) |
| Discharge diagnosis of depression | 1.06 (0.86‐1.30) | 1.49 (1.09‐2.04) |
| Discharge diagnosis of schizophrenia | 1.43 (0.75‐2.74) | 2.63 (1.13‐6.13) |
| Discharge diagnosis of bipolar disorder | 0.53 (0.28‐1.02) | 0.35 (0.09‐1.45) |
| Discharge diagnosis of anxiety | 0.82 (0.68‐0.99) | 1.11 (0.83‐1.49) |
| Discharge diagnosis of substance abuse | 0.80 (0.65‐0.99) | 1.05 (0.75‐1.46) |
| Discharge diagnosis of any psychiatric illness | 0.88 (0.75‐1.02) | 1.22 (0.96‐1.56) |
| Addiction team consult while inpatient | 0.82 (0.58‐1.17) | 0.58 (0.29‐1.17) |
Potentially Avoidable Readmissions
After further exclusion of 872 patients who had unavoidable readmissions according to the SQLape algorithm, 6115 patients remained. Of these, 388 had a PAR within 30 days (6.3%, Table 1).
In bivariate analysis (Table 2), the likelihood of psychiatric illness (P=0.02), number of outpatient psychiatric medications (P=0.04), and prescription of anxiolytics (P=0.01) were significantly associated with PAR, as they were with ACR. A discharge diagnosis of schizophrenia was also associated with PAR (P=0.03).
In multivariate analysis, only discharge diagnoses of depression (OR: 1.49, 95% CI: 1.09‐2.04) and schizophrenia (OR: 2.63, 95% CI: 1.13‐6.13) were associated with PAR.
DISCUSSION
Comorbid psychiatric illness was common among patients admitted to the medicine wards. Patients with documented discharge diagnoses of depression or schizophrenia were at highest risk for a potentially avoidable 30‐day readmission, whereas those prescribed more psychiatric medications were at increased risk for ACR. These findings were independent of a comprehensive set of risk factors among medicine inpatients in this retrospective cohort study.
This study extends prior work indicating patients with psychiatric disease have increased healthcare utilization,[6, 7, 8, 9, 10, 11] by identifying at least 2 subpopulations of the psychiatrically ill (those with depression and schizophrenia) at particularly high risk for 30‐day PAR. To our knowledge, this is the first study to identify schizophrenia as a predictor of hospital readmission for medical illnesses. One prior study prospectively identified depression as increasing the 90‐day risk of readmission 3‐fold, although medication usage was not assessed,[6] and our report strengthens this association.
There are several possible explanations why these two subpopulations in particular would be more predisposed to readmissions that are potentially avoidable. It is known that patients with schizophrenia, for example, live on average 20 years less than the general population, and most of this excess mortality is due to medical illnesses.[20, 21] Reasons for this may include poor healthcare access, adverse effects of medication, and socioeconomic factors among others.[21, 22] All of these reasons may contribute to the increased PAR risk in this population, mediated, for example, by decreased ability to adhere to postdischarge care plans. Successful community‐based interventions to decrease these inequities have been described and could serve as a model for addressing the increased readmission risk in this population.[23]
Our finding that patients with a greater number of prescribed psychiatric medications are at increased risk for ACR may be expected, given other studies that have highlighted the crucial importance of medications in postdischarge adverse events, including readmissions.[24] Indeed, medication‐related errors and toxicities are the most common postdischarge adverse events experienced by patients.[25] Whether psychiatric medications are particularly prone to causing postdischarge adverse events or whether these medications represent greater psychiatric comorbidity cannot be answered by this study.
It was surprising but reassuring that substance abuse was not a predictor of short‐term readmissions as identified using our measures; in fact, a discharge diagnosis of substance abuse was associated with lower risk of ACR than comparator patients. It seems unlikely that we would have inadequate power to find such a result, as we found a statistically significant negative association in the ACR population, and 17% of our population overall was considered likely to have a substance abuse comorbidity. However, it is likely the burden of disease was underestimated given that we did not try to determine the contribution of long‐term substance abuse to medical diseases that may increase readmission risk (eg, liver cirrhosis from alcohol use). Unlike other conditions in our study, patients with substance abuse diagnoses at BWH can be seen by a dedicated multidisciplinary team while an inpatient to start treatment and plan for postdischarge follow‐up; this may have played a role in our findings.
A discharge diagnosis of anxiety was also somewhat protective against readmission, whereas a prescription of an anxiolytic (predominantly benzodiazepines) increased risk; many patients prescribed a benzodiazepine do not have a Diagnostic and Statistical Manual of Mental Disorders4th Edition (DSM‐IV) diagnosis of anxiety disorder, and thus these findings may reflect different patient populations. Discharging physicians may have used anxiety as a discharge diagnosis in patients in whom they suspected somatic complaints without organic basis; these patients may be at lower risk of readmission.
Discharge diagnoses of psychiatric illnesses were associated with ACR and PAR in our study, but outpatient diagnoses were not. This likely reflects greater severity of illness (documentation as a treated diagnosis on discharge indicates the illness was relevant during the hospitalization), but may also reflect inaccuracies of diagnosis and lack of assessment of severity in outpatient coding, which would bias toward null findings. Although many of the patients in our study were seen by primary care doctors within the Partners system, some patients had outside primary care physicians and we did not have access to these records. This may also have decreased our ability to find associations.
The findings of our study should be interpreted in the context of the study design. Our study was retrospective, which limited our ability to conclusively diagnose psychiatric disease presence or severity (as is true of most institutions, validated psychiatric screening was not routinely used at our institutions on hospital admission or discharge). However, we used a conservative scale to classify the likelihood of patients having psychiatric or substance abuse disorders, and we used other metrics to establish the presence of illness, such as the number of prescribed medications, inpatient consultation with a substance abuse service, and hospital discharge diagnoses. This approach also allowed us to quickly identify a large cohort unaffected by selection bias. Our study was single center, potentially limiting generalizability. Although we capture at least 80% of readmissions, we were not able to capture all readmissions, and we cannot rule out that patients readmitted elsewhere are different than those readmitted within the Partners system. Last, the SQLape algorithm is not perfectly sensitive or specific in identifying avoidable readmissions,[13] but it does eliminate many readmissions that are clearly unavoidable, creating an enriched cohort of patients whose readmissions are more likely to be avoidable and therefore potentially actionable.
We suggest that our study findings first be considered when risk stratifying patients before hospital discharge in terms of readmission risk. Patients with depression and schizophrenia would seem to merit postdischarge interventions to decrease their potentially avoidable readmissions. Compulsory community treatment (a feature of treatment in Canada and Australia that is ordered by clinicians) has been shown to decrease mortality due to medical illness in patients who have been hospitalized and are psychiatrically ill, and addition of these services to postdischarge care may be useful.[23] Inpatient physicians could work to ensure follow‐up not just with medical providers but with robust outpatient mental health programs to decrease potentially avoidable readmission risk, and administrators could work to ensure close linkages with these community resources. Studies evaluating the impact of these types of interventions would need to be conducted. Patients with polypharmacy, including psychiatric medications, may benefit from interventions to improve medication safety, such as enhanced medication reconciliation and pharmacist counseling.[26]
Our study suggests that patients with depression, those with schizophrenia, and those who have increased numbers of prescribed psychiatric medications should be considered at high risk for readmission for medical illnesses. Targeting interventions to these patients may be fruitful in preventing avoidable readmissions.
Acknowledgements
The authors thank Dr. Yves Eggli for screening the database for potentially avoidable readmissions using the SQLape algorithm.
Disclosures
Dr. Donz was supported by the Swiss National Science Foundation and the Swiss Foundation for MedicalBiological Scholarships. The authors otherwise have no conflicts of interest to disclose. The content is solely the responsibility of the authors and does not necessarily represent the official views of the US Department of Veterans Affairs.
Readmissions to the hospital are common and costly.[1] However, identifying patients prospectively who are likely to be readmitted and who may benefit from interventions to reduce readmission risk has proven challenging, with published risk scores having only moderate ability to discriminate between patients likely and unlikely to be readmitted.[2] One reason for this may be that published studies have not typically focused on patients who are cognitively impaired, psychiatrically ill, have low health or English literacy, or have poor social supports, all of whom may represent a substantial fraction of readmitted patients.[2, 3, 4, 5]
Psychiatric disease, in particular, may contribute to increased readmission risk for nonpsychiatric (medical) illness, and is associated with increased utilization of healthcare resources.[6, 7, 8, 9, 10, 11] For example, patients with mental illness who were discharged from New York hospitals were more likely to be rehospitalized and had more costly readmissions than patients without these comorbidities, including a length of stay nearly 1 day longer on average.[7] An unmet need for treatment of substance abuse was projected to cost Tennessee $772 million of excess healthcare costs in 2000, mostly incurred through repeat hospitalizations and emergency department (ED) visits.[10]
Despite this, few investigators have considered the role of psychiatric disease and/or substance abuse in medical readmission risk. The purpose of the current study was to evaluate the role of psychiatric illness and substance abuse in unselected medical patients to determine their relative contributions to 30‐day all‐cause readmissions (ACR) and potentially avoidable readmissions (PAR).
METHODS
Patients and Setting
We conducted a retrospective cohort study of consecutive adult patients discharged from medicine services at Brigham and Women's Hospital (BWH), a 747‐bed tertiary referral center and teaching hospital, between July 1, 2009 and June 30, 2010. Most patients are cared for by resident housestaff teams at BWH (approximately 25% are cared for by physician assistants working directly with attending physicians), and approximately half receive primary care in the Partners system, which has a shared electronic medical record (EMR). Outpatient mental health services are provided by Partners‐associated mental health professionals including those at McLean Hospital and MassHealth (Medicaid)‐associated sites through the Massachusetts Behavioral Health Partnership. Exclusion criteria were death in the hospital or discharge to another acute care facility. We also excluded patients who left against medical advice (AMA). The study protocol was approved by the Partners Institutional Review Board.
Outcome
The primary outcomes were ACR and PAR within 30 days of discharge. First, we identified all 30‐day readmissions to BWH or to 2 other hospitals in the Partners Healthcare Network (previous studies have shown that 80% of all readmitted patients are readmitted to 1 of these 3 hospitals).[12] For patients with multiple readmissions, only the first readmission was included in the dataset.
To find potentially avoidable readmissions, administrative and billing data for these patients were processed using the SQLape (SQLape s.a.r.l., Corseaux, Switzerland) algorithm, which identifies PAR by excluding patients who undergo planned follow‐up treatment (such as a cycle of planned chemotherapy) or are readmitted for conditions unrelated in any way to the index hospitalization.[13, 14] Common complications of treatment are categorized as potentially avoidable, such as development of a deep venous thrombosis, a decubitus ulcer after prolonged bed rest, or bleeding complications after starting anticoagulation. Although the algorithm identifies theoretically preventable readmissions, the algorithm does not quantify how preventable they are, and these are thus referred to as potentially avoidable. This is similar to other admission metrics, such as the Agency for Healthcare Research and Quality's prevention quality indicators, which are created from a list of ambulatory care‐sensitive conditions.[15] SQLape has the advantage of being a specific tool for readmissions. Patients with 30‐day readmissions identified by SQLape as planned or unlikely to be avoidable were excluded in the PAR analysis, although still included in ACR analysis. In each case, the comparison group is patients without any readmission.
Predictors
Our predictors of interest included the overall prevalence of a psychiatric diagnosis or diagnosis of substance abuse, the presence of specific psychiatric diagnoses, and prescription of psychiatric medications to help assess the independent contribution of these comorbidities to readmission risk.
We used a combination of easily obtainable inpatient and outpatient clinical and administrative data to identify relevant patients. Patients were considered likely to be psychiatrically ill if they: (1) had a psychiatric diagnosis on their Partners outpatient EMR problem list and were prescribed a medication to treat that condition as an outpatient, or (2) had an International Classification of Diseases, 9th Revision diagnosis of a psychiatric illness at hospital discharge. Patients were considered to have moderate probability of disease if they: (1) had a psychiatric diagnosis on their outpatient problem list, or (2) were prescribed a medication intended to treat a psychiatric condition as an outpatient. Patients were considered unlikely to have psychiatric disease if none of these criteria were met. Patients were considered likely to have a substance abuse disorder if they had this diagnosis on their outpatient EMR, or were prescribed a medication to treat this condition (eg, buprenorphine/naloxone), or received inpatient consultation from a substance abuse treatment team during their inpatient hospitalization, and were considered unlikely if none of these were true. We also evaluated individual categories of psychiatric illness (schizophrenia, depression, anxiety, bipolar disorder) and of psychotropic medications (antidepressants, antipsychotics, anxiolytics).
Potential Confounders
Data on potential confounders, based on prior literature,[16, 17] collected at the index admission were derived from electronic administrative, clinical, and billing sources, including the Brigham Integrated Computer System and the Partners Clinical Data Repository. They included patient age, gender, ethnicity, primary language, marital status, insurance status, living situation prior to admission, discharge location, length of stay, Elixhauser comorbidity index,[18] total number of medications prescribed, and number of prior admissions and ED visits in the prior year.
Statistical Analysis
Bivariate comparisons of each of the predictors of ACR and PAR risk (ie, patients with a 30‐day ACR or PAR vs those not readmitted within 30 days) were conducted using 2 trend tests for ordinal predictors (eg, likelihood of psychiatric disease), and 2 or Fisher exact test for dichotomous predictors (eg, receipt of inpatient substance abuse counseling).
We then used multivariate logistic regression analysis to adjust for all of the potential confounders noted above, entering each variable related to psychiatric illness into the model separately (eg, likely psychiatric illness, number of psychiatric medications). In a secondary analysis, we removed potentially collinear variables from the final model; as this did not alter the results, the full model is presented. We also conducted a secondary analysis where we included patients who left against medical advice (AMA), which also did not alter the results. Two‐sided P values <0.05 were considered significant, and all analyses were performed using the SAS version 9.2 (SAS Institute, Inc., Cary, NC).
RESULTS
There were 7984 unique patients discharged during the study period. Patients were generally white and English speaking; just over half of admissions came from the ED (Table 1). Of note, nearly all patients were insured, as are almost all patients in Massachusetts. They had high degrees of comorbid illness and large numbers of prescribed medications. Nearly 30% had at least 1 hospital admission within the prior year.
| Characteristic | All Patients, N (%) | Not Readmitted, N (%) | ACR, N (%) | PAR N (%)a |
|---|---|---|---|---|
| ||||
| Study cohort | 6987 (100) | 5727 (72) | 1260 (18) | 388 (5.6) |
| Age, y | ||||
| <50 | 1663 (23.8) | 1343 (23.5) | 320 (25.4) | 85 (21.9) |
| 5165 | 2273 (32.5) | 1859 (32.5) | 414 (32.9) | 136 (35.1) |
| 6679 | 1444 (20.7) | 1176 (20.5) | 268 (18.6) | 80 (20.6) |
| >80 | 1607 (23.0) | 1349 (23.6) | 258 (16.1) | 87 (22.4) |
| Female | 3604 (51.6) | 2967 (51.8) | 637 (50.6) | 206 (53.1) |
| Race | ||||
| White | 5126 (73.4) | 4153 (72.5) | 973 (77.2) | 300 (77.3) |
| Black | 1075 (15.4) | 899 (15.7) | 176 (14.0) | 53 (13.7) |
| Hispanic | 562 (8.0) | 477 (8.3) | 85 (6.8) | 28 (7.2) |
| Other | 224 (3.2) | 198 (3.5) | 26 (2.1) | 7 (1.8) |
| Primary language | ||||
| English | 6345 (90.8) | 5180 (90.5) | 1165 (92.5) | 356 (91.8) |
| Marital status | ||||
| Married | 3642 (52.1) | 2942 (51.4) | 702 (55.7) | 214 (55.2) |
| Single, never married | 1662 (23.8) | 1393 (24.3) | 269 (21.4) | 73 (18.8) |
| Previously married | 1683 (24.1) | 1386 (24.2) | 289 (22.9) | 101 (26.0) |
| Insurance | ||||
| Medicare | 3550 (50.8) | 2949 (51.5) | 601 (47.7) | 188 (48.5) |
| Medicaid | 539 (7.7) | 430 (7.5) | 109 (8.7) | 33 (8.5) |
| Private | 2892 (41.4) | 2344 (40.9) | 548 (43.5) | 167 (43.0) |
| Uninsured | 6 (0.1) | 4 (0.1) | 2 (0.1) | 0 (0) |
| Source of index admission | ||||
| Clinic or home | 2136 (30.6) | 1711 (29.9) | 425 (33.7) | 117 (30.2) |
| Emergency department | 3592 (51.4) | 2999 (52.4) | 593 (47.1) | 181 (46.7) |
| Nursing facility | 1204 (17.2) | 977 (17.1) | 227 (18.0) | 84 (21.7) |
| Other | 55 (0.1) | 40 (0.7) | 15 (1.1) | 6 (1.6) |
| Length of stay, d | ||||
| 02 | 1757 (25.2) | 1556 (27.2) | 201 (16.0) | 55 (14.2) |
| 34 | 2200 (31.5) | 1842 (32.2) | 358 (28.4) | 105 (27.1) |
| 57 | 1521 (21.8) | 1214 (21.2) | 307 (24.4) | 101 (26.0) |
| >7 | 1509 (21.6) | 1115 (19.5) | 394 (31.3) | 127 (32.7) |
| Elixhauser comorbidity index score | ||||
| 01 | 1987 (28.4) | 1729 (30.2) | 258 (20.5) | 66 (17.0) |
| 27 | 1773 (25.4) | 1541 (26.9) | 232 (18.4) | 67 (17.3) |
| 813 | 1535 (22.0) | 1212 (21.2) | 323 (25.6) | 86 (22.2) |
| >13 | 1692 (24.2) | 1245 (21.7) | 447 (35.5) | 169 (43.6) |
| Medications prescribed as outpatient | ||||
| 06 | 1684 (24.1) | 1410 (24.6) | 274 (21.8) | 72 (18.6) |
| 79 | 1601 (22.9) | 1349 (23.6) | 252 (20.0) | 77 (19.9) |
| 1013 | 1836 (26.3) | 1508 (26.3) | 328 (26.0) | 107 (27.6) |
| >13 | 1866 (26.7) | 1460 (25.5) | 406 (32.2) | 132 (34.0) |
| Number of admissions in past year | ||||
| 0 | 4816 (68.9) | 4032 (70.4) | 784 (62.2) | 279 (71.9) |
| 15 | 2075 (29.7) | 1640 (28.6) | 435 (34.5) | 107 (27.6) |
| >5 | 96 (1.4) | 55 (1.0) | 41 (3.3) | 2 (0.5) |
| Number of ED visits in past year | ||||
| 0 | 4661 (66.7) | 3862 (67.4) | 799 (63.4) | 261 (67.3) |
| 15 | 2326 (33.3) | 1865 (32.6) | 461 (36.6) | 127 (32.7) |
All‐Cause Readmissions
After exclusion of 997 patients who died, were discharged to skilled nursing or rehabilitation facilities, or left AMA, 6987 patients were included (Figure 1). Of these, 1260 had a readmission (18%). Approximately half were considered unlikely to be psychiatrically ill, 22% were considered moderately likely, and 29% likely (Table 2).
| All‐Cause Readmission Analysis | Potentially Avoidable Readmission Analysis | |||||
|---|---|---|---|---|---|---|
| No. in Cohort (%) | % of Patients With ACR | P Valuea | No. in Cohort (%) | % of Patients With PAR | P Valuea | |
| ||||||
| Entire cohort | 6987 | 18.0 | 6115 | 6.3 | ||
| Likelihood of psychiatric illness | ||||||
| Unlikely | 3424 (49) | 16.5 | 3026 (49) | 5.6 | ||
| Moderate | 1564 (22) | 23.5 | 1302 (21) | 7.1 | ||
| Likely | 1999 (29) | 16.4 | 1787 (29) | 6.4 | ||
| Likely versus unlikely | 0.87 | 0.20 | ||||
| Moderate+likely versus unlikely | 0.001 | 0.02 | ||||
| Likelihood of substance abuse | 0.01 | 0.20 | ||||
| Unlikely | 5804 (83) | 18.7 | 5104 (83) | 6.5 | ||
| Likely | 1183 (17) | 14.8 | 1011 (17) | 5.4 | 0.14 | |
| Number of prescribed outpatient psychotropic medications | <0.001 | 0.04 | ||||
| 0 | 4420 (63) | 16.3 | 3931 (64) | 5.9 | ||
| 1 | 1725 (25) | 20.4 | 1481 (24) | 7.2 | ||
| 2 | 781 (11) | 22.3 | 653 (11) | 7.0 | ||
| >2 | 61 (1) | 23.0 | 50 (1) | 6.0 | ||
| Prescribed antidepressant | 1474 (21) | 20.6 | 0.005 | 1248 (20) | 6.2 | 0.77 |
| Prescribed antipsychotic | 375 (5) | 22.4 | 0.02 | 315 (5) | 7.6 | 0.34 |
| Prescribed mood stabilizer | 81 (1) | 18.5 | 0.91 | 69 (1) | 4.4 | 0.49 |
| Prescribed anxiolytic | 1814 (26) | 21.8 | <0.001 | 1537 (25) | 7.7 | 0.01 |
| Prescribed stimulant | 101 (2) | 26.7 | 0.02 | 83 (1) | 10.8 | 0.09 |
| Prescribed pharmacologic treatment for substance abuse | 79 (1) | 25.3 | 0.09 | 60 (1) | 1.7 | 0.14 |
| Number of psychiatric diagnoses on outpatient problem list | 0.31 | 0.74 | ||||
| 0 | 6405 (92) | 18.2 | 5509 (90) | 6.3 | ||
| 1 or more | 582 (8) | 16.5 | 474 (8) | 7.0 | ||
| Outpatient diagnosis of substance abuse | 159 (2) | 13.2 | 0.11 | 144 (2) | 4.2 | 0.28 |
| Outpatient diagnosis of any psychiatric illness | 582 (8) | 16.5 | 0.31 | 517 (8) | 8.0 | 0.73 |
| Discharge diagnosis of depression | 774 (11) | 17.7 | 0.80 | 690 (11) | 7.7 | 0.13 |
| Discharge diagnosis of schizophrenia | 56 (1) | 23.2 | 0.31 | 50 (1) | 14 | 0.03 |
| Discharge diagnosis of bipolar disorder | 101 (1) | 10.9 | 0.06 | 92 (2) | 2.2 | 0.10 |
| Discharge diagnosis of anxiety | 1192 (17) | 15.0 | 0.003 | 1080 (18) | 6.2 | 0.83 |
| Discharge diagnosis of substance abuse | 885 (13) | 14.8 | 0.008 | 803 (13) | 6.1 | 0.76 |
| Discharge diagnosis of any psychiatric illness | 1839 (26) | 16.0 | 0.008 | 1654 (27) | 6.6 | 0.63 |
| Substance abuse consultation as inpatient | 284 (4) | 14.4 | 0.11 | 252 (4) | 3.6 | 0.07 |
In bivariate analysis (Table 2), likelihood of psychiatric illness (P<0.01) and increasing numbers of prescribed outpatient psychiatric medications (P<0.01) were significantly associated with ACR. In multivariate analysis, each additional prescribed outpatient psychiatric medication increased ACR risk (odds ratio [OR]: 1.10, 95% confidence interval [CI]: 1.01‐1.20) or any prescription of an anxiolytic in particular (OR: 1.16, 95% CI: 1.001.35) was associated with increased risk of ACR, whereas discharge diagnoses of anxiety (OR: 0.82, 95% CI: 0.68‐0.99) and substance abuse (OR: 0.80, 95% CI: 0.65‐0.99) were associated with lower risk of ACR (Table 3).
| ACR, OR (95% CI) | PAR, OR (95% CI)a | |
|---|---|---|
| ||
| Likely psychiatric disease | 0.97 (0.82‐1.14) | 1.20 (0.92‐1.56) |
| Likely and possible psychiatric disease | 1.07 (0.94‐1.22) | 1.18 (0.94‐1.47) |
| Likely substance abuse | 0.83 (0.69‐0.99) | 0.85 (0.63‐1.16) |
| Psychiatric diagnosis on outpatient problem list | 0.97 (0.76‐1.23) | 1.04 (0.70‐1.55) |
| Substance abuse diagnosis on outpatient problem list | 0.63 (0.39‐1.02) | 0.65 (0.28‐1.52) |
| Increasing number of prescribed psychiatric medications | 1.10 (1.01‐1.20) | 1.00 (0.86‐1.16) |
| Outpatient prescription for antidepressant | 1.10 (0.94‐1.29) | 0.86 (0.66‐1.13) |
| Outpatient prescription for antipsychotic | 1.03 (0.79‐1.34) | 0.93 (0.59‐1.45) |
| Outpatient prescription for anxiolytic | 1.16 (1.001.35) | 1.13 (0.88‐1.44) |
| Outpatient prescription for methadone or buprenorphine | 1.15 (0.67‐1.98) | 0.18 (0.03‐1.36) |
| Discharge diagnosis of depression | 1.06 (0.86‐1.30) | 1.49 (1.09‐2.04) |
| Discharge diagnosis of schizophrenia | 1.43 (0.75‐2.74) | 2.63 (1.13‐6.13) |
| Discharge diagnosis of bipolar disorder | 0.53 (0.28‐1.02) | 0.35 (0.09‐1.45) |
| Discharge diagnosis of anxiety | 0.82 (0.68‐0.99) | 1.11 (0.83‐1.49) |
| Discharge diagnosis of substance abuse | 0.80 (0.65‐0.99) | 1.05 (0.75‐1.46) |
| Discharge diagnosis of any psychiatric illness | 0.88 (0.75‐1.02) | 1.22 (0.96‐1.56) |
| Addiction team consult while inpatient | 0.82 (0.58‐1.17) | 0.58 (0.29‐1.17) |
Potentially Avoidable Readmissions
After further exclusion of 872 patients who had unavoidable readmissions according to the SQLape algorithm, 6115 patients remained. Of these, 388 had a PAR within 30 days (6.3%, Table 1).
In bivariate analysis (Table 2), the likelihood of psychiatric illness (P=0.02), number of outpatient psychiatric medications (P=0.04), and prescription of anxiolytics (P=0.01) were significantly associated with PAR, as they were with ACR. A discharge diagnosis of schizophrenia was also associated with PAR (P=0.03).
In multivariate analysis, only discharge diagnoses of depression (OR: 1.49, 95% CI: 1.09‐2.04) and schizophrenia (OR: 2.63, 95% CI: 1.13‐6.13) were associated with PAR.
DISCUSSION
Comorbid psychiatric illness was common among patients admitted to the medicine wards. Patients with documented discharge diagnoses of depression or schizophrenia were at highest risk for a potentially avoidable 30‐day readmission, whereas those prescribed more psychiatric medications were at increased risk for ACR. These findings were independent of a comprehensive set of risk factors among medicine inpatients in this retrospective cohort study.
This study extends prior work indicating patients with psychiatric disease have increased healthcare utilization,[6, 7, 8, 9, 10, 11] by identifying at least 2 subpopulations of the psychiatrically ill (those with depression and schizophrenia) at particularly high risk for 30‐day PAR. To our knowledge, this is the first study to identify schizophrenia as a predictor of hospital readmission for medical illnesses. One prior study prospectively identified depression as increasing the 90‐day risk of readmission 3‐fold, although medication usage was not assessed,[6] and our report strengthens this association.
There are several possible explanations why these two subpopulations in particular would be more predisposed to readmissions that are potentially avoidable. It is known that patients with schizophrenia, for example, live on average 20 years less than the general population, and most of this excess mortality is due to medical illnesses.[20, 21] Reasons for this may include poor healthcare access, adverse effects of medication, and socioeconomic factors among others.[21, 22] All of these reasons may contribute to the increased PAR risk in this population, mediated, for example, by decreased ability to adhere to postdischarge care plans. Successful community‐based interventions to decrease these inequities have been described and could serve as a model for addressing the increased readmission risk in this population.[23]
Our finding that patients with a greater number of prescribed psychiatric medications are at increased risk for ACR may be expected, given other studies that have highlighted the crucial importance of medications in postdischarge adverse events, including readmissions.[24] Indeed, medication‐related errors and toxicities are the most common postdischarge adverse events experienced by patients.[25] Whether psychiatric medications are particularly prone to causing postdischarge adverse events or whether these medications represent greater psychiatric comorbidity cannot be answered by this study.
It was surprising but reassuring that substance abuse was not a predictor of short‐term readmissions as identified using our measures; in fact, a discharge diagnosis of substance abuse was associated with lower risk of ACR than comparator patients. It seems unlikely that we would have inadequate power to find such a result, as we found a statistically significant negative association in the ACR population, and 17% of our population overall was considered likely to have a substance abuse comorbidity. However, it is likely the burden of disease was underestimated given that we did not try to determine the contribution of long‐term substance abuse to medical diseases that may increase readmission risk (eg, liver cirrhosis from alcohol use). Unlike other conditions in our study, patients with substance abuse diagnoses at BWH can be seen by a dedicated multidisciplinary team while an inpatient to start treatment and plan for postdischarge follow‐up; this may have played a role in our findings.
A discharge diagnosis of anxiety was also somewhat protective against readmission, whereas a prescription of an anxiolytic (predominantly benzodiazepines) increased risk; many patients prescribed a benzodiazepine do not have a Diagnostic and Statistical Manual of Mental Disorders4th Edition (DSM‐IV) diagnosis of anxiety disorder, and thus these findings may reflect different patient populations. Discharging physicians may have used anxiety as a discharge diagnosis in patients in whom they suspected somatic complaints without organic basis; these patients may be at lower risk of readmission.
Discharge diagnoses of psychiatric illnesses were associated with ACR and PAR in our study, but outpatient diagnoses were not. This likely reflects greater severity of illness (documentation as a treated diagnosis on discharge indicates the illness was relevant during the hospitalization), but may also reflect inaccuracies of diagnosis and lack of assessment of severity in outpatient coding, which would bias toward null findings. Although many of the patients in our study were seen by primary care doctors within the Partners system, some patients had outside primary care physicians and we did not have access to these records. This may also have decreased our ability to find associations.
The findings of our study should be interpreted in the context of the study design. Our study was retrospective, which limited our ability to conclusively diagnose psychiatric disease presence or severity (as is true of most institutions, validated psychiatric screening was not routinely used at our institutions on hospital admission or discharge). However, we used a conservative scale to classify the likelihood of patients having psychiatric or substance abuse disorders, and we used other metrics to establish the presence of illness, such as the number of prescribed medications, inpatient consultation with a substance abuse service, and hospital discharge diagnoses. This approach also allowed us to quickly identify a large cohort unaffected by selection bias. Our study was single center, potentially limiting generalizability. Although we capture at least 80% of readmissions, we were not able to capture all readmissions, and we cannot rule out that patients readmitted elsewhere are different than those readmitted within the Partners system. Last, the SQLape algorithm is not perfectly sensitive or specific in identifying avoidable readmissions,[13] but it does eliminate many readmissions that are clearly unavoidable, creating an enriched cohort of patients whose readmissions are more likely to be avoidable and therefore potentially actionable.
We suggest that our study findings first be considered when risk stratifying patients before hospital discharge in terms of readmission risk. Patients with depression and schizophrenia would seem to merit postdischarge interventions to decrease their potentially avoidable readmissions. Compulsory community treatment (a feature of treatment in Canada and Australia that is ordered by clinicians) has been shown to decrease mortality due to medical illness in patients who have been hospitalized and are psychiatrically ill, and addition of these services to postdischarge care may be useful.[23] Inpatient physicians could work to ensure follow‐up not just with medical providers but with robust outpatient mental health programs to decrease potentially avoidable readmission risk, and administrators could work to ensure close linkages with these community resources. Studies evaluating the impact of these types of interventions would need to be conducted. Patients with polypharmacy, including psychiatric medications, may benefit from interventions to improve medication safety, such as enhanced medication reconciliation and pharmacist counseling.[26]
Our study suggests that patients with depression, those with schizophrenia, and those who have increased numbers of prescribed psychiatric medications should be considered at high risk for readmission for medical illnesses. Targeting interventions to these patients may be fruitful in preventing avoidable readmissions.
Acknowledgements
The authors thank Dr. Yves Eggli for screening the database for potentially avoidable readmissions using the SQLape algorithm.
Disclosures
Dr. Donz was supported by the Swiss National Science Foundation and the Swiss Foundation for MedicalBiological Scholarships. The authors otherwise have no conflicts of interest to disclose. The content is solely the responsibility of the authors and does not necessarily represent the official views of the US Department of Veterans Affairs.
- , , . Rehospitalizations among patients in the Medicare fee‐for‐service program. N Engl J Med. 2009;360(14):1418–1428.
- , , , et al. Risk prediction models for hospital readmission: a systematic review. JAMA. 2011;306(15):1688–1698.
- , . Hospital readmission as an accountability measure. JAMA. 2011;305(5):504–505.
- , , , , , . Postdischarge environmental and socioeconomic factors and the likelihood of early hospital readmission among community‐dwelling Medicare beneficiaries. Gerontologist. 2008;48(4):495–504.
- , , , , . Low health literacy and health outcomes: an updated systematic review. Ann Intern Med. 2011;155(2):97–107.
- , , , et al. Depression is a risk factor for rehospitalization in medical inpatients. Prim Care Companion J Clin Psychiatry. 2007;9(4):256–262.
- , , , . Mental illness and hospitalization for ambulatory care sensitive medical conditions. Med Care. 2008;46(12):1249–1256.
- , , , , , . Substance use treatment barriers for patients with frequent hospital admissions. J Subst Abuse Treat. 2010;38(1):22–30.
- , , , , . Managed care and the quality of substance abuse treatment. J Ment Health Policy Econ. 2002;5(4):163–174.
- , , , , . Unmet substance abuse treatment need, health services utilization, and cost: a population‐based emergency department study. Ann Emerg Med. 2005;45(2):118–127.
- , , , . Elderly Medicare inpatients with substance use disorders: characteristics and predictors of hospital readmissions over a four‐year interval. J Stud Alcohol. 2000;61(6):891–895.
- , , , et al. Rationale and design of the Pharmacist Intervention for Low Literacy in Cardiovascular Disease (PILL‐CVD) study. Circ Cardiovasc Qual Outcomes. 2010;3(2):212–219.
- , , , , , . Validation of the potentially avoidable hospital readmission rate as a routine indicator of the quality of hospital care. Med Care. 2006;44(11);972–981.
- , , , , , . Measuring potentially avoidable hospital readmissions. J Clin Epidemiol. 2002;55:573–587.
- Agency for Healthcare Research and Quality Quality Indicators. (April 7, 2006). Prevention Quality Indicators (PQI) Composite Measure Workgroup Final Report. Available at: http://www.qualityindicators.ahrq.gov/modules/pqi_resources.aspx. Accessed June 1, 2012.
- , , , et al. Hospital readmission in general medicine patients: a prediction model. J Gen Intern Med. 2010;25(3):211–219.
- , , , et al. Derivation and validation of an index to predict early death or unplanned readmission after discharge from hospital to the community. CMAJ. 2010;182(6):551–557.
- , , , . Comorbidity measures for use with administrative data. Med Care. Jan 1998;36(1):8–27.
- , , , , eds. Morbidity and mortality in people with serious mental illness. October 2006. National Association of State Mental Health Directors, Medical Directors Council. Available at: http://www.nasmhpd.org/docs/publications/MDCdocs/Mortality%20and%20 Mo rbidity%20Final%20Report%208.18.08.pdf. Accessed January 13, 2013.
- , , , . Mortality in individuals who have had psychiatric treatment: population‐based study in Nova Scotia. Br J Psychiat. 2005;187:552–558.
- , , , , , . Inequitable access for mentally ill patients to some medically necessary procedures. CMAJ. 2007;176(6):779–784.
- , , . Quality of medical care for people with and without comorbid mental illness and substance misuse: systematic review of comparative studies. Br J Psychiat. 2009;194:491–499.
- , , , , , . Reducing all‐cause mortality among patients with psychiatric disorders: a population‐based study. CMAJ. 2013;185(1):E50–E56.
- , , , et al. Incidence of potentially avoidable urgent readmissions and their relation to all‐cause urgent readmissions. CMAJ. 2011;183(14):E1067–E1072.
- , , , , . The incidence and severity of adverse events affecting patients after discharge from the hospital. Ann Intern Med. 2003;138(3):161–167.
- , , , . Hospital‐based medication reconciliation practices: a systematic review. Arch Intern Med. 2012;172(14):1057–1069.
- , , . Rehospitalizations among patients in the Medicare fee‐for‐service program. N Engl J Med. 2009;360(14):1418–1428.
- , , , et al. Risk prediction models for hospital readmission: a systematic review. JAMA. 2011;306(15):1688–1698.
- , . Hospital readmission as an accountability measure. JAMA. 2011;305(5):504–505.
- , , , , , . Postdischarge environmental and socioeconomic factors and the likelihood of early hospital readmission among community‐dwelling Medicare beneficiaries. Gerontologist. 2008;48(4):495–504.
- , , , , . Low health literacy and health outcomes: an updated systematic review. Ann Intern Med. 2011;155(2):97–107.
- , , , et al. Depression is a risk factor for rehospitalization in medical inpatients. Prim Care Companion J Clin Psychiatry. 2007;9(4):256–262.
- , , , . Mental illness and hospitalization for ambulatory care sensitive medical conditions. Med Care. 2008;46(12):1249–1256.
- , , , , , . Substance use treatment barriers for patients with frequent hospital admissions. J Subst Abuse Treat. 2010;38(1):22–30.
- , , , , . Managed care and the quality of substance abuse treatment. J Ment Health Policy Econ. 2002;5(4):163–174.
- , , , , . Unmet substance abuse treatment need, health services utilization, and cost: a population‐based emergency department study. Ann Emerg Med. 2005;45(2):118–127.
- , , , . Elderly Medicare inpatients with substance use disorders: characteristics and predictors of hospital readmissions over a four‐year interval. J Stud Alcohol. 2000;61(6):891–895.
- , , , et al. Rationale and design of the Pharmacist Intervention for Low Literacy in Cardiovascular Disease (PILL‐CVD) study. Circ Cardiovasc Qual Outcomes. 2010;3(2):212–219.
- , , , , , . Validation of the potentially avoidable hospital readmission rate as a routine indicator of the quality of hospital care. Med Care. 2006;44(11);972–981.
- , , , , , . Measuring potentially avoidable hospital readmissions. J Clin Epidemiol. 2002;55:573–587.
- Agency for Healthcare Research and Quality Quality Indicators. (April 7, 2006). Prevention Quality Indicators (PQI) Composite Measure Workgroup Final Report. Available at: http://www.qualityindicators.ahrq.gov/modules/pqi_resources.aspx. Accessed June 1, 2012.
- , , , et al. Hospital readmission in general medicine patients: a prediction model. J Gen Intern Med. 2010;25(3):211–219.
- , , , et al. Derivation and validation of an index to predict early death or unplanned readmission after discharge from hospital to the community. CMAJ. 2010;182(6):551–557.
- , , , . Comorbidity measures for use with administrative data. Med Care. Jan 1998;36(1):8–27.
- , , , , eds. Morbidity and mortality in people with serious mental illness. October 2006. National Association of State Mental Health Directors, Medical Directors Council. Available at: http://www.nasmhpd.org/docs/publications/MDCdocs/Mortality%20and%20 Mo rbidity%20Final%20Report%208.18.08.pdf. Accessed January 13, 2013.
- , , , . Mortality in individuals who have had psychiatric treatment: population‐based study in Nova Scotia. Br J Psychiat. 2005;187:552–558.
- , , , , , . Inequitable access for mentally ill patients to some medically necessary procedures. CMAJ. 2007;176(6):779–784.
- , , . Quality of medical care for people with and without comorbid mental illness and substance misuse: systematic review of comparative studies. Br J Psychiat. 2009;194:491–499.
- , , , , , . Reducing all‐cause mortality among patients with psychiatric disorders: a population‐based study. CMAJ. 2013;185(1):E50–E56.
- , , , et al. Incidence of potentially avoidable urgent readmissions and their relation to all‐cause urgent readmissions. CMAJ. 2011;183(14):E1067–E1072.
- , , , , . The incidence and severity of adverse events affecting patients after discharge from the hospital. Ann Intern Med. 2003;138(3):161–167.
- , , , . Hospital‐based medication reconciliation practices: a systematic review. Arch Intern Med. 2012;172(14):1057–1069.
Copyright © 2013 Society of Hospital Medicine
Should I retire early?
Much has been written of the widespread concern among America’s physicians over upcoming changes in our health care system. Dire predictions of impending doom have prompted many to consider early retirement.
I do not share such concerns, for what that is worth; but if you do, and you are serious about retiring sooner than planned, now would be a great time to take a close look at your financial situation.
Many doctors have a false sense of security about their money; most of us save too little. We either miscalculate or underestimate how much we’ll need to last through retirement.
We tend to live longer than we think we will, and as such we run the risk of outliving our savings. And we don’t face facts about long-term care. Not nearly enough of us have long-term care insurance, or the means to self-fund an extended long-term care situation.
Many people lack a clear idea of where their retirement income will come from, and even when they do, they don’t know how to manage their savings correctly. Doctors in particular are notorious for not understanding investments. Many attempt to manage their practice’s retirement plans with inadequate knowledge of how the investments within their plans work.
So how will you know if you can safely retire before Obamacare gets up to speed? Of course, as with everything else, it depends. But to arrive at any sort of reliable ballpark figure, you’ll need to know three things: (1) how much you realistically expect to spend annually after retirement; (2) how much principal you will need to generate that annual income; and (3) how far your present savings are from that target figure.
An oft-quoted rule of thumb is that in retirement you should plan to spend about 70% of what you are spending now. In my opinion, that’s nonsense. While a few significant expenses, such as disability and malpractice insurance premiums, will be eliminated, other expenses, such as travel, recreation, and medical care (including long-term care insurance, which no one should be without), will increase. My wife and I are assuming we will spend about the same in retirement as we spend now, and I suggest you do too.
Once you know how much money you will spend per year, you can calculate how much money – in interest- and dividend-producing assets – will be needed to generate that amount.
Ideally, you will want to spend only the interest and dividends; by leaving the principal untouched you will never run short, even if you retire at an unusually young age, or longevity runs in your family (or both). Most financial advisers use the 5% rule: You can safely assume a minimum average of 5% annual return on your nest egg. So if you want to spend $100,000 per year, you will need $2 million in assets; for $200,000, you’ll need $4 million.
This is where you may discover – if your present savings are a long way from your target figure – that early retirement is not a realistic option. Better, though, to make that unpleasant discovery now, rather than face the frightening prospect of running out of money at an advanced age. Don’t be tempted to close a wide gap in a hurry with high-return/high-risk investments, which often backfire, leaving you further than ever from retirement.
Of course, it goes without saying that debt can destroy the best-laid retirement plans. If you carry significant debt, pay it off as soon as possible, and certainly before you retire.
Even if you have no plans to retire in the immediate future, it is never too soon to think about retirement. Young physicians often defer contributing to their retirement plans because they want to save for a new house, or college for their children. But there are tangible tax benefits that you get now, because your contributions usually reduce your taxable income, and your investment grows tax-free until you take it out.
For long-term planning, the most foolproof strategy – seldom employed, because it’s boring – is to sock away a fixed amount per month (after your retirement plan has been funded) in a mutual fund. For example, $1,000 per month for 25 years with the market earning 10% overall comes to almost $2 million, with the power of compounded interest working for you.
Dr. Eastern practices dermatology and dermatologic surgery in Belleville, N.J.
Much has been written of the widespread concern among America’s physicians over upcoming changes in our health care system. Dire predictions of impending doom have prompted many to consider early retirement.
I do not share such concerns, for what that is worth; but if you do, and you are serious about retiring sooner than planned, now would be a great time to take a close look at your financial situation.
Many doctors have a false sense of security about their money; most of us save too little. We either miscalculate or underestimate how much we’ll need to last through retirement.
We tend to live longer than we think we will, and as such we run the risk of outliving our savings. And we don’t face facts about long-term care. Not nearly enough of us have long-term care insurance, or the means to self-fund an extended long-term care situation.
Many people lack a clear idea of where their retirement income will come from, and even when they do, they don’t know how to manage their savings correctly. Doctors in particular are notorious for not understanding investments. Many attempt to manage their practice’s retirement plans with inadequate knowledge of how the investments within their plans work.
So how will you know if you can safely retire before Obamacare gets up to speed? Of course, as with everything else, it depends. But to arrive at any sort of reliable ballpark figure, you’ll need to know three things: (1) how much you realistically expect to spend annually after retirement; (2) how much principal you will need to generate that annual income; and (3) how far your present savings are from that target figure.
An oft-quoted rule of thumb is that in retirement you should plan to spend about 70% of what you are spending now. In my opinion, that’s nonsense. While a few significant expenses, such as disability and malpractice insurance premiums, will be eliminated, other expenses, such as travel, recreation, and medical care (including long-term care insurance, which no one should be without), will increase. My wife and I are assuming we will spend about the same in retirement as we spend now, and I suggest you do too.
Once you know how much money you will spend per year, you can calculate how much money – in interest- and dividend-producing assets – will be needed to generate that amount.
Ideally, you will want to spend only the interest and dividends; by leaving the principal untouched you will never run short, even if you retire at an unusually young age, or longevity runs in your family (or both). Most financial advisers use the 5% rule: You can safely assume a minimum average of 5% annual return on your nest egg. So if you want to spend $100,000 per year, you will need $2 million in assets; for $200,000, you’ll need $4 million.
This is where you may discover – if your present savings are a long way from your target figure – that early retirement is not a realistic option. Better, though, to make that unpleasant discovery now, rather than face the frightening prospect of running out of money at an advanced age. Don’t be tempted to close a wide gap in a hurry with high-return/high-risk investments, which often backfire, leaving you further than ever from retirement.
Of course, it goes without saying that debt can destroy the best-laid retirement plans. If you carry significant debt, pay it off as soon as possible, and certainly before you retire.
Even if you have no plans to retire in the immediate future, it is never too soon to think about retirement. Young physicians often defer contributing to their retirement plans because they want to save for a new house, or college for their children. But there are tangible tax benefits that you get now, because your contributions usually reduce your taxable income, and your investment grows tax-free until you take it out.
For long-term planning, the most foolproof strategy – seldom employed, because it’s boring – is to sock away a fixed amount per month (after your retirement plan has been funded) in a mutual fund. For example, $1,000 per month for 25 years with the market earning 10% overall comes to almost $2 million, with the power of compounded interest working for you.
Dr. Eastern practices dermatology and dermatologic surgery in Belleville, N.J.
Much has been written of the widespread concern among America’s physicians over upcoming changes in our health care system. Dire predictions of impending doom have prompted many to consider early retirement.
I do not share such concerns, for what that is worth; but if you do, and you are serious about retiring sooner than planned, now would be a great time to take a close look at your financial situation.
Many doctors have a false sense of security about their money; most of us save too little. We either miscalculate or underestimate how much we’ll need to last through retirement.
We tend to live longer than we think we will, and as such we run the risk of outliving our savings. And we don’t face facts about long-term care. Not nearly enough of us have long-term care insurance, or the means to self-fund an extended long-term care situation.
Many people lack a clear idea of where their retirement income will come from, and even when they do, they don’t know how to manage their savings correctly. Doctors in particular are notorious for not understanding investments. Many attempt to manage their practice’s retirement plans with inadequate knowledge of how the investments within their plans work.
So how will you know if you can safely retire before Obamacare gets up to speed? Of course, as with everything else, it depends. But to arrive at any sort of reliable ballpark figure, you’ll need to know three things: (1) how much you realistically expect to spend annually after retirement; (2) how much principal you will need to generate that annual income; and (3) how far your present savings are from that target figure.
An oft-quoted rule of thumb is that in retirement you should plan to spend about 70% of what you are spending now. In my opinion, that’s nonsense. While a few significant expenses, such as disability and malpractice insurance premiums, will be eliminated, other expenses, such as travel, recreation, and medical care (including long-term care insurance, which no one should be without), will increase. My wife and I are assuming we will spend about the same in retirement as we spend now, and I suggest you do too.
Once you know how much money you will spend per year, you can calculate how much money – in interest- and dividend-producing assets – will be needed to generate that amount.
Ideally, you will want to spend only the interest and dividends; by leaving the principal untouched you will never run short, even if you retire at an unusually young age, or longevity runs in your family (or both). Most financial advisers use the 5% rule: You can safely assume a minimum average of 5% annual return on your nest egg. So if you want to spend $100,000 per year, you will need $2 million in assets; for $200,000, you’ll need $4 million.
This is where you may discover – if your present savings are a long way from your target figure – that early retirement is not a realistic option. Better, though, to make that unpleasant discovery now, rather than face the frightening prospect of running out of money at an advanced age. Don’t be tempted to close a wide gap in a hurry with high-return/high-risk investments, which often backfire, leaving you further than ever from retirement.
Of course, it goes without saying that debt can destroy the best-laid retirement plans. If you carry significant debt, pay it off as soon as possible, and certainly before you retire.
Even if you have no plans to retire in the immediate future, it is never too soon to think about retirement. Young physicians often defer contributing to their retirement plans because they want to save for a new house, or college for their children. But there are tangible tax benefits that you get now, because your contributions usually reduce your taxable income, and your investment grows tax-free until you take it out.
For long-term planning, the most foolproof strategy – seldom employed, because it’s boring – is to sock away a fixed amount per month (after your retirement plan has been funded) in a mutual fund. For example, $1,000 per month for 25 years with the market earning 10% overall comes to almost $2 million, with the power of compounded interest working for you.
Dr. Eastern practices dermatology and dermatologic surgery in Belleville, N.J.
Managing symptoms of depression
Diana looked at her pill bottles and wondered why she was on all these medications when she did not feel any better. She looked at the five bottles: bupropion, paroxetine, diazepam, alprazolam, and zolpidem. She thought about the side effects she was experiencing.
She had been taking this cocktail, in various dosages, for the best part of a year now. Her depression remained unchanged. She made a decision that she would tell her psychiatrist that she wanted off the medications at her next visit. She would then ask for other treatments. She had found many therapies offered on the Internet for treatment of depression, and she hoped her psychiatrist would be able to help her decide which therapies might be best suited for her. Perhaps she would agree to stay on one medication as a compromise as she knew her psychiatrist thought treatment of depression with medication to be important.
Up to 30% of patients with depression do not respond to multiple treatment trials and are considered to have treatment-resistant depression. Most treatment trials for these patients focus on symptom reduction as a goal. This emphasis on symptom reduction often leads to tunnel vision, where other evidence-based treatments become marginalized by psychiatrists. Thus, patients like Diana end up on multiple medications, without an integrated approach to assessment or discussion of combined treatments (medications and psychotherapy).
Dr. Gabor Keitner, who practices in Providence, R.I., and is a member of the Association of Family Psychiatrists, offers a new program aimed at helping patients manage their depression. His philosophical stance is that depression is a chronic illness and that expecting symptoms to be cured with medications is, for most patients, a false hope perpetuated by a consumer society, where the pharmaceutical industry has dominated the education of patients, their families, and the psychiatric profession. He conceptualizes depression, like other chronic medical illnesses, such as diabetes or hypertension, with a similar range of severity. Therefore, the assessment and treatment of depression requires a more nuanced approach.
He is scheduled to present his Management of Depression (MOD) program at this year’s American Psychiatric Association meeting in San Francisco. His MOD program focuses on how a patient such as Diana can build a satisfying life with meaningful goals and relationships – even if her depressive symptoms persist.
In his pilot study, 30 patients with treatment-resistant depression were randomized to treatment as usual (TAU, n = 13) or the MOD program (n = 17) for 12 weeks. The patients in the MOD group had significant improvement in perception of social support (P < .034) and purpose in life (P < .038) scores, in contrast to the TAU group. The MOD group participated in nine adjunctive sessions of disease management focused therapy. The Scales of Psychological Well-Being measured purpose in life, life goals, and meaning. Social support was measured with the Multidimensional Scale of Perceived Social Support. Depression severity was measured by the Montgomery-Åsberg Depression Rating Scale. Patients were assessed at baseline and week 12. Both groups of patients had significant improvements in their depressive symptoms (TAU 35.46 to 25.9 P < .010; MOD 31.88 to 22.41 P < .001) but continued to experience moderate levels of depression. Adjunctive treatment focusing on functioning, life meaning, and relationships, as opposed to symptom reduction, will help Diana to have a more satisfying life, despite her symptoms of depression.
Measuring relational functioning briefly
In another session, Dr. Keitner is slated to present "The Brief Multidimensional Assessment Scale (BMAS): A Mental Health Check Up," coauthored with Abigail K. Mansfield Maraccio, Ph.D., and Joan Kelley. This scale evaluates global mental health outcomes, including quality of life, symptoms, functioning, and relationships. This measure can be used to assess the clinical status of patients at every health encounter and over the course of an illness. Most available scales are either too long for routine clinical use, focus on a narrow range of symptoms, or focus on specific diagnostic groups. Best of all, this new scale takes less than a minute to complete.
The BMAS was tested against The Outcome Questionnaire–45 (OQ45) with 248 psychiatric outpatients as part of their standard ongoing care. Internal consistency was evaluated with Cronbach’s alpha, which was .75 for the four items. Test-retest reliability was assessed using Pearson’s r and ranged from .45 (symptom severity, which can fluctuate daily) to .79 (quality of life) for each of the BMAS items. Concurrent and convergent validity was analyzed with Pearson product moment correlations between BMAS and OQ45 scales. All correlations were significant for the relevant dimensions.
The BMAS demonstrated acceptable reliability, especially for such a brief measure. It also demonstrated concurrent and convergent validity with a much longer commonly used clinical outcome scale. The BMAS is a useful assessment tool for patients with any clinical condition for which it is desirable to track how the patient is experiencing his or her life situation at a given point in time and when there is a desire to monitor change over time. Notably, BMAS includes health relationships as a measure of good clinical outcome.
A daughter’s documentary about her father
One media workshop slated for the APA meeting will be offered by three members of the Association of Family Psychiatrists: Dr. Michael S. Ascher, Dr. Ira Glick, and Dr. Igor Galynker. They will present a film, "Unlisted: A Story of Schizophrenia." This is a soul-searching examination of responsibility – of parents and children, physicians and patients, and of society and citizens – toward those afflicted with severe mental illness. The film was made by Dr. Delaney Ruston, a Seattle general physician who documents the rebuilding of her relationship with her father. "Unlisted" examines the challenging family dynamics that are present when schizophrenia occurs. Dr. Ruston works hard to overcome the obstacles in accessing appropriate treatment for her father, and her documentary exposes the many failings of the American mental health system as experienced by the families. Dr. Ruston traces the progression of her father’s illness. She studies his medical files and narrates from his autobiographical surrealist novel. In beautifully portrayed scenes, "Unlisted" enters the inner life of Richard Ruston with a clarity and affection missing from many films about people with mental illness.
In summary, family-oriented patient care can be delivered in many ways, from focusing on relational improvement in individual work, to being aware of how to assess and measure relational functioning briefly at each visit, to being able to listen to the accounts of family members and invite them into the treatment room.
Dr. Heru is with the department of psychiatry at the University of Colorado at Denver, Aurora. She is editor of the recently published book, "Working With Families in Medical Settings: A Multidisciplinary Guide for Psychiatrists and Other Health Professions" (New York: Routledge, March 2013), and has been a member of the Association of Family Psychiatrists since 2002.
Diana looked at her pill bottles and wondered why she was on all these medications when she did not feel any better. She looked at the five bottles: bupropion, paroxetine, diazepam, alprazolam, and zolpidem. She thought about the side effects she was experiencing.
She had been taking this cocktail, in various dosages, for the best part of a year now. Her depression remained unchanged. She made a decision that she would tell her psychiatrist that she wanted off the medications at her next visit. She would then ask for other treatments. She had found many therapies offered on the Internet for treatment of depression, and she hoped her psychiatrist would be able to help her decide which therapies might be best suited for her. Perhaps she would agree to stay on one medication as a compromise as she knew her psychiatrist thought treatment of depression with medication to be important.
Up to 30% of patients with depression do not respond to multiple treatment trials and are considered to have treatment-resistant depression. Most treatment trials for these patients focus on symptom reduction as a goal. This emphasis on symptom reduction often leads to tunnel vision, where other evidence-based treatments become marginalized by psychiatrists. Thus, patients like Diana end up on multiple medications, without an integrated approach to assessment or discussion of combined treatments (medications and psychotherapy).
Dr. Gabor Keitner, who practices in Providence, R.I., and is a member of the Association of Family Psychiatrists, offers a new program aimed at helping patients manage their depression. His philosophical stance is that depression is a chronic illness and that expecting symptoms to be cured with medications is, for most patients, a false hope perpetuated by a consumer society, where the pharmaceutical industry has dominated the education of patients, their families, and the psychiatric profession. He conceptualizes depression, like other chronic medical illnesses, such as diabetes or hypertension, with a similar range of severity. Therefore, the assessment and treatment of depression requires a more nuanced approach.
He is scheduled to present his Management of Depression (MOD) program at this year’s American Psychiatric Association meeting in San Francisco. His MOD program focuses on how a patient such as Diana can build a satisfying life with meaningful goals and relationships – even if her depressive symptoms persist.
In his pilot study, 30 patients with treatment-resistant depression were randomized to treatment as usual (TAU, n = 13) or the MOD program (n = 17) for 12 weeks. The patients in the MOD group had significant improvement in perception of social support (P < .034) and purpose in life (P < .038) scores, in contrast to the TAU group. The MOD group participated in nine adjunctive sessions of disease management focused therapy. The Scales of Psychological Well-Being measured purpose in life, life goals, and meaning. Social support was measured with the Multidimensional Scale of Perceived Social Support. Depression severity was measured by the Montgomery-Åsberg Depression Rating Scale. Patients were assessed at baseline and week 12. Both groups of patients had significant improvements in their depressive symptoms (TAU 35.46 to 25.9 P < .010; MOD 31.88 to 22.41 P < .001) but continued to experience moderate levels of depression. Adjunctive treatment focusing on functioning, life meaning, and relationships, as opposed to symptom reduction, will help Diana to have a more satisfying life, despite her symptoms of depression.
Measuring relational functioning briefly
In another session, Dr. Keitner is slated to present "The Brief Multidimensional Assessment Scale (BMAS): A Mental Health Check Up," coauthored with Abigail K. Mansfield Maraccio, Ph.D., and Joan Kelley. This scale evaluates global mental health outcomes, including quality of life, symptoms, functioning, and relationships. This measure can be used to assess the clinical status of patients at every health encounter and over the course of an illness. Most available scales are either too long for routine clinical use, focus on a narrow range of symptoms, or focus on specific diagnostic groups. Best of all, this new scale takes less than a minute to complete.
The BMAS was tested against The Outcome Questionnaire–45 (OQ45) with 248 psychiatric outpatients as part of their standard ongoing care. Internal consistency was evaluated with Cronbach’s alpha, which was .75 for the four items. Test-retest reliability was assessed using Pearson’s r and ranged from .45 (symptom severity, which can fluctuate daily) to .79 (quality of life) for each of the BMAS items. Concurrent and convergent validity was analyzed with Pearson product moment correlations between BMAS and OQ45 scales. All correlations were significant for the relevant dimensions.
The BMAS demonstrated acceptable reliability, especially for such a brief measure. It also demonstrated concurrent and convergent validity with a much longer commonly used clinical outcome scale. The BMAS is a useful assessment tool for patients with any clinical condition for which it is desirable to track how the patient is experiencing his or her life situation at a given point in time and when there is a desire to monitor change over time. Notably, BMAS includes health relationships as a measure of good clinical outcome.
A daughter’s documentary about her father
One media workshop slated for the APA meeting will be offered by three members of the Association of Family Psychiatrists: Dr. Michael S. Ascher, Dr. Ira Glick, and Dr. Igor Galynker. They will present a film, "Unlisted: A Story of Schizophrenia." This is a soul-searching examination of responsibility – of parents and children, physicians and patients, and of society and citizens – toward those afflicted with severe mental illness. The film was made by Dr. Delaney Ruston, a Seattle general physician who documents the rebuilding of her relationship with her father. "Unlisted" examines the challenging family dynamics that are present when schizophrenia occurs. Dr. Ruston works hard to overcome the obstacles in accessing appropriate treatment for her father, and her documentary exposes the many failings of the American mental health system as experienced by the families. Dr. Ruston traces the progression of her father’s illness. She studies his medical files and narrates from his autobiographical surrealist novel. In beautifully portrayed scenes, "Unlisted" enters the inner life of Richard Ruston with a clarity and affection missing from many films about people with mental illness.
In summary, family-oriented patient care can be delivered in many ways, from focusing on relational improvement in individual work, to being aware of how to assess and measure relational functioning briefly at each visit, to being able to listen to the accounts of family members and invite them into the treatment room.
Dr. Heru is with the department of psychiatry at the University of Colorado at Denver, Aurora. She is editor of the recently published book, "Working With Families in Medical Settings: A Multidisciplinary Guide for Psychiatrists and Other Health Professions" (New York: Routledge, March 2013), and has been a member of the Association of Family Psychiatrists since 2002.
Diana looked at her pill bottles and wondered why she was on all these medications when she did not feel any better. She looked at the five bottles: bupropion, paroxetine, diazepam, alprazolam, and zolpidem. She thought about the side effects she was experiencing.
She had been taking this cocktail, in various dosages, for the best part of a year now. Her depression remained unchanged. She made a decision that she would tell her psychiatrist that she wanted off the medications at her next visit. She would then ask for other treatments. She had found many therapies offered on the Internet for treatment of depression, and she hoped her psychiatrist would be able to help her decide which therapies might be best suited for her. Perhaps she would agree to stay on one medication as a compromise as she knew her psychiatrist thought treatment of depression with medication to be important.
Up to 30% of patients with depression do not respond to multiple treatment trials and are considered to have treatment-resistant depression. Most treatment trials for these patients focus on symptom reduction as a goal. This emphasis on symptom reduction often leads to tunnel vision, where other evidence-based treatments become marginalized by psychiatrists. Thus, patients like Diana end up on multiple medications, without an integrated approach to assessment or discussion of combined treatments (medications and psychotherapy).
Dr. Gabor Keitner, who practices in Providence, R.I., and is a member of the Association of Family Psychiatrists, offers a new program aimed at helping patients manage their depression. His philosophical stance is that depression is a chronic illness and that expecting symptoms to be cured with medications is, for most patients, a false hope perpetuated by a consumer society, where the pharmaceutical industry has dominated the education of patients, their families, and the psychiatric profession. He conceptualizes depression, like other chronic medical illnesses, such as diabetes or hypertension, with a similar range of severity. Therefore, the assessment and treatment of depression requires a more nuanced approach.
He is scheduled to present his Management of Depression (MOD) program at this year’s American Psychiatric Association meeting in San Francisco. His MOD program focuses on how a patient such as Diana can build a satisfying life with meaningful goals and relationships – even if her depressive symptoms persist.
In his pilot study, 30 patients with treatment-resistant depression were randomized to treatment as usual (TAU, n = 13) or the MOD program (n = 17) for 12 weeks. The patients in the MOD group had significant improvement in perception of social support (P < .034) and purpose in life (P < .038) scores, in contrast to the TAU group. The MOD group participated in nine adjunctive sessions of disease management focused therapy. The Scales of Psychological Well-Being measured purpose in life, life goals, and meaning. Social support was measured with the Multidimensional Scale of Perceived Social Support. Depression severity was measured by the Montgomery-Åsberg Depression Rating Scale. Patients were assessed at baseline and week 12. Both groups of patients had significant improvements in their depressive symptoms (TAU 35.46 to 25.9 P < .010; MOD 31.88 to 22.41 P < .001) but continued to experience moderate levels of depression. Adjunctive treatment focusing on functioning, life meaning, and relationships, as opposed to symptom reduction, will help Diana to have a more satisfying life, despite her symptoms of depression.
Measuring relational functioning briefly
In another session, Dr. Keitner is slated to present "The Brief Multidimensional Assessment Scale (BMAS): A Mental Health Check Up," coauthored with Abigail K. Mansfield Maraccio, Ph.D., and Joan Kelley. This scale evaluates global mental health outcomes, including quality of life, symptoms, functioning, and relationships. This measure can be used to assess the clinical status of patients at every health encounter and over the course of an illness. Most available scales are either too long for routine clinical use, focus on a narrow range of symptoms, or focus on specific diagnostic groups. Best of all, this new scale takes less than a minute to complete.
The BMAS was tested against The Outcome Questionnaire–45 (OQ45) with 248 psychiatric outpatients as part of their standard ongoing care. Internal consistency was evaluated with Cronbach’s alpha, which was .75 for the four items. Test-retest reliability was assessed using Pearson’s r and ranged from .45 (symptom severity, which can fluctuate daily) to .79 (quality of life) for each of the BMAS items. Concurrent and convergent validity was analyzed with Pearson product moment correlations between BMAS and OQ45 scales. All correlations were significant for the relevant dimensions.
The BMAS demonstrated acceptable reliability, especially for such a brief measure. It also demonstrated concurrent and convergent validity with a much longer commonly used clinical outcome scale. The BMAS is a useful assessment tool for patients with any clinical condition for which it is desirable to track how the patient is experiencing his or her life situation at a given point in time and when there is a desire to monitor change over time. Notably, BMAS includes health relationships as a measure of good clinical outcome.
A daughter’s documentary about her father
One media workshop slated for the APA meeting will be offered by three members of the Association of Family Psychiatrists: Dr. Michael S. Ascher, Dr. Ira Glick, and Dr. Igor Galynker. They will present a film, "Unlisted: A Story of Schizophrenia." This is a soul-searching examination of responsibility – of parents and children, physicians and patients, and of society and citizens – toward those afflicted with severe mental illness. The film was made by Dr. Delaney Ruston, a Seattle general physician who documents the rebuilding of her relationship with her father. "Unlisted" examines the challenging family dynamics that are present when schizophrenia occurs. Dr. Ruston works hard to overcome the obstacles in accessing appropriate treatment for her father, and her documentary exposes the many failings of the American mental health system as experienced by the families. Dr. Ruston traces the progression of her father’s illness. She studies his medical files and narrates from his autobiographical surrealist novel. In beautifully portrayed scenes, "Unlisted" enters the inner life of Richard Ruston with a clarity and affection missing from many films about people with mental illness.
In summary, family-oriented patient care can be delivered in many ways, from focusing on relational improvement in individual work, to being aware of how to assess and measure relational functioning briefly at each visit, to being able to listen to the accounts of family members and invite them into the treatment room.
Dr. Heru is with the department of psychiatry at the University of Colorado at Denver, Aurora. She is editor of the recently published book, "Working With Families in Medical Settings: A Multidisciplinary Guide for Psychiatrists and Other Health Professions" (New York: Routledge, March 2013), and has been a member of the Association of Family Psychiatrists since 2002.

Only doctors can save America
Dr. Ezekiel J. Emanuel, one of the brains behind Obamacare, has a blunt message for his fellow physicians:
Only you can save America.
He's not just talking about medicine. As might befit someone who holds a faculty title at the business-oriented Wharton School at the University of Pennsylvania, Dr. Emanuel spent much of his keynote address here at the American College of Physicians' annual meeting in San Francisco talking about the U.S. economy. The enormous impact of runaway spending on U.S. health care threatens "everything we care about," including access to health care, state funds available for education, corporate wages for the middle class, and the fiscal health of the nation, he said.
"More than any other group in America, doctors have the power to solve our long-term economic challenges to ensure a prosperous future," Dr. Emanuel said.

If the U.S. health care system were a country, its nearly $3 trillion economy in 2012 would be the fifth largest in the world, behind only the U.S. as a whole, China, Japan, and Germany. "We spend more on health care in this country than the 66 million French spend on everything in their society," he said. "It is an astounding number how much we spend on health care."
Take just the federal portions of Medicare and Medicaid, excluding state spending, and you've still got the 16th largest economy in the world, bigger than the economies of Switzerland, Turkey, or the Netherlands, for example. The impact of any other fiscal variable on the U.S. economy, including Social Security, is swamped by the impact of health care costs, said Dr. Emanuel, who is also chair of medical ethics and health policy at the University of Pennsylvania, Philadelphia.
Per person, the United States far outspends other countries when it comes to health care, and the proportion of the gross domestic product consumed by health care keeps getting larger and larger.
Dr. Emanuel served as a special adviser for health policy to the director of the federal Office of Management and Budget in 2009-2011 - during the design, passage, and first steps to implementation of the Patient Protection and Affordable Care Act (commonly known as Obamacare) - and he seemed to address some critics in absentia who have claimed that health care reform will lead to unwanted rationing of care. There's no need to ration, Dr. Emanuel said. Switzerland doesn't ration care, and it spends far less per capita for what is considered quality health care. "We can do a better job in this country of controlling costs without the need to ration care," he said.
The only way to really control costs is to transform the way U.S. health care is delivered, he said. Ten percent of U.S. patients account for 63% of dollars spent on health care. "You know who they are - people with congestive heart failure, COPD, diabetes, adult asthma, coronary artery disease, cancer. People with chronic multiple chronic illnesses. That's where the money's going. That's where the uneven quality is," and that's where health care delivery needs to improve, he said.
Dr. Emanuel proposed six essential components to transforming the health care system. Among them: The focus needs to be on cost according to value, and getting rid of services with no value. The system must focus on patients' needs, not on physicians' schedules or other concerns. And the system must evolve toward clinicians working as teams including allied health professionals, not as individuals. "We are not going to be, going forward, one-sies and two-sies in practice" anymore, he said.
Greater emphasis on delivering health care via organizations and systems, standardization of processes, and transparency around price and quality will be essential, he added.
Transparency in pricing and quality isn't just something consumers will want. Physicians will want it in order to refer patients to quality care and set prices appropriately, Dr. Emanuel argued. "I think this is inevitable, and I think it's going to happen faster than you think," he said.
Most U.S. physicians are stuck in fee-for-service payment systems, which don't provide the incentives needed for change, he said. Doctors "as a group" should push for changes to the payment system, which will increase physician autonomy but also will assign more financial risk to physicians. "I see no way of getting out of that," Dr. Emanuel said.
In his eyes, if doctors don't push for changes in how health care is delivered, we basically can kiss the U.S. economy and future prosperity good-bye. "Doctors are the only people who can re-engineer the delivery system," he said. "If you don't do it, it ain't gonna happen. It's that simple," he said. All previous reform efforts that did not have physician leadership have failed.
"You have to lead this," he explained.
No one should expect that reforming the fifth-largest economy in the world could be accomplished in just a few years, however. "It's going to take this decade," Dr. Emanuel predicted.
Dr. Emanuel reported having no financial disclosures.
Twitter: @sherryboschert
Dr. Ezekiel J. Emanuel, one of the brains behind Obamacare, has a blunt message for his fellow physicians:
Only you can save America.
He's not just talking about medicine. As might befit someone who holds a faculty title at the business-oriented Wharton School at the University of Pennsylvania, Dr. Emanuel spent much of his keynote address here at the American College of Physicians' annual meeting in San Francisco talking about the U.S. economy. The enormous impact of runaway spending on U.S. health care threatens "everything we care about," including access to health care, state funds available for education, corporate wages for the middle class, and the fiscal health of the nation, he said.
"More than any other group in America, doctors have the power to solve our long-term economic challenges to ensure a prosperous future," Dr. Emanuel said.
If the U.S. health care system were a country, its nearly $3 trillion economy in 2012 would be the fifth largest in the world, behind only the U.S. as a whole, China, Japan, and Germany. "We spend more on health care in this country than the 66 million French spend on everything in their society," he said. "It is an astounding number how much we spend on health care."
Take just the federal portions of Medicare and Medicaid, excluding state spending, and you've still got the 16th largest economy in the world, bigger than the economies of Switzerland, Turkey, or the Netherlands, for example. The impact of any other fiscal variable on the U.S. economy, including Social Security, is swamped by the impact of health care costs, said Dr. Emanuel, who is also chair of medical ethics and health policy at the University of Pennsylvania, Philadelphia.
Per person, the United States far outspends other countries when it comes to health care, and the proportion of the gross domestic product consumed by health care keeps getting larger and larger.
Dr. Emanuel served as a special adviser for health policy to the director of the federal Office of Management and Budget in 2009-2011 - during the design, passage, and first steps to implementation of the Patient Protection and Affordable Care Act (commonly known as Obamacare) - and he seemed to address some critics in absentia who have claimed that health care reform will lead to unwanted rationing of care. There's no need to ration, Dr. Emanuel said. Switzerland doesn't ration care, and it spends far less per capita for what is considered quality health care. "We can do a better job in this country of controlling costs without the need to ration care," he said.
The only way to really control costs is to transform the way U.S. health care is delivered, he said. Ten percent of U.S. patients account for 63% of dollars spent on health care. "You know who they are - people with congestive heart failure, COPD, diabetes, adult asthma, coronary artery disease, cancer. People with chronic multiple chronic illnesses. That's where the money's going. That's where the uneven quality is," and that's where health care delivery needs to improve, he said.
Dr. Emanuel proposed six essential components to transforming the health care system. Among them: The focus needs to be on cost according to value, and getting rid of services with no value. The system must focus on patients' needs, not on physicians' schedules or other concerns. And the system must evolve toward clinicians working as teams including allied health professionals, not as individuals. "We are not going to be, going forward, one-sies and two-sies in practice" anymore, he said.
Greater emphasis on delivering health care via organizations and systems, standardization of processes, and transparency around price and quality will be essential, he added.
Transparency in pricing and quality isn't just something consumers will want. Physicians will want it in order to refer patients to quality care and set prices appropriately, Dr. Emanuel argued. "I think this is inevitable, and I think it's going to happen faster than you think," he said.
Most U.S. physicians are stuck in fee-for-service payment systems, which don't provide the incentives needed for change, he said. Doctors "as a group" should push for changes to the payment system, which will increase physician autonomy but also will assign more financial risk to physicians. "I see no way of getting out of that," Dr. Emanuel said.
In his eyes, if doctors don't push for changes in how health care is delivered, we basically can kiss the U.S. economy and future prosperity good-bye. "Doctors are the only people who can re-engineer the delivery system," he said. "If you don't do it, it ain't gonna happen. It's that simple," he said. All previous reform efforts that did not have physician leadership have failed.
"You have to lead this," he explained.
No one should expect that reforming the fifth-largest economy in the world could be accomplished in just a few years, however. "It's going to take this decade," Dr. Emanuel predicted.
Dr. Emanuel reported having no financial disclosures.
Twitter: @sherryboschert
Dr. Ezekiel J. Emanuel, one of the brains behind Obamacare, has a blunt message for his fellow physicians:
Only you can save America.
He's not just talking about medicine. As might befit someone who holds a faculty title at the business-oriented Wharton School at the University of Pennsylvania, Dr. Emanuel spent much of his keynote address here at the American College of Physicians' annual meeting in San Francisco talking about the U.S. economy. The enormous impact of runaway spending on U.S. health care threatens "everything we care about," including access to health care, state funds available for education, corporate wages for the middle class, and the fiscal health of the nation, he said.
"More than any other group in America, doctors have the power to solve our long-term economic challenges to ensure a prosperous future," Dr. Emanuel said.
If the U.S. health care system were a country, its nearly $3 trillion economy in 2012 would be the fifth largest in the world, behind only the U.S. as a whole, China, Japan, and Germany. "We spend more on health care in this country than the 66 million French spend on everything in their society," he said. "It is an astounding number how much we spend on health care."
Take just the federal portions of Medicare and Medicaid, excluding state spending, and you've still got the 16th largest economy in the world, bigger than the economies of Switzerland, Turkey, or the Netherlands, for example. The impact of any other fiscal variable on the U.S. economy, including Social Security, is swamped by the impact of health care costs, said Dr. Emanuel, who is also chair of medical ethics and health policy at the University of Pennsylvania, Philadelphia.
Per person, the United States far outspends other countries when it comes to health care, and the proportion of the gross domestic product consumed by health care keeps getting larger and larger.
Dr. Emanuel served as a special adviser for health policy to the director of the federal Office of Management and Budget in 2009-2011 - during the design, passage, and first steps to implementation of the Patient Protection and Affordable Care Act (commonly known as Obamacare) - and he seemed to address some critics in absentia who have claimed that health care reform will lead to unwanted rationing of care. There's no need to ration, Dr. Emanuel said. Switzerland doesn't ration care, and it spends far less per capita for what is considered quality health care. "We can do a better job in this country of controlling costs without the need to ration care," he said.
The only way to really control costs is to transform the way U.S. health care is delivered, he said. Ten percent of U.S. patients account for 63% of dollars spent on health care. "You know who they are - people with congestive heart failure, COPD, diabetes, adult asthma, coronary artery disease, cancer. People with chronic multiple chronic illnesses. That's where the money's going. That's where the uneven quality is," and that's where health care delivery needs to improve, he said.
Dr. Emanuel proposed six essential components to transforming the health care system. Among them: The focus needs to be on cost according to value, and getting rid of services with no value. The system must focus on patients' needs, not on physicians' schedules or other concerns. And the system must evolve toward clinicians working as teams including allied health professionals, not as individuals. "We are not going to be, going forward, one-sies and two-sies in practice" anymore, he said.
Greater emphasis on delivering health care via organizations and systems, standardization of processes, and transparency around price and quality will be essential, he added.
Transparency in pricing and quality isn't just something consumers will want. Physicians will want it in order to refer patients to quality care and set prices appropriately, Dr. Emanuel argued. "I think this is inevitable, and I think it's going to happen faster than you think," he said.
Most U.S. physicians are stuck in fee-for-service payment systems, which don't provide the incentives needed for change, he said. Doctors "as a group" should push for changes to the payment system, which will increase physician autonomy but also will assign more financial risk to physicians. "I see no way of getting out of that," Dr. Emanuel said.
In his eyes, if doctors don't push for changes in how health care is delivered, we basically can kiss the U.S. economy and future prosperity good-bye. "Doctors are the only people who can re-engineer the delivery system," he said. "If you don't do it, it ain't gonna happen. It's that simple," he said. All previous reform efforts that did not have physician leadership have failed.
"You have to lead this," he explained.
No one should expect that reforming the fifth-largest economy in the world could be accomplished in just a few years, however. "It's going to take this decade," Dr. Emanuel predicted.
Dr. Emanuel reported having no financial disclosures.
Twitter: @sherryboschert

Patient Prediction Model Trims Avoidable Hospital Readmissions
A new prediction model that uses a familiar phrase can help identify potentially avoidable hospital patient readmissions, according to a report in JAMA Internal Medicine.
The retrospective cohort study, "Potentially Avoidable 30-Day Hospital Readmissions in Medical Patients," used a model dubbed HOSPITAL to create a score that targets patients most likely to benefit from pre-discharge interventions. The model is based on seven factors: hemoglobin at discharge, discharge from an oncology service, sodium levels at discharge, procedure during the index admission, index type of admission, number of admissions in the prior 12 months, and length of stay. The HOSPITAL score had fair discriminatory power (C statistic 0.71) and good calibration, the authors noted.
"By definition, these [interventions] are expensive and you really want to reserve them for the patients that are most likely to benefit," says study co-author Jeffrey Schnipper, MD, MPH, FHM, director of clinical research and an associate physician in the general medicine division at Brigham and Women's Hospital in Boston.
The study identified 879 potentially avoidable discharges out of 10,731 eligible discharges, or 8.5%. The estimated potentially avoidable readmission risk was 18%. Dr. Schnipper says that in absolute reduction, the model could cut 2% to 3% of readmissions.
"This is an evolution of sophistication in how we think about this work," Dr. Schnipper adds. "Not all patients have a preventable readmission. Maybe some of those patients are more likely to benefit. The next step is to prove it. That's the gold standard and that’s our next study." TH
Visit our website for more information on 30-day readmissions.
A new prediction model that uses a familiar phrase can help identify potentially avoidable hospital patient readmissions, according to a report in JAMA Internal Medicine.
The retrospective cohort study, "Potentially Avoidable 30-Day Hospital Readmissions in Medical Patients," used a model dubbed HOSPITAL to create a score that targets patients most likely to benefit from pre-discharge interventions. The model is based on seven factors: hemoglobin at discharge, discharge from an oncology service, sodium levels at discharge, procedure during the index admission, index type of admission, number of admissions in the prior 12 months, and length of stay. The HOSPITAL score had fair discriminatory power (C statistic 0.71) and good calibration, the authors noted.
"By definition, these [interventions] are expensive and you really want to reserve them for the patients that are most likely to benefit," says study co-author Jeffrey Schnipper, MD, MPH, FHM, director of clinical research and an associate physician in the general medicine division at Brigham and Women's Hospital in Boston.
The study identified 879 potentially avoidable discharges out of 10,731 eligible discharges, or 8.5%. The estimated potentially avoidable readmission risk was 18%. Dr. Schnipper says that in absolute reduction, the model could cut 2% to 3% of readmissions.
"This is an evolution of sophistication in how we think about this work," Dr. Schnipper adds. "Not all patients have a preventable readmission. Maybe some of those patients are more likely to benefit. The next step is to prove it. That's the gold standard and that’s our next study." TH
Visit our website for more information on 30-day readmissions.
A new prediction model that uses a familiar phrase can help identify potentially avoidable hospital patient readmissions, according to a report in JAMA Internal Medicine.
The retrospective cohort study, "Potentially Avoidable 30-Day Hospital Readmissions in Medical Patients," used a model dubbed HOSPITAL to create a score that targets patients most likely to benefit from pre-discharge interventions. The model is based on seven factors: hemoglobin at discharge, discharge from an oncology service, sodium levels at discharge, procedure during the index admission, index type of admission, number of admissions in the prior 12 months, and length of stay. The HOSPITAL score had fair discriminatory power (C statistic 0.71) and good calibration, the authors noted.
"By definition, these [interventions] are expensive and you really want to reserve them for the patients that are most likely to benefit," says study co-author Jeffrey Schnipper, MD, MPH, FHM, director of clinical research and an associate physician in the general medicine division at Brigham and Women's Hospital in Boston.
The study identified 879 potentially avoidable discharges out of 10,731 eligible discharges, or 8.5%. The estimated potentially avoidable readmission risk was 18%. Dr. Schnipper says that in absolute reduction, the model could cut 2% to 3% of readmissions.
"This is an evolution of sophistication in how we think about this work," Dr. Schnipper adds. "Not all patients have a preventable readmission. Maybe some of those patients are more likely to benefit. The next step is to prove it. That's the gold standard and that’s our next study." TH
Visit our website for more information on 30-day readmissions.
Hospitals Seek Ways to Defuse Angry Doctors
Everyone is prone to an angry outburst from time to time, and doctors are no exception. With well-documented, negative effects on morale, nurse retention, and patient safety, it's safe to say anger issues crop up from time to time among the nearly 40,000 practicing hospitalists throughout the U.S.
A recent article in Kaiser Health News describes efforts by hospitals to deal with physicians' tirades, such as a three-day counseling program developed at Vanderbilt University in Nashville, Tenn.
"All physicians need to be aware that there should be a 'zero tolerance' attitude for disruptive behavior, hospitalists included, and that disruptive behavior undermines a culture of safety, and therefore can put patients in danger," says Danielle Scheurer, MD, MSCR, SFHM, hospitalist and chief quality officer at Medical University of South Carolina in Charleston and physician editor of The Hospitalist.
In 2009, The Joint Commission issued a sentinel alert about intimidating and disruptive behaviors by physicians and the ways in which hospitals can address the issue.
The problem is not unique to any physician specialty, including hospitalists, says Alan Rosenstein, MD, an internist and disruptive behavior researcher based in San Francisco. A physician's training or personality might contribute to angry outbursts, but excessive workloads will cause pressure, stress, and burnout, which can lead to poor behavior.
"Hospitals can no longer afford to look the other way," Dr. Rosenstein says. "I look at physicians as a precious resource. The organizations they're affiliated with need to be more proactive and empathetic, intervening before the problem reaches the stage of requiring discipline through techniques such as coaching and stress management." TH
Visit our website for more information about the impact of workloads on hospitalists.
Everyone is prone to an angry outburst from time to time, and doctors are no exception. With well-documented, negative effects on morale, nurse retention, and patient safety, it's safe to say anger issues crop up from time to time among the nearly 40,000 practicing hospitalists throughout the U.S.
A recent article in Kaiser Health News describes efforts by hospitals to deal with physicians' tirades, such as a three-day counseling program developed at Vanderbilt University in Nashville, Tenn.
"All physicians need to be aware that there should be a 'zero tolerance' attitude for disruptive behavior, hospitalists included, and that disruptive behavior undermines a culture of safety, and therefore can put patients in danger," says Danielle Scheurer, MD, MSCR, SFHM, hospitalist and chief quality officer at Medical University of South Carolina in Charleston and physician editor of The Hospitalist.
In 2009, The Joint Commission issued a sentinel alert about intimidating and disruptive behaviors by physicians and the ways in which hospitals can address the issue.
The problem is not unique to any physician specialty, including hospitalists, says Alan Rosenstein, MD, an internist and disruptive behavior researcher based in San Francisco. A physician's training or personality might contribute to angry outbursts, but excessive workloads will cause pressure, stress, and burnout, which can lead to poor behavior.
"Hospitals can no longer afford to look the other way," Dr. Rosenstein says. "I look at physicians as a precious resource. The organizations they're affiliated with need to be more proactive and empathetic, intervening before the problem reaches the stage of requiring discipline through techniques such as coaching and stress management." TH
Visit our website for more information about the impact of workloads on hospitalists.
Everyone is prone to an angry outburst from time to time, and doctors are no exception. With well-documented, negative effects on morale, nurse retention, and patient safety, it's safe to say anger issues crop up from time to time among the nearly 40,000 practicing hospitalists throughout the U.S.
A recent article in Kaiser Health News describes efforts by hospitals to deal with physicians' tirades, such as a three-day counseling program developed at Vanderbilt University in Nashville, Tenn.
"All physicians need to be aware that there should be a 'zero tolerance' attitude for disruptive behavior, hospitalists included, and that disruptive behavior undermines a culture of safety, and therefore can put patients in danger," says Danielle Scheurer, MD, MSCR, SFHM, hospitalist and chief quality officer at Medical University of South Carolina in Charleston and physician editor of The Hospitalist.
In 2009, The Joint Commission issued a sentinel alert about intimidating and disruptive behaviors by physicians and the ways in which hospitals can address the issue.
The problem is not unique to any physician specialty, including hospitalists, says Alan Rosenstein, MD, an internist and disruptive behavior researcher based in San Francisco. A physician's training or personality might contribute to angry outbursts, but excessive workloads will cause pressure, stress, and burnout, which can lead to poor behavior.
"Hospitals can no longer afford to look the other way," Dr. Rosenstein says. "I look at physicians as a precious resource. The organizations they're affiliated with need to be more proactive and empathetic, intervening before the problem reaches the stage of requiring discipline through techniques such as coaching and stress management." TH
Visit our website for more information about the impact of workloads on hospitalists.
VIDEO: Five Reasons You Should Attend HM13 in Washington, D.C.
Alstonia scholaris
Alstonia scholaris, a tree that grows 50-80 feet high and belongs to the Apocynaceae family, has a long history of use in traditional and homeopathic medicine, including Ayurvedic medicine in India, where it is known as sapthaparna (Integr. Cancer Ther. 2009;8:273-9), in traditional Chinese medicine (J. Ethnopharmacol. 2010;129:293-8; J. Ethnopharmacol. 2010;129:174-81), and in traditional medicine in Africa and Australia (Integr. Cancer Ther. 2010;9:261-9). The bark contains the alkaloids ditamine, echitamine (or ditaine), and echitanines; and decoctions or other preparations of the bark have been used to treat gastrointestinal conditions (Grieve M. A Modern Herbal (Vol. 1). New York, Dover Publications, 1971, p. 29). Often called the devil’s tree, the bark of A. scholaris also has been used to treat malaria, cutaneous diseases, tumors, ulcers, chronic respiratory conditions (such as asthma and bronchitis), helminthiasis, and agalactia (Chin. J. Integr. Med. 2012 Mar 28 [Epub ahead of print]).
In the study of A. scholaris most directly pertinent to potential dermatologic treatment, Lee et al. found that ethanolic bark extracts of A. scholaris significantly suppressed retinoid-induced skin irritation in vitro and in vivo, in human HaCat keratinocytes. The investigators identified echitamine and loganin as the primary components likely responsible for the anti-inflammatory effects.

Data showed that A. scholaris dose-dependently inhibited the all-trans retinoic acid–induced releases of the pro-inflammatory cytokines monocyte chemoattractant protein-1 (MCP-1) and interleukin-8 (IL-8) in vitro. Also in vitro, A. scholaris extract potently suppressed radiation-induced increases in matrix metalloproteinase-1 (MMP-1). Importantly, in a cumulative irritation patch test, the botanical extract diminished retinol-induced skin irritation while enhancing retinoid activity in blocking MMP-1 expression, which is linked closely to cutaneous aging. The authors concluded that A. scholaris appears to have the dual benefits of decreasing irritation associated with retinoids while augmenting their antiaging impact (Evid. Based Complement. Alternat. Med. 2012;2012:190370).
The leaf extract of A. scholaris has been used to treat cold symptoms and tracheitis, and it has been prescribed in hospitals and approved for commercial over-the-counter sale by the State Food and Drugs Administration of China (SFDA) (J. Ethnopharmacol. 2010;129:293-8; J. Ethnopharmacol. 2010;129:174-81). The broad range of biological properties associated with A. scholaris has been ascribed to particular constituent categories, including alkaloids, flavonoids, and terpenoids (specifically, phenolic acids) (Chin. J. Integr. Med. 2012 Mar 28 [Epub ahead of print]). These properties include, but are reportedly not limited to, antioxidant, anticancer, anti-inflammatory, antistress, analgesic, antimutagenic, hepatoprotective, immunomodulatory, and chemopreventive activity (Integr. Cancer Ther. 2010;9:261-9; Chin. J. Integr. Med. 2012 Mar 28 [Epub ahead of print]). Antineoplastic effects have been linked directly to phytochemical constituents including echitamine, alstonine, pleiocarpamine, O-methylmacralstonine, macralstonine, and lupeol (Integr. Cancer Ther. 2010;9:261-9).
In 2006, Jagetia and Baliga investigated the anticancer activity of A. scholaris alkaloid fractions in vitro in cultured human neoplastic cell lines. They also conducted in vivo studies in tumor-bearing mice. The in vitro data in HeLa cells revealed a time-dependent rise in antineoplastic activity after 24 hours of exposure (25 mcg/mL). Further, once-daily administration of A. scholaris (240 mg/kg) to tumor-bearing mice yielded dose-dependent remissions, although there were toxic presentations at this dosage. The next-lower dose of 210 mg/kg was found to be most effective, with 20% of the mice surviving for as long as 120 days after tumor cell inoculation, compared with none of the control animals treated with saline (Phytother. Res. 2006;20:103-9).
Using an acute-restraint stress model in mice in 2009, Kulkarni and Juvekar evaluated the effects of stress and the impact of a methanolic extract of A. scholaris bark. Pretreatments with the extract of 100, 250, and 500 mg/kg for 7 days were found to exert significant antistress effects. In addition, nootropic activities were observed, with memory functions clearly enhanced in learning tasks. A. scholaris also was associated with significant antioxidant properties. The extract at 200 mcg/mL exhibited maximum scavenging of the stable radical 1,1-diphenyl-2-picrylhydrazyl at 90.11% and the nitric oxide radical at 62.77% (Indian J. Exp. Biol. 2009;47:47-52).
Later in 2009, Jahan et al. reported on their investigation of potential antioxidant and chemopreventive activity displayed by A. scholaris in a two-stage murine model. Skin carcinogenesis development was initiated in Swiss albino mice through one application of 7, 12-dimethyabenz(a)anthrecene (DMBA) and then promoted two weeks later by repeated application of croton oil three times per week through 16 weeks. The investigators found a lower incidence of tumors, tumor yield, tumor burden, and number of papillomas in mice treated with A. scholaris extract as compared to untreated controls (Integr. Cancer Ther. 2009;8:273-9).
In 2010, Shang et al. conducted multiple studies using A. scholaris. In the first published report, they assessed the anti-inflammatory and analgesic properties of the ethanolic leaf extract to validate its use in traditional Chinese medicine and modern clinical medicine. The investigators first determined that analgesic activity was conferred as the ethyl acetate and alkaloid fractions significantly diminished acetic acid-induced reactions in mice and, along with the ethanolic extract, reduced xylene-induced ear edema.
The researchers also performed in vivo and in vitro assessments of anti-inflammatory activity again on xylene-induced ear edema and carrageenan-induced air pouch formation in mice, as well as cyclooxygenase (COX)-1, -2 and 5-LOX inhibition.
In the air pouch model, A. scholaris alkaloids were found to have significantly spurred superoxide dismutase activity while lowering nitric oxide, prostaglandin E2, and malondialdehyde levels. In vitro tests, supporting evidence from animal models, showed that the three primary alkaloids isolated from A. scholaris leaves (picrinine, vallesamine, and scholaricine) inhibited the inflammatory mediators COX-1, COX-2, and 5-LOX. The researchers also noted that the in vitro anti-inflammatory assay results reinforced the notion of these alkaloids as the bioactive fraction of the plant (J. Ethnopharmacol. 2010;129:174-81).
In their second published report that year, Shang et al. investigated the antitussive and anti-asthmatic activities of the ethanolic extract, fractions, and chief alkaloids of A. scholaris leaf.
The researchers tested for antitussive effects using ammonia-induced or sulfur dioxide-induced coughing in mice and citric acid-induced coughing in guinea pigs. They evaluated anti-asthmatic activity via histamine-induced bronchoconstriction in guinea pigs. They also measured phenol red volume in murine tracheas to assess expectorant activity.
The data indicated antitussive activity, with significant alkaloid suppression of ammonia-induced coughing frequency in mice. Latency periods of sulfur dioxide-induced cough in mice and citric acid-induced cough in guinea pigs increased, and cough frequency in guinea pigs decreased.
Anti-asthmatic effects, such as suppression of convulsion, were observed in guinea pigs. In the expectorant assessment, tracheal phenol red production was increased. The researchers identified picrinine as the primary alkaloid responsible for these activities (J. Ethnopharmacol. 2010;129:293-8).
In addition, Jahan and Goyal showed that pretreatment with A. scholaris bark extract protected the bone marrow of mice against radiation-induced chromosomal damage and micronuclei induction (J Environ. Pathol. Toxicol. Oncol. 2010;29:101-11).
Conclusion
Despite the dearth of research on A. scholaris, the existing data are intriguing, particularly the findings that A. scholaris may have the capacity to amplify the anti-aging activity of retinoids while blunting their irritating effects. Although more research is needed to determine the dermatologic value of A. scholaris, the pursuit may potentially prove fruitful.
Dr. Baumann is in private practice in Miami Beach. She did not disclose any conflicts of interest. To respond to this column, or to suggest topics for future columns, write to her at [email protected].
Alstonia scholaris, a tree that grows 50-80 feet high and belongs to the Apocynaceae family, has a long history of use in traditional and homeopathic medicine, including Ayurvedic medicine in India, where it is known as sapthaparna (Integr. Cancer Ther. 2009;8:273-9), in traditional Chinese medicine (J. Ethnopharmacol. 2010;129:293-8; J. Ethnopharmacol. 2010;129:174-81), and in traditional medicine in Africa and Australia (Integr. Cancer Ther. 2010;9:261-9). The bark contains the alkaloids ditamine, echitamine (or ditaine), and echitanines; and decoctions or other preparations of the bark have been used to treat gastrointestinal conditions (Grieve M. A Modern Herbal (Vol. 1). New York, Dover Publications, 1971, p. 29). Often called the devil’s tree, the bark of A. scholaris also has been used to treat malaria, cutaneous diseases, tumors, ulcers, chronic respiratory conditions (such as asthma and bronchitis), helminthiasis, and agalactia (Chin. J. Integr. Med. 2012 Mar 28 [Epub ahead of print]).
In the study of A. scholaris most directly pertinent to potential dermatologic treatment, Lee et al. found that ethanolic bark extracts of A. scholaris significantly suppressed retinoid-induced skin irritation in vitro and in vivo, in human HaCat keratinocytes. The investigators identified echitamine and loganin as the primary components likely responsible for the anti-inflammatory effects.
Data showed that A. scholaris dose-dependently inhibited the all-trans retinoic acid–induced releases of the pro-inflammatory cytokines monocyte chemoattractant protein-1 (MCP-1) and interleukin-8 (IL-8) in vitro. Also in vitro, A. scholaris extract potently suppressed radiation-induced increases in matrix metalloproteinase-1 (MMP-1). Importantly, in a cumulative irritation patch test, the botanical extract diminished retinol-induced skin irritation while enhancing retinoid activity in blocking MMP-1 expression, which is linked closely to cutaneous aging. The authors concluded that A. scholaris appears to have the dual benefits of decreasing irritation associated with retinoids while augmenting their antiaging impact (Evid. Based Complement. Alternat. Med. 2012;2012:190370).
The leaf extract of A. scholaris has been used to treat cold symptoms and tracheitis, and it has been prescribed in hospitals and approved for commercial over-the-counter sale by the State Food and Drugs Administration of China (SFDA) (J. Ethnopharmacol. 2010;129:293-8; J. Ethnopharmacol. 2010;129:174-81). The broad range of biological properties associated with A. scholaris has been ascribed to particular constituent categories, including alkaloids, flavonoids, and terpenoids (specifically, phenolic acids) (Chin. J. Integr. Med. 2012 Mar 28 [Epub ahead of print]). These properties include, but are reportedly not limited to, antioxidant, anticancer, anti-inflammatory, antistress, analgesic, antimutagenic, hepatoprotective, immunomodulatory, and chemopreventive activity (Integr. Cancer Ther. 2010;9:261-9; Chin. J. Integr. Med. 2012 Mar 28 [Epub ahead of print]). Antineoplastic effects have been linked directly to phytochemical constituents including echitamine, alstonine, pleiocarpamine, O-methylmacralstonine, macralstonine, and lupeol (Integr. Cancer Ther. 2010;9:261-9).
In 2006, Jagetia and Baliga investigated the anticancer activity of A. scholaris alkaloid fractions in vitro in cultured human neoplastic cell lines. They also conducted in vivo studies in tumor-bearing mice. The in vitro data in HeLa cells revealed a time-dependent rise in antineoplastic activity after 24 hours of exposure (25 mcg/mL). Further, once-daily administration of A. scholaris (240 mg/kg) to tumor-bearing mice yielded dose-dependent remissions, although there were toxic presentations at this dosage. The next-lower dose of 210 mg/kg was found to be most effective, with 20% of the mice surviving for as long as 120 days after tumor cell inoculation, compared with none of the control animals treated with saline (Phytother. Res. 2006;20:103-9).
Using an acute-restraint stress model in mice in 2009, Kulkarni and Juvekar evaluated the effects of stress and the impact of a methanolic extract of A. scholaris bark. Pretreatments with the extract of 100, 250, and 500 mg/kg for 7 days were found to exert significant antistress effects. In addition, nootropic activities were observed, with memory functions clearly enhanced in learning tasks. A. scholaris also was associated with significant antioxidant properties. The extract at 200 mcg/mL exhibited maximum scavenging of the stable radical 1,1-diphenyl-2-picrylhydrazyl at 90.11% and the nitric oxide radical at 62.77% (Indian J. Exp. Biol. 2009;47:47-52).
Later in 2009, Jahan et al. reported on their investigation of potential antioxidant and chemopreventive activity displayed by A. scholaris in a two-stage murine model. Skin carcinogenesis development was initiated in Swiss albino mice through one application of 7, 12-dimethyabenz(a)anthrecene (DMBA) and then promoted two weeks later by repeated application of croton oil three times per week through 16 weeks. The investigators found a lower incidence of tumors, tumor yield, tumor burden, and number of papillomas in mice treated with A. scholaris extract as compared to untreated controls (Integr. Cancer Ther. 2009;8:273-9).
In 2010, Shang et al. conducted multiple studies using A. scholaris. In the first published report, they assessed the anti-inflammatory and analgesic properties of the ethanolic leaf extract to validate its use in traditional Chinese medicine and modern clinical medicine. The investigators first determined that analgesic activity was conferred as the ethyl acetate and alkaloid fractions significantly diminished acetic acid-induced reactions in mice and, along with the ethanolic extract, reduced xylene-induced ear edema.
The researchers also performed in vivo and in vitro assessments of anti-inflammatory activity again on xylene-induced ear edema and carrageenan-induced air pouch formation in mice, as well as cyclooxygenase (COX)-1, -2 and 5-LOX inhibition.
In the air pouch model, A. scholaris alkaloids were found to have significantly spurred superoxide dismutase activity while lowering nitric oxide, prostaglandin E2, and malondialdehyde levels. In vitro tests, supporting evidence from animal models, showed that the three primary alkaloids isolated from A. scholaris leaves (picrinine, vallesamine, and scholaricine) inhibited the inflammatory mediators COX-1, COX-2, and 5-LOX. The researchers also noted that the in vitro anti-inflammatory assay results reinforced the notion of these alkaloids as the bioactive fraction of the plant (J. Ethnopharmacol. 2010;129:174-81).
In their second published report that year, Shang et al. investigated the antitussive and anti-asthmatic activities of the ethanolic extract, fractions, and chief alkaloids of A. scholaris leaf.
The researchers tested for antitussive effects using ammonia-induced or sulfur dioxide-induced coughing in mice and citric acid-induced coughing in guinea pigs. They evaluated anti-asthmatic activity via histamine-induced bronchoconstriction in guinea pigs. They also measured phenol red volume in murine tracheas to assess expectorant activity.
The data indicated antitussive activity, with significant alkaloid suppression of ammonia-induced coughing frequency in mice. Latency periods of sulfur dioxide-induced cough in mice and citric acid-induced cough in guinea pigs increased, and cough frequency in guinea pigs decreased.
Anti-asthmatic effects, such as suppression of convulsion, were observed in guinea pigs. In the expectorant assessment, tracheal phenol red production was increased. The researchers identified picrinine as the primary alkaloid responsible for these activities (J. Ethnopharmacol. 2010;129:293-8).
In addition, Jahan and Goyal showed that pretreatment with A. scholaris bark extract protected the bone marrow of mice against radiation-induced chromosomal damage and micronuclei induction (J Environ. Pathol. Toxicol. Oncol. 2010;29:101-11).
Conclusion
Despite the dearth of research on A. scholaris, the existing data are intriguing, particularly the findings that A. scholaris may have the capacity to amplify the anti-aging activity of retinoids while blunting their irritating effects. Although more research is needed to determine the dermatologic value of A. scholaris, the pursuit may potentially prove fruitful.
Dr. Baumann is in private practice in Miami Beach. She did not disclose any conflicts of interest. To respond to this column, or to suggest topics for future columns, write to her at [email protected].
Alstonia scholaris, a tree that grows 50-80 feet high and belongs to the Apocynaceae family, has a long history of use in traditional and homeopathic medicine, including Ayurvedic medicine in India, where it is known as sapthaparna (Integr. Cancer Ther. 2009;8:273-9), in traditional Chinese medicine (J. Ethnopharmacol. 2010;129:293-8; J. Ethnopharmacol. 2010;129:174-81), and in traditional medicine in Africa and Australia (Integr. Cancer Ther. 2010;9:261-9). The bark contains the alkaloids ditamine, echitamine (or ditaine), and echitanines; and decoctions or other preparations of the bark have been used to treat gastrointestinal conditions (Grieve M. A Modern Herbal (Vol. 1). New York, Dover Publications, 1971, p. 29). Often called the devil’s tree, the bark of A. scholaris also has been used to treat malaria, cutaneous diseases, tumors, ulcers, chronic respiratory conditions (such as asthma and bronchitis), helminthiasis, and agalactia (Chin. J. Integr. Med. 2012 Mar 28 [Epub ahead of print]).
In the study of A. scholaris most directly pertinent to potential dermatologic treatment, Lee et al. found that ethanolic bark extracts of A. scholaris significantly suppressed retinoid-induced skin irritation in vitro and in vivo, in human HaCat keratinocytes. The investigators identified echitamine and loganin as the primary components likely responsible for the anti-inflammatory effects.
Data showed that A. scholaris dose-dependently inhibited the all-trans retinoic acid–induced releases of the pro-inflammatory cytokines monocyte chemoattractant protein-1 (MCP-1) and interleukin-8 (IL-8) in vitro. Also in vitro, A. scholaris extract potently suppressed radiation-induced increases in matrix metalloproteinase-1 (MMP-1). Importantly, in a cumulative irritation patch test, the botanical extract diminished retinol-induced skin irritation while enhancing retinoid activity in blocking MMP-1 expression, which is linked closely to cutaneous aging. The authors concluded that A. scholaris appears to have the dual benefits of decreasing irritation associated with retinoids while augmenting their antiaging impact (Evid. Based Complement. Alternat. Med. 2012;2012:190370).
The leaf extract of A. scholaris has been used to treat cold symptoms and tracheitis, and it has been prescribed in hospitals and approved for commercial over-the-counter sale by the State Food and Drugs Administration of China (SFDA) (J. Ethnopharmacol. 2010;129:293-8; J. Ethnopharmacol. 2010;129:174-81). The broad range of biological properties associated with A. scholaris has been ascribed to particular constituent categories, including alkaloids, flavonoids, and terpenoids (specifically, phenolic acids) (Chin. J. Integr. Med. 2012 Mar 28 [Epub ahead of print]). These properties include, but are reportedly not limited to, antioxidant, anticancer, anti-inflammatory, antistress, analgesic, antimutagenic, hepatoprotective, immunomodulatory, and chemopreventive activity (Integr. Cancer Ther. 2010;9:261-9; Chin. J. Integr. Med. 2012 Mar 28 [Epub ahead of print]). Antineoplastic effects have been linked directly to phytochemical constituents including echitamine, alstonine, pleiocarpamine, O-methylmacralstonine, macralstonine, and lupeol (Integr. Cancer Ther. 2010;9:261-9).
In 2006, Jagetia and Baliga investigated the anticancer activity of A. scholaris alkaloid fractions in vitro in cultured human neoplastic cell lines. They also conducted in vivo studies in tumor-bearing mice. The in vitro data in HeLa cells revealed a time-dependent rise in antineoplastic activity after 24 hours of exposure (25 mcg/mL). Further, once-daily administration of A. scholaris (240 mg/kg) to tumor-bearing mice yielded dose-dependent remissions, although there were toxic presentations at this dosage. The next-lower dose of 210 mg/kg was found to be most effective, with 20% of the mice surviving for as long as 120 days after tumor cell inoculation, compared with none of the control animals treated with saline (Phytother. Res. 2006;20:103-9).
Using an acute-restraint stress model in mice in 2009, Kulkarni and Juvekar evaluated the effects of stress and the impact of a methanolic extract of A. scholaris bark. Pretreatments with the extract of 100, 250, and 500 mg/kg for 7 days were found to exert significant antistress effects. In addition, nootropic activities were observed, with memory functions clearly enhanced in learning tasks. A. scholaris also was associated with significant antioxidant properties. The extract at 200 mcg/mL exhibited maximum scavenging of the stable radical 1,1-diphenyl-2-picrylhydrazyl at 90.11% and the nitric oxide radical at 62.77% (Indian J. Exp. Biol. 2009;47:47-52).
Later in 2009, Jahan et al. reported on their investigation of potential antioxidant and chemopreventive activity displayed by A. scholaris in a two-stage murine model. Skin carcinogenesis development was initiated in Swiss albino mice through one application of 7, 12-dimethyabenz(a)anthrecene (DMBA) and then promoted two weeks later by repeated application of croton oil three times per week through 16 weeks. The investigators found a lower incidence of tumors, tumor yield, tumor burden, and number of papillomas in mice treated with A. scholaris extract as compared to untreated controls (Integr. Cancer Ther. 2009;8:273-9).
In 2010, Shang et al. conducted multiple studies using A. scholaris. In the first published report, they assessed the anti-inflammatory and analgesic properties of the ethanolic leaf extract to validate its use in traditional Chinese medicine and modern clinical medicine. The investigators first determined that analgesic activity was conferred as the ethyl acetate and alkaloid fractions significantly diminished acetic acid-induced reactions in mice and, along with the ethanolic extract, reduced xylene-induced ear edema.
The researchers also performed in vivo and in vitro assessments of anti-inflammatory activity again on xylene-induced ear edema and carrageenan-induced air pouch formation in mice, as well as cyclooxygenase (COX)-1, -2 and 5-LOX inhibition.
In the air pouch model, A. scholaris alkaloids were found to have significantly spurred superoxide dismutase activity while lowering nitric oxide, prostaglandin E2, and malondialdehyde levels. In vitro tests, supporting evidence from animal models, showed that the three primary alkaloids isolated from A. scholaris leaves (picrinine, vallesamine, and scholaricine) inhibited the inflammatory mediators COX-1, COX-2, and 5-LOX. The researchers also noted that the in vitro anti-inflammatory assay results reinforced the notion of these alkaloids as the bioactive fraction of the plant (J. Ethnopharmacol. 2010;129:174-81).
In their second published report that year, Shang et al. investigated the antitussive and anti-asthmatic activities of the ethanolic extract, fractions, and chief alkaloids of A. scholaris leaf.
The researchers tested for antitussive effects using ammonia-induced or sulfur dioxide-induced coughing in mice and citric acid-induced coughing in guinea pigs. They evaluated anti-asthmatic activity via histamine-induced bronchoconstriction in guinea pigs. They also measured phenol red volume in murine tracheas to assess expectorant activity.
The data indicated antitussive activity, with significant alkaloid suppression of ammonia-induced coughing frequency in mice. Latency periods of sulfur dioxide-induced cough in mice and citric acid-induced cough in guinea pigs increased, and cough frequency in guinea pigs decreased.
Anti-asthmatic effects, such as suppression of convulsion, were observed in guinea pigs. In the expectorant assessment, tracheal phenol red production was increased. The researchers identified picrinine as the primary alkaloid responsible for these activities (J. Ethnopharmacol. 2010;129:293-8).
In addition, Jahan and Goyal showed that pretreatment with A. scholaris bark extract protected the bone marrow of mice against radiation-induced chromosomal damage and micronuclei induction (J Environ. Pathol. Toxicol. Oncol. 2010;29:101-11).
Conclusion
Despite the dearth of research on A. scholaris, the existing data are intriguing, particularly the findings that A. scholaris may have the capacity to amplify the anti-aging activity of retinoids while blunting their irritating effects. Although more research is needed to determine the dermatologic value of A. scholaris, the pursuit may potentially prove fruitful.
Dr. Baumann is in private practice in Miami Beach. She did not disclose any conflicts of interest. To respond to this column, or to suggest topics for future columns, write to her at [email protected].