User login
Duloxetine reduces chemo-induced neuropathy
A 5-week course of daily oral duloxetine reduced pain and improved function and quality of life for patients with chemotherapy-induced peripheral neuropathy, according to a report in the April 3 issue of JAMA.
Duloxetine’s effects on chemotherapy-induced peripheral neuropathic pain were measured in a randomized, double-blind, placebo-controlled, crossover clinical trial involving 231 cancer patients aged 25 years and older who had been treated with platinum or taxane agents. Study subjects were approximately twice as likely to experience a 30% reduction in pain while taking duloxetine than while taking placebo and were 2.4 times more likely to experience a 50% reduction in pain, said Ellen M. Lavoie Smith, Ph.D., of the University of Michigan School of Nursing, Ann Arbor, and her associates. The data were presented at the 2012 annual meeting of the American Society of Clinical Oncology.
Patients also reported better daily functioning with duloxetine, compared with placebo, including improved scores on measures assessing numbness, tingling, or discomfort of the hands or feet; tinnitus or difficulty hearing; joint pain; muscle cramps and weakness; and difficulty walking, dressing, or feeling small objects in the hands. Pain-related quality of life also improved to a greater degree with duloxetine (mean change of 2.44 points out of 44 possible points on the Functional Assessment of Cancer Treatment, Gynecologic Oncology Group Neurotoxicity subscale) than with placebo (mean change of 0.87 points).
There were no hematologic or grade 4 adverse events. Mild adverse events were reported by 16% during duloxetine treatment and 27% during placebo treatment, and moderate adverse effects were reported by 7% and 3%, respectively. These included fatigue, insomnia, and nausea in both patient groups, the investigators said (JAMA 2013;309:1359-67).
This study was supported by the National Cancer Institute and the Alliance Statistics and Data Center. Study drugs and placebo were supplied by Eli Lilly. Dr. Smith reported no conflicts of interest, and one of her associates reported ties to Genentech.
FROM JAMA
Major finding: Study subjects were 2.4 times more likely to experience a 50% pain reduction while taking duloxetine than while taking placebo.
Data source: A randomized, double-blind, placebo-controlled crossover trial involving 231 cancer patients.
Disclosures: This study was supported by the National Cancer Institute and the Alliance Statistics and Data Center. Study drugs and placebo were supplied by Eli Lilly. Dr. Smith reported no conflicts of interest, and one of her associates reported ties to Genentech.
How to avoid opioid misuse
Opioids have become the standard of care for numerous chronic pain complaints and are the most misused drugs in the United States.1 The result: A public health issue with challenges for patients with pain, clinicians treating pain, and the broader community. (See “Opioid analgesic misuse: Scope of the problem,” below1-7).
Ultimately, clinicians are faced with trying to provide adequate pain relief while predicting which patients are at risk for misuse. An expert panel commissioned by the American Pain Society and American Academy of Pain Medicine (APS/AAPM) reviewed the evidence and issued clinical guidelines for long-term opioid therapy in chronic noncancer pain.8 Using the APS/AAPM framework, this article discusses how to:
-
identify the risk of problem use in the individual patient
-
monitor opioid therapy to ensure safe prescribing
-
determine when to terminate opioid therapy in cases of opioid misuse.
| OPIOID ANALGESIC MISUSE: SCOPE OF THE PROBLEM Americans consume an estimated 80% of the global supply of prescription opioids.2 From 1997 to 2007, average sales of opioid analgesics per person increased 402%.3 Because opioid analgesics are increasingly available in the community,4 the prevalence of opioid misuse has followed suit. Opioid analgesics have become the most misused drug class in the United States—second only to marijuana among all illicit substances.1 Nonmedical users of opioid analgesics numbered 4.5 million in 2011, and 1.8 million opioid analgesic users met diagnostic criteria for dependence or abuse.1 In 2007, the costs to society of opioid analgesic abuse were estimated at $25.6 billion due to lost productivity, $25.9 billion due to health care costs, and $5.1 billion due to criminal justice costs, totaling $55.7 billion.5 Regardless of whether opioid analgesics are obtained by prescription or diversion (sharing medication, stolen, or purchased illegally), their misuse in all its forms is a significant public health problem. Opioid analgesic–related emergency department visits increased 111% from 2004 to 2008, to a total of 305,900 visits.6 Deaths involving opioid analgesics, including intentional and unintentional overdoses, quadrupled from 1999 to 2008.7 Additionally, from 1999 to 2009, national admission rates for treatment of an opioid analgesic–related substance use disorder increased nearly sixfold.7 |
Before treatment: Determine misuse risk
Despite their widespread use, long-term opioid analgesics are not recommended as first-choice therapy.8 Evidence supporting long-term efficacy is limited, and studies indicate modest clinical effectiveness.9 Concerns also are emerging about the safety of long-term opioid use, including iatrogenic opioid-related substance use disorders. Even categorizing opioid misuse is difficult because consensus is lacking on misuse terminology (TABLE 1).8,10-12
On the other hand, many patients with chronic pain do benefit from opioid analgesics, and most who are prescribed long-term opioid therapy do not misuse their medications. The use of opioid analgesics for chronic pain presents an opportunity for misuse in a subset of susceptible people.
| Key Point The use of opioid analgesics for chronic pain presents an opportunity for misuse in a subset of susceptible people. |
TABLE 1
Glossary of of opioid use terminology
| DSM, Diagnostic and Statistical Manual of Mental Disorders. |
| Aberrant drug-related behavior Opioid-related behavior that demonstrates nonadherence to the patient-clinician agreed-upon therapeutic plan8 |
| Misuse Use of an opioid in a manner other than how it is prescribed10,11 |
Abuse Illicit opioid use that is detrimental to the user or others10 Nonmedical use of an opioid for the purpose of attaining a “high”11 A DSM-IV-TR substance use disorder diagnosis, evidenced by a maladaptive pattern of opioid use, leading to clinically significant impairment or distress as manifested by ≥1 of the following criteria in a 12-month period:
|
Dependence A DSM-IV-TR substance use disorder diagnosis, evidenced by a maladaptive pattern of opioid use, leading to clinically significant impairment or distress as manifested by ≥3 of the following criteria in a 12-month period:
|
Risk factors thought to increase susceptibility include younger age, more severe pain intensity, multiple pain complaints, history of a substance use disorder, and history of a psychiatric disorder.2 Identifying individuals with potential for misuse is difficult, however, and clinicians’ attempts are not necessarily accurate.13
Screening tools. The APS/AAPM guidelines recommend empirically derived screening questionnaires (TABLE 2)8 to help you identify misuse potential before initiating opioid therapy. Instruments also are available to monitor misuse for individuals already in treatment. The Screener and Opioid Assessment for Patients with Pain (SOAPP) appears to be the most predictive of misuse potential, although selecting a screening instrument may depend on particular practice needs.14 These tools are most valuable when used within a comprehensive evaluation that includes the clinical interview with history and pain assessment.
TABLE 2
Questionnaires for screening and opioid misuse risk identification8
| Risk assessment tools | |
| Screener and Opioid Assessment for Patients with Pain (SOAPP) http://www.painedu.org/soapp.asp | Predicts how much monitoring a patient will need on long-term opioid therapy |
| Opioid Risk Tool (ORT) http://www.partnersagainstpain.com/printouts/ Opioid_Risk_Tool.pdf | Assesses for known conditions that indicate higher risk for medication misuse, including history of substance abuse, age, history of sexual abuse, and psychiatric disorders |
| Diagnosis, Intractability, Risk, Efficacy (DIRE) http://www.google.com/url?sa=t&rct=j&q=&esrc=s&source=web&cd=5& ved=0CEgQFjAE&url=http%3A%2F%2Fwww.fmdrl.org%2Findex.cfm%3Fevent%3Dc .getAttachment%26riid%3D6613&ei=vJ7lULDHFqKc2AWCiIGwAQ&usg=AFQjCNECSYFnam9UATA-Xm_JQ0cjm6Xdiw& bvm=bv.1355534169,d.b2I | Assigns the patient a score of 1 to 3 for each of 4 factors: diagnosis, intractability, risk (psychological, chemical health, reliability, social support), and efficacy |
| Monitoring tools during long-term opioid therapy | |
| Pain Assessment and Documentation Tool (PADT) http://www.ucdenver.edu/academics/colleges/PublicHealth/research/centers/maperc/online/Documents/Pain Assessment Documentation Tool %28PADT%29.pdf | Assesses pain relief, daily functioning, and opioid-related adverse events; also whether patient appears to be engaging in potential aberrant drug-related behaviors |
| Current Opioid Misuse Measure (COMM) http://www.painedu.org/soapp.asp | Assists in identifying patients exhibiting aberrant drug-related behaviors |
When you identify someone at high risk of opioid misuse, proceed carefully using multiple sources of clinical information. Balance appropriate pain care with safeguarding against misuse. In the absence of evidence of current misuse, the decision depends on clinical judgment. You might try alternative pain treatments to avoid opioid exposure or consider opioid analgesics with additional monitoring of prescribing (TABLE 3).8
TABLE 3
Practical strategies for addressing opioid misuse8
Before treatment
|
During treatment
|
When things go wrong
|
Managing risk during treatment
Opioid trial. The APS/AAPM panel8 and the World Health Organization analgesic ladder for treating cancer pain15 recommend an opioid trial before long-term opioids are prescribed. This approach assumes that opioid therapy may not be universally effective and appropriate for all patients and all pain complaints for which opioids are indicated.
By agreeing to an evaluation period, such as 30 days, you and your patient understand that opioid treatment may not continue beyond the trial without an accompanying treatment response. Whereas you may tailor specific outcomes to the individual, a successful response should include:
-
reduced pain
-
increased function (such as return to work or other valued activities)
-
and improved quality of life.
If the agreed-upon outcomes are not met, consider discontinuing the opioid trial and trying alternative treatments. Full discussion of the well-documented strategies for managing opioid therapy is beyond the scope of this article. (See other sources for information about strategies such as opioid rotation, which involves switching from one opioid to another in an effort to increase therapeutic benefit or reduce harm.16,17 )
Monitoring aids. In addition to screening and monitoring questionnaires, urine drug screens and prescription monitoring programs (PMPs) can help you objectively monitor for aberrant drug-related behaviors that may indicate misuse.
Urine drug screens can identify substance abuse or dependence and potential problems you might not have detected.2 When used appropriately, urine drug screens can provide useful information about an individual’s substance abuse potential (such as a positive test for an illicit substance). The absence of a prescribed opioid may be as significant as a positive finding because this may suggest compliance issues or diversion.
Prescription monitoring programs have been established by most states since 2002 through grants from the Department of Justice. PMPs store prescription drug information from pharmacies in a statewide database and develop algorithms that can detect behaviors suggesting opioid misuse.18 For example, an algorithm may track factors such as having 5 or more prescribers, 3 or more pharmacies, or 3 or more early refills within 1 year.19
Individual states administer PMPs differently, but prescribers generally can request information to monitor individual patients and detect illicit behaviors. Although relatively new, PMPs have been shown to reduce prescription sales,20 doctor shopping,19 and opioid analgesic misuse.21 A comprehensive list of state PMPs is available from the Alliance of States with Prescription Monitoring Programs (www.pmpalliance.org/content/pmp-access).
| Key Point Although relatively new, prescription monitoring programs have been shown to reduce doctor shopping and opioid analgesic misuse. |
Responding to evidence of aberrant behavior
Even when you follow recommended opioid risk mitigation strategies, expect some individuals to show aberrant drug-taking behavior, abuse, or even the emergence of a co-occurring substance use disorder. Although evidence is limited regarding best practices in these circumstances, terminating opioid treatment is not necessarily the only option.8
Should you identify aberrant drug-related behaviors or any form of opioid analgesic misuse, evaluate the patient to determine the circumstances and immediately address the behavior. For example, using more medication than prescribed may be a sign of inadequately managed pain or clinical status, rather than an indication of abuse.
Referrals may be beneficial as part of your evaluation process. A pain specialist may offer alternative treatment approaches to mitigate medication overuse. An addiction specialist can evaluate patient safety for continued treatment with opioids, facilitate referrals for treatment of a substance use disorder, and provide consultation if discontinuing opioid therapy is appropriate.
Intervention. The patient’s pain complaint will persist whether or not you continue opioids, and substance abuse treatment may complement pain management. Even for an individual who continues opioid therapy, substance abuse treatment can provide tools for understanding and managing substance misuse. For instance, a cognitive-behavioral training program helped curb misuse and increase adherence in high-risk patients on opioid therapy for chronic back pain.22
Providing specialized care before you consider terminating opioid therapy allows people to address their reasons for misusing. Integrated treatment by a clinician specializing in co-occurring chronic pain and addiction may be particularly beneficial, as pain is an important motivator of individuals seeking treatment for an opioid use disorder.23
Termination. If, after additional resources and referral, an individual fails to make progress toward the therapeutic goal, you may need to terminate long-term opioid therapy. By making this decision, you may prevent the emergence of an opioid use disorder. Even so, telling someone that you are stopping opioid treatment can be a difficult discussion. The National Institute on Drug Abuse provides a wealth of online resources to assist with these and other opioid misuse conversations.24,25
Opioid detoxification is complex and should be managed and monitored to mitigate opioid withdrawal symptoms. Unfortunately, very little clinical guidance exists on effective opioid taper strategies for chronic pain patients. Consultation with an addiction specialist is recommended to assist with discontinuing treatment.
Future directions: A role for buprenorphine?
The introduction of transdermal buprenorphine in the United States in 2001 spurred new interest in this medication for treating moderate to severe chronic pain.26 Buprenorphine’s reported lower abuse potential may differentiate it from other opioid analgesics.27 Although a 2006 report showed evidence of modest diversion and abuse of buprenorphine,28 survey data and human laboratory studies demonstrate consistently that the abuse potential is lower—particularly with the combined buprenorphine/naloxone formulation—than with other opioids.29
Sublingual buprenorphine formulations, with and without naloxone, are FDA approved for opioid use disorder and opioid dependence, but not for pain. Thus, it is a medication with analgesic properties that is approved for an opioid use disorder. Some preliminary evidence supports off-label use of sublingual buprenorphine for chronic pain,30 but more research is needed before this approach can be recommended.
Additional clinical studies are examining whether the sublingual formulation’s efficacy for pain is comparable to other buprenorphine formulations. If this is supported, buprenorphine may become an appropriate, safer option for patients at risk of misusing who might benefit from continued opioid therapy.
| Key Point Some preliminary evidence supports off-label use of sublingual buprenorphine for chronic pain, but more research is needed. |
Maintaining a rational, evidence-based approach
Opioid analgesic misuse is a serious public health problem. It would be unfortunate, however, if clinicians were to avoid medically appropriate opioid prescribing for people with chronic pain. Rational, evidence-based strategies to mitigate opioid misuse are the appropriate goal, accompanied by efforts to improve chronic pain treatment with and without opioids. To provide safe and effective opioid therapy, we urge you to develop a proactive approach informed by clinical guidelines, clinical experience, and the scientific literature.
| Key Point While opioid analgesic misuse is a serious problem, it would be unfortunate if clinicians avoided prescribing opioids for people in chronic pain. |
| Disclosure Dr. Potter receives grant support from the National Institute on Drug Abuse K23 DA02297 (Potter) and U10 DA020024 (Trivedi) and serves as a consultant to Observant LLC. Ms. Marino reported no potential conflict of interest relevant to this article. |
References
- Results from the 2011 National Survey on Drug Use and Health: summary of national findings. Rockville, MD: Substance Abuse and Mental Health Services Administration, 2012. Available at: http://www.samhsa.gov/data/NSDUH.aspx. Accessed December 26, 2012.
- Sehgal N, Manchikanti L, Smith HS. Prescription opioid abuse in chronic pain: a review of opioid abuse predictors and strategies to curb opioid abuse. Pain Physician. 2012;15(3 suppl):ES67–E92.
- Manchikanti L, Fellows B, Ailinani H, et al. Therapeutic use, abuse, and nonmedical use of opioids: a ten-year perspective. Pain Physician. 2010;13:401–435.
- Boudreau D, Von Korff M, Rutter CM, et al. Trends in long-term opioid therapy for chronic non-cancer pain. Pharmacoepidemiol Drug Saf. 2009;18:1166–1175.
- Birnbaum HG, White AG, Schiller M, et al. Societal costs of prescription opioid abuse, dependence, and misuse in the United States. Pain Med. 2011;12:657–667.
- Centers for Disease Control and Prevention. Emergency department visits involving nonmedical use of selected prescription drugs - United States, 2004-2008. MMWR Morb Mortal Wkly Rep. 2010;59:705–734.
- Centers for Disease Control and Prevention. Overdoses of prescription opioid pain relievers - United States, 1999-2008. MMWR Morb Mortal Wkly Rep. 2011;60:1487–1492.
- Chou R, Fanciullo GJ, Fine PG, et al. Clinical guidelines for the use of chronic opioid therapy in chronic noncancer pain. J Pain. 2009;10:113–130.
- Martell BA, O’Connor PG, Kerns RD, et al. Systematic review: opioid treatment for chronic back pain: prevalence, efficacy, and association with addiction. Ann Intern Med. 2007;146:116–127.
- Butler SF, Budman SH, Fernandez KC, et al. Development and validation of the Current Opioid Misuse Measure. Pain. 2007;130:144–156.
- Katz NP, Adams EH, Chilcoat H, et al. Challenges in the development of prescription opioid abuse-deterrent formulations. Clin J Pain. 2007;23:648–660.
- Diagnostic and Statistical Manual of Mental Disorders, 4th ed., text rev. Washington, DC: American Psychiatric Association, 2000.
- Katz N, Fanciullo GJ. Role of urine toxicology testing in the management of chronic opioid therapy. Clin J Pain. 2002;18(4 suppl):S76–S82.
- Moore TM, Jones T, Browder JH, et al. A comparison of common screening methods for predicting aberrant drug-related behavior among patients receiving opioids for chronic pain management. Pain Med. 2009;10:1426–1433.
- World Health Organization. Cancer: WHO’s pain ladder. Available at: http://www.who.int/cancer/palliative/painladder/en. Accessed December 26, 2012.
- Fine PG, Portenoy RK. Establishing “best practices” for opioid rotation: conclusions of an expert panel. J Pain Symptom Manage. 2009;38:418–425.
- Ballantyne JC, Mao J. Opioid therapy for chronic pain. N Engl J Med. 2003;349:1943–1953.
- Worley J. Prescription drug monitoring programs, a response to doctor shopping: purpose, effectiveness, and directions for future research. Issues Ment Health Nurs. 2012;33:319–328.
- Katz N, Panas L, Kim M, et al. Usefulness of prescription monitoring programs for surveillance—analysis of Schedule II opioid prescription data in Massachusetts, 1996-2006. Pharmacoepidemiol Drug Saf. 2010;19:115–123.
- Simeone R, Holland L. An evaluation of prescription monitoring programs, September 1, 2006. Available at: https://www.bja.gov/publications/pdmpexecsumm.pdf. Accessed December 26, 2012.
- Wang J, Christo PJ. The influence of prescription monitoring programs on chronic pain management. Pain Physician. 2009;12:507–515.
- Jamison RN, Ross EL, Michna E, et al. Substance misuse treatment for high-risk chronic pain patients on opioid therapy: a randomized trial. Pain. 2010;150:390–400.
- Potter JS. Co-occurring chronic pain and opioid addiction: is there a role for integrated treatment? Honolulu, HI: American Psychiatric Association Annual Meeting, 2011.
- National Institute on Drug Abuse. Talking to patients about sensitive topics: communication and screening techniques for increasing the reliability of patient self-report. Available at: http://www.drugabuse.gov/nidamed/centers-excellence/resources/talking-to-patients-about-sensitive-topics-communication-screening-techniques-increasing. Accessed January 10, 2013.
- National Institute on Drug Abuse. Managing pain patients who abuse prescription drugs. Available at: http://www.drugabuse.gov/nidamed/etools/managing-pain-patients-who-abuse-prescription-drugs. Accessed January 10, 2013.
- Pergolizzi J, Aloisi AM, Dahan A, et al. Current knowledge of buprenorphine and its unique pharmacological profile. Pain Pract. 2010;10:428–450.
- Park HS, Lee HY, Kim YH, et al. A highly selective kappa-opioid receptor agonist with low addictive potential and dependence liability. Bioorg Med Chem Lett. 2006;16:3609–3613.
- Substance Abuse and Mental Health Services Administration. Diversion and abuse of buprenorphine: a brief assessment of emerging indicators. Final report, 2006. Available at: http://buprenorphine.samhsa.gov. Accessed December 26, 2012.
- Comer SD, Sullivan MA, Vosburg SK, et al. Abuse liability of intravenous buprenorphine/naloxone and buprenorphine alone in buprenorphine-maintained intravenous heroin abusers. Addiction. 2010;105:709–718.
- Malinoff HL, Barkin RL, Wilson G. Sublingual buprenorphine is effective in the treatment of chronic pain syndrome. Am J Ther. 2005;12:379–384.
Do surgical residents need ethics teaching?
Recently, I was invited to present surgical grand rounds on an ethics topic. After the talk, a senior surgeon, now retired, who was in the audience confided to me that in all of his years of residency, he had never had a lecture on ethics. This off-hand comment raised a question that demands consideration in the contemporary era of increasingly limited time available for teaching in surgical residencies. Do we need ethics teaching in surgery residencies?
As someone who spent significant time in the last few years in ethics teaching activities, my reflex answer is “Yes.” However, it is worthwhile to explore the reasons why, in the education of contemporary surgeons, it is important to focus dedicated attention on the ethical issues that arise in the practice of surgery.
Certainly, it is not true that ethics was previously unimportant in surgery. In 1915 when the early organizers of the American College of Surgeons were first writing down the qualifications for membership, they emphasized the importance of ethics: “The moral and ethical fitness of the candidates shall be determined by the reports of surgeons whose names are submitted by the candidate himself, and by such other reports and data as the Credentials Committee and the administration of the College may obtain.”[i] Thus, the early founders of the College considered “ethical fitness” to be essential to their members. Since there were clearly ethical and unethical ways to practice surgery, why has the focused emphasis on ethics teaching only occurred in recent decades?
I believe that there are three changes that have occurred in surgical care and surgical education that have led to the importance of this recent focus on ethics education in contemporary surgical training programs: the limitations on work hours for surgical residents, the increasing shift to outpatient care, and the increasing number of options for surgical patients brought about by improvements in surgical technology.
To begin with, surgical residents today spend significantly less time in the hospital every week than did surgical residents in years past. Although one could debate the actual educational value the additional time that I and my surgical predecessors spent in the hospital, there is no question that the significant shortening of the amount of time that surgical residents spend with surgical faculty has resulted in fewer opportunities for learning through role modeling. These many additional hours in the hospital for surgical residents in the past resulted in greater opportunities for residents to see how their faculty dealt with the challenges of managing ethically complex cases. Although these interactions were not often thought of as “ethical role modeling” in prior years, there is no question that significant ethical teaching occurred in this informal curriculum.
Second, and closely related to the reduction in surgical resident work hours, has been the significant shift to outpatient surgical care. This shift has meant that surgical residents whose time is focused on what happens in the hospital have even fewer opportunities to witness faculty engaging in many central aspects of the ethical care of surgical patients (e.g., obtaining informed consent for complex surgical procedures, communicating bad news to patients and families, or weighing risks and benefits of high risk elective surgical procedures).
Perhaps most importantly, today there are more options for surgical therapies than ever before. The central question for a surgeon in 1913 when the American College of Surgeons was formed was, “What can be done for this patient?” Today, in caring for the most complex and critically ill patients, the question that is foremost for surgeons is often “What should be done?” This question is not a purely surgical question, but also an ethical question. Consider a patient who has developed multisystem organ failure after complications from surgery. Because of the advances in critical care, such a patient might be able to be kept alive with technologies such as mechanical ventilation, augmented cardiac output with a ventricular assist device, and hemodialysis. These therapies cannot be judged to be appropriate or not without thoughtful consideration of an individual patient’s overall goals and values. In such a case, weighing values and probabilities for success or failure relative to a particular patient’s goals moves beyond purely scientific surgical decision making into the realm of ethics.
For all of these reasons, I believe that although surgeons have practiced in an ethical fashion for countless generations, the contemporary education of surgeons should include focused attention on ethics and the ethical implications of the surgical interventions that we recommend for our patients. Some might argue that the ultimate goal of surgical education should be to fully integrate the ethical considerations into the surgical care rendered to patients. However, there is so much surgical science to be learned in residency, that in order for consideration of the ethical implications to not be lost, I believe that there must be dedicated attention to ethics teaching.
Although it is an artificial separation to think about distinguishing the ethical considerations from the surgical decision making for a particular patient, the separation is valuable to emphasize the differences between surgical science and surgical ethics. The former is dependent on anatomy, physiology, and surgical technique; whereas the latter is dependent on relationships, communication, and patient values. Although we can train surgical residents to be excellent technicians with a focus purely on surgical science, we can only educate great doctors who are also surgeons by expanding the discussions of optimal surgical care to include the considerations central to surgical ethics.
[1] This important historical background is courtesy of David Nahrwold, MD.
Dr. Angelos is an ACS Fellow, the Linda Kohler Anderson Professor of Surgery and Surgical Ethics, chief, endocrine surgery, and associate director of the MacLean Center for Clinical Medical Ethics at the University of Chicago.
HM13: Bringing Hospital Medicine to the East Coast
Every year, hospitalists from across the country come together at SHM’s annual meeting. With this year’s convention located just a few miles south of Washington, D.C., HM13 will be the most convenient meeting for thousands of hospitalists who live and work on or near the East Coast.
In fact, many won’t even need to board a plane to meet up with thousands of fellow hospitalists. For those in Boston, Baltimore, New York, Philadelphia, and other cities in the northeast corridor, the only meeting designed specifically for hospitalists is just a short drive or train ride away.
And when they arrive at the Gaylord National Resort and Convention Center in National Harbor, Md., hospitalists will find a truly expansive experience dedicated to the specialty. In addition to featuring four days of educational content, the meeting gives hospitalists the chance to catch up with old friends and network with new colleagues. Plus, with an exhibit floor filled with the nation’s top recruiters, service providers, and pharmaceutical innovators, hospitalists can get up to speed on the best offerings in the industry in a matter of hours.
Check out our 6-minute feature video: "Five Reasons You Should Attend HM13"
With so many offerings and opportunities in one place, the challenge for most hospitalists isn’t finding something to do—it’s planning their meeting schedule to achieve all of their career and educational goals.
This year, hospitalists can plan their meeting experience with HM13 at Hand, SHM’s mobile application. Now, any hospitalist with a tablet or smartphone and an Internet connection can add educational sessions to their HM13 plan, view paperless abstracts, and connect with other HM13 attendees in advance of the meeting.
For more HM13 information, visit www.hospitalmedicine2013.org.
Brendon Shank is SHM’s associate vice president of communications.
SHM Tallies Ratio of Hospital Respondents' Observation Admissions to Inpatient Admission Encounters

SHM added a new item to its 2012 State of Hospital Medicine report: the ratio of respondents’ observation admissions to inpatient admission encounters. This metric was added because observation encounters have been increasing, with financial effects on hospitals and patients. SHM survey respondents reported a 20% observation rate for both adult and pediatric practice groups (see Figure 1).
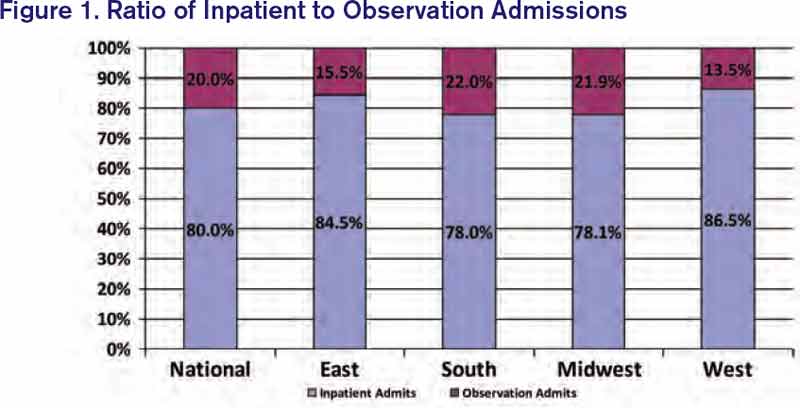
Under observation status, services that used to be billed as inpatient status (e.g. chest pain evaluation, treatment of asthma exacerbation) must be billed by the hospital at much lower outpatient rates. Some hospitals have responded to this financial pressure by creating observation units or making other operational adjustments. One recent analysis suggested that nationwide adoption of such efforts could save billions of dollars.1
Becoming lean enough to do short work in short time, though, does not address all of the observation-related issues facing hospitals. When the Centers for Medicare & Medicaid Services’ (CMS) Recovery Audit Contractors (RACs) determine retrospectively that an inpatient admission should have been an observation encounter, the hospital’s payment is not downgraded but forfeited.2 This development has prompted hospitals to preemptively opt for observation status for certain patients. Case managers and providers increasingly are spending time reviewing inpatient versus observation status throughout a patient’s stay. Many hospitals have turned to third-party contractors to help review observation status.
Observation status has financial implications for patients as well. In the past year, USA Today, The Wall Street Journal, and CNN Money all have reported on patients hit with unexpected out-of-pocket expenses related to observation care.3,4,5 A common theme: Medicare patient hospitalized with an acute fracture, managed nonoperatively but requiring rehabilitation prior to returning home. These patients found out too late that observation, a status they were often unaware of, did not qualify for CMS’ three-day inpatient requirement to cover rehabilitation costs. Some patients were charged exorbitant prices for noncovered “outpatient” services, such as providing their routine medications.
Advocacy groups have joined the fray on patients’ behalf, and legal challenges have ensued. AARP and others are educating patients about observation status—and their right to challenge it. The Center for Medicare Advocacy (www.kslaw.com/Library/publication/HH111411_Bagnall.pdf) has filed a lawsuit against the U.S. Department of Health and Human Services on behalf of patients hit with uncovered rehabilitation costs, and the American Hospital Association has teamed with several hospitals to sue over funds forfeited in RAC audits (www.aha.org/content/12/121101-aha-hhs-medicare-com.pdf). Both houses of Congress have legislation (H.R. 1543 and S. 818) seeking to count observation days toward the Medicare three-day rule. For its part, CMS has promised to review observation status and, hopefully, clarify the rules.
Hospitalists, meanwhile, are gearing up for more observation care. The 2012 State of Hospital Medicine report shows that 37% of adult groups and 28% of pediatric groups reported having primary responsibility for observation or short-stay units. My own hospital runs both a clinical decision unit in the ED and a short-stay unit staffed by our hospitalist group. As SHM tracks observation status in future surveys, HM groups will be able to follow this phenomenon among their colleagues and benchmark their own rates of observation encounters.
Dr. Creamer is medical director of the short-stay unit at MetroHealth Medical Center in Cleveland and a member of SHM’s Practice Analysis Committee.
References
- Feng Z, Wright DB, Mor V. Sharp rise in Medicare enrollees being held in hospitals for observation raises concerns about causes and consequences. Health Aff (Millwood). 2012;31(6):1251-1259.
- Baugh CW, Venkatesh AK, Hilton JA, Samuel PA, Schuur JD, Bohan JS. Making greater use of dedicated hospital observation units for many short-stay patients could save $3.1 billion a year. Health Aff (Millwood). 2012;31(10):2314-2323.
- Gengler A. The painful new trend in Medicare. CNN Money website. Available at: http://money.cnn.com/2012/08/07/pf/medicare-rehab-costs.moneymag/index.htm. Accessed March 6, 2013.
- Jaffe S. Patients held for observation can face steep drug bills. USA Today website. Available at: http://usatoday30.usatoday.com/money/industries/health/drugs/story/2012-04-30/drugs-can-be-expensive-in-observation-care/54646378/1. Accessed March 6, 2013.
- Landro L. Filling a gap between ERs and inpatient rooms. The Wall Street Journal website. Available at: http://online.wsj.com/article/SB10001424052970204349404578101060863887052.html. Accessed March 6, 2013.
SHM added a new item to its 2012 State of Hospital Medicine report: the ratio of respondents’ observation admissions to inpatient admission encounters. This metric was added because observation encounters have been increasing, with financial effects on hospitals and patients. SHM survey respondents reported a 20% observation rate for both adult and pediatric practice groups (see Figure 1).
Under observation status, services that used to be billed as inpatient status (e.g. chest pain evaluation, treatment of asthma exacerbation) must be billed by the hospital at much lower outpatient rates. Some hospitals have responded to this financial pressure by creating observation units or making other operational adjustments. One recent analysis suggested that nationwide adoption of such efforts could save billions of dollars.1
Becoming lean enough to do short work in short time, though, does not address all of the observation-related issues facing hospitals. When the Centers for Medicare & Medicaid Services’ (CMS) Recovery Audit Contractors (RACs) determine retrospectively that an inpatient admission should have been an observation encounter, the hospital’s payment is not downgraded but forfeited.2 This development has prompted hospitals to preemptively opt for observation status for certain patients. Case managers and providers increasingly are spending time reviewing inpatient versus observation status throughout a patient’s stay. Many hospitals have turned to third-party contractors to help review observation status.
Observation status has financial implications for patients as well. In the past year, USA Today, The Wall Street Journal, and CNN Money all have reported on patients hit with unexpected out-of-pocket expenses related to observation care.3,4,5 A common theme: Medicare patient hospitalized with an acute fracture, managed nonoperatively but requiring rehabilitation prior to returning home. These patients found out too late that observation, a status they were often unaware of, did not qualify for CMS’ three-day inpatient requirement to cover rehabilitation costs. Some patients were charged exorbitant prices for noncovered “outpatient” services, such as providing their routine medications.
Advocacy groups have joined the fray on patients’ behalf, and legal challenges have ensued. AARP and others are educating patients about observation status—and their right to challenge it. The Center for Medicare Advocacy (www.kslaw.com/Library/publication/HH111411_Bagnall.pdf) has filed a lawsuit against the U.S. Department of Health and Human Services on behalf of patients hit with uncovered rehabilitation costs, and the American Hospital Association has teamed with several hospitals to sue over funds forfeited in RAC audits (www.aha.org/content/12/121101-aha-hhs-medicare-com.pdf). Both houses of Congress have legislation (H.R. 1543 and S. 818) seeking to count observation days toward the Medicare three-day rule. For its part, CMS has promised to review observation status and, hopefully, clarify the rules.
Hospitalists, meanwhile, are gearing up for more observation care. The 2012 State of Hospital Medicine report shows that 37% of adult groups and 28% of pediatric groups reported having primary responsibility for observation or short-stay units. My own hospital runs both a clinical decision unit in the ED and a short-stay unit staffed by our hospitalist group. As SHM tracks observation status in future surveys, HM groups will be able to follow this phenomenon among their colleagues and benchmark their own rates of observation encounters.
Dr. Creamer is medical director of the short-stay unit at MetroHealth Medical Center in Cleveland and a member of SHM’s Practice Analysis Committee.
References
- Feng Z, Wright DB, Mor V. Sharp rise in Medicare enrollees being held in hospitals for observation raises concerns about causes and consequences. Health Aff (Millwood). 2012;31(6):1251-1259.
- Baugh CW, Venkatesh AK, Hilton JA, Samuel PA, Schuur JD, Bohan JS. Making greater use of dedicated hospital observation units for many short-stay patients could save $3.1 billion a year. Health Aff (Millwood). 2012;31(10):2314-2323.
- Gengler A. The painful new trend in Medicare. CNN Money website. Available at: http://money.cnn.com/2012/08/07/pf/medicare-rehab-costs.moneymag/index.htm. Accessed March 6, 2013.
- Jaffe S. Patients held for observation can face steep drug bills. USA Today website. Available at: http://usatoday30.usatoday.com/money/industries/health/drugs/story/2012-04-30/drugs-can-be-expensive-in-observation-care/54646378/1. Accessed March 6, 2013.
- Landro L. Filling a gap between ERs and inpatient rooms. The Wall Street Journal website. Available at: http://online.wsj.com/article/SB10001424052970204349404578101060863887052.html. Accessed March 6, 2013.
We Welcome the Newest SHM Members
- E. Cornatzer, MD, Alabama
- P. Cornatzer, MD, Alabama
- S. Meadows, MD, Alabama
- F. Shaikh, MD, PhD, Alabama
- A. Zouhary, MACP, Alabama
- L. Balk, Arizona
- E. Harding, MD, Arizona
- G. Rao, MD, Arizona
- S. Shah, MD, Arizona
- R. Snedecor, Arizona
- M. Dirst-Roberts, MD, Arkansas
- R. Campbell, California
- J. Idury, MD, California
- H. Jackson, MD, California
- C. Johnson, MD, MS, California
- G. Kanwar, California
- B. Kong, MD, California
- P. Lee, MD, California
- S. Pendharkar, USA, California
- S. Perry, California
- T. Pham, MD, California
- M. Sarwar Sr., MD, California
- A. Tandon, California
- E. Wu, MD, California
- G. Clover, MD, Colorado
- J. Cunningham, MD, Colorado
- A. Del Pino-Jones, Colorado
- D. Hilty, Colorado
- K. Kanel, Colorado
- E. Batista, MD, Connecticut
- A. Montero, MD, District of Columbia
- D. Westervelt, NP, District of Columbia
- C. Dumois, MD, Florida
- L. Gatien, DO, Florida
- G. Del Rio, MD, Florida
- M. Khan, MD, Florida
- I. Kuizon, MD, Florida
- S. Menon, DO, MPH, Florida
- G. Newlands, Florida
- R. Patil, MD, MBBS, Florida
- R. Ribon, MD, Florida
- C. Shah, MD, Florida
- C. Brooks, FAAP, Georgia
- S. Clarke, M.H.A., Georgia
- S. Lofgren, MD, Georgia
- K. Nieh, MD, Georgia
- R. Wright, MD, Georgia
- T. Dibuono, RN, Illinois
- C. Kandaswamy, MD, Illinois
- K. Kaul, MD, Illinois
- M. Majid, MD, Illinois
- D. Mitra, MD, Illinois
- J. Peace, Illinois
- A. Rahman, Illinois
- J. Rogers, Illinois
- M. Bolden, MD, Indiana
- T. Callahan, DO, Indiana
- G. Dupre, MD, Indiana
- K. Hall, MD, Indiana
- K. Hunt, MD, Indiana
- E. Tripp, MD, Indiana
- J. Gehling, Iowa
- B. Halsch, Iowa
- H. Zook, Kansas
- R. McLendon Jr., MD, Louisiana
- J. Newsom, Louisiana
- A. Karikkineth, USA, Maryland
- M. Lee, Maryland
- A. Rahim, MD, Maryland
- J. Riley, PA, Maryland
- M. Short, MD, Maryland
- L. Balestrero, MD, Massachusetts
- S. Dhungel, Massachusetts
- A. Finn, Massachusetts
- W. Garcia-Beltran, Massachusetts
- A. Khan, Massachusetts
- N. Najjar, MD, Massachusetts
- A. Sharma, MD, Massachusetts
- J. Cimadevilla, MD, Massachusetts
- M. Byland, MD, Michigan
- D. Coffin, PA-C, Michigan
- K. Covell, DO, Michigan
- J. Hill, Michigan
- M. Howard, PA-C, Michigan
- M. Kabach, Michigan
- K. Karikari, MD, MS, Michigan
- M. Kelsey, PA-C, Michigan
- J. Knoke, PA-C, Michigan
- A. Lawrin, Michigan
- E. Li Fuentes, MD, Michigan
- C. Petrilli, MD, Michigan
- J. Peyton, DO, Michigan
- L. Reynolds, PA-C, Michigan
- O. Sinyavskiy, MD, Michigan
- N. Veerapaneni, MD, MS, Michigan
- D. Wells, PA-C, Michigan
- L. Worthington, PA, Michigan
- E. Canan, MHA, Minnesota
- J. Hsieh, MD, Minnesota
- S. Hsieh, MD, Minnesota
- M. Moore, MD, Minnesota
- S. Xie, MD, Minnesota
- R. Bardowell, MD, Missouri
- A. Chowdhury, MD, Missouri
- I. Elayyan, MD, Missouri
- S. Majcina, Missouri
- P. Martin, Missouri
- S. Budd, MD, Nebraska
- U. Indukuri, MBBS, Nebraska
- J. Stolp, DO, Nebraska
- M. Mahdavian, MD, Canada
- I. Ahmad, MBBS, New Jersey
- T. Kostrub, MS, New Jersey
- S. Ozawa, RN, New Jersey
- G. Smith, MD, New Mexico
- D. Yu, MBA, FACP, New Mexico
- S. Aruchamy, MD, New York
- S. Chikoti, MD, New York
- J. Cohen, MD, New York
- M. Nerkar, MD, New York
- A. Mednick, MD, New York
- E. Metzger, NP, New York
- C. Morrow, MD, New York
- A. Ragusa, MD, New York
- D. Silverstein, MD, New York
- L. Sinvani, MD, New York
- A. Subramony, FAAP, New York
- P. Tierney, MD, New York
- A. Vien, New York
- F. Volpicelli, MD, New York
- E. Bindewald, MD, New Zealand
- R. Brown, FACP, North Carolina
- T. Cook, North Carolina
- K. Gallagher, MD, North Carolina
- C. Jones, North Carolina
- C. McKay, MB, North Carolina
- R. Nagaraj, MBBS, MPH, North Carolina
- A. Purohit, MD, North Carolina
- J. Guntakandla, FHM, North Dakota
- E. Albert, MD, Ohio
- F. Kuo, MD, MBA, Ohio
- A. Suciu, Ohio
- H. Tiu, MN, Ohio
- K. Wright, Ohio
- C. Kaufman, Oklahoma
- R. McGuire, MD, Ontario, Canada
- M. Shafiee, MD, Ontario, Canada
- J. Hughson, MD, Oregon
- M. Moore, MD, Oregon
- J. Richards, Oregon
- K. Alcorn, Pennsylvania
- J. Bogart Jr., ACNP, MSN, RN, Pennsylvania
- M. Buisch, PA-C, Pennsylvania
- P. Dolan, RN, Pennsylvania
- M. Dunkle, PA-C, Pennsylvania
- E. Faulconbridge, PA-C, Pennsylvania
- J. Frommer Jr., DO, Pennsylvania
- G. Horn, Pennsylvania
- K. Killian, PA-C, Pennsylvania
- J. Klutz, MD, FACFM, Pennsylvania
- B. Nolt, MD, Pennsylvania
- B. Randleman, DO, Pennsylvania
- E. Reynolds, MHS, PA-C, Pennsylvania
- S. Schwalm, MA, Pennsylvania
- K. McNally, BSC, CCFP, MD, Prince
- Edward Island, Canada
- J. Germain, CCFP, Quebec, Canada
- J. Garzone, DO, South Carolina
- M. Chaney, MD, Tennessee
- C. Foxley, MD, Tennessee
- S. Geller, MD, FACP, MPH, Tennessee
- J. Mann, MD, Tennessee
- D. Sargent, MD, Tennessee
- O. Adeyinka, MBBS, Texas
- J. Asuaje, Texas
- A. Bhuriwala, MBBS, Texas
- B. Fishman, MD, FACP, Texas
- S. Gerineni, Texas
- G. Guzman, MD, Texas
- R. Ledesma, Texas
- R. Mckelvey, BC, Texas
- R. Mohme, MD, Texas
- J. Ramineni, MD, Texas
- N. Robinson, MD, Texas
- M. Seas, Texas
- E. Silva, MD, Texas
- S. Siripurapu, Texas
- E. Trevino, DMD, Texas
- J. Miller, MD, Utah
- S. Sadiq, MBBS, Utah
- C. Wells, MD, Utah
- C. Mitchell, MD, Vermont
- K. Free, PA-C, Virginia
- M. Gomez-Sanchez, MD, Virginia
- P. Lee, MD, Virginia
- M. Ayub, MD, Washington
- B. Dentler, MD, Washington
- S. Fogarty, MD, Washington
- J. James, MD, Washington
- M. Larrabee, MD, Washington
- M. Marton, PhD, Washington
- C. Meyers, MD, Washington
- M. Narayanan, MD, MPH, Washington
- B. Randhawa, MD, Washington
- T. Spector, MD, Washington
- A. Thomas, Washington
- J. Tieder, MD, Washington
- J. Yoon, MD, Washington
- L. Mousa, MD, West Virginia
- D. La Voie, MD, Wisconsin
Affordable Care Act (ACA) Provision Carries Pay Raise for Some Hospitalists
For those who remain unaware, hospitalists who care for Medicaid patients will be getting a raise in 2013 and 2014. The reason is that the Affordable Care Act (ACA) requires Medicaid rates for specified primary-care services to be equal to those of Medicare rates during those two years, with the federal government paying the difference. Hospitalists generally meet the requirements and, therefore, will see this pay increase for their applicable Medicaid billing. For some context of the scope of this change, on average, Medicaid pays physicians at 66% of the national Medicare rates, although there is significant variation among the states.
To qualify, a physician must have a specialty designation of family medicine, internal medicine, or pediatrics, then further attest to board certification in one of those specialties or related subspecialties. Alternatively, the physician must have a 60% claims history for the specified evaluation and management (E&M) codes.
Multiple parties who have heard reports about state plans for Medicaid parity recently have contacted SHM; the plans, they report, intentionally would exclude hospitalists from the promised increase. There are variations on the explanation for the exclusion and where the idea is coming from, but the inquiries follow this general theme: “Since the definition of eligible physicians remains a grey area, states are developing alternative plans with a more narrow interpretation of the qualifying factors for the increase. These plans are only including physicians who practice in the community setting (i.e. not the hospital setting).”
This is demonstrably wrong. Even if states are having these discussions, such a plan is not going to come to fruition. The final rule for Medicaid parity, which essentially has the effect of law, is very clear: It does not allow for differing eligibility or alternate state plans.
The Centers for Medicare & Medicaid Services (CMS) specifically stated in the final rule that the increase is not limited to office-based primary-care services, but it will also include hospital observation and consultation for inpatient services provided by nonadmitting physicians, ED services, and critical-care services. In other words, a hospitalist who attests eligibility for their respective state Medicaid agency and bills 99231-3, 99221-3, 99238-9, etc., will receive the increased payment for these codes.
In response to an SHM inquiry for further clarification, CMS officials have stated, “The regulation requires that qualified physicians billing eligible codes receive higher payment. States do not have the latitude to exclude physicians simply because they practice in hospitals.”
It is possible that some confusion might be arising due to the recent controversies around the upcoming Medicaid expansion, which would extend Medicaid eligibility to individuals who earn up to 138% of the federal poverty line. Some states have chosen to opt out of this expansion and have publicly fought its implementation. The Medicaid parity provision is parallel to, but independent of, Medicaid expansion. Even if a state opts out of the expansion, the Medicaid payment increase for primary-care services should remain unaffected.
This isn’t to say that the Medicaid parity provision is a certainty. With the eyes of Congress turned toward budget cuts and austerity, the funds allocated for this temporary increase could easily be targeted. Regardless, any change in eligibility would require a rule change at the federal level, which is unlikely.
Many states have already devoted much time and effort on plans to implement the provision, and the plans were due to be submitted to CMS on March 31. It is pretty late in the game to consider changes. Barring an unlikely rule change or total elimination of funding, it is clear that hospitalists are eligible for the payment bump and should remain so.
Josh Boswell is SHM’s senior manager of government relations.
Fellow in Hospital Medicine Spotlight: Arvind Gupta, MD, FACP, FHM
Dr. Gupta is a hospitalist at Wellspan York Hospital in York, Pa. He is the former medical director of the hospitalist program at Holy Spirit Hospital in Camp Hill, Pa., and the former director of the department of medicine research at Lehigh Valley Hospital in Allentown, Pa. He is president and founder of the South Central Pennsylvania chapter of SHM.
Undergraduate education: Punjab University, India
Medical school: Ross University School of Medicine, Dominica
Notable: After spending 10 years as a director of microbiology at Vencor Hospital in Arlington, Va., Dr. Gupta began attending medical school when he was 36. Although he started his hospitalist career much later than most, he has made up the time through active participation at the hospitals in which he worked. He has been a part of the medical executive committee, the quality council, and the performance improvement committee,. He also chaired the credential committee. As a research specialist, he has taken part in 34 clinical trials. As a hospitalist, he focuses on providing efficient, safe, and cost-effective care for his patients.
FYI: Dr. Gupta’s favorite pastime is golf. He loves watching sports and movies with his family. He says one of his greatest achievements is having sons who attend Duke University and Cornell University.
Quotable: “Becoming an SHM fellow is a great honor and recognition. It means a lot for the new designation of the hospitalist.”
Larry Wellikson: Exceptional Hospitalists Bring Positive Change to Health Care Industry

Exceptional hospitalists

Even though hospital medicine and SHM are still relatively young, we can be very proud of what our specialty already has brought to changing our nation’s health care for the better. Many of these accomplishments, from winning the prestigious Eisenberg Award to our change leadership by SHM’s Center for Healthcare Innovation and Improvement at more 300 hospitals to the extraordinary growth of our specialty, have been well chronicled in The Hospitalist and elsewhere the last few years.
I wanted to use this month’s column to highlight the unique career directions of a few SHM members to shine a bright light on the influence hospitalists are making nationwide. Certainly, there are many more hospitalists beyond this group of five that I have selected, but this small cadre should serve as an example of the talent and reach of our specialty—with only more and greater things ahead to come in the future.
Chief Medical Officer of CMS
Pat Conway, MD, SFHM, is a pediatric hospitalist and the former chair of SHM’s Public Policy Committee. He left his pediatric academic practice to become a White House fellow, then returned to Cincinnati Children’s Hospital to serve as chief medical officer (CMO). When Don Berwick was in charge of the Centers for Medicare & Medicaid Services (CMS), he reached out to Pat and asked him to come to Washington to be part of Medicare’s senior team as the CMO for CMS. In this role, Pat has been a nationally recognized leader in performance improvement and patient safety, and he has been instrumental in bringing about evolutionary changes to the largest healthcare program in the world. Pat will be sharing his perspectives as a keynote speaker at HM13 (check out our 10-page HM13 preview starting on p. 45).
Resident Fellow at the American Enterprise Institute
Scott Gottlieb, MD, is a practicing hospitalist in New York City, but he is better known as a leading expert in healthcare policy, most recently acting as an advisor to presidential candidate Mitt Romney. From 2005 to 2007, Scott was a deputy commissioner at the FDA. He has worked as a senior advisor to the administrator at CMS, where he played an instrumental role in the implementation of the Medicare Drug Benefit in 2004.
Scott is best known for his frequent contributions to The Wall Street Journal, The New York Times, USA Today, and Forbes. He has held editorial positions at the British Medical Journal and the Journal of the American Medical Association, regularly appears as a guest commentator on CNBC, and is a frequent contributor to Politico.
At SHM, Scott has brought his national viewpoint to the Public Policy Committee. He proudly touts his experience as a practicing hospitalist as bringing a front-line reality to his national recognition and much-sought-after critical thinking about healthcare policy.
Chairman of the American Board of Internal Medicine
Bob Wachter, MD, MHM, was a thought leader in HM before our specialty even had a name, writing the initial peer-reviewed articles and coining the term “hospitalist.” Bob has built a pre-eminent hospitalist program at the University of California at San Francisco and helped influence and populate much of academic HM. His Wachter’s World blog (www.wachtersworld.com) is one of the most widely read medical blogs, reaching an audience well beyond our specialty.
Bob was one of the first presidents of SHM—back when we were known as NAIP, or the National Association of Inpatient Physicians—and set SHM on its strong growth and innovative direction that has made us the envy of other medical specialty societies. Last year, Modern Healthcare hailed Bob as the 14th most influential physician executive in the entire country.
On the ABIM board, Bob has represented the best of HM and brought our innovative spirit and our commitment to improvement, safety, and change leadership, culminating this year in the ABIM chairmanship. Bob will offer his unique insights into HM and the national healthcare agenda at HM13 (www.hospitalmedicine 2013.org).
CEO: Telemedicine for the ICU
Mary Jo Gorman, MD, MHM, is a hospitalist and intensivist who made her mark on HM as the chief medical officer (CMO) of IPC: The Hospitalist Company. As she offered her talents to SHM, she became chairman of SHM’s Public Policy Committee and eventually SHM president.
For the last few years, Mary Jo has been the CEO of ICUMedicine. In this role, she has been active around the country, bringing ICU competencies to many community hospitals by offering a telemedicine solution for critically ill patients. This unconventional approach to meeting a glaring need fits into Mary Jo’s career history of looking for new and different ways to bring better healthcare solutions to the front lines of patient care. Last year, Modern Healthcare recognized Mary Jo as one of the most influential female physician executives in the country.
CEO, Medical University of South Carolina (MUSC) Hospitals
After leaving Duke University, Pat Cawley, MD, MBA, MHM, started his career as a community-based hospitalist leader. After a number of leadership roles at SHM, Pat served as SHM president and was elected a Master in Hospital Medicine in 2012.
Pat initially was recruited to MUSC to build and manage their HM group. Soon he was tapped to be the CMO at MUSC. Earlier this year, Pat became the first hospitalist to be chosen to run a major academic medical center when he was promoted to CEO at MUSC.
In recent years, Pat has been a leading voice as the American Hospital Association looks to involve physician leaders. He is a rising star at AHA, helping to merge the cultures of hospital administrators and physicians to create the hospital of the future.
Hospitalists Contribute at the Highest Level
Obviously, I could go on and on, adding other hospitalists who are making unique and important contributions at the local and national level. It is interesting that at a time when many are still trying to get their heads around just what HM is, we already can recognize the immense talent that resides in hospitalist groups across the country. At a time when the U.S. healthcare system is being reshaped, hospitalists, such as those mentioned above and oh-so-many more, are already making large and small steps forward. We are helping to create a new healthcare enterprise, based on value, efficiency, effectiveness, and putting the patient first.
SHM wants to continue to be the place where the innovators and thought leaders of today and tomorrow can come together to multiply their efforts. The challenges are daunting, but the results can be rewarding, and the members of SHM are ready to bring our talents, energies, and commitments to do our part in this great American journey.
Exceptional hospitalists
Even though hospital medicine and SHM are still relatively young, we can be very proud of what our specialty already has brought to changing our nation’s health care for the better. Many of these accomplishments, from winning the prestigious Eisenberg Award to our change leadership by SHM’s Center for Healthcare Innovation and Improvement at more 300 hospitals to the extraordinary growth of our specialty, have been well chronicled in The Hospitalist and elsewhere the last few years.
I wanted to use this month’s column to highlight the unique career directions of a few SHM members to shine a bright light on the influence hospitalists are making nationwide. Certainly, there are many more hospitalists beyond this group of five that I have selected, but this small cadre should serve as an example of the talent and reach of our specialty—with only more and greater things ahead to come in the future.
Chief Medical Officer of CMS
Pat Conway, MD, SFHM, is a pediatric hospitalist and the former chair of SHM’s Public Policy Committee. He left his pediatric academic practice to become a White House fellow, then returned to Cincinnati Children’s Hospital to serve as chief medical officer (CMO). When Don Berwick was in charge of the Centers for Medicare & Medicaid Services (CMS), he reached out to Pat and asked him to come to Washington to be part of Medicare’s senior team as the CMO for CMS. In this role, Pat has been a nationally recognized leader in performance improvement and patient safety, and he has been instrumental in bringing about evolutionary changes to the largest healthcare program in the world. Pat will be sharing his perspectives as a keynote speaker at HM13 (check out our 10-page HM13 preview starting on p. 45).
Resident Fellow at the American Enterprise Institute
Scott Gottlieb, MD, is a practicing hospitalist in New York City, but he is better known as a leading expert in healthcare policy, most recently acting as an advisor to presidential candidate Mitt Romney. From 2005 to 2007, Scott was a deputy commissioner at the FDA. He has worked as a senior advisor to the administrator at CMS, where he played an instrumental role in the implementation of the Medicare Drug Benefit in 2004.
Scott is best known for his frequent contributions to The Wall Street Journal, The New York Times, USA Today, and Forbes. He has held editorial positions at the British Medical Journal and the Journal of the American Medical Association, regularly appears as a guest commentator on CNBC, and is a frequent contributor to Politico.
At SHM, Scott has brought his national viewpoint to the Public Policy Committee. He proudly touts his experience as a practicing hospitalist as bringing a front-line reality to his national recognition and much-sought-after critical thinking about healthcare policy.
Chairman of the American Board of Internal Medicine
Bob Wachter, MD, MHM, was a thought leader in HM before our specialty even had a name, writing the initial peer-reviewed articles and coining the term “hospitalist.” Bob has built a pre-eminent hospitalist program at the University of California at San Francisco and helped influence and populate much of academic HM. His Wachter’s World blog (www.wachtersworld.com) is one of the most widely read medical blogs, reaching an audience well beyond our specialty.
Bob was one of the first presidents of SHM—back when we were known as NAIP, or the National Association of Inpatient Physicians—and set SHM on its strong growth and innovative direction that has made us the envy of other medical specialty societies. Last year, Modern Healthcare hailed Bob as the 14th most influential physician executive in the entire country.
On the ABIM board, Bob has represented the best of HM and brought our innovative spirit and our commitment to improvement, safety, and change leadership, culminating this year in the ABIM chairmanship. Bob will offer his unique insights into HM and the national healthcare agenda at HM13 (www.hospitalmedicine 2013.org).
CEO: Telemedicine for the ICU
Mary Jo Gorman, MD, MHM, is a hospitalist and intensivist who made her mark on HM as the chief medical officer (CMO) of IPC: The Hospitalist Company. As she offered her talents to SHM, she became chairman of SHM’s Public Policy Committee and eventually SHM president.
For the last few years, Mary Jo has been the CEO of ICUMedicine. In this role, she has been active around the country, bringing ICU competencies to many community hospitals by offering a telemedicine solution for critically ill patients. This unconventional approach to meeting a glaring need fits into Mary Jo’s career history of looking for new and different ways to bring better healthcare solutions to the front lines of patient care. Last year, Modern Healthcare recognized Mary Jo as one of the most influential female physician executives in the country.
CEO, Medical University of South Carolina (MUSC) Hospitals
After leaving Duke University, Pat Cawley, MD, MBA, MHM, started his career as a community-based hospitalist leader. After a number of leadership roles at SHM, Pat served as SHM president and was elected a Master in Hospital Medicine in 2012.
Pat initially was recruited to MUSC to build and manage their HM group. Soon he was tapped to be the CMO at MUSC. Earlier this year, Pat became the first hospitalist to be chosen to run a major academic medical center when he was promoted to CEO at MUSC.
In recent years, Pat has been a leading voice as the American Hospital Association looks to involve physician leaders. He is a rising star at AHA, helping to merge the cultures of hospital administrators and physicians to create the hospital of the future.
Hospitalists Contribute at the Highest Level
Obviously, I could go on and on, adding other hospitalists who are making unique and important contributions at the local and national level. It is interesting that at a time when many are still trying to get their heads around just what HM is, we already can recognize the immense talent that resides in hospitalist groups across the country. At a time when the U.S. healthcare system is being reshaped, hospitalists, such as those mentioned above and oh-so-many more, are already making large and small steps forward. We are helping to create a new healthcare enterprise, based on value, efficiency, effectiveness, and putting the patient first.
SHM wants to continue to be the place where the innovators and thought leaders of today and tomorrow can come together to multiply their efforts. The challenges are daunting, but the results can be rewarding, and the members of SHM are ready to bring our talents, energies, and commitments to do our part in this great American journey.
Win Whitcomb: Front-Line Hospitalists Fight Against Health Care-Associated Infections (HAIs)

2013 marks a turning point in the way hospitals are held accountable for the prevention of healthcare-associated infections (HAIs). It has been known for some time that HAIs are a serious cause of morbidity, with 1 in 20 hospital patients in the U.S. acquiring one. That represents 1.7 million Americans and accounts for about 100,000 lives lost each year. On a personal note, my father died of an HAI after surgery in 2000.
Now, with the Affordable Care Act coming into full swing, hospitals must get serious about preventing HAIs. This presents a major opportunity for hospitalists. There are three ways that hospitals will be affected:
- Since 2008, hospitals have not been reimbursed at a higher rate for vascular catheter-associated infections, catheter-associated urinary tract infections (UTIs), or surgical-site infections when acquired in the hospital.
- Over the next few years, Medicare’s Hospital Value-Based Purchasing (HVBP) program will begin to pay hospitals more or less, depending on how they perform, on six HAIs.
- Beginning in October 2014, in a roll-up measure for hospital-acquired conditions (which include infections), the worst-performing quartile of U.S. hospitals will be penalized 1% of their Medicare inpatient payments (see Table 1, below).
There are six HAIs that will be increasingly tied to hospital reimbursement. Each can be partially or completely prevented based on sets of practices, or care bundles, that require teamwork both in the planning stages and at the bedside. And, of course, the single most important way to reduce the spread of HAIs is to clean your hands before and after each patient encounter.
Clostridium-Difficile-Associated Disease (CDAD)
It is likely that your hospital has some type of CDAD prevention program. Here are a few things to keep in mind for CDAD prevention:
- Avoid alcohol-based hand rubs, because they do not kill C. diff spores. Vigorous hand washing with soap and water is the best approach.
- Use clindamycin, fluoroquinolones, and third-generation cephalosporins judiciously, as their restriction has been associated with reduced rates of CDAD.
- Place patients with suspected or proven C. diff infection on contact precautions, including gloves and gowns.
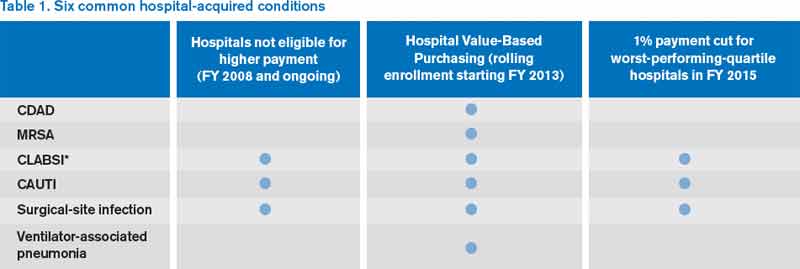
Methicillin-Resistant Staphylococcus Aureus (MRSA)
This includes hospital-acquired MRSA bacteremia. This topic will be discussed in future columns. Approaches to prevention include hand hygiene, cohorting patients, effective environmental cleaning, and antibiotic stewardship.
Central-Line-Associated Bloodstream Infection (CLABSI)
Adherence to the central-line insertion bundle has been conclusively shown to prevent CLABSI. It will become a process measure for HVBP in the near future. Prevention measures include hand hygiene, maximal barrier precautions during insertion, skin antisepsis with chlorhexidine, avoidance of the femoral vein, and daily assessment for readiness to discontinue the central line (which should involve every hospitalist).
Catheter-Associated Urinary Tract Infection (CAUTI)
CAUTI has been mentioned frequently in this column, and for good reason: It is the most common HAI. Although the evidence supporting practices that prevent CAUTI is not as strong as for CLABSI, every institution should have a bundle of practices embedded in nurses’ and doctors’ workflow to prevent CAUTI (see “Quality Meets Finance,” January 2013, p. 31).
Surgical-Site Infection (SSI)
For the most part, SSI can be left to the surgeons and other operating room professionals. However, with increasing involvement of hospitalists in surgical cases, we must have an understanding of how SSIs are prevented. The World Health Organization surgical checklist (www.who.int/patientsafety/safesurgery) is a great starting point for any organization.
Ventilator-Associated Pneumonia (VAP)
For hospitalists who provide critical care, adherence to a VAP prevention bundle includes:
- Elevation of the head of the bed;
- Daily “sedation vacation” and readiness to extubate;
- Oral care with chlorhexidine; and
- Peptic ulcer disease and venous thromboembolism prophylaxis.
In 2009, the U.S. Department of Health and Human Services (HHS) launched an action plan to prevent HAIs. As part of this effort, the Agency for Health Research and Quality (AHRQ) created a comprehensive unit-based safety program (CUSP) aimed at preventing CLABSI and CAUTI. The effort also focuses on safety culture and teamwork. For those interested in participating, visit www.onthecuspstophai.org.
Another way to get involved is to work Partnership for Patients, a public-private partnership led by HHS (http://partnershipforpatients.cms.gov), if a team at your hospital is participating. The Partnership for Patients seeks to reduce harm, including HAIs, by 40% by the end of 2013 compared with a 2010 baseline.
Dr. Whitcomb is medical director of healthcare quality at Baystate Medical Center in Springfield, Mass. He is a co-founder and past president of SHM. Email him at [email protected].
The View from The Center
As many of you know, SHM recently submitted five recommendations to the American Board of Internal Medicine Foundation’s Choosing Wisely campaign. This campaign encourages physicians and patients to have crucial conversations about appropriate utilization of tests and treatments. Seventeen specialty societies released lists in the second phase of the campaign. Many of the lists, including SHM’s, include recommendations that can help reduce hospital-acquired infections.
For example, one of SHM’s recommendations suggests not placing, or leaving in place, urinary catheters for any reason other than those indicated by the guidelines (e.g. bladder outlet obstruction, acute urinary retention, patient requires prolonged immobilization, to improve comfort for end of life, selected perioperative conditions). As Dr. Whitcomb indicates above, CAUTIs are low-hanging fruit when it comes to improving this condition—the guidelines are clear-cut, and relatively simple protocols can be put into place to prevent CAUTI.
Among the American Academy of Family Physicians and other society recommendations is avoidance of routine prescriptions of antibiotics for acute sinusitis or upper respiratory infections. Good antimicrobial stewardship policies are another approach to reduce or eliminate harmful antibiotic-resistant infections.
SHM will be offering multiple opportunities in the coming months to support your institution in Choosing Wisely. A daylong pre-course and two breakout sessions will be offered at HM13 (www.hospitalmedicine2013.org) addressing how you can implement the various recommendations. Additionally, publications are in the works describing the evidence base for SHM’s “avoid lists.” For resources, more information about SHM’s recommendations, and the latest Choosing Wisely developments, visit www.hospitalmedicine.org/choosingwisely.
2013 marks a turning point in the way hospitals are held accountable for the prevention of healthcare-associated infections (HAIs). It has been known for some time that HAIs are a serious cause of morbidity, with 1 in 20 hospital patients in the U.S. acquiring one. That represents 1.7 million Americans and accounts for about 100,000 lives lost each year. On a personal note, my father died of an HAI after surgery in 2000.
Now, with the Affordable Care Act coming into full swing, hospitals must get serious about preventing HAIs. This presents a major opportunity for hospitalists. There are three ways that hospitals will be affected:
- Since 2008, hospitals have not been reimbursed at a higher rate for vascular catheter-associated infections, catheter-associated urinary tract infections (UTIs), or surgical-site infections when acquired in the hospital.
- Over the next few years, Medicare’s Hospital Value-Based Purchasing (HVBP) program will begin to pay hospitals more or less, depending on how they perform, on six HAIs.
- Beginning in October 2014, in a roll-up measure for hospital-acquired conditions (which include infections), the worst-performing quartile of U.S. hospitals will be penalized 1% of their Medicare inpatient payments (see Table 1, below).
There are six HAIs that will be increasingly tied to hospital reimbursement. Each can be partially or completely prevented based on sets of practices, or care bundles, that require teamwork both in the planning stages and at the bedside. And, of course, the single most important way to reduce the spread of HAIs is to clean your hands before and after each patient encounter.
Clostridium-Difficile-Associated Disease (CDAD)
It is likely that your hospital has some type of CDAD prevention program. Here are a few things to keep in mind for CDAD prevention:
- Avoid alcohol-based hand rubs, because they do not kill C. diff spores. Vigorous hand washing with soap and water is the best approach.
- Use clindamycin, fluoroquinolones, and third-generation cephalosporins judiciously, as their restriction has been associated with reduced rates of CDAD.
- Place patients with suspected or proven C. diff infection on contact precautions, including gloves and gowns.
Methicillin-Resistant Staphylococcus Aureus (MRSA)
This includes hospital-acquired MRSA bacteremia. This topic will be discussed in future columns. Approaches to prevention include hand hygiene, cohorting patients, effective environmental cleaning, and antibiotic stewardship.
Central-Line-Associated Bloodstream Infection (CLABSI)
Adherence to the central-line insertion bundle has been conclusively shown to prevent CLABSI. It will become a process measure for HVBP in the near future. Prevention measures include hand hygiene, maximal barrier precautions during insertion, skin antisepsis with chlorhexidine, avoidance of the femoral vein, and daily assessment for readiness to discontinue the central line (which should involve every hospitalist).
Catheter-Associated Urinary Tract Infection (CAUTI)
CAUTI has been mentioned frequently in this column, and for good reason: It is the most common HAI. Although the evidence supporting practices that prevent CAUTI is not as strong as for CLABSI, every institution should have a bundle of practices embedded in nurses’ and doctors’ workflow to prevent CAUTI (see “Quality Meets Finance,” January 2013, p. 31).
Surgical-Site Infection (SSI)
For the most part, SSI can be left to the surgeons and other operating room professionals. However, with increasing involvement of hospitalists in surgical cases, we must have an understanding of how SSIs are prevented. The World Health Organization surgical checklist (www.who.int/patientsafety/safesurgery) is a great starting point for any organization.
Ventilator-Associated Pneumonia (VAP)
For hospitalists who provide critical care, adherence to a VAP prevention bundle includes:
- Elevation of the head of the bed;
- Daily “sedation vacation” and readiness to extubate;
- Oral care with chlorhexidine; and
- Peptic ulcer disease and venous thromboembolism prophylaxis.
In 2009, the U.S. Department of Health and Human Services (HHS) launched an action plan to prevent HAIs. As part of this effort, the Agency for Health Research and Quality (AHRQ) created a comprehensive unit-based safety program (CUSP) aimed at preventing CLABSI and CAUTI. The effort also focuses on safety culture and teamwork. For those interested in participating, visit www.onthecuspstophai.org.
Another way to get involved is to work Partnership for Patients, a public-private partnership led by HHS (http://partnershipforpatients.cms.gov), if a team at your hospital is participating. The Partnership for Patients seeks to reduce harm, including HAIs, by 40% by the end of 2013 compared with a 2010 baseline.
Dr. Whitcomb is medical director of healthcare quality at Baystate Medical Center in Springfield, Mass. He is a co-founder and past president of SHM. Email him at [email protected].
The View from The Center
As many of you know, SHM recently submitted five recommendations to the American Board of Internal Medicine Foundation’s Choosing Wisely campaign. This campaign encourages physicians and patients to have crucial conversations about appropriate utilization of tests and treatments. Seventeen specialty societies released lists in the second phase of the campaign. Many of the lists, including SHM’s, include recommendations that can help reduce hospital-acquired infections.
For example, one of SHM’s recommendations suggests not placing, or leaving in place, urinary catheters for any reason other than those indicated by the guidelines (e.g. bladder outlet obstruction, acute urinary retention, patient requires prolonged immobilization, to improve comfort for end of life, selected perioperative conditions). As Dr. Whitcomb indicates above, CAUTIs are low-hanging fruit when it comes to improving this condition—the guidelines are clear-cut, and relatively simple protocols can be put into place to prevent CAUTI.
Among the American Academy of Family Physicians and other society recommendations is avoidance of routine prescriptions of antibiotics for acute sinusitis or upper respiratory infections. Good antimicrobial stewardship policies are another approach to reduce or eliminate harmful antibiotic-resistant infections.
SHM will be offering multiple opportunities in the coming months to support your institution in Choosing Wisely. A daylong pre-course and two breakout sessions will be offered at HM13 (www.hospitalmedicine2013.org) addressing how you can implement the various recommendations. Additionally, publications are in the works describing the evidence base for SHM’s “avoid lists.” For resources, more information about SHM’s recommendations, and the latest Choosing Wisely developments, visit www.hospitalmedicine.org/choosingwisely.